Embed Size (px)
Citation preview

1) Cópia do projetoTópicos do Ensino de Física I – F 609 Determinação da velocidade da luz e demonstrações em ondulatória Aluno: Vicente Lima Ventura Seco RA:046865 Orientador: Professor Doutor Ernesto Kemp Email:[email protected] Descrição: Este trabalho tem como objetivo primário determinar a velocidade do som a partir
da formação de ondas em tubos fechados, gerando como produto secundário a demonstração qualitativa da formação de ondas em líquidos e a audição por meio da caixa craniana.
Usando tubos cilíndricos, fones de ouvido, microfones e programas de osciloscopia para computador, será possível determinar o comprimento das ondas sonoras formadas no tubo variando a distância entre emissor e receptor, o que possibilitará a determinação da velocidade do som uma vez que a frequência será determinada pelo gerador de sinais.
Utilizando um segundo tubo parcialmente preenchido com água e uma membrana elástica para facilitar a interação entre as ondas sonoras geradas por um auto-falante de maior intensidade sonora e o líquido, poderemos observar a formação de ondas no líquido em questão. Por fim, será possível utilizar o auto falante de maior potência para demonstrar a audição por meio de vibrações sobre a caixa craniana.
Importância didática do trabalho para o eventual destinatário dele: A maior importância do trabalho acima apresentado esta na possibilidade de interagir de
forma qualitativa e quantitativa com alguns dos principais conceitos de ondulatória, que são deveras abstratos para os estudantes do ensino médio. Ainda que os conceitos teóricos abordados não sejam de alto grau de dificuldade, são pontos chave no aprendizado de física do ensino fundamental e médio e que frequentemente são vistos com grande dificuldade pelos estudantes que se deparam pela primeira vez com a matéria.
Originalidade: O presente trabalho já foi realizado em partes separadas por instituições de ensino nacionais e
internacionais, existindo inclusive um Kit para a detecção da velocidade do som desenvolvido pela PASCO Scientific. Em contraponto, um único trabalho que vise demonstrar tanto a formação de ondas em líquidos, a audição por meio da caixa craniana e a determinação da velocidade do som não foi encontrado em nenhuma referência.
Um projeto semelhante foi desenvolvido na disciplina F609 no IFGW – Unicamp [1], mas este além de usar técnicas diferentes para a demonstração da interferência sonora não determinou a velocidade do som e sim adotou seu valor padrão igual a 340 m/s para o desenvolvimento do seu trabalho. Ainda há um segundo trabalho demonstrando a formação de padrões de ondas em líquidos, mas este difere completamente do intuito do atual projeto.
Referências:Caderno de exercícios Anglo Vestibulares, pág 248, exercício 20http://www.scielo.br/scielo.php?pid=S0102-47442003000100009&script=sci_arttextwww.clarion.edu/44684/72209.doc ftp://ftp.pasco.com/Support/Documents/English/WA/WA-9895/012-10507A.pdf
[1]http://www.ifi.unicamp.br/%7Elunazzi/F530_F590_F690_F809_F895/F809/F809_sem1_2002/F809_sem1_2002_Cris_Interf_Ondas_Sonoras.pdf
Lista de materiais:Serão necessários para a determinação da velocidade do som:– tubos rígidos e transparentes dom diâmetros entre 1 e 2 polegadas – inicialmente serão
utilizadas lâmpadas tubulares e canos de silicone rígido;– varetas de metal ou bambu;– um microfone de lapela para computador;– um fone de ouvido com conexão p2;– EVA, madeira e borrachas para acabamentos;– um computador ou notebook (emprestado pelo próprio aluno do dia da apresentação);– softwares livres de osciloscopia digital;
Serão necessários para a formação de ondas em líquidos:– tubos rígidos e transparentes dom diâmetros entre 1 e 2 polegadas – inicialmente serão
utilizadas lâmpadas tubulares e canos de silicone rígido;– auto falante de 4 polegas;– EVA, madeira e borrachas para acabamentos;– bexigas para serem usadas como membranas;– um computador ou notebook (emprestado pelo próprio aluno do dia da apresentação);– softwares livres de osciloscopia digital;
Serão necessários para a audição pela caixa craniana:– auto falante de 4 polegadas;– EVA, madeira e borrachas para acabamentos;– varetas de metal;– canudinhos de bebida;
Meu orientador, o Prof. Dr. Ernesto Kemp concorda com os termos aqui estabelecidos para o projeto e declara que poderá dispor de todos os elementos necessários a menos de excepções indicadas embaixo.
Excepções: não há.Sigilo: não solicita
2) Resultados atingidos e o que falta fazer:Até o momento os esforços concentraram-se na aquisição dos materiais e testes de montagem
das três partes: a) determinação da velocidade do som, b) formação de onda em líquidos, c) audição pela caixa craniana.
Segue abaixo a descrição individual de cada parte:a) determinação da velocidade do som:Foram coletados todos os materiais necessários e concluída a construção do tubo - já com o
emissor e receptor. Falta escolher quais programas de osciloscopia serão utilizados pois surgiram novas indicações que ainda não foram testadas. Até o momento estamos utilizando os programas “winscope” e “sinewave generator”. Falta definir a base de fixação do experimento, mas esta só será possível quando as demais partes estiverem concluídas também.
b) formação de onda em líquidos:Foram coletados diversos materiais para a construção do tubo, visto que a lâmpada de vidro
não possui diâmetro e resistência necessária para a construção desta etapa. Entre os materiais, o
tubo rígido de silicone apresenta-se com melhor características para o experimento, mas este, infelizmente tem sua forma viciada no formato circular pois é vendido em rolos. Até o momento concentramo-nos em “desentortar” o tubo, o que foi de certa forma trabalhoso visto a sua espessura.
Agora que o tubo assumiu formato retilíneo, iniciamos os testes para descobrir a melhor disposição para que o auto-falante consiga gerar ondas visíveis no líquido – etapa que esta tendo poucos progressos. Falta definir a base de fixação do experimento, mas esta só será possível quando as demais partes estiverem concluídas também.
ATUALIZAÇÃO: dentro das possibilidades de montagem, concluímos que a formação das ondas nos líquidos serão inviáveis visto as dimensões necessárias para o tubo e a potência do alto-falante para movimentar tamanha quantidade de água. Substituiremos então o líquido por outros materiais. Exemplos da montagem agora proposta podem ser encontradas nos seguintes links:
http://tuhsphysics.ttsd.k12.or.us/Research/IB03/GeorInti/page/tidalwave.MOVhttp://tuhsphysics.ttsd.k12.or.us/Research/IB03/GeorInti/page/research.htm
c) audição pela caixa craniana.Coleta de materiais e estes concluídos. Viabilidade do experimento confirmada. Falta definir a
base de fixação do experimento, mas esta só será possível quando as demais partes estiverem concluídas também.
3) Fotos da experiência no estágio em que se encontra.a) determinação da velocidade do som:
Figura 1: materiais utilizados
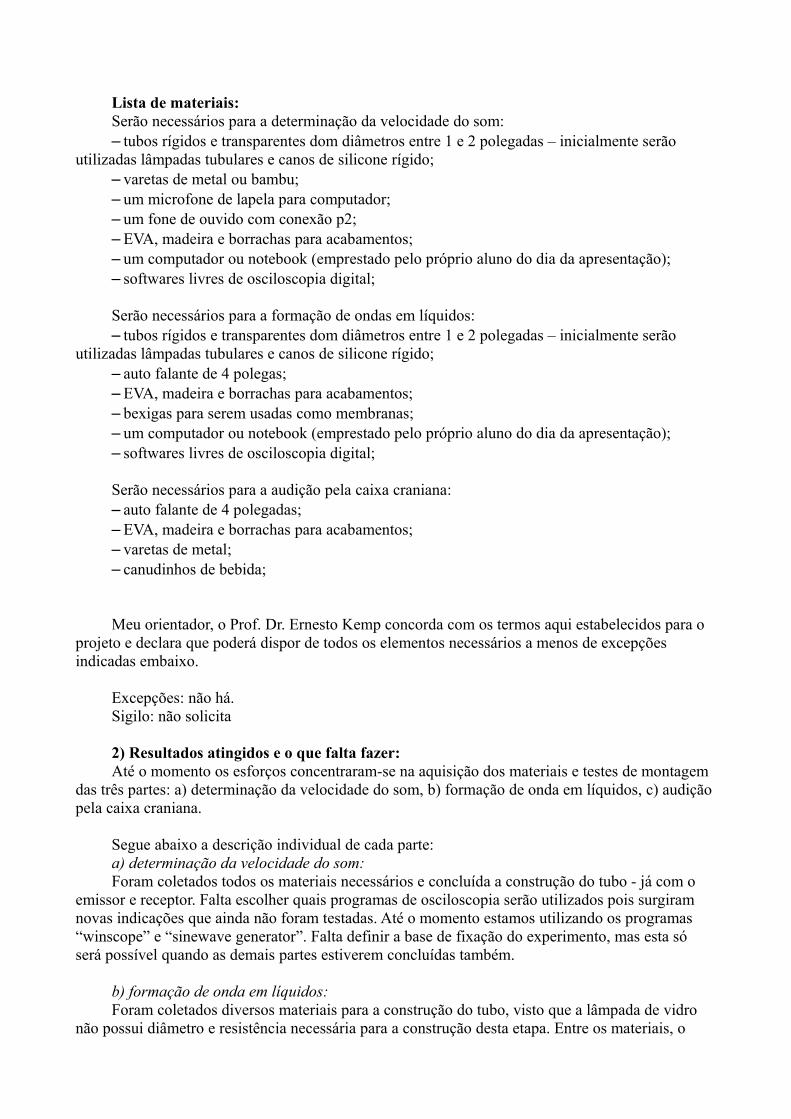
Figura 2: imagem da montagem com enfoque no emissor e receptor.
Figura 3: visão completa da montagem.
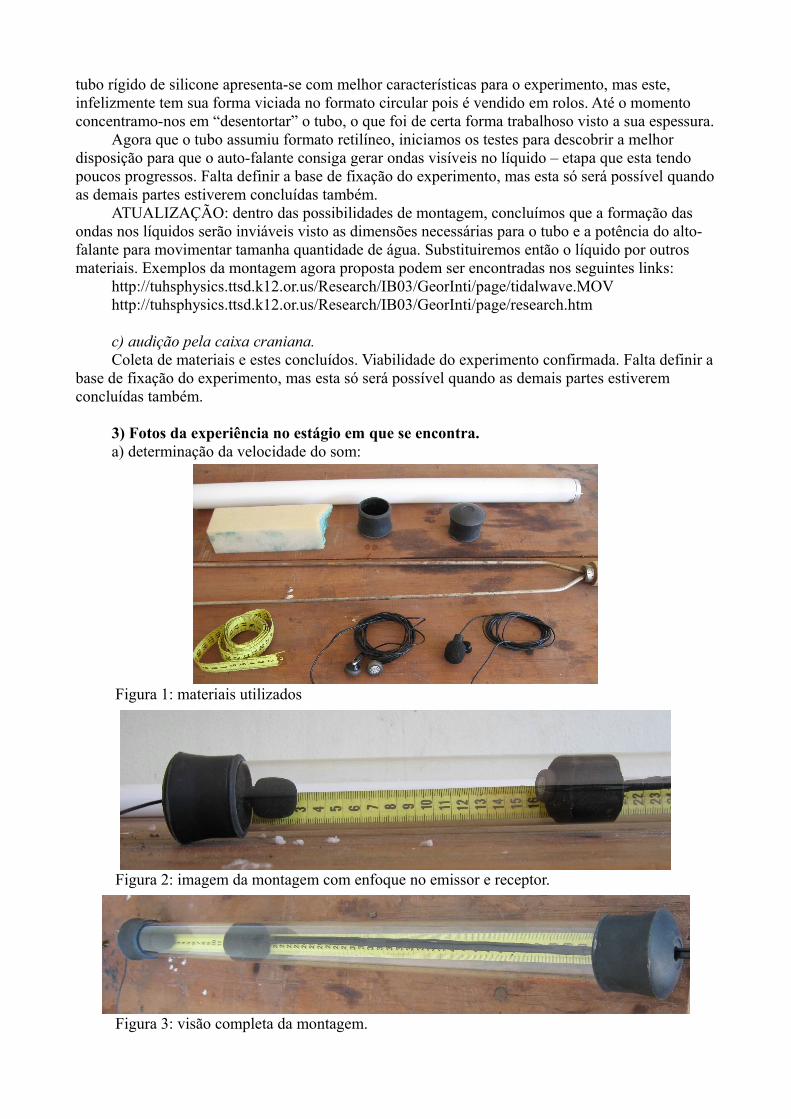
b) formação de onda em líquidos:Ainda não há fotos sobre os novos testes feitos com materiais sólidos.
Figura 4: materiais utilizados para a montagem to tubo
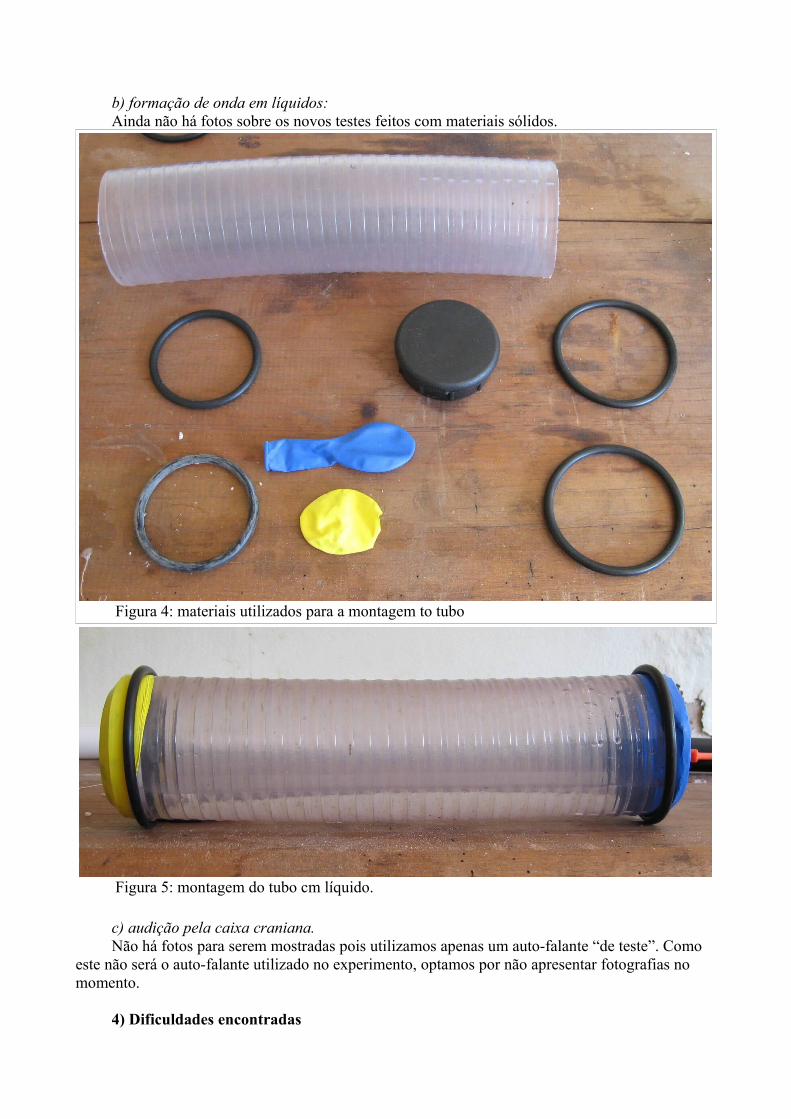
Figura 5: montagem do tubo cm líquido.
c) audição pela caixa craniana.Não há fotos para serem mostradas pois utilizamos apenas um auto-falante “de teste”. Como
este não será o auto-falante utilizado no experimento, optamos por não apresentar fotografias no momento.
4) Dificuldades encontradas
As principais dificuldades encontradas foram e estão sendo:Corte do tubo de vidro da lâmpada. Nem mesmo vidrarias conseguiram cortar o vidro sem que
este estilhaçasse. No final a necessidade do corte foi evitada usando uma lâmpada com menor comprimento.
Desentortar o tubo de silicone rígido e adaptar um alto-falante potente o suficiente para oscilar as ondas por meio da membrana. No momento o tubo já assume o formato desejado e levanta-se a possibilidade de substituir o líquido por outros materiais que permitam a observação das ondas apos longa exposição. Tal idéia é uma adaptação de um experimento já realizado na disciplina.
5) Pesquisa realizada, palavras-chave e referências obtidas:As pesquisas realizadas foram feitas nas bibliotecas da Faculdade de Educação – Unicamp, no Instituto de Física Gleb Wataghin – Unicamp, no site de buscas google (www.google.com.br), no site da disciplina F609 e F809( www.ifi.unicamp.br/vie), no site feira de ciências (www.feiradeciencias.com.br) no portal de vídeos youtube (www.youtube.com).
Durante as pesquisas foram usadas como palavras chave: física ondulatória (ondulatory physics), experimentos ondas estacionárias (experiments stationary waves), experimento determinação velocidade do som (experiment air velocity detection), dust stationary wave tube, Kundt's Tube e possíveis combinações entre as palavras acima.
Das referências encontradas, listamos abaixo as que agregaram informações para este trabalho:- Fundamentos de Física Volume 2 – Gravitação, Ondas e Termodinâmica; Halliday Resnick Walker; 6ª Edição – LTC → Livro com teoria relacionada ao assunto abordado para o nível de ensino superior.- Os fundamentos da Física Volume 2 – Termologia, Óptica e Ondas; Ramalho, Nicolau Toledo – Ramalho, Nicolau; 7ª edição – Editora Moderna → Livro com teoria relacionada ao assunto abordado para o segundo grau.
- http://www.practicalphysics.org/go/Experiment_133.html → experimento demonstrando a formação de ondas estacionárias sobre partículas em tubo fechado. Referência direta para a segunda etapa do projeto apresentado neste relatório.- http://tuhsphysics.ttsd.k12.or.us/Research/IB03/GeorInti/page/research.htm → explicações sobre montagem e teoria do Tubo de Kundt, apresentado vídeo sobre o funcionamento do mesmo. Referência direta para a segunda etapa do projeto apresentado neste relatório.- www.sbfisica.org.br/fne/Vol4/Num1/a10.pdf → experimento demonstrando outra forma de detectar a velocidade do som usando montagem mais simples do que a utilizada no presente projeto. - http://br.geocities.com/santiagobergliaffa/ressonancia2.pdf → experimento conceitualmente idêntico ao apresentado no presente relatório usando montagem experimental manufaturada industrialmente.
Os vídeos encontrados apenas demonstram algumas das idéias de montagem e resultados finais, sendo que nenhum foi utilizado como referência para a construção dos experimentos apresentados neste projeto.- http://www.youtube.com/watch?v=UySM4wCJuF0&feature=related → vídeo demonstrando a interação com as ondas e partículas solidas – Referência para a segunda etapa do experimento.- http://www.youtube.com/watch?v=NpEevfOU4Z8&feature=related → vídeo em que é possível observar as ondas estacionárias em líquidos. - http://www.youtube.com/watch?v=_S7-PDF6Vzc&feature=related → vídeo demonstrando padrões de ondas estacionárias em cordas.
6) Teoria

7) Reproduzir declaração do orientador:Meu orientador concorda com o expressado neste relatório parcial e deu a seguinte opinião:Até o momento não há uma opinião formal sobre o que foi feito até o RP. Este foi entregue para o orientador um encontro para conversar sobre os avanços e contratempos do projeto será marcado. Pode se apenas afirmar que o orientador está a par do desenvolvimento do projeto.
8) Indicação da escolha de horário para apresentação do painel:5a feira dia 18 de junho das 17-19 h - o segundo horário.
Apêndice 1:Referência extraídas da internet:
http://www.practicalphysics.org/go/Experiment_133.htmlStationary waves in an air columnDemonstrationThis experiment demonstrates vividly how sound waves make air vibrate in a tube. Apparatus and materials
• Loudspeaker • Signal generator • Polystyrene beads, small • Filter funnel • Tube, transparent plastic or glass (1.0 m to 1.5m long) • Rubber bung, or similar, to seal one end of tube
Technical notesPlace a thin layer of polystyrene beads along the length of the tube.
Alternatively you could use lycopdium powder or cork dust. These materials are best inserted by first sprinkling them along a metre rule, placing the rule inside the tube and then inverting it.
Photographs courtesy of Mike Vetterlein
Tape the loudspeaker in place. If the loudspeaker and tube have different diameters, join them with a paper cone or plastic cup.
Procedurea Switch on the signal generator. Vary the sound coming out of the loudspeaker, changing its
amplitude or frequency, or both. Ask students to observe the effect that each of these changes have on the vibrations of the beads.
b At some particular frequencies, a standing wave pattern will be formed, with the beads settling into heaps (piles) at certain positions along the tube.
Teaching notesAt the simplest level, this experiment demonstrates that sounds from the loudspeaker produce
vibrations in air.
At more advanced level, you could measure the average distance between adjacent nodes (where the beads settle). This will be half a wavelength. You could then explore the relationship between frequency and wavelength, for frequencies that produce a standing wave pattern (they should be inversely proportional).
Using wave speed = frequency x wavelength you could also go on to make an estimate of the speed of sound in air at the temperature of the room.
A version of this experiment, using polystyrene beads, was shown by Pascal Daman on the Luxemburg stand at Physics on Stage 3 in November 2003.
This experiment was safety-checked in February 2006
http://tuhsphysics.ttsd.k12.or.us/Research/IB03/GeorInti/page/research.htm
Kundt's Tubekelly.intile & matt.georgeTuHS Physics Home .:. Research
Background Information:Our apparatus, commonly known as Kundt's Tube, was originally designed to measure the
velocity of sound as it travels through a variety of substances. It is built using an acrylic tube that is closed at one end with a sound source at the other end. The tube lies horizontally and the substance being tested is put into the tube. When the sound source is activated, stationary waves can be observed in the substance. The wavelengths change according to the frequency of the sound.
Chapter Fifteen of Lehrbuch Der Physik (translates to “Textbook of Physics”) describes Kundt's original experiment. Kundt inserted a metal rod and piston into the tube and rubbed it to attain the desired frequency and generate the sound waves (we will use a loudspeaker instead). He also used cork dust to display the wavelengths. As the waves entered the tube, columns of dust rose at what we believe to be the nodes of each wave. Knowing where these nodes occur allows us to measure the wavelengths and, since we already know the frequency, the speed of sound can be deduced from these measurements.
On the Hyperphysics website, the experiment is outlined and there is a video example. This particular experiment also uses the “rod and piston” method of creating standing waves. This website outlines the importance of longitudinal waves in explaining the outcome of the Kundt's Tube experiment. Since the waves feature areas of high and low pressure, the standing waves in the tube are a result of variances in pressure, not waves of displacement. The idea of reflection is key to understanding the results of the experiment. Since the waves are reflected, the substance in the tube is being pressurized by two sets of waves, traveling in opposite directions.
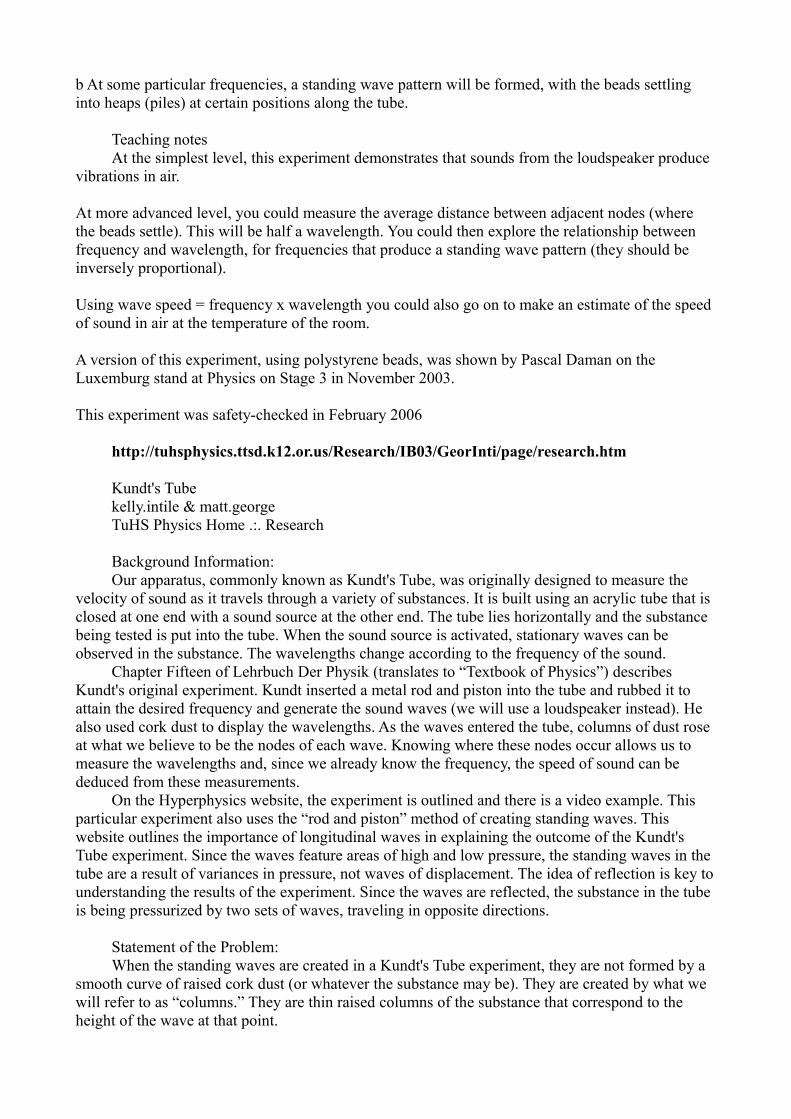
Statement of the Problem:When the standing waves are created in a Kundt's Tube experiment, they are not formed by a
smooth curve of raised cork dust (or whatever the substance may be). They are created by what we will refer to as “columns.” They are thin raised columns of the substance that correspond to the height of the wave at that point.
Our problem is to figure out why the waves are created by these columns and not in a smooth, continuous pattern. We will test how frequency varies this pattern of raised columns.
Hypothesis:We believe that since the sound waves are reflected off the closed end of the tube, the opposite
waves colliding creates the raised columns. Since sound waves are longitudinal (that is, they are made up of alternating areas of high and low pressure), then when the waves collide, they create areas of intensely high and low pressure, pushing the styrofoam balls into columns in the shape of the wave.
Materials:1 6 ft. long 3 in. diameter acrylic tube3 ventilation funnels (3 to 6 inches)a lot of wire6 inch car audio speakeranother 6 inch speaker after the first one blewfunction generatoramplifierstyrofoam ballsstatic-free spray (Static Guard)tape measure
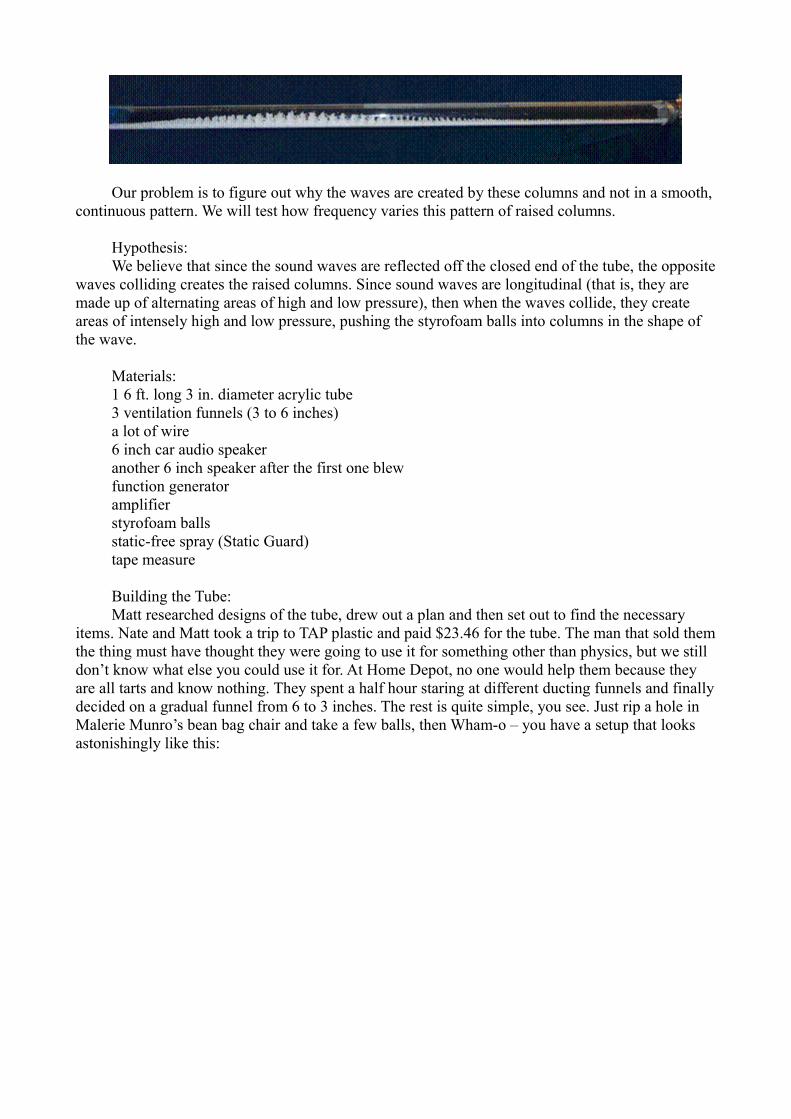
Building the Tube:Matt researched designs of the tube, drew out a plan and then set out to find the necessary
items. Nate and Matt took a trip to TAP plastic and paid $23.46 for the tube. The man that sold them the thing must have thought they were going to use it for something other than physics, but we still don’t know what else you could use it for. At Home Depot, no one would help them because they are all tarts and know nothing. They spent a half hour staring at different ducting funnels and finally decided on a gradual funnel from 6 to 3 inches. The rest is quite simple, you see. Just rip a hole in Malerie Munro’s bean bag chair and take a few balls, then Wham-o – you have a setup that looks astonishingly like this:
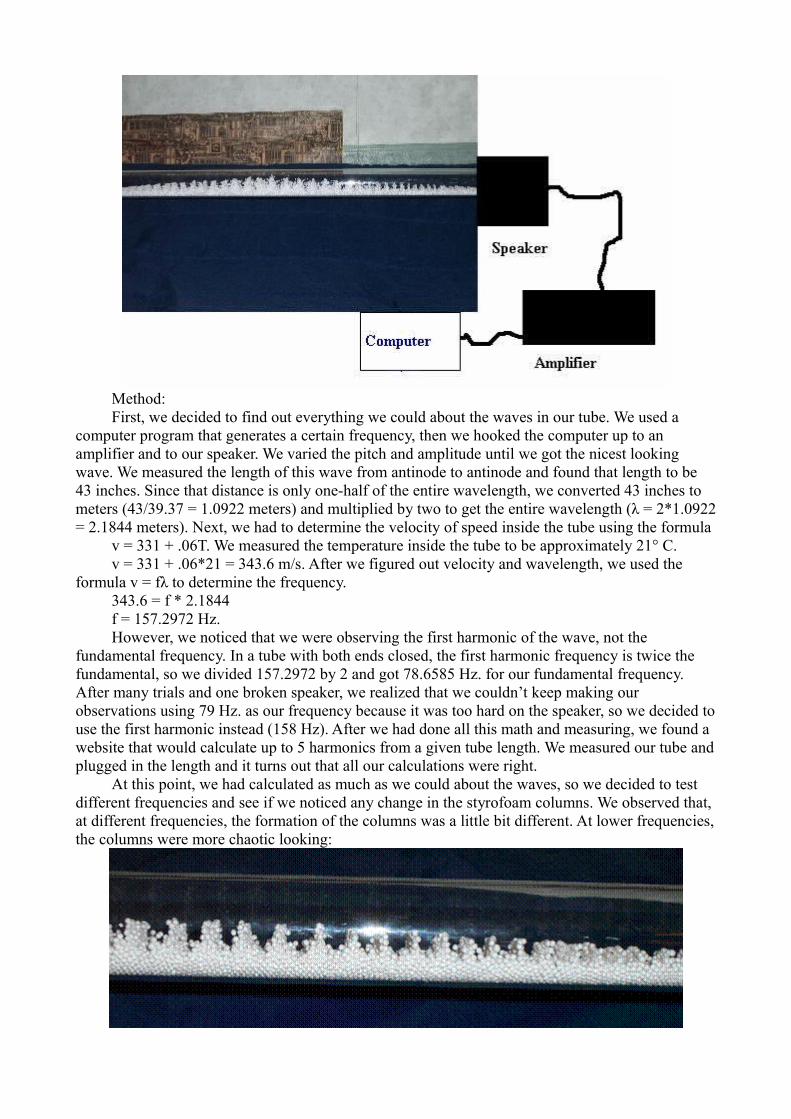
Method:First, we decided to find out everything we could about the waves in our tube. We used a
computer program that generates a certain frequency, then we hooked the computer up to an amplifier and to our speaker. We varied the pitch and amplitude until we got the nicest looking wave. We measured the length of this wave from antinode to antinode and found that length to be 43 inches. Since that distance is only one-half of the entire wavelength, we converted 43 inches to meters (43/39.37 = 1.0922 meters) and multiplied by two to get the entire wavelength (λ = 2*1.0922 = 2.1844 meters). Next, we had to determine the velocity of speed inside the tube using the formula
v = 331 + .06T. We measured the temperature inside the tube to be approximately 21° C.v = 331 + .06*21 = 343.6 m/s. After we figured out velocity and wavelength, we used the
formula v = fλ to determine the frequency.343.6 = f * 2.1844f = 157.2972 Hz.However, we noticed that we were observing the first harmonic of the wave, not the
fundamental frequency. In a tube with both ends closed, the first harmonic frequency is twice the fundamental, so we divided 157.2972 by 2 and got 78.6585 Hz. for our fundamental frequency. After many trials and one broken speaker, we realized that we couldn’t keep making our observations using 79 Hz. as our frequency because it was too hard on the speaker, so we decided to use the first harmonic instead (158 Hz). After we had done all this math and measuring, we found a website that would calculate up to 5 harmonics from a given tube length. We measured our tube and plugged in the length and it turns out that all our calculations were right.
At this point, we had calculated as much as we could about the waves, so we decided to test different frequencies and see if we noticed any change in the styrofoam columns. We observed that, at different frequencies, the formation of the columns was a little bit different. At lower frequencies, the columns were more chaotic looking:

At higher frequencies, the columns were more neat and tidy; usually exactly one styrofoam ball’s width all the way across the tube:
This led us to believe that, at least in some way, frequency had a little to do with the formation of the columns. We thought for a while that it might have something to do with the fact that we were using styrofoam and that the balls kept getting statically charged. It was very difficult to observe what was going on inside the tube with styrofoam balls clinging to all the walls, so we eventually got some Static Guard and sprayed the inside of the tube and the balls. After we used the Static Guard, there were still columns, so we deduced that static electricity had nothing to do with it. Next, we considered the possibility that the properties of styrofoam itself had caused the columns. However, during our introductory research, we had read about Kundt’s original experiment, in which he used cork dust. The sources that described his experiment in detail also noted that he had encountered columns of cork dust as well, so the formation of these columns could not be unique to styrofoam. One of the most interesting things we noticed was that, when the amplitude was very high, the columns would start to collapse into each other in a sort of “tidal wave” effect. The styrofoam balls would bunch up at the antinode of the wave and push toward the top of the tube. After a while, they would form two “tidal waves,” each traveling away from the antinode, and eventually started spilling over and falling back down to the bottom of the tube:
.:Video of tidal Wave:.
Eventually, we decided that we would study the relationship between the length between each column of balls and the frequency. We accomplished this by setting the frequency to 70 Hz. and measuring the length of 10 columns. We recorded this data and tried again, this time with 75 Hz. We realized that it would take too long if we continued to increase our frequency by 5 Hz. every time, so we decided to increase by 10 Hz.
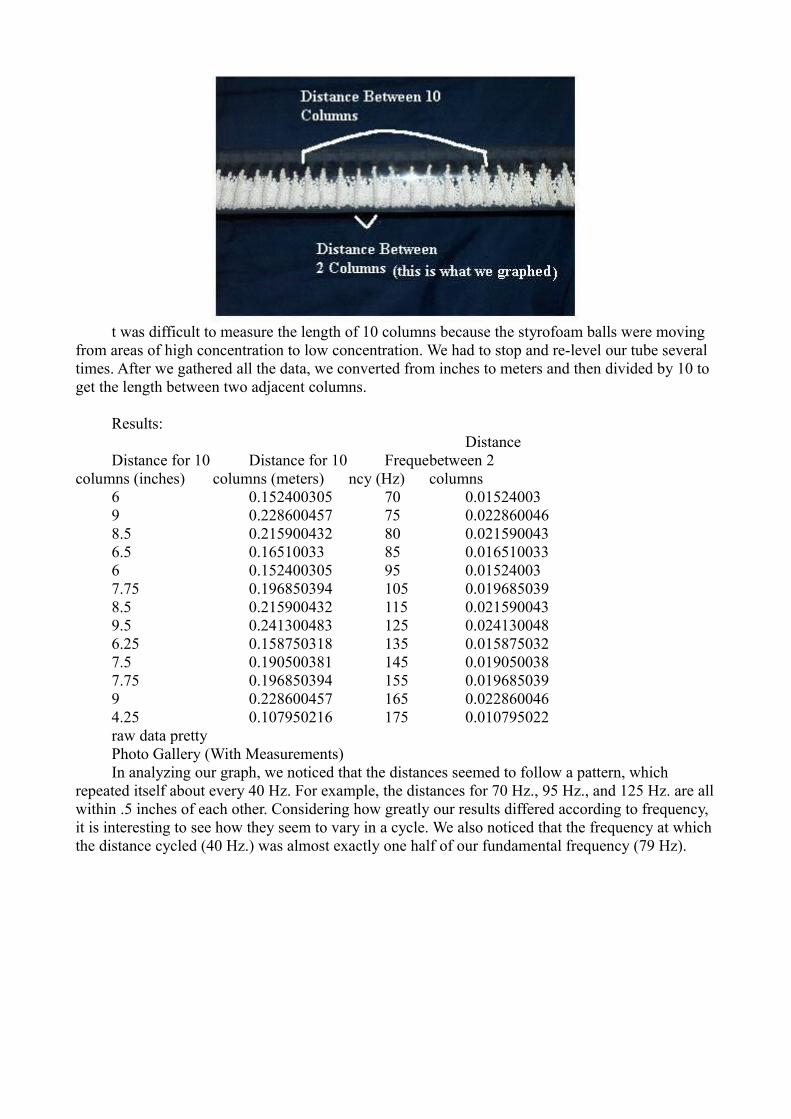
t was difficult to measure the length of 10 columns because the styrofoam balls were moving from areas of high concentration to low concentration. We had to stop and re-level our tube several times. After we gathered all the data, we converted from inches to meters and then divided by 10 to get the length between two adjacent columns.
Results:
Distance for 10 columns (inches)
Distance for 10 columns (meters)
Frequency (Hz)
Distance between 2 columns
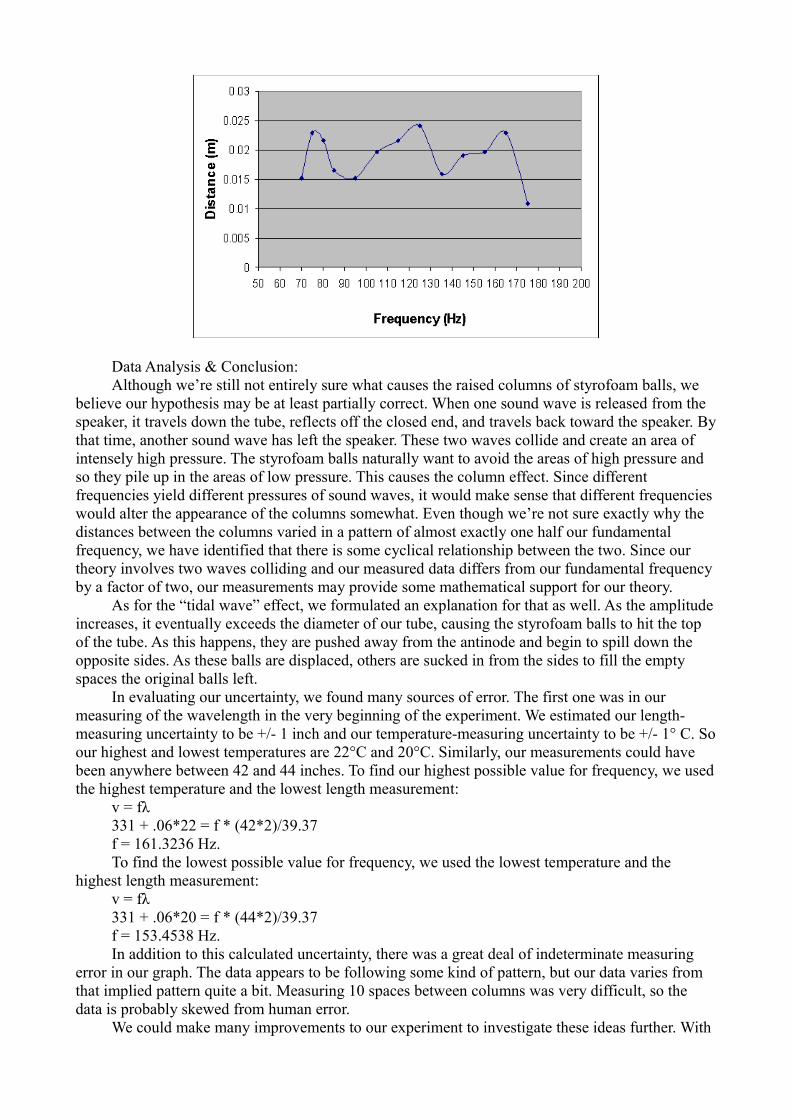
6 0.152400305 70 0.015240039 0.228600457 75 0.0228600468.5 0.215900432 80 0.0215900436.5 0.16510033 85 0.0165100336 0.152400305 95 0.015240037.75 0.196850394 105 0.0196850398.5 0.215900432 115 0.0215900439.5 0.241300483 125 0.0241300486.25 0.158750318 135 0.0158750327.5 0.190500381 145 0.0190500387.75 0.196850394 155 0.0196850399 0.228600457 165 0.0228600464.25 0.107950216 175 0.010795022raw data prettyPhoto Gallery (With Measurements)In analyzing our graph, we noticed that the distances seemed to follow a pattern, which
repeated itself about every 40 Hz. For example, the distances for 70 Hz., 95 Hz., and 125 Hz. are all within .5 inches of each other. Considering how greatly our results differed according to frequency, it is interesting to see how they seem to vary in a cycle. We also noticed that the frequency at which the distance cycled (40 Hz.) was almost exactly one half of our fundamental frequency (79 Hz).
Data Analysis & Conclusion:Although we’re still not entirely sure what causes the raised columns of styrofoam balls, we
believe our hypothesis may be at least partially correct. When one sound wave is released from the speaker, it travels down the tube, reflects off the closed end, and travels back toward the speaker. By that time, another sound wave has left the speaker. These two waves collide and create an area of intensely high pressure. The styrofoam balls naturally want to avoid the areas of high pressure and so they pile up in the areas of low pressure. This causes the column effect. Since different frequencies yield different pressures of sound waves, it would make sense that different frequencies would alter the appearance of the columns somewhat. Even though we’re not sure exactly why the distances between the columns varied in a pattern of almost exactly one half our fundamental frequency, we have identified that there is some cyclical relationship between the two. Since our theory involves two waves colliding and our measured data differs from our fundamental frequency by a factor of two, our measurements may provide some mathematical support for our theory.
As for the “tidal wave” effect, we formulated an explanation for that as well. As the amplitude increases, it eventually exceeds the diameter of our tube, causing the styrofoam balls to hit the top of the tube. As this happens, they are pushed away from the antinode and begin to spill down the opposite sides. As these balls are displaced, others are sucked in from the sides to fill the empty spaces the original balls left.
In evaluating our uncertainty, we found many sources of error. The first one was in our measuring of the wavelength in the very beginning of the experiment. We estimated our length-measuring uncertainty to be +/- 1 inch and our temperature-measuring uncertainty to be +/- 1° C. So our highest and lowest temperatures are 22°C and 20°C. Similarly, our measurements could have been anywhere between 42 and 44 inches. To find our highest possible value for frequency, we used the highest temperature and the lowest length measurement:
v = fλ331 + .06*22 = f * (42*2)/39.37f = 161.3236 Hz.To find the lowest possible value for frequency, we used the lowest temperature and the
highest length measurement:v = fλ331 + .06*20 = f * (44*2)/39.37f = 153.4538 Hz.In addition to this calculated uncertainty, there was a great deal of indeterminate measuring
error in our graph. The data appears to be following some kind of pattern, but our data varies from that implied pattern quite a bit. Measuring 10 spaces between columns was very difficult, so the data is probably skewed from human error.
We could make many improvements to our experiment to investigate these ideas further. With

more time and resources, it would be interesting to test different substances in the tube and see how the appearance of the column varies according to mass or density of the substance. The best way to test our hypothesis would have been if there was some way to measure the pressure inside the tube while the speaker was generating a frequency, but we haven’t discovered a way to do that. We also would have liked to observe changes in the columns as the length of the tube is altered (by inserting a piston instead of the closed end cap). Despite its shortcomings, our tube is an effective way to observe standing waves and how they change when the frequency is altered, or depending on whether the ends are open or closed. Even though we didn’t reach a firm conclusion about why the columns are caused, we learned a great deal about standing waves and formed a reasonable conjecture about the appearance of the raised columns.
Bibliography:
Hyperphysics. http://hyperphysics.phy-astr.gsu.edu/hbase/waves/kundtosc.htmlA website explaining the original experiment and setup.Kundt’s Tube. http://w1.xrefer.com/entry/489550Encyclopedia definition of Kundt's tubeLehrbuch Der Physik. http://kr.cs.ait.ac.th/~radok/physics/i5.htmExpanded definitions of wave theoryStanding Waves http://www.walter-fendt.de/ph14e/stlwaves.htmJava applet that shows tube length to frequency correlation Flame Tube. http://www.ph.unimelb.edu.au/staffresources/lecdem/wb3.htmSimilar to Kundt's tube, this one uses gas and the flames are differentiated in a wave patternSargent Welch http://www.sargentwelch.com/pdf/opins/84865.cfm/84865.pdf


![Levitação magnética - ifi.unicamp.brlunazzi/F530_F590_F690_F809_F895/F809/... · propriedades magnéticas da matéria [1,2]. Levitação é um fenômeno intrigante que desperta](https://img.document.onl/doc/110x75/5c61ef7a09d3f269088b708a/levitacao-magnetica-ifi-lunazzif530f590f690f809f895f809-propriedades.jpg)
![Relatório Final de Atividades Disciplina: F-609 ...lunazzi/F530_F590_F690_F809_F895/F809/... · parcialmente abordado no projeto Enclausuramento de uma fonte sonora [3], de Instrumentação](https://img.document.onl/doc/110x75/5be6de4209d3f2191b8bc903/relatorio-final-de-atividades-disciplina-f-609-lunazzif530f590f690f809f895f809.jpg)