Embed Size (px)
Citation preview
7/21/2019 6. PRA Tool Box
http://slidepdf.com/reader/full/6-pra-tool-box 1/50
RA Tool Box
//www.fao.org/docrep/003/X5996E/x5996e06.htm[5/5/2015 12:27:29 AM]
Produced by: Economic and Social
Development Department
Title: Conducting a PRA Training and Modifying PRA Tools to Your Needs. An Example ...
More details
6. PRA Tool Box
6.1. Brief Introduction to PRA.
6.2. Modified PRA Tools
6.3. Documentation Sheets for the Modified PRA tools
ANNEX B:
of the Joint Back to Office ReportTechnical Backstopp ing to the Preparatory Phase of GCP/ETH/056/BEL
Officers: Sally Sontheimer, Gender and Natural Resource Management Officer, SDWW
Karel Callens, Food and Nutrition Division, ESN
Bernd Seiffert, Participatory Approaches and Methods Officer, SDAR
Country: Ethiopia
Travel Dates Karel Callens and Bernd Seiffert: 7-22 October 1999
Sally Sontheimer: 9-20 October 1999
6.1. Brief Introduct ion to PRA.
During the Training a modified version of the PRA Manual developed by the National Team
Leader Mr. A. Mekonnen was used and distributed to the trainees. The below section serves
here as a very brief introduction to PRA/RRA.
Rapid Rural Appraisal (RRA) and PRA (Participatory Rural/Relaxed Appraisal)
RRA is an extractive research methodology consisting of systematic, semi-structured activities conducted
on-site by a multi-disciplinary team with the aim of quickly and efficiently acquiring new information about
rural life and rural resources.
(Compare Schoenhut/Kievelitz 1994)
PRA is a growing combination of approaches and methods that enable rural people to share, enhance and
analyse their knowledge of life and conditions, to plan and act and to monitor and evaluate. The role of the
outsider is that of a catalyst, a facilitator of processes within a community which is prepared to alter their
situation.
(Compare Chambers 1995 and 1997)
Rapid Rural Appraisal
RRA is a social science approach that emerged in the late 1970s. The basic idea of RRA is to
rather quickly collect, analyse and evaluate information on rural conditions and local
7/21/2019 6. PRA Tool Box
http://slidepdf.com/reader/full/6-pra-tool-box 2/50
RA Tool Box
//www.fao.org/docrep/003/X5996E/x5996e06.htm[5/5/2015 12:27:29 AM]
knowledge. This information is generated in close co-operation with the local population in
rural areas. Therefore, the research methods had to be adjusted to local conditions, i.e. they
had to meet the communication needs of illiterate people or people who are not used to
communicating in scientific terms.
Tools like mapping, diagramming and ranking were developed or improved in order to gather
information for decision-makers in development agencies. One of the key principles of RRA is
the visualisation of questions and results by using locally comprehensible symbols. A main
reason for developing RRA was to find shortcuts in the search for relevant information on rural
development issues in order to avoid costly and time consuming research procedures.
In most of the cases RRA is carried out by a small team of researchers or trained professional
in one to three days in a kind of workshop. The role of the local population in RRA is to provide
relevant local knowledge for research purposes and development planning. The RRA team
manages the process and maintains the power to decide on how to utilise this information.
Partic ipatory Rural/Relaxed Appraisal
During the 1980s, PRA was firstly developed in India and Kenya, mainly supported by NGOs
operating at grass-roots level. Until today PRA evolved so fast in terms of the methodology,
the creation of new tools and specifically in the different ways it is applied.
Compared to RRA which mainly aims at extracting information, PRA places emphasis on
empowering local people to assume an active role in analysing their own living conditions,
problems and potentials in order to seek for a change of their situation. This changes are
supposed to be achieved by collective action and the local communities are invited to assume
responsibilities for implementing respective activities. The members of the PRA team act as
facilitators. Here it is no longer the external experts but rather the local people themselves who
“own” the results of a PRA Workshop. Consequently an important principle of PRA is to share
the results of the analysis between the PRA team and the community members by
visualisation, public presentations and discussions during meetings.
Most PRA workshops last from 3 to 5 days and the planning of the workshop and the
facilitation of tools is done in a multidisciplinary team of insiders and outsiders which is gender balanced.
Some Princip les that are shared by PRA and RRA:
· Offsetting biases through different: perspectives, methods and tools, sources of
information, people from different background and places, background of team
members (spatial, person, gender, age groups, interest groups, key informants,
wealth groups, seasonal, professionals, disciplines)
· Rapid and Progressive Learning: (flexible, interactive)
· Be Gender sensitive at all times
· Reversal of roles (Learning from, with and by local people, eliciting and using
their symbols, criteria, categories and indicators; and finding, understanding and
appreciating local people's knowledge)
· Focussed Learning: (not finding out more that is needed and not measuring
when comparing is enough. We are often trained to make absolute measurements
and to give exact numbers, but often relative proportions, trends, scores or ranking
are all that is needed for decision making and planning of activities)
· Seeking for diversity and dif ferences: People often have different perceptions
7/21/2019 6. PRA Tool Box
http://slidepdf.com/reader/full/6-pra-tool-box 3/50
RA Tool Box
//www.fao.org/docrep/003/X5996E/x5996e06.htm[5/5/2015 12:27:29 AM]
of the same situation!
· Attitude: In order to make the PRA or RRA workshops an success it is most
important build a positive relationship with local women and men. Outsiders must
have an attitude of respect, humility and patience, and a willingness to learn from
the local people.
Role Descriptions of PRA Team Members:
Role description of
PRA-Facilitator
The PRA facilitator is the man or women who facilitates a focus group, the drawing of a map or
any other PRA tool.
Activi ties:
· Introduces the PRA tool to the group
· Facilitates the event
· Moderates the process
· Acts as a catalyst between the individuals of the group
· Finds ways of integrating dominant and quiet people and makes sure that all
group members are able to express their opinions
· Makes sure that the group keeps to the topic but is also flexible in handling
additional important information
· Repeats in own words what people say in order to confirm that there is a good
understanding of the discussion
· Takes care of time management
· Supports the note-taker in gathering all relevant information and assists him in
filling the documentation sheet after the group work has finished
· Is responsible to the team leader
At ti tudes:
· Has flexibility, patience and a sense of humour
· avoids to use complicated terms and words
· He/she talks the local language
· Encourages people and motivates them· “Hands over the stick” to the community group as much as possible
· Keeps a low profile during the event
· Listens carefully to any group member and does not teach,
· involves quiet and marginalised people
Role description of
Note-taker
When drawing a map, developing a seasonal calendar or applying any other PRA tool, one
7/21/2019 6. PRA Tool Box
http://slidepdf.com/reader/full/6-pra-tool-box 4/50
RA Tool Box
//www.fao.org/docrep/003/X5996E/x5996e06.htm[5/5/2015 12:27:29 AM]
person from the PRA team is the note-taker who writes down all important information and
relevant observations.
Activi ties:
· Brings along material for copying what is drawn on the ground during an event: -
white A4 paper to attach a copy to the documentation sheet
· Brings along the necessary material
· Observes the event from the background
· Writes down all important information. It would be helpful to have a checklist
showing relevant topics!
· Notes who is talking. Is there an equal participation of all or do some people
dominate the process? Do women talk?
· Assists the facilitator in an indirect way by giving signs, e.g. shoulder tapping .
· Supports the facilitator directly by asking questions, if the situation requires it.
· Takes care that participants copies any visualised subject (map, diagram etc.) on a sheet of paper immediately after the event.
· Observes and facilitates the copying, ensures that the copy resembles the
original, has a legend, a date, place and names of drawers
· Sits together with the facilitator and discusses the notes while filling the
documentation sheet after the end of the event.
At ti tudes:
· good observer
· The role of the note-taker during the event is more of a passive one. Nevertheless
he/she has the main responsibility for transforming the notes into useful results
and for visualising them to the whole team
· familiar with the language used
· is able to visualise and present results to the PRA team briefly and precisely
Role description of:
PRA Team-leader
Every PRA team has one person who serves as the team leader during the PRA field workshop.
Activi ties:
· Is responsible for the PRA team.
· Is responsible for all organisational and logistical matters concerning the PRA
workshop in the Kushet.
· Moderates the PRA workshop and evaluation meetings during the evening
7/21/2019 6. PRA Tool Box
http://slidepdf.com/reader/full/6-pra-tool-box 5/50
RA Tool Box
//www.fao.org/docrep/003/X5996E/x5996e06.htm[5/5/2015 12:27:29 AM]
· Introduces the PRA-team to the community (or organises it)
· Takes care that the events can start in time
· Assists the sub-teams if they have any problems
· Co-ordinates the village workshop events and facilitates the group presentation
· Facilitates the summarising and documentation process of the smaller teams, that
have used a PRA tool
· Stays in close contact with link persons and the opinion leaders during the whole
workshop (e.g. in order to know who participates in the different events)
At ti tudes:
· well organised
· kind and patient at all the time, keeps a cool head if things go wrong
· Sense of humour
· keeps low profile
· listens, observes, consults
6.2. Modified PRA Tools
6.2.1. Resource Map
6.2.2. Social Map
6.2.3. Wealth Ranking Objectives:
6.2.4. Local Perceptions of Malnutrition Mapping Objectives:
6.2.5. Venn Diagram on Institutions
6.2.6. Resource Cards
6.2.7. Seasonal Calendar
6.2.8. Income and Expenditure Matrix
6.2.9. Daily Activity Clocks 6.2.10. Focus group discussion: Constraints and Opportunities to achieving
Nutrition and Household Food Security
6.2.11. Semi Structured Interview: Household Case Study
6.2.12. Community Workshop
6.2.13. Daily Evaluation and Planning Meeting
6.2.1. Resource Map
PRA Tool : Resource Map
Description: The Village Resource Map is a tool that helps us to learn about a community and its resource
base. The primary concern is not to develop an accurate map but to get useful information
about local perceptions of resources. The participants should develop the content of the map
according to what is important to them.
Objectives: To learn the villagers' perception of what natural resources are found in the community and
how they are used.
With whom: Female and male focus groups
Time
needed:
2 hours
Key Questions:
7/21/2019 6. PRA Tool Box
http://slidepdf.com/reader/full/6-pra-tool-box 6/50
RA Tool Box
//www.fao.org/docrep/003/X5996E/x5996e06.htm[5/5/2015 12:27:29 AM]
1. What resources are abundant?
2. What resources are scarce?
3. Does everyone have equal access to land?
4. Do women have access to land?
5. Do the poor have access to land?
6. Who makes decision on land allocation?
7. Where do people go to collect water?
8. Who collects water?
9. Where do people go to collect firewood?10. Who collects firewood?
11. Where do people go graze livestock?
12. What kind of development activities do you carry out as a whole community?
Where?
13. Which resource do you have the most problem with?
How to facilitate:
The Village Resource Map is a good tool to begin with. It is easy and fun for the villagers to do.
It helps initiate discussion among the community and with the PRA team. All team members
should observe the mapping exercise because it provides an overall orientation to the features
of the community and its resources.
In our PRA, we would like to do this map with separate groups of men and women in the
village. This is because women and men may use different resources. The women will map
the resources they think are important (like water sources, firewood sources, etc). The men
will map the resources they think are important (like grazing land, infrastructure, etc). Maps
may include: infrastructure (roads, houses, buildings, bridges, etc); water sites and sources;
agricultural lands (crop varieties and locations); soils, slopes, elevations; forest lands; grazing
areas; shops, markets; health clinics, schools, churches; special places (sacred sites,
cemeteries, bus stops, shrines, etc)
1. Find a large open place to work.
2. Start by placing a rock or leaf to represent a central and important landmark.
3. Ask the participants to draw the boundaries of the kushet.
4. Ask the participants to draw other things on the map that are important. Don't
interrupt the participants unless they stop drawing.
5. Once they stop, you can ask whether there is anything else of importance that
should be added.
6. When the map is completed, facilitators should ask the participants to describe
it. Ask questions about anything that is unclear.
Use the key questions to guide a discussion about resources in the village. One or more
facilitators should ask the questions, another should take notes on what is said.
Be sure to draw a picture of the map on a piece of paper. Be sure that the final map includes
direction indicators (North, South, East, West).
Materials: Sticks, pebbles, leaves, sawdust, flour, dung or any other local material.
7/21/2019 6. PRA Tool Box
http://slidepdf.com/reader/full/6-pra-tool-box 7/50
RA Tool Box
//www.fao.org/docrep/003/X5996E/x5996e06.htm[5/5/2015 12:27:29 AM]
6.2.2. Social Map
Description:
A social map of the kushet is a map that is drawn by the residents and which shows the social
structures and institutions found in an area. It also helps us to learn about social and economic
differences between the households.
Objectives:
· To learn about the social structures in the Kushet and the differences among the
households by ethnicity, religion and wealth.
· To learn about who is living where.
· To learn about the social institutions and the different views local people might
have regarding those institutions.
Key Questions:
1. What are the approximate boundaries of the kushet with regard to social
interaction and social services?
2. How many households are found in the Kushet and where are they located?
3. Is the number of households growing or shrinking?
4. What are the social structures and institutions found in the Kushet?
5. What religious groups are found in the kushet? Where in the Kushet are the
different religious groups living?
6. What ethnic groups are found in the kushet? Where in the Kushet are the
different ethnic groups living?
7. Which are the female Headed Households and where are they are located?
How to facilitate:
1. Ask the participants to draw a map of the Kushet, showing all households. For
orientation it will be helpful to draw roads and significant spots of the Kushet into
the map.
2. Discuss whether the total number of households has increased or shrunk during
recent years. If there were any changes ask why the number has changed and
whether this has caused any problem for certain families or for the community at
large.
3. Ask the group to also show institutions, buildings and places that offer some kind
of social service or which are popular spots to meet and discuss. Example:
schools, churches, health service, traditional healers, community administration,
community leaders, local shop, kindergarten, places where people frequently
meet, water point etc.)
4. Encourage the group to discuss and show on the map which different ethnic
groups are living in their Kushet. Using a common symbol, mark those households
in which the minority ethnic groups live.
7/21/2019 6. PRA Tool Box
http://slidepdf.com/reader/full/6-pra-tool-box 8/50
RA Tool Box
//www.fao.org/docrep/003/X5996E/x5996e06.htm[5/5/2015 12:27:29 AM]
5. Encourage the group to discuss and show on the map which different religious
groups are living in their Kushet. Using a common symbol, mark those households
in which the minority religious groups live.
6. Ask the group to indicate with a symbol on the map all households that are
female-headed. Make sure that everybody has the same understanding of what
the characteristics of a female headed household are!
7. If time and the situation allows you should integrate the wealth ranking tool at
this point which is described on a separate tool sheet!
8. Make sure that your copy of the map has a key explaining the different items
and symbols used on the map.
Material needed: Documentation Sheet, this tool sheet, white paper for copying the map
1) If drawing on the ground: soft ground, sticks and local material for symbols, or
2) if drawing on a paper: BIG sheet of paper, pencils, markers
Time: 1,5-2 hours
Hints:
· If people find it difficult to understand this tool, it will be helpful to draw a simple
example for them.
· During the whole process, take care that once somebody has given a statement,
you ask the others whether they agree, disagree or want to add something.
· The notetaker must ensure that all important points of the discussion and also
other information is documented.
· The purpose of the social map must be very clear to all participants, make sure
that the participants do not have wrong expectations. For example they might think
that the poor households will get food donations, which is completely wrong.
· Unlike resource mapping, social maps need good and well prepared facilitation.
Be aware that some of the issues that might be discussed could be sensitive
issues for the group.
· Make sure that the objective of having all households shown on the map will be
achieved.
6.2.3. Wealth Ranking Objectives:
1. To investigate perceptions of wealth differences and inequalities in a community
2. To identify and understand local indicators and criteria of wealth and well-being
3. To map the relative position of households in a community
Methods:
1. Ranking
2. Mapping
Selecting Key Informants:
Carry out the exercise with a few key informants who know the community well.
7/21/2019 6. PRA Tool Box
http://slidepdf.com/reader/full/6-pra-tool-box 9/50
RA Tool Box
//www.fao.org/docrep/003/X5996E/x5996e06.htm[5/5/2015 12:27:29 AM]
Facilitator:
Two PRA-team members
Key Questions:
1. What are local perceptions of wealth, well-being and inequality?
2. What socio-economic groupings are there in the community and who belongs in
what group?
Steps:
1. A numbered list is made of all the households in the community (see social map)
and the name each household head and the household number is written on a
separate card.
2. A number of key informants who know the village and its inhabitants very well
are asked to sort the cards in as many piles as there are wealth categories in the
community, using their own criteria.
3. After sorting, ask the informants for the wealth criteria for each pile and
differences between the piles. Assure the informants of confidentiality and do not
discuss the ranks of individual families, so as not to cause bad feelings within the community.
4. List local criteria and indicators derived from the ranking discussion.
6.2.4. Local Perceptions of Malnutri tion Mapping Objectives:
4. To identify various forms of malnutrition prevalent in the community.
5. To understand the local perceptions of malnutrition.
6. To map nutritionally vulnerable households
Methods:
3. Key informant interview
4. Mapping
5. Ranking
6. Matrix
Selecting Key Informants:
Carry out the interview with one or more key informants. Below, possible key informants are
listed and ranked (1 to 4) according to priority.
1. Community Health Worker (1)
2. Traditional Birth Attendant (3)
3. Home Agent (2)
4. Traditional Healer (3)
5. Teacher (4)
Facilitator:
One PRA-team member
Key Questions:
7/21/2019 6. PRA Tool Box
http://slidepdf.com/reader/full/6-pra-tool-box 10/50
RA Tool Box
//www.fao.org/docrep/003/X5996E/x5996e06.htm[5/5/2015 12:27:29 AM]
3. What are the commonly seen health problems in this community? List by
children, adults and women.
4. For each group (children, adults and women) can you rank these health
problems according to their importance? Give ten marks to the most important
problem and one mark to the last important problem. Give a mark between 1 and
10 to the remaining problems.
5. Can you explain why you have given more importance to one problem than to
another? (i.e. higher incidence, more severe, etc.)
6. Can you identify those problems that are important for nutrition (i.e. marasmus,
kwashiorkor, night blindness, diarrhea, anemia, etc.)?
7. For each of the nutrition-related problems, what do local people see as the
causes? (Draw a matrix with the problems, causes, treatment)
8. What do local people in general do to treat these problems?
9. Can you identify on the village map those households that have frequently such
nutrition-related problems?
10. For each of the households that you have marked, can you explain what the
nutrition-related problems are?
11. For each of the households that you have marked, what are in your opinion the
reasons why these households are having the nutrition-related problems that you
mentioned?
6.2.5. Venn Diagram on Institutions
Description:
The Venn Diagram on Institutions shows institutions, organisations, groups and important
individuals found in the village (Kushet), as well as the villagers view of their importance in the community. Additionally the Diagram explains who participates in these groups in terms of
gender and wealth. The Institutional Relationship Diagram also indicates how close the
contact and cooperation between those organisations and groups is.
Objectives:
· To identify external and internal organisations/groups/important persons active in
the community
· To identify who participates in local organisations/institutions by gender and
wealth
· To find out how the different organisations and groups relate to each other in
terms of contact, co-operation, flow of information and provision of services
Key Questions:
· Which organisations/institutions/groups are working in or with the community?
· Which institutions/groups do the villagers regard as most important, and why?
· Which groups are addressing household food security and nutrition issues?
· Which organisations work together?
· Are there groups which are meant for women or men only?
· Are some particular groups or kind of people excluded from being members of or
7/21/2019 6. PRA Tool Box
http://slidepdf.com/reader/full/6-pra-tool-box 11/50
RA Tool Box
//www.fao.org/docrep/003/X5996E/x5996e06.htm[5/5/2015 12:27:29 AM]
receiving
services from certain institutions?
How to facilitate the process?
1) If time allows it will be good to form separate focus groups for women and men. Make sure
that also the poorest and most disadvantaged join the group.
2) Make sure that you have all material that is needed. You can a) either draw and write with a
stick on a soft ground or b) you might use a BIG sheet of paper, pencil and markers. If you
decide to use paper, people should first use a pencil to be able to still change the size of the
circles that the participants will draw.
3) Explain to the participants the three objectives (see above) of the Venn Diagram on
institutions.
4) Ask the participants which organisations/institutions/groups are found in the village (Kushet)
and which other ones from elsewhere are working with them. Make sure that they also think of
the small not formal groups like e.g. neighbourhood committees. These questions will be
useful to ask:
What kind of ways of assisting each other do exist among people? Which local groups are
organised along environmental issues (water, grazing, arable land), economic issues (saving,
credit, agriculture, livestock), social issues (health, literacy, religion, tradition, education, sport).
Are their political groups? Who makes important decisions in the Kushet?
5) Ask one of the villagers to write down all the institutions that are mentioned and to give each
organisation a symbol which everybody can understand.
6) Ask the participants to draw a big circle in the centre of the paper or on the ground that
represents themselves.
7) Ask them to discuss for each organisation how important it is for them. The most important
ones are then drawn as a big circle and the less important ones as smaller circles. Ask the
participants to compare the sizes of the circles and to adjust them so that the sizes of the
circles represent the importance of the institution, organisation or group.
8) Every organisation/group should be marked with the name or symbol.
9) Ask them to discuss in which way they benefit from the different organisations.
10) The facilitator and notetaker have to listen very carefully and the notetaker writes down,
why the different organisations are considered important or less important!
11) Ask them to show the degree of contact/co-operation between themselves and those
institutions by distance between the circles. Institutions which they do not have much contact
with should be far away from their own big circle. Institutions that are in close contact with the participants and which whom they co-operate most, should be inside their own circle. The
contact between all other institutions should also be shown by the distance between the
circles on the map:
largely distanced circles: no or little contact or co-operation
circles close to each other: only loose contacts exist
touching circles: some co-operation
overlapping circles: close co-operation
7/21/2019 6. PRA Tool Box
http://slidepdf.com/reader/full/6-pra-tool-box 12/50
RA Tool Box
//www.fao.org/docrep/003/X5996E/x5996e06.htm[5/5/2015 12:27:29 AM]
12) Ask them which institutions are only accepting women or men as members. Are their any
institutions or groups that do provide services either only for men or only for women? Show the
answers by marking the circles with a common symbol for men or women.
13) Ask them to discuss in which organisations poor people do not participate and why. Ask if
there are any services of certain organisations from which the poorer people are usually
excluded. Mark these institutions on the map by using a symbol for poor. You might also ask if
there are other groups of people that usually are excluded from some of these institutions or
services.
14) Ask the participants which institutions/groups are addressing household food security and
nutrition issues. Ask them to discuss in which way they address these issues? Mark the
mentioned institutions with a common symbol.
15) Only if time and the motivation of the participants allows, ask the group to discuss and
document the strength and weaknesses of those institutions which were reported as most
important.
Material needed: The notetaker will need the Documentation Sheet for the Venn Diagram, this
tool sheet, white paper for copying the map
1) If drawing on the ground: soft ground, sticks and local material for symbols, or 2) if drawing on a paper: BIG sheet of paper, pencils, markers
Time: 1,5 - 2 hours
Hints: If people find it difficult to understand this tool, it will be helpful to draw a simple example
for them.
6.2.6. Resource Cards
Description: Resource Picture Cards are useful for facilitating a discussion about who uses and controls
resources in a fun and non-threatening way. They show very clearly the resource base of both
men and women. This can lead to discussions about differences between men's and women's priorities and their need for resources.
Objective: To learn about differences between men and women in use and control over resources.
With whom: Mixed group of men and women, preferably from the same groups that prepared the resource
map.
Time
needed:
1.5 hours
Key Questions:
1. What are the resources that women use?
2. What are the resources that men use?
3. What resource do both use?
4. Who controls the use of these resources?
5. Who makes decisions about how resources are used?
How to facilitate:
You can use either pre-prepared cards with p ictu res or use local material to create
symbols for this exercise.
1. Explain to the group that you want to learn about resource use and control.
7/21/2019 6. PRA Tool Box
http://slidepdf.com/reader/full/6-pra-tool-box 13/50
RA Tool Box
//www.fao.org/docrep/003/X5996E/x5996e06.htm[5/5/2015 12:27:29 AM]
2. Place three large drawings, one of a man, one of a woman, and one of both, on
the ground in a row with adequate space in between them.
3. Ask the participants to think about the resources they named while doing the
resource map and any others they have, use and/or think are important.
4. If you want to use local materials, then ask the participants to develop symbols
for these resources (leaves or twigs could represent forest and firewood, cow
dung or horns can represent cattle, etc). Or you can use the pre-made Resource
Cards.
5. If using the Resource Cards, ask them to draw pictures on cards to represent
resources not on the cards.
6. Ask the participants to place the symbols or pictures under the symbol of the
man, woman or both, depending on who uses the resource.
7. Ask the participants to explain why they made the choices they did.
8. Make another row of the three large drawings, the man, the woman, and both,
on the ground underneath the other picture.
9. Repeat the exercise, but this time focus on who has control, ownership or decision-making power over each resource.
10. Ask the participants to compare the way they have arranged the symbols or
picture cards in both of the drawings.
Hints:
1. There will be a lot of discussion about where to place the symbols, under the
drawing of the man, the woman or both. Explain that only the resources
used/controlled half by men and half by women should be placed under the “both”
column. They should place the symbols or pictures under either the woman or
man to indicate who uses/controls them most.
2. Be sure to have blank cards ready to draw in resources that you have not made
pictures for.
Materials: Two sets of Resource Picture Cards, including the figures. Or sticks, pebbles, leaves, sawdust,
flour, dung or any other local material.
6.2.7. Seasonal Calendar
Type of group: mixed group for women and men
Description:
A seasonal calendar is a participatory tool to explore seasonal changes (e.g. gender-specific
workload, diseases, income, expenditure etc.)
Objectives:
· To learn about changes in livelihoods over the year and to show the seasonality
of agricultural and non agricultural workload, food availability, human diseases,
gender-specific income and expenditure, water, forage, credit and holidays.
7/21/2019 6. PRA Tool Box
http://slidepdf.com/reader/full/6-pra-tool-box 14/50
RA Tool Box
//www.fao.org/docrep/003/X5996E/x5996e06.htm[5/5/2015 12:27:29 AM]
Key Questions:
1. What are the busiest months of the year?
2. At what time of the year is food scarce?
3. How does income vary over the year for men and women?
4. How does expenditure vary over the year for men and women?
5. How does rainfall vary over the year?
6. How does water availability for human consumption vary over the year?
7. How does livestock forage availability vary over the year?
8. How does credit availability vary over the year?9. When are holidays and how many days in which month?
10. When are most agricultural work carried out by women?
11. When are most agricultural work carried out by men?
12. When is most non-agricultural work carried out by women?
13. When is most non-agricultural work carried out by men?
14. Which could be the most appropriate season for additional activities for men
and women? What time constraints do exist and for what reason?
How to facilitate:
1. Find a large open space for the group. The calendar can be drawn on the
ground or an very big sheets of paper.
2. Ask the participants to draw a matrix, indicating each month along one axis by a
symbol.
3. It usually easiest to start the calendar by asking about rainfall patterns. Choose
a symbol for rain and put/draw it next to the column which participants will now
use to illustrate the rainfall. Ask the group to put stones under each month of the
calendar to represent relative amounts of rainfall (more stones meaning more
rainfall).
4. Move to the next topic and ask people during which month the food is usually
scare. Discuss the reasons why it is scarce and make sure that the different kind
of food donations that people receive are discussed and that this information is
shown in the map.
5. Go on like this, meaning topic by topic. After finishing all the columns your matrix
should have covered the following 14 topics:
(1) Rainfall
(2) Food scarcity (many stones means less food available, indicate
during which time people receive food donations (e.g. food for work))
(3) Income (cask and kind) for women
(4) Income (cash and kind) for men
(5) Expenditure for men
(6) Expenditure for women?
(7) water availability for human consumption
(8) livestock forage availability
7/21/2019 6. PRA Tool Box
http://slidepdf.com/reader/full/6-pra-tool-box 15/50
RA Tool Box
//www.fao.org/docrep/003/X5996E/x5996e06.htm[5/5/2015 12:27:29 AM]
(9) credit availability
(10) number of holiday days
(11) agricultural work load for women
(12) agricultural work load for men
(13) non-agricultural work load for women
(14) non-agricultural work load for women
6. After the calendar is finished ask the group which linkages they see among the
different topics of the calendar. Encourage the group to discuss what they see on
the calendar.
7. Make sure that your copy of the seasonal calendar - has a key explaining the
different items and symbols used on the map.
Material needed: Documentation Sheet, this tool sheet, white paper for copying the seasonal
calendar.
1) If drawing on the ground: soft ground, stones, sticks and other available material to produce symbols, or
2) if drawing on a paper: BIG sheet of paper, pencils, markers
Time: 2 hours
Hints:
· Additional issues for the Seasonal Calendar may be added according to the
needs and interests of the participants.
6.2.8. Income and Expenditure Matrix
Description: The Income and Expenditure Matrix is a tool that helps us to identify and quantify the relative
importance of different sources of income and expenditures. The tool also helps us to
understand how secure or how vulnerable certain groups of people incomes are. In the
Expenditures matrix, we can see if all, most or only some of people's total income is spent to
meet basic needs - food, water, clothing, shelter, health care, education. We can also ask
whether people have any money left over to save or to invest in tools, fertilizer, or other
important items that could help them in their work.
Objective: To learn about sources of income (cash and kind) and how income is proportionality spent by
gender and wealth.
With whom: Two mixed focus groups (men and women), one looking at gender differences, the other at
wealth differences.Time
needed:
2 hours
Key questions:
Income matrix:
1. What are the most important sources of income in the community, both cash and
in kind?
2. Who has only a few sources of income?
7/21/2019 6. PRA Tool Box
http://slidepdf.com/reader/full/6-pra-tool-box 16/50
RA Tool Box
//www.fao.org/docrep/003/X5996E/x5996e06.htm[5/5/2015 12:27:29 AM]
3. Who has many sources of income?
4. How do poor peoples sources of income compare to rich people's?
5. How do women's sources of income compare to men's?
Expenditure matrix:
6. How are expenditures spread out over the year?
7. Which expenditures are common to almost every one?
8. For each social group, what proportion of income is spent on basic needs like food, clothing, housing, health care and education?
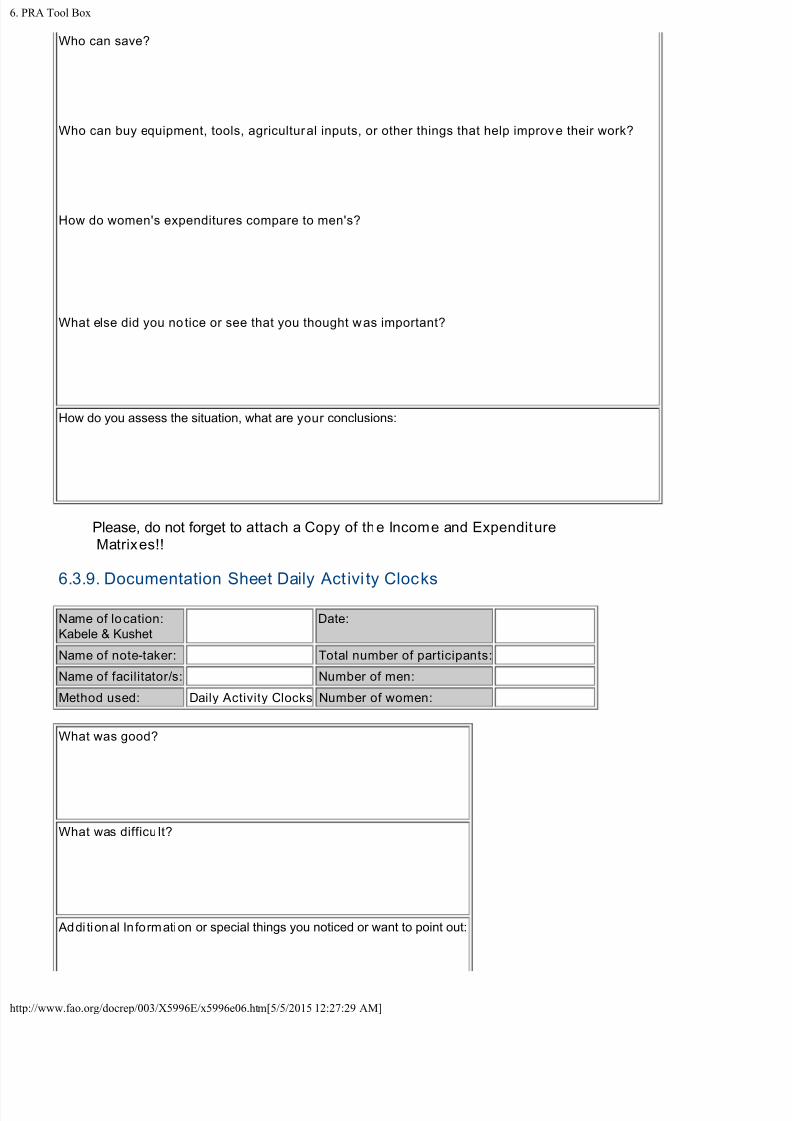
9. Who can save?
10. Who can buy equipment, tools, agricultural inputs, or other things that help
improve their work?
11. How do women's expenditures compare to men's?
How to facilitate:
For the group looking at wealth differences:
1. Explain to the group that you want to learn about where their income comes
from and how they spend it. Reassure them that you don't want to know how
much they make but are only interested in learning about where their money
comes from.
1. Ask the group to list their sources of income. Be sure to prompt them to include
both cash sources and payments in kind or by barter.
2. Start drawing the matrix on the ground or a large piece of paper.
3. Put the sources of income in the horizontal axis. The group may want to use symbols to represent the various sources.
4. Collect 50 small stones (ask the children for help). Explain that these stones
represent the total income for the whole community for the year.
5. Ask the participants to divide the 50 stones between 3 groups - poor, middle and
rich.
6. Ask the group to select a representative for each of the 3 wealth groups, and
give these representatives the portion of the stones the group decided they should
have.
7. Ask the representative to stand along the vertical axis with his/her stones.
8. Ask the representative to take turns placing their stones in the matrix to indicate
their sources of income. Carry this out until all the stones are divided.
9. Record the matrix, counting all the stones for each source of income for each
socio-economic group.
10. Repeat the same process for expenditures. Create a new matrix, using local
symbols if desired, asking the group to list all of their expenditures, including
savings.
7/21/2019 6. PRA Tool Box
http://slidepdf.com/reader/full/6-pra-tool-box 17/50
RA Tool Box
//www.fao.org/docrep/003/X5996E/x5996e06.htm[5/5/2015 12:27:29 AM]
11. Ask the representatives to collect back their stones and to redistribute them
according to how they spend their money.
For the gender group
1. The process is almost the same. Put two columns on the horizontal matrix -
men, women. Again let the group list their sources of income.
2. Again collect 50 stones. Divide them equally among the men and the women (25
each). Select a representative and start the distribution.
Hints:
Discussing incomes and expenditures can be highly sensitive. People are reluctant to talk
about these issues in public. Be sure to reassure the participants that you do not want to know
about amounts, but will only be talking about relative proportions for each group. There will be
a sensitive moment when you ask the group to agree on how to divide the stones among the
rich, middle and poor groups. Be sure that you limit the total number of stones for the
community as a whole. We suggest 50 stones.
Materials: Local material to create symbols and stones.
6.2.9. Daily Act ivi ty Clocks
Description: Daily Activity Clocks illustrate all of the different kinds of activities carried out in one day. They
are particularly useful for looking at relative work-loads between different groups in the
community. Comparisons between clocks show who works the longest hours, who
concentrates on a few activities and who does a number of tasks in a day, and who has the
most leisure time and sleep.
Objectives: To learn what different people do during one day and how heavy their workloads are.
With whom: Female and male focus groups; you can also do this with focus groups of boys and girls, if
there is time.
Time
needed:
1 hour
Key Questions:
1. For each person, how is his or her time divided?
2. What is the difference between the women's and the men's clocks?
3. Who has the heaviest workload?
4. Who has time for rest and leisure?
5. How much time per day do women or girls spend collecting water and fuelwood?
How to facilitate:
1. Organize separate focus groups of men and women. Make sure that each group
includes people from different socio-economic groups.
2. Explain that you would like to learn about what they do on a typical day.
3. Ask the groups of men and women to prepare their clocks. You can start by
asking them what they did yesterday and how they generally pass their day this
time of the year. It's easy to start the clocks by asking them what time they usually
get up.
7/21/2019 6. PRA Tool Box
http://slidepdf.com/reader/full/6-pra-tool-box 18/50
RA Tool Box
//www.fao.org/docrep/003/X5996E/x5996e06.htm[5/5/2015 12:27:29 AM]
4. Build up a picture of all the activities they carried out the day before, and how
long they took. Plot each activity on a circle which represents a clock. Activities
that are carried out at the same time (such as child care and cooking) can be
noted in the same spaces.
5. When the clocks are done, ask questions about the activities shown.
6. Note the present season (for example raining season, dry season).
7. If there is time, ask the participants to produce new clocks to represent a typical
day in the other season.
8. Compare the clocks.
9. Use the key questions above to guide a discussion about people's activities and
workloads.
Be sure to draw a picture of the clocks on paper. Be sure that the name of the
group/person is noted on the clocks and also the season of the year.
Materials: Flip chart paper, coloured markers and a ruler.
Hints: You can start by drawing a picture of how you spent your day yesterday.
Draw a big circle on paper and indicate when you wake up, what time you go to bed and all the
activities in-between. No need to go into great detail, but be sure to show that all kinds of
activities are included such as work, housework, child
6.2.10. Focus group discussion: Constraints and Opportunities to achieving
Nutrition and Household Food Security
Objectives:
1. Understand local perceptions of nutrition and household food security.
2. Identify and understand constraints in the household and community to
achieving nutrition and household food security.
3. Identify and understand mechanisms in the household and the community to
cope with nutrition and household food insecurity.
4. Identify what community, household and individual resources are required to
obtain nutrition and household food security.
Methods:
1. Semi-structured group interview
2. Ranking
3. Matrix
Selecting Focus Groups:
Plan separate meetings for men and women so as to be able to capture gender-based
differences in perceptions.
Facilitator:
Two PRA-team members
7/21/2019 6. PRA Tool Box
http://slidepdf.com/reader/full/6-pra-tool-box 19/50
RA Tool Box
//www.fao.org/docrep/003/X5996E/x5996e06.htm[5/5/2015 12:27:29 AM]
Key Questions:
Nutrition
1. What are the major health problems that members of the community have faced
during the past year? Rank these problems in order of importance by giving ten
marks to the most important problem, one mark to the least important problem and
a mark between one and ten to the remaining problems, (also find out who was
affected by what illness) (indicate those problems that are nutrition related) (if
some of the nutrition-related health problems identified during the nutrition-mapping exercise are not mentioned, ask about those problems)
2. In your view, what are the reasons for these problems and what is commonly
done to resolve the problems? (Draw a matrix with the problems, the causes, the
actions taken by the community and households) (Ask this question for each of the
nutrition-related health problems) (Probe deep enough into the reason for problem
in order to understand the underlying causes) (probe deep enough into how the
family addressed the problem and its causes)
3. How are decisions being made in the household with regard to health or
responding to health problems? Who makes specific decisions? How are
household resources allocated in case of ill health and malnutrition?
4. What resources are needed by the community, households and individuals to
become more successfull at preventing health and nutrition problems from
recurring?
Household food security
5. What are the foods commonly eaten in the community during this (dry) season?
(When listing the foods do not restrict the list)
6. Can you rank these foods according to their frequency of consumption? (Give 10
marks to the most frequently consumed food and 1 mark to the last frequently consumed food. Mark the remaining foods on a scale between 1 and 10)
7. How does the diet change during the other (rainy) season and why? (Add or
subtract foods from the list. Rank the foods again)
8. What do you consider to be a good quality diet? (Rank the foods listed before
according to importance)
9. During the last year, what have been the problems in the community,
households and individuals to obtain such an adequate diet (to be food secure)?
(focus on the three levels: community, household and individual so as to reveal
issues of food distribution within the community and within household) (Draw a matrix with the problems, the causes, the actions taken by the community and
households)
10. In your view, what were the reasons for these problems? What did the
community and households do to resolve these problems? (Probe deep enough
into the reason for the problem in order to understand the underlying causes)
(Probe deep enough into how the community addressed the problem and its
causes)
11. How are decisions being made within the household with regard to achieving
7/21/2019 6. PRA Tool Box
http://slidepdf.com/reader/full/6-pra-tool-box 20/50
RA Tool Box
//www.fao.org/docrep/003/X5996E/x5996e06.htm[5/5/2015 12:27:29 AM]
food security or responding to problems of attaining food security? Who makes
specific decisions? How are resources allocated to achieving food security? How
are resources reallocated in case of food insecurity?
12. What measures are taken by the community and households to prevent food
security problems from reccuring?
13. What resources are needed by the community, households and individuals to
become more successfull at preventing food security problems from recurring?
6.2.11. Semi Structured Interview: Household Case Study
Objectives:
5. Understand why members of a household (that was mapped as being affected
by malnutrition) have nutrition-related health problems and why other households
are not affected.
6. Identify constraints and opportunities in the household and community for
household members to achieve nutrition security.
Methods:
4. Semi-structured interview
5. Ranking
6. Observation
Selecting Households:
1. Sort and pile the households in the community by those that were mapped as
having nutrition-related health problems and those that have no such problems.
2. With each pile, sort and pile households that were ranked as wealthy and those
that were ranked as poor. (You should now have four piles)
3. Within each pile, sort and pile households that are male headed and those that
are female headed. (You should now have eight piles)
4. Randomly select one household from each pile. A household case study will be
carried out in each household.
5. The facilitators will carry out the interview at the house.
Facilitator:
Two PRA-team members
Key Questions:
14. Who lives in this household? (father, mother, children, permanent dependants
like grandparents, temporary dependants) (for the children, find out how old they
are)
15. What are the major health problems that some of your family members have
faced during the past year? (find out who was affected by what illness) (indicate
those problems that are nutrition related) (if some of the nutrition-related health
problems identified during the nutrition-mapping exercise are not mentioned, ask
7/21/2019 6. PRA Tool Box
http://slidepdf.com/reader/full/6-pra-tool-box 21/50
RA Tool Box
//www.fao.org/docrep/003/X5996E/x5996e06.htm[5/5/2015 12:27:29 AM]
about those problems)
16. In your view, what were the reasons for these problems and what did you do to
solve the problems? (Ask this question for each of the nutrition-related health
problems) (Probe deep enough into the reason for problem in order to understand
the underlying causes) (probe deep enough into how the family addressed the
problem and its causes)
17. What measures have you taken to prevent such problems from reccuring?
18. What resources would you need to become more successfull at preventing
such problems of recurring?
19. What are the foods commonly eaten in the household during this (dry) season?
(When listing the foods do not restrict the list)
20. Can you rank these foods according to their frequency of consumption? (Give
10 marks to the most frequently consumed food and 1 mark to the last frequently
consumed food. Mark the remaining foods on a scale between 1 and 10)
21. How does the households diet change during the other (rainy) season and
why? (Add or subtract foods from the list. Rank the foods again)
22. During the last year, what have been your problems to be able to feed your
family well?
23. In your view, what were the reasons for these problems and what did you do to
resolve these problems? How did you feed your family during these periods?
(Probe deep enough into the reason for problem in order to understand the
underlying causes) (probe deep enough into how the family addressed the
problem and its causes)
24. What measures have you taken to prevent such problems from reccuring?
25. What resources would you need to become more successfull at preventing such problems of recurring?
6.2.12. Community Workshop
Objectives:
7. To present the main findings and conclusions of the appraisal to the community
at large.
8. To provide an opportunity to the community for discussion of the main findings of
the appraisal.
9. To reach a consensus on the way forward and the roles and responsibilities of
the community, the community support staff and the project.
Methods:
7. Presentation
8. Group Discussion
Target groups:
7/21/2019 6. PRA Tool Box
http://slidepdf.com/reader/full/6-pra-tool-box 22/50
RA Tool Box
//www.fao.org/docrep/003/X5996E/x5996e06.htm[5/5/2015 12:27:29 AM]
Organize a meeting with the community at large, ensuring that men and women are equally
represented, as well as people from different socio-economic groups and ages.
Facilitators:
All PRA-team members
Key Questions:
12. What are views of the community on the main findings of the appraisal.
13. In anticipation of project approval and implementation, what actions can the community and the community support staff already initiate, using locally available
resources, to start address some of the problems raised during the appraisal.
Procedure:
1. The PRA-field team Leader presents an overview of the activities of the last four
days.
2. Each PRA-team member presents the main findings of the PRA exercise
facilitated by him or her. Main findings and conclusions should be presented using
the Evaluation Matrix, giving: key questions, main findings, strengths within the
community, weaknesses within the community, opportunities outside the community, threats outside the community, and conclusions.
3. Following the presentation of all findings, the gathering should be split up in five
groups:
Community Leaders, Adult Men, Adult Women, Young People, and Community
Support Staff.
4. Each groups should discuss among themselves the findings and conclusions of
the PRA and identify what actions could be undertaken by themselves (young, old,
men, women, leaders, support staff) to address some of the identified problems
within limits of the local resource base (human, financial, natural, social, institutional, etc.). PRA team members may facilitate this exercise, allowing
maximum participation from the group members, and using the various elements
of the SWOT analyses as entry points. For example, what are the weaknesses in
the community that the community needs to address and what are the strengths
that need emphasizing? How can opportunities coming from outside be utilized
and threats reduced and what is the role of the community support staff in that?
5. Each group presents its findings and conclusions to the plenary meeting.
6. The PRA field team leader explains what the steps prior to the actual
implementation of the project will be: causal analysis at regional level, project
planning and formulation, review and approval of the project proposal by a tri-
partite review meeting (BSF, FAO, Government of Ethiopia)
7. The PRA field team leader expresses the commitment of the project to follow-up
on the process initiated through the PRA. Namely, the first step following the
approval of the project proposal would be the initiation of a “Community Action
Planning” process, building on the findings of the appraisal, and resulting in the
implementation of various community based micro-projects.
8. Vote of thanks by the various stakeholders.
7/21/2019 6. PRA Tool Box
http://slidepdf.com/reader/full/6-pra-tool-box 23/50
RA Tool Box
//www.fao.org/docrep/003/X5996E/x5996e06.htm[5/5/2015 12:27:29 AM]
Materials:
1. Flip charts with the “Main Questions and Findings, SWOT and Conclusions” of
the various exercises prepared prior to the meeting.
2. Flip charts for documenting the group discussions.
6.2.13. Daily Evaluation and Planning Meeting
Description:
Every afternoon the PRA team comes together to reflect the process of day, to present the
results gathered, to evaluate the results and to plan for the next day.
Objectives:
· To present the results of the day.
· To summarise and structure the results according to the key questions and
according to related Strength and Weaknesses inside the community and
according to Opportunities and Threats identified outside the community.
· To compare the results of the different groups and to identify differences and correspondences.
· To enable the PRA team to elaborate new relevant key questions and a
programme for the next day.
How to facili tate the Process:
Before starting the Evaluation and Planning Meeting:
1. The PRA team-leader prepares the matrix on a big sheet of paper. Fill in the
fields: Type of group, Tool, Team and key questions. The PRA team-leader is also
responsible to moderate the team meeting.
2. Every team (PRA Facilitator and Note-taker) that facilitated one group fills in a
short and summarised version of the results gathered during the event. This
information is written in the field:
Main Findings and should contain answers to the key questions.
3. Other information that relates to the key questions is structured according to
Strength and
Weaknesses inside the community and according to Opportunities and Threats
identified outside the community.
Strength inside the Community could be: positive characteristics and advantages
of a situation or issue, locally available potentials, capacities, resources,
experience, knowledge, related successes
Weaknesses inside the Community could be: negative characteristics and
disadvantages of a situation or issue, constraints, difficulties, problems,
shortcomings
Opportunities outside the Community could be: Factors, situations that can
benefit, enhance or improve the situation or issue.
7/21/2019 6. PRA Tool Box
http://slidepdf.com/reader/full/6-pra-tool-box 24/50
RA Tool Box
//www.fao.org/docrep/003/X5996E/x5996e06.htm[5/5/2015 12:27:29 AM]
Threats outside the Community could be: Factors, situations that can hinder the
issue or situation.
4. All important additionally gathered information is written in the last row:
“Additional information” Are all key questions answered sufficiently? Which
information is still missing?
During the Meeting:
5. Every team that facilitated one event presents their findings using the respective row of the Evaluation matrix that they had filled in.
6. After all teams have presented their work of the day, the whole PRA team
discusses the results and identifies the “Open Questions of the day” which still
need to be answered.
Questions to guide the discussion could be:
Are all key questions answered sufficiently? Which information is still missing?
Are there new questions which have to be answered during the following days?
Are some results of the different groups contradicting? What has still to be
clarified?
Are some results reflecting a different perception or interest of certain groups (e.g.
women, men, rich, poor, religious groups etc.)?
7. Based on the discussion and newly developed questions plan the next day.
8. You might also want to talk about how people experienced the whole day. It will
always be good to take enough time so that everybody can express what he or
she liked or did not like about the day and the process.
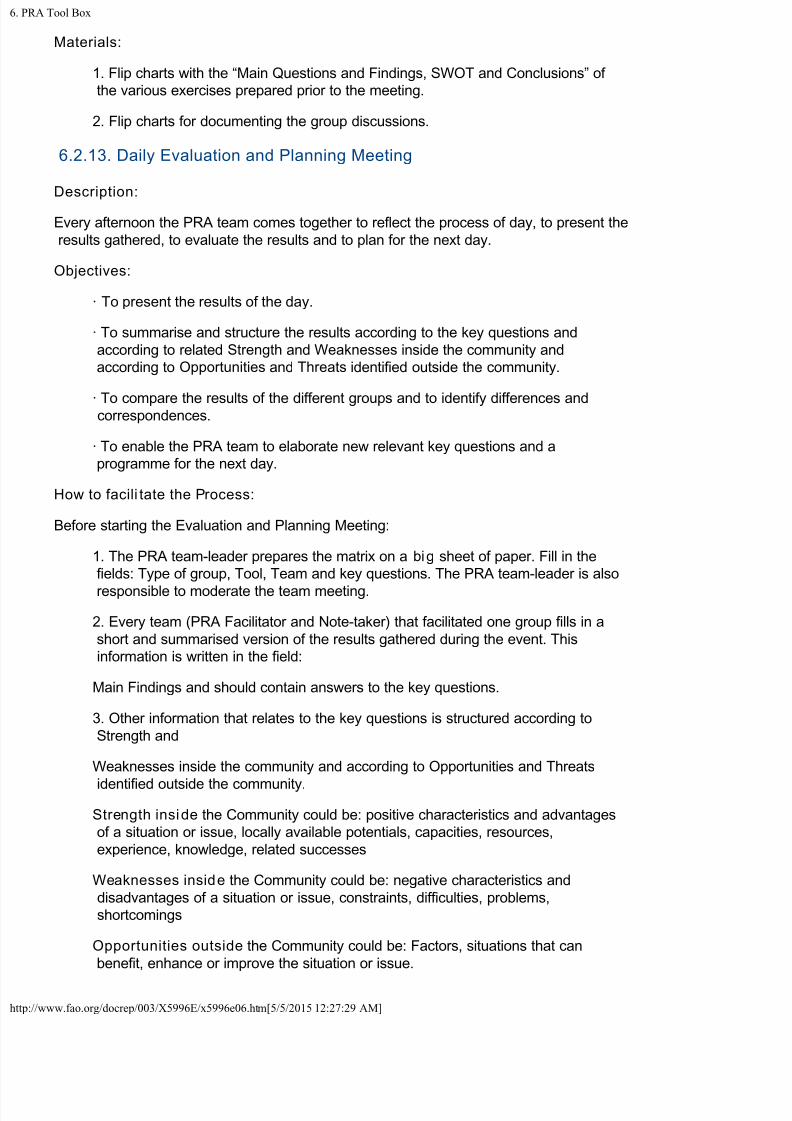
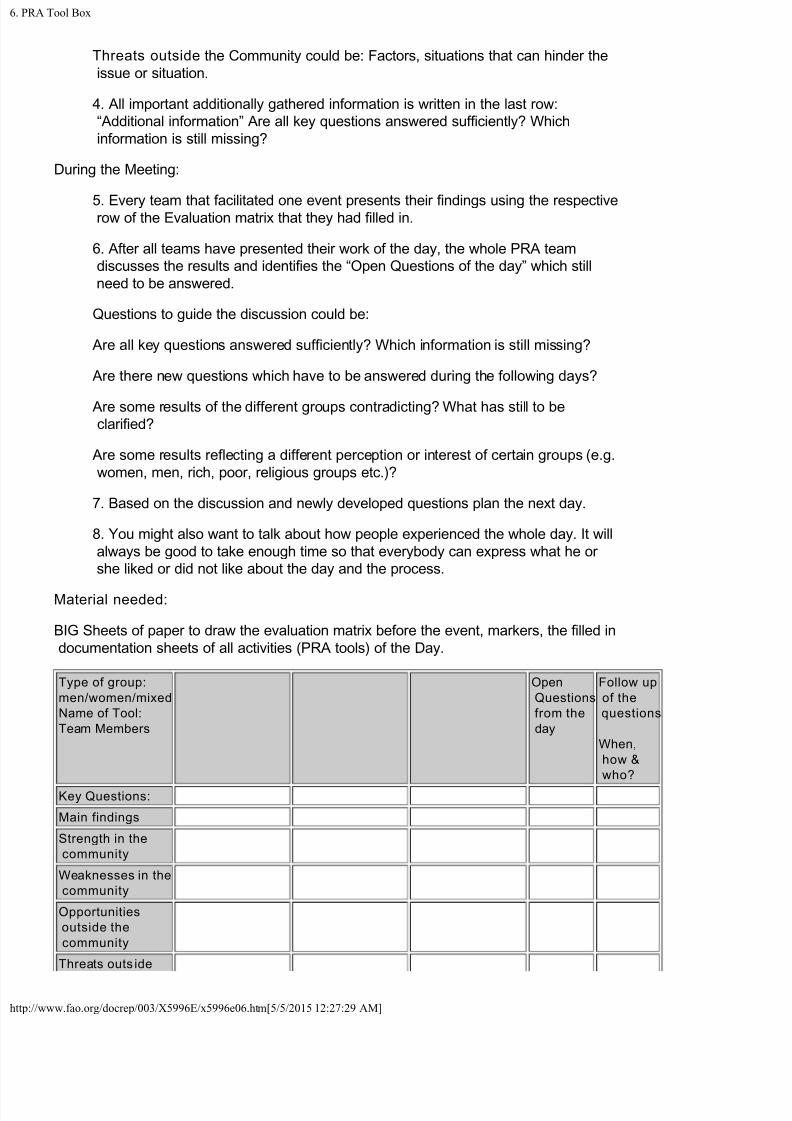
Material needed:
BIG Sheets of paper to draw the evaluation matrix before the event, markers, the filled in
documentation sheets of all activities (PRA tools) of the Day.
Type of group:
men/women/mixed
Name of Tool:
Team Members
Open
Questions
from the
day
Follow up
of the
questions
When,
how &
who?
Key Questions:
Main findings
Strength in the
community
Weaknesses in the
community
Opportunities
outside the
community
Threats outs ide
7/21/2019 6. PRA Tool Box
http://slidepdf.com/reader/full/6-pra-tool-box 25/50
RA Tool Box
//www.fao.org/docrep/003/X5996E/x5996e06.htm[5/5/2015 12:27:29 AM]
the community
Addi tional
information
Evaluation Matrix
6.3. Documentation Sheets for the Modified PRA tools
6.3.1 Documentation Sheet Resource Map 6.3.2. Documentation Sheet Social Map
6.3.3. Documentation Sheet Wealth Ranking
6.3.4. Documentation Sheet Local Perceptions of Malnutrition Mapping
6.3.5 Documentation Sheet Venn Diagram on Institutions
6.3.6. Documentation Sheet Resource Cards
6.3.7. Documentation Sheet Seasonal Calendar
6.3.8. Documentation Sheet Income and Expenditure Matrix
6.3.9. Documentation Sheet Daily Activity Clocks
6.3.10. Documentation Sheet Focus Group Discussion on Constraints and
Opportunities to achieving Nutrition and Household Food Security
6.3.11. Documentation Sheet for Household Case Study - Semi Structured Interviews
6.3.12. Documentation Sheet Community Workshop
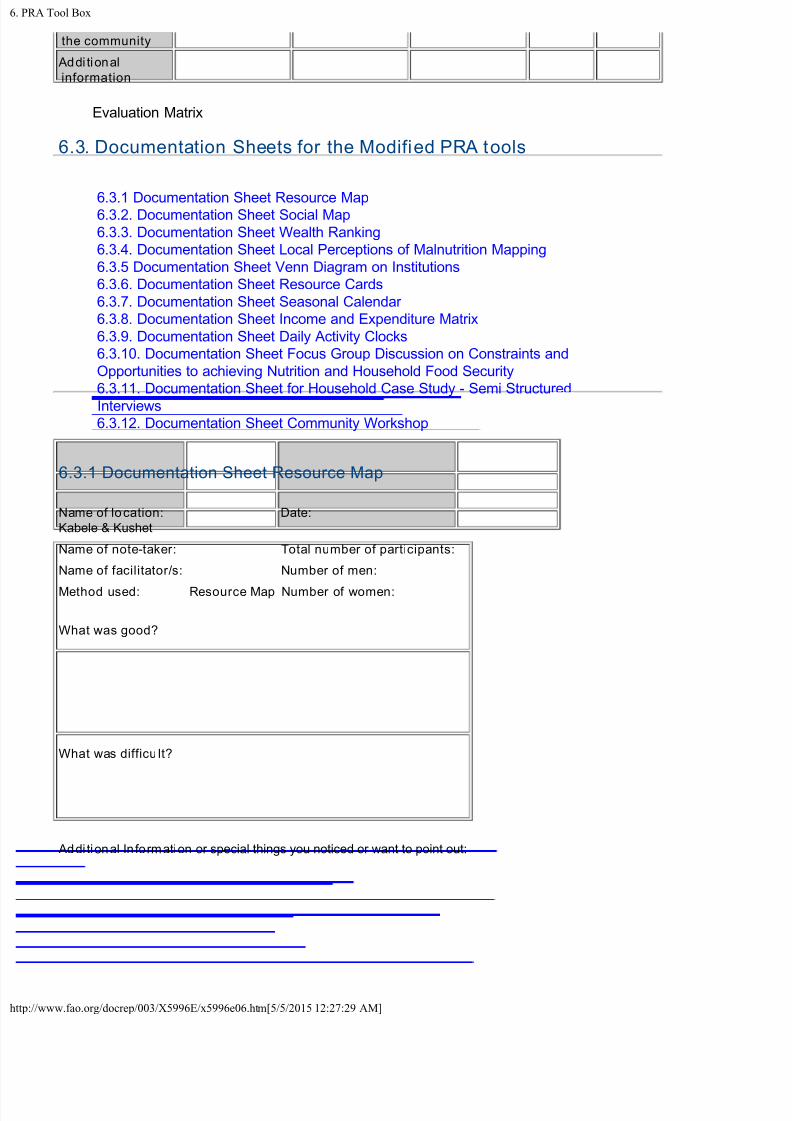
6.3.1 Documentation Sheet Resource Map
Name of location:
Kabele & Kushet
Date:
Name of note-taker: Total number of participants:
Name of facilitator/s: Number of men:
Method used: Resource Map Number of women:
What was good?
What was difficu lt?
Addi tional In formation or special things you noticed or want to point out:
7/21/2019 6. PRA Tool Box
http://slidepdf.com/reader/full/6-pra-tool-box 26/50
RA Tool Box
//www.fao.org/docrep/003/X5996E/x5996e06.htm[5/5/2015 12:27:29 AM]
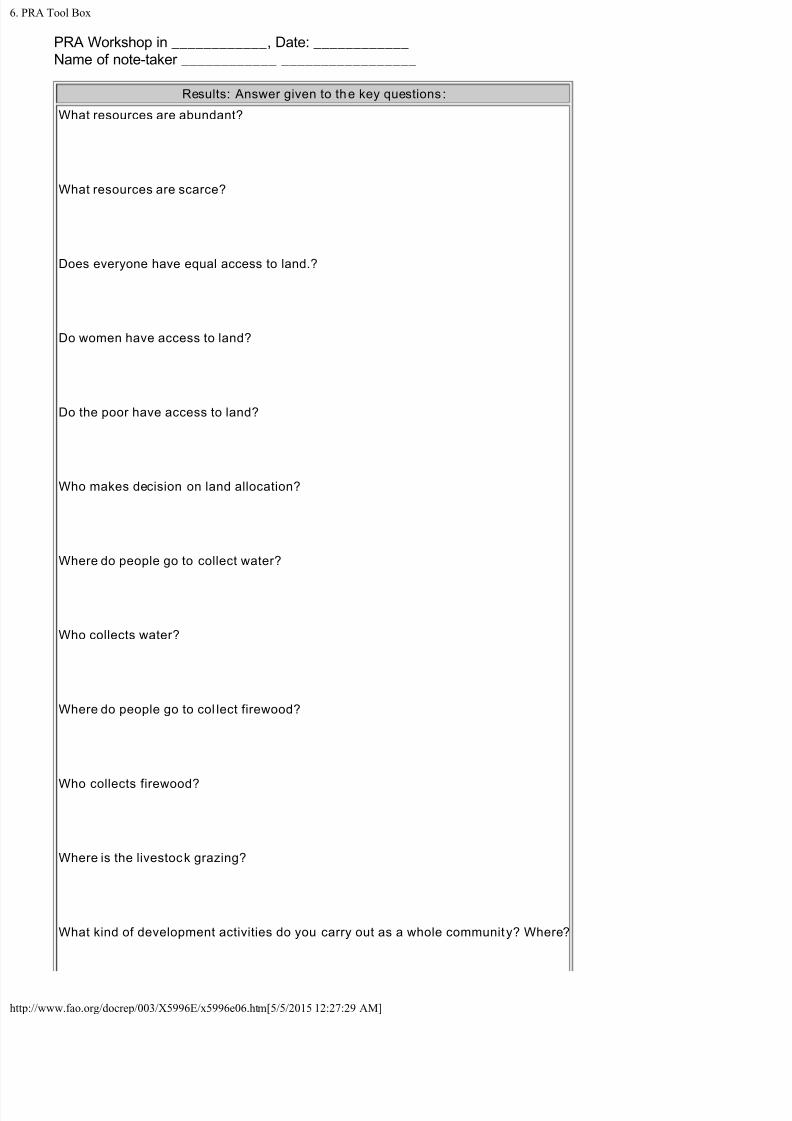
PRA Workshop in ____________, Date: ____________
Name of note-taker ____________ _________________
Results: Answer given to the key questions :
What resources are abundant?
What resources are scarce?
Does everyone have equal access to land.?
Do women have access to land?
Do the poor have access to land?
Who makes decision on land allocation?
Where do people go to collect water?
Who collects water?
Where do people go to col lect firewood?
Who collects firewood?
Where is the livestock grazing?
What kind of development activities do you carry out as a whole community? Where?
7/21/2019 6. PRA Tool Box
http://slidepdf.com/reader/full/6-pra-tool-box 27/50
RA Tool Box
//www.fao.org/docrep/003/X5996E/x5996e06.htm[5/5/2015 12:27:29 AM]
Which resource do you have the most problem with?
What else did you observe or noti ce?
How do you assess the situation, what are your conclusions:
Please, do not forget to attach a Copy of the Resource Map!!
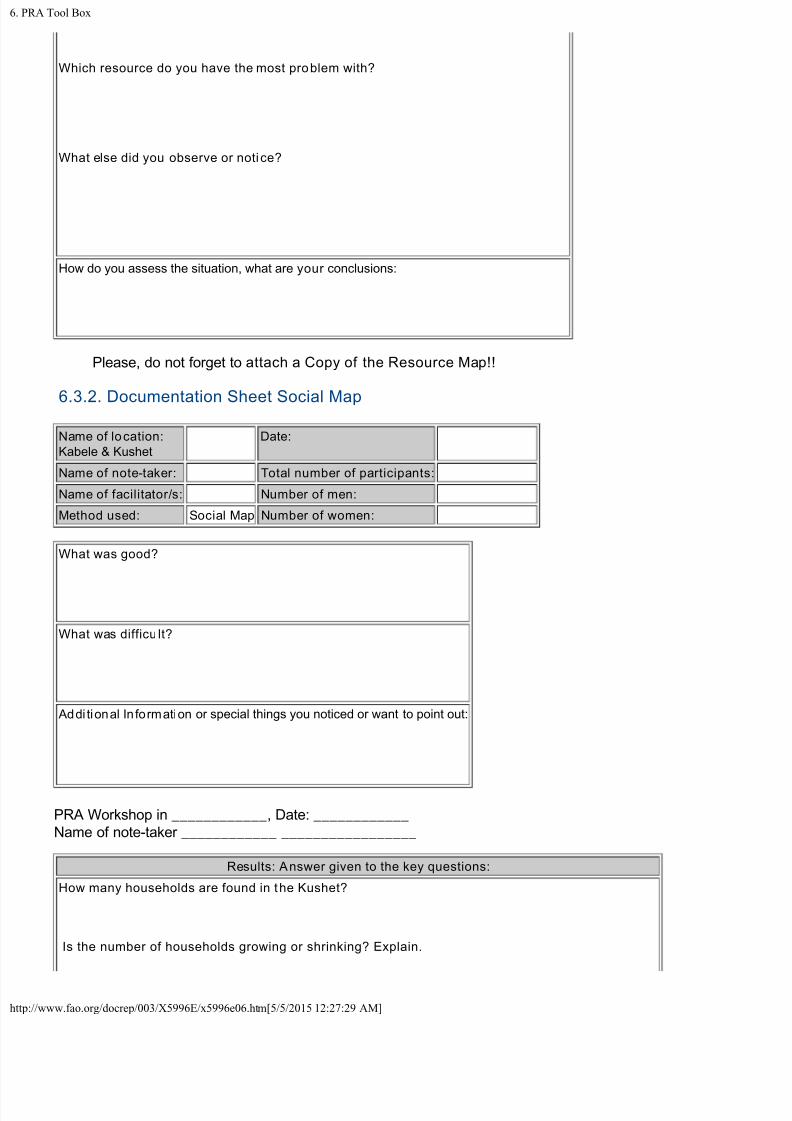
6.3.2. Documentation Sheet Social Map
Name of location:
Kabele & Kushet
Date:
Name of note-taker: Total number of participants:
Name of facilitator/s: Number of men:
Method used: Social Map Number of women:
What was good?
What was difficu lt?
Addi tional In formation or special things you noticed or want to point out:
PRA Workshop in ____________, Date: ____________
Name of note-taker ____________ _________________
Results: Answer given to the key questions:
How many households are found in the Kushet?
Is the number of households growing or shrinking? Explain.
7/21/2019 6. PRA Tool Box
http://slidepdf.com/reader/full/6-pra-tool-box 28/50
RA Tool Box
//www.fao.org/docrep/003/X5996E/x5996e06.htm[5/5/2015 12:27:29 AM]
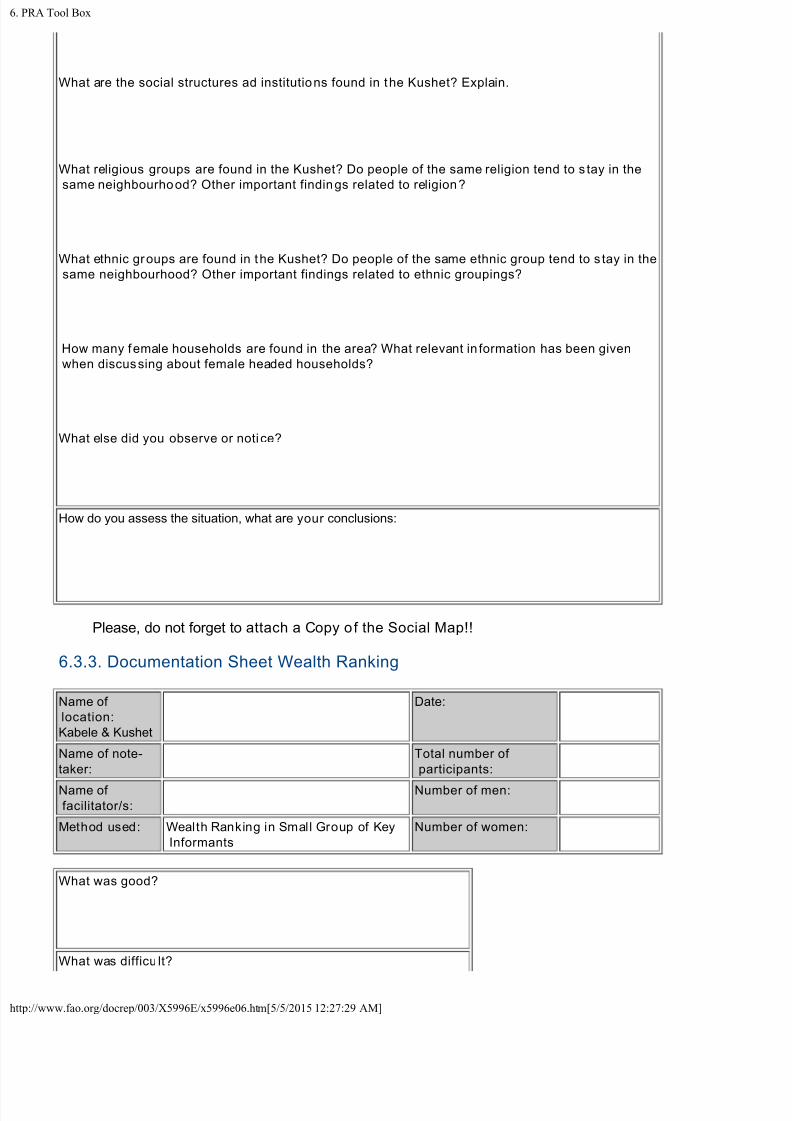
What are the social structures ad institutions found in the Kushet? Explain.
What religious groups are found in the Kushet? Do people of the same religion tend to s tay in the
same neighbourhood? Other important findings related to religion?
What ethnic groups are found in the Kushet? Do people of the same ethnic group tend to s tay in the
same neighbourhood? Other important findings related to ethnic groupings?
How many female households are found in the area? What relevant in formation has been given
when discussing about female headed households?
What else did you observe or noti ce?
How do you assess the situation, what are your conclusions:
Please, do not forget to attach a Copy of the Social Map!!
6.3.3. Documentation Sheet Wealth Ranking
Name of
location:
Kabele & Kushet
Date:
Name of note-
taker:
Total number of
participants:
Name of
facilitator/s:
Number of men:
Method used: Wealth Ranking in Small Group of Key
Informants
Number of women:
What was good?
What was difficu lt?
7/21/2019 6. PRA Tool Box
http://slidepdf.com/reader/full/6-pra-tool-box 29/50
RA Tool Box
//www.fao.org/docrep/003/X5996E/x5996e06.htm[5/5/2015 12:27:29 AM]
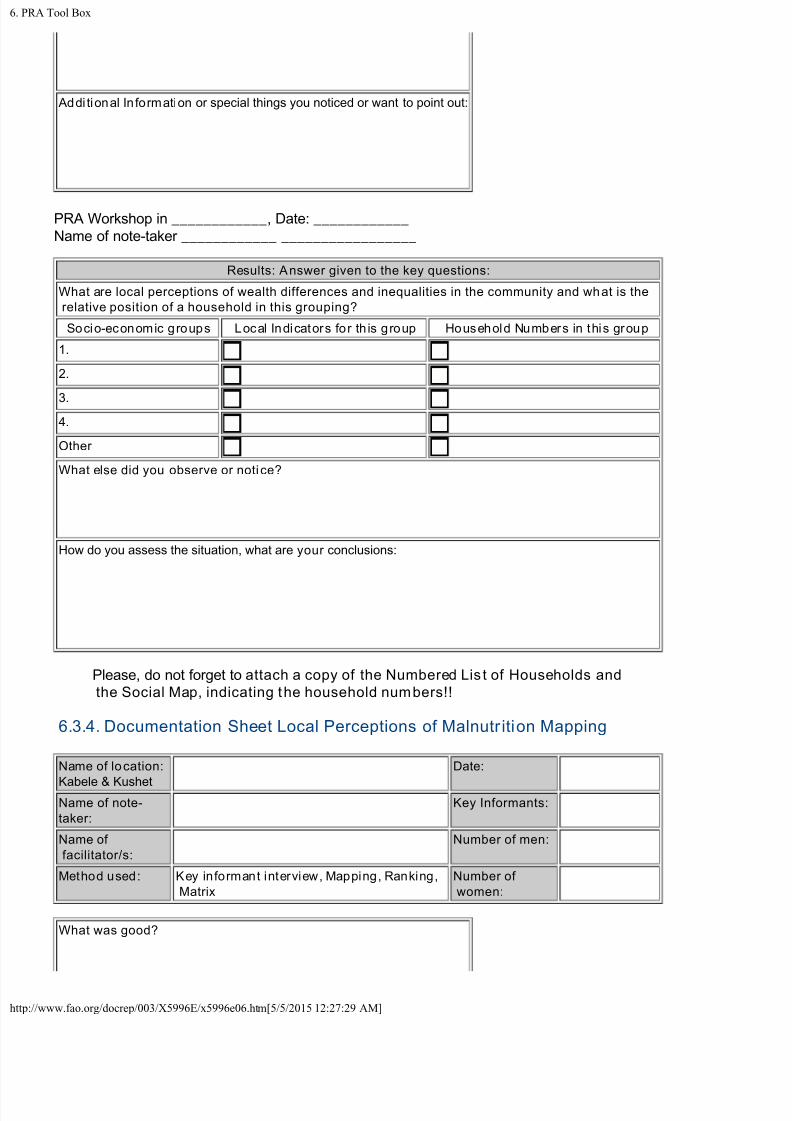
Addi tional In formation or special things you noticed or want to point out:
PRA Workshop in ____________, Date: ____________
Name of note-taker ____________ _________________
Results: Answer given to the key questions:
What are local perceptions of wealth differences and inequalities in the community and what is the
relative position of a household in this grouping?
Socio-economic groups Local Indicators for th is group Household Numbers in this group
1.
2.
3.
4.
Other
What else did you observe or noti ce?
How do you assess the situation, what are your conclusions:
Please, do not forget to attach a copy of the Numbered Lis t of Households and
the Social Map, indicating the household numbers!!
6.3.4. Documentation Sheet Local Perceptions of Malnutr ition Mapping
Name of location:
Kabele & Kushet
Date:
Name of note-
taker:
Key Informants:
Name of
facilitator/s:
Number of men:
Method used: Key informant interview, Mapping, Ranking,
Matrix
Number of
women:
What was good?
7/21/2019 6. PRA Tool Box
http://slidepdf.com/reader/full/6-pra-tool-box 30/50
RA Tool Box
//www.fao.org/docrep/003/X5996E/x5996e06.htm[5/5/2015 12:27:29 AM]
What was difficu lt?
Addi tional In formation or special things you noticed or want to point out:
PRA Workshop in ____________, Date: ____________
Name of note-taker ____________ _________________
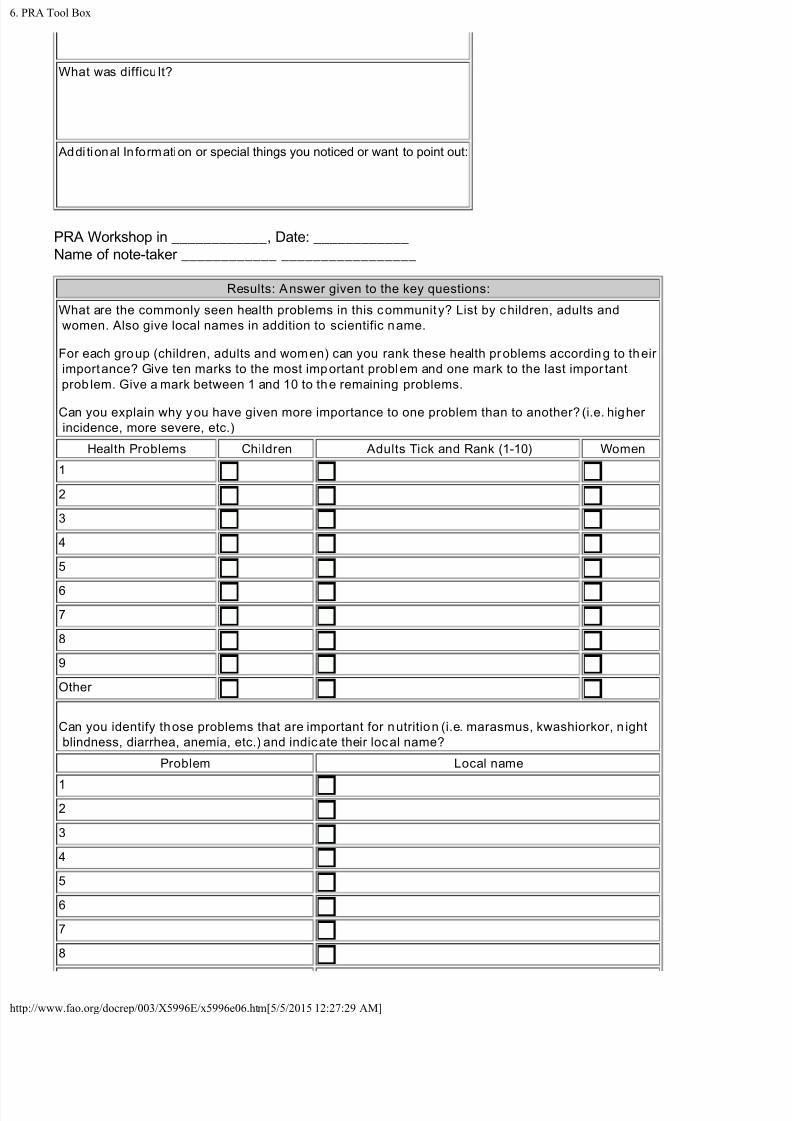
Results: Answer given to the key questions:
What are the commonly seen health problems in this community? List by children, adults and
women. Also give local names in addition to scientific name.
For each group (children, adults and women) can you rank these health problems according to their
importance? Give ten marks to the most important problem and one mark to the last impor tant
prob lem. Give a mark between 1 and 10 to the remaining problems.
Can you explain why you have given more importance to one problem than to another? (i.e. higher
incidence, more severe, etc.)
Health Problems Children Adults Tick and Rank (1-10) Women
1
2
3
4
5
6
7
8
9
Other
Can you identify those problems that are important for nutrition (i.e. marasmus, kwashiorkor, n ight
blindness, diarrhea, anemia, etc.) and indicate their local name?
Problem Local name
1
2
3
4
5
6
7
8
7/21/2019 6. PRA Tool Box
http://slidepdf.com/reader/full/6-pra-tool-box 31/50
RA Tool Box
//www.fao.org/docrep/003/X5996E/x5996e06.htm[5/5/2015 12:27:29 AM]
Other
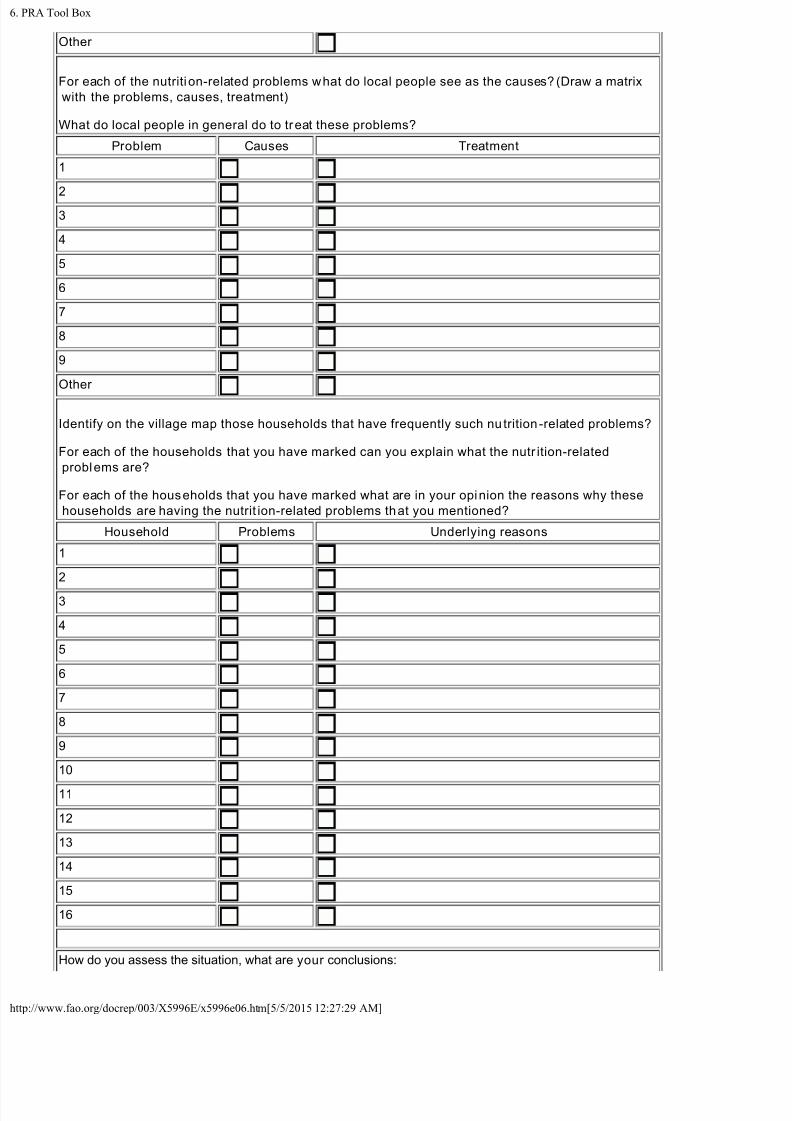
For each of the nutriti on-related problems what do local people see as the causes? (Draw a matrix
with the problems, causes, treatment)
What do local people in general do to treat these problems?
Problem Causes Treatment
1
23
4
5
6
7
8
9
Other
Identify on the village map those households that have frequently such nu trition-related problems?
For each of the households that you have marked can you explain what the nutr ition-related
problems are?
For each of the households that you have marked what are in your opinion the reasons why these
households are having the nutrit ion-related problems that you mentioned?
Household Problems Underlying reasons
1
2
3
4
5
6
7
8
9
10
11
12
13
14
15
16
How do you assess the situation, what are your conclusions:
7/21/2019 6. PRA Tool Box
http://slidepdf.com/reader/full/6-pra-tool-box 32/50
RA Tool Box
//www.fao.org/docrep/003/X5996E/x5996e06.htm[5/5/2015 12:27:29 AM]
Please, do not forget to attach a Copy of the Nutri tion Map!!
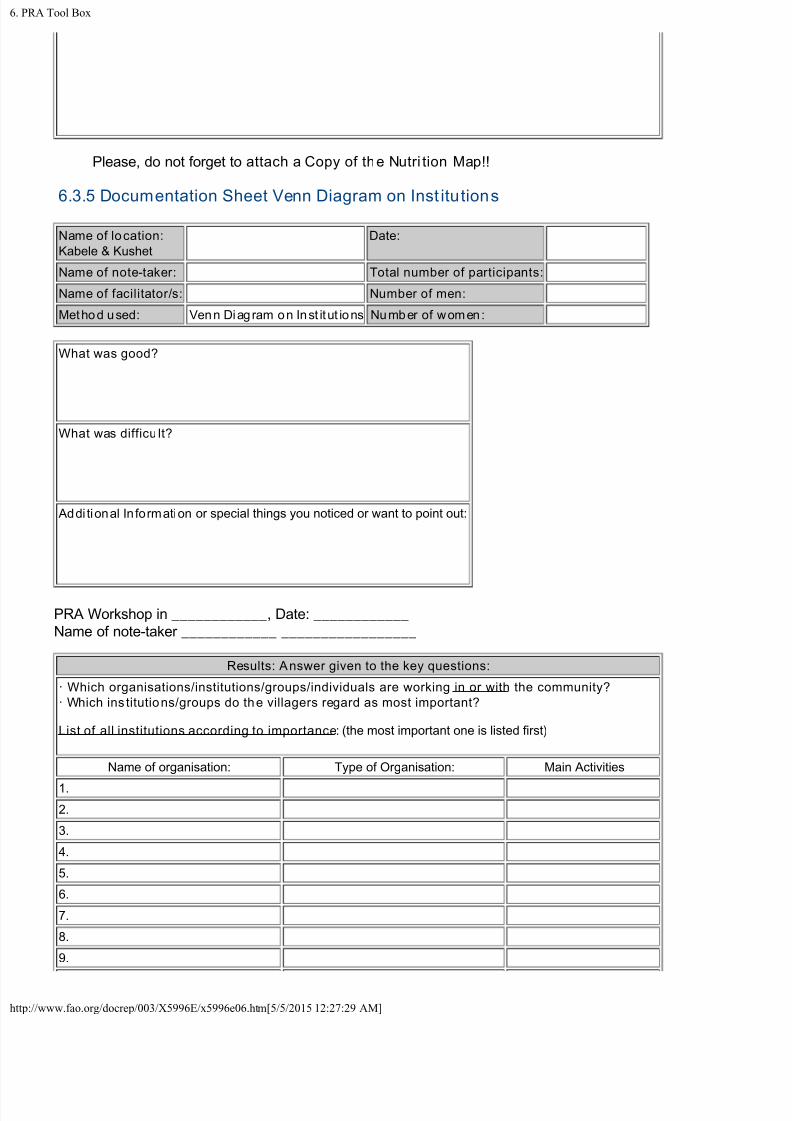
6.3.5 Documentation Sheet Venn Diagram on Inst itutions
Name of location:
Kabele & Kushet
Date:
Name of note-taker: Total number of participants:
Name of facilitator/s: Number of men:
Method used: Venn Diagram on Inst itut ions Number of women:
What was good?
What was difficu lt?
Addi tional In formation or special things you noticed or want to point out:
PRA Workshop in ____________, Date: ____________
Name of note-taker ____________ _________________
Results: Answer given to the key questions:
· Which organisations/institutions/groups/individuals are working in or with the community?
· Which ins titutions/groups do the villagers regard as most important?
List of all institutions according to importance: (the most important one is listed first)
Name of organisation: Type of Organisation: Main Activities
1.
2.
3.
4.
5.
6.
7.
8.
9.
7/21/2019 6. PRA Tool Box
http://slidepdf.com/reader/full/6-pra-tool-box 33/50
RA Tool Box
//www.fao.org/docrep/003/X5996E/x5996e06.htm[5/5/2015 12:27:29 AM]
10.
11.
12.
13.
14.
15.
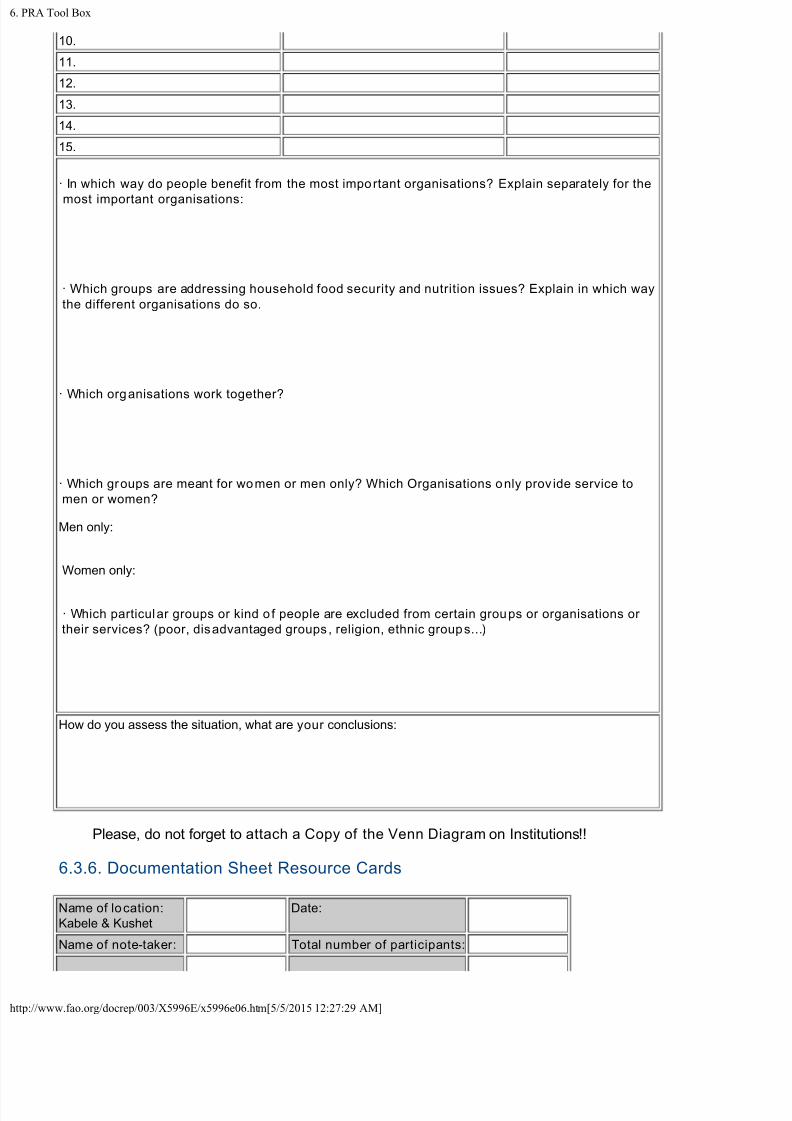
· In which way do people benefit from the most important organisations? Explain separately for the
most important organisations:
· Which groups are addressing household food security and nutrition issues? Explain in which way
the different organisations do so.
· Which organisations work together?
· Which groups are meant for women or men only? Which Organisations only prov ide service to
men or women?
Men only:
Women only:
· Which particular groups or kind o f people are excluded from certain groups or organisations or
their services? (poor, disadvantaged groups , religion, ethnic groups...)
How do you assess the situation, what are your conclusions:
Please, do not forget to attach a Copy of the Venn Diagram on Institutions!!
6.3.6. Documentation Sheet Resource Cards
Name of location:
Kabele & Kushet
Date:
Name of note-taker: Total number of participants:
7/21/2019 6. PRA Tool Box
http://slidepdf.com/reader/full/6-pra-tool-box 34/50
RA Tool Box
//www.fao.org/docrep/003/X5996E/x5996e06.htm[5/5/2015 12:27:29 AM]
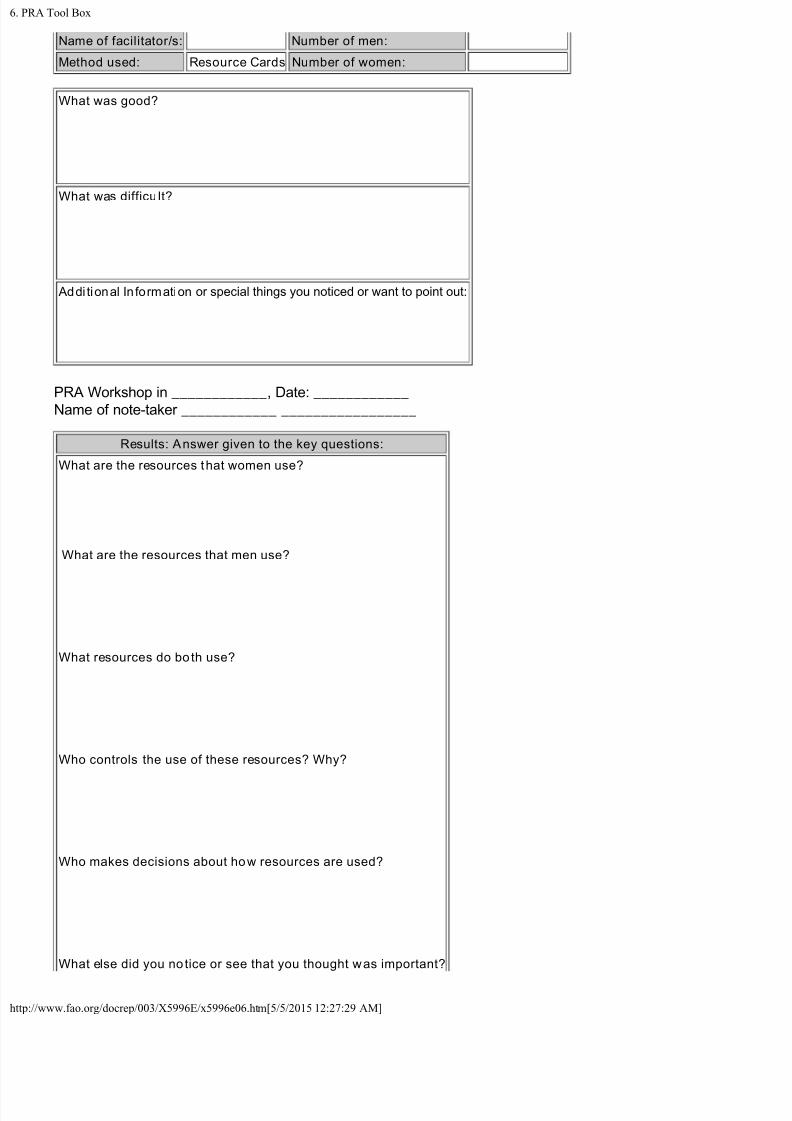
Name of facilitator/s: Number of men:
Method used: Resource Cards Number of women:
What was good?
What was difficu lt?
Addi tional In formation or special things you noticed or want to point out:
PRA Workshop in ____________, Date: ____________Name of note-taker ____________ _________________
Results: Answer given to the key questions:
What are the resources that women use?
What are the resources that men use?
What resources do bo th use?
Who controls the use of these resources? Why?
Who makes decisions about how resources are used?
What else did you no tice or see that you thought was important?
7/21/2019 6. PRA Tool Box
http://slidepdf.com/reader/full/6-pra-tool-box 35/50
RA Tool Box
//www.fao.org/docrep/003/X5996E/x5996e06.htm[5/5/2015 12:27:29 AM]
How do you assess the situation, what are your conclusions:
Please, do not forget to attach a Copy of the Resource Card pictures for both
use and control!!
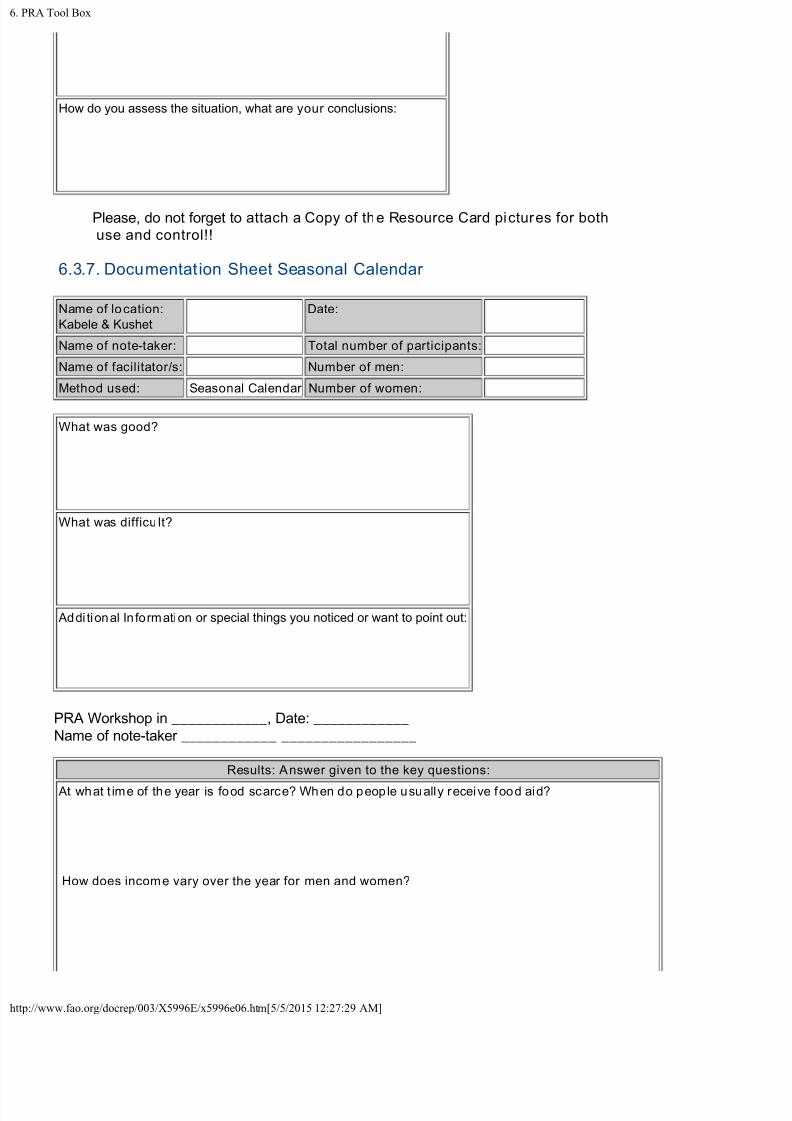
6.3.7. Documentation Sheet Seasonal Calendar
Name of location:
Kabele & Kushet
Date:
Name of note-taker: Total number of participants:
Name of facilitator/s: Number of men:
Method used: Seasonal Calendar Number of women:
What was good?
What was difficu lt?
Addi tional In formation or special things you noticed or want to point out:
PRA Workshop in ____________, Date: ____________
Name of note-taker ____________ _________________
Results: Answer given to the key questions:
At what t ime of the year is food scarce? When do people usually receive food aid?
How does income vary over the year for men and women?
7/21/2019 6. PRA Tool Box
http://slidepdf.com/reader/full/6-pra-tool-box 36/50
RA Tool Box
//www.fao.org/docrep/003/X5996E/x5996e06.htm[5/5/2015 12:27:29 AM]
How does expenditure vary over the year for men and women?
How does rainfall vary over the year?
How does water availability for human consumption vary over the year?
How does livestock forage availability vary over the year?
How does credit availability vary over the year?
When are holidays and how many days in wh ich month? What do people usually do during those
holidays? Are there certain activities which people are not allowed to do dur ing those days? Which
ones and why?
When is most agricultural work carried out by women? What kind of agricul tural work?
When is most agricultural work carried out by men? What kind of agricultural work?
When is most non-agricultural work carried out by women? Which kind of work?
When is most non-agricultural work carried out by men? Which kind of work?
7/21/2019 6. PRA Tool Box
http://slidepdf.com/reader/full/6-pra-tool-box 37/50
RA Tool Box
//www.fao.org/docrep/003/X5996E/x5996e06.htm[5/5/2015 12:27:29 AM]
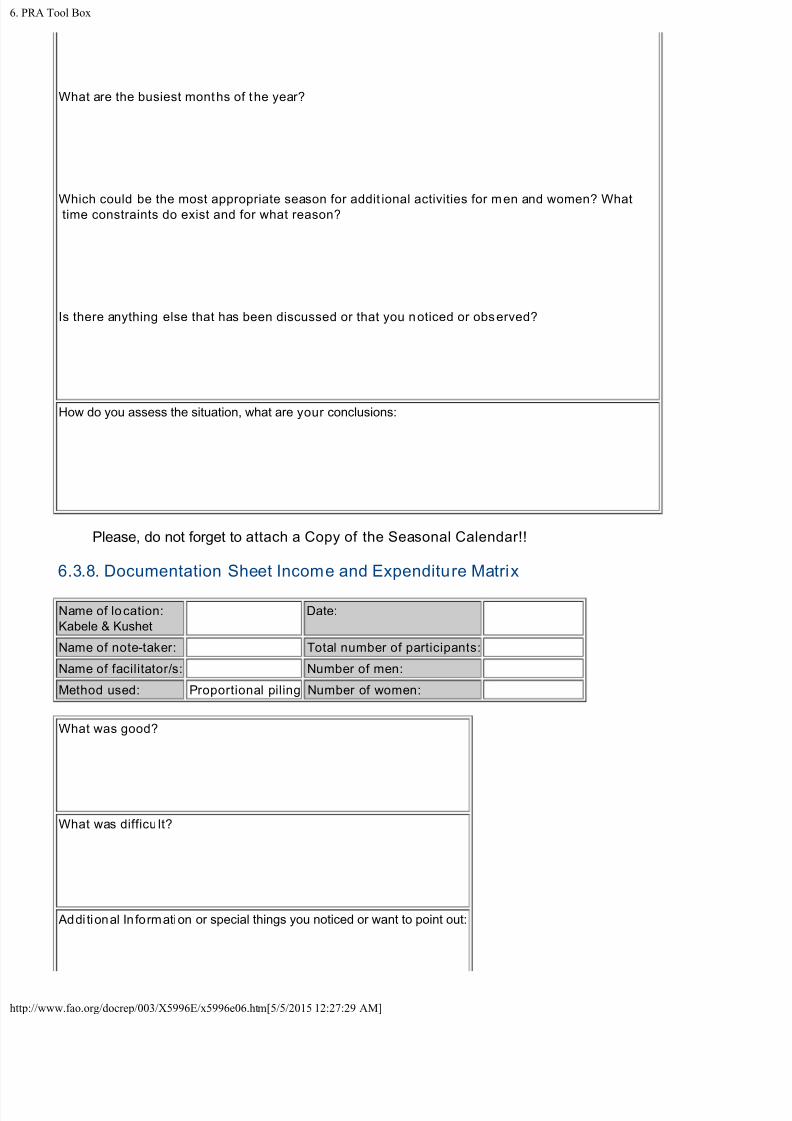
What are the busiest months of the year?
Which could be the most appropriate season for addit ional activities for men and women? What time constraints do exist and for what reason?
Is there anything else that has been discussed or that you noticed or observed?
How do you assess the situation, what are your conclusions:
Please, do not forget to attach a Copy of the Seasonal Calendar!!
6.3.8. Documentation Sheet Income and Expenditure Matrix
Name of location:
Kabele & Kushet
Date:
Name of note-taker: Total number of participants:
Name of facilitator/s: Number of men:
Method used: Proportional piling Number of women:
What was good?
What was difficu lt?
Addi tional In formation or special things you noticed or want to point out:
7/21/2019 6. PRA Tool Box
http://slidepdf.com/reader/full/6-pra-tool-box 38/50
RA Tool Box
//www.fao.org/docrep/003/X5996E/x5996e06.htm[5/5/2015 12:27:29 AM]
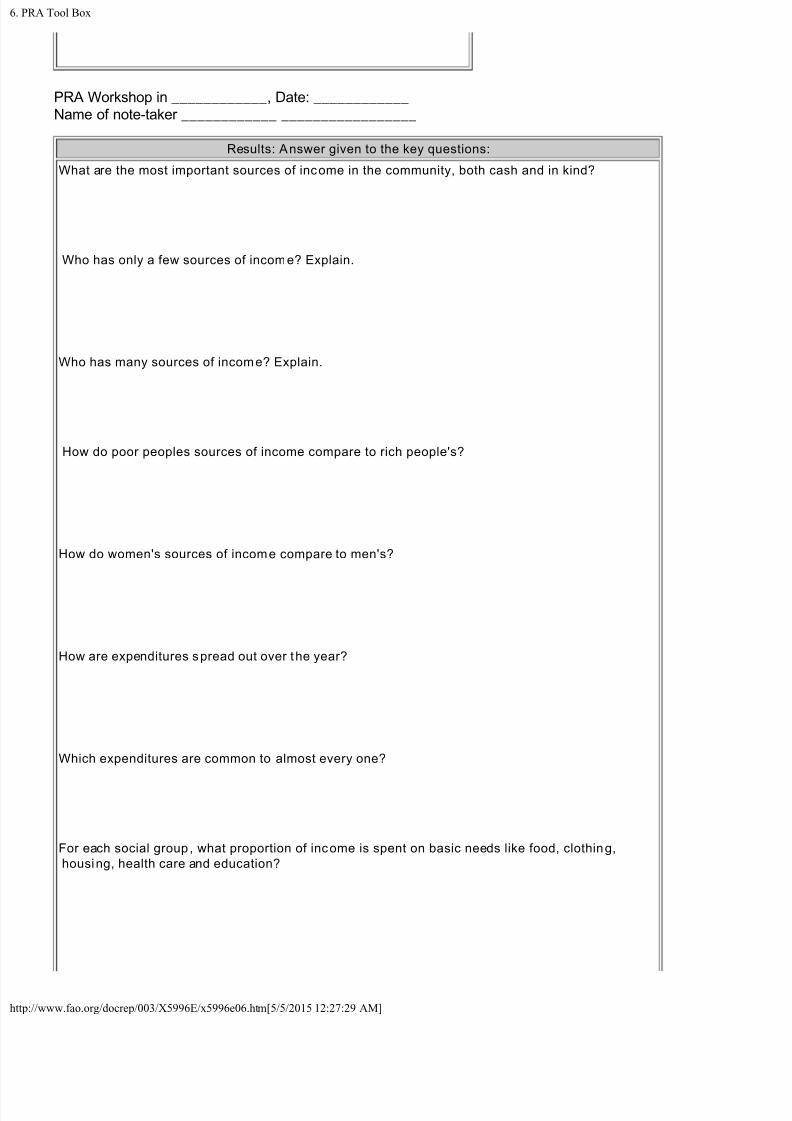
PRA Workshop in ____________, Date: ____________
Name of note-taker ____________ _________________
Results: Answer given to the key questions:
What are the most important sources of income in the community, both cash and in kind?
Who has only a few sources of income? Explain.
Who has many sources of income? Explain.
How do poor peoples sources of income compare to rich people's?
How do women's sources of income compare to men's?
How are expenditures spread out over the year?
Which expenditures are common to almost every one?
For each social group, what proportion of income is spent on basic needs like food, clothing,
housing, health care and education?
7/21/2019 6. PRA Tool Box
http://slidepdf.com/reader/full/6-pra-tool-box 39/50
RA Tool Box
//www.fao.org/docrep/003/X5996E/x5996e06.htm[5/5/2015 12:27:29 AM]
Who can save?
Who can buy equipment, tools, agricultural inputs, or other things that help improve their work?
How do women's expenditures compare to men's?
What else did you no tice or see that you thought was important?
How do you assess the situation, what are your conclusions:
Please, do not forget to attach a Copy of the Income and Expenditure
Matrixes!!
6.3.9. Documentation Sheet Daily Act ivi ty Clocks
Name of location:
Kabele & Kushet
Date:
Name of note-taker: Total number of participants:
Name of facilitator/s: Number of men:
Method used: Daily Activity Clocks Number of women:
What was good?
What was difficu lt?
Addi tional In formation or special things you noticed or want to point out:
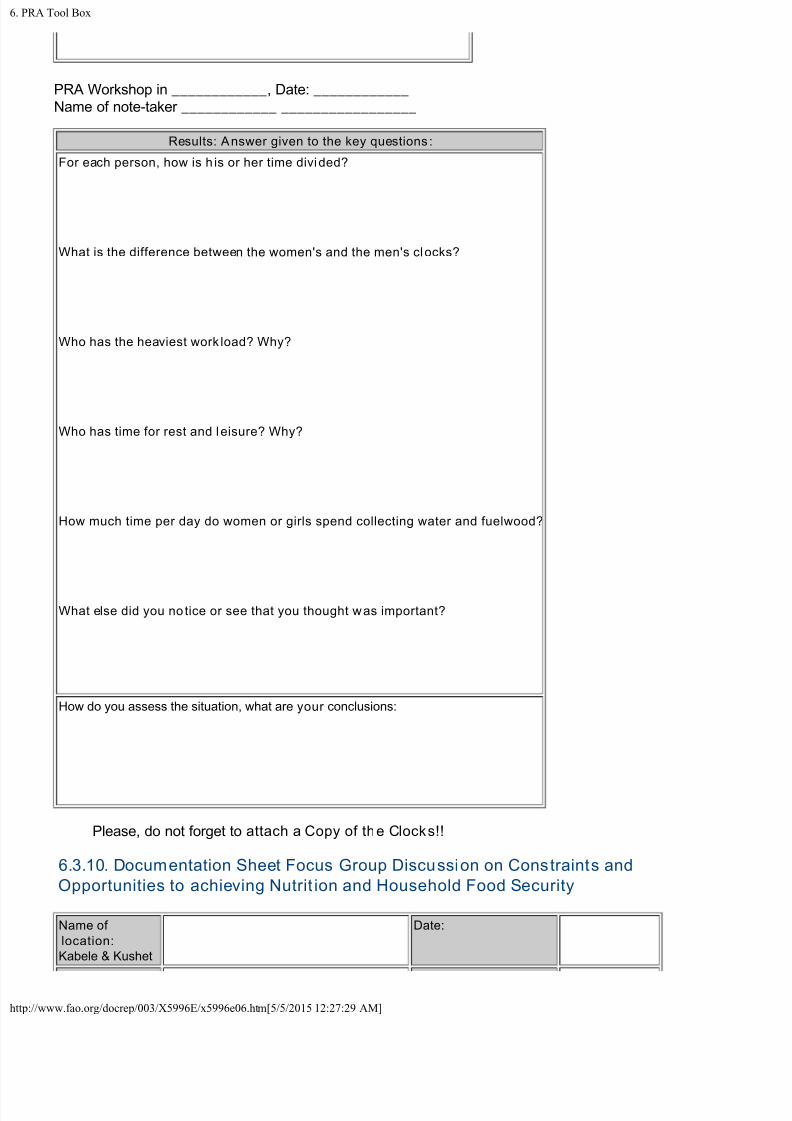
7/21/2019 6. PRA Tool Box
http://slidepdf.com/reader/full/6-pra-tool-box 40/50
RA Tool Box
//www.fao.org/docrep/003/X5996E/x5996e06.htm[5/5/2015 12:27:29 AM]
PRA Workshop in ____________, Date: ____________
Name of note-taker ____________ _________________
Results: Answer given to the key questions :
For each person, how is h is or her time divided?
What is the difference between the women's and the men's clocks?
Who has the heaviest work load? Why?
Who has time for rest and leisure? Why?
How much time per day do women or girls spend collecting water and fuelwood?
What else did you no tice or see that you thought was important?
How do you assess the situation, what are your conclusions:
Please, do not forget to attach a Copy of the Clocks!!
6.3.10. Documentation Sheet Focus Group Discussion on Constraints and
Opportunities to achieving Nutrit ion and Household Food Security
Name of
location:
Kabele & Kushet
Date:
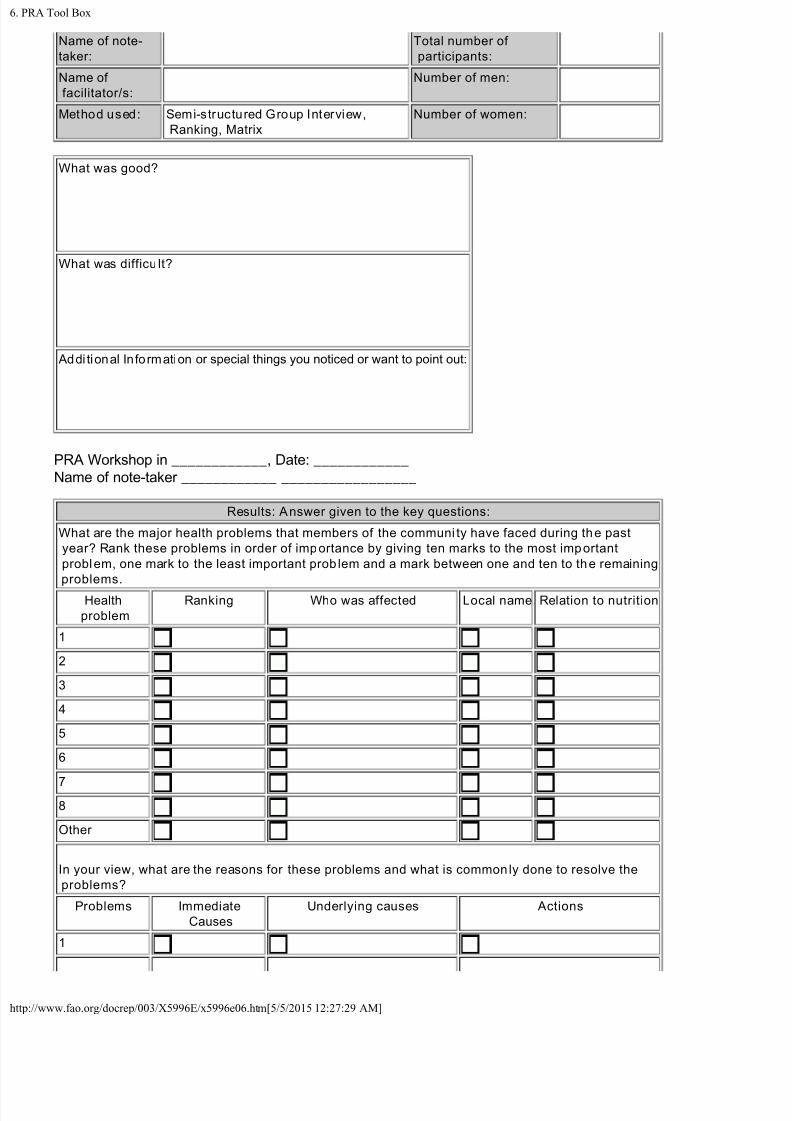
7/21/2019 6. PRA Tool Box
http://slidepdf.com/reader/full/6-pra-tool-box 41/50
RA Tool Box
//www.fao.org/docrep/003/X5996E/x5996e06.htm[5/5/2015 12:27:29 AM]
Name of note-
taker:
Total number of
participants:
Name of
facilitator/s:
Number of men:
Method used: Semi-structured Group Interview,
Ranking, Matrix
Number of women:
What was good?
What was difficu lt?
Addi tional Information or special things you noticed or want to point out:
PRA Workshop in ____________, Date: ____________
Name of note-taker ____________ _________________
Results: Answer given to the key questions:
What are the major health problems that members of the communi ty have faced during the past
year? Rank these problems in order of importance by giving ten marks to the most important
problem, one mark to the least important prob lem and a mark between one and ten to the remaining
problems.
Health
problem
Ranking Who was affected Local name Relation to nutrition
1
2
3
4
5
6
7
8
Other
In your view, what are the reasons for these problems and what is commonly done to resolve the
problems?
Problems Immediate
Causes
Underlying causes Actions
1
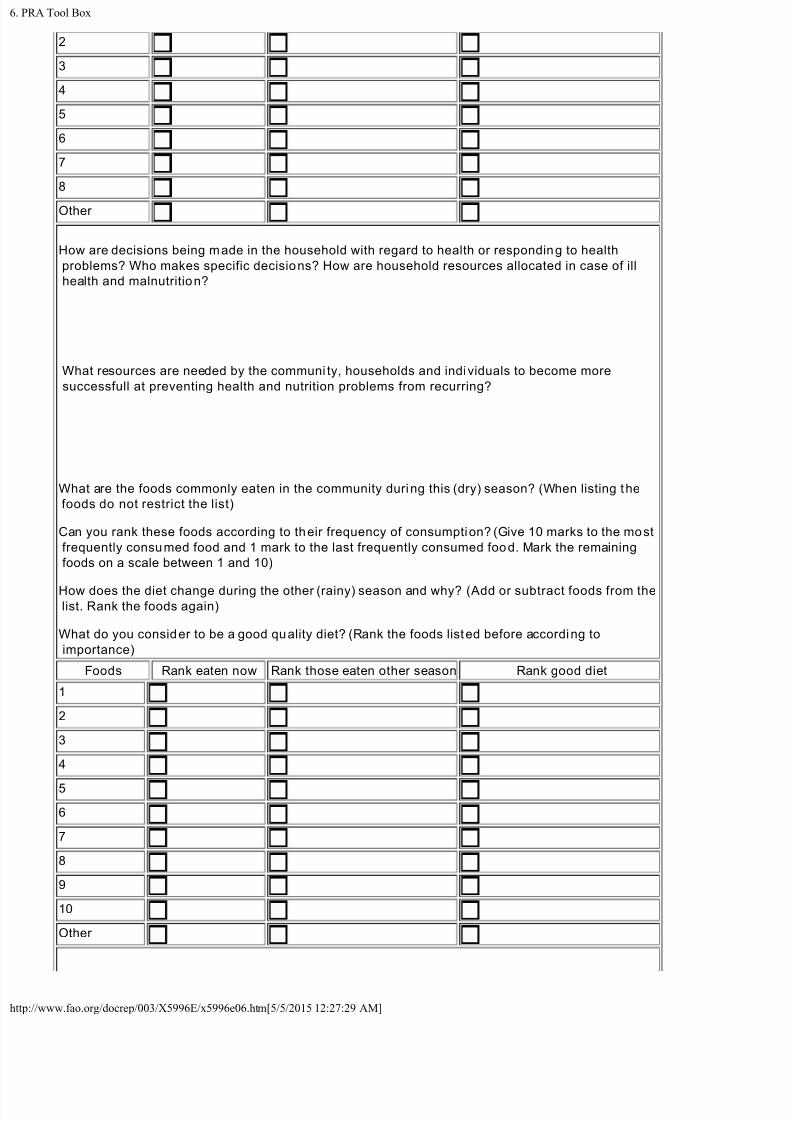
7/21/2019 6. PRA Tool Box
http://slidepdf.com/reader/full/6-pra-tool-box 42/50
RA Tool Box
//www.fao.org/docrep/003/X5996E/x5996e06.htm[5/5/2015 12:27:29 AM]
2
3
4
5
6
7
8
Other
How are decisions being made in the household with regard to health or responding to health
problems? Who makes specific decisions? How are household resources allocated in case of ill
health and malnutrition?
What resources are needed by the communi ty, households and individuals to become more
successfull at preventing health and nutrition problems from recurring?
What are the foods commonly eaten in the community during this (dry) season? (When listing the
foods do not restrict the list)
Can you rank these foods according to their frequency of consumption? (Give 10 marks to the most
frequently consumed food and 1 mark to the last frequently consumed food. Mark the remaining
foods on a scale between 1 and 10)
How does the diet change during the other (rainy) season and why? (Add or subtract foods from the list. Rank the foods again)
What do you consider to be a good quality diet? (Rank the foods listed before according to
importance)
Foods Rank eaten now Rank those eaten other season Rank good diet
1
2
3
4
5
6
7
8
9
10
Other
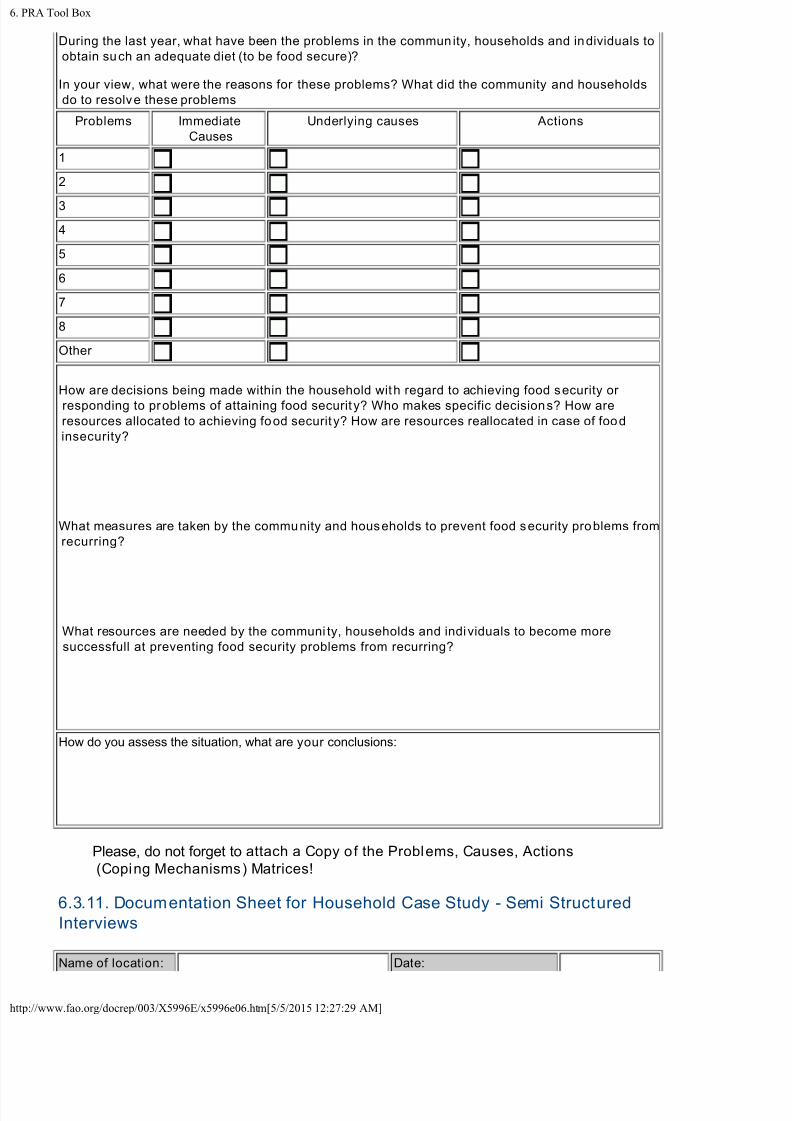
7/21/2019 6. PRA Tool Box
http://slidepdf.com/reader/full/6-pra-tool-box 43/50
RA Tool Box
//www.fao.org/docrep/003/X5996E/x5996e06.htm[5/5/2015 12:27:29 AM]
During the last year, what have been the problems in the community, households and individuals to
obtain such an adequate diet (to be food secure)?
In your view, what were the reasons for these problems? What did the community and households
do to resolve these problems
Problems Immediate
Causes
Underlying causes Actions
1
2
3
4
5
6
7
8
Other
How are decisions being made within the household with regard to achieving food security or responding to problems of attaining food securit y? Who makes specific decisions? How are
resources allocated to achieving food securit y? How are resources reallocated in case of food
insecurity?
What measures are taken by the community and households to prevent food security problems from
recurring?
What resources are needed by the communi ty, households and individuals to become more
successfull at preventing food security problems from recurring?
How do you assess the situation, what are your conclusions:
Please, do not forget to attach a Copy of the Problems, Causes, Actions
(Coping Mechanisms) Matrices!
6.3.11. Documentation Sheet for Household Case Study - Semi Structured
Interviews
Name of location: Date:
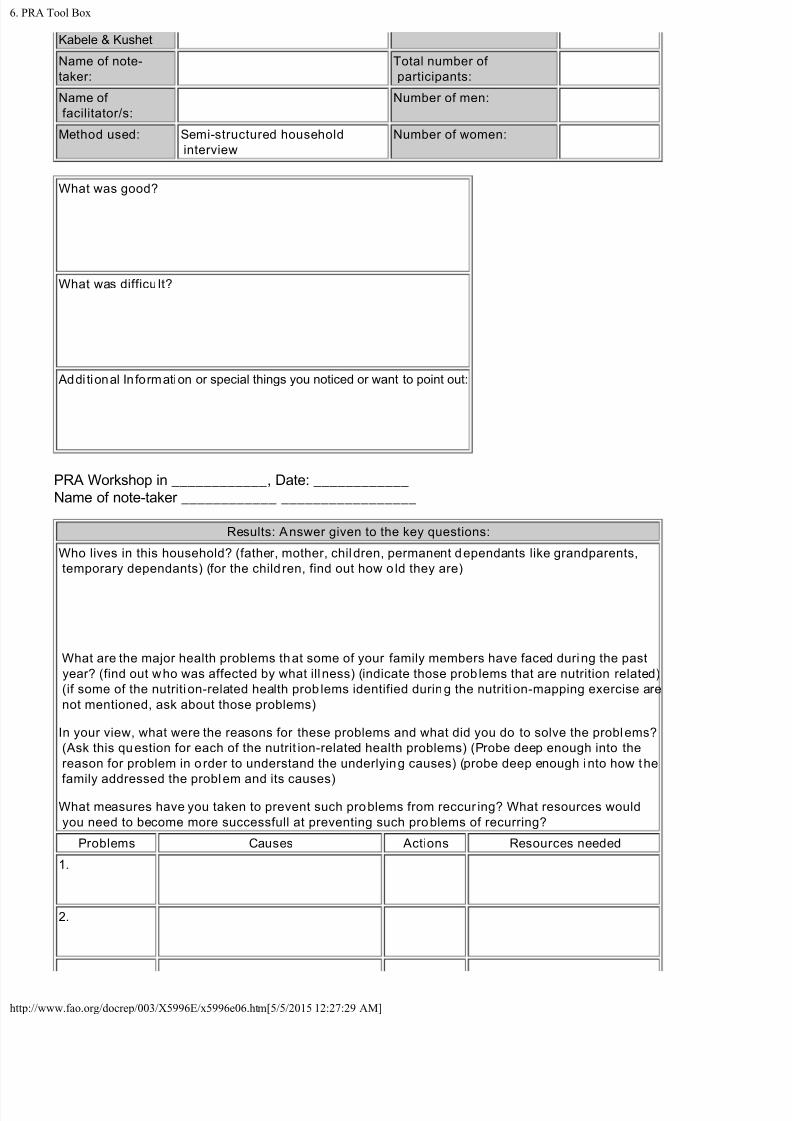
7/21/2019 6. PRA Tool Box
http://slidepdf.com/reader/full/6-pra-tool-box 44/50
RA Tool Box
//www.fao.org/docrep/003/X5996E/x5996e06.htm[5/5/2015 12:27:29 AM]
Kabele & Kushet
Name of note-
taker:
Total number of
participants:
Name of
facilitator/s:
Number of men:
Method used: Semi-structured household
interview
Number of women:
What was good?
What was difficu lt?
Addi tional In formation or special things you noticed or want to point out:
PRA Workshop in ____________, Date: ____________
Name of note-taker ____________ _________________
Results: Answer given to the key questions:
Who lives in this household? (father, mother, children, permanent dependants like grandparents,
temporary dependants) (for the child ren, find out how o ld they are)
What are the major health problems that some of your family members have faced during the past
year? (find out who was affected by what ill ness) (indicate those prob lems that are nutrition related)
(if some of the nutriti on-related health prob lems identified during the nutriti on-mapping exercise are
not mentioned, ask about those problems)
In your view, what were the reasons for these problems and what did you do to solve the problems?
(Ask this question for each of the nutrit ion-related health problems) (Probe deep enough into the
reason for problem in o rder to understand the underlying causes) (probe deep enough into how the
family addressed the problem and its causes)
What measures have you taken to prevent such problems from reccur ing? What resources would
you need to become more successfull at preventing such problems of recurring?
Problems Causes Actions Resources needed
1.
2.
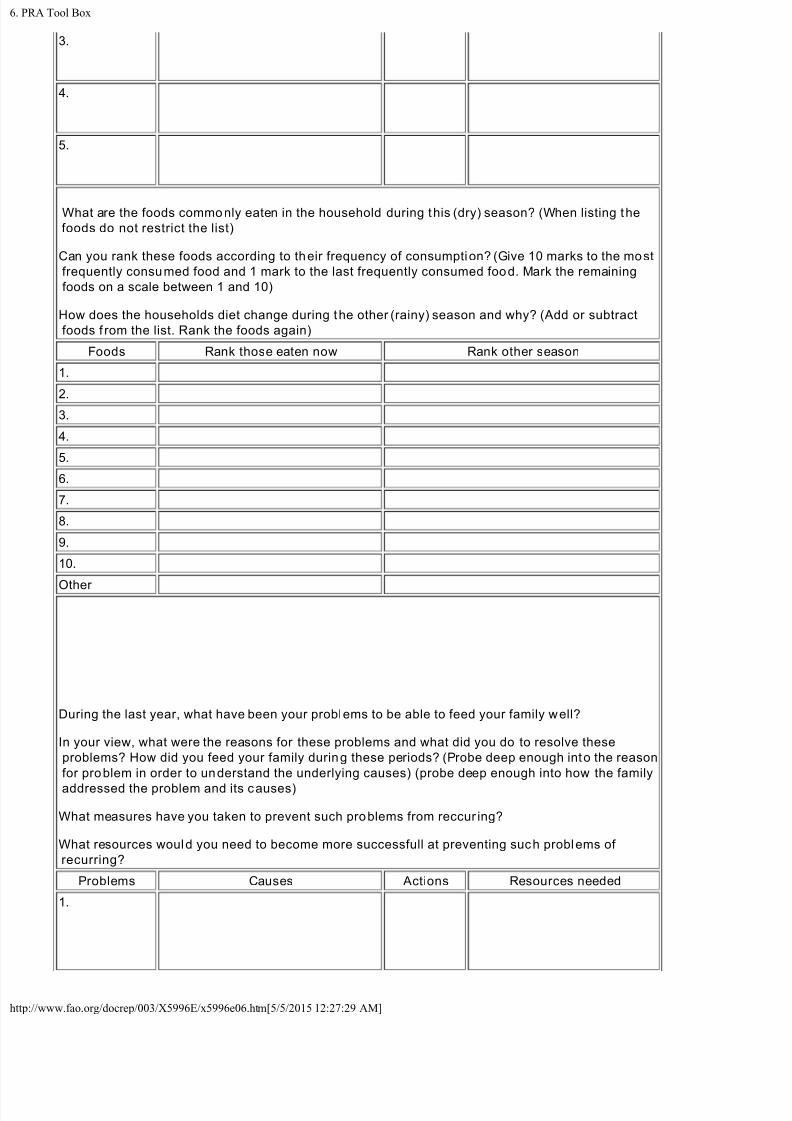
7/21/2019 6. PRA Tool Box
http://slidepdf.com/reader/full/6-pra-tool-box 45/50
RA Tool Box
//www.fao.org/docrep/003/X5996E/x5996e06.htm[5/5/2015 12:27:29 AM]
3.
4.
5.
What are the foods commonly eaten in the household during this (dry) season? (When listing the
foods do not restrict the list)
Can you rank these foods according to their frequency of consumption? (Give 10 marks to the most
frequently consumed food and 1 mark to the last frequently consumed food. Mark the remaining
foods on a scale between 1 and 10)
How does the households diet change during the other (rainy) season and why? (Add or subtract
foods f rom the list. Rank the foods again)
Foods Rank those eaten now Rank other season
1.
2.
3.
4.
5.
6.
7.
8.
9.
10.
Other
During the last year, what have been your problems to be able to feed your family well?
In your view, what were the reasons for these problems and what did you do to resolve these
problems? How did you feed your family during these periods? (Probe deep enough into the reason
for problem in order to understand the underlying causes) (probe deep enough into how the family
addressed the problem and its causes)
What measures have you taken to prevent such problems from reccur ing?
What resources would you need to become more successfull at preventing such problems of
recurring?
Problems Causes Actions Resources needed
1.
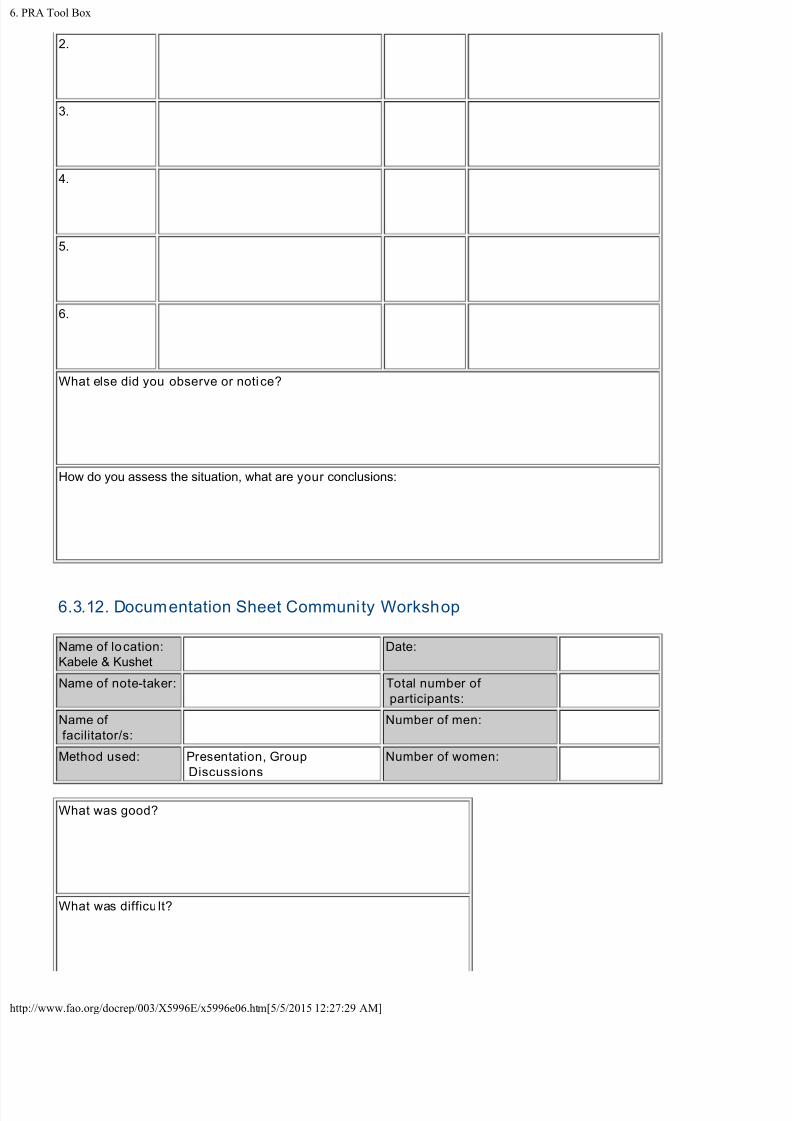
7/21/2019 6. PRA Tool Box
http://slidepdf.com/reader/full/6-pra-tool-box 46/50
RA Tool Box
//www.fao.org/docrep/003/X5996E/x5996e06.htm[5/5/2015 12:27:29 AM]
2.
3.
4.
5.
6.
What else did you observe or noti ce?
How do you assess the situation, what are your conclusions:
6.3.12. Documentation Sheet Community Workshop
Name of location:
Kabele & Kushet
Date:
Name of note-taker: Total number of
participants:
Name of
facilitator/s:
Number of men:
Method used: Presentation, Group
Discussions
Number of women:
What was good?
What was difficu lt?
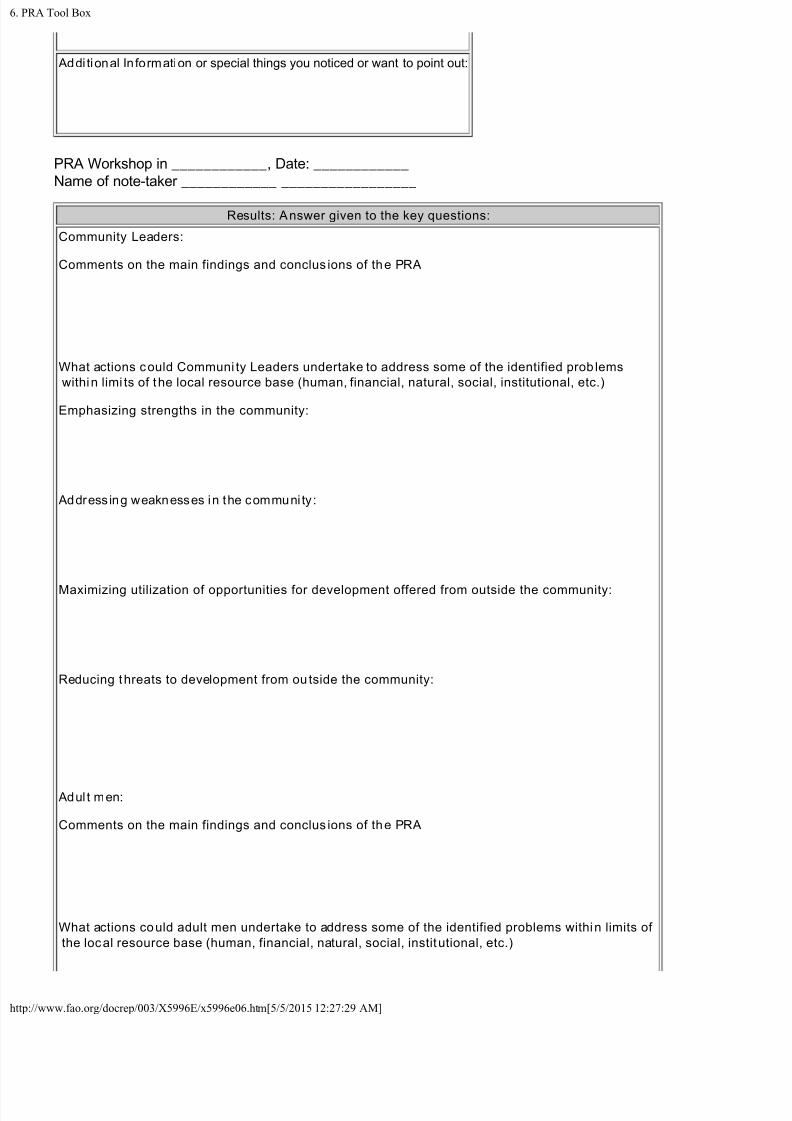
7/21/2019 6. PRA Tool Box
http://slidepdf.com/reader/full/6-pra-tool-box 47/50
RA Tool Box
//www.fao.org/docrep/003/X5996E/x5996e06.htm[5/5/2015 12:27:29 AM]
Addi tional In formation or special things you noticed or want to point out:
PRA Workshop in ____________, Date: ____________
Name of note-taker ____________ _________________
Results: Answer given to the key questions:
Community Leaders:
Comments on the main findings and conclus ions of the PRA
What actions could Communi ty Leaders undertake to address some of the identified prob lems
within limi ts of the local resource base (human, financial, natural, social, institutional, etc.)
Emphasizing strengths in the community:
Addressing weaknesses in the communi ty :
Maximizing utilization of opportunities for development offered from outside the community:
Reducing threats to development from outside the community:
Adul t men:
Comments on the main findings and conclus ions of the PRA
What actions could adult men undertake to address some of the identified problems within limits of
the local resource base (human, financial, natural, social, institutional, etc.)
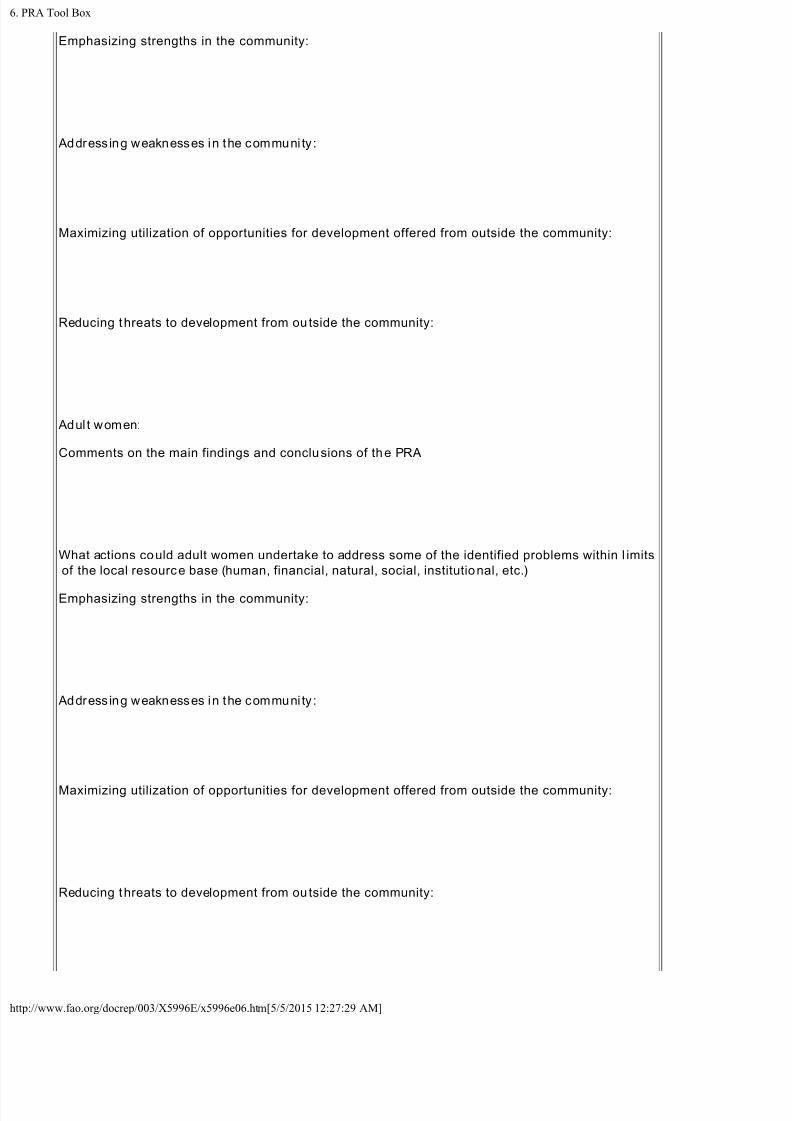
7/21/2019 6. PRA Tool Box
http://slidepdf.com/reader/full/6-pra-tool-box 48/50
RA Tool Box
//www.fao.org/docrep/003/X5996E/x5996e06.htm[5/5/2015 12:27:29 AM]
Emphasizing strengths in the community:
Addressing weaknesses in the communi ty :
Maximizing utilization of opportunities for development offered from outside the community:
Reducing threats to development from outside the community:
Adul t women:
Comments on the main findings and conclusions of the PRA
What actions could adult women undertake to address some of the identified problems within l imits
of the local resource base (human, financial, natural, social, institutional, etc.)
Emphasizing strengths in the community:
Addressing weaknesses in the communi ty :
Maximizing utilization of opportunities for development offered from outside the community:
Reducing threats to development from outside the community:
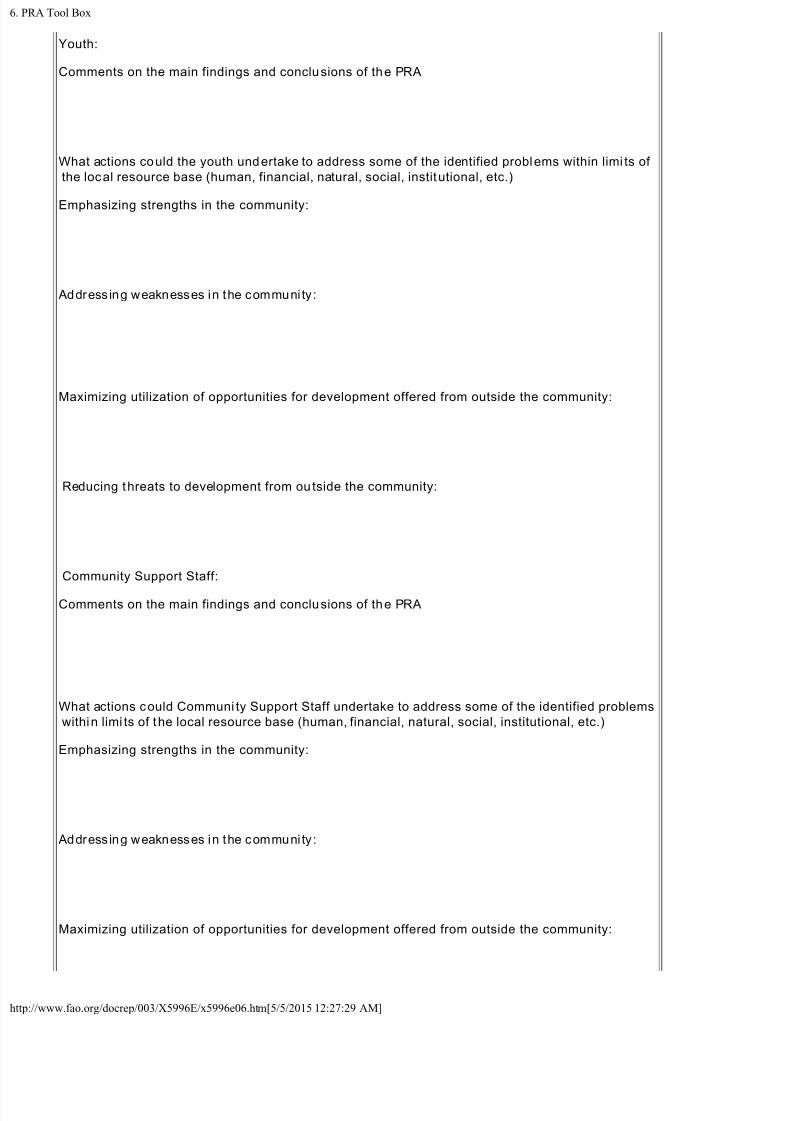
7/21/2019 6. PRA Tool Box
http://slidepdf.com/reader/full/6-pra-tool-box 49/50
RA Tool Box
//www.fao.org/docrep/003/X5996E/x5996e06.htm[5/5/2015 12:27:29 AM]
Youth:
Comments on the main findings and conclusions of the PRA
What actions could the youth undertake to address some of the identified problems within limi ts of
the local resource base (human, financial, natural, social, institutional, etc.)
Emphasizing strengths in the community:
Addressing weaknesses in the communi ty :
Maximizing utilization of opportunities for development offered from outside the community:
Reducing threats to development from outside the community:
Community Support Staff:
Comments on the main findings and conclusions of the PRA
What actions could Communi ty Support Staff undertake to address some of the identified problems
within limi ts of the local resource base (human, financial, natural, social, institutional, etc.)
Emphasizing strengths in the community:
Addressing weaknesses in the communi ty :
Maximizing utilization of opportunities for development offered from outside the community:
7/21/2019 6. PRA Tool Box
http://slidepdf.com/reader/full/6-pra-tool-box 50/50
RA Tool Box
Reducing threats to development from outside the community:
What else did you observe or noti ce?
How do you assess the situation, what are your conclusions: