Embed Size (px)
Citation preview
Simão Artur Sousa Coutinho Santiago Pinho
A STUDY OF GENETIC VARIANTS ASSOCIATED WITH
OBESITY AMONG PORTUGUESE CHILDREN
Dissertação de Mestrado em Evolução e Biologia Humanas, orientada por
Doutora Cristina Padez e Doutor Licínio Manco e apresentada ao Departamento de Ciências da Vida da Faculdade de Ciências e Tecnologia da Universidade de Coimbra
Setembro de 2018

ii
iii
A study of genetic variants associated with
obesity among Portuguese children
Simão Artur Sousa Coutinho Santiago Pinho
Dissertação de Mestrado em Evolução e Biologia Humanas, orientada por
Doutora Cristina Padez e Doutor Licínio Manco e apresentada ao Departamento de
Ciências da Vida da Faculdade de Ciências e Tecnologia da Universidade de Coimbra
Setembro de 2018

iv
v
Acknowledgments/Agradecimentos
A realização desta tese contou com o apoio de inúmeras pessoas, às quais jamais
encontrarei as palavras suficientes para agradecer. Quero deste modo, expressar a minha
profunda gratidão a todos aqueles que, pelo apoio e amizade, direta ou indiretamente,
contribuíram para a realização deste trabalho.
Ao meu coorientador, o Doutor Licínio Manuel Mendes Manco, por me ter
acolhido no seu laboratório, por toda a sua orientação e ajuda na realização deste trabalho.
As palavras serão sempre poucas para expressar a minha gratidão, por todo o tempo que
gastou, e sabedoria que partilhou para a realização deste trabalho.
Ao Centro de Investigação em Antropologia e Saúde (CIAS) e em particular à
minha orientadora a Professora Doutora Cristina Padez, por todo o apoio e ajuda que
prestou.
Agradeço também aos meus amigos que sempre me apoiaram e estiveram comigo
desde a minha licenciatura até ao final do meu mestrado, meras palavras nunca serão o
suficiente para expressar a minha gratidão pelos anos que passamos juntos. Mas do fundo
do meu coração obrigado.
À Beatriz por todo o apoio, coragem, força e momentos felizes que tivemos
agradeço por todo o amor que me deste.
Aos meus pais nomeadamente a minha mãe, que me guiou e cuidou de mim,
dando-me sempre o seu apoio e que fez sempre o possível para me deixar feliz e certificar
de que tinha tudo o que precisava. Do fundo do meu coração agradeço todos os sacrifícios
e horas que gastou em cuidar de mim.
Finalmente, e por não poder alongar-me mais, agradeço a todos os que de algum
modo tornaram possível a realização desta dissertação

vi
vii
Abstract
Obesity has become a serious public health problem, and its impact is more salient
in more industrialized countries. It is widely accepted that obesity is a complex
multifactorial condition, with an important genetic component. In 2007, it was identified
the first single nucleotide polymorphism (SNP) in the FTO gene (rs9939609) associated
with obesity in humans through a genome-wide association study (GWAS). Since then,
many other obesity-associated loci have been found.
The main aim of this work was to investigate the association of the FTO SNP
rs9939609 and the two SLC6A4 polymorphisms (5-HTTLPR and STin2) with obesity and
other anthropometric variables, such as weight, height, BMI, BMI z-score, waist
circumference, hip circumference, waist-to-height ratio, and skinfold measurements in a
sample of Portuguese children. Moreover, we also tested for interaction effects between
the study polymorphisms and physical activity in relation to obesity.
Anthropometric parameters and physical activity were measured in a random
sample of 645 children (321 girls and 324 boys) between 3-11 years-old, of several public
schools from the central region of the country. Physical activity was measured objectively
during 7 days with Actigraph accelerometers. The International Obesity Task Force
(IOTF) cut-offs were used to define obesity. Genotyping of the two SLC6A4 (5-HTT)
gene polymorphisms, 5-HTTLPR and STin2, was performed by Polymerase Chain
Reaction (PCR) followed by agarose gel electrophoresis. The FTO SNP rs9939609
genotyping was performed by real time PCR using TaqMan probes. For statistical
association analyses the population sample was stratified in two groups aged 3-6 years-
old and 7-11 years-old. Subjects defined as overweight or obese were merged in one case
group.
In children aged 7-11 years-old, the FTO rs9939609 showed a statistically
significant association with BMI Z-score (P = 0.04), and marginal associations were
found with BMI (P = 0.07) and WHtR (P = 0.07). Also, a marginal association was found
between rs9939609 and risk of overweight/obesity (P = 0.087). A strong significant
association was observed with risk of abdominal obesity (P = 4.5x10⁻⁴) in the same age
group. When stratified by physical activity, several statistically significant associations
were observed with obesity-related anthropometric parameters in non-active individuals
aged 7-11 years, including for BMI (P = 0.02), BMI Z-score (P = 0.027), waist
viii
circumference (P = 0.035), WHtR (P = 0.045), subscapular skinfold (P = 0.015) and sum
of skinfolds (P = 0.046), but not in active individuals. In concordance, a statistically
significant association between the FTO polymorphism and risk of obesity and abdominal
obesity was observed in non-active individuals (P = 0.037 and P = 0.003 respectively),
but not in active individuals. No associations with obesity or related anthropometric
parameters were found in children aged 3-6 years-old.
For the two SLC6A4 polymorphisms (5-HTTLPR and STin2), no significant
associations were found in both age groups (except in children aged 7-11 years-old
between 5-HTTLPR and subscapular or suprailiac skinfold measures; P = 0.02 and P =
0.04, respectively), even when the population was divided in active and non-active
individuals.
In conclusion, the FTO SNP rs9939609 showed association with several
anthropometric measures and the risk of obesity or abdominal obesity in Portuguese
children, in line with previous studies performed in European populations. Moreover, we
observed an interaction effect between the FTO gene and physical activity in obesity. Our
results also suggest that the association between the FTO SNP rs9939609 and obesity
becomes evident only after the age of seven.
This work contributed to a better knowledge of the genetics of obesity in
Portuguese children, but further studies are needed to improve the understanding of the
genetic factors underlying the obesity risk in children.
Key-words: Abdominal obesity; FTO; STin2; 5-HTTLPR genes; Physical activity
ix
Resumo
A obesidade tornou-se um grave problema de saúde pública, e o seu impacto é
mais saliente em países industrializados. É amplamente aceite que a obesidade é uma
condição complexa e multifatorial, com um importante componente genético. Em 2007,
foi identificado o primeiro polimorfismo de nucleótido simples (SNP) no gene FTO
(rs9939609) através de um estudo de associação genómica (GWAS). Desde então, muitos
outros loci têm sido encontrados associados à obesidade.
O principal objetivo deste trabalho foi investigar a associação com obesidade e
outras variáveis antropométricas como o peso, altura, IMC, IMC z-score, circunferência
da cintura, relação cintura / estatura e mediadas de dobras cutâneas do SNP FTO
rs9939609 e de dois polimorfismos no gene SLC6A4 (5-HTTLPR e STin2), numa amostra
de crianças portuguesas. Além disso, foram também testados efeitos da interação entre os
polimorfismos genéticos e atividade física para a obesidade.
Os parâmetros antropométricos e a atividade física foram medidos numa amostra
aleatória de 645 crianças (321 sexo feminino e 324 sexo masculino) entre os 3-11 anos
de idade, provenientes de várias escolas públicas da região centro do país. A atividade
física foi medida durante 7 dias com o acelerômetro Actigraph. Os pontos-de-corte do
International Obesity Task Force (IOTF) foram usados para definir obesidade. A
genotipagem dos dois polimorfismos do gene SLC6A4 (5-HTT), 5-HTTLPR e STin2, foi
realizada pela Reação em Cadeia da Polimerase (PCR) seguida de eletroforese em gel de
agarose. O SNP FTO rs9939609, foi genotipado por PCR em tempo real com sondas
TaqMan. Para os estudos de associação, a população foi dividida em dois grupos de
acordo com a idade: um grupo com idade entre os 3-6 anos e um segundo grupo com
idades entre os 7-11 anos. Os indivíduos com obesidade e excesso de peso foram incluídos
num único grupo.
O polimorfismo FTO rs9939609 mostrou uma associação estatisticamente
significativa com o IMC Z-Score (P = 0,04) e associações marginais foram encontradas
com o IMC (P = 0,07) e WHtR (P = 0,07) em crianças com idade entre 7-11 anos. Além
disso, foi encontrada uma associação marginal com o risco de excesso de peso/obesidade
(P = 0,087), e uma forte associação com o risco de obesidade abdominal (P = 4,5 x10⁻⁴)
em crianças com idade 7-11 anos. Quando a população foi estratificada por atividade
física, várias associações estatisticamente significativas foram observadas com
x
parâmetros antropométricos como o IMC (P = 0,02), IMC Z-score (P = 0,027),
circunferência da cintura (P = 0,035), WHtR (P = 0,045), pele subescapular (P = 0,015)
e soma de dobras cutâneas (P = 0,046), em indivíduos não ativos com idade entre 7-11
anos. Além disso, o polimorfismo FTO mostrou uma associação estatisticamente
significativa com o risco de obesidade (P = 0,037) e obesidade abdominal (P = 0,003) em
indivíduos inativos, mas não em indivíduos ativos. Em crianças com 3-6 anos de idade
não foi encontrada qualquer associação com obesidade ou parâmetros antropométricos.
Para os dois polimorfismos SLC6A4 (5-HTTLPR e STin2), nenhuma associação
significativa foi encontrada em ambos os grupos etários (exceto no grupo 7-11 anos entre
5-HTTLPR e pele subescapular ou pregas suprailíacas; P = 0,02 e P = 0,04,
respetivamente), mesmo quando a população foi dividida em indivíduos fisicamente
ativos e não ativos.
Em conclusão, o SNP FTO rs9939609 mostrou associação com o risco de
obesidade e obesidade abdominal em crianças portuguesas, em consonância com os
estudos realizados anteriormente noutras populações europeias. Além disso foi observado
um efeito de interação entre o gene FTO e a atividade física na obesidade. Os nossos
resultados também sugerem que a associação entre o gene FTO e a obesidade se torna
evidente apenas após os 7 anos de idade.
Este trabalho contribuiu para um melhor conhecimento da genética da obesidade
em crianças portuguesas, mas são necessários outros estudos para uma melhor
compreensão dos fatores genéticos subjacente ao risco de obesidade em crianças.
Palavras-chave: Obesidade Abdominal; Genes FTO; 5-HTTLPR; STin2; Atividade
Física
xi
Index
Acknowledgments / Agradecimentos
Abstract / Key-Words
Resumo / Palavras Chave
Table Index
1 Introduction…………………………………………………………………………...1
1.1 What is obesity?...............................................................................................3
1.2 Genetics of obesity: the FTO and SLC6A4 genes……………………………3
1.3 Gene environment interactions………………………………….…………...5
1.4 Objectives……………………………………………………………………6
2 General laboratory methods…………………………………………………………7
2.1 Selection of polymorphisms…………………………………………………9
2.2 Study subjects and Anthropometric measures……………………………….9
2.3 Physical activity measurement……………………………………………...10
2.4 Genotyping………………………………………………………………….11
2.5 Statistical analysis…………………………………………………...12
3 Results……………………………………………………………………………...15
3.1 Population characteristics…………………………………………………..17
3.2 Population genetics……………………………………………………..…..20
3.3 Associations with obesity-related quantitative traits……………………….21
3.4 Associations with overweight/obesity……………………………..……….25
3.5 Associations with abdominal obesity………………………………..……..25
4 Discussion…………………………………………………………………………..31
4.1 SLC6A4 polymorphisms……………………………………………………33
4.2 FTO rs9939609………………………………………………………….….35
4.3 Gene Vs. Physical Activity interaction…………………………………,….35
4.4 Association with abdominal obesity………………………………………..36
4.5 Age-related associations…………………………………………………....36
5 Conclusion……………………………………………………………..…………...41
6 References……………………………………………………………..…………...43

xii
xiii
Table Index
Table 3.1. General characteristic of the sampled children.
Table 3.2. Characteristics of the study population sample stratified according two age
groups (3-6 and 7-11 years old) and comparison between the sexes.
Table 3.3. Genotype and allele frequencies for the three polymorphisms 5-HTTLPR,
STin2 and FTO in the sample of Portuguese children.
Table 3.4. Association of 5-HTTLPR polymorphism with obesity-related quantitative
traits.
Table 3.5. Association of STin2 polymorphism with obesity-related quantitative traits.
Table 3.60 Association of FTO polymorphism with obesity-related quantitative traits.
Table 3.7. Association of polymorphisms in genes SLC6A4 (5-HTTLPR and STin2)
and FTO (rs9939609) with risk of overweight/obesity in the sample of Portuguese
children aged between 3 and 6 years old.
Table 3.8. Association of polymorphisms in genes SLC6A4 (5-HTTLPR and STin2)
and FTO (rs9939609) with risk of overweight/obesity in the sample of Portuguese
children aged between 7 and 11 years old.
Table 3.9. Association of polymorphisms in genes SLC6A4 (5-HTTLPR and STin2)
and FTO (rs9939609) with risk of abdominal obesity in the sample of Portuguese
children aged between 3 and 6 years old.
Table 3.10. Association of polymorphisms in genes SLC6A4 (5-HTTLPR and STin2)
and FTO (rs9939609) with risk of abdominal obesity in the sample of Portuguese
children aged between 7 and 11 years old.
18
19
20
22
23
24
27
28
29
30

xiv

1- Introduction

2
3
1.1. What is obesity?
Obesity is a major public health problem that has experienced an increase in the
world population, and its impact is more salient in more industrialized countries (Xia &
Grant, 2013). According to the definition from the World Health Organization (WHO),
obesity is defined as abnormal or excessive fat accumulation that may impair health. The
most commonly used measure of obesity and overweight is Body Mass Index (BMI),
which is defined as a person’s weight in kilograms divided by the square of the person’s
height in meters (kg/m2). Obesity results from the interaction of several family,
environmental and genetic factors (Srivastava et al., 2016; Xia & Grant, 2013). Numerous
environmental factors are associated with obesity, including sedentary behaviors,
breastfeeding, and sleep duration, just to mention some of them. Nevertheless, it is
generally accepted that this increase in obesity prevalence results mainly from an increase
in the consumption of energy-dense food and, on the other hand, a reduction in physical
activity (PA) levels (Xia & Grant, 2013).
However, it is also clear that some individuals are more susceptible to these
“obesogenic” environmental changes (Sandholt et al., 2012; Tung & Yeo, 2011). Indeed,
studies using monozygotic twins (MZ) and dizygotic twins (DZ) (genetically equal
individuals and individuals sharing 50% similarity respectively) have estimated that the
concordance for fat mass in MZ twins ranges between 70-90% while in DZ twins ranges
between 35-45%, demonstrating that obesity has a great genetic component and that
characteristics such as body weight are strongly hereditary (Tung & Yeo, 2011; Xia &
Grant, 2013). In fact, it is now accepted that obesity constitutes a complex nonmendelian
trait that results from numerous susceptibility loci (Srivastava et al., 2016). Therefore the
identification of obesity-associated loci could enable the ability to distinguish individuals
who have a strong genetic predisposition to obesity, allowing the development of
prevention or treatment strategies (Sandholt et al., 2012)
1.2. Genetics of obesity: the FTO and SLC6A4 genes
Since polygenic obesity is the most common form of obesity (Tung & Yeo,
2011), human genome-wide association studies (GWAS) through the study of thousands
of single nucleotide polymorphisms (SNPs) across all the genome, allowed the
identification of a large number of loci associated with obesity (Speliotes et al., 2010;
4
Wen et al., 2012; Loos & Yeo, 2014). The fat mass and obesity-associated (FTO) gene,
located on chromosome 16q12.2, was the first obesity-associated locus identified by
GWAS (Dina et al., 2007; Frayling et al., 2007).
The FTO gene is expressed mainly in the brain and hypothalamus playing a role
in the regulation of energy homeostasis (Tung & Yeo, 2011; Dina et al., 2007). The FTO
gene product is a nuclear protein 2-oxoglutarate Fe (II) dependent demethylase, although
little is known about the physiological function of this protein. Recent studies suggest
that the enzyme can remove methyl groups from DNA and RNA nucleotides in vitro, with
highest affinity for single stranded RNA molecules ( Leonska - Duniec et al., 2016; Loos
& Yeo, 2014; Tung & Yeo, 2011). The FTO gene has been the focus of many studies,
covering a large number of distinct populations of European (González-Sánchez et al.,
2009; Hubacek et al., 2008; Loos & Yeo, 2014), African (Adeyemo et al., 2010;
Hassanein et al., 2010; Loos & Yeo, 2014), and Asian (Cha et al., 2008; Chang et al.,
2008; Loos & Yeo, 2014; Tan et al., 2008) ancestries, that have confirmed the association
of FTO with obesity. The SNP rs9939609 located in intron 1 of the FTO gene is the most
widely studied among populations showing the highest levels of association with obesity
and BMI (Xia & Grant, 2013). Each additional minor rs9939609 A risk allele was found
to be associated with a 20%–30% increase in the risk of obesity and 1–1.5 kg increase in
body weight (Frayling et al., 2007). Studies in the Portuguese population also have shown
a strong association between this SNP and obesity in both children and adults
(Albuquerque et al., 2013; Ferreira Carlos et al., 2013; Muc et al., 2015).
It is worth noting that many of the variants discovered showing an association
with obesity are predominantly expressed in the central nervous system (Sandholt et al.,
2012). An example is the serotonin transporter (5-HTT) which is translated by the solute
carrier family 6 member 4 (SLC6A4) gene on chromosome 17q11.2 (Miranda et al., 2017;
Sookoian et al., 2007). The 5-HTT is an integral membrane protein localized in
presynaptic neuronal membranes (Calati et al., 2011), implicated in the transport of
serotonin (5-hydroxytryptamine or 5-HT) from the synaptic cleft into the pre-synaptic
neurons, with the purpose of terminating serotonin action and recycling it (Bah et al.,
2010; Calati et al., 2011). The SLC6A4 gene has two well studied polymorphic regions,
the serotonin transporter linked polymorphic region in the promoter region (5-HTTLPR)
and a variable number of tandem repeats (VNTR) in the second intron (known as STin2)
(Dias et al., 2016).
5
The 5-HTTLPR polymorphism has two common alleles: a short (S) and a long
(L) with 14 and 16 copies, respectively, of a 20 to 23 base pair (bp) repeat sequence
(Bonnet et al., 2017; Peralta-leal et al., 2012). Individuals homozygous (SS) and
heterozygous (LS) compared to homozygous individuals (LL), have a reduced expression
of SLC6A4, resulting in a reduced reuptake of serotonin from the synaptic cleft into
presynaptic neurons (Peralta-leal et al., 2012). The second SLC6A4 polymorphic region
STin2 is a multiallelic 17-bp VNTR with two common 10 and 12 repeat alleles, and two
rare alleles with 9 and 7 repeats (Lesch et al., 1994; MacKenzie & Quinn, 1999). The
intronic polymorphism STin2 may act as a positive transcriptional regulatory element,
the 12-allele having a higher transcriptional activity (Fiskerstrand et al., 1999; MacKenzie
& Quinn, 1999).
Until now, there is no consensus in the literature about the association with
obesity for 5-HTTLPR polymorphic region. Several studies in different populations have
reported associations of both S and L alleles with obesity or obesity related traits (Bah et
al., 2010; Borkowska et al., 2015; Fuemmeler et al., 2008; Iordanidou et al., 2010; Lan et
al., 2009; Miranda et al., 2017; Peralta-leal et al., 2012; Sookoian et al., 2007; Sookoian
et al., 2008), while other reports showed no such associations (Hameed et al., 2015;
Mergen et al., 2007). In the Portuguese population a recent study demonstrated an
association between the 5-HTTLPR L allele and overweight/obesity in a sample of
Portuguese young adults (Dias et al., 2016). Almost all the studies conducted thus far,
have focus mainly on adults. The few studies that have been performed to investigate
association of this variant with obesity in children have shown an association between
the S allele and increased BMI and other obesity-related parameters (Miranda et al., 2017;
Sookoian et al., 2007). Regarding STin2, to our knowledge, only two studies have been
performed to investigate the association between this polymorphism and obesity. The first
study found no significant association between this polymorphism and obesity in Turkish
adults (Uzun et al., 2015) and a second study in Portuguese young adults, showed the
STin2 10 allele and L/10 haplotype associated with overweight/obesity (Dias et al., 2016).
1.3. Gene environment interactions
A gene-environment interaction (GxE) exists where the risk conveyed by a
specific genotype depends on one or more environmental exposure levels. Modulation of
FTO-obesity associations by self-reported physical activity and by diet, the two major
6
factors contributing to body weight regulation, are the most replicated gene-
environmental interactions in obesity. Many individual observations in European ancestry
populations suggests that moderate to vigorous physical activity attenuates the effect of
FTO genetic susceptibility to obesity (Albuquerque et al., 2017). It was shown that low
physical activity accentuates the effect of the FTO on obesity risk, as reported in both
adults (Andreasen et al., 2008; Rampersaud et al., 2008) and children (Ruiz et al., 2010;
Xi et al., 2011). Studies in the Portuguese population also have shown the influence of
higher physical activity (sport practice) on the attenuation of the FTO rs9939609 genetic
susceptibility to obesity in young adults (Muc et al., 2015). For the SLC6A4
polymorphisms, a recent study in the Portuguese population showed that in less active
individuals, overweight/obesity was significantly associated with the 5-HTTLPR L-allele
and nominally associated with STin2 10-allele, demonstrating that physical inactivity
accentuates the influence of the SLC6A4 polymorphisms on obesity risk (Dias et al.,
2016). However, to our knowledge no other study conducted thus far assessed for
interactions between SLC6A4 polymorphisms and physical activity on obesity risk.
1.4. Objectives
The main aim of this work was to investigate possible associations between
polymorphisms located at the two loci FTO and SLC6A4 with obesity and obesity-related
variables (weight, BMI, BMI z-score, waist circumference, hip circumference, waist-to-
height ratio, and skinfold measurements) in a sample of Portuguese children aged 3-11
years-old.
In particular, our study aimed:
I. to investigate the association between the FTO SNP rs9939609 and
overweight/obesity and other anthropometric variables;
II. to investigate the possible association of the two SLC6A4 polymorphisms, 5-
HTTLPR and STin2, with obesity and other anthropometric variables;
III. to test for interaction effects between the study polymorphisms and physical
activity in relation to obesity.
2 - Material and methods: fundamentals
and protocols

8
9
2.1. Selection of polymorphisms
For this study three polymorphisms of two loci, that have been previously
identified from the literature as being related with obesity or obesity-related traits, were
selected:
- the FTO SNP rs9939609 (position: chr16:53820527), the most widely studied
locus in terms of obesity, that has previously also been associated with obesity and obesity
related traits in both children (Albuquerque et al., 2013) and adults (Muc et al., 2015) of
the Portuguese population;
- the two SLC6A4 (chr17q11.2) polymorphisms STin2 and 5-HTTLPR, that have
been previously associated with obesity in a sample of Portuguese young adults (Dias et
al., 2016).
2.2. Study subjects and anthropometric measures
The study population included 645 Portuguese children (321 females, 324 males;
age 3-11 years old), randomly selected from several public schools in the central region
of Portugal (Coimbra).
This study was conducted under a project approved by the Ministry of Education
- Direcção Geral de Inovação e de Desenvolvimento Curricular. The study was
performed anonymously and according to the guidelines laid down in the Declaration of
Helsinki. Written informed consent was obtained from all children’s parents.
All anthropometric measurements were taken barefoot and in minimal clothing
for weight, height, waist circumference (WC), hip circumference (HC), triceps,
subscapular and suprailiac skinfolds. The following anthropometric variables were
considered for this study:
i) BMI was calculated as the weight in kilograms divided by the square of height
in meters (kg/m2), and was used to classify children as normal weight, overweight or
obese according the age and sex specific BMI cut-off points provided by the International
Obesity Task Force (IOTF).
ii) Body mass index z-scores, also called BMI standard deviation (s.d.) scores, are
measures of relative weight adjusted for child age and sex. Given a child’s age, sex, BMI,
and an appropriate standard reference, a BMI z-score (or its equivalent BMI-for-age
percentile) can be determined. It should be noted that BMI z-scores are calculated relative
to an external reference (whether national or international) and not to an internal
10
reference. Body mass index Z-scores correspond to growth chart percentiles, and can be
converted into their equivalent BMI-for-age percentiles by comparison to a normal
distribution table (Must & Anderson, 2006).
iii) Waist-to-height ratio (WHtR) constitutes an anthropometric tool used for measuring
central adiposity (body fat), calculated by dividing WC (cm) by height (cm). WHtR has
been gaining more attention and has been described has a more sensitive universal
screening tool than BMI to detect health risks (Yoo, 2016).
iv) Skinfold measurements is a common method to estimate body fat composition of the
body. The sum (mm) of the triceps, subscapular and suprailiac values is then converted
to a percentage of body weight according to age and sex.
2.3. Physical activity measurement
Physical activity (PA) was measured for consecutive 7 days using a wGT3X-BT
Actigraph accelerometer (ActiGraph LLC, Pensacola, FL, USA). This accelerometer is a
triaxial motion sensor and, it is one of the most commonly used devices for assessing PA.
The dimensions of the sensor are 4.6x3.3x1.5 cm with a weight of 19 grams. The
accelerometer was placed on an elastic belt above the right anterior superior iliac spine
and it was selected a sample rate of 100 Hz (range 30–100 Hz). The filtered acceleration
signal is digitized, and the magnitude is summed over a user-specified period of time (an
epoch interval) which was set at 5 seconds as in other studies of children which has been
shown to be more accurate for the assessment of the spontaneous and intermittent
activities of young children. The accelerometer was placed over the hip for seven
consecutive school days. Accelerometer data were electronically downloaded using the
ActiLife 6 software. Subsequently, data were reduced to an Excel file containing
movement counts. The output also included the total time that the accelerometer was worn
(minutes) on each day.
The total amount of daily moderate-to-vigorous physical activity (MVPA) was
expressed in minutes/day. Participants who did not complete a minimum of 600 minutes
of accelerometer data per day after removing sequences of 20 or more consecutive zero
counts (Andersen et al., 2006; Bringolf-Isler et al., 2009) were excluded from subsequent
analyses.
Data processing and inclusion criteria were the same as in the European Youth
Heart Study (Riddoch et al., 2004), the Avon Longitudinal Study of Parents and Children
11
(Riddoch et al., 2007), the National Health and Nutrition Examination (Troiano et al.,
2008), and the Midlands Adolescent Lifestyle Study (Machado-Rodrigues et al., 2014;
Machado-Rodrigues et al., 2011a; Machado-Rodrigues et al., 2011b).
For 6-10 years-old children accelerometer output was interpreted using intensity-
based cut-points, which categorizes activity counts as sedentary, light, moderate, or
vigorous physical activity. Time spent in moderate-to-vigorous physical activity (MVPA)
was calculated using a specific pediatric cut-point for preschool-aged children (Evenson
et al., 2008). Children were classified as active if they accumulated at least 60 minutes of
MVPA, and non-Active if they do not reach these recommended values.
For pre-school children (aged 3-5 years-old) accelerometer output was interpreted
using intensity-based cut-points, which categorizes activity counts as sedentary, light,
moderate, or vigorous physical activity. Time spent in MVPA was calculated using a
specific pediatric cut-point for preschool-aged children (Pate et al., 2006). Children were
classified as active if they accumulated at least 60 minutes of MVPA, and non-Active if
they do not reach these recommended values.
2.4. Genotyping
Buccal swabs of volunteer individuals were submitted to DNA extraction, using
the FavorPrepTM Genomic DNA Mini Kit (Favorgen® Biotech Corp, Taiwan), according
to the instructions of the manufacturer. Briefly, buccal cells were subjected to a lysis
buffer and proteinase K. The lysed sample was transferred to a column containing a silica
resin that selectively binds DNA. The silica membrane with DNA was then washed to
remove impurities (as proteins and salts). The final step in the DNA extraction protocol
is the release of pure DNA from the silica membrane with 50 µl of Elution Buffer. Final
product was transferred and stored at 4ºC or -20ºC.
Genotyping of the two SLC6A4 (5-HTT) gene polymorphisms, 5-HTTLPR and
STin2, was performed by Polymerase Chain Reaction (PCR) followed by electrophoresis
in 2% agarose gels, visualized under ultraviolet light after ethidium bromide staining.
Primers for the 5-HTTLPR polymorphism are described in Gelernter et al. (1997):
forward JP 5’-ATGCCAGCACCTAACCCCTAATGT-3’and reverse GR 5’-
GGACCGCAAGGTGGGCGGGA-3’. Primers for the STin2 polymorphism are
described in Uzun et al. (2015): forward 5’-GGTCAGTATCACAGGCTGCGAGTAG-
3’ and reverse 5’-TGTTCCTAGTCTTACGCCAGTGAAG-3’. PCR amplification was
performed in 25 µl reaction volume containing ~50 ng of genomic DNA, 1X PCR buffer,
12
3.0 mmol MgCl2, 0.5 mmol of each dNTP, 10.0 pmol of each primer and 1 unit of Taq
DNA polymerase (Thermo Scientific TM). PCR was carried out in a Biometra
TProfessional Thermocycler (Biometra, Goettingen Germany) as follows: 5 min at 94ºC
followed by 35 cycles of denaturation at 94ºC for 30sec, annealing at 60ºC for 30sec,
extension at 72ºC for 30sec, and a final extension of 5 min at 72ºC.
For the FTO SNP rs9939609, samples were genotyped by allelic discrimination
assays using the TaqMan® SNP Genotyping Assay C_30090620_10 (Applied
Biosystems, Foster City, USA). The detection of polymorphisms in the genome through
the real-time polymerase chain reaction, also called quantitative polymerase chain
reaction (qPCR), combines amplification, detection and quantification of a specific
nucleic acid into a single step. Each predesigned TaqMan SNP Genotyping Assay
includes two allele-specific TaqMan MGB probes containing distinct fluorescent dyes
(dye FAM™ and dye VIC®) to detect specific SNP targets and a PCR primer pair. During
a PCR cycle, the probe hybridizes specifically to the corresponding template, cleaves via
the 5′ to 3′ exonuclease activity of Taq DNA polymerase and subsequently increases the
FAM™ and VIC® fluorescent emissions. Real-time PCR instruments measure the
accumulation of fluorescent signal during the exponential phase of the reaction for precise
quantification of PCR products and objective data analysis.
The qPCR amplification was carried out in 20 μl of a total reaction volume
containing 1.5 μl (~40 ng) of DNA, 0.2 μM of TaqMan probes in 1x of SsoFast™ Probes
Supermix (Bio-Rad, Hercules, CA, USA). PCR conditions were an initial denature step
at 95°C for 10 minutes, followed by 40 cycles of 1 minute at 62°C and 15 seconds at
95°C. Fluorescence was visualized through a CFX96 TouchTM Real-Time PCR Detection
System (Bio-Rad, Hercules, CA, USA). To assess genotyping reproducibility, a random
10% selection of samples were re-genotyped or submitted to automatic sequencing by
Sanger’s dideoxy chain termination reaction using the Big-Dye Terminator v1.1 Cycle
Sequencing kit (Applied Biosystems, Foster City, USA) and the ABI 3130 automatic
sequencer (Applied Biosystems).
2.5. Statistical analysis
Genotype and allele frequencies, Hardy-Weinberg equilibrium probability values
were calculated for FTO rs9939609, 5-HTTLPR and STin2 polymorphisms in the whole
population.
13
For statistical association analyses the population sample was stratified in two
groups aged 3-6 and 7-11 years-old. Subjects defined as overweight or obese were merged
in one case group. Linear regression models were used to test the association of the
studied polymorphisms with obesity-related quantitative traits height (m), weight (kg),
BMI (kg/m2), BMI z-score, WC (cm), WHtR, triceps (mm), subscapular (mm), suprailiac
(mm) and sum of skinfolds (mm). The association between genotype distributions and
both risk of overweight/obesity and risk of abdominal obesity was tested by logistic
regression, unadjusted and adjusted for sex and age, and presented as odds ratios (OR)
with 95% confidence intervals (CI) and p values. Genotypes with rare variants of the 5-
HTTLPR and STin2 polymorphism were not included in the association analysis due to
their low frequency in the population. All these statistical analyses were done by using
the set-based tests implemented on PLINK software v.1.07 (Purcell et al., 2007;
http://pngu.mgh.harvard.edu/purcell/plink/).
Normality of the quantitative data was assessed using the Kolmogorov-Smirnov
test. The nonparametric Kruskal-Wallis or Mann-Whitney tests were used to compare
quantitative variables between groups. These statistical analyses were performed using
the IBM SPSS Statistics software, version 24.0 (SPSS, Inc., Chicago, IL)

14

3 - Results

16
17
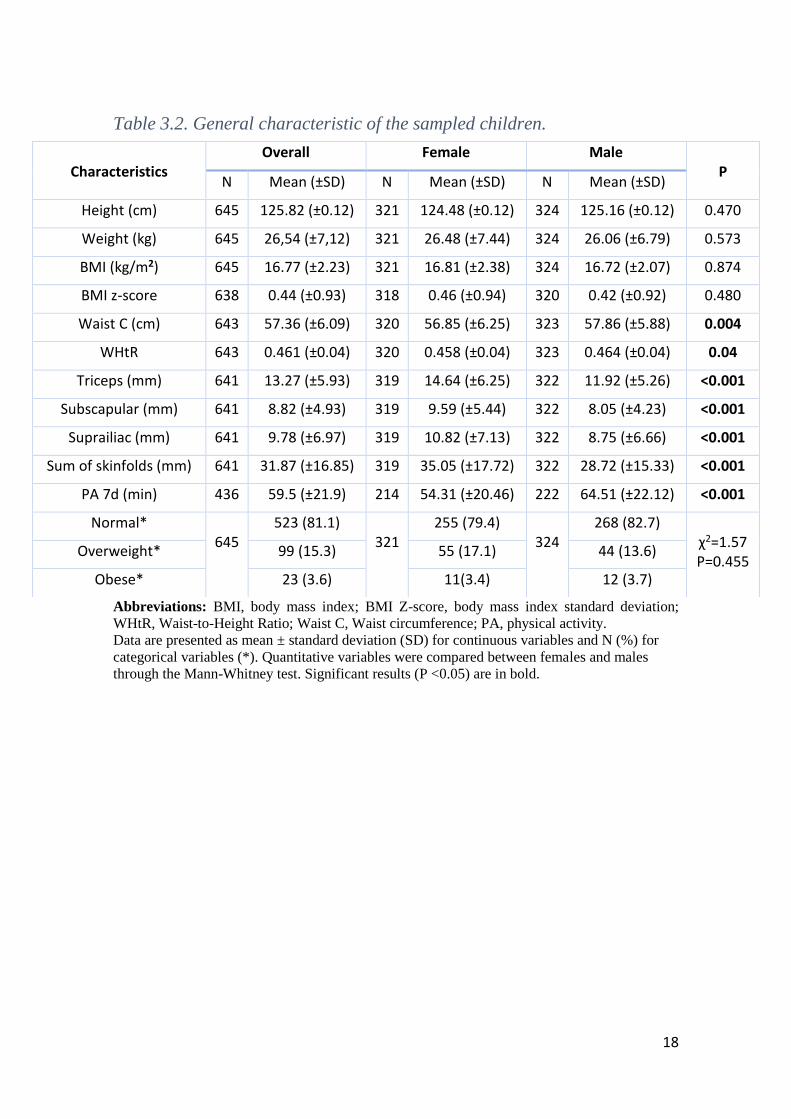
3.1. Population characteristics
General characteristics of the study population are summarized in Table 3.1. From
a total of 645 participants, 321 (49.8%) were girls and 324 (50.2%) were boys. Significant
gender-related differences in several anthropometric measurements were observed (P <
0.05). Females showed a significant higher value of triceps, subscapular, suprailiac and
sum of skinfolds. Nevertheless, males showed significant higher values of waist
circumference and waist to height ratio (WHtR) as well as higher values of physical
activity.
According the IOTF cut-offs, the prevalence of excess weight, including
overweight and obesity, reach 18.9% in the study sample. Ninety-nine individuals
(15.3%) were classified as overweight and 23 (3.6%) as obese (81.1 % of subjects were
classified as normal-weight). Boys and girls showed identical prevalence of obesity (3.7%
and 3.4%, respectively) and prevalence of overweight is higher in females (17.1% in girls
and 13.7% in boys) (Table 3.1).
For the genetic association analyses, the study population was divided into two
groups based on age: one group aged 3-6 years-old and a second group aged 7-11 years-
old. Children with 3 to 6 years-old include 241 individuals, 112 girls (46.5%) and 129
boys (53.5%), while children between 7 to 11 years-old include 404 individuals, 209 girls
(51.7%) and 195 boys (48.3%). General characteristics of the population according the
two age groups are detailed in Table 3.2.
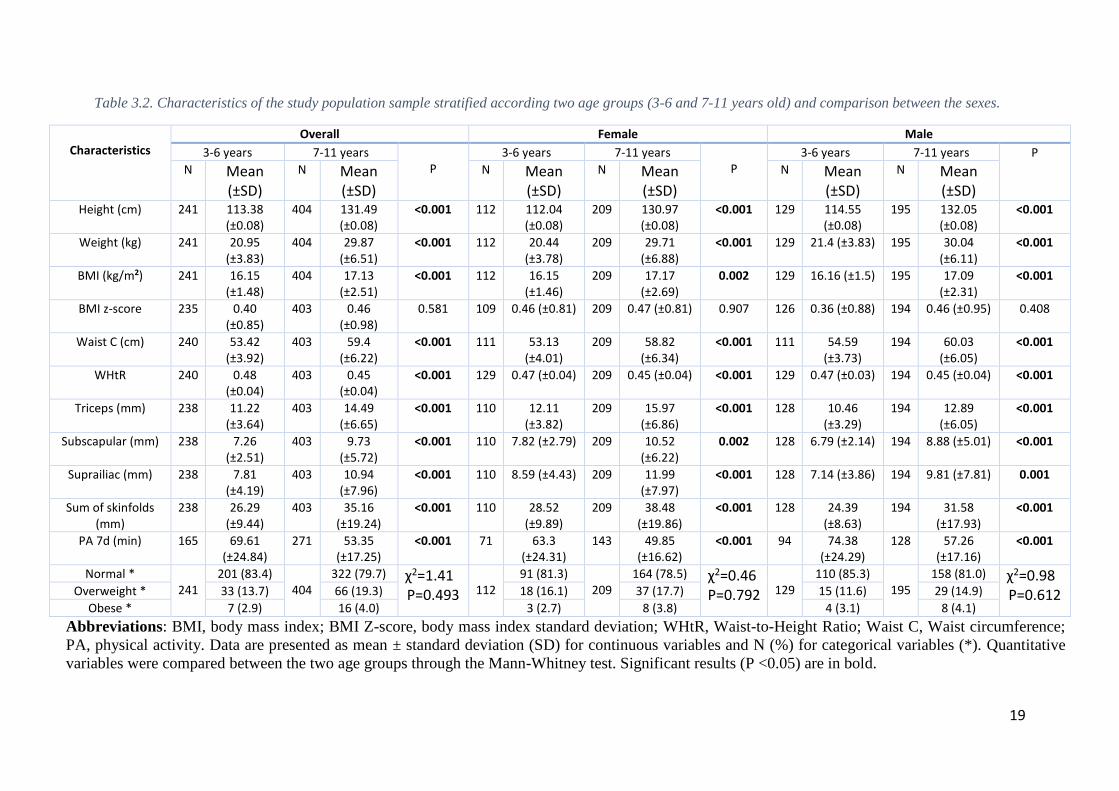
Significant age-related differences were observed in the whole population as well
as in males and females, except for BMI z-score (Table 3.2). In almost all characteristics,
children aged 7-11 years-old showed higher values in comparison with individuals aged
3-6 years-old, except for WHtR (Table 3.2). Curiously, children aged 3-6 years-old had
higher values of physical activity, 69.61 vs. 53.35 minutes of moderate-to-vigorous
physical activity (MVPA) per week.
18
Table 3.2. General characteristic of the sampled children.
Abbreviations: BMI, body mass index; BMI Z-score, body mass index standard deviation;
WHtR, Waist-to-Height Ratio; Waist C, Waist circumference; PA, physical activity.
Data are presented as mean ± standard deviation (SD) for continuous variables and N (%) for
categorical variables (*). Quantitative variables were compared between females and males
through the Mann-Whitney test. Significant results (P <0.05) are in bold.
Characteristics
Overall Female Male P
N Mean (±SD) N Mean (±SD) N Mean (±SD)
Height (cm) 645 125.82 (±0.12) 321 124.48 (±0.12) 324 125.16 (±0.12) 0.470
Weight (kg) 645 26,54 (±7,12) 321 26.48 (±7.44) 324 26.06 (±6.79) 0.573
BMI (kg/m2) 645 16.77 (±2.23) 321 16.81 (±2.38) 324 16.72 (±2.07) 0.874
BMI z-score 638 0.44 (±0.93) 318 0.46 (±0.94) 320 0.42 (±0.92) 0.480
Waist C (cm) 643 57.36 (±6.09) 320 56.85 (±6.25) 323 57.86 (±5.88) 0.004
WHtR 643 0.461 (±0.04) 320 0.458 (±0.04) 323 0.464 (±0.04) 0.04
Triceps (mm) 641 13.27 (±5.93) 319 14.64 (±6.25) 322 11.92 (±5.26) <0.001
Subscapular (mm) 641 8.82 (±4.93) 319 9.59 (±5.44) 322 8.05 (±4.23) <0.001
Suprailiac (mm) 641 9.78 (±6.97) 319 10.82 (±7.13) 322 8.75 (±6.66) <0.001
Sum of skinfolds (mm) 641 31.87 (±16.85) 319 35.05 (±17.72) 322 28.72 (±15.33) <0.001
PA 7d (min) 436 59.5 (±21.9) 214 54.31 (±20.46) 222 64.51 (±22.12) <0.001
Normal* 645
523 (81.1) 321
255 (79.4) 324
268 (82.7) χ2=1.57 P=0.455
Overweight* 99 (15.3) 55 (17.1) 44 (13.6)
Obese* 23 (3.6) 11(3.4) 12 (3.7)
19
Table 3.2. Characteristics of the study population sample stratified according two age groups (3-6 and 7-11 years old) and comparison between the sexes.
Characteristics
Overall Female Male
3-6 years 7-11 years P
3-6 years 7-11 years P
3-6 years 7-11 years P
N Mean (±SD)
N Mean (±SD)
N Mean (±SD)
N Mean (±SD)
N Mean (±SD)
N Mean (±SD)
Height (cm) 241 113.38 (±0.08)
404 131.49 (±0.08)
<0.001 112 112.04 (±0.08)
209 130.97 (±0.08)
<0.001 129 114.55 (±0.08)
195 132.05 (±0.08)
<0.001
Weight (kg) 241 20.95 (±3.83)
404 29.87 (±6.51)
<0.001 112 20.44 (±3.78)
209 29.71 (±6.88)
<0.001 129 21.4 (±3.83) 195 30.04 (±6.11)
<0.001
BMI (kg/m2) 241 16.15 (±1.48)
404 17.13 (±2.51)
<0.001 112 16.15 (±1.46)
209 17.17 (±2.69)
0.002 129 16.16 (±1.5) 195 17.09 (±2.31)
<0.001
BMI z-score 235 0.40 (±0.85)
403 0.46 (±0.98)
0.581 109 0.46 (±0.81) 209 0.47 (±0.81) 0.907 126 0.36 (±0.88) 194 0.46 (±0.95) 0.408
Waist C (cm) 240 53.42 (±3.92)
403 59.4 (±6.22)
<0.001 111 53.13 (±4.01)
209 58.82 (±6.34)
<0.001 111 54.59 (±3.73)
194 60.03 (±6.05)
<0.001
WHtR 240 0.48 (±0.04)
403 0.45 (±0.04)
<0.001 129 0.47 (±0.04) 209 0.45 (±0.04) <0.001 129 0.47 (±0.03) 194 0.45 (±0.04) <0.001
Triceps (mm) 238 11.22 (±3.64)
403 14.49 (±6.65)
<0.001 110 12.11 (±3.82)
209 15.97 (±6.86)
<0.001 128 10.46 (±3.29)
194 12.89 (±6.05)
<0.001
Subscapular (mm) 238 7.26 (±2.51)
403 9.73 (±5.72)
<0.001 110 7.82 (±2.79) 209 10.52 (±6.22)
0.002 128 6.79 (±2.14) 194 8.88 (±5.01) <0.001
Suprailiac (mm) 238 7.81 (±4.19)
403 10.94 (±7.96)
<0.001 110 8.59 (±4.43) 209 11.99 (±7.97)
<0.001 128 7.14 (±3.86) 194 9.81 (±7.81) 0.001
Sum of skinfolds (mm)
238 26.29 (±9.44)
403 35.16 (±19.24)
<0.001 110 28.52 (±9.89)
209 38.48 (±19.86)
<0.001 128 24.39 (±8.63)
194 31.58 (±17.93)
<0.001
PA 7d (min) 165 69.61 (±24.84)
271 53.35 (±17.25)
<0.001 71 63.3 (±24.31)
143 49.85 (±16.62)
<0.001 94 74.38 (±24.29)
128 57.26 (±17.16)
<0.001
Normal * 241
201 (83.4) 404
322 (79.7) χ2=1.41 P=0.493
112
91 (81.3) 209
164 (78.5) χ2=0.46 P=0.792
129
110 (85.3) 195
158 (81.0) χ2=0.98 P=0.612 Overweight * 33 (13.7) 66 (19.3) 18 (16.1) 37 (17.7) 15 (11.6) 29 (14.9)
Obese * 7 (2.9) 16 (4.0) 3 (2.7) 8 (3.8) 4 (3.1) 8 (4.1)
Abbreviations: BMI, body mass index; BMI Z-score, body mass index standard deviation; WHtR, Waist-to-Height Ratio; Waist C, Waist circumference;
PA, physical activity. Data are presented as mean ± standard deviation (SD) for continuous variables and N (%) for categorical variables (*). Quantitative
variables were compared between the two age groups through the Mann-Whitney test. Significant results (P <0.05) are in bold.
20
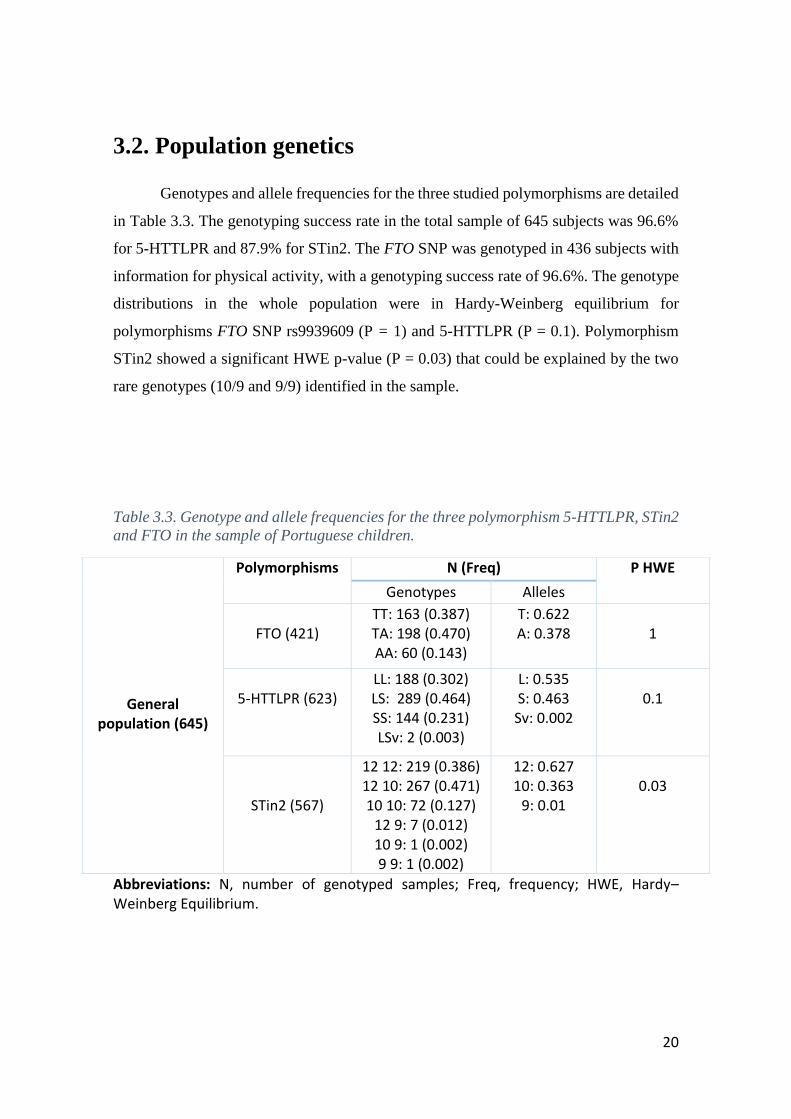
3.2. Population genetics
Genotypes and allele frequencies for the three studied polymorphisms are detailed
in Table 3.3. The genotyping success rate in the total sample of 645 subjects was 96.6%
for 5-HTTLPR and 87.9% for STin2. The FTO SNP was genotyped in 436 subjects with
information for physical activity, with a genotyping success rate of 96.6%. The genotype
distributions in the whole population were in Hardy-Weinberg equilibrium for
polymorphisms FTO SNP rs9939609 (P = 1) and 5-HTTLPR (P = 0.1). Polymorphism
STin2 showed a significant HWE p-value (P = 0.03) that could be explained by the two
rare genotypes (10/9 and 9/9) identified in the sample.
Table 3.3. Genotype and allele frequencies for the three polymorphism 5-HTTLPR, STin2
and FTO in the sample of Portuguese children.
Abbreviations: N, number of genotyped samples; Freq, frequency; HWE, Hardy–Weinberg Equilibrium.
General population (645)
Polymorphisms N (Freq) P HWE
Genotypes Alleles
FTO (421)
TT: 163 (0.387) TA: 198 (0.470) AA: 60 (0.143)
T: 0.622 A: 0.378
1
5-HTTLPR (623)
LL: 188 (0.302) LS: 289 (0.464) SS: 144 (0.231) LSv: 2 (0.003)
L: 0.535 S: 0.463 Sv: 0.002
0.1
STin2 (567)
12 12: 219 (0.386) 12 10: 267 (0.471) 10 10: 72 (0.127)
12 9: 7 (0.012) 10 9: 1 (0.002) 9 9: 1 (0.002)
12: 0.627 10: 0.363
9: 0.01
0.03
21
3.3. Associations with obesity-related quantitative traits
In Tables 3.4, 3.5 and 3.6 we detail the results of the association analysis between
the three polymorphism and obesity-related quantitative traits in the two age groups, 3-6
years-old and 7-11 years-old.
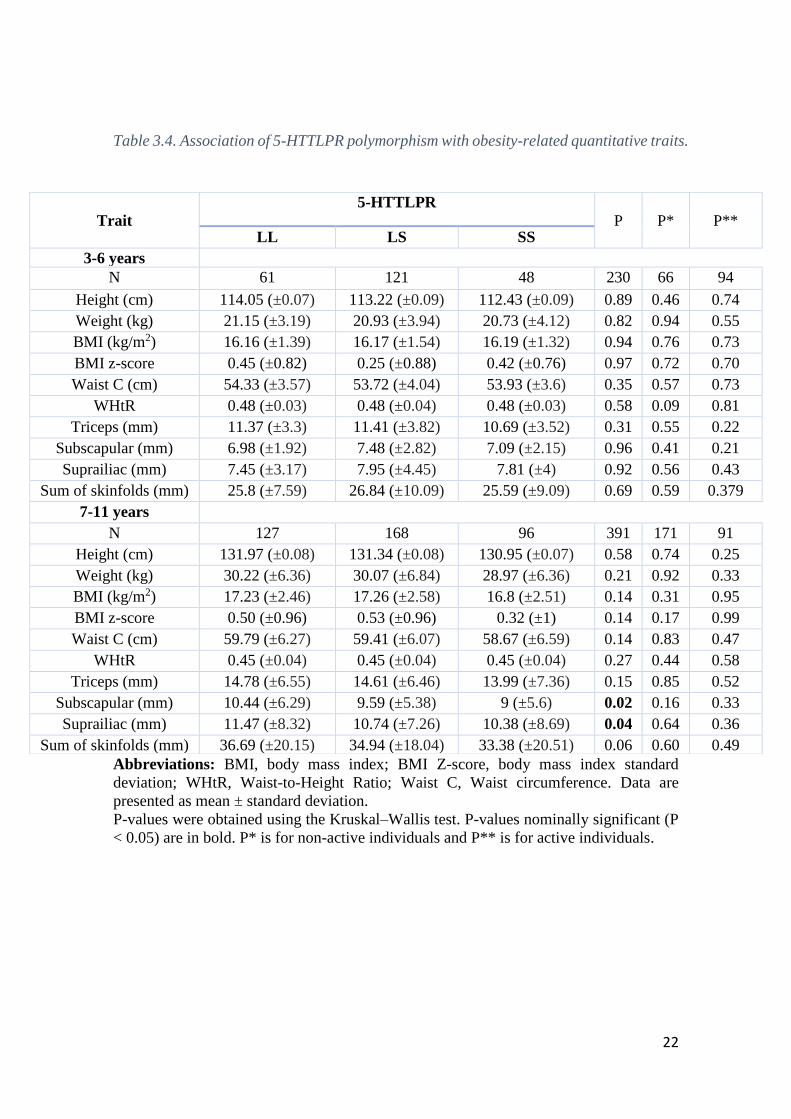
Regarding the 5-HTTLPR polymorphism, a statistically significant association
was found in children aged 7-11 years-old for subscapular and suprailiac skinfold
measures (P = 0.02 and P = 0.04, respectively) (Table 3.4). No other associations were
found in the remaining anthropometric parameters in the overall sample. Moreover, when
the population was split by physical activity, the previous association was lost both in
physical active and non-active individuals (P >0.05). No significant associations were
found in children aged 3-6 years-old.
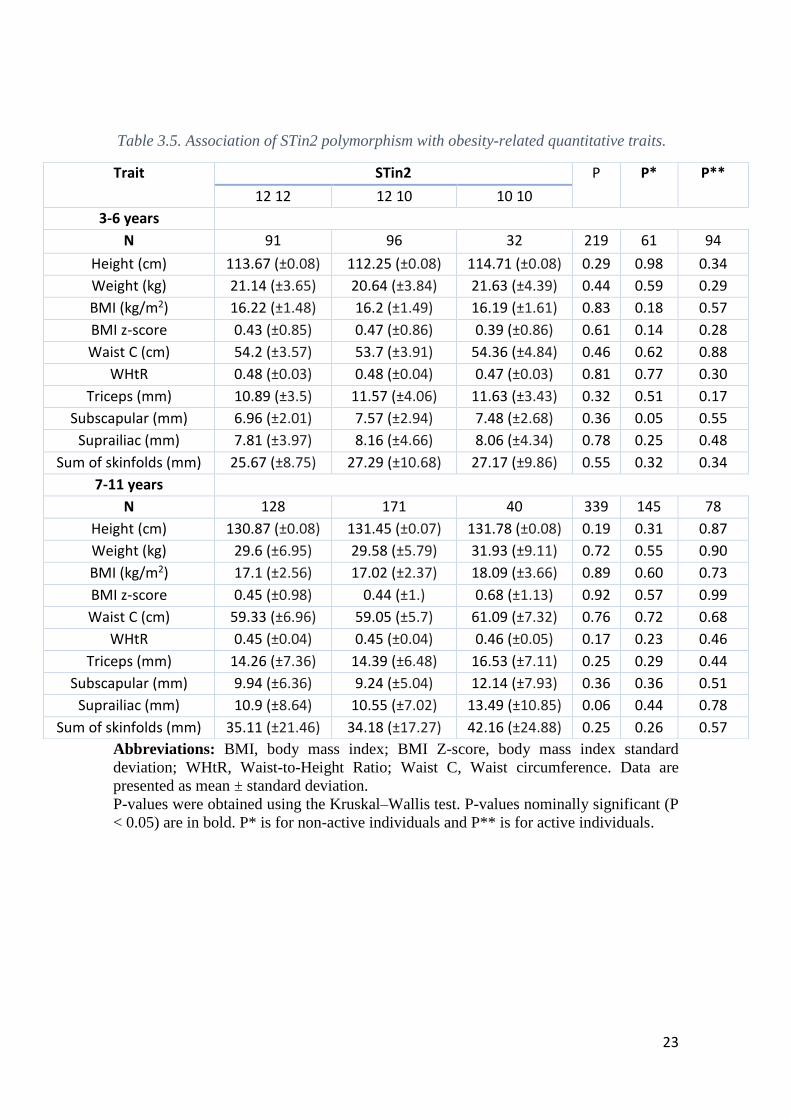
For the STin2 polymorphisms no statistically significant associations were found
among the analyzed parameters (P >0.05) in both age groups 3-6 years old and 7-11 years-
old, although a near significant association was found in children aged between 7-11
years-old for suprailiac skinfold thickness (P = 0.06) (Table 3.5). Also, when the
population was split by physical activity no significant associations were found both in
active and non-active individuals (P >0.05).
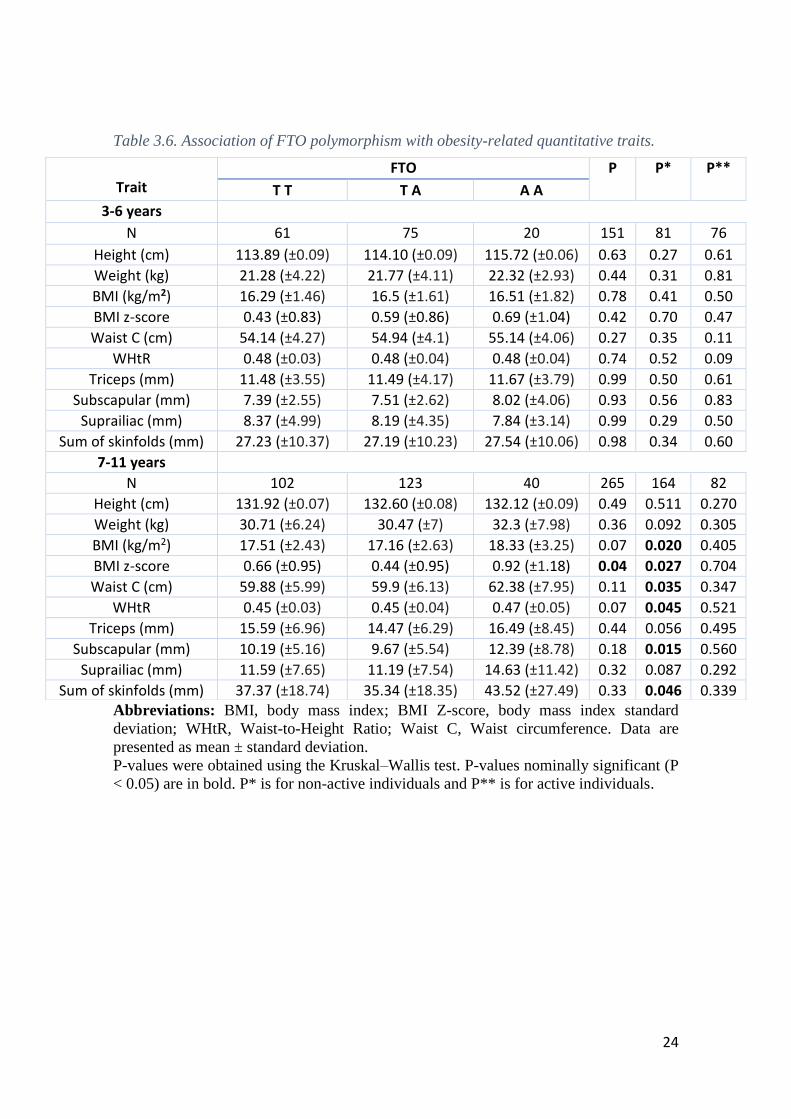
The FTO polymorphism showed a statistically significant association with BMI
Z-score (P = 0.04) in children aged between 7-11 years (Table 3.6). Although no other
significant associations were found, a marginal association was found for WHtR and BMI
(P = 0.07) in the same age group. When we tested association split by physical activity,
statistically significant associations were found for several obesity-related anthropometric
parameters in non-active individuals aged 7-11 years, including for BMI (P = 0.02), BMI
Z-score (P = 0.027), waist circumference (P = 0.035), WHtR (P = 0.045), subscapular
skinfold (P = 0.015) and sum of skinfolds (P = 0.046). No significant associations were
found in children aged 3-6 years in whole sample or in both active and non-active groups
(P >0.05) (Table 3.6).
22
Table 3.4. Association of 5-HTTLPR polymorphism with obesity-related quantitative traits.
Abbreviations: BMI, body mass index; BMI Z-score, body mass index standard
deviation; WHtR, Waist-to-Height Ratio; Waist C, Waist circumference. Data are
presented as mean ± standard deviation.
P-values were obtained using the Kruskal–Wallis test. P-values nominally significant (P
< 0.05) are in bold. P* is for non-active individuals and P** is for active individuals.
Trait
5-HTTLPR
P
P*
P** LL LS SS
3-6 years
N 61 121 48 230 66 94
Height (cm) 114.05 (±0.07) 113.22 (±0.09) 112.43 (±0.09) 0.89 0.46 0.74
Weight (kg) 21.15 (±3.19) 20.93 (±3.94) 20.73 (±4.12) 0.82 0.94 0.55
BMI (kg/m2) 16.16 (±1.39) 16.17 (±1.54) 16.19 (±1.32) 0.94 0.76 0.73
BMI z-score 0.45 (±0.82) 0.25 (±0.88) 0.42 (±0.76) 0.97 0.72 0.70
Waist C (cm) 54.33 (±3.57) 53.72 (±4.04) 53.93 (±3.6) 0.35 0.57 0.73
WHtR 0.48 (±0.03) 0.48 (±0.04) 0.48 (±0.03) 0.58 0.09 0.81
Triceps (mm) 11.37 (±3.3) 11.41 (±3.82) 10.69 (±3.52) 0.31 0.55 0.22
Subscapular (mm) 6.98 (±1.92) 7.48 (±2.82) 7.09 (±2.15) 0.96 0.41 0.21
Suprailiac (mm) 7.45 (±3.17) 7.95 (±4.45) 7.81 (±4) 0.92 0.56 0.43
Sum of skinfolds (mm) 25.8 (±7.59) 26.84 (±10.09) 25.59 (±9.09) 0.69 0.59 0.379
7-11 years
N 127 168 96 391 171 91
Height (cm) 131.97 (±0.08) 131.34 (±0.08) 130.95 (±0.07) 0.58 0.74 0.25
Weight (kg) 30.22 (±6.36) 30.07 (±6.84) 28.97 (±6.36) 0.21 0.92 0.33
BMI (kg/m2) 17.23 (±2.46) 17.26 (±2.58) 16.8 (±2.51) 0.14 0.31 0.95
BMI z-score 0.50 (±0.96) 0.53 (±0.96) 0.32 (±1) 0.14 0.17 0.99
Waist C (cm) 59.79 (±6.27) 59.41 (±6.07) 58.67 (±6.59) 0.14 0.83 0.47
WHtR 0.45 (±0.04) 0.45 (±0.04) 0.45 (±0.04) 0.27 0.44 0.58
Triceps (mm) 14.78 (±6.55) 14.61 (±6.46) 13.99 (±7.36) 0.15 0.85 0.52
Subscapular (mm) 10.44 (±6.29) 9.59 (±5.38) 9 (±5.6) 0.02 0.16 0.33
Suprailiac (mm) 11.47 (±8.32) 10.74 (±7.26) 10.38 (±8.69) 0.04 0.64 0.36
Sum of skinfolds (mm) 36.69 (±20.15) 34.94 (±18.04) 33.38 (±20.51) 0.06 0.60 0.49
23
Table 3.5. Association of STin2 polymorphism with obesity-related quantitative traits.
Abbreviations: BMI, body mass index; BMI Z-score, body mass index standard
deviation; WHtR, Waist-to-Height Ratio; Waist C, Waist circumference. Data are
presented as mean ± standard deviation.
P-values were obtained using the Kruskal–Wallis test. P-values nominally significant (P
< 0.05) are in bold. P* is for non-active individuals and P** is for active individuals.
Trait STin2 P P* P**
12 12 12 10 10 10
3-6 years
N 91 96 32 219 61 94
Height (cm) 113.67 (±0.08) 112.25 (±0.08) 114.71 (±0.08) 0.29 0.98 0.34
Weight (kg) 21.14 (±3.65) 20.64 (±3.84) 21.63 (±4.39) 0.44 0.59 0.29
BMI (kg/m2) 16.22 (±1.48) 16.2 (±1.49) 16.19 (±1.61) 0.83 0.18 0.57
BMI z-score 0.43 (±0.85) 0.47 (±0.86) 0.39 (±0.86) 0.61 0.14 0.28
Waist C (cm) 54.2 (±3.57) 53.7 (±3.91) 54.36 (±4.84) 0.46 0.62 0.88
WHtR 0.48 (±0.03) 0.48 (±0.04) 0.47 (±0.03) 0.81 0.77 0.30
Triceps (mm) 10.89 (±3.5) 11.57 (±4.06) 11.63 (±3.43) 0.32 0.51 0.17
Subscapular (mm) 6.96 (±2.01) 7.57 (±2.94) 7.48 (±2.68) 0.36 0.05 0.55
Suprailiac (mm) 7.81 (±3.97) 8.16 (±4.66) 8.06 (±4.34) 0.78 0.25 0.48
Sum of skinfolds (mm) 25.67 (±8.75) 27.29 (±10.68) 27.17 (±9.86) 0.55 0.32 0.34
7-11 years
N 128 171 40 339 145 78
Height (cm) 130.87 (±0.08) 131.45 (±0.07) 131.78 (±0.08) 0.19 0.31 0.87
Weight (kg) 29.6 (±6.95) 29.58 (±5.79) 31.93 (±9.11) 0.72 0.55 0.90
BMI (kg/m2) 17.1 (±2.56) 17.02 (±2.37) 18.09 (±3.66) 0.89 0.60 0.73
BMI z-score 0.45 (±0.98) 0.44 (±1.) 0.68 (±1.13) 0.92 0.57 0.99
Waist C (cm) 59.33 (±6.96) 59.05 (±5.7) 61.09 (±7.32) 0.76 0.72 0.68
WHtR 0.45 (±0.04) 0.45 (±0.04) 0.46 (±0.05) 0.17 0.23 0.46
Triceps (mm) 14.26 (±7.36) 14.39 (±6.48) 16.53 (±7.11) 0.25 0.29 0.44
Subscapular (mm) 9.94 (±6.36) 9.24 (±5.04) 12.14 (±7.93) 0.36 0.36 0.51
Suprailiac (mm) 10.9 (±8.64) 10.55 (±7.02) 13.49 (±10.85) 0.06 0.44 0.78
Sum of skinfolds (mm) 35.11 (±21.46) 34.18 (±17.27) 42.16 (±24.88) 0.25 0.26 0.57
24
Table 3.6. Association of FTO polymorphism with obesity-related quantitative traits.
Abbreviations: BMI, body mass index; BMI Z-score, body mass index standard
deviation; WHtR, Waist-to-Height Ratio; Waist C, Waist circumference. Data are
presented as mean ± standard deviation.
P-values were obtained using the Kruskal–Wallis test. P-values nominally significant (P
< 0.05) are in bold. P* is for non-active individuals and P** is for active individuals.
Trait
FTO P P* P**
T T T A A A
3-6 years
N 61 75 20 151 81 76
Height (cm) 113.89 (±0.09) 114.10 (±0.09) 115.72 (±0.06) 0.63 0.27 0.61
Weight (kg) 21.28 (±4.22) 21.77 (±4.11) 22.32 (±2.93) 0.44 0.31 0.81
BMI (kg/m2) 16.29 (±1.46) 16.5 (±1.61) 16.51 (±1.82) 0.78 0.41 0.50
BMI z-score 0.43 (±0.83) 0.59 (±0.86) 0.69 (±1.04) 0.42 0.70 0.47
Waist C (cm) 54.14 (±4.27) 54.94 (±4.1) 55.14 (±4.06) 0.27 0.35 0.11
WHtR 0.48 (±0.03) 0.48 (±0.04) 0.48 (±0.04) 0.74 0.52 0.09
Triceps (mm) 11.48 (±3.55) 11.49 (±4.17) 11.67 (±3.79) 0.99 0.50 0.61
Subscapular (mm) 7.39 (±2.55) 7.51 (±2.62) 8.02 (±4.06) 0.93 0.56 0.83
Suprailiac (mm) 8.37 (±4.99) 8.19 (±4.35) 7.84 (±3.14) 0.99 0.29 0.50
Sum of skinfolds (mm) 27.23 (±10.37) 27.19 (±10.23) 27.54 (±10.06) 0.98 0.34 0.60
7-11 years
N 102 123 40 265 164 82
Height (cm) 131.92 (±0.07) 132.60 (±0.08) 132.12 (±0.09) 0.49 0.511 0.270
Weight (kg) 30.71 (±6.24) 30.47 (±7) 32.3 (±7.98) 0.36 0.092 0.305
BMI (kg/m2) 17.51 (±2.43) 17.16 (±2.63) 18.33 (±3.25) 0.07 0.020 0.405
BMI z-score 0.66 (±0.95) 0.44 (±0.95) 0.92 (±1.18) 0.04 0.027 0.704
Waist C (cm) 59.88 (±5.99) 59.9 (±6.13) 62.38 (±7.95) 0.11 0.035 0.347
WHtR 0.45 (±0.03) 0.45 (±0.04) 0.47 (±0.05) 0.07 0.045 0.521
Triceps (mm) 15.59 (±6.96) 14.47 (±6.29) 16.49 (±8.45) 0.44 0.056 0.495
Subscapular (mm) 10.19 (±5.16) 9.67 (±5.54) 12.39 (±8.78) 0.18 0.015 0.560
Suprailiac (mm) 11.59 (±7.65) 11.19 (±7.54) 14.63 (±11.42) 0.32 0.087 0.292
Sum of skinfolds (mm) 37.37 (±18.74) 35.34 (±18.35) 43.52 (±27.49) 0.33 0.046 0.339
25
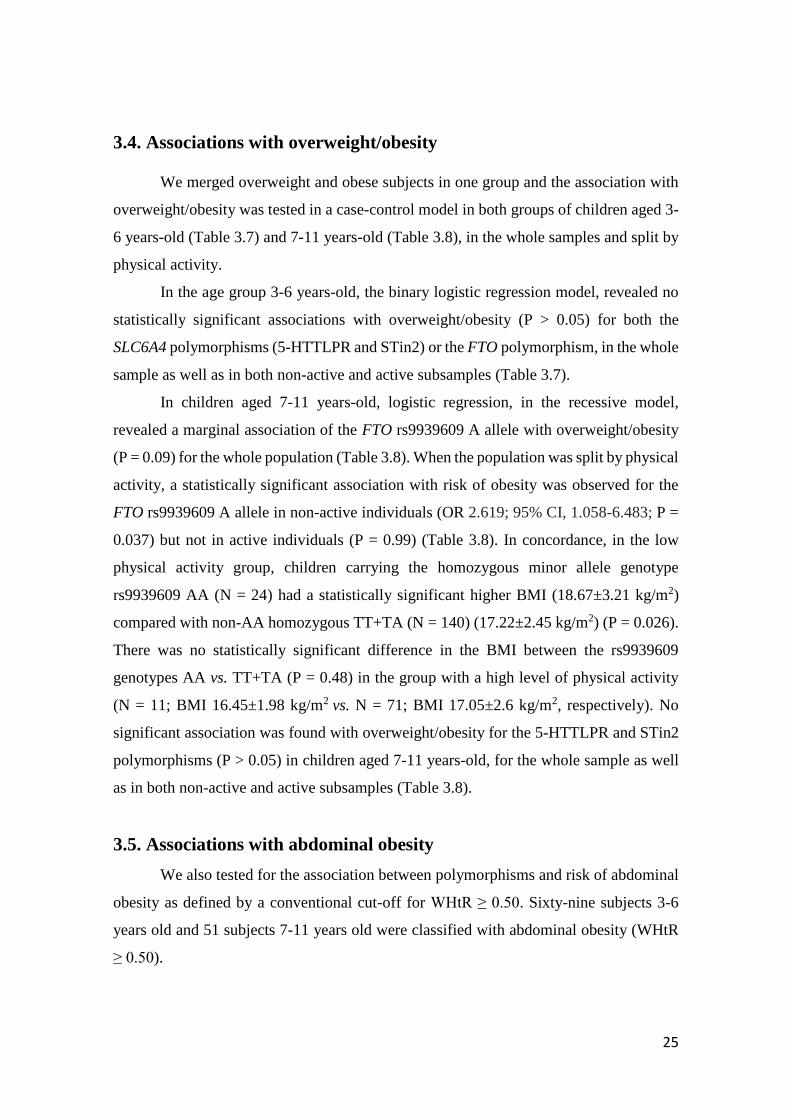
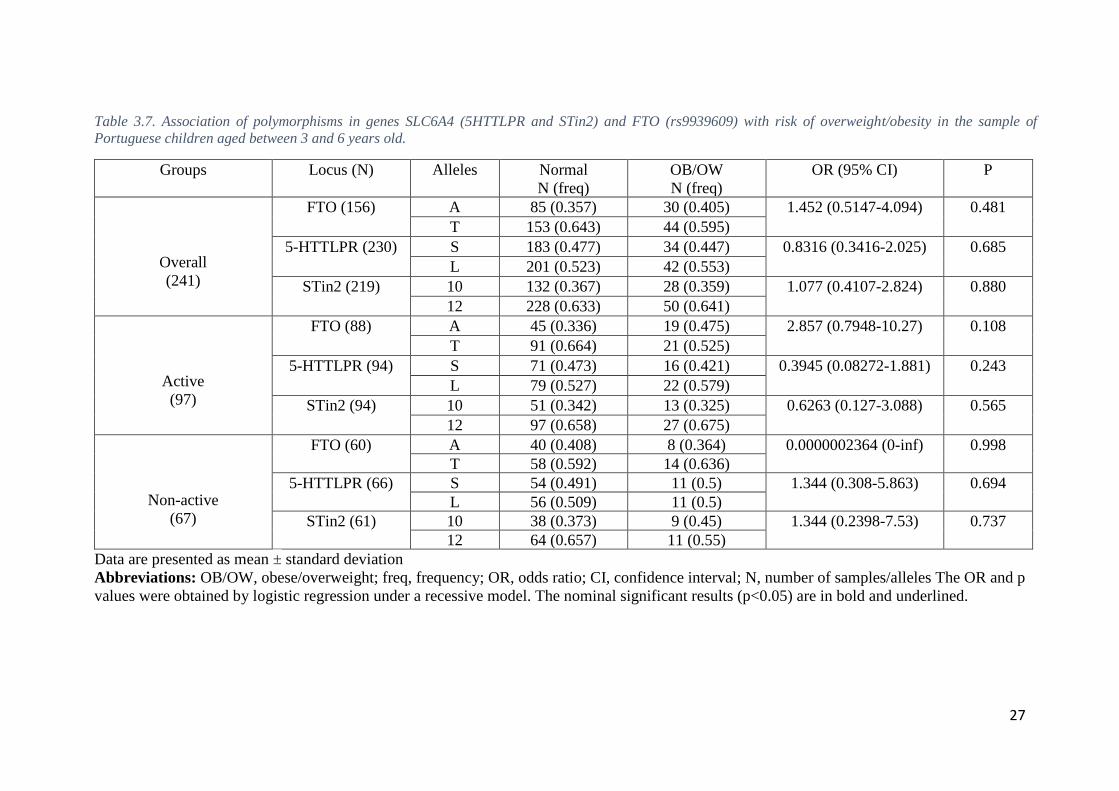
3.4. Associations with overweight/obesity
We merged overweight and obese subjects in one group and the association with
overweight/obesity was tested in a case-control model in both groups of children aged 3-
6 years-old (Table 3.7) and 7-11 years-old (Table 3.8), in the whole samples and split by
physical activity.
In the age group 3-6 years-old, the binary logistic regression model, revealed no
statistically significant associations with overweight/obesity (P > 0.05) for both the
SLC6A4 polymorphisms (5-HTTLPR and STin2) or the FTO polymorphism, in the whole
sample as well as in both non-active and active subsamples (Table 3.7).
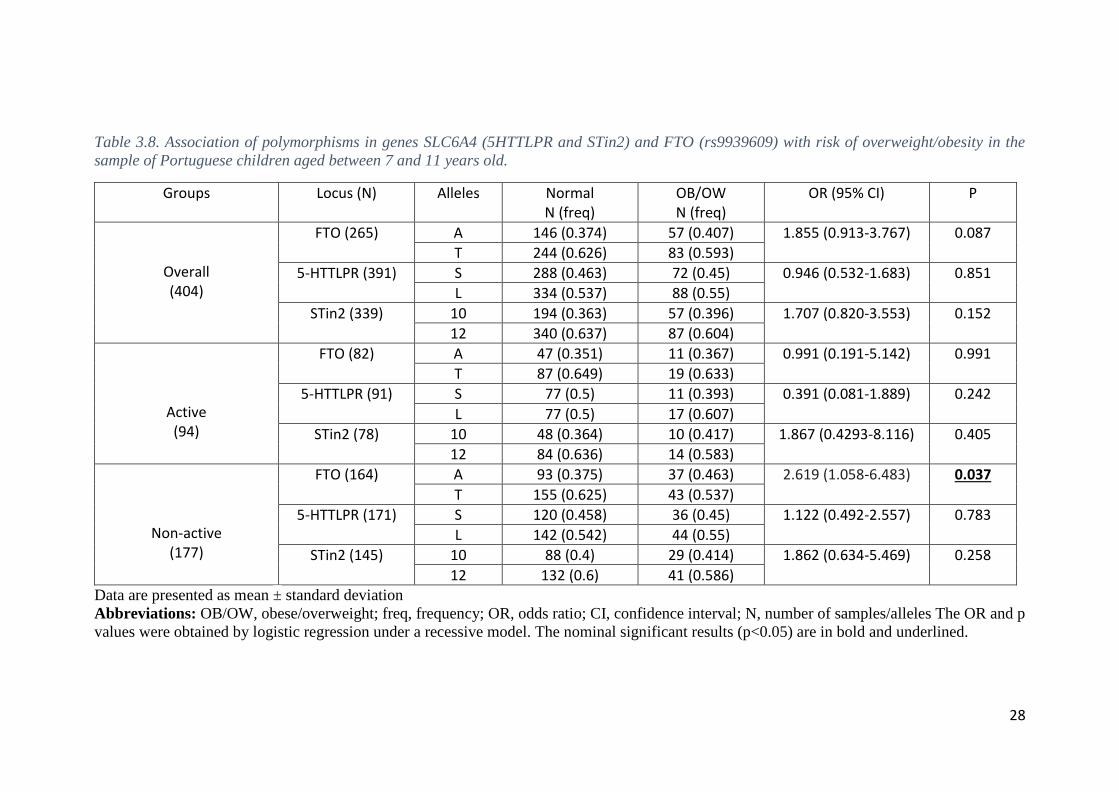
In children aged 7-11 years-old, logistic regression, in the recessive model,
revealed a marginal association of the FTO rs9939609 A allele with overweight/obesity
(P = 0.09) for the whole population (Table 3.8). When the population was split by physical
activity, a statistically significant association with risk of obesity was observed for the
FTO rs9939609 A allele in non-active individuals (OR 2.619; 95% CI, 1.058-6.483; P =
0.037) but not in active individuals (P = 0.99) (Table 3.8). In concordance, in the low
physical activity group, children carrying the homozygous minor allele genotype
rs9939609 AA (N = 24) had a statistically significant higher BMI (18.67±3.21 kg/m2)
compared with non-AA homozygous TT+TA (N = 140) (17.22±2.45 kg/m2) (P = 0.026).
There was no statistically significant difference in the BMI between the rs9939609
genotypes AA vs. TT+TA (P = 0.48) in the group with a high level of physical activity
(N = 11; BMI 16.45±1.98 kg/m2 vs. N = 71; BMI 17.05±2.6 kg/m2, respectively). No
significant association was found with overweight/obesity for the 5-HTTLPR and STin2
polymorphisms (P > 0.05) in children aged 7-11 years-old, for the whole sample as well
as in both non-active and active subsamples (Table 3.8).
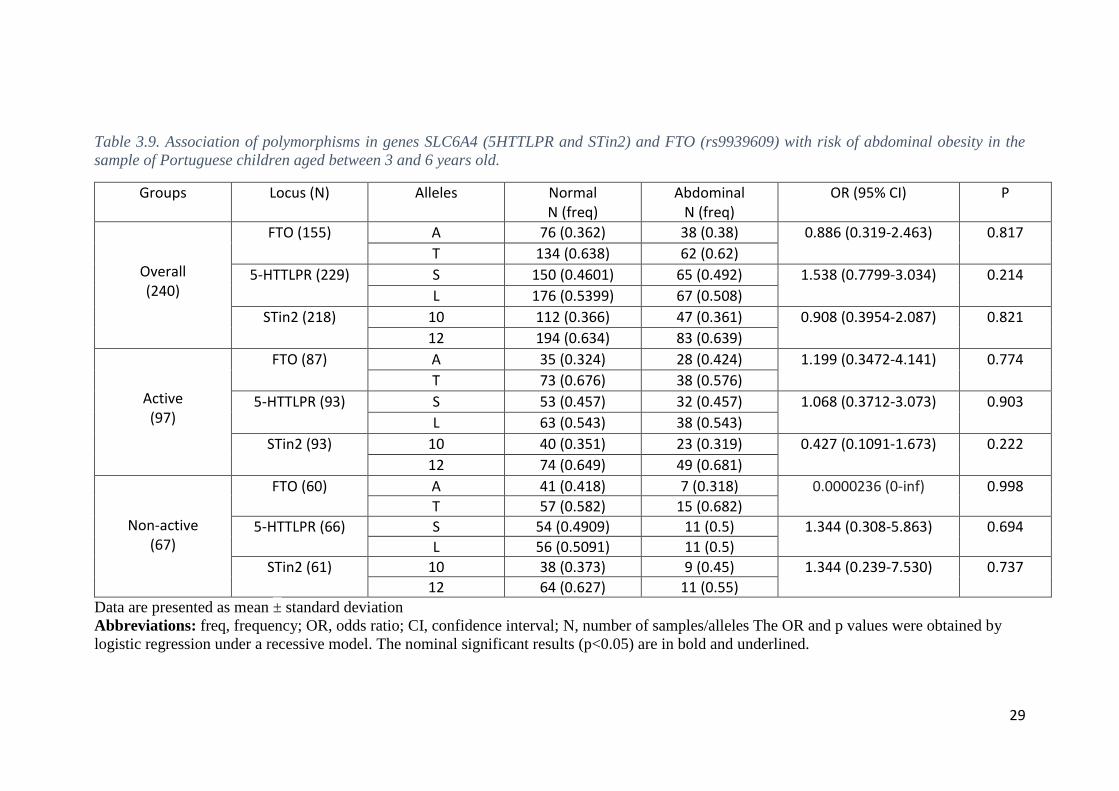
3.5. Associations with abdominal obesity
We also tested for the association between polymorphisms and risk of abdominal
obesity as defined by a conventional cut-off for WHtR ≥ 0.50. Sixty-nine subjects 3-6
years old and 51 subjects 7-11 years old were classified with abdominal obesity (WHtR
≥ 0.50).
26
Logistic regression showed no statistically significant associations (P > 0.05)
with abdominal obesity in children aged 3-6 years-old for any polymorphic site (Table
3.9).
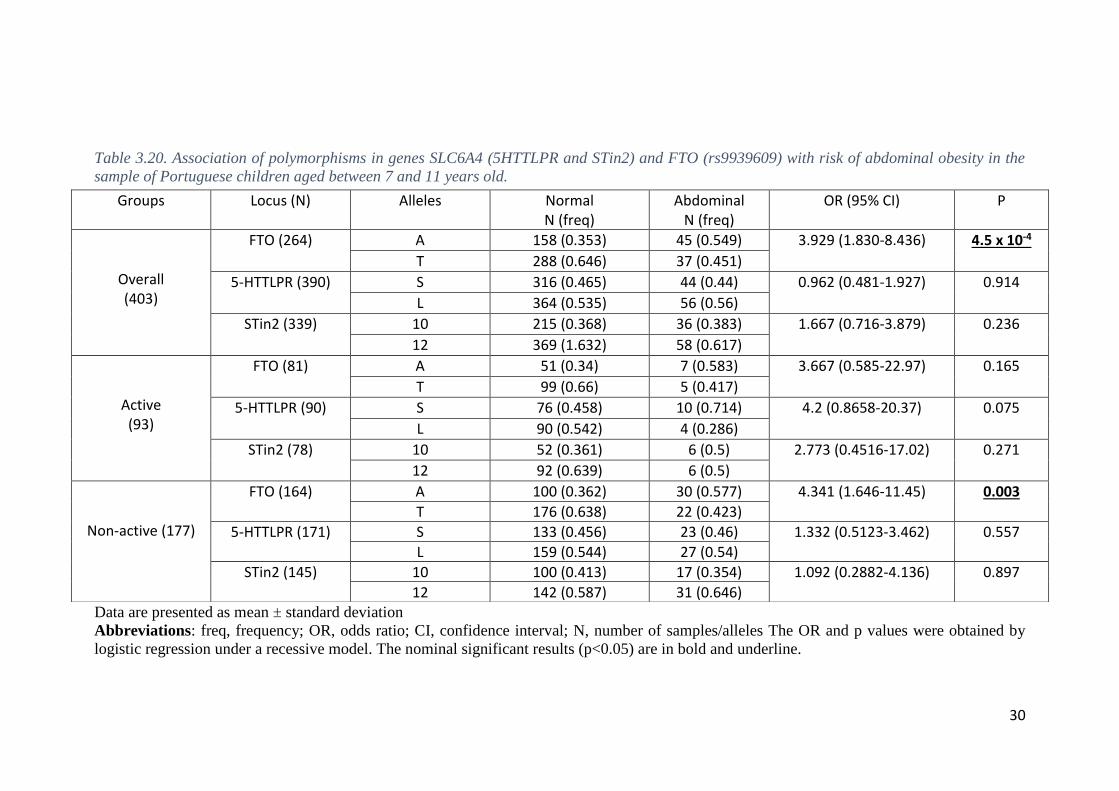
In children aged 7-11 years-old, a strong significant association with risk of
abdominal obesity was observed for the FTO rs9939609 A allele for the whole sample
(OR 3.93; 95% CI, 1.83-8.44; P = 4.5x10⁻⁴) (Table 3.10). When the sample was stratified
according physical activity, the statistically significant association was maintained in
non-active individuals (OR 4.341; 95% CI, 1.65-11.45; P = 0.003) but, in contrast, was
lost in physical active children (P = 0.165). No statistically significant association with
abdominal obesity was found for the SLC6A4 polymorphisms (5-HTTLPR and STin2) in
children aged 7-11 years old, for the whole sample as well as in both non-active and active
subsamples (Table 3.10).
27
Table 3.7. Association of polymorphisms in genes SLC6A4 (5HTTLPR and STin2) and FTO (rs9939609) with risk of overweight/obesity in the sample of
Portuguese children aged between 3 and 6 years old.
Groups Locus (N) Alleles Normal
N (freq)
OB/OW
N (freq)
OR (95% CI) P
Overall
(241)
FTO (156)
A 85 (0.357) 30 (0.405) 1.452 (0.5147-4.094) 0.481
T 153 (0.643) 44 (0.595)
5-HTTLPR (230)
S 183 (0.477) 34 (0.447) 0.8316 (0.3416-2.025) 0.685
L 201 (0.523) 42 (0.553)
STin2 (219) 10 132 (0.367) 28 (0.359) 1.077 (0.4107-2.824) 0.880
12 228 (0.633) 50 (0.641)
Active
(97)
FTO (88)
A 45 (0.336) 19 (0.475) 2.857 (0.7948-10.27) 0.108
T 91 (0.664) 21 (0.525)
5-HTTLPR (94)
S 71 (0.473) 16 (0.421) 0.3945 (0.08272-1.881) 0.243
L 79 (0.527) 22 (0.579)
STin2 (94) 10 51 (0.342) 13 (0.325) 0.6263 (0.127-3.088) 0.565
12 97 (0.658) 27 (0.675)
Non-active
(67)
FTO (60)
A 40 (0.408) 8 (0.364) 0.0000002364 (0-inf) 0.998
T 58 (0.592) 14 (0.636)
5-HTTLPR (66)
S 54 (0.491) 11 (0.5) 1.344 (0.308-5.863) 0.694
L 56 (0.509) 11 (0.5)
STin2 (61) 10 38 (0.373) 9 (0.45) 1.344 (0.2398-7.53) 0.737
12 64 (0.657) 11 (0.55)
Data are presented as mean ± standard deviation
Abbreviations: OB/OW, obese/overweight; freq, frequency; OR, odds ratio; CI, confidence interval; N, number of samples/alleles The OR and p
values were obtained by logistic regression under a recessive model. The nominal significant results (p<0.05) are in bold and underlined.
28
Table 3.8. Association of polymorphisms in genes SLC6A4 (5HTTLPR and STin2) and FTO (rs9939609) with risk of overweight/obesity in the
sample of Portuguese children aged between 7 and 11 years old.
Groups Locus (N) Alleles Normal N (freq)
OB/OW N (freq)
OR (95% CI) P
Overall (404)
FTO (265)
A 146 (0.374) 57 (0.407) 1.855 (0.913-3.767) 0.087
T 244 (0.626) 83 (0.593)
5-HTTLPR (391)
S 288 (0.463) 72 (0.45) 0.946 (0.532-1.683) 0.851
L 334 (0.537) 88 (0.55)
STin2 (339) 10 194 (0.363) 57 (0.396) 1.707 (0.820-3.553) 0.152
12 340 (0.637) 87 (0.604)
Active (94)
FTO (82)
A 47 (0.351) 11 (0.367) 0.991 (0.191-5.142) 0.991
T 87 (0.649) 19 (0.633)
5-HTTLPR (91)
S 77 (0.5) 11 (0.393) 0.391 (0.081-1.889) 0.242
L 77 (0.5) 17 (0.607)
STin2 (78) 10 48 (0.364) 10 (0.417) 1.867 (0.4293-8.116) 0.405
12 84 (0.636) 14 (0.583)
Non-active (177)
FTO (164)
A 93 (0.375) 37 (0.463) 2.619 (1.058-6.483) 0.037
T 155 (0.625) 43 (0.537)
5-HTTLPR (171)
S 120 (0.458) 36 (0.45) 1.122 (0.492-2.557) 0.783
L 142 (0.542) 44 (0.55)
STin2 (145) 10 88 (0.4) 29 (0.414) 1.862 (0.634-5.469) 0.258
12 132 (0.6) 41 (0.586) Data are presented as mean ± standard deviation
Abbreviations: OB/OW, obese/overweight; freq, frequency; OR, odds ratio; CI, confidence interval; N, number of samples/alleles The OR and p
values were obtained by logistic regression under a recessive model. The nominal significant results (p<0.05) are in bold and underlined.
29
Table 3.9. Association of polymorphisms in genes SLC6A4 (5HTTLPR and STin2) and FTO (rs9939609) with risk of abdominal obesity in the
sample of Portuguese children aged between 3 and 6 years old.
Groups Locus (N) Alleles Normal N (freq)
Abdominal N (freq)
OR (95% CI) P
Overall (240)
FTO (155)
A 76 (0.362) 38 (0.38) 0.886 (0.319-2.463) 0.817
T 134 (0.638) 62 (0.62)
5-HTTLPR (229)
S 150 (0.4601) 65 (0.492) 1.538 (0.7799-3.034) 0.214
L 176 (0.5399) 67 (0.508)
STin2 (218) 10 112 (0.366) 47 (0.361) 0.908 (0.3954-2.087) 0.821
12 194 (0.634) 83 (0.639)
Active (97)
FTO (87)
A 35 (0.324) 28 (0.424) 1.199 (0.3472-4.141) 0.774
T 73 (0.676) 38 (0.576)
5-HTTLPR (93)
S 53 (0.457) 32 (0.457) 1.068 (0.3712-3.073) 0.903
L 63 (0.543) 38 (0.543)
STin2 (93) 10 40 (0.351) 23 (0.319) 0.427 (0.1091-1.673) 0.222
12 74 (0.649) 49 (0.681)
Non-active (67)
FTO (60)
A 41 (0.418) 7 (0.318) 0.0000236 (0-inf) 0.998
T 57 (0.582) 15 (0.682)
5-HTTLPR (66)
S 54 (0.4909) 11 (0.5) 1.344 (0.308-5.863) 0.694
L 56 (0.5091) 11 (0.5)
STin2 (61) 10 38 (0.373) 9 (0.45) 1.344 (0.239-7.530) 0.737
12 64 (0.627) 11 (0.55) Data are presented as mean ± standard deviation
Abbreviations: freq, frequency; OR, odds ratio; CI, confidence interval; N, number of samples/alleles The OR and p values were obtained by
logistic regression under a recessive model. The nominal significant results (p<0.05) are in bold and underlined.
30
Table 3.20. Association of polymorphisms in genes SLC6A4 (5HTTLPR and STin2) and FTO (rs9939609) with risk of abdominal obesity in the
sample of Portuguese children aged between 7 and 11 years old.
Data are presented as mean ± standard deviation
Abbreviations: freq, frequency; OR, odds ratio; CI, confidence interval; N, number of samples/alleles The OR and p values were obtained by
logistic regression under a recessive model. The nominal significant results (p<0.05) are in bold and underline.
Groups Locus (N) Alleles Normal N (freq)
Abdominal N (freq)
OR (95% CI) P
Overall (403)
FTO (264)
A 158 (0.353) 45 (0.549) 3.929 (1.830-8.436) 4.5 x 10⁻⁴
T 288 (0.646) 37 (0.451)
5-HTTLPR (390)
S 316 (0.465) 44 (0.44) 0.962 (0.481-1.927) 0.914
L 364 (0.535) 56 (0.56)
STin2 (339) 10 215 (0.368) 36 (0.383) 1.667 (0.716-3.879) 0.236
12 369 (1.632) 58 (0.617)
Active (93)
FTO (81)
A 51 (0.34) 7 (0.583) 3.667 (0.585-22.97) 0.165
T 99 (0.66) 5 (0.417)
5-HTTLPR (90)
S 76 (0.458) 10 (0.714) 4.2 (0.8658-20.37) 0.075
L 90 (0.542) 4 (0.286)
STin2 (78) 10 52 (0.361) 6 (0.5) 2.773 (0.4516-17.02) 0.271
12 92 (0.639) 6 (0.5)
Non-active (177)
FTO (164)
A 100 (0.362) 30 (0.577) 4.341 (1.646-11.45) 0.003
T 176 (0.638) 22 (0.423)
5-HTTLPR (171)
S 133 (0.456) 23 (0.46) 1.332 (0.5123-3.462) 0.557
L 159 (0.544) 27 (0.54)
STin2 (145) 10 100 (0.413) 17 (0.354) 1.092 (0.2882-4.136) 0.897
12 142 (0.587) 31 (0.646)

4- Discussion

32
33
In this study we investigated in a sample of Portuguese children the possible
associations with several obesity-related parameters, the risk of overweight/obesity and
abdominal obesity for the FTO polymorphism rs9939609 and the two SLC6A4 variants 5-
HTTLPR and STin2. Moreover, we also tested for interaction effects between the study
polymorphisms and physical activity in relation to obesity.
4.1. SLC6A4 polymorphisms
For the 5-HTTLPR polymorphism, we found a statistically significant association
with two skinfold measurements (subscapular P = 0.02 and suprailiac P = 0.04) in children
aged 7-11 years-old. No other associations were found between 5-HTTLPR and the
remaining anthropometric variables in both age groups 3-6 years-old and 7-11 years-old.
Moreover, when tested for the association with overweight/obesity and risk of abdominal
obesity no significant results were found for 5-HTTLPR.
To our knowledge, this is the first study in Portuguese children testing for the possible
association of the 5-HTTLPR polymorphism with obesity. Previous works in children from
other populations, found that S allele carriers were associated with a higher risk of obesity.
A study by Sookoian et al. (2007) reported that Argentinean children/adolescents with the S
allele presented a greater risk of being obese/overweight, and a recent study by Miranda et
al. (2017) demonstrated that Brazilian children homozygotes (SS) had higher anthropometric
parameters and higher food intake than homozygous (LL).
Most association studies between 5-HTTLPR and obesity were conducted in adults
and found significant association between the S allele and obesity. A study by Iordanidou et
al. (2010) found that the 5-HTTLPR S allele was strongly associated with the presence of
T2D in Greeks independent of obesity status, but failed to demonstrate an association with
obesity. Other study of Sookoian et al. (2008) found an association between the S allele and
obesity in young adult men, similar to their previous work in children (Sookoian et al., 2007).
Another study in young adults, reported a strong association between the 5-HTTLPR S allele
and BMI (Fuemmeler et al., 2008). Furthermore, Lan et al (2009) demonstrated that the SS
genotype was associated with a significant increase in BMI and risk obesity in non-elderly,
but not in elderly patients with stroke. However, some studies found no such association
results between 5-HTTLPR and categories of BMI. Mergen et al. (2007) found no significant
association between the 5-HTTLPR and obesity in Turkish adults, and Hameed et al. (2015)
failed to find any association with T2D and obesity in the Pakistani population. On the other
34
hand, Bah et al. (2010) showed opposite results in significant associations, as they reported
homozygotes SS to be more frequent in underweight subjects. Also Peralta-leal et al. (2012)
showed a direct association between BMI and the L allele, similar to Borkowska et al. (2015)
that found the L allele associated with obesity in Polish adults. Interesting enough, in the
same work, they detect that the S allele was associated with the development of depressive
temperament. Finally, in a recent work conducted in Portuguese young adults, an association
between L-allele and risk of obesity was also found, but only in less active individuals (Dias
et al., 2016)
The association of 5-HTTLPR polymorphism with obesity has been largely
investigated because of its role in controlling serotonin transmission in regions of the brain
associated with mood regulation, ingestion of food, energy expenditure and weight
adjustment (Borkowska et al., 2015). Authors of the studies that found the L allele associated
with obesity, argue that the S allele is associated with higher availability of 5-HT in central
serotonergic synapses, which should intensify satiety, reducing food intake and inducing
lower BMI and fat mass (Peralta-leal et al., 2012).
For the STin2 polymorphism, located in the second intron of the SLC6A4 gene, the
present study reports no significant association with obesity-related quantitative traits, risk
of overweight/obesity or abdominal obesity in both age groups of children, even when
stratified by physically activity. Our study is the first to test for the possible association
between SLC6A4 STin2 polymorphism and obesity in Portuguese children. Only two studies
until now have tested this polymorphism for association with obesity, and none have used
children. Uzun et al. (2015) found no significant effects on Turkish adults. Dias et al. (2016)
found no significant association in a population sample of Portuguese young adults, but
when stratified by physical activity a significant association was observed between the STin2
10 allele and overweight/obesity in less active subjects.
When the study population was stratified by physical activity no significant
association results were found between the SLC6A4 polymorphisms (5-HTTLPR and
STin2) and obesity risk in non-active or active subjects in both children aged 3-6 years or 7-
11 years. Thus, our study revealed no interaction effects between physical activity and the
SLC6A4 polymorphisms (5-HTTLPR and STin2) on obesity risk, which is in contrast with
results obtained in Portuguese young adults where physical activity seems to accentuate the
influence of SLC6A4 polymorphisms on risk of obesity (Dias et al., 2016). However, no
other study conducted thus far assessed for interactions between SLC6A4 polymorphisms
35
and physical activity on obesity risk to allow for comparisons with data from other
populations.
4.2. FTO rs9939609 polymorphism
The FTO gene has been the focus of several studies, and its strong association with
obesity has been confirmed in European and other different populations (Albuquerque et al.,
2013; González-Sánchez et al., 2009; Hubacek et al., 2008; Loos & Yeo, 2014). In children
aged 7-11 years old, we have found significant association of the FTO SNP rs9939609 with
only one anthropometric measure (BMI Z-sore P = 0.04) for the whole group, in contrast
with a report of Albuquerque et al. (2013) that found associations with several obesity related
parameters in a previous study in Portuguese children. In contrast, a recent report in
Portuguese children showed that the FTO rs9939609 polymorphism has no effect, or
eventually a recessive very weak increasing on BMI z-score (Almeida et al., 2018).
Nevertheless, some studies in other populations have reported no association results between
FTO SNPs and obesity related quantitative traits (H. Li et al., 2008; Ohashi et al., 2007).
When testing for the risk of overweight/obesity in the whole sample, we found a
marginal association between the FTO polymorphism and overweight/obesity in children
aged 7-11 years-old (P = 0.087). Albuquerque et al. (2013) reported in Portuguese children
a significant association between the FTO rs9939609 AA genotype with obesity (P = 0.026)
but not with overweight. Similarly, previous studies performed in other European
populations reported the association of FTO rs9939609 A-allele with obesity (Dina et al.,
2007; Frayling et al., 2007; González-Sánchez et al., 2009; Scuteri et al., 2007).
The rs9939609 polymorphism is the most replicated polymorphism associated with
obesity across the world. We failed to find strong significant associations in our study
general population of children which could be due to the low statistical power (because of a
low sample size, low carrier cases frequency or small genetic effects).
4.3. Gene Vs. Physical Activity interaction
When the study population was stratified by physical activity, we found statistically
significant associations for several obesity-related traits in non-active individuals aged 7-11
years-old. Moreover, in the same age stratus, a statistically significant association was found
between rs9939609 and the risk of overweight/obesity (P = 0.037) as well as for BMI
between AA vs. TT+TA genotypes (P = 0.026). This provides evidence that physical
36
inactivity accentuates the influence of FTO gene on the risk of obesity, as described in
previous studies for adults and adolescents (Ahmad et al., 2013; Kilpeläinen et al., 2011;
Kim et al., 2016; S. Li et al., 2010; Muc et al., 2015). The meta-analysis by Kilpeläinen et
al. (2011) showed that the effect of FTO rs9939609 on BMI, waist circumference, body fat
percentage and obesity risk is approximately 30% lower in physically active than in
sedentary adults, but no such interaction was observed for children and adolescents. In a
previous study, Lee et al. (2010) showed that in a low physical activity subgroup of 7 to 10
years-old children of Korean ethnicity, rs9939609 A allele carriers had a higher BMI than
TT carriers (P=0.0147). Thus, to our knowledge, our study is the first clearly suggesting in
children of European ancestry an interaction effect between the FTO genotype and physical
activity on obesity.
4.4. Association with abdominal obesity
In our study we also tested association for the risk of abdominal obesity, which is
more strongly correlated with metabolic risk factors in children than BMI, as indicated by
higher value of WHtR (Khoury et al., 2013). We report a strong association between the
FTO SNP rs9939609 and risk of abdominal obesity (OR 3.93) in children aged 7-11 years-
old, and that the FTO influence on risk of abdominal obesity seems to increase in non-
physical active individuals (OR 4.341) as previous observed for obesity. However, to our
knowledge no other study conducted thus far assessed for associations between FTO
rs9939609 polymorphisms and risk of abdominal obesity.
4.5. Age-related associations
Interestingly, we noted that the associations between the FTO polymorphism and risk
of obesity changed across the two age groups. Several significant associations were found
in children aged 7-11 years-old in the non-active group (as well as a marginal association in
the whole population), while in children aged 3-6 years-old no such associations were found.
This age-dependent association was previously reported in a longitudinal study showing that
the association of FTO rs9939609 with BMI and weight increases during childhood up to
age 20 years and then weakened during later adulthood (Hardy et al., 2010). Also a study
revealed that the FTO genotype only influence BMI after the age of 7 years (Hakanen et
al., 2009). A recent study in Chinese individuals revealed that association between FTO
37
rs9939609 and obesity-related traits may change from childhood to adolescence, and the
association may start as early as age 12 years (Zhang et al., 2014).
Also, our results revealed that, at least in Portuguese children, the two SLC6A4
polymorphisms do not have the same effect on risk of obesity than in adults as reported in
Dias et al. (2016). This result could be related with age of individuals under study since the
5-HTTLPR effects in obesity have been previous described to be age dependent (Lan et al.,
2009).

38

5- Conclusion

40
41
Our results replicate, at least in non-active individuals, the well-known association,
both in children and adults, between the FTO rs9939609 polymorphism and obesity or
obesity-related parameters. We observed an interaction effect between the FTO gene and
physical activity in obesity, since genetic associations were observed in non-active but not
in active subjects. This result is in accordance with previous studies, both in children and
adults, suggesting that that moderate to vigorous physical activity attenuates the effect of
FTO genetic susceptibility to obesity.
We also observed that the FTO rs9939609 association with risk of obesity is age-
dependent. Children aged 7-11 years-old showed associations with risk of obesity,
abdominal obesity and several obesity related parameters, but such significant results were
not observed in children aged 3-6 years-old. Thus, our results suggest that the association
between FTO gene and obesity becomes evident only after 7 years-old, as observed in
previous studies.
It was not possible to replicate previous results in children regarding the association
of 5-HTTLPR polymorphism with risk of obesity. Possible explanations could be the low
statistical power, age differences on the analysed samples or ethnicity.
Although being a small population-based genetic association study, focusing only in
three candidate polymorphisms from two genes, we fell that our findings contribute to the
knowledge of the genetic obesity in Portuguese children, replicating previous data observed
in other European populations. Further research on the role of the SLC6A4 gene on obesity
risk, with longitudinal studies in children and considering the impact of environmental
factors such as physical activity should be improved.

42
6 - References
44
Adeyemo, A., Chen, G., Zhou, J., Shriner, D., Doumatey, A., Huang, H., & Rotimi, C. (2010). FTO genetic variation and association with obesity in West Africans and African Americans. Diabetes, 59(6), 1549–1554. https://doi.org/10.2337/db09-1252
Ahmad, S., Rukh, G., Varga, T. V., Ali, A., Kurbasic, A., Shungin, D., … Franks, P. W. (2013). Gene × Physical Activity Interactions in Obesity: Combined Analysis of 111,421 Individuals of European Ancestry. PLoS Genetics, 9(7), 1–9. https://doi.org/10.1371/journal.pgen.1003607
Albuquerque, D., Nóbrega, C., & Manco, L. (2013). Association of FTO Polymorphisms with Obesity and Obesity-Related Outcomes in Portuguese Children. PLoS ONE, 8(1). https://doi.org/10.1371/journal.pone.0054370
Albuquerque, D., Nóbrega, C., Manco, L., & Padez, C. (2017). The contribution of genetics and environment to obesity. British Medical Bulletin, 123(1), 159–173. https://doi.org/10.1093/bmb/ldx022
Almeida, S. M., Furtado, J. M., Mascarenhas, P., Ferraz, M. E., Ferreira, J. C., Monteiro, M. P., … Ferraz, F. P. (2018). Association between LEPR, FTO, MC4R, and PPARG-2 polymorphisms with obesity traits and metabolic phenotypes in school-aged children. Endocrine, 60(3), 466–478. https://doi.org/10.1007/s12020-018-1587-3
Andersen, L. B., Harro, M., Sardinha, L. B., Froberg, K., Ekelund, U., Brage, S., & Anderssen, S. A. (2006). Physical activity and clustered cardiovascular risk in children: a cross-sectional study (The European Youth Heart Study). Lancet (London, England), 368(9532), 299–304. https://doi.org/10.1016/S0140-6736(06)69075-2
Andreasen, C. H., Stender-Petersen, K. L., Mogensen, M. S., Torekov, S. S., Wegner, L., Andersen, G., … Hansen, T. (2008). Low physical activity accentuates the effect of the FTO rs9939609 polymorphism on body fat accumulation. Diabetes, 57(1), 95–101. https://doi.org/10.2337/db07-0910
Bah, J., Westberg, L., Baghaei, F., Henningsson, S., Rosmond, R., Melke, J., … Eriksson, E. (2010). Further exploration of the possible influence of polymorphisms in HTR2C and 5HTT on body weight. Metabolism: Clinical and Experimental, 59(8), 1156–1163. https://doi.org/10.1016/j.metabol.2009.11.007
Bonnet, G., Gómez-Abellán, P., Vera, B., Sánchez-Romera, J. F., Hernández-Martínez, A. M., Sookoian, S., … Garaulet, M. (2017). Serotonin-transporter promoter polymorphism modulates the ability to control food intake: Effect on total weight loss. Molecular Nutrition and Food Research, 61(11), 1–10. https://doi.org/10.1002/mnfr.201700494
Borkowska, A., Bieliåski, M., Szczęsny, W., Szwed, K., Tomaszewska, M., Kałwa, A., … Akiskal, H. (2015). Effect of the 5-HTTLPR polymorphism on affective temperament, depression and body mass index in obesity. Journal of Affective Disorders, 184, 193–197. https://doi.org/10.1016/j.jad.2015.05.061
Bringolf-Isler, B., Grize, L., Mäder, U., Ruch, N., Sennhauser, F. H., & Braun-Fahrländer, C. (2009). Assessment of intensity, prevalence and duration of everyday activities in Swiss school children: A cross-sectional analysis of accelerometer and diary data. International Journal of Behavioral Nutrition and Physical Activity, 6, 1–10. https://doi.org/10.1186/1479-5868-6-50
Calati, R., De Ronchi, D., Bellini, M., & Serretti, A. (2011). The 5-HTTLPR polymorphism and eating disorders: A meta-analysis. International Journal of Eating Disorders, 44(3), 191–199. https://doi.org/10.1002/eat.20811
Cha, S. W., Choi, S. M., Kim, K. S., Park, B. L., Kim, J. R., Kim, J. Y., & Shin, H. D. (2008).
45
Replication of genetic effects of FTO polymorphisms on BMI in a Korean population. Obesity (Silver Spring), 16(9), 2187–2189. https://doi.org/10.1038/oby.2008.314
Chang, Y. C., Liu, P. H., Lee, W. J., Chang, T. J., Jiang, Y. Der, Li, H. Y., … Chuang, L. M. (2008). Common variation in the fat mass and Obesity-Associated (FTO) gene confers risk of obesity and modulates BMI in the chinese population. Diabetes, 57(8), 2245–2252. https://doi.org/10.2337/db08-0377
Dias, H., Muc, M., Padez, C., & Manco, L. (2016). Association of polymorphisms in 5-HTT (SLC6A4) and MAOA genes with measures of obesity in young adults of Portuguese origin. Archives of Physiology and Biochemistry, 122(1), 8–13. https://doi.org/10.3109/13813455.2015.1111390
Dina, C., Meyre, D., Gallina, S., Durand, E., Körner, A., Jacobson, P., … Froguel, P. (2007). Variation in FTO contributes to childhood obesity and severe adult obesity. Nature Genetics, 39(6), 724–726. https://doi.org/10.1038/ng2048
Evenson, K. R., Catellier, D. J., Gill, K., Ondrak, K. S., & McMurray, R. G. (2008). Calibration of two objective measures of physical activity for children. Journal of Sports Sciences, 26(14), 1557–1565. https://doi.org/10.1080/02640410802334196
Ferreira Carlos, F., Silva-Nunes, J., Flores, O., Brito, M., Doria, G., Veiga, L., & Baptista, P. V. (2013). Association of FTO and PPARG polymorphisms with obesity in Portuguese women. Diabetes, Metabolic Syndrome and Obesity: Targets and Therapy, 6(July 2013), 241–245. https://doi.org/10.2147/DMSO.S45779
Fiskerstrand, C. E., Lovejoy, E. A., & Quinn, J. P. (1999). An intronic polymorphic domain often associated with susceptibility to affective disorders has allele dependent differential enhancer activity in embryonic stem cells. FEBS Letters, 458(2), 171–174. https://doi.org/10.1016/S0014-5793(99)01150-3
Frayling, T. M., Timpson, N. J., Weedon, M. N., Freathy, R. M., Lindgren, C. M., Perry, J. R. B., … Mccarthy, M. I. (2007). Index and Predisposes to Childhood and Adult Obesity. Science, 316(5826), 889–894. https://doi.org/10.1126/science.1141634.A
Fuemmeler, B. F., Agurs-collins, T., Mcclernon, F. J., Kollins, S. H., Kail, M., Bergen, A. W., & Ashley-koch, A. E. (2008). Obesity, 16(2), 348–355. https://doi.org/10.1038/oby.2007.65.Genes
Gelernter, J., Kranzler, H., & Cubells, J. F. (1997). Serotonin transporter protein (SLC6A4) allele and haplotype frequencies and linkage disequilibria in African- and European-American and Japanese populations and in alcohol-dependent subjects. Human Genetics, 101(2), 243–246. https://doi.org/10.1007/s004390050624
González-Sánchez, J. L., Zabena, C., Martínez-Larrad, M. T., Martínez-Calatrava, M. J., Pérez-Barba, M., & Serrano-Ríos, M. (2009). Variant rs9939609 in the FTO gene is associated with obesity in an adult population from Spain. Clinical Endocrinology, 70(3), 390–393. https://doi.org/10.1111/j.1365-2265.2008.03335.x
Grant, S. F. A., Li, M., Bradfield, J. P., Kim, C. E., Annaiah, K., Santa, E., … Hakonarson, H. (2008). Association analysis of the FTO gene with obesity in children of Caucasian and African ancestry reveals a common tagging SNP. PLoS ONE, 3(3), 1–6. https://doi.org/10.1371/journal.pone.0001746
Hakanen, M., Raitakari, O. T., Lehtima, T., Peltonen, N., Pahkala, K., & Lagstro, H. (2009). FTO Genotype Is Associated with Body Mass Index after the Age of Seven Years But Not with Energy Intake or Leisure-Time Physical Activity. The Journal of Clinical Endocrinology & Metabolism, 94(June), 1281–1287. https://doi.org/10.1210/jc.2008-1199
46
Hameed, A., Ajmal, M., Nasir, M., & Ismail, M. (2015). Genetic association analysis of serotonin transporter polymorphism (5-HTTLPR) with type 2 diabetes patients of Pakistani population. Diabetes Research and Clinical Practice, 108(1), 67–71. https://doi.org/10.1016/j.diabres.2015.01.009
Hardy, R., Wills, A. K., Wong, A., Elks, C. E., Wareham, N. J., Loos, R. J. F., … Ong, K. K. (2010). Life course variations in the associations between FTO and MC4R gene variants and body size. Human Molecular Genetics, 19(3), 545–552. https://doi.org/10.1093/hmg/ddp504
Hassanein, M. T., Lyon, H. N., Nguyen, T. T., Akylbekova, E. L., Waters, K., Lettre, G., … Hirschhorn, J. N. (2010). Fine mapping of the association with obesity at the FTO locus in African-derived populations. Human Molecular Genetics, 19(14), 2907–2916. https://doi.org/10.1093/hmg/ddq178
Hubacek, J. A., Bohuslavova, R., Kuthanova, L., Kubinova, R., Peasey, A., Pikhart, H., … Bobak, M. (2008). The FTO gene and obesity in a large eastern European population sample: The HAPIEE study. Obesity, 16(12), 2764–2766. https://doi.org/10.1038/oby.2008.421
Iordanidou, M., Tavridou, A., Petridis, I., Arvanitidis, K. I., Christakidis, D., Vargemezis, V., & Manolopoulos, V. G. (2010). The serotonin transporter promoter polymorphism ( 5-HTTLPR ) is associated with type 2 diabetes. Clinica Chimica Acta, 411(3–4), 167–171. https://doi.org/10.1016/j.cca.2009.10.022
Khoury, M., Manlhiot, C., Bs, C., & Mccrindle, B. W. (2013). Role of the Waist / Height Ratio in the Cardiometabolic Risk Assessment of Children Classified by Body Mass Index. Journal of the American College of Cardiology, 62(8), 742-751. https://doi.org/10.1016/j.jacc.2013.01.026
Kilpeläinen, T. O., Qi, L., Brage, S., Sharp, S. J., Sonestedt, E., Demerath, E., … Loos, R. J. F. (2011). Physical activity attenuates the influence of FTO variants on obesity risk: A meta-analysis of 218,166 adults and 19,268 children. PLoS Medicine, 8(11). https://doi.org/10.1371/journal.pmed.1001116
Kim, J. Y., DeMenna, J. T., Puppala, S., Chittoor, G., Schneider, J., Duggirala, R., … Coletta, D. K. (2016). Physical activity and FTO genotype by physical activity interactive influences on obesity. BMC Genetics, 17(1), 1–7. https://doi.org/10.1186/s12863-016-0357-6
Lan, M., Chang, Y., Chen, W., Kao, Y., Lin, H., & Liu, J. (2009). Serotonin transporter gene promoter polymorphism is associated with body mass index and obesity in non-elderly stroke patients. Journal of Endocrinological Investigation, 32, 119–122.
Lee, H. J., Kim, I. kyoung, Kang, J. H., Ahn, Y., Han, B. G., Lee, J. Y., & Song, J. (2010). Effects of common FTO gene variants associated with BMI on dietary intake and physical activity in Koreans. Clinica Chimica Acta, 411(21–22), 1716–1722. https://doi.org/10.1016/j.cca.2010.07.010
Leonska-Duniec, A., Jastrzebski, Z., Zarebska, A., Maciejewska, A., Ficek, K., & Cieszczyk, P. (2016). Assessing effect of interaction between the FTO A/T polymorphism (rs9939609) and physical activity on obesity-related traits. Journal of Sport and Health Science, (March), 6–11. https://doi.org/10.1016/j.jshs.2016.08.013
Lesch, K. P., Balling, U., Gross, J., Strauss, K., Wolozin, B. L., Murphy, D. L., & Riederer, P. (1994). Organization of the human serotonin transporter gene. Journal of Neural Transmission. General Section, 95(2), 157–162.
Li, H., Wu, Y., Loos, R. J., Hu, F. B., Liu, Y., Wang, J., … Lin, X. (2008). Variants in the fat
47
mass- and obesity-associated (FTO) gene are not associated with obesity in a Chinese Han population. Diabetes, 57(1), 264–268. https://doi.org/10.2337/db07-1130.H.L.
Li, S., Zhao, J. H., Luan, J., Ekelund, U., Luben, R. N., Khaw, K. T., … Loos, R. J. F. (2010). Physical activity attenuates the genetic predisposition to obesity in 20,000 men and women from EPIC-Norfolk prospective population study. PLoS Medicine, 7(8), 1–9. https://doi.org/10.1371/journal.pmed.1000332
Loos, R. J. F., & Yeo, G. S. H. (2014). The bigger picture of FTO - The first GWAS-identified obesity gene. Nature Reviews Endocrinology, 10(1), 51–61. https://doi.org/10.1038/nrendo2013227
Machado-Rodrigues, A. M., Coelho-E-Silva, M. J., Mota, J., Cumming, S. P., Riddoch, C., & Malina, R. M. (2011). Correlates of aerobic fitness in urban and rural Portuguese adolescents. Annals of Human Biology, 38(4), 479–484. https://doi.org/10.3109/03014460.2011.554865
Machado-Rodrigues, A. M., Coelho-E-Silva, M. J., Mota, J., Cyrino, E., Cumming, S. P., Riddoch, C., … Malina, R. M. (2011). Agreement in activity energy expenditure assessed by accelerometer and self-report in adolescents: Variation by sex, age, and weight status. Journal of Sports Sciences, 29(14), 1503–1514. https://doi.org/10.1080/02640414.2011.593185
Machado-Rodrigues, A. M., Coelho-E-Silva, M. J., Mota, J., Padez, C., Martins, R. A., Cumming, S. P., … Malina, R. M. (2014). Urban-rural contrasts in fitness, physical activity, and sedentary behaviour in adolescents. Health Promotion International, 29(1), 118–129. https://doi.org/10.1093/heapro/das054
MacKenzie, A., & Quinn, J. (1999). A serotonin transporter gene intron 2 polymorphic region, correlated with affective disorders, has allele-dependent differential enhancer-like properties in the mouse embryo. Proceedings of the National Academy of Sciences of the United States of America, 96(26), 15251–15255. https://doi.org/10.1073/pnas.96.26.15251
Mergen, H., Karaaslan, C., Mergen, M., Deniz Ozsoy, E., & Ozata, M. (2007). LEPR, ADBR3, IRS-1 and 5-HTT genes polymorphisms do not associate with obesity. Endocrine Journal, 54(1), 89–94. https://doi.org/10.1507/endocrj.K06-023
Miranda, R. C. K., Genro, J. P., Campagnolo, P. D. B., Mattevi, V. S., Vitolo, M. R., & Almeida, S. (2017). Biallelic and triallelic approaches of 5-HTTLPR polymorphism are associated with food intake and nutritional status in childhood. The Journal of Nutritional Biochemistry, 43, 47–52. https://doi.org/10.1016/j.jnutbio.2017.01.015
Muc, M., Padez, C., & Manco, L. (2015). Influence of physical activity on the association between the FTO variant rs9939609 and adiposity in young adults. American Journal of Human Biology, 27(5), 734–738. https://doi.org/10.1002/ajhb.22712
Must, A., & Anderson, S. E. (2006). Body mass index in children and adolescents: Considerations for population-based applications. International Journal of Obesity, 30(4), 590–594. https://doi.org/10.1038/sj.ijo.0803300
Ohashi, J., Naka, I., Kimura, R., Natsuhara, K., Yamauchi, T., Furusawa, T., … Ohtsuka, R. (2007). FTO polymorphisms in oceanic populations. Journal of Human Genetics, 52(12), 1031–1035. https://doi.org/10.1007/s10038-007-0198-2
Pate, R. R., Almeida, M. J., McIver, K. L., Pfeiffer, K. A., & Dowda, M. (2006). Validation and calibration of an accelerometer in preschool children. Obesity, 14(11), 2000–2006. https://doi.org/10.1038/oby.2006.234
Peralta-leal, V., Leal-ugarte, E., Meza-espinoza, J. P., Dávalos-rodríguez, I. P., Bocanegra-
48
alonso, A., Acosta-gonzález, R. I., … Durán-gonzález, J. (2012). Association of a serotonin transporter gene ( SLC6A4 ) 5-HTTLPR polymorphism with body mass index categories but not type 2 diabetes mellitus in Mexicans.Genetic Molecular Biology, 35(3), 589–593.
Pereira, P. de A., Alvim-Soares, A. M., Sandrim, V. C., Lanna, C. M. M., Souza-Costa, D. C., Belo, V. de A., … Miranda, D. M. de. (2016). Falta de associação entre o polimorfismo genético do FTO, AKT1 e AKTIP e o sobrepeso e a obesidade infantis. Jornal de Pediatria, 92(5), 521–527. https://doi.org/10.1016/j.jped.2015.12.007
Purcell, S., Neale, B., Todd-Brown, K., Thomas, L., Ferreira, M. A. R., Bender, D., … Sham, P. C. (2007). PLINK: A Tool Set for Whole-Genome Association and Population-Based Linkage Analyses. The American Journal of Human Genetics, 81(3), 559–575. https://doi.org/10.1086/519795
Rampersaud, E., Mitchell, B. D., Pollin, T. I., Fu, M., Shen, H., O’Connell, J. R., … Snitker, S. (2008). Physical activity and the association of common FTO gene variants with body mass index and obesity. Archives of Internal Medicine, 168(16), 1791–1797. https://doi.org/10.1001/archinte.168.16.1791
Riddoch, C. J., Andersen, L. B., Wedderkopp, N., Harro, M., Klasson-Heggebø, L., Sardinha, L. B., … Ekelund, U. (2004). Physical Activity Levels and Patterns of 9- and 15-yr-Old European Children. Medicine and Science in Sports and Exercise, 36(1), 86–92. https://doi.org/10.1249/01.MSS.0000106174.43932.92
Riddoch, C. J., Mattocks, C., Deere, K., Saunders, J., Kirkby, J., Tilling, K., … Ness, A. R. (2007). Objective measurement of levels and patterns of physical activity. Archives of Disease in Childhood, 92(11), 963–969. https://doi.org/10.1136/adc.2006.112136
Ruiz, J. R., Labayen, I., Ortega, F. B., Legry, V., Moreno, L. A., Dallongeville, J., … Meirhaeghe, A. (2010). Attenuation of the effect of the FTO rs9939609 polymorphism on total and central body fat by physical activity in adolescents: The HELENA study. Archives of Pediatrics and Adolescent Medicine, 164(4), 328–333. https://doi.org/10.1001/archpediatrics.2010.29
Sandholt, C. H., Hansen, T., & Pedersen, O. (2012). Beyond the fourth wave of genome-wide obesity association studies. Nutrition and Diabetes, 2(JULY), e37-10. https://doi.org/10.1038/nutd.2012.9
Scuteri, A., Sanna, S., Chen, W. M., Uda, M., Albai, G., Strait, J., … Abecasis, G. R. (2007). Genome-wide association scan shows genetic variants in the FTO gene are associated with obesity-related traits. PLoS Genetics, 3(7), 1200–1210. https://doi.org/10.1371/journal.pgen.0030115
Sookoian, S., Gemma, C., García, S. I., Gianotti, T. F., Dieuzeide, G., Roussos, A., … Pirola, C. J. (2007). Short allele of serotonin transporter gene promoter is a risk factor for obesity in adolescents. Obesity (Silver Spring, Md.), 15(2), 271–6. https://doi.org/10.1038/oby.2007.519
Sookoian, S., Gianotti, T. F., Gemma, C., Burguẽo, A., & Pirola, C. J. (2008). Contribution of the functional 5-HTTLPR variant of the SLC6A4 gene to obesity risk in male adults. Obesity (Silver Spring), 16(2), 488–491. https://doi.org/10.1038/oby.2007.64
Speliotes, E. K., Willer, C. J., Berndt, S. I., Monda, K. L., Thorleifsson, G., Jackson, A. U., … Kaakinen, M. (2010). Association analyses of 249,796 individuals reveal eighteen new loci associated with body mass index. Nature Genetics, 42(11), 937–948. https://doi.org/10.1038/ng.686.Association
Srivastava, A., Srivastava, N., & Mittal, B. (2016). Genetics of Obesity. Indian Journal of
49
Clinical Biochemistry, 31(4), 361–371. https://doi.org/10.1007/s12291-015-0541-x Tan, J. T., Dorajoo, R., Seielstad, M., Sim, X. L., Ong, R. T. H., Chia, K. S., … Tai, E. S. (2008).
FTO variants are associated with obesity in the chinese and malay populations in Singapore. Diabetes, 57(10), 2851–2857. https://doi.org/10.2337/db08-0214
Troiano, R. P., Berrigan, D., Dodd, K. W., Mâsse, L. C., Tilert, T., & Mcdowell, M. (2008). Physical activity in the United States measured by accelerometer. Medicine and Science in Sports and Exercise, 40(1), 181–188. https://doi.org/10.1249/mss.0b013e31815a51b3
Tung, Y. C. L., & Yeo, G. S. H. (2011). From GWAS to biology: Lessons from FTO. Annals of the New York Academy of Sciences, 1220(1), 162–171. https://doi.org/10.1111/j.1749-6632.2010.05903.x
Uzun, M., Saglar, E., Kucukyildirim, S., Erdem, B., Unlu, H., & Mergen, H. (2015). Association of VNTR polymorphisms in DRD4, 5-HTT and DAT1 genes with obesity. Archives of Physiology and Biochemistry, 121(2), 75–79. https://doi.org/10.3109/13813455.2014.985686
Wen, W., Cho, Y. S., Zheng, W., Dorajoo, R., Kato, N., Qi, L., … Okada, Y. (2012). Meta-analysis identifies common variants associated with body mass index in East Asians. Nature Genet, 44(3), 307–311. https://doi.org/10.1038/ng.1087.Meta-analysis
Xi, B., Wang, C., Wu, L., Zhang, M., Shen, Y., Zhao, X., … Mi, J. (2011). Influence of physical inactivity on associations between single nucleotide polymorphisms and genetic predisposition to childhood obesity. American Journal of Epidemiology, 173(11), 1256–1262. https://doi.org/10.1093/aje/kwr008
Xia, Q., & Grant, S. F. A. (2013). The genetics of human obesity. Annals of the New York Academy of Sciences, 1281(1), 178–190. https://doi.org/10.1111/nyas.12020
Yoo, E. G. (2016). Waist-to-height ratio as a screening tool for obesity and cardiometabolic risk. Korean Journal of Pediatrics, 59(11), 425–431. https://doi.org/10.3345/kjp.2016.59.11.425
Zhang, M., Zhao, X., Cheng, H., Wang, L., Xi, B., Shen, Y., … Mi, J. (2014). Age- and sex-dependent association between FTO rs9939609 and obesity-related traits in Chinese children and adolescents. PLoS ONE, 9(5). https://doi.org/10.1371/journal.pone.0097545


![Referências Bibliográficas - dbd.puc-rio.br · Referências Bibliográficas. 89 [Narayanan96] NARAYANAN, A.; MOORE, M.. Quantum inspired genetic algorithms. In: INTERNATIONAL](https://img.document.onl/doc/110x75/5c5f4b5609d3f210748b4851/referencias-bibliogracas-dbdpuc-riobr-referencias-bibliogracas.jpg)