Embed Size (px)
Citation preview

MICAELA MARGARIDA FERREIRA DE SOUSA
A STUDY ON HISTORICAL DYES USED IN
TEXTILES: DRAGON’S BLOOD, INDIGO AND MAUVE
Dissertação apresentada para obtenção do Grau
de Doutor em Conservação e Restauro, especialidade
Ciências da Conservação, pela Universidade Nova de
Lisboa, Faculdade de Ciências e Tecnologia.
LISBOA
2008

ii
Acknowledgments
I would like to thank my supervisors Prof. Maria João Melo (Faculdade de Ciências e
Tecnologia – Universidade Nova de Lisboa: FCT-UNL) and Prof. Joaquim Marçalo (Instituto
Técnológico e Nuclear: ITN) for giving me the opportunity to participate in the project: “The
Molecules of Colour in Art: a photochemical study” as well as the general supervision of my
PhD project. I’m also grateful to Prof. Sérgio Seixas de Melo (Universidade de Coimbra: UC),
the project coordinator.
I would also like to thank all the people involved in this PhD project: Prof. Jorge Parola (FCT-
UNL) for the RMN analysis, supervision of indigo work in homogeneous media and
supervision of mauve counter ions analysis; Prof. Fernando Pina (FCT-UNL) for the
supervision on the dragon’s blood flavylium characterization; Prof. Conceição Oliveira
(Instituto Superior Técnico: IST) for her help in the MS measurements; researcher Catarina
Miguel (FCT-UNL) for validating and obtaining some indigo photodegradation results on
homogeneous media; master student Isa Rodrigues(FCT-UNL) for the HPLC-DAD analysis
on the Andean Paracas textiles; Prof. Fernando Catarino (Faculty of Sciences – University of
Lisbon: FC-UL) for the dragon’s blood resins botanical details and Prof. João Lopes
(University of Porto: UP) for the dragon’s blood PCA analysis.
Moreover I’m grateful to all the people and institutions that sent samples of the different
organic dyes analysis: a) Dragon’s blood samples: the botanical garden of Lisbon, the
botanical garden of Ajuda, to Roberto Jardim, director of the botanical garden of Madeira, to
the Natural Park of Madeira for the Dracaena draco samples and Prof. J. Pavlis for the
Dracaena cinnabari samples. I also would like to thank Dr. Anita Quye for the dragon’s blood
samples and Ms H. Chantre for the Cape Verde species. I am grateful to Frances Cook
(Royal Botanic Gardes: RBG, Kew) who helped in the sampling of dragon’s blood EBC,
collection and also for her valuable comments. B) Mauve dye samples: Perth Museum
(Scotland), Museum of Science and Industry in Manchester, Columbia University, New York
City, and the Science Museum, London, for the samples. I also would like to thank to P.J.
Morris (Science Museum) responsible for sending all the mauve samples and for his valuable
comments. Also I’m grateful to Prof. Anthony Travis (Sidney M. Edelstein Center for the
History and Philisophy of Science) and Prof. Henry Rzepa (Imperial College) who were very
helpful in the discussion of the mauve dye results.
I also would like to thank to my PhD colleagues who have been my partners on this journey
with exchange of ideas, knowledge and discussions. I am also grateful to the DCR “staff” as
Ana Maria and Márcia Vilarigues for all the support.
Finally I’m grateful to POCI (POCI/QUI/55672/2004 and PTDC/EAT/65445/2006), FCT and
FEDER for further funding.

iii
Resumo
Nesta tese de doutoramento foram estudados três corantes históricos a nível molecular
nomeadamente o índigo, um corante milenar utilizado desde a altura dos egípcios e dos
romanos; o sangue de dragão, uma resina vermelha utilizada por diversas culturas com
variados fins artísticos e medicinais e o corante sintético malva que revolucionou toda a
história da química e indústria da cor. Com este estudo pretende-se obter uma melhor
conservação e valorização do património cultural, nomeadamente de têxteis.
Flavílios naturais foram redescobertos como cromóforos responsáveis pela cor vermelha
das resinas sangue de dragão. O cloreto de 7,4’-dihidroxi-5-metilflavílio (dracoflavílio) foi
pela primeira vez identificado e caracterizado por HPLC-DAD-MS e RMN em resinas
provenientes de dragoeiros Dracaena draco, enquanto que o cloreto de 7,4’-dihidroxiflavílio
foi identificado pela primeira vez em resinas dos dragoeiros Dracaena cinnabari. Mais de 50
resinas sangue de dragão de proveniência conhecida e identificada por especialistas foram
analisadas por HPLC-DAD seleccionando-se o 7,6-dihidroxi-5-metilflavílio (dracorodin), o
cloreto de 7,4’-dihidroxi-5-metilflavílio (dracoflavílio) e o cloreto de 7,4’-dihidroxiflavílio como
marcadores de espécie para resinas obtidas a partir do Daemonorops spp., Dracaena draco
e Dracaena cinnabari, respectivamente. Este método foi aplicado com sucesso na
identificação de resinas colhidas no século XIX pertencente ao Royal Botanic Garden, Kew
(uma colaboração com o Royal Botanic Garden, Kew).
A caracterização da rede complexa de reacções químicas em solução aquosa destes
flavílios, para condições ácidas ou ligeiramente ácidas revelaram que a principal espécie em
equilíbrio a pH 4-6, para o dracoflavílio e a dracordina, é a base vermelha quinoidal (A).
A fotodegradação do índigo e um derivado do índigo solúvel em água (índigo carmim) foi
realizada em meio líquido e no estado sólido. Foram obtidos os rendimentos de
fotodegradação com irradiação cromática a 335nm e 610 nm. A isatina foi o principal
produto de degradação identificado por HPLC-DAD-MS para o índigo, enquanto que o
índigo carmin revelou a presença de isatina sulfonada. Os resultados obtidos foram
confirmados com a análise dos corantes azuis de têxteis milenários da cultura Pré-
Colombiana de Paracas (uma colaboração com o Museu of Fine Arts, Boston).
A caracterização da malva por HPLC-DAD-MS e por RMN revelou que contrariamente ao
descrito na literatura, a malva é uma mistura complexa constituída por cerca de 13
cromóforos roxos. Da análise de amostras históricas de malva, foi possível verificar que a
malva original feita nos primeiros anos de 1856-57 por Perkin, existe apenas em têxteis
históricos. Os sais históricos, incluindo a amostra exposta no Museu Científico de Londres
como “a malva original realizada por William Perkin em 1856” foram sintetizados depois de
1862 (uma colaboração com o Science Museum, Londres).

iv
Abstract
A characterization at the molecular level of three important historic dyes was undertaken: the
most popular blue in the history of humankind, indigo, one the most ancient red resins,
dragon’s blood, and the first synthetic dye with high commercial value, mauve. The
molecular studies evolved along two axes: the characterization of relevant chromophores for
mauve and dragon's blood resins and the study of indigo photochemistry.
Natural flavylium compounds were rediscovered as the chromophores responsible for the
red colour in dragon's blood resins. 7,4’-dihydroxy-5-methoxyflavylium (dracoflavylium) was
for the first time identified in samples of the resin dragon’s blood, extracted from the tree
Dracaena draco. Also, 7,4’-dihydroxyflavylium was identified for the first time as the red
natural flavylium in Dracaena cinnabari species. Following these results, the use of flavylium
compounds as markers to identify the species source of dragon’s blood resins is proposed.
This method was built-up on the analyses of more than 50 resin samples from different trees,
and further successfully tested on 19th century Kew Gardens collection (in a collaboration
with Kew Gardens, Kew). Moreover, the complex network of reversible chemical reactions, at
acidic or slightly basic conditions, that dracoflavylium undergoes in aqueous solution is
described, and it is concluded that the red colour of these resins is due to the stable quinoid
base, which is the major species in the pH range 4-6.
The photodegradation of indigo and its water-soluble derivative indigo carmine was carried
out in liquid and organized media. Photodegradation quantum yields were obtained for
monochromatic irradiation at 335 nm and 610 nm; the main photodegradation product was
identified by HPLC-DAD-MS as being isatin for indigo. The stability of indigo and the
mechanisms of degradation are discussed and compared to what was observed in millenary
Paracas textiles (in a collaboration with Museum of Fine Arts, Boston).
The characterization of mauve revealed that, contrarily to what is reported in the literature,
the dye is a complex mixture of at least 13 chromophores with the 7-amino-5-phenyl-3-
(phenylamino)phenazin-5-ium core. From the analysis of historic mauve samples it was
possible to verify that the “original mauve”, made in the early years of 1856-7 by Perkin,
exists in historic textile samples. The historic salt samples analysed, including the one
displayed in the Science Museum of London as the “original mauve performed by William
Perkin in 1856”, were found to be later than 1862 (in a collaboration with Science Museum,
London).

v
Symbols and Notations
A Quinoid base species
A- Quinoid base ionized species
AH+ Flavylium cation species
B Hemiacetal species
C0 Summation of the concentration of all flavylium species at the equilibrium
Cc Cis-chalcone species
Cc- Cis-chalcone ionized species
Ct Trans-chalcone species
Ct- Trans-chalcone ionized species
Ka1 Equilibrium constant of flavylium deprotonation leading to the quinoid base (A)
species
Ka2 Equilibrium constant of quinoid base deprotonation leading to the ionized
quinoid base (A-) species
Kh Equilibrium constant of flavylium hydration leading to the hemiacetal (B)
species
Ki Equilibrium constant of cis-trans isomerisation to form the chalcone species
Kt Equilibrium constant of tautomerisation reaction to form the chalcone
species(Cc)
ε Molar absorptivity coefficient
HPLC-DAD High performance liquid chromatography – diode array detector
rt Retention time
λmax Maximum wavelength absorption in the ultraviolet-visible spectra
hν Light
I0 intensity of the incident light
Iabs total light absorbed
IC-AEC Ion chromatography – anion exchange chromatography
ICP-AES Inductively coupled plasma – atomic emission spectrometry
kic Rate constant of internal conversion deactivation
kisc Rate constant of intersystem crossing deactivation
kf Rate constant of fluorescence deactivation
kp Rate constant of phosphorescence deactivation

vi
MS Mass spectrometry
FD-MS Field-desorption mass spectra
HRMS High-resolution mass spectra
LC-MS Liquid chromatography –Mass spectrometry
NMR Nuclear Magnetic resonance
1H NMR Proton Nuclear Magnetic resonance
13C NMR Carbon 13 Nuclear Magnetic resonance
COSY Correlation spectroscopy
HMBC Heteronuclear Multiple Bond Correlation
HMQC Heteronuclear Multiple Quantum Coherence
HSQC Heteronuclear Single Quantum Coherence
NOESY Nuclear Overhauser effect spectroscopy
δ Chemical shift
PCA Principal component analysis
ΦR Quantum yield of reaction
S0 Singlet state
S1 Excited ground state
sp. One species
spp. More than one species
TIC Total ion chromatogram (MS)
UV-Vis Ultraviolet-visible spectroscopy
Vsol Solution volume

vii
Index of contents
General Introduction - Molecular and photochemical studies on historical dyes:
dragon’s blood, indigo and mauve
1
1. Preamble 1
2. Chromophores characterization 1
3. Photophysical characterization 2
4. Photochemical characterization 4
Chapter 1 - Dragon’s Blood 5
1.1 Overview 5
1.1.1 Dracaenacea 6
1.1.2 Palmae 8
1.1.3 Euphorbiaceae 9
1.1.4 Others 9
1.2 Chemical composition – The red colourants beyond 10
1.3 Results 13
1.3.1 Dragon’s blood resins data library 13
1.3.2 Flavylium markers identification 14
1.3.2.1 Dracaena draco: 7,4’-dihydroxy-5-methoxyflavylium 16
1.3.2.2 Dracaena cinnabari: 7,4’-dihydroxyflavylium 16
1.3.2.3 Daemonorops draco: 7-hydroxy-5-methoxy-6-methylflavylium 17
1.3.3 The Economic Botany Collections at the Royal Botanic Gardens (EBC,
RBG) – Kew
17
1.3.3.1 Daemonorops draco (synonym, Daemonorops propinqua) and
Daemonorops sp.
18
1.3.3.2 Dracaena cinnabari, Dracaena ombet (synonym D. schizantha) and
Dracaena sp.
20
1.3.3.3 Dracaena draco 24
1.3.4 Flavylium markers characterization 27
1.3.4.1 Flavylium chemical reactions network – the dragon’s blood red
colour
27
1.3.4.1.1 Dracoflavylium 28
1.3.4.1.2 Dracorhodin and 7,4’-dihydroxyflavylium 29
1.4 Conclusions 30

viii
Chapter 2 - Indigo Dye 32
2.1 Overview 32
2.2 Chemical composition – revealing the blue colour 32
2.3. Indigo photodegradation 33
2.4 Results 35
2.4.1 Monochromatic irradiation in homogeneous media 36
2.4.1.1 Indigo in DMF 36
2.4.1.2 Indigo carmine in DMF and water 38
2.4.2 Monochromatic irradiation in heterogeneous media 39
2.4.3 Polychromatic irradiation in heterogeneous media 41
2.4.4 Characterization of the degradation products in Andean millenary textiles 42
2.5 Conclusions 44
Chapter 3 - Mauve Dye 45
3.1 Overview 45
3.2. Chemical composition – pursuing a perfect colour 47
3.3 Results 50
3.3.1 Syntheses 50
3.3.2 Original samples 53
3.3.2.1 Original mauve textile samples 53
3.3.2.1.1 Group I - Perth, Science Museum F5 and F6 55
3.3.2.1.2 Group II - ScMF1, F2, F3 and F4 56
3.3.2.2 Original mauve salt samples 57
3.3.2.2.1 Science Museum 1, Chandler Museum and Science
Museum 3
58
3.3.2.2.2 Museum SI Manchester 1, Science Museum 4 and Science
Museum 2
59
3.3.2.2.3 Museum SI Manchester 2 and JCE 1926 60
3.3.3. Accelerated aging study 61
3.3.3.1 Mauve dyed textile reconstruction 61
3.3.3.2 Mauve dyed historic textiles 62
3.4 Conclusions 62
General Conclusion 64
References and notes 66

ix
Appendix I – Experimental section 74
I.1 General 74
I.2 Instrumentation 74
I.2.1 HPLC-DAD 74
I.2.2 LC-MS 76
I.2.3 MS 77
I.2.4 NMR spectroscopy 77
I.2.5 IC-AEC 77
I.2.6 ICP-AES 78
I.2.7 Optical Microscopic 78
I.2.8 Monochromatic irradiation 78
I.2.9 Solar Box Camera 78
I.2.10 UV/Vis spectra 78
I.2.11 Colorimeter 78
I.3 Methods 79
I.3.1 Dragon’s Blood 79
I.3.1.1 Resin samples 79
I.3.1.2 Collection/sampling of resin samples 87
I.3.1.3 Extraction of the dragon’s blood dye chromophores, purification and
characterization of the natural flavylium markers
88
I.3.1.4 PCA analysis 89
I.3.1.5 Characterization of the flavylium compounds network chemical
reactions
89
I.3.2 Indigo 89
1.3.2.1 Actinometry 89
I.3.2.2 Homogeneous media –monochromatic irradiation 91
I.3.2.2.1 Quantum yield 91
I.3.2.3 Heterogeneous media –monochromatic irradiation 92
I.3.2.3.1 Quantum yield 92
I.3.2.4. Heterogeneous media - polychromatic irradiation 93
I.3.2.5 Indigo photodegradation HPLC-DAD calibration curves 93
I.3.2.6 Andean indigo dyed fibres extraction 93
I.3.3 Mauve dye 94
I.3.3.1 Synthesis 94
I. 3.3.2 Mauve dye sources 94
I.3.3.3 Extraction and characterization of the mauve dye 98
I.3.3.4 Mordant analysis 100
I.3.3.5 Polychromatic irradiation 101

x
I.4 References 101
Appendix II – Dragon’s blood data 102
II.1 NMR and MS characterization 102
II.1.1 Dracoflavylium 102
II.1.2 Dracorhodin 103
II.1.3 7,4’-dihydroxyflavylium 104
II.2 PCA analysis 105
II.3 Network of Chemical reactions 107
II.3.1 Dracoflavylium 107
II.3.1 A- concentration in the equilibrium 108
II.3.2 Dracorhodin and 7,4’-dihydroxyflavylium 109
II.4 References 109
Appendix III – Indigo dye data 110
III.1 I0 and photodegradation quantum yields 110
III.2 Indigo photodegradation calibration curves HPLC-DAD 111
III.3 HPLC-DAD characterization 112
III.3.1 Indigo dye 112
III.3.2 Indigo carmine 112
III.4 Solar Box exposure 113
III.5 Indigo Andean Textiles 113
III.6 References 114
Appendix IV – Mauve dye data 115
IV.1 Synthesis – Stoichiometries of the mauveine chromophores 115
IV.1.1 Formation of Mauveine A 115
IV.1.2 Formation of Mauveine B 116
IV.1.3 Formation of Pseudo-mauveine 117
IV.2 Mauve dye summarized characterization 119
IV.3 HPLC-DAD/LC-MS characterization 120
IV.3.1 Mauve dyed textiles 120
IV.3.2 Mauve salts 124
IV.3.3 Mauve from other sources: mauve-dyed textiles 125
IV.4 NMR characterization (structure elucidation) 126
IV.4.1 Mauveine B2 126
IV.4.2 Mauveine C 127
IV.4.3 Pseudo-mauveine 128

xi
IV.4.4 Mauveine C25a 129
IV.4.5 Mauveine C25b 130
IV.5 ICP-AES characterization of the mordents from mauve dyed textiles 131
IV.6 Anion exchange chromatography of counter ions from mauve salts 131
IV.7 Heterogeneous media - polychromatic irradiation 133
IV.8 References 133

xii
Index of figures
Chapter 1
Figure 1.1- Possible de-excitation pathways of excited molecules 2
Figure 1.2 - Adapted Jablonski scheme 3
Figure 1.3– a) Resin from Dracaena draco tree; b) Resin from Daemonorops micrantha
(Griff.) Becc palm
6
Figure 1.4 – Dracaena cinnabari Balf, Socotra 6
Figure 1.5 – Dracaena serrulata Baker 6
Figure 1.6 – Dracaena ombet Kotschy & Peyr 7
Figure 1.7 – Dracaena draco L., Lisbon 7
Figure 1.8 – Dracaena draco L., Icod 8
Figure 1.9 – Daemonorops draco sp. 9
Figure 1.10 – Croton lechleri 9
Figure 1.11- Pterocarpus oficinallis 10
Figure 1.12- Dracaena cochinchinensis (Lour.) 10
Figure 1.13 – Chemical structure of anthocyanins 11
Figure 1.14 – Network of chemical reactions for 7,4’-dihydroxy-5-methoxyflavylium 12
Figure 1.15 – PCA analysis of Dracaena draco, Dracaena cinnabari and Daemonorops
draco HPLC data library chromatograms
16
Figure 1.16 – PCA analysis of Dracaena draco, Dracaena cinnabari and Daemonorops
draco HPLC data library and EBC, Kew chromatograms
18
Figure 1.17 – HPLC profile of Dracaena cinnabari and Dracaena schizantha samples
from EBC, K collection
23
Figure 1.18 – HPLC profiles of two resin samples labelled as Dracaena draco from the
“Great Dragon Tree” of Tenerife - EBC, K collection
25
Figure 1.19 - UV-Vis absorption spectra variations of dracoflavylium with pH jumps 28
Figure 1.20 - Mole fractions distribution with pH for dracoflavylium at the equilibrium 28
Figure 1.21 - UV-Vis absorption spectra variations of dracorhodin with pH jumps 29
Chapter 2
Figure 2.1 – Production of indigotin and indirubin from plant leaves 33
Figure 2.2 - Indigo carmine 34
Figure 2.3 – Indigo reduction mechanism in non acidic media 35
Figure 2.4 – UV-vis spectra of indigo and isatin in DMF
36
Figure 2.5 – Monitorization by HPLC-DAD of indigo irradiation at 335 nm in
homogeneous media
38
Figure 2.6 – Photodegradation of indigo carmine in bacteriological gelatine 41

xiii
Figure 2.7 - Monitorization by HPLC-DAD of indigo photodegradation in the solid state 42
Chapter 3
Figure 3.1 – Strucuture of the N-phenylphenazidium salt discovered by O. Fischer and
E. Hepp in 1893 and R. Nietzki in 1896
49
Figure 3.2 – Mauveine structures discovered by Otto Meth-Cohn and Mandy Smith in
1994
49
Figure 3.3 - Fully characterised products isolated from modern mauve synthesis and
mauve historical salt samples
52
Figure 3.4 – Mauve dyed textile samples from museum collections 54
Figure 3.5 –Mauve dyed shawl, ScMF6 sample 55
Figure 3.6 –Historical salt mauve samples. 58
Figure 3.7 – Mauve dyed textile reconstruction before and after 48h of irradiation 61
Appendix I – Experimental section
Figure I.1 – a) Resin collected from the branch; b) Resin collected from the stem; c)
Extraction of the resin with acidified MeOH (AH-) and MeOH (A)
87
Figure I.2 – Dracaena and Daemonorops samples 88
Figure I.3 – Gelatine indigo carmine gel before a) and after b) 335nm irradiation 93
Figure I.4 – Indigo glass slides irradiated in the solar box. 93
Figure I.5 – Perth Museum sample before and after extraction with MeOH / HCOOH 99
Appendix II – Dragon’s blood data
Figure II.1 - 7,4’-dihydroxy-5-methoxyflavylium hydrogen sulphate 102
Figure II.2 - 7-hydroxy-5-methoxy-6-methylflavylium 103
Figure II.3 - 7,4’-dihydroxyflavylium. 105
Figure II.4 - PCA analysis of Daemonorops spp. samples 106
Figure II.5 - PCA analysis of Dracaena spp. samples 106
Figure II.6 - pH jump of the compound 7,4’-dihydroxy-5-methoxyflavylium, from 1 to 8.8 108
Appendix III – Indigo data
Figure III.1 – HPLC-DAD chromatogram of indigo dye 112
Figure III.2– HPLC-DAD chromatogram of indigo carmine 113
Figure III.3 - HPLC-DAD chromatogram of an indigo Andean textile sample 114
Appendix IV-Mauve dye data
Figure IV.1 – Formation of mauveine A 115
Figure IV.2 –Formation of mauveine B 116

xiv
Figure IV.3 –Formation of pseudo-mauveine 117
Figure IV.4 – Mauve dyed textiles HPLC-DAD chromatograms 120
Figure IV.5 - HPLC-MS total ion chromatogram (TIC) Science Museum 1 salt sample 121
Figure IV.6 - HPLC-MS total ion chromatogram (TIC) of Science Museum F6 122
Figure IV.7 - HPLC-MS TIC of Museum SI Manchester 2 salt sample 123
Figure IV.8 - Mauve salts HPLC-DAD chromatograms 124
Figure IV.9 - Mauve-dyed textiles HPLC-DAD chromatograms from other sources 125
Figure IV.10 - Mauveine B2 126
Figure IV.11 - Mauveine C 127
Figure IV.12- Pseudo-mauveine 128
Figure IV.13 – Mauveine C25a 129
Figure IV.14 – Mauveine C25b 130
Figure IV.15 - Mauve salts IC-AEC chromatograms 132

xv
Index of Tables
Chapter 1
Table 1.1 - Chemical structures responsible for the red colour in dragon’s blood resins 11
Table 1.2 – HPLC data for Daemonorops draco, Dracaena draco, Dracaena cinnabari
resins and respective flavylium markers. 15
Table 1.3 –Daemonorops samples from EBC, K analysed by HPLC-DAD 19
Table 1.4 - Dracaena cinnabari samples from EBC, K analysed by HPLC-DAD 21
Table 1.5 –Dracaena draco samples from EBC, K analysed by HPLC-DAD 24
Chapter 2
Table 2.1 - Absorption maxima and extinction coefficients of indigo, isatin and indigo
carmine in DMF at T=293 K 36
Table 2.2 - Quantum yields of reaction,IΦR, for indigo in DMF at T=293 K 37
Table 2.3 – Compounds identified by HPLC-DAD with the photodegradation of indigo
carmine in water and DMF with 335nm irradiation 39
Table 2.4 - Quantum yields of reaction,IΦR, for indigo carmine in aqueous gels and water at T=293 K
40
Table 2.5 – Relative concentration of the principal chromophores and main products
identified in Andean Textiles by HPLC-DAD 43
Chapter 3
Table 3.1 – Syntheses of mauve dye with different ratios of aniline and toluidine 50
Table 3.2 – Relative percentages of the mauveine chromophores in the synthesized
mauve dye 53
Table 3.3 - Relative percentages of the main chromophores of the mauve dyed textile
sample 54
Table 3.4 - Relative percentages of the main chromophores of the mauveine salt
samples and respective counter-ions 57
Appendix I – Experimental section
Table I.1 – Elution gradients used for mauve dye analysis 75
Table I.2 - Library samples analysed by HPLC-DAD 80
Table I.3 – Historical mauve samples 95
Table I.4 –Extraction methods tested in mauve dyed silk textile 99
Table I.5 – Mauveine chromophores distribution in mauve dyed textile 100
Table I.6 - Ion standards and respective retention times in water 100

xvi
Appendix II – Dragon’s blood data
Table II.1 – 1H and 13C-NMR data for 7,4’-dihydroxy-5-methoxyflavylium 103
Table II.2 – 1H and 13C-NMR data for 7-hydroxy-5-methoxy-6-methylflavylium 104
Table II.3 –1H and 13C NMR data for 7,4’-dihydroxyflavylium 105
Appendix III – Indigo data
Table III.1 – I0 and parameters for the 335 nm and 610 nm irradiations 110
Table III.2 – IndigoΦR and parameters for the 335 nm and 610 nm irradiations 110
Table III.3 – Indigo carmine ΦR and parameters for the 335 nm and 610 nm irradiations 111
Table III.4 – HPLC-DAD calibration curves of indigo and isatin 111
Appendix IV-Mauve dye data
Table IV.1 – Concentration of the starting materials used in the 4 mauve dye syntheses 118
Table IV.2 – Concentrations of K2Cr2O7 and H2SO4 necessary for mauve synthesis 118
Table IV.3 - Structures and summarized spectral data for mauveine compounds 119
Table IV.4 - 1H- and 13C-NMR data for the isolated mauveine B2 126
Table IV.5 - 1H- and 13C-NMR data for the isolated mauveine C 127
Table IV.6 - 1H- and 13C-NMR data for the isolated pseudo-mauveine 128
Table IV.7 - 1H- and 13C-NMR data for the isolated mauveine C25a 129
Table IV.8 - 1H- and 13C-NMR data for the isolated mauveine C25b 130
Table IV.9 - Mordant analysis of three mauve-dyed textile samples 131
Table IV.10 - Counter-ions of the mauve salt samples 133

1
General Introduction - Molecular and photochemical studies on
historical dyes: dragon’s blood, indigo and mauve
1. Preamble
Before the discovery of mauve dye and later thousands of synthetic dyes that resemble a
colourful rainbow [1] in the nineteenth century, the colours used to dye a textile since pre-
historic times were obtained from natural sources – vegetable or animal [2,3]. For the blue
and purple colours, indigo derivatives were mainly used. For red dyed textiles,
anthraquinone based dyes could be found and the yellows were obtained from an
enormous variety of local plant species, mostly from the flavonoid family [2,3]. From these
organic dyes, dragon’s blood and indigo were chosen for the red and blue colour study,
respectively. The synthetic mauve dye, a landmark in the history of chemistry and dye
industry, was also studied.
A characterization at the molecular level of dragon’s blood, indigo and mauve dye is the
main aim of this thesis. A more in-depth understanding will in turn enable a better
conservation and access to our cultural heritage, namely to ancient textiles. This PhD
thesis was carried out in the framework of the project Molecules of Colour in Art: a
Photochemical Study, where the molecular studies evolved along three main axes with: i)
structural characterization of the most relevant chromophores in each dye; ii)
photophysical characterization and iii) photochemical characterization. In this thesis, the
structural characterization of dragon’s blood, indigo and mauve dye, as well as the
photodegradation of indigo will be presented.
In each chapter an introduction to each organic dye is presented, followed by its molecular
characterization and photodegradation for the indigo dye. A brief summary of the principal
conclusions is also presented.
2. Chromophores’ characterization
Organic dyes are usually a complex mixture of different chromophores that bring colour to
the textile. In natural dyes, such as dragon’s blood, the presence of several chromophores
with different relative proportions according to the dyeing source, the local, date and
season of the sampling amongst others [4,6], can give a kind of fingerprint very useful in
the identification of dyes in works of art, such as textiles [2,7]. With this information
amongst others factors, it will be possible, for example, to establish conception dates,
assign production centres, identify textile trade routes, etc [8]. Moreover, successful
photophysical and photodegradation characterization is only possible when the molecules

2
involved are well characterized structurally. In synthetic dyes, like the mauve dye, a
complex pattern of chromophores can also be found, when the synthetic procedure gives
several coloured products. Nevertheless, a simpler pattern can be found in natural and
synthetic dyes as the case of the indigo dye where usually only the indigotin chromophore
is retained on the fibres during the dyeing bath [2]. For this reason the photodegradation of
indigo in homogeneous and heterogeneous media was carried out.
3. Photophysical characterization
Organic dyes being coloured molecules will absorb in the UV-Vis region and therefore
photochemical reactions that will dictate the stability of the molecule can occur. When
these molecules absorb radiation, the resulting extra energy produces an excited state
molecule, which can be considered an entire new molecule since several properties as its
polarity, acidity, oxidation and reduction properties, just to name a few, are entirely
different from the ground state molecule [9-12]. The lifetime of an excited molecule is
usually very small, in the order of nanoseconds or even less. It can return to the ground
state with emission of fluorescence (i.e. emission of photons), internal conversion (i.e.
direct return to the ground state without emission of fluorescence), intersystem crossing
(possibly followed by emission of phosphorescence), intramolecular charge transfer;
proton transfer; photochemical reactions, amongst others (see figure 1.1), which compete
with each other while the molecule is in the excited state.
Figure 1.1- Possible de-excitation pathways of excited molecules, adapted from [9].
hνννν
fluorescence emission
intersystem crossing
internal conversion
intramolecular charge transfer
conformational change
electron transfer
proton transfer
energy transfer
excimer / exciplex
formation
photochemical transformation
delayed fluorescence
phosphorescence
excited molecule

3
When the excited molecule loses energy through chemical reactions we are in the
photochemistry field but when the excited molecule is converted to the ground state, with
the excess of energy being released as radiative or non radiative energy we are in the
photophysics domain [11,12]. In the excited state, bonds can be broken and new ones
formed; if the processes involving bond breaking and formation are reversible, they will be
considered as non radiative photophysical deactivations (figure 1.2). If they are
irreversible, they will be studied as a photochemical reaction and an important parameter
for its characterization is defined as the quantum yield of reaction (see below).
Figure 1.2: Adapted Jablonski scheme [9], where the kf (fluorescence deactivation) and kp
(phosphorescence deactivation) are the rate constants for the radiative processes and the
k’isc (intersystem crossing deactivation), kic (internal conversion deactivation) and kisc
(intersystem crossing deactivation) are the non-radiative processes. The S0 and S1 are the
singlet and excited ground state respectively and T1 is the first triplet state.
For a full photophysical characterization, absorption, fluorescence and phosphorescence
spectra can be obtained; triplet-triplet absorption analysis is also performed. Moreover,
fluorescence lifetimes and quantum yields can be determined and the rate constants
responsible for the excited state deactivation can be calculated.
The photophysical characterization will enable a better understanding of the
photochemistry as well as more precise lifetime of the molecule. The study of the influence
of oxygen in the photochemistry and reactivity of these dyes will, in turn, enable a better
understanding of which are the photophysical parameters that play a relevant role in the
photodegradation mechanism. Furthermore, it will enable the prediction of the colour
changes over time.
kisc
kf hνννν
kp
T1
S0
S1
kic
k’isc

4
4. Photochemical characterization
One important parameter, as mentioned before, in the characterization of photochemical
reactions is the photodegradation quantum yield of a reaction that can be defined as:
Φ = Amount of reactant consumed or product formed per unit of time
Amount of photon absorbed
The quantum yield obtained should take into account the role of oxygen in the
photodegradation reaction as photooxidation can contribute for the global mechanism of
fading. Therefore, the photodegradation quantum yield in the presence and absence of
oxygen should be calculated.
Moreover, the main photoproducts should also be identified as well as the intermediates
formed after monochromatic irradiation, in order to obtain the principal degradation
mechanisms occurred during the light induced fading.
A systematic approach to the study of the photophysics and photochemistry of these
colourants cannot be found in the literature. Particular importance has been given to the
molecular characterization of the cited molecules rather than on a full understanding of the
photodegradation mechanisms. It is important to remember that the most known organic
dyes had to overcome the barrier of light and washing fading during hundreds of years.
Therefore, their degradation is somehow a slow process and for that reason the
photophysical and photochemical characterization of these organic dyes is a complex and
time-consuming task. Nevertheless, it is important to know their molecular mechanisms of
degradation, in order to be able to plan strategies to prevent their fading and improve their
durability.
With the results presented in this thesis, new knowledge into historic dyes at their
molecular level is provided and, from now on, it will be easier to perform a detailed
photophysical and photochemical study of these organic dyes as well as applying the
results obtained in the research and conservation of textiles.

5
Chapter 1 - Dragon’s Blood
1.1 Dragon’s blood overview
Dragon’s blood is a natural resin [13] with a rich deep red colour obtained essentially from
three different families of plants, namely Dracaenaceae, Palmae and Euphorbiaceae [14-
17]. It may sound like an exotic ingredient of a witch's brew or a magic potion. Indeed,
legends refer that dragon’s blood was the result of a fight between a dragon and an
elephant until death, where a dragon tree sprung up from the congealed blood dropped by
both animals, giving “magical” properties to the red resin [14-17]. In the Greek mythology it
was mentioned that Hercules killed Geriones (the three headed monster) from the Eriteya
Island, and from his blood a tree was also born with red fruits which produced the dragon’s
blood resin [18]. Curiously, the red resin has been applied for centuries in traditional
medicine with different clinical and ethnomedical uses where pharmacological assays
have frequently corroborated its medical applications (and therefore the “magical”
properties of dragon’s blood) against cancer, ulcers and wounds, amongst others [19-28].
Apart from this, dragon’s blood has also been used in the past with several artistic
purposes [14-17,29].
Attempts to unveil the trade history of dragon’s blood resins, the use of its sources and
even its chemical composition have been difficult due to botanical misunderstanding and
the diversity of dragon trees [14-17,30-32]. It is believed that in the past, one of the
principal sources of dragon’s blood was Dracaena cinnabari Balf. (Dracaenaceae) from
Socotra Island [14-16]. Today the main dragon’s blood resin commercially available is
obtained from the species Daemonorops draco (Willd.) Blume (synonym Daemonorops
propinqua Becc.) from Thailand, Sumatra and Borneo [14-16,30,33]. However, a great
diversity of dragon’s blood resins has been used since ancient times until today, due to the
different dyeing sources of the resin available in each geographic area [14-16,27-28].
The resin can be collected from natural exudates that occur in injured areas in the stem
and branches of the tree (Dracaenaceae and Euphorbiaceae families, figure 1.3a) or can
be obtained from the fruits which are covered with small scales through where the resin
exudes forming a brittle red resinous layer outside the fruits (Palmae family, figure 1.3b)
[14-16,34-37].

6
Figure 1.3– a) Resin from Dracaena draco tree; b) Resin from Daemonorops micrantha
(Griff.) Becc. [13].
1.1.1 Dracaenaceae (mostly larger Mediterranean)
In the Dracaenaceae family, which comprises between 60 and 100 species, only 5
species have the growth habit of a tree with an umbrella type crown producing dragon’s
blood resin [34,35,38-41]. These trees are the Dracaena cinnabari Balf. (figure 1.4)
which is endemic of Socotra Island [38]; Dracaena serrulata Baker (figure 1.5) from the
south-western Arabia [34,35]; the Dracaena ombet Kotschy & Peyr (synonym Dracaena
schizantha Baker, figure 1.6) from North-East tropical Africa and western Arabian
peninsula [40]; Dracaena draco L. (figure 1.7) from the Macaronesian Islands as Madeira,
Azores, Cape Verde and Canarias [34,35] or from Morocco being reported there as
Dracaena draco L. subsp. Ajgal Benabid et Cuzin [41], and finally the recently identified
Dracaena tamaranea A. Marrero & al. (similar to Dracaena draco L.) from the Gran
Canaria (Canary Islands)[39].
Figure 1.4 – Dracaena cinnabari Balf, Socotra [42].
Figure 1.5 – Dracaena serrulata Baker [43].
a b
1.4 1.5

7
Figure 1.6 – Dracaena ombet Kotschy & Peyr [44].
Figure 1.7 – Dracaena draco L., Lisbon.
It is believed that these dragon trees with a bizarre prehistoric appearance share a
common origin due to the similar morphological features and the existence of comparable
fossils (Dracaenites brongniartii Saporta, Dracaenites narbonenis Saporta and
Dracaenites sepultus Saporta) from Tertiary deposits (65 million to 1.8 million years ago)
in Southern Europe [38,39]. During the Tertiary period, the drastic climate changes at the
end of the Oligocene brought about the almost extinction of the subtropical vegetation
throughout the South of Europe and North Africa, from the Atlantic to the Indian Oceans
and lead to a biogeographic dissociation between the living dragon’s tree of East and West
Africa. Only a few specimens of the ancient flora survived on both sides of the African
continent where the environmental conditions were more stable due to the tempering
effect of the sea [39]. Far from one another, these remaining colonies continued to develop
independently, giving rise to the actual five species of dragon’s tree of the Dracaena
genus. As long isolation exists, each species will tend to become slightly different from
others [37,39]. Nevertheless, similarities can be drawn between the five species
mentioned.
Important colonies of this ancient relic flora are the Dracaena cinnabari dragon’s tree of
Socotra Island with an age between 200 and 300 years old [38]. However, studies point
out that this Dracaena cinnabari woodland will reach the stage of intensive disintegration
within 30-77 years due to climate changes [38,45]. Other very famous exemplar was the
Great Dragon Tree of Orotova (Tenerife) believed to have an estimated age of 6000 years
old. The dragon tree fell in 1817 due to a hurricane. Today, the oldest Dracaena draco tree
in Icod (Tenerife) has an estimated age of 700 years old [13-16] (figure 1.8). Being
monocots, its age is very difficult to estimate due to the lack of annual growth rings.
1.6 1.7

8
Nevertheless, the dragon’s tree age can be estimated with different indirect methods being
the most usual the number’s determination of the sausage-shaped section that normally
display between 11 and 16 years for Dracaena draco and 14-30 years for Dracaena
cinnabari [38].
Figure 1.8 – Dracaena draco L., Icod [46]
1.1.2 Palmae (mostly South East Asia)
In the Palmae family, the species that produce dragon’s blood resin belong to genus rattan
Daemonorops which comprises about 115 species [36,37,47]. The Daemonorops genus is
divided into two sections, the Cymbospatha and the Piptospatha being the most important
product of the last one, the dragon’s blood powder. The dragon’s blood species are
confined to Malaysia, Thailand and West Indonesia, where the red resin is an item of trade
between Borneo, Sumatra, the Malay Peninsula and even China [16]. As in the
Dracaenaceae family, they are a natural unit taxa where some species have slightly
diverged because of isolation or adaptation [37-39]. As mentioned before, the most
commonly used Daemonorops sp. dragon’s blood species is Daemonorops draco (Willd.)
Blume (synonym Daemonorops propinqua Becc. Species, figure 1.9), but up to 10 species
are known, namely the Daemonorops brachystachys Furtado from Peninsula Malaysia
to North Sumatera, Daemonorops didymophylla Becc. Ex JD Hooker from Peninsula
Thailand to West Malesia, Sumatera, Daemonorops dracuncula Ridl. from Sumatera
(Kep. Mentawai), Daemonorops dransfieldii Rustiami from Sumatera, Daemonorops
maculate J. Dransf. from Borneo, Daemonorops micrantha (Griff.) Becc. from
Peninsula Malaysia and Borneo, Daemonorops rubra (Reinw. ex Mart.) Blume from
Jawa, Daemonorops sabut Becc. from Peninsula Thailand to West Malesia [36,37], and
the recently discovered Daemonorops acehensis Rustiami from Sumatera as well the
Daemonorops siberutensis Rustiami from Sumatera (Kep. Mentawai) [47].

9
Figure 1.9 – Daemonorops draco sp. [48].
1.1.3 Euphorbiaceae (mostly Latin America)
In the Euphorbiaceae family the production of dragon’s blood belongs to genus Croton
(figure 1.10) widespread in tropical regions of the Old and New World with circa 1300
species [27-28].
Figure 1.10 – Croton lechleri, [49].
Several species of Croton, namely Croton lechleri from South American (Ecuador, Peru,
Colombia and Bolivia), Croton palanostigma Klotzsch from South American tropics
(Peru), Croton draco Cham & Schltdl. from Mexico and Central America, Croton
urucurana Baill from Brazil and Paraguai, Croton erythrhrochilus Müll.-Arg. from Peru,
Croton perspeciosus Croizat, Croton aromaticus L. from Sri Lanka, and Croton
rimbachii Croizat have been used in the production of the red resin [27, 28].
1.1.4 Others
Other known sources of dragon’s blood are the Pterocarpus oficinallis Jacq.
(synonymous of Pterocarpus draco L., Leguminosae family, figure 1.11) from West Indian,
Caribean, coastal areas of Central and northern South America [15,16,50] and the shrub
Dracaena cochinchinensis (Lour.) S. C. Chen (Dracaenaceae family, figure 1.12) from
China, S.W. Guangxi to S. Yunnan, to Indochina believed by some authors to be the
original source of the dragon’s blood used for thousands of years in traditional Chinese
medicine [25,51].

10
Figure 1.11-Pterocarpus oficinallis [52]
Figure 1.12-Shrub Dracaena cochinchinensis (Lour.) [53]
However, it is known that for Chinese herbal medicine Daemonorops was also imported
into China from South-East Asia, and others sources as Dracaena angustifolia (Medik.)
Roxb (tropical and subtropical Asia to North Australia including Taiwan, Guangdong and
Yunnan) and Dracaena cambodiana Pierre ex Gagnep. (South Hainan to Indochina) [52]
were also used.
1.2 Chemical composition – The red colourants unveilled
The dragon’s blood resins are a complex mixture of several compounds. Recent
phytochemical studies on the genera Dracaena and Daemonorops identified several
compounds as saponins [19-21,55], chalcones [23], flavonoids [23,56-58], sterols [59], and
flavans [58,59], amongst others. These compounds are colourless or display a yellowish
colour. However, for the Daemonorops sp. resins, besides the presence of chalcones,
flavans and flavonoids, red flavylium pigments as dracorhodin and dracorubin were also
identified [60,62-69]. It was in 1936 that Brockmann and Haase published the first attempt
to identify the red colourants of a powdered commercial dragon's blood resin probably
from a Daemonorops sp. source in which they isolated one of the red compounds and
named it as dracorubin [62]. A second colourant, dracorhodin, was identified in 1943 by
Brockmann and Junge that have also synthesized the molecule and concluded it was a
natural 2-phenyl-1-benzopyrylium (a flavylium salt) from the anthocyanins family [64]. A
more straightforward synthesis, and consequent confirmation of the structure, was
published by Robertson and Whalley, in 1950 [65]. The structure of dracorubin was
proposed by Robertson and Whalley in 1950 [65] and the molecule was only synthesized
1.11 1.12

11
in 1975, by Whalley [66]. In the meantime, two other natural red flavylium colorants from
dragon's blood were characterized and named as nordracorhodin and nordracorubin
[60,67] (table 1.1).
Table 1.1 - Chemical structures responsible for the red colour in dragon’s blood resins.
The structures correspond to the quinoid bases (A).
Dracorhodin Dracorubin Dracoflavylium 7, 4'- dihydroxy-flavylium
OO
OMe
OO
O O
OMe
OO
OMe
OH
OO
OH
1943 [64], 1950 [65] 1936 [62], 1937 [63],
1950 [68], 1976 [66]
2006 [69] 2008 [70]
The presence of natural flavylium compounds in dragon’s blood resin from Daemonorops
sp. has been mislaid during the last decades [19-22,26,30-32]. However, those natural
flavylium compounds contribute significantly to the final deep red colour of dragon’s blood
resin.
Synthetic flavylium salts, natural flavylium and anthocyanins have in common the 2-
phenyl-1-benzopyrylium chromophore unit. In terms of molecular structure, flavylium salts
were the first to be discovered, Bülow [71] 1901, followed by the natural anthocyanins,
Willstätter [72], and finally by natural flavylium compounds [73].
Anthocyanins are characterized by the existence of an O-glucoside in position 3
(monoglucoside). A sugar can also be present in position 5 (diglucosides) or less
frequently in position 7 [74], figure 1.13. On the other hand, in anthocyanidins hydroxyl
groups take the positions of the glucosides, leading to unstable structures in solution. On
the contrary, the so-called desoxyanthocyanidins, that corresponds to “anthocyanidins”
lacking the hydroxyl in position 3 (but bearing a hydroxyl in position 5), are quite stable in
solution.
Figure 1.13 – In the basic chemical structure of anthocyanins, an hydroxyl group is
present in positions 4’ and 7, and a sugar in position 3 (monoglycosides) or 3 and 5
(diglycosides).
O
OGl
HO
OH
R'3
OGl
R'5+
3 5
7 A
B 4’

12
In the seventies of the last century, it was firmly established by Dubois and Brouillard
(anthocyanins) [75] and McClelland (synthetic flavylium salts) [76] that both families of
compounds undergo multiple structural alterations in aqueous solution, following the same
basic mechanism [77] (see figure 1.14).
The flavylium cation (AH+) is the dominant species in very acidic solutions, but with
increasing of pH a series of more or less reversible reactions occur: 1) deprotonation
leading to the quinoid base (A), 2) hydration of the flavilyum cation giving rise to the
colourless hemiacetal (B), 3) tautomerisation reaction, responsible for ring opening, to give
the pale-yellow Z-chalcone form (Cc), and finally, 4) cis-trans isomerisation to form the
pale-yellow chalcone (Ct). Furthermore, at higher pH, and depending on the number of
hydroxyl groups, further deprotonated species are found, such as Ctn- and An-. The
relevant contribution for the colour is given by AH+ and the quinoid bases.
Figure 1.14 – Network of chemical reactions for 7,4’-dihydroxy-5-methoxyflavylium in
solution [69] (see section 1.3.4.1).
In this work, the discovery of natural flavylium compounds in resins [69,70], namely the
compounds 7,4’-dihydroxy-5-methoxyflavylium and 7,4’-dihydroxyflavylium from Dracaena
draco and from Dracaena cinnabari, respectively, is reported for the first time. A fingerprint
study of these red chromophores in dragon’s blood resins from Dracaena and
OO
O-
A-
OO
OH
A
OHO
OH
+
AH+
OHO
OHHO
B
OHHO
OH
O
Cc
OHHO
Ct
O
OH
OH-O
O
OH
OH-O
O
O-
Ct-
Ct2-
Ka1Ka2
Kh
Kt
Ki
KCt1 KCt2
+ H++ H+
+ H+
+ H+ + H+
OCH3 OCH3 OCH3
OCH3 OCH3
OCH3
OCH3 OCH3

13
Daemonorops trees was performed using high performance liquid chromatography with
diode array detector (HPLC-DAD) and principal component analysis (PCA).
These natural flavylium markers do not fit the commonly accepted definition of
anthocyanidin or 3-deoxyanthocyanidin [78] as some authors recently have proposed for
analogous structures from Arrabidaea chica [79], as a methoxy group was found in position
5. Their structure and chemical behaviour are closer to the so-called synthetic flavylium
salts, as will be described bellow.
1.3 Results
Due to the great diversity of dragon’s blood resins and botanical misunderstandings
amongst others in the literature, previously to the resin red compounds characterization,
an HPLC-DAD data base was built (see appendix I - experimental section, section I.3
p.79). Moreover, a method based on flavylium markers was developed for the resins
identification and applied to the XIX century dragon’s blood collection of the Economic
Botany Collections at the Royal Botanic Gardens, Kew (EBC, K). Afterwards the dragon’s
blood flavylium characterization was performed.
1.3.1 Dragon’s blood resins data library
From the circa 30 species referred in the section 1.1, only three species (Dracaena draco,
Dracaena cinnabari and Daemonorops draco), which were probably the most important
species used in Europe, were selected for the construction of the dragon’s blood HPLC-
DAD library (see appendix I - experimental section, table I.2, p. 80, for library HPLC-DAD
dragon’s blood samples). The aim of the HPLC library was the distinction of dragon’s
blood species and subsequent identification of unknown resins. An initial HPLC-DAD
screening revealed the presence of different flavylium compounds responsible for the red
colour of the resins. The use of the flavylium compounds as potential species markers for
dragon’s blood resins was for the first time investigated.
Circa 50 samples from Dracaena draco, Dracaena cinnabari and Daemonorops draco
(mostly collected in botanical gardens) were analyzed by HPLC-DAD. The results obtained
were subsequently applied to 37 samples of dragon’s blood from EBC, K (labelled as
Daemonorops draco, Daemonorops sp., Dracaena cinnabari, Dracaena draco, Dracaena
schizantha and Dracaena sp.). The EBC, K contains perhaps the largest and most reliably
identified assemblage of dragon’s blood resins dating from the 19th century which were
donated by Sir Isaac Bailey Balfour or the Pharmaceutical Society of Great Britain,
amongst others [14,16].

14
1.3.2 Flavylium markers identification
Samples from known provenance, with the species correctly identified by experts, were
used to build-up the HPLC-DAD database (i.e. for the Dracaenaceae, 33 samples of
Dracaena draco and 9 samples of Dracaena cinnabari). It was also possible to
characterize roughly the tree age (for more details see appendix I – experimental section,
table I.2, p. 80). The situation was different for the Daemonorops draco resin, where only 2
commercial samples were acquired. However, this limitation was overcome with the
analysis of the dragon’s blood EBC, K collection (see section 1.3.3.1).
In all the samples analysed, the red colour resulted from the contribution of single flavylium
chromophores, as for instance, dracorhodin, and condensed flavylium molecules, such as
dracorubin [23,24,62-69] (see table 1.1). More importantly, it was observed (table 1.2) that
Dracaena draco, Dracaena cinnabari and Daemonorops draco presented each one a
characteristic flavylium: 7,4’-dihydroxy-5-methoxyflavylium (dracoflavylium), 7,4'-
dihydroxyflavylium and 7-hydroxy-5-methoxy-6-methylflavylium (dracorhodin),
respectively. As can be observed in table 1.1, these compounds have the 2-phenyl-1-
benzopyrylium core in common, but a different substitution pattern, consequently each
exhibit characteristic UV-Vis spectra and retention times (table 1.2). This, in turn, enables
a straightforward identification of these flavylium chromophores by HPLC-DAD, which
leads to the identification of the dragon’s blood source (table 1.2). Besides these markers,
the chromatograms acquired at the wavelengths for red detection (462 nm) for each resin
type are also characteristic for these species and, after PCA, could also be used as a
fingerprint (see table 1.2 and figure 1.15).
The PCA principal components represented in Figure 1.15 can be analysed according to
the corresponding loadings (each sample PCA score is the inner product between the
sample chromatogram and the loading corresponding to a given principal component). It
was observed that the loading for the first score, PC#1, contains strong positive peaks at
20.5, 27.4 and 27.9 min and strong negative peaks at 18.0, 18.7 and 23.3 min. The former
correspond to Dracaena draco elution peaks while the latter correspond to Dracaena
cinnabari peaks. Therefore, the first PCA component, PC#1, is able to discriminate
between these two Dracaena species (positive scores for Dracaena draco and negative
scores for Dracaena cinnabari in the first component axis). The third score, PC#3, exhibits
two strong positive peaks at 21.1 and 21.7 min. These peaks correspond to peaks
observed in Daemonorops draco chromatograms (see table 1.2). No other relevant peaks
were observed in the third loading which means that this component captures only the
Daemonorops draco samples information (strong positive scores in the third score).

15
Table 1.2 – HPLC chromatogram profiles, retention times and absorption maxima for
Daemonorops draco, Dracaena draco, Dracaena cinnabari resins and respective flavylium
markers.
Species Chromatogram Flavylium marker Spectrum’ Flavylium marker
Dracaena cinnabari
Balf. f. (Source:
Firmihin and Hamadero in
Socotra Island; mean age circa 250
years old)
20 25 30
0,0
0,8
1,6
Absorbance at 462nm
tr, minutes
1
(1) 7,4’-
dihydroxyflavylium tr = 18.03±0.15
min λmax = 462 nm
200 300 400 500 5500,0
0,6
1,2
Absorbance
Wavelength, nm
Dracaena draco L. (source:
Natural Park of Madeira;
age: circa 200 years old)
20 25 30
0,0
0,8
1,6
Absorbance at 476nm
tr, minutes
2
(2) Dracoflavylium 7,4’-dihydroxy-5-methoxyflavylium
tr =
20.51±0.12min λmax = 476 nm 200 300 400 500 550
0,0
0,6
1,2
Absorbance
Wavelength, nm
Daemonorops draco (Wild.)
Blume (source:
Zecchi; age unknown)
20 25 30
0
1
2
Absorbance at 438nm
tr, minutes
3
(3) Dracorhodin 7,6-dihydroxy-5-methoxyflavylium
tr = 21.76±0.07min λmax = 438 nm
200 300 400 500 5500,0
0,7
1,4
Absorbance
Wavelength, nm

16
-20 -10 0 10 20-15
0
15
30
Principal Component #2 (28.1%)
Principal Component #1 (30.3%)
Figure 1.15 – PCA analysis of Dracaena draco (squares), Dracaena cinnabari (circles) and
Daemonorops draco (stars) with HPLC data library chromatograms acquired at 462 nm..
1.3.2.1 Dracaena draco: 7,4’-dihydroxy-5-methoxyflavylium
The HPLC-DAD library for Dracaena draco was created with resins freshly gathered from
Madeira, Lisbon and Cape Verde. In all the samples analysed the 7,4’-dihydroxy-5-
methoxyflavylium (dracoflavylium) was always present. Samples enclosed by the dotted
line are centenary trees c. 200 years old, where dracoflavylium content was the major red
compound (c. 32%) (figure 1.15). In the other samples this flavylium was present as a
minor product of the total amount of the red colourants of resin, ranging from 1-10%
(relative area). Although relative concentration of dracoflavylium is variable, this flavylium
was only found in Dracaena draco resins.
1.3.2.2 Dracaena cinnabari: 7,4’-dihydroxyflavylium
In the chromatograms used to build-up the HPLC-DAD library for Dracaena cinnabari, the
quantity of 7,4’-dihydroxyflavylium varied from 5% to 15% of the relative area for the total
amount of the red colourants of resin. The colour of this resin is due to a complex mixture
of red compounds (table 1.2), with 7,4’-dihydroxyflavylium being one of the major
chromophores.

17
1.3.2.3 Daemonorops draco: 7-hydroxy-5-methoxy-6-methylflavylium
In the Daemonorops draco resins, 7-hydroxy-5-methoxy-6-methylflavylium (dracorhodin)
was the major red compound. The occurrence of dracorhodin in Daemonorops sp. resins
has been described already in the literature [23,24,62-65].
1.3.3 The Economic Botany Collections at the Royal Botanic Gardens – Kew
After obtaining the results described above, identification of dragon’s blood resin sources
based on flavylium markers was applied to the largely 19th century collection of dragon’s
blood at EBC, K. These items comprise not only resins from the already described
Daemonorops draco, Dracaena draco and Dracaena cinnabari, but also unnamed
Daemonorops and Dracaena sp. resins and one resin from Zanzibar tentatively labelled
Dracaena schizantha (a synonym of Dracaena ombet). The EBC, K collection is very
heterogeneous with very different grades of resin purity. Just over 50% of the resin
collection labelled as Daemonorops draco (or its synonym Daemonorops propinqua),
Dracaena cinnabari and Dracaena draco species were examined.
The results obtained were analyzed and compared with the HPLC-DAD data library, using
the flavylium markers and the PCA of the full chromatograms acquired at 462 nm. Both
approaches gave identical results and successfully discriminated Daemonorops draco,
Dracaena cinnabari and Dracaena draco (see figure 1.16). On the other hand, it was not
possible to distinguish unambiguously the EBC, K sample labelled Dracaena schizantha (a
synonym of Dracaena ombet) from the circa 30 Dracaena cinnabari samples analysed
(HPLC-DAD library and EBC, K collection). All the samples, had the same flavylium
marker; however, due to the small number of samples labelled Dracaena schizantha, 1
from EBC, K and 1 from the living collections (Horticulture & Public Education, Kew - HPE,
K) a more conclusive result using PCA could not be drawn.
PCA shows that all the EBC, K samples are in accordance with the built-up data library
(figure 1.16), therefore, being possible to establish and verify the species source. Only two
samples lay outside the three established areas: the samples EBC, K 36653 (labelled
Dracaena draco), which is probably a mixture of resins, and EBC, K 36825 (labelled
Dracaena draco), which is not actually based on flavylium compounds. In the next sections
the results obtained will be described in more detail and, whenever possible, they will be
compared to previous analyses of the EBC, K red resins by Raman [30-32].

18
-20 -10 0 10 20-15
0
15
30
Principal Component #2 (28.1%)
Principal Component #1 (30.3%)
Figure 1.16 - PCA analysis of Dracaena draco (squares), Dracaena cinnabari (circles) and
Daemonorops draco (stars); HPLC chromatograms acquired at 462 nm for data library
samples (open symbols) and EBC, K samples (solid symbols). The areas assigned
represent three major distinct zones enabling the species identification of the samples
analyzed.
1.3.3.1 Daemonorops draco (synonym, Daemonorops propinqua) and Daemonorops
sp.
In the EBC, K samples labelled as Daemonorops draco or D. propinqua, 7-hydroxy-5-
methoxy-6-methylflavylium (dracorhodin) was identified as the major compound. This
observation is in line with the recent publication which announced the two taxa as
synonyms [37], Daemonorops draco being the accepted name [33]. Furthermore, the
chromatograms obtained for these samples are very similar, as confirmed by PCA analysis
(see appendix II – Dragon’s blood data, section II.2, p. 105, for PCA graphics).
The HPLC-DAD data showed that of the 9 analyzed samples labelled Daemonorops
draco, Daemonorops propinqua or Daemonorops sp., only 6 samples had a correct
attribution (see table 1.3). In 4 samples (35489, 35495, 35500, 35526), the relative
percentage of 7,6-dihydroxy-5-methoxyflavylium (dracorhodin) was circa 65% of the total
area of red chromophores as found in the commercial Daemonorops sp. resins. In
samples that were processed (35490 and 35505), the relative percentage of 7-hydroxy-5-
methoxy-6-methylflavylium decreased to 55% of the total red chromophores.

19
Table 1.3 – Specimens of Daemonorops samples from EBC, K analysed by HPLC-DAD
and percentage of the flavylium markers identified.
ID EBC, K
classification
Date of
donation
Provenance,
donor Observations
Species
% flavylium marker*
35487 Daemonorops
draco ?
India,
India Museum Mixture of resin, bark and powder.
Dracaena cinnabari
Circa 6% 7,4’-
dihydroxyflavylium
35489 Daemonorops
draco 1851
Singapore
A.S. Hill & Son
Mostly resin.
Labelled as “Calamus draco, in lumps,
colour of powder, brick red. Contains
about 12 per cent of insoluble matter”.
Paler and duller than other samples.
Daemonorops draco
Circa 65% dracorhodin
35490 Daemonorops
draco 1851
India, Calcutta,
Royal
Commonwealth
Exhibition
Mostly resin.
Labelled as “Reed dragon’s blood”
Daemonorops draco
Circa 55% dracorhodin
35495 Daemonorops
draco ?
?,
British Museum
(Natural History)
Mixture of resin and powder. The
sample appears to be small pieces from
a reed resin.
Daemonorops draco
Circa 65% dracorhodin
35499 Daemonorops
draco ? Sumatra, ? Resin attached to fruit scales.
Daemonorops sp. (?)
Circa 65% unknown
compound (tr=21.03 min,
λmax=453 nm)
35500 Daemonorops
propinqua
1896
Sumatra, ? Resin attached to fruit scales. Daemonorops draco
Circa 65% dracorhodin
35526 Daemonorops
propinqua 1890
?,
A Hill & Son
Mixture of resin, powder and
contaminants. It looks paler and much
less resinous than some other samples
of lump dragon’s blood.
Daemonorops draco
Circa 65% dracorhodin
35527 Daemonorops
propinqua ?
?,
Savory & Co
Mixture of resin and powder. Lump
dragon’s blood.
Dracaena cinnabari
Circa 16% 7,4’-
dihydroxyflavylium
35505 Daemonorops
sp. 1851
Sumatra,
Royal
Commonwealth
Exhibition
Mostly resin.
Similar to lump dragon’s blood.
Daemonorops draco
Circa 55% dracorhodin
*The relative peak areas were calculated with the chromatographic program ChromQuest
4.1 at the maximum wavelength absorption for each flavylium marker selected: 438 nm for
dracorhodin (Daemonorops sp.), 462 nm for 7,4’-dihydroxyflavylium (Dracaena cinnabari
and Dracaena schizantha) and 476 nm for 7,4’-dihydroxy-5-methoxyflavylium (Dracaena
draco).

20
In two further samples, 35487 and 35527, labelled Daemonorops draco and Daemonorops
propinqua respectively, the presence of 7,4’-dihydroxyflavylium and absence of
dracorhodin prompt the conclusion that these resins were from Dracaena cinnabari. Both
these samples appeared more glossy or resinous than other lump resins classed with this
genus. Also, at least one of these 2 samples was sourced in India (see table 1.3). Finally,
sample 35499 (labelled as Daemonorops draco) revealed the presence of an unknown red
chromophore in its composition (see table 1.3) and therefore no conclusion concerning its
provenance could be drawn. It seems that the names of samples of lump dragon’s blood
resins currently housed under the name Daemonorops in the EBC, K may not be accurate,
and analysis of further samples using these techniques would be profitable. Some of the
naming errors may have arisen due to past curation of the samples where Latin names
have been assumed from the vernacular. These errors are more likely to occur from
samples sourced in India as both Daemonorops draco and Dracaena cinnabari were
traded there [16].
1.3.3.2 Dracaena cinnabari, Dracaena ombet (synonym D. schizantha) and Dracaena
sp.
All 15 EBC, K Dracaena cinnabari samples showed the presence of 7,4’-
dihydroxyflavylium (5-20%), in agreement with the species attribution; these samples were
acquired most directly from Socotra, where the species is endemic and some from market
imports (see table 1.4 for more details).

21
Table 1.4 - Dracaena cinnabari samples from EBC, K analysed by HPLC-DAD.
ID EBC, RBC
classification
Date of
donation Provenance, donor Observations
Species
% flavylium marker*
36489 Dracaena
cinnabari ?
?, labelled Socotra dragon’s
blood from Allen & Co. Mixture of resin, bark and powder
Dracaena cinnabari
Circa 7% 7,4’-
dihydroxyflavylium
36542 Dracaena
cinnabari 07-1881 ?, donated by Prof IB Balfour
Mixture of resin, bark and powder.
Labelled as “Socotra Dragon’s blood”.
Dracaena cinnabari
Circa 8% 7,4’-
dihydroxyflavylium
36543 Dracaena
cinnabari 1875 ?, donated by Dr Vaughan
Resin.
Labelled as “Socotra Dragon’s blood”.
Dracaena cinnabari
Circa 5% 7,4’-
dihydroxyflavylium
36545 Dracaena
cinnabari 10-1899
?, purchased by Mather at
Ripley Roberts Drug sale, 3
Mincing lane
Resin.
Labelled as “Extra fine Zanzibar leas”.
Dracaena cinnabari
Circa 5% 7,4’-
dihydroxyflavylium
36557 Dracaena
cinnabari 10-1899 Zanzibar, purchased by Mather
Heterogeneous resin.
Labelled as “Socotra Dragon’s blood”.
Dracaena cinnabari
Circa 15% 7,4’-
dihydroxyflavylium
36563 Dracaena
cinnabari ? ?
Powder.
Labelled as “Socotra Dragon’s blood”.
Dracaena cinnabari
Circa 15% 7,4’-
dihydroxyflavylium
36580 Dracaena
cinnabari 10-1899
?, Kurachi, purchased by
Mather
Resin.
Labelled as “Fine marbles of dragon’s
blood”
Dracaena cinnabari
Circa 5% 7,4’-
dihydroxyflavylium
36599 Dracaena
cinnabari 1881 Socotra, ?
Mixture of pigment and resin.
Labelled as “dam el akhuwen”
Dracaena cinnabari
Circa 17% 7,4’-
dihydroxyflavylium
36611 Dracaena
cinnabari 01-1880 ?, presented by Dr JB Balfour
Tears of resin.
Labelled as “Socotra Dragon’s blood”.
Dracaena cinnabari
Circa 15% 7,4’-
dihydroxyflavylium
36622 Dracaena
cinnabari ? ?
Tears of resin.
Labelled as “Socotra Dragon’s blood”.
Dracaena cinnabari
Circa 5% 7,4’-
dihydroxyflavylium
36773 Dracaena
cinnabari 1880
Socotra,
donated by Prof IB Balfour
Tears of resin.
Labelled as “Edah Amsellah”
Dracaena cinnabari
Circa 22% 7,4’-
dihydroxyflavylium
36808 Dracaena
cinnabari ?
Socotra,
donated by Prof IB Balfour Resin wrapped in bark.
Dracaena cinnabari
Circa 20% 7,4’-
dihydroxyflavylium
36809 Dracaena
cinnabari 1880
Socotra.
donated by Prof IB Balfour
Mixture of resin, pigment and bark.
Labelled as “Edah-Muck-Dehar”
“prepared from the boiled dust”
Dracaena cinnabari
Circa 19% 7,4’-
dihydroxyflavylium
36823 Dracaena
cinnabari 07-1881
Socotra.
donated by Prof IB Balfour
Powder.
Labelled as “Edah Dukkah”
“consisting of small fragments broken
tears of Dragons blood”
Dracaena cinnabari
Circa 20% 7,4’-
dihydroxyflavylium

22
79745 Dracaena
cinnabari ? Socotra, ? Tears of resin.
Dracaena cinnabari
Circa 5% 7,4’-
dihydroxyflavylium
36816 Dracaena
schizantha
23-04-
1871 Zanzibar; ? Resin.
Dracaena cinnabari?
Circa 15% 7,4’-
dihydroxyflavylium
- Dracaena
schizantha 2007 Kew gardens, Palm House Resin wrapped in bark
Dracaena schizantha
(D. ombet)
Circa 2% 7,4’-
dihydroxyflavylium
36819 Dracaena sp ? Socotra, ? Mixture of resin, pigment and bark.
Dracaena cinnabari
Circa 5% 7,4’-
dihydroxyflavylium
36820 Dracaena sp ? ? Mixture of resin, pigment and bark.
Dracaena cinnabari
Circa 12% 7,4’-
dihydroxyflavylium
36821 Dracaena sp 1906 Zanzibar, London Drug market Mixture of resin, pigment and bark.
Dracaena cinnabari
Circa 13% 7,4’-
dihydroxyflavylium
36822 Dracaena sp ? ?, donated by East India
Company Mixture of resin, pigment and bark.
Dracaena cinnabari
Circa 5% 7,4’-
dihydroxyflavylium
75793 Dracaena sp ? Socotra, Mixture of resin, pigment and bark.
Dracaena cinnabari
Circa 15% 7,4’-
dihydroxyflavylium
*The relative peak areas were calculated as described for table 1.3
The 36816 EBC, K sample, tentatively labelled as Dracaena schizantha from Zanzibar
and donated in 1871, also revealed the presence of 7,4’-dihydroxyflavylium, in 15% of the
total of the red chromophores, and a similar chromatographic elution profile to Dracaena
cinnabari resins (see figure 1.17A and 1.17B). Moreover, when the 36816 sample was
compared with resin from a living Dracaena ombet (synonym Dracaena schizantha) tree,
from Ethiopia [80], HPE, K collected in 2007, there was no match between the two (see
figure 1.17B and 1.17C). In the living Dracaena ombet tree, the relative percentage area of
7,4’-dihydroxyflavylium (circa 2%) was less than the second flavylium eluted (circa 6%),
contrary to the 36816 EBC, K sample and all the Dracaena cinnabari samples analyzed.
Furthermore, the compounds eluted between 22 and 28 minutes in the sample from the
living Dracaena ombet had different concentrations compared to sample EBC, K 36816
(see figure 1.17B and 1.17C). This is reflected in the PCA analysis that clearly shows that
the sample collected from the living Dracaena ombet is different from the Dracaena
cinnabari samples, whilst sample 36816 EBC, K Dracaena schizantha is similar to the
EBC, K Dracaena cinnabari samples (see appendix II – Dragon’s blood data, section II.2,

23
p. 105 for PCA graphics). It seems that the original label for specimen 36816 only referred
to dragon’s blood and not to the botanical name Dracaena schizantha which was
tentatively, but wrongly attributed some time in the history of its curation. As the analysis
shows, this specimen should have been labelled Dracaena cinnabari which also makes
sense historically as, at this time, there was an established trade route between Socotra
and Zanzibar [16]. Then, D. cinnabari was the most popularly traded dragon’s blood. There
is another sample of D. cinnabari from Zanzibar (EBC, K 36557) to support its presence in
trade there. As no species of Dracaena grow naturally in Zanzibar, the only other likely
source is D.ombet from N.E. African mainland but evidence suggests this species was
very little traded [81].
20 30
0,00
0,32
3
C
time, minutes
0,00
0,323
0,00
0,45
B
Absorbance at 462nm, A
u
A3
Figure 1.17 – HPLC profile of Dracaena cinnabari and Dracaena schizantha samples from EBC, K
collection. A) HPLC chromatogram profile of 36809 EBC, K Dracaena cinnabari sample (1880); B)
HPLC chromatogram profile of sample of 36816 EBC, K labelled Dracaena schizantha (1871); C)
HPLC chromatogram profile of a resin sample collected in 2007 from a living 28 year old Dracaena
ombet (synonym D. schizantha) tree from RBG, Kew. The two first chromatograms are also similar
to Dracaena cinnabari resins collected in 2007, see table 1.2, p. 15.
In all the unknown Dracaena sp. samples (36819, 36820, 36821, 36822, 75793) the 7,4’-
dihydroxyflavylium was detected and a similar chromatographic elution profile to Dracaena
cinnabari resins, confirmed by PCA, was found; this points to Dracaena cinnabari as the
source (see appendix II – Dragon’s blood data, section II.2, p. 105, for PCA graphics). In
the case of 36822, a sample labelled Dracaena sp. from the East India Company,
previously suggested to belong to Daemonorops sp. or a degraded Croton sp. [32], 7,4’-

24
dihydroxyflavylium was detected in its composition. Moreover, its HPLC profile was also
analogous to those of Dracaena cinnabari, strongly suggesting this species to be the
source of the resin. Pearson [16] discussed that frequently in the past resins traded out of
Bombay were assumed to be sourced from Daemonorops draco, but the East India
Company also had connections with Socotra and East Africa and so both species are
represented in dragon’s blood sourced from India.
1.3.3.3 Dracaena draco
Based on the dracoflavylium marker, of the 7 samples labelled as Dracaena draco from
the EBC, K, only four were in fact from Dracaena draco trees, namely, those that came
from botanical gardens (26387, 26421, 36824 and 78811, table 1.5).
Table 1.5 – Specimens of Dracaena draco samples from EBC, K analysed by HPLC-DAD
and percentage of the flavylium markers identified.
ID EBC, RBC
classification
Date of
donation
Provenance, donor Observations Species*
% flavylium marker
26397 Dracaena
draco 1867
Kew gardens, Palm
House Red resin fragments.
Dracaena draco
Circa 2% dracoflavylium
26421 Dracaena
draco. 1871 Tenerife, Canary Is, ?
Red wood.
Labelled as “Celebrated
Dragon tree of Tenerife”.
Dracaena draco
Circa 33% dracoflavylium
36516 Dracaena
draco ? “Socotra?”, ?
Mostly red resin.
Labelled as “Resin
wrapped in leaves”.
Daemonorops sp.
Circa 42% dracohodin
36653 Dracaena
draco ? Madeira, ? Red resin.
Dracaena draco +
Dracaena ombet/cinnabari
Circa 9% dracoflavylium
and 2% of 7,4’-
dihydroxyflavylium
36824 Dracaena
draco ?
Lisbon, Botanic
Garden
Mostly red resin.
Labelled as “Resin
wrapped in leaves”
Dracaena draco
Circa 5% dracoflavylium
36825 Dracaena
draco ? Tenerife, Canary Is, ?
Brown resin.
Labelled as “Gum-resin
exuded from the great
Dragon tree of Tenerife”.
Pterocarpus or Croton sp
(?)
Circa 37 % ellagic acid
78811 Dracaena
draco 06-09-2004
?, Adelaide, Botanic
Garden Red resin.
Dracaena draco
Circa 3% dracoflavylium
*The relative peak areas were calculated as described for table 1.3.
In the samples from the Botanical Garden of Lisbon (36824) and Adelaide, Botanic Garden
(78811), dracoflavylium accounted for 3% and 5%, respectively, of the total amount of the

25
red colourants. The wood sample 26421, from the famous “Great Dragon Tree” of
Tenerife, had dracoflavylium in high concentration (33%, see figure 1.18A) as was also
observed in three of the samples from old trees (circa 200 years old) from Madeira Island
in the data library (section 1.3.2, figure 1.15, p.16). On the other hand, the sample 36825
labelled as being from the same dragon tree, presented a brown colour instead of the
usual red colour and was composed of possible hydrolyzable tannins (see figure 1.18B),
where ellagic acid was identified. The occurrence of “tannins” in this specimen of dragon’s
blood resin has been already reported in 1895 by H. Trimble, who concluded that the
specimen was very similar to Pterocarpus draco L. or Croton draco Schltdl. [82]. Indeed, in
all resins from our Dracaena draco HPLC-DAD chromatogram library, “tannins” were not
found. Probably, this sample was not obtained from a Dracaena draco resin. Edwards et.
al [31] also noticed this sample was very different from other Dracaena draco samples, but
they could not disclose the family and chemical composition of the sample.
10 20 30
0,0
0,4
0,8B
Absorbance at 370nm, Au
Absorbance at 476nm, Au
time, minutes
E
0,0
0,2
2
A
Figure 1.18 – HPLC profiles of two resin samples labelled as Dracaena draco from the
“Great Dragon Tree” of Tenerife - EBC, K collection. A) 26421 Dracaena draco resin
sample with dracoflavylium (2) identified, B) 36825 sample labelled as Dracaena draco
resin, with ellagic acid (E) identified. The chromatogram B suggests this sample is not from
Dracaena draco resin; see text for further details.
Sample 36516 is not from Dracaena draco resin but Daemonorops sp. resin, since the
major compound observed was dracorhodin (42%), and no dracoflavylium was detected.

26
Edwards et al. [31] also suggested this sample could be from Daemonorops sp. However,
due to the weak features of the Raman spectra obtained, they were not able to confirm
this. The appearance of this sample, as sticks of resin wrapped in leaves, also suggests
this conclusion and, interestingly, although the original label is no longer with the sample in
the EBC, K, the database records "?Socotra" as the origin, suggesting illegibility in the
label; Sumatra (the major origin of Daemonorops) is not unlike Socotra if written illegibly.
Finally, sample 36653 from Madeira is possibly a mixture of different resins. Both 7,4’-
dihydroxy-5-methoxyflavylium (dracoflavylium) (9% of the relative area of the total red
compounds ) and 7,4’-dihydroxyflavylium (2% of relative area of the total red compounds)
were detected, pointing to a mixture of Dracaena draco and Dracaena ombet or Dracaena
cinnabari resins. Edwards et al. detected some differences between this and a Dracaena
draco sample from the Botanical Garden of Lisbon; however, a full identification of the
resin composition could not be obtained [31].
With these results, it was possible to conclude that the flavylium chromophores that
contribute to the red colour of dragon's blood resins can be used as species markers,
enabling an easy and rapid discrimination between Daemonorops and Dracaena.
Additionally, Dracaena draco and Dracaena cinnabari can be discriminated but Dracaena
cinnabari and Dracaena ombet share the same marker, although in different
concentrations. The use of the full chromatogram signal for PCA processing did not
provide any further discrimination, but the results were in full agreement with the
conclusions obtained using a single molecule marker. Therefore, the use of flavylium
compounds as species markers was clearly validated.
It was also possible to confirm in the EBC, K collection the inventoried sources of 25
samples of resins, identify species origins for 5 samples where previously only genus was
known (36819, 36820, 36821, 36822 and 75793) or where species was only tentatively
assigned (36816), and clarify or discuss incorrect attributions: 4 samples with incorrect
genus (35487, 35527, 36516, 36825), 1 sample correct to genus but incorrect to species
(35499) and 1 mixed collection (36653). These results suggest that other samples in the
EBC, K may benefit from re-examination using these techniques, especially items labelled
lump dragon’s blood arising out of India.

27
1.3.4 Flavylium markers characterization
After these positive results, a detailed characterization of the three flavylium compounds
identified in dragon’s blood resins is presented in order to understand the resins red
colour. The 7,4’-dihydroxyflavylium data is already published in the literature [83], and only
relevant aspects necessary to understand the final red colour of dragon’s blood resin are
presented.
1.3.4.1 Flavylium chemical reactions network – the dragon’s blood red colour
Dragon’s blood flavylium compounds, as reported in the literature, are involved in a
complex network of chemical reactions (figure 1.14, section 1.2) in which the different
forms can be reversibly interconverted by changing the pH. In acidic water, five species for
each dragon’s blood flavylium could be identified: 1) the flavylium cation (AH+) with a
yellow colour for the three compounds studied, where dracoflavylium and 7,4’-
dihydroxyflavylium present a maximum of absorbance more shifted to the reds (λmax circa
460 nm) due to the presence of a higher number of hydroxyl groups than in dracorhodin
(λmax=432 nm); 2) the quinoid neutral base reached by deprotonation of AH+, in which
dracoflavylium and 7,4’-dihydroxyflavylium present an orange-red base A with a maximum
at circa 495 nm and dracorhodin an orange base A with a maximum at 479 nm; 3) the
hemiketal (B) obtained by hydration of AH+; 4) the cis-chalcone (Cc) resulting from
tautomerization of B; and 5) the pale yellow trans-chalcone (Ct), with a maximum at circa
370 nm, formed from the isomerization of Cc. B and Cc are short-lived transient species
whose absorption spectra have not been determined experimentally for these three
flavylium compounds. In basic water, for dracoflavylium and 7,4’-dihydroxyflavylium it is
possible to obtain the pink ionized quinoidal base (A-); in the three dragon’s blood
flavylium compounds, the ionized trans-chalcones (Ct- and Ct2-), formed through the
deprotonation of the hydroxyl groups, were also found in equilibrium or as transient
species (see appendix II – Dragon’s blood data, section II.3, p. 107 for flavylium network of
chemical reactions).
In dragon’s blood resin, moderately acidic pH values were found (5-6) and therefore only
the acidic media and slightly basic media will be considered. More details about higher
basic pH can be found in specific literature [69].

28
1.3.4.1.1 Dracoflavylium
The spectral variations of the compound 7,4’-dihydroxy-5-methoxyflavylium occurring after
ca. 1 minute upon a pH jump from the stock solutions at pH=1 are shown in figure 1.19.
Figure 1.19. - Spectral variations occurring immediately (ca. 1 minute) upon a pH jump
from equilibrated solutions of the dracoflavylium (4x10⁻⁶ M) at pH=1.0 to higher pH values
pH=2.1; pH=3.8; pH=5.0; pH=5.7; pH=7; pH=7.5 and pH= 9.9). a) Immediately after the pH
jump; b) after thermal equilibration. The calculated pKas immediately upon a pH jump
(figure a) are 4.0 and 7.5 and are presented in the inset of figure b.
At very acidic pH values, the absorption band of the yellow flavylium cation is the
dominant species (λmax=476 nm); by increasing the pH, a new band centred at 493 nm is
obtained, due to the red quinoidal base A formation, pKa1=4.0; further increase of the pH
leads to an absorption band characteristic of the ionized base A-, pKa2=7.5. The spectra
reported in figure 1.19A are different from those of the equilibrium, presented in figure
1.19B. In the equilibrium, at acidic pH values, the flavylium cation is once more the
dominant species, but at higher pH values, the equilibrium is established between the
base A (63%) and the trans-chalcone Ct (37%), see figure 1.20.
AH+
A A-
a 0
0.1
0.2
200 300 400 500 600 700
A
Wavelength (nm)
0
0.1
0.2
0
1
2 4 6 8 10 12
A
Mo
le F
ractio
n
pH
pKa1
=4.0
pKa2
=7.5
b
AH+ A A
-
AH+
A
A-
AH+
A

29
0
1
2 4 6 8 10 12
Mole
Fra
ction
pH
A-
Ct-
Ct2222-
A
Ct
AH+
Figure 1.20 - Mole fractions distribution with pH for dracoflavylium at the equilibrium (for
more details, (see appendix II – Dragon’s blood data, section II.3, p.107).
1.3.4.1.2 Dracorhodin and 7,4’-dihydroxyflavylium
The spectral variations of both dracorhodin and 7,4’-dihydroxyflavylium are similar to those
reported above for dracoflavylium. The intensity of the AH+ band (λmax=432 nm for
dracorhodin and λmax=456 nm for 7,4’-dihydroxyflavylium) decreases with increasing pH
and two bands with maxima near 370 nm and near 490 nm appear (A: λmax=479 nm for
dracorhodin and λmax=493 nm for 7,4’-dihydroxyflavylium, assigned to trans-chalcone and
quinoidal base respectively (see figure 1.21).
300 400 500 600
0,0
0,5
1,0
A
Wavelenght/ nm
300 400 500 6000,0
0,5
1,0
A
Wavelenght/nm
Figure 1.21 - UV/Vis absorption spectra of dracorhodin (5X10⁻⁶ M) at pH=1.0 to higher pH
values: pH=2.5; pH=3.4; pH=5; pH=5.5; pH=6.2. a) immediately after the pH jump; b) after
thermal equilibration. Insets: calculated pKa1.
In dracorhodin, at moderately acidic pH values such as those measured for the resin, the
concentration of the red base is also very high with circa 63%, (see appendix II – Dragon’s
blood data, section II.3, p.109), which is similar to what was found for dracoflavylium.
However, for the 7,4’-dihydroxyflavylium at pH around 5-6, the quinoidal base has a
0 2 4 60,0
0,5
1,0
A
pH
pKa1=3.3
0 2 4 6
0,0
0,5
1,0
pK'a1=3.4
A
pH

30
concentration of only 10%, being the major compound the pale yellow trans-chalcone with
90%. Therefore, for 7,4’-dihydroxyflavylium the cis-trans isomerization (ki =1x10³ s-1) is
faster than the deprotonation (ka1=1x10⁻⁴ s-1), the tautomerization and the hydration
(kh=1.4x10⁻⁶ s-1) processes, leading to a high amount of Ct in moderately acidic media [83].
Both dracoflavylium and dracorhodin are the first natural flavylium compounds for which
the base is the major species at biological pH (more than 60%). For the most common
anthocyanins and 3-deoxyanthocyanidins in moderately acid to neutral pH, colourless B is
the major species, together with Ct. The final colours, especially the blue colour present in
flowers, are obtained through complex supramolecular structures [84,85]. The high content
of red quinoid base in the equilibrium at moderately acidic pH for these two flavylium
compounds can be related to the substituent groups and their position in the flavylium ring.
It is interesting to note that both flavylium compounds with a higher content of red quinoid
base have a methoxy group in the 5 position of the flavylium ring and a hydroxyl group in
the 4’ position. In order to evaluate the influence of the substituent groups in the formation
of the red quinoid base A, other flavylium compounds should also be characterized, for
instance a flavylium with the same substituent groups in different positions (e. g. 7,5-
dihydroxy-4’-methoxyflavylium) as well as apigenidin (7,5,4’-trihydroxyflavylium).
Apigenidin is a 3-deoxyanthocyanidin, the chemical ancestor of anthocyanins, with a
molecular structure which can be considered between anthocyanins and synthetic
flavylium salts.
1.4. Conclusions
With the characterization of dragon’s blood resins it was possible to conclude that the red
colour of the resins is due to the presence of several natural flavylium compounds which
are characteristic of the family resin source. It was demonstrated for the first time that
these natural flavylium compounds can be used as species markers, enabling an easy and
rapid discrimination between Daemonorops and Dracaena dragon’s blood resins.
The high percentage of the red quinoid base found in the equilibrium for the natural
flavylium with an OMe group in position 5 of the 2-phenyl-1-benzopyrylium core reveals
that Nature found a new strategy with this structure to stabilize the red colour in plants,
besides the usual anthocyanins and deoxyanthocyanidins. In the deoxyanthocyanidins, the
2-phenyl-1-benzopyrylium structure has a hydroxyl group in position 5 and as a result
stable yellow and red molecules are obtained. However, in this case, the percentage of the
red basic form in the equilibrium [86] is not as high as in the natural flavylium with an OMe
group also in position 5. These results suggest that the substitution of the OH group in

31
position 5 by the OMe is related with a natural evolution of the 2-phenyl-1-benzopyrylium
compound to obtain more intense red colours. In order to confirm these results the
characterization of apigenidin will be fundamental.
Nevertheless, with these approaches, natural flavylium compounds and
deoxyanthocyanidins, only the yellow and red colours are obtained. In order to obtain the
blue colours, the hydroxylation in position 3 is a fundamental step (anthocyanidins).
However, this substituent in this position gives also instability to the molecule. The problem
was solved by incorporating glycosides in that position, leading to more stable species as
anthocyanins. Yet, at moderately acidic pH values, the blue colour is reminiscent at the
equilibrium. The final known solution found by Nature was the construction of
supramolecular structures [84,85].

32
Chapter 2-Indigo Dye
2.1 Indigo dye overview
Indigo blue is one of the oldest organic dyes used on textiles and has been known since
Egyptian and Roman civilizations [2,3]. It is considered a very stable organic dye which
can explain its wide application not only in textiles but also in paints and inks, and
longevity [2,3,86-88]. Indeed, synthetic indigo is still used today in the production of blue
jeans and even the production of indigo with microorganisms according to green
chemistry principles has been recently investigated [89].
It was in 1897 that the Badische Anilin und Soda Fabrik (BASF) introduced the synthetic
indigo to the market [90]. Before that, indigo was obtained from hundreds of different
plants belonging to the Leguminosae, Papilionoidae, Cruciferae and Polygonaceae
families, among others [2,3,88]. In Europe the main source of indigo was Isatis Tinctoria
L. while in Asia it was obtained mostly from Indigofera tinctoria L. [2,3,88]. In the XVII
century, the Indigofera tinctoria L. replaced the Isatis tinctoria L. in Europe once it
produced a higher content of indigo dye [90]. However, in the present state-of-the-art it is
not possible to distinguish the vegetable dyeing source in indigo dyed textiles, since only
indigotin and indirubin (a structural isomer of indigotin) is retained in the fibre and no other
markers have been identified until now [2,3,91-93]. Moreover, it is still to be learned how
the dyeing process changes the relative amounts of indigotin and indirubin in the final
dyed textile, because both chromophores come from the same initial precursors [94].
2.2 Chemical composition – revealing the blue colour
The indigo dye is composed mainly by indigotin, a C16H10N2O2 compound synthesised for
the first time by Adolf von Baeyer and Emmerling in 1870 using isatin as starting material
[90]. Its correct structural formula was discovered circa ten years later by Bayer, in 1883
[90].
The precursors of indigotin in the plant leaves are the glycosides of indoxil, namely
indican and isatan B. During the fermentation process, the indoxyl glycosides are
converted by enzymatic hydrolysis to indoxyl which is then converted to leuco-indigo and
finally oxidised by exposure to air to indigotin. Simultaneously, the indoxyl can also be
converted to indirubin [87,94,95] (for more details see figure 2.1).

33
NH
O O
OH
OH
OHHO
NH
O O
OH
OH
OHO
NH
OH
NH
O
NH
O
O
Indican Isatan B
Indoxyl (enol form) Indoxyl (ceto form) Isatin
[O]
[O]
NH
OIndirubin
NH
HN
OH
HO
NH
O
Leuco-Indigo
NH
HN
O
O
Indigotin
2H+,2e-
Figure 2.1 – Production of indigotin and indirubin from plant leaves [94].
The indigo dye belongs to the dye family known as vat dyes which are composed by
derivatives of indigotin as the famous and expensive Tyrian Purple obtained from
Mediterranean shellfish [2,3]. These vat dyes, either from plants or animals, when initially
extracted, are present as colourless precursors. Only through exposure to air they reveal
their final colour, due to the oxidation of the leuco form to the keto species. In this state,
the vat dyes are insoluble in water and precipitate in the textile fibres [2,3].
2.3 Indigo photodegradation
Photodegradation studies of indigo date back to the 1980s, when it was found that
irradiations at λ> 390 nm of indigo dissolved in different organic solvents such as
chloroform, methanol or acetone, produced isatin [96,97] (see figure 2.1). A self-sensitized
photooxidation for the photodegradation mechanism of indigo was proposed based only in
two observations: i) indigo in a solution of 2,5-dimethyl furan and methanol leads to the
formation of 2-hydroperoxy-5-methoxy-2,5-dimethyldihydro furan; ii) in the presence of

34
nickel dimethyldithiocarbamate (a singlet oxygen quencher) the photodegradation of indigo
in chloroform is decreased. A more recent work [98] showed that a polychromatic
irradiation of indigo dissolved in dichloromethane promoted the formation of isatin, isatoic
anhydride and anthranilic acid.
In both works, no photodegradation quantum yields were obtained. The only published
photodegradation quantum yields refers to a 254 nm irradiation of indigo carmine [99], the
water soluble derivative of indigo (figure 2.2).
NH
HN
O
O
NaO3S
SO3Na
Figure 2.2 - Indigo carmine.
This dye is being studied as a probe for ozone production in antimicrobial and
inflammatory actions of neutrophil cells [100,101] and as a contaminant in wastewaters
that should be removed [99,102]. The advanced oxidation processes (AOPs) used for its
destruction in contaminated water were carried out with ultraviolet irradiation in the
presence of hydrogen peroxide or the heterogeneous catalyst TiO2 [99]. It was observed
that the mechanism and main products resulting form UV (lirr= 254 nm) and UV/H2O2
photodegradation were different from those obtained with UV/TiO2. In the first case, the
process evolved in two steps, where in the first step isatin sulfonate was the main product
and in the second step isatin was converted into alipahtic acids. For the heterogeneous
UV/TiO2 systems it was concluded that indigo carmine molecules were oxidized to
biodegradable breakdown products such as formic, acetic and oxalic acids [99].
Recently, other studies presented quantum yields for the possible generation of 1O2 by
indigo and indigo carmine [103], suggesting that intersystem crossing competes with
internal conversion, contrarily to previous photophysical studies of the keto and leuco
forms of indigo and its derivatives [104-106]. From the photophysical characterization of
indigo, it was possible to conclude that in the case of the keto form the major deactivation
pathway involved a very efficient internal conversion from the lowest singlet excited state
to the ground-state, whereas in the case of the leuco form competition occurred between
the internal conversion, triplet formation and fluorescence deactivation processes. These
differences between the two forms reveal that the leuco form is less photostable than the
keto indigo species.

35
Therefore, in order to understand the reactivity of the molecule, electrochemical
characterization of the transformation of the indigo keto form in its leuco form (figure 2.3),
namely the mechanisms involved in the disruption of the central double bond, should be
considered.
Figure 2.3 – Indigo reduction mechanism in non acidic media, adapted from [107].
A stopped flow study on indigo carmine reduction by dithionite (S2O42− ) concluded that the
mechanism was a two-step reduction (figure 2.3) and that the reduction potential was pH
dependent. Further studies on the electrochemical reduction of indigo dissolved in organic
solvents (DMSO, DMF) [107] confirmed the general reduction mechanism. More recently,
an indigo radical anion was identified by EPR in the electrochemical reduction [108].
2.4 Results
In this work, significant effects of solvent purity on quantum yields of reaction for indigo
and its water soluble derivative indigo carmine were observed. Quantum yields of reaction
were obtained at 335 nm and 610 nm irradiation wavelengths in homogenous organic and
aqueous solutions, as well as in transparent gels (proteinaceous and cellulosic). This
design aimed to reproduce the dye environment in textiles, such as silk, wool and cotton,
and monochromatic irradiation wavelengths were used in order to determine effectively the
quantum yields of reaction. The reactions kinetics were monitored by UV-visible absorption
and the resulting photoproducts were characterized by HPLC-DAD. The influence of
oxygen on the reaction mechanisms is presented. Indigo in the solid state was irradiated
with a Xenon polychromatic source, with a spectral distribution close to the solar spectrum.
The main products and mechanisms are compared to those obtained with monochromatic
irradiation. Finally, the blues of millenary Andean textiles are characterized and the
degradation products found herein are compared to the experimental simulation.
keto species indigo radical leuco species
NH
HN
O
O
NH
HN
-O
O-.
NH
HN
-O
O+ 1 e-
+ 1 e-

36
2.4.1 Monochromatic irradiation in homogeneous media
2.4.1.1 Indigo in DMF
Indigo was irradiated at 335 and 610 nm in N,N-dimethylformamide (DMF). Its UV-vis
spectrum is presented in figure 2.4, together with isatin. The wavelength maxima and
molar absorption coefficients (table 2.1) show that, with both irradiation wavelengths,
indigo is the main absorbing species. Irradiations at lower wavelengths as 254 nm [99]
were purposely avoided, since this type of irradiation is rarely, if ever, encountered under
glass indoors and can give rise to different reactions than those induced by the near
ultraviolet and visible [109].
Figure 2.4 – UV-vis spectra of indigo (A) and isatin (B) in DMF.
Table 2.1 - Absorption maxima and extinction coefficients of indigo, isatin and indigo
carmine in DMF at T=293 K. 34are also presented for 335 nm.
λmax /
nm
εmax / L mol-
1cm-1
ε335 / L mol-
1cm-1
Indigo 610 22 900 11500
Isatin 418 1500* 440*
Indigo carmine 618 17 800 10000
Indigo carmine / H2O 610 19 400 10100
* estimated error 25%; for all other values estimated error ≤ 10%.
The DMF solvent was chosen as indigo does not dissolve in water and DMF is one of the
few solvents where the complete dissolution of indigo is achieved, enabling the
preparation of concentrated solutions that will absorb all the incident photons of the light
source. Moreover, the DMF is currently used in the extraction of indigotin from indigo dyed
textiles.
300 400 500 600 7000
20000
40000
εε εε(L.mol-1.cm
-1)
Wavelength (nm)
A
B

37
It is important to stress here that only freshly distilled or freshly opened DMF was used to
obtain the reaction quantum yields. In indigo solutions prepared with aged DMF it was
observed that isatin was produced in the dark. For instance, the blank solution kept in the
dark was reacting almost at the same rate as the indigo solution irradiated at 610 nm.
The quantum yields of reaction, 4ΦR, were obtained in the presence of O2 with atmospheric
conditions, in degassed solutions (high vacuum line) and in N2 atmosphere (table 2.2).
Degassed solutions enabled to obtain lower levels of O2 and therefore were considered as
the values for ΦR in the absence of molecular oxygen.
Table 2.2: Quantum yields of reaction,4ΦR, for indigo in DMF at T=293 K, in the
presence and absence of molecular oxygen, for more details (see appendix III – Indigo
data, section III.1, p. 110, for I0 and ΦR ).
Presence O2 Absence O2
λirr (nm) 335 610 335 610
ΦΦΦΦR 8 x 10⁻³ 4 x 10⁻⁴ 3 x 10⁻⁴ *
* Lower than 10-6, it was not possible to determine with the utilized irradiation set-up.
In the presence of O2, ΦR is 20 times lower for irradiation at 610 nm when compared to
335 nm. Also, comparing the values for irradiation at 335 nm with and without oxygen, the
difference is similar. It was not possible to compare the ΦR for irradiation at 610 nm
because, in the absence of oxygen the ΦR was to low (<10-6) to be calculated with the
available irradiation set-up. Irradiation was also followed by HPLC-DAD and, for both
irradiation wavelengths isatin was detected as the major photodegradation product, circa
80% of the relative peak area of total compounds in solution (figure 2.5, see appendix III –
Indigo data, section III.2, p.111, for HPLC-DAD calibration curves). Two other minor
components with less than 10% of the relative peak area of total compounds in solution
(see appendix III-Indigo data) were also formed, see appendix III – Indigo data, section
III.3.1, p.112, for indigo HPLC-DAD chromatograms). These compounds, on the basis of
their mass spectra and by comparison with HPLC standards, could not be isatoic
anhydride (C8H5NO3), anthranilic acid (C6H4(NH2)CO2H) or tryptanthrin (C15H8N2O2) [98].
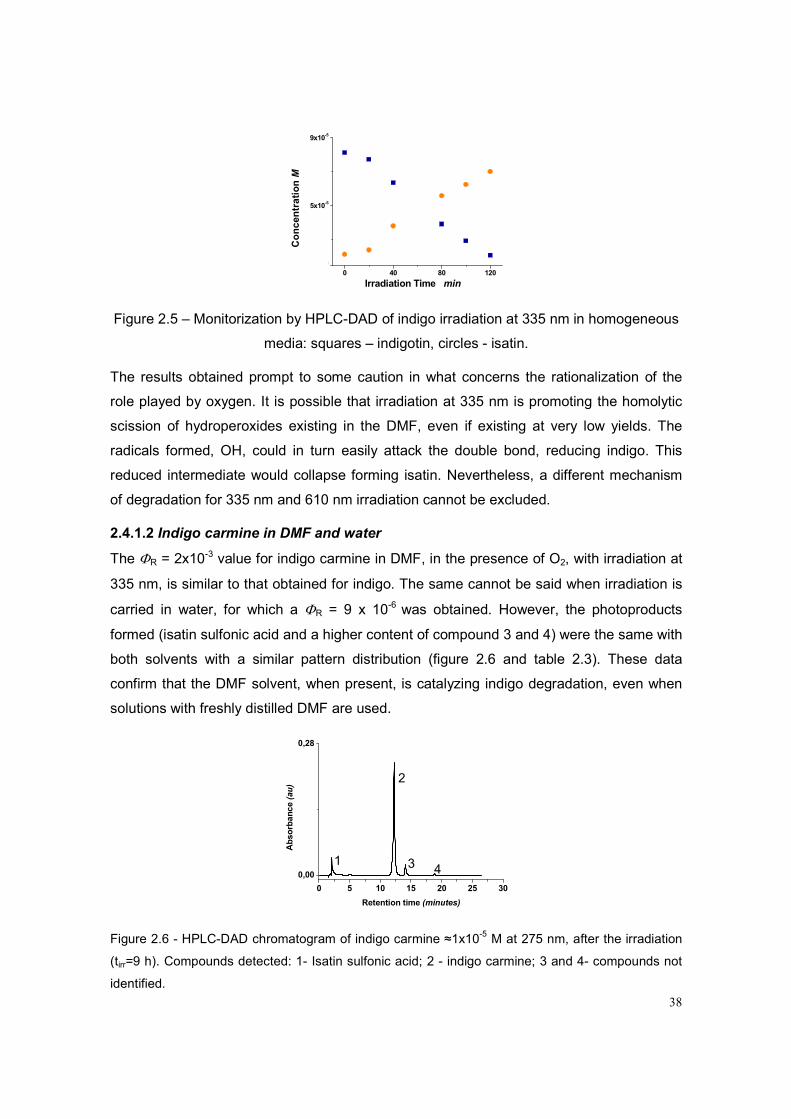
38
0 40 80 1205x10
-6
5x10⁻⁵
9x10⁻⁵
Irradiation Time minConcentration M
Figure 2.5 – Monitorization by HPLC-DAD of indigo irradiation at 335 nm in homogeneous
media: squares – indigotin, circles - isatin.
The results obtained prompt to some caution in what concerns the rationalization of the
role played by oxygen. It is possible that irradiation at 335 nm is promoting the homolytic
scission of hydroperoxides existing in the DMF, even if existing at very low yields. The
radicals formed, OH, could in turn easily attack the double bond, reducing indigo. This
reduced intermediate would collapse forming isatin. Nevertheless, a different mechanism
of degradation for 335 nm and 610 nm irradiation cannot be excluded.
2.4.1.2 Indigo carmine in DMF and water
The ΦR = 2x10⁻³ value for indigo carmine in DMF, in the presence of O2, with irradiation at
335 nm, is similar to that obtained for indigo. The same cannot be said when irradiation is
carried in water, for which a ΦR = 9 x 10⁻⁶ was obtained. However, the photoproducts
formed (isatin sulfonic acid and a higher content of compound 3 and 4) were the same with
both solvents with a similar pattern distribution (figure 2.6 and table 2.3). These data
confirm that the DMF solvent, when present, is catalyzing indigo degradation, even when
solutions with freshly distilled DMF are used.
0 5 10 15 20 25 30
0,00
0,28
Absorbance (au)
Retention time (minutes)
Figure 2.6 - HPLC-DAD chromatogram of indigo carmine ≈1x10⁻⁵ M at 275 nm, after the irradiation
(tirr=9 h). Compounds detected: 1- Isatin sulfonic acid; 2 - indigo carmine; 3 and 4- compounds not
identified.
1
2
3 4
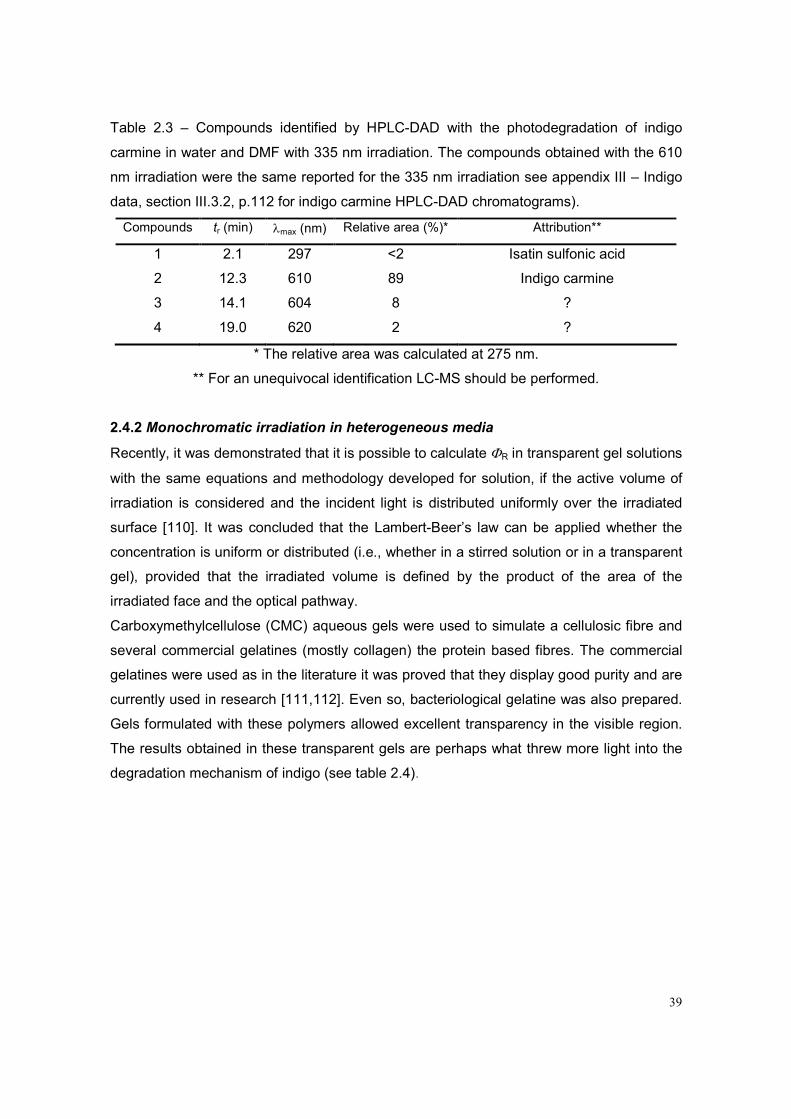
39
Table 2.3 – Compounds identified by HPLC-DAD with the photodegradation of indigo
carmine in water and DMF with 335 nm irradiation. The compounds obtained with the 610
nm irradiation were the same reported for the 335 nm irradiation see appendix III – Indigo
data, section III.3.2, p.112 for indigo carmine HPLC-DAD chromatograms).
Compounds tr (min) λmax (nm) Relative area (%)* Attribution**
1 2.1 297 <2 Isatin sulfonic acid
2 12.3 610 89 Indigo carmine
3 14.1 604 8 ?
4 19.0 620 2 ?
* The relative area was calculated at 275 nm.
** For an unequivocal identification LC-MS should be performed.
2.4.2 Monochromatic irradiation in heterogeneous media
Recently, it was demonstrated that it is possible to calculate ΦR in transparent gel solutions
with the same equations and methodology developed for solution, if the active volume of
irradiation is considered and the incident light is distributed uniformly over the irradiated
surface [110]. It was concluded that the Lambert-Beer’s law can be applied whether the
concentration is uniform or distributed (i.e., whether in a stirred solution or in a transparent
gel), provided that the irradiated volume is defined by the product of the area of the
irradiated face and the optical pathway.
Carboxymethylcellulose (CMC) aqueous gels were used to simulate a cellulosic fibre and
several commercial gelatines (mostly collagen) the protein based fibres. The commercial
gelatines were used as in the literature it was proved that they display good purity and are
currently used in research [111,112]. Even so, bacteriological gelatine was also prepared.
Gels formulated with these polymers allowed excellent transparency in the visible region.
The results obtained in these transparent gels are perhaps what threw more light into the
degradation mechanism of indigo (see table 2.4).

40
Table 2.4 - Quantum yields of reaction,4ΦR, for indigo carmine in aqueous gels and water
at T=293 K, in the presence of molecular oxygen, (see appendix III – Indigo data, section
III.2, p. 110, for I0 and ΦR ).
ΦR Medium
λirr 335 nm λirr 610 nm
H2O 9 x 10⁻⁶ *
DMF 2 x 10⁻³ -
CMC 5 x 10⁻⁴ 2 x 10⁻⁴
Vahine gelatine 4 x 10⁻⁴ 5 x 10⁻⁴
Jerónimos gelatine 9 x 10⁻⁴ 4 x 10⁻⁴
Bacteriological gelatine 2 x 10⁻³ 3 x 10⁻⁴
* Lower than 10-6, it was not possible to determine with the utilized irradiation set-up. The ΦR of indigo carmine in DMF was not performed.
When photodegradation of indigo carmine in DMF is compared with indigo carmine in
water solution (gels), the ΦR obtained is circa 2 orders of magnitude higher. Taking into
account that these gels are water based gels this is an unexpected result, as in more
confined environments we would expect to have lower photodegradation reaction rates
and not 2 orders of magnitude higher. It is well known that both cellulose based materials
and proteinaceous ones are prone in developing hydroperoxides [113]. These, in turn, can
absorb light in the visible region and in the excited intermediate state can evolve through
intra or intermolecular reactions with the formation of carbonyl groups and other radicals.
Carbonyl groups can further act as chromophores and evolve into a series of Norrish
reactions, with further bond breaking and formation of other reactive carbonyl functions
and radicals. The results obtained with the bacteriological pure gelatine further sustain this
line of reasoning; contrary to the other gelatines acquired as tablets, this was sold as a
powder that could not be previously washed with cold water (the gel is prepared with warm
water), procedure adopted for the commercial gelatines. This washing would enable the
quenching of radicals present in the protein structure as well as the removal of degraded
material more polar and soluble in water. When irradiated at 610 nm (where the
hydroperoxides cannot absorb), the ΦR obtained is similar to the other gelatines, but when
irradiation is carried out at 335 nm, the values are almost one order of magnitude higher
for the bacteriological gelatine (figure 2.7).

41
Figure 2.7 – Photodegradation of indigo carmine in bacteriological gelatine with irradiation
at 335 nm. In the inset the absorbance variation followed at 610nm, is plotted over time,
giving the m parameter of the ΦR equation, for more details, see Appendix II – Indigo data.
The main products formed in cellulose or proteic gels at both irradiation wavelengths are
the same as those obtained for indigo carmine when dissolved in water. Moreover, a
similar distribution of the principal compounds could also be found.
2.4.3 Polychromatic irradiation in heterogeneous media
Indigo deposited in creased glass surfaces creating a homogeneous blue surface
(L*=44.52±0.36; a*=-0.70±0.04; b*=-12.00±0.15 [114]) was irradiated with a Xenon lamp
with a cut-off filter till 300 nm, simulating the sunlight exposure (see appendix I –
Experimental section, p. 93). The reaction was followed by periodically measuring colour
changes with a colorimeter and the photodegradation profile was characterized as
previously by HPLC-DAD, after full extraction of the indigotin with DMF from the glass
surfaces. Circa 0.10 mg after 1700 hours/5950 MJ of irradiation faded almost totally
(L=82.00±0.41, a*=-1.95±0.12, b*=3.23±0.16), corresponding to circa 120 years in a
museum display (see appendix III- Indigo data, section III.3, p. 113). It was possible to
confirm that the photodegradation of indigo in the solid state was similar to what was
observed with monochromatic irradiation, being isatin the major product formed. However,
the concentration of isatin formed in the solid state was very low when compared with the
indigo in homogeneous media (figure 2.8). One of the reasons for this low content of isatin
300 400 500 600 700
2,3A
bso
rba
nce
(A
u)
Wavelenght (nm)
0 10 20 30
0,0
0,3
0,5
y = 0,0173x + 0,011
R2 = 0,9966Delta A
Time (minutes)

42
can be its possible degradation during the indigo irradiation due to the absorbance of short
wavelength radiation by isatin.
0 1500 30000
1x10⁻⁴
Co
nce
ntr
atio
n (
M)
Time irradiation (min)
Figure 2.8 - Monitorization by HPLC-DAD of indigo photodegradation in the solid state.
Squares – indigotin; Circles –isatin.
2.4.4 Characterization of the degradation products in Andean millenary textiles
The blues from 11 textiles of the pre-Colombian civilization of Paracas, 500 BC – 200 AD,
and one of Nasca, 200 AD, in a total of 17 samples, were analysed by HPLC-DAD (see
appendix I-experimental section, p.93 for extraction methods).
In all the 19 samples analysed, indigotin (tr = 25.00 min, λmax = 614 nm) was identified as
the main colourant. A high amount of indirubin (tr = 26.23 min, λmax = 544 nm), as reported
by Wouters for textiles from these cultures [115], was also found (see table 2.5 and
appendix III-indigo data, section III.4, p. 114, for Andean sample HPLC-DAD
chromatogram).
In all the samples analysed, the presence of isatin (tr = 8.50 min, λmax = 242, 302 nm) and
an unknown compound (tr = 6.82 min, λmax = 311 nm), previously identified in indigo
homogeneous and heterogeneous media photodegradation, was detected. This unknown
compound was identified in less than 50% of the samples analysed with a relative
percentage inferior to 10% and, as its epsilon was not known, it was excluded from table
2.6.

43
Table 2.5 – Relative concentration of the principal chromophores and main products
identified in Andean Textiles by HPLC-DAD.
Textile Sample
Indigotin
(%)* Indirubin
(%)* Isatin (%)*
Dark blue 77 12 11 Blue 41 20 39
Skirt 200BC – 200AD
Blue 58 13 29 Dark blue 55 21 24 Poncho fragment
0 – 100AD Light Blue 63 23 14 Man’s Poncho,
100 BC – 0 Blue 60 16 24
Blue 89 3 8 Dark blue 79 14 7
Fragment, Nasca, 300 AD
Light blue 90 2 8 Dark blue 75 9 16 Border Fragment
0 – 200AD Dark blue 73 11 16 Fragment
0 – 200 AD Light blue 28 17 55
Dark blue 70 8 22 Border Fragment 0 – 50AD
Dark blue 85 5 10
Mantle Border 100 BC – 100 AD
Blue 51 29 20
Mantle Border 100 BC – 100 AD
Blue 81 11 8
Fragment (100-200 AD)
Light Blue 90 - 10
Turban 100BC – 100AD
Blue 50 45 5
* the respective areas of the compounds were calculated at their maximum wavelength
and represented as a function of the concentration, for more details see experimental
section.
The identification of the same products in these blue textiles, where isatin was once again
the major product formed, confirms the results obtained for indigo photodegradation in
liquid and solid media. Isatoic anhydride, tryptanthrin and anthranilic acid, reported in [98],
were not found.
2.5 Conclusions
With these results it is possible to conclude that indigo is a stable dye, as referred in the
literature [2,3]. It was demonstrated that the main photodegradation reaction that occurs is
the cleavage of the central double bond of indigotin, leading to the formation of isatin. This
reaction can be promoted by the presence of electron donors such as free radicals that will
easily attack the double bond, reducing indigotin. It is in this reduced state, which is more
reactive than the indigotin keto form, that the central covalent bond will be cleaved forming
isatin. This was further confirmed by the indigo carmine photodegradation in cellulosic and

44
protein based gels which revealed higher ΦR than those observed for the indigo carmine
photodegradation in water, due to the possible presence of radicals. Moreover, when the
photodegradation of indigo and indigo carmine were carried out in DMF, it was also
verified that both ΦR obtained were higher than the ΦR obtained for indigo carmine
dissolved in water. Tests, including the irradiation of DMF solvent at 335 nm, revealed that
several compounds, possibly hydroperoxides, were formed. The contribution of several
radicals for the photodegradation of indigo dye excludes therefore that the main
photodegradation mechanism is the oxidative degradation of indigotin through singlet
oxygen. Moreover, this explanation did not support the photophysical studies of indigotin,
where it was found that the degradation of indigo was unlikely to occur through interactions
with triplet oxygen due to the low yields of singlet oxygen formation [106].
Anyway, the best approach to photodegradation of indigo dyed fibres was the
photodegradation of indigo carmine in water as it revealed to be very stable, without extra
contribution of free radicals. These radicals developed in cellulose and gelatine gels
probably will accelerate the indigo photodegradation more than the indigo dyed textiles. It
should be stressed that indigo dye is really a stable molecule due to the hydrogen bonds
between adjacent carbonyl and N-H groups that keep the molecule in a stable trans-planar
configuration [105,106] preventing its photoreactivity; therefore, low ΦR can be expected in
textile environments.

45
Chapter 3 - Mauve Dye
3.1 Mauve dye overview
The synthetic colourant mauve was discovered in 23 March 1856 by the eighteen-year-old
chemist William Henry Perkin (1838-1907) [1,116,117]. Perkin was trying to synthesize
quinine from coal-tar chemicals, although this was just achieved almost a century later by
Woodard and Doering [118]. The quinine compound was used against the malaria disease
and at that time it was obtained from the bark of chinchona tree [118]. August Hoffman, the
director of the Royal College of Chemistry in London, where Perkin studied, suggested
that it might be possible to prepare quinine from a suitable amine derivative [119,120].
Perkin tried an oxidative dimerisation of allyltoluidine (C10H13N) with potassium dichromate,
once the allyltoluidine had almost half of the molecular weight of quinine (C20H24N2O):
2(C10H13N) + O3 = C20H24N2O2 + H2O [119-122]. However, instead of the colourless
quinine, Perkin obtained a “dirty reddish brown precipitate”. In order to understand the
reaction, he repeated the process using a simpler compound, aniline, and once more he
obtained a coloured precipitate [119-122]. The majority of his contemporary chemists
would have discarded this black precipitate, once the formation of coloured amorphous
compounds was considered an indication of non-crystalline compound formation and
failure of the reaction [117,120]. For instance, it is known that Hoffman in 1858 obtained
accidentally the fuchsine dye (rosaniline); however, he was so concerned with the reaction
under study that he regarded it as an impurity [121]. Nevertheless, Perkin treated the black
precipitate with water, coal-tar naphtha and methylated spirits of wine (i.e. methanol),
obtaining a deep purple solution which dyed silk very well and was resistant to light [119-
123].. He sent some specimens of dyed silk to the famous dyers Pullars of Perth that
considered the colour as good as one of their best lilac [116,117,119,120,122-123].
Furthermore, as they report, at that time the purple color was very fashionable [124].
Moreover, it was obtained with the semi-synthetic murexide dye produced with deposits of
bird droppings (guano) or with the vegetable French Purple dye produced with lichen,
which faded rapidly [118,125]. Therefore, the discovery of a stable purple colour, not very
expensive, would be of great interest for dyers. This was not compatible with the low yield
of the reaction (less than five per cent of mauve dye was obtained per each synthesis), the
difficulty of obtaining raw-material in relevant amounts and inexpensive manner, the need
of large scale-up and finally the difficulties encountered on dyeing with a new class of
dyestuffs [116,117,119,120]. For instance, the mauve dye displayed a great affinity to silk
fibre which caused unevenness in the dyed textile fabric and in cotton textiles it could not

46
resist to the action of soap [119,120]. Even so, in 1856 a patent was secured (granted on
26 August 1856 and sealed on 20 February 1857 [126]), and in June 1857 with his father
George Perkin and his brother Thomas Perkin, Perkin started the works on the mauve dye
in a small factory at Greenford, Middlesex [116,117,119,120]. After six months, the mauve
dye, under the name of “Aniline Purple” or “Tryan Purple” (to suggest a connection to the
ancient royalty purple colour obtained with thousands of tiny marine molluscs), was being
manufactured in an amount enough to supply Thomas Keith’s house at Bethnal Green, the
largest silk dyer of London [116,117,119,120,125]. The initial problems were rapidly
overcome: the Bechamp’s discovery of the nitrobenzene conversion into aniline with iron
and acetic acid in 1854 [127], were installed at the Greenford Green Factory in 1857 and it
was possible to obtain costless aniline [128]. Special apparatuses were developed for the
large scale production. It was found that large pieces of silk could be dyed in a soap bath
in order to prevent unevenness, and in 1857 Perkin with the dyer Pullar discovered a
mordant tannin based process to dye cotton textiles in a permanent way [119,120]. Even
the mauve synthesis was optimized in order to obtain a more water soluble colourant and,
as a result, the initial amorphous paste sold as sulphate salt was replaced by the soluble
mauve acetate salt which required aniline with higher contents of toluidine [129]. It was
also noticed that aniline with large amounts of toluidine produced a redder shade of purple,
while aniline with little toluidine produced a blue shade of purple and, taking advantage of
this, two different products were manufactured [129].
In 1859, Perkin’s mauve dye was a success in France, where the name mauveine and
mauve were adopted in association with the pale-violet mallow flower (Latin: malva). From
silk, dyeing was extended to cotton dyeing and calico printing. The purple shade became a
favourite colour of Empress Eugenia and Queen Victoria and immediately spread all over
France and England, being the mauve apogee in the early 1860s
[116,117,121,122,124,125]. Since Perkin was not able to patent the manufacture of his
mauve dye in France, the French colourists and chemists started to replicate and improve
the mauve dye process during this period. Even in Britain, in 1860, the Roberts Dale & Co.
factory started producing mauve dye using copper salts instead of the usual potassium
dichromate to oxidise aniline. Although this process was not as efficient as the process
developed by Perkin, they started competing with the Perkin’s & Sons factory [130,131].
Very soon other synthetic dyes from coal-tar chemicals were also discovered and made
available in large scale. The aniline red, also known as magenta (Britain) and fuchsine
(France), was discovered in 1859 by Verguin [132,133]. In 1861, aniline red was converted
into a blue dye and in 1863 into Hoffman’s violets (more brilliant but less resistant to fading

47
than the mauve dye), which began to threaten the sales of mauve [132,133]. Indeed, after
1863, the production of the mauve dye declined and, although it was used for about 10
years, the production ceased in 1873. In 1 January 1874 Perkin sold his factory and
dedicated his full-time to chemical research, being very well known, for instance, his work
with alizarin synthesis, among others [116,117,120-122].
All this pioneering work is considered a landmark in the history of chemistry and launched
the synthetic dye industry in Europe. Although other synthetic dyestuff had been
discovered before mauve (picric acid in 1771 by Woulfe and aurin by Runge in 1834), this
was the first industrial multi-step synthesis of an organic compound that immediately
spread within the UK, France, Germany, Switzerland and the USA [1,116,117,124].
Thousands of synthetic colours were discovered and made available to everyone,
contrarily to the few dozen of natural colours available in antiquity. Furthermore, the
mauve dye was also the indirect inspiration for other coal-tar derivatives as the perfumes
and explosives. Important contributions can also be found in medicine and other sciences
[1,116,117,124]. Therefore, it is undeniable that the mauve dye is a chemical icon and a
landmark in the history of science and technology.
3.1. Chemical composition – pursuing a perfect colour
To be used as a textile dye, the chromophore should display a desirable colour; it should
also be resistant to light-induced and pollution-induced fading and to washing. Mauve, as a
successful dye, fulfilled all these criteria.
Perkin performed an extensive research on the chemistry of mauve dye synthesizing
different mauveine salts [134,135], among others, in order to obtain a pure compound
suitable for structure elucidation, eventually, for patent protection and possibly to improve
the dye obtained in the earlier synthesis. According to Perkin, when the mauve dye was
first commercialized, it was sold as an amorphous body in the form of sulphate salt [120];
however, in 1863 the mauve dye was sent to the market perfectly pure and crystallized
and, as sulphate of mauveine was unsuitable for the dyer, was converted into the soluble
acetate of mauveine [120,122,129].
This extensive research can also be seen as part of a programme to synthesise
derivatives of mauveine as novel dyes, in the same way the aniline blue and violet
derivatives had been obtained by Hofmann and others from aniline red [132,133]. For
instance, the oxidation of the mauve dye lead to the discovery of aniline pink or safranine
(C20H18N4Cl) in 1859 by Greville Williams and in 1863 by Perkin, which due to its price was

48
not used extensively [120,122]. Another derivative of mauveine was also discovered in
1863 and named dahlia (patented on 6 November 1863) with the proposed empirical
formula by Perkin of C27H23(C2H5)N4HCl [120,122].
During his research Perkin concluded that the mauve dye was composed mostly by
mauveine, a trimethylated based compound (C27H24N4), and a second colourant named
pseudo-mauveine (C24H20N4) [129,135,136]. In 1879 Perkin confirmed that the mauveine
compound was derived from aniline and para-toluidine and that its formula was indeed
C27H24N4 [129]. The C27 empirical formula had been initially presented in 19 August 1863
[134,135]. Between 1863 and 1879, Perkin had assigned the C26H24N4 formula to the
mauveine compound [129].
The empirical formula of pseudo-mauveine, C24H20N4, was also presented in 1879 and
Perkin concluded that this second colourant could even be obtained only with pure aniline,
contrarily to mauveine [129]. One secret of the success of the mauve dye first synthesis
lies on the fact that the aniline used by Perkin was not totally pure, it was a mixture of
aniline with both ortho and para-toluidine. It was in 1862-63 that Hoffman concluded that
commercial aniline obtained from coal tar was contaminated with toluidine [132,133]. The
coal tar had both benzene and toluene which after nitration and reduction would give,
respectively, aniline and toluidine. Indeed, after 1896, and contrarily to what he presented
in 1879 [129] and 1896 [120], Perkin revealed that the mauve dye was not a mixture of two
chromophores but three: “mauveine formed from aniline and p-toluidine” (the C27H24N4
chromophore), pseudo-mauveine formed from aniline only (the C24H20N4 chromophore)
and “a third analogue formed from aniline, o and p-toluidine” (probably an isomer of the
C27H24N4 compound, see section 3.3 for more details). Moreover, Perkin found that the
mixture gave better results in the dyeing than the compounds separately [122].
Taking advantage of the impurity of the commercial anilines, Perkin was able to develop
two different types of purple: one bluer, obtained with aniline and little toluidine, and a red
shade obtained from aniline with large amounts of toluidine. The percentage of toluidine
also revealed to be important in the quality of the mauve acetate salts that replaced the
initial mauve sulphates; to precipitate mauve dye as acetate salts, anilines with higher
contents of toluidine were necessary [129].
Although Perkin also speculated about the structure of the mauve dye, he was not able to
find it. It was in 1893 and 1896 with O. Fischer and E. Hepp [136], and R. Nietzki [137],
respectively, that the pseudo-mauveine was found to be an N-phenylphenazidium salt
derived from pure oxidized aniline (figure 3.1). However, for the mauveine chromophore,

49
which was also considered a derivative of pseudo-mauveine, they were not able to find the
position of the CH3 groups in its structure.
N+
N
NH2 NH
X-
Figure 3.1 – Strucuture of the N-phenylphenazidium salt discovered by O. Fischer and E.
Hepp and R. Nietzki [125]
The first correct mauveine structure had to wait until 1994 to be revealed by Otto Meth-
Cohn and Mandy Smith [138]. In their first pioneering analysis of historic samples,
obtained from the Science Museum London and from the Zeneca archives at Blackley,
Manchester, two compounds were considered to be the main chromophores, mauveine A
(major compound) and mauveine B, respectively C26 and C27 structures, and no pseudo-
mauveine was identified [138] (figure 3.2).
Mauveine A Mauveine B
Figure 3.2 – Mauveine structures discovered by Otto Meth-Cohn and Mandy Smith in 1994
[138].
In the present work, using a modern synthesis, it was possible to obtain pseudo-mauveine
(C24), mono (C25), di (C26), tri (C27) and tetramethylated (C28) derivatives using as starting
materials aniline, o-toluidine and p-toluidine; depending on the ortho to para ratios, it was
also possible to obtain different isomeric ratios. Two other compounds - mauveine B2 and
mauveine C, respectively C27 and C28 compounds - were also discovered during analysis
[139].
These data, as well as the early data of Meth-Cohn and Smith [138], contradict Perkin’s
claim that the definite formula for commercial mauveine was a C27, mauveine B or an
isomer, and that the second colouring material was pseudo-mauveine. As it will be shown
N
N
NHH2N
X-
N
N
NHH2N
X-

50
in this work, mauveine is a complex mixture and it may be anticipated that both modern
authors and Perkin have their credits.
3. 3 Results
Mauve synthesis was performed in order to obtain the mauve’s chromophores
characterization with HPLC-DAD, MS and 1H-NMR. Afterwards, the analysis of different
historic mauve samples -mauveine salts and dyed textiles- was undertaken. Fourteen
samples from important museum collections were analyzed with HPLC-DAD, LC-MS and
ICP-AES or IC-AEC. Moreover, the study of the photodegradation of dyed mauve textiles
was initiated.
3.3.1 Syntheses
In order to obtain the major chromophores of the mauve dye for its characterization, a
synthesis as described in the Journal Chemical Education in 1998 [140] was performed
(for more details see appendix I – experimental section, p. 94). As the mauve dye obtained
with the JCE 1998 synthesis was different from what was reported in the literature [138] (a
mauve dye with two major chromophores: mauveine A and B), other syntheses with
different proportions of the initial standard materials, namely aniline and toluidine, were
also tested (see table 3.1). In synthesis 2 a higher concentration of mauveine A was
expected, for synthesis 3 the formation of mauveine B would be increased and in
synthesis 5 it was expected to obtain more pseudo-mauveine. Equivalent proportions of
the starting materials were also tested in synthesis 4.
Table 3.1 – Syntheses of mauve dye with different ratios of aniline and toluidine.
Synthesis Aniline (mol) o-toluidine (mol) p-toluidine (mol)
1, JCE 1998 1 1 2
2, Mauveine B 1 2 1
3, Mauveine A 2 1 1
4 1 1 1
5, Pseudo-Mauveine 1 0.1 0.1
Of the five syntheses performed, synthesis 1 from JCE 1998 was the most successful,
although it was well below the 5% obtained by Perkin in 1856 [120,122,140]. In the other
four syntheses, the formation of mauve dye was even lower and in synthesis 3 no purple
colour was observed. This can be related with the reaction time; Perkin’s synthesis took

51
one or two days [116,120,122,126] before the final washings and not just 2h as reported in
[140]. In the JCE 1998 synthesis, the formation of a black precipitate was really fast, while
in syntheses 2 and specially 4 it was slower. Indeed, in all the chromatograms of the
synthesized mauve dye, the starting materials were detected, namely aniline and
toluidines. Nevertheless, the principal reason for the low yield of the reactions might be the
low amounts of K2Cr2O7 and H2SO4 indicated in [140]. According to a mauve synthesis
described in 1876, where the quantities of the starting materials are described [116], the
amount of potassium dichromate used is at least 40 times larger than in the JCE 1998
synthesis. Moreover, the stoichiometric equations of the formation of mauveine
compounds revealed that a higher amount of K2Cr2O7 and H2SO4 than what is described in
the JCE 1998 synthesis is needed (see Appendix IV-Mauve dye data, section IV.1, p. 115
for stoichiometries of the mauveine chromophores formation). For instance, in the
syntheses 2 and 3, almost ten times more amount of H2SO4 should be used, compared to
what is described in JCE 1998. The insufficient amount of starting materials together with
reduced reaction time can explain the lack of success of synthesis 3 and the very low
yields in synthesis 2 and 4. Nevertheless, it was still possible to observe that in the three
syntheses where a purple colour was obtained, the composition of the mauve dye was
related with the proportions of the starting materials used.
In two of the three mauve dye syntheses, the major compounds obtained were mauveine
A (C26H23N4+), B (C27H25N4
+) and isomers, and mauveine C (C28H27N4+) (see figure 3.3).
Other minor purple compounds were also detected but they were only characterized in the
historical samples (see next section and Appendix IV-Mauve dye data, section IV.2, p.119
for mauve summarized characterization).
For the synthesis 1, the major compound obtained was a new isomer of mauveine B
(mauveine B2) together with a new mauveine compound (mauveine C, table 3.2). Both
compounds contain two molecules of p-toluidine and, therefore, the major amount of this
reagent in this synthesis is crucial (table 3.1). Even though they were never identified
before, they are always present as minor compounds in Perkin’s original samples (see
next section).
In the synthesis 2, the major chromophores were mauveine B (28%), together with
mauveine A (25%). Although more mauveine B was produced in this reaction than in the
first synthesis, as expected, the amount of mauveine B2 and mauveine C were still
considerable (circa 23% each). Probably, the amount of the starting material p-toluidine
was too high, inducing the formation of mauveine B2 and C, which competed with the
formation of mauveine B. In the original Perkin’s samples, such amounts of mauveine C

52
and B2 compounds were never found, although Perkin in his last communications referred
that the mauveine was a mixture of three chromophores [122], the third possibly being an
isomer of mauveine B.
In the synthesis 4, with a higher content of the starting material aniline, more pseudo-
mauveine (C24H20N4+, circa 46%), with no methyl groups, was obtained, together with two
new mono-methylated derivatives (C25H22N4+, circa 40%). The presence of mauveine A
and B was very low (less than 6% each, see table 3.2). This synthesis confirms that it is
possible to obtain pseudo-mauveine from “pure aniline” as referred by Perkin. Indeed, in
one of the historical samples, the mauveine chromophores distribution is very similar (see
next section).
Figure 3.3 - Fully characterised products isolated from modern mauve synthesis and
mauve historical salt samples. Depending on the initial ratio of aniline, o-toluidine and p-
toluidine, the proportions of the different mauveine compounds vary. The mauveines A, B
and B2, pseudo-mauveine and mauveines C25a and C25b could be isolated in sufficient
amount to allow MS and NMR characterization, while seven others could only be
characterized by HPLC-MS.

53
Table 3.2 – Relative percentages of the mauveine chromophores in the synthesized
mauve dye.
Synthesis C24 C25
C25a+C25b
C26
A
C27
B
C27
B2
C28
C
1 - - 15 24 31 30
2 - - 25 29 24 22
3* - - - - - -
4* - - - - - -
5** 46 40 5 5 - -
* No formation of mauve dye was observed in this synthesis.
**In synthesis 5 other minor compounds were also found with less than 4%.
3.3.2 Original samples
All the original mauve samples synthesised and purified by Perkin (as well as the mauve
samples synthesised in this work) are complex mixtures of at least thirteen different
compounds, all containing the 7-amino-5-phenyl-3-(phenylamino)phenazin-5-ium core.
Besides the C24 compound with no methyl groups (pseudo-mauveine), two
monomethylated C25 isomers, named C25a and C25b, dimethylated mauveine A (C26), four
trimethylated mauveines (B, B2, B3, B4), two tetramethylated mauveines (C, C1), one
pentamethylated (mauveine D) and one hexamethylated (mauveine E) could be identified
in the historical samples (see Appendix IV-Mauve dye data, section IV.2, p. 119 for mauve
summarized characterization, section IV.3, p. 120 for HPLC-DAD/LC-MS characterization
of historical samples and section IV.4 for NMR characterization, p.126). These last two
compounds show that the commercial aniline used by Perkin was contaminated not only
with toluidines but also with anilines containing two methyl groups in the benzene ring. All
these compounds have absorption wavelength maxima (λmax) in methanol solution in the
range 540 (mauve E) – 550 (mauve B2) nm. This is also in agreement with a recent
chromatographic analysis (by HPLC) of mauveine samples [141].
3.3.2.1 Original mauve textile samples
Some of the original mauve textile samples analyzed can be from the early years of mauve
manufacture and in the case of ScMF5 and Perth samples may even be from 1856 [142].
The seven samples analyzed (figure 3.4) can be grouped in two sets of three and four
samples. The first group (ScMF5, Perth and ScMF6) is characterized by a high percentage
of mauveine A (circa 50%), with the mono-methyl derivative isomers (15-20%), pseudo-

54
mauveine (5%) and mauveine B (5-12%) also present (table 3.3). In the second group
(ScMF1, F2, F3 and F4), samples with mauveine A and B as major chromophores can be
found, with the mono-methyl derivatives C25 being present in minor amounts (1-5%) and
no pseudo-mauveine (table 3.3). Both data sets are consistent, and, therefore, may reflect
standard processes for the production of the mauve dye.
Figure 3.4 - Textile samples from museum collections analysed in this work. The
designations are in accordance with those given in Table 3.3. Fibre a corresponds to a
fibre dyed with mauveine Science Museum 1, using an original dyeing procedure
described by Perkin [119] (for more details about mauve samples, see appendix I-
Experimental section, p.94.
Table 3.3 - Relative percentages of the main chromophores of the mauve dyed textile
samples.
Textile C24
C25
C25a+C25b
C26
A
C27
B
C27
B2
C27**
B3+B4
C28
C
C28**
C1 C26/C27
***
ScMF1 - 1 32 36 11 4 7 9 0.6
ScMF2* - 5 70 13 7 4 1 - 3.0
ScMF3 - 2 61 21 8 5 2 2 1.8
ScMF4 - 2 53 24 9 5 3 4 1.4
ScMF5 5 20 51 5 11 9 - - 2.1
Perth 4 18 50 12 9 7 - - 1.8
ScMF6 5 15 51 11 11 7 - - 1.7
a <1 2 50 22 11 6 4 5 1.3
* The concentration of mauve in this sample was very low. ** The assignment of these three structures (mauveines B3, B4 and C1) was not
made; however, based on the available analytical data, these could be clearly identified as isomers of mauveine B and mauveine C (see
appendix IV- Mauve data, section IV.3, p.120 for HPLC-DAD/LC-MS characterization of historical samples and section IV.4 for NMR
characterization, p.126). *** Defined as the ratio between the sum of all C26 and all C27 compounds relative percentages calculated at
λ=551nm.

55
3.3.2.1.1 Group I - Perth, Science Museum F5and F6
The Science Museum has a piece of the first silk fabric dyed on a large scale (ScMF5),
which was allegedly presented to Queen Victoria. The museum’s inventory record dates
this piece to “about 1860” and this information came probably from the Perkin family. The
Perth Museum in Scotland has also a similar piece that was probably from the same silk
fabric and for Queen Victoria. However, in this museum it is labelled as “cut from the first
length of material dyed by Dr Perkins [sic] by his new process in Pullar’s works, Perth in
1856” [142].
The chromophore fingerprint for the Perth and the ScMF5 samples are very similar,
pointing to a common mauve dyeing bath. In order to confirm if they are from the same silk
fabric, an analysis of the weaving techniques and pattern is also required.
Since the Perth and the ScMF5 samples are identical, probably they were made in 1856-7,
when Perkin was working with the Pullars dyers as reported in the Perth sample label.
There is no evidence that Perkin was working with the Pullars in 1860 and therefore the
tentative dating of the Science Museum is probably incorrect. Both samples are similar to
the ScMF6 sample, the only textile that can be accurately dated to 1862 or slightly earlier
once it was displayed in the 1862 exhibition [142] (figure 3.5).
Figure 3.5 – The mauve dyed shawl (a), ScMF6 sample, which was displayed in the 1862
exhibition (b) [142].
The high percentage of mauveine A (circa 50%) together with the mono-methyl derivative
isomers (15-20%) and the pseudo-mauveine (5%) in these three samples possibly
correspond to the first large scale product introduced in the market, where the commercial
mauve appeared as an amorphous body [120,122,129]. In this process, the mauve dye
was probably obtained from aniline containing but little toluidine, leading to the formation of
a higher content of pseudo-mauveine and mauveine C25 compounds when compared with
the samples of the group II (ScMF1, F2, F3 and F4).
a b

56
In the wool ScMF6 sample, almost 6 mg of iron and aluminium per g of textile were
detected by ICP-AES (see appendix IV- Mauve data, section IV.5 p. 131 for mordent
analysis). The amounts of aluminium and iron ions are in the concentration range of
mordanted wool textiles [143].
In the original patent, Perkin mentions that he found advantageous to boil the wool with the
mauve dye and iron sulphate, which can explain the high content of iron in this sample
[126]. In the article of 1862 [119], Perkin does not refer the presence of iron sulphate in the
mauve dyeing bath of wool and this procedure could have been discarded. Indeed, the
mauve colourant is a direct dye for protein based fibres and a mordant is not required to
obtain a permanent colour [144]. It would be interesting to analyse the amount of iron and
aluminium in older wool textile samples and compare with the present results.
As expected, in the silk sample analysed (Perth), metal ions were not detected in sufficient
amount to consider that a mordant was applied to the sample. Only 1 mg of iron per g of
textile was found, which is very low for a silk mordanted with iron (around 5 mg of iron per
g of textile are needed). This value is also outside of the values expected for non-
mordanted silk (0.07 mg of iron per g of textile) [143]. In the cotton sample from group II
(ScMF4), a similar amount of iron was also found. One remote hypothesis for the presence
of iron is the use of iron vessels to obtain the reagents for the mauve synthesis [120]; other
contaminations during the dyeing process can also be considered.
3.2.2.1.2 Group II - ScMF1, F2, F3 and F4
The four samples of this group, all of unknown date but possibly prepared for the 1862
International exhibition [142], display a higher content of mauveine A, mauveine B and
even mauveines C when compared with the group I. This is possibly due to a transition
from the first process described above to a second process where the mauve dye was
sold in the form of the more water-soluble mauveine acetate [122,129]. In order to obtain
crystallized mauveine acetate it was necessary to have a mauve dye enriched in
methylated derivatives like mauveines A, B or C [145].
In the cotton ScMF4 sample, besides the presence of iron, 10.06 mg of tin per g of textile
were detected. Indeed, one year after the mauve discovery, Perkin and the Pullar dyers
developed a process based on tannins and stannate of sodium or alum [KAl(SO4)2.12H2O]
to fix the mauve dye to vegetable fibres in such a way that it could resist the action of soap
[120].

57
3.3.2.2 Original mauve salt samples
The mauve salt samples are of an unknown date but probably they were all made after
1860 [142], when the mauve dye was manufactured in the form of acetate salt. It was with
some of these salt samples that Perkin perhaps performed his research on the mauveine
compound formula until 1879, concluding that it was a C27H24N4 [129].
Although the distribution of the mauveine compounds amongst the salt samples (table 3.4)
shows rather large dissimilarities, the two major chromophores present are (with the
exception of Schunck’s sample) mauveines A (C26) and B (C27). Other C27 isomers
(mauveines B3 and B4), as well as C28 compounds (mauveines C and C1), are also
present, with mauveine B2 as the most important of these minor compounds and
contributing with circa 10% to the overall colour. The pseudo-mauveine and mauveines
C25a and C25b are present in minor amounts C (see appendix IV- Mauve data, section IV.3,
p.120 for HPLC-DAD/LC-MS characterization of historical samples and section IV.4 for
NMR characterization, p. 126).
Table 3.4 - Relative percentages of the main chromophores of the mauveine salt samples
and respective counter-ions (A-acetate, S-sulphate).
Salt C24 C25
C25a+C25b
C26
A
C27
B
C27
B2
C27
B3+B4
C28
C
C28
C1 C26/C27
* Anion
%
ScM 1 1 2 50 23 10 5 4 5 1.3 97 A
ScM 2 1 3 37 26 13 6 5 8 0.8 98 S
ScM 3 1 2 54 16 9 4 5 8 1.8 67 S
ScM 4 1 2 37 31 12 5 5 8 0.8 82 A
MSIM1 - 2 39 33 12 5 4 6 0.8 86 A
MSIM2 49 41 7 - 3 - - - - 68 A
CM 1 2 50 24 8 4 5 7 1.4 100 A
*Defined as the ratio between the sum of all C26 and all C27 compounds relative
percentages calculated at 550nm.

58
3.3.2.2.1 Science Museum 1, Chandler Museum and Science Museum 3
The ScM1 sample, an iconic object of the Science Museum of London, has been displayed
by the museum as the original mauve dye prepared by Perkin in the Easter of 1856 (figure
3.6 a).
Figure 3.6 – The historical salt mauve samples. a) The Science Museum’s “Original
Sample” of Mauve, ScM1. In this work, it is shown that this sample was obtained by a
second synthetic process developed by Perkin and therefore cannot be considered as the
result of Perkin’s pioneer synthesis. b) The mauve salts (ScM2, ScM3 and ScM4) donated
by Miss A. Perkin to the Science Museum.
However, its original date of conception was discussed by P. Morris in 2006 [142], who
concluded that this sample could not be earlier than 1862. In the earlier years of
production and until 1859, the mauve dye was known as Tryan Purple or Aniline Purple
[116,117,120,122,125] and not as mauveine, as written in the original label of the bottle.
Moreover, it has also written Sir William Perkin which refers to the knighting of Perkin in
1906 in the mauve jubilee celebrations, fifty years after its discovery. However, the main
reason for this sample to be dated after 1862, is that the mauve dye in the bottle is a salt
and not an amorphous body as the first batches of the commercial dye described by
Perkin [120,122]. Indeed, the first crystalline samples made by Perkin are from 1862 [142].
Curiously, the CM sample which was offered by Perkin to Prof. Chandler in 1906, displays
a similar label to the ScM1 sample, where it can be read: “Mauve or aniline purple,
Mauveine Acetate presented by Sir William Perkin, October 1906” [142].
In these two salts samples, mauveine A is present in a higher amount, contributing with ca.
50% of the overall chromophores. The distribution of all mauveine compounds is very
similar in both samples (table 3.4), pointing to a common source. Moreover, they are the
only two samples that display such a high amount of acetate, almost 100% C (see
appendix IV- Mauve data, section IV.6, p.131 for counter ion analysis).
a b

59
The presence of acetate, as already mentioned by Morris [142], confirms that these
samples cannot be earlier than 1862, as there is no historical evidence for the earlier
synthesis of any salts as reasonably pure samples. They could have been made both in
France for the jubilee celebrations 50 years after the mauve discovery [125]. If so, they
were made after the Perkin’s research on the mauveine structure, where in 1879 he
concluded that the main chromophore of mauveine was a C27 based compound. Indeed
these two samples, as well as the ScM3, display a higher content of mauveine A (C26) and
they are the only salt samples where the ratio C26/C27 is higher than one. However, the
ScM3 sample displays almost 70% of sulphate and only 20% of acetate ion, which could
indicate that this dye was from an earlier period than the ScM1 and CM, when the sulphate
salt was being replaced for the more soluble acetate salt and comparable for instance to
the period of textiles group I.
As referred before, there was a time when Perkin thought that the mauveine compound
had a C26 based formula and in the ScM3 sample, as well as in the ScM1 and CM
samples, the ratio C26/C27 higher than one could explain the proposal of a C26H23N4+
formula for the principal mauveine chromophore somewhere between 1863 and 1879.
Furthermore, all the textiles samples, except one, present a higher content of mauveine A
and a C26/C27 ratio higher than one and, therefore, these salt samples were not a unique
case.
3.3.2.2.2 Museum SI Manchester 1, Science Museum 4 and Science Museum 2
ScM1 and MSIM1, samples allegedly from the Perkin’s factory [142], were both analysed
by Meth-Cohn and Smith in 1994 [138], obtaining identical results for both samples: they
identified two chromophores, namely mauveine A (C26H23N4+) and mauveine B (C27H25N4
+),
and in both samples the major compound was mauveine A.
Although both samples displayed mauveine A as the major compound, the ScM1 sample
had circa 50% of mauveine A, while the MSM1 sample had only circa 40%. Moreover, the
distribution of all mauveine compounds was quite different in both samples: in the MSM1,
the relative percentage of C27 based compounds was superior to mauveine A (C26)
contrarily to the ScM1 sample. Although the acetate ion was the major counter-ion found in
both samples, in the MSM1 chloride with circa 7% and sulphate with circa 13% were also
found. Therefore, they are probably not identical samples as reported by Meth-Cohn and
Smith in 1994 [138].
The MSIM1 sample is more similar to the ScM4, as the relative distribution of the
mauveine chromophores and the counter-ions composition is similar. In both samples, the

60
relative percentage of C27 based compounds is superior to mauveine A and the C26/C27
ratio is less than one. Other sample also with a C26/C27 ratio minor than one is the ScM2
sample. The C26/C27 ratio minor than one in these three samples can explain why,
although mauveine A is the major compound with circa 40% relative percentage of total
purple compounds, Perkin concluded that the major mauveine compound was a C27 based
compound and not a C26. Indeed, the percentage of mauveine B and its C27 isomers (more
than 45% of the total purple compounds) is superior to mauveine A (C26).
3.3.2.2.3 Museum SI Manchester 2 and JCE 1926
The sample from the Schunk’s collection (MSIM2), labelled as mauveine C27H24N4,
displays a very different fingerprint from the previously samples. The major purple
chromophores present were the C24 pseudo-mauveine (49%) together with two mono-
methylated derivatives (C25a and C25b, 41%). There was also a minor component of
mauveine A (7%) and no evidence for mauveine B or C was found. The major counter-ion
was acetate but sulphate (17%) and chloride (13%) in minor amounts were also found.
In order to obtain a higher amount of pseudo-mauveine and mono-methylated derivatives
as in this sample, a synthesis with aniline but little toluidine was required, as demonstrated
in mauve synthesis 5. As referred before, in the earlier days of mauve production,
commercial aniline contaminated with toluidine was used [120]. Some years later, a
process with almost pure aniline was developed in order to give blue shades to the mauve
dye. Since the fingerprint of this sample (chromophores distribution) is different from the
group I textile samples, which are probably the most antique mauve dyed textiles
analysed, it is possible that this sample was not from the earlier years of production of the
mauve dye. Moreover, the original label, probably made by Schunck or one of his
assistants and the presence of acetate in such quantity, points also to a later date of
conception. The formula C27H24N4 written in the original label was proposed in 1863, while
the pseudo-mauveine formula was only presented in 1879 and for that reason this sample
should be dated at least after 1863 and eventually before 1879.
A bluer purple cotton textile (L*=31.24±0.03; a*=24.69±0.00 and b*= -30.64±0.01) from the
Journal Chemical Education (JCE) from 1926 [146] was also analysed, revealing the
presence of mostly pseudo-mauveine and mono-methylated derivatives. However, in this
sample, the percentage of mono-methylated derivatives (80%) is much higher than that of
pseudo-mauveine (less than 2%), contrarily to the MSIM2 sample C (see appendix IV-
Mauve data, section IV.3, p. 125 for HPLC-DAD characterization).

61
For the MSIM2 sample, a different synthesis cannot be excluded since its fingerprint was
never found in the Perkin’s samples analysed; the yield of synthesis 5 was very low and
Schunck could be doing an independent synthesis not published in the literature.
3.3.3. Accelerated aging study
A preliminary photodegradation study of mauve dyed textiles in a Solar Box Camera was
carried out in order to verify if the relative percentage of mauveine chromophores could
change with exposure to light. Four mauve dyed samples (two historic and two
reconstructions) were submitted to polychromatic irradiation in the Solar Box Camera and
the colour fading was monitored with a colorimeter and HPLC-DAD.
3.3.3.1 Mauve dyed textile reconstruction
The mauve dyed textile reconstruction after 200 h/700 Mj/m2 of irradiation revealed an
increase of luminosity in 67% and a decrease of the blue component in 90% and of the red
component in 65%, which means that after nearly 14 years display in a museum, the
mauve dye would have faded almost completely, (see appendix IV – Mauve data, section
IV.7 for Solar box exposure, p.133). Significant changes in colour occurred only after 48 h
(3 years in a museum display), with the initial purple colour (L*=38.93±0.80;
a*=32.24±0.20; b*=-38.18±0.05) changing to a reddish colour (L*=45.05±0.63;
a*=26.37±0.44; b*=-20.47±0.28) due to the intense decrease of the blue component (see
figure 3.7).
Figure 3.7 – Mauve dyed textile reconstruction before a) and after b) 48h of irradiation (14
years in a museum display) in the solar box camera.
The relative percentage of the principal nine mauveine chromophores analysed by HPLC-
DAD remained almost constant during the irradiation. The decrease of mauveine B was
slightly superior to mauveine A (less than 2% was observed).
A B

62
3.3.3.2 Mauve dyed historic textiles
The other two historic mauve dyes (Science Museum F5 and F6) followed the same
behaviour of the mauve dyed textile reconstruction, being possible to conclude that the
photodegradation does not change significantly the final relative percentages of the
mauveine chromophores. The Science Museum F5, less concentrated than the Science
Museum F6, as expected faded more rapidly than Science Museum F6. With these
preliminary photodegradation results of mauve dyed textiles it can be predicted that the
mauve dye is less stable than indigo in heterogeneous media. Light indigo silk dyed
textiles (and less concentrated than the mauve dyed textiles) submitted to similar aging
conditions of mauve dye, revealed that after 14 years of light exposure in a museum would
still have a blue colour.
3.4 Conclusions
Mauve dye can be defined as a complex mixture of methyl derivatives of 7-amino-5-
phenyl-3-(phenylamino)phenazin-5-ium in which relative percentages of the purple
chromophores vary according to the initial proportion of the starting materials. All the
historical samples analysed contained a common fingerprint where mauveine A or
mauveine B (and isomers) predominate, with the exception of the mauveine salt from
the Schunk collection. New C27 isomers, two C28 and two C25 compounds were for the
first time described and characterised in historic mauveine samples. Pseudo-
mauveine, described by Perkin as a second colouring material in the mauve dye, was
also identified for the first time in historical samples. Mauveines C25 can constitute a
fingerprint marker for the original synthesis while mauveines C27 are markers for a later
synthetic process. Depending on the number of methyl groups, the purple colour
ranges from a bluish shade as the original textiles group I (mauveine A, C26 and
pseudo mauveine, C25) to a reddish shade of violet as the original textiles group II
(mauveine B, C27). This confirms the existence of two differents types of purple as
mentioned by Perkin: a bluer shade that was obtained with aniline and little toluidine
(inducing a higher content of mauveine A, C26, and pseudo mauveine, C25) and a
redder shade that was obtained with large amounts of toluidine (inducing a higher
content of mauveines B, C27, and C, C28).
Perkin’s original recipe could be identified in three textile samples and, in these cases,
mauveine A and mauveines C25 were found to be the major chromophores. Therefore,
it is expected that during the earlier years of mauve production, when the mauve dye
was sold as an amorphous paste in the form of sulphate salt, the bluish shade of

63
purple was usually obtained. Later and when the mauve sulphate salt was replaced by
the soluble mauve acetate salt more suitable for the dyer, large amounts of toluidine
were used producing a reddish shade of purple. Nevertheless, it is possible that both
processes were used at the same time, mainly when different shades of purple were
required.
These differences in the synthesis may explain the different structures of mauveine
chromophores presented by Perkin namely, the C26 and C27 structures. Interestingly, only
after 1896 Perkin concluded that the mauveine dye was composed by three
chromophores, one of them obtained from aniline, o-toluidine and p-toluidine. It is possible
that during a later period a mauve dye enriched in methylated derivatives was used and
more mauveines C27 (and even C28) with a higher content of p-toluidine were obtained.
This was the case of some salt samples, including the one displayed by the Science
Museum of London as the original mauve dye synthesized by Perkin in 1856. The counter-
ions analysis of this sample and other salts revealed that the acetate was the major ion
(except in two samples), indicating that they were most probably prepared as a textile dye
and therefore they should be dated after 1862. As a result, the only mauve dye made
according to the original recipe of 1856 exists in three of the textile samples, in group I.
These were now shown to be the samples containing the “original mauve”.

64
General Conclusion
Organic dyes have been used since pre-historic times for artistic purposes, revealing a
considerable resistance to light induced fading. However, their initial colour often changes
under light exposure, where the initial coloured chromophores are usually transformed into
colourless photoproducts. Both the initial chromophores and the photoproducts formed
give a kind of fingerprint useful in the characterization and identification of the organic
dyes. Moreover, if the photophysical and photochemical properties are known, it is
possible to predict the lifetime of these colours and estimate the initial colour. This is also
valuable information in order to prevent the colours from fading and improve their lifetime.
An approach to the study of organic dyes fading is their characterization at the molecular
level as performed in this work for dragon’s blood, indigo and mauve dye. This molecular
description revealed new insights into the identification and characterization of mauve dye
and dragon’s blood, whereas for indigo a better understanding of the general
photodegradation mechanism was achieved. With it, the importance of these organic dyes
can be revaluated, especially in the cases of dragon’s blood and mauve dye. For dragon’s
blood, its importance as an organic dye can be reconsidered as its identification could
have been mislaid during the last decades due to the lack of characterization of the
principal red chromophores. For indigo dye, the comprehension of the fading mechanisms
can prompt the development of new strategies that will help improve its lifetime. As
referred in the introduction, this more in-depth understanding will contribute for a better
access, valorization and conservation of these organic dyes.
In order to obtain this characterization at the molecular level of dragon’s blood, indigo and
mauve dye, a structural analysis of their chromophores was performed and in the case of
indigo its photodegradation was studied.
In Chapter 1, with the fingerprint study of the red chromophores from Dracaena and
Daemonorops dragon’s blood resins with HPLC-DAD and PCA, it was possible to
conclude that different flavylium compounds, two of them identified for the first time (7,4’-
dihydroxy-5-methoxyflavylium and 7,4’-dihydroxyflavylium), were responsible for the red
colour of the resins. Moreover, 7,6-dihydroxy-5-methoxyflavylium (dracorhodin) and 7,4’-
dihydroxy-5-methoxyflavylium (dracoflavylium) are the first natural flavylium compounds
for which the base is the major species at biological pH (more than 50%). From circa 50
samples of known dragon’s blood sources it was possible to select 7,6-dihydroxy-5-
methoxyflavylium (dracorhodin), 7,4’-dihydroxy-5-methoxyflavylium (dracoflavylium) and
7,4’-dihydroxyflavylium as species markers for Daemonorops spp., Dracaena draco and

65
Dracaena cinnabari, respectively. This method was applied successfully to 37 samples of
dragon’s blood from the Economic Botany Collections at the Royal Botanic Gardens, Kew
(EBC, K).
In Chapter 2 it was possible to conclude that the photodegradation of indigo can be
promoted by the presence of electron donors such as free radicals that will easily attack
the central double bond, reducing indigotin and leading to the formation of isatin.
Therefore, solvents as DMF or media with free radicals can accelerate its degradation.
Nevertheless, it was found by comparison with indigo carmine that indigo displays low
quantum yields in the homogeneous media, as expected for a molecule which is
considered very stable and presents also low photoreactivity.
In Chapter 3 it was possible to conclude that the mauve dye is a complex mixture of
methyl derivatives of 7-amino-5-phenyl-3-(phenylamino)phenazin-5-ium, contrarily to what
is reported in the literature. By investigating original mauve salt samples and fabric tests
dyed with mauve from different sources, it was possible to understand the evolution of
mauve as a commercial dye. With the exception of the mauveine salt from the Schunk
collection, all samples contained a common fingerprint where mauveine A or mauveine B
(and isomers) predominate. Besides these derivatives of pseudo-mauveine with two and
three methyl groups, several other methylated derivatives were found (mono, tetra and
more) for the first time. Amongst these, mauveine B2 (C27) and mauveines C25 are
important markers in the fingerprint of mauveine salts and textiles, respectively. Moreover,
it was possible to conclude that the mauve dye made according to the original recipe of
1856 exists only in three of the textile samples analysed.
66
References and Notes
[1] Travis, A. The Rainbow Makers: The Origins of the Synthetic Dyestuffs Industry in
Western Europe. Lehigh University Press: London, 1993.
[2] Cardon, D. Natural Dyes- Sources, Tradition, Technology and Science. Archetype
Publications: London, 2007.
[3] Ferreira, E.; Hulme, A.; McNab, H. Chemical Society Reviews 2004, 33, 329.
[4] Verhecken, A.; Wouters, J. Bulletin Institut Royal du Patrimoine Artistique XXII. 1988-
89, 207.
[5] Wouters, J.; Verhecken, A. Annales de la Société Entomologique de France 1989, 25-
4, 393.
[6] Wouters, J.; Verhecken, A. Studies in Conservation 1989, 34, 189.
[7] Zhang, X.; Laursen, R. A. Analytical Chemistry 2005, 77-7, 2022.
[8] Constable, O. R. Trade and Traders in Muslim Spain. Cambridge University Press:
Cambridge, 2003.
[9] Valeur, B. Molecular Fluorescence – Principles and applications. Wyley-VCH:
Wenheim, 2002.
[10] Wells, C. Introduction to Molecular Photochemistry. Chapman and Hall: London, 1972.
[11] Montalti, M.; Credi, A.; Prodi, L.; Gandolfi, M. Handbook of Photochemistry. 3rd edition.
CRC Press: Boca Raton, USA, 2006.
[12] Turro, N. J.; Valley, M. Modern Molecular Photochemistry. University Science Books:
US, 1991.
[13] Resins can be defined as a lipid-soluble mixture of volatile and non-volatile terpenoid
and/or phenolic secondary compounds that are usually secreted in specialized structures
located either internally or on the surface of the plant. These compounds apparently play
no role in the primary or fundamental physiology of the plant. Its function is more related
with protection against injuries, desiccation, high temperatures and ultraviolet radiation,
amongst others. In: Langenheim, J. Plant Resins – Chemistry Evolution Ecology and
Ethnobotany. Timber Press: Cambridge, 2003.
[14] Pearson, J. The Horticulturist 2002, 10.
[15] Pearson, J.; Prendergast, H.D.V. Economic Botany 2001, 55, 474.
[16] Pearson, J. The History, Botany and Analysis of the Dragons Blood Collection at the
Royal Botanic Gardens, Kew Diploma Dissertation 36. Kew Garden: Kew, 2001.
[17] Mills, J.; White, R. Studies in Conservation 1977, 22, 12.
[18] González, G. A. L. Los Árboles y Arbustos de la Península Ibérica e Islas Baleares.
Ediciones Mundi-Prensa: Madrid, 2001.

67
[19] Hernández, J. C.; Léon, F.; Quintana, J.; Estévez, F.; Bermejo, J. Bioorganic and.
Medicinal Chemistry 2004, 12, 4423.
[20] González, A. G.; Hernández, J. C.; Léon, F.; Padrón, J. I.; Estévez, F.; Quintana;
Bermejo, J. Journal of Natural Products 2003, 66, 793.
[21] Mimaki, Y.; Kuroda, M.; Ide, A.; Kameyama, A.; Yokosuka, A.; Sashida, Y.
Phytochemistry 1999, 50, 805.
[22] Machala, M.; Kubínova, R.; Horavová, P.; Suchy, V. Phytotherapy Research 2001, 15,
114.
[23] Shen, C.; Tsai, S.; Wei, S.; Wang, S.; Shieh, V; Chen, C. Journal of Natural Products
2007, 21, 377.
[24] Gong, W. J.; Cao, Y. H.; Wang, Y. Chromatographia 2007, 66, 767.
[25] Zhu, Y.; Zhang, P.; Yu, H.; Li, J.; Wang, M.; Zhao, M. Journal of Natural Products
2007, 70, 1570.
[26] Zheng, Q.-A.; Li, H.-Z; Zhang, Y.-J.; Yang, C.-R. Helvetica Chimica Acta 2004, 87,
1167.
[27] Salatino, A.; Salatino, M. L. F.; Negri, G. Journal of the Brazilian Chemical Society
2007, 18-1, 11.
[28] Jones, K. The Journal of Alternative and Complementary Medicine 2003, 9-6, 877.
[29] Cennini, C. Il Libbro dell’Arte. (Ed.: Brunello, F.) Neri Pozza Editore: Vicenza, 1982.
[30] Edwards, H. G. M.; Farwell, D. W.; Quye, A. Journal of Raman Spectroscopy 1997,
28, 243.
[31] Edwards, H. G. M.; Oliveira, L. F. C.; Quye, A. Spectrochimica Acta Part A 2001, 57,
2831.
[32] Edwards, H. G. M.; Oliveira, L. F. C.; Prendergast, H. D. V. Analyst 2004, 129, 134.
[33] Govaerts, R.; Dransfield, J. World Checklist of Palms. Royal Botanic Gardens: Kew,
2005.
[34] Machala, G.; Mbugua, P. K. Flora of Tropical East Africa. Dracaenacea. Royal Botanic
Gardens: Kew, 2007.
[35] Bos, J. J. Agricultural University Wageningen Papers 1984, 84, 1.
[36] Rustiami, H. Phenetic Study on Dragon's blood Species of Daemonorops Section
Piptospatha (family Arecaceae), Thesis (M.Sc.). Royal Botanic Gardens: Kew, 1999.
[37] Rustiami, H.; Setyowati, F. M.; Kartawinata, K. Journal of Tropical Ethnobiology 2004,
1-2, 65.
[38] Adolt, R., Pavlis, J. Trees 2004, 18, 43.

68
[39] Marrero, A.; Almeida, R. S.; González-Martin, M. Botanical Journal of the Linnean
Society 1998, 128, 291.
[40] Thulin, M. Flora of Somalia, 4. Royal Botanic Gardens: Kew, 1995.
[41] Benabid, A.; Cuzin, F. Comptes Rendus de l’Académie des Sciences. Sciences de la
Vie 1997, 320, 267.
[42] In http://www.worldtwitch.com, April 2008.
[43] In http://www.huntington.org/BotanicalDiv/ISI2004/isi/2004-20.html, April 2008.
[44] In http://www.jpb-imagine.com/djibflor/dracaen.html, April 2008.
[45] Attorre, F.; Francesconi, F.; Taleb, N.; Scholte, P.; Saed, A.; Alfo, M.; Bruno, F.
Biological Conservation 2007, 138, 430.
[46] In http://en.wikipedia.org/wiki/Dracaena_%28plant%29, April 2008.
[47] Rustiami, H. Gardens’ Bulletin, Singapore 2002, 54, 199.
[48] In http://content.answers.com/main/content/wp/en-commons/thumb/7/71/240px-Koeh-
023.jpg, April 2008.
[49] In http://www.ics.trieste.it/MedicinalPlant/_MedicinalPlant.aspx?id=60, April 2008.
[50] Dobbie, J. J.; Henderson, G. G. American Journal of Pharmacy 1884, 56-6, 4.
[51] Zheng, Q.; Yang. C. Journal of Asian Products Research 2003, 5-4, 291.
[52] In http://striweb.si.edu/ctfs/webatlas/plant.photos/pterof.arq.jpg, April 2008.
[53] In http://www.infojardin.com/foro/showthread.php?t=4197, April 2008.
[54] Bensky, D.; Clavey, S.; Stöger, E. Chinese Herbal Medicine Materia Medica. 3rd
edition. Eastland Press: US, 2004.
[55] Hernández, J. C.; Léon, F.; Estévez, F.; Quintana, J.; Bermejo, J. Journal of
Chemistry and Biodiversity 2006, 3, 62.
[56] Himmelreich, U; Masaoud, M.; Adam, G.; Ripperger, H. Phytochemistry 1995, 39-4.
949
[57] Masaoud, M.; Ripperger, H.; Porzel, A.; Adam, G. Phytochemistry 1995, 38-3. 745.
[58] Masaoud, M.; Ripperger,H.; Himmelreich, U.; Adam, G. Phytochemistry 1995, 38-3.
751.
[59] Masaoud, M.; Schmidt, J.; Adam, G. Phytochemistry 1995, 38-3, 795.
[60] Cardillo, G.; Merlini, L.; Nasini, G. Journal of the Chemical Society 1971, 3967.
[61] Arnone, A.; Nasinin, G.; Vajna de Pava, O. Journal of Natural Products 1997, 60, 971.
[62] Brockmann, H.; Haase, R. Berichte der Deutschen Chemischen Gesellschaft, B 1936,
69, 1950.
[63] Brockmann, H.; Haase, R. Berichte der Deutschen Chemischen Gesellschaft, B 1937,
70, 1733.

69
[64] Brockmann, H.; Junge, H. Berichte der Deutschen Chemischen Gesellschaft, B 1943,
76, 751.
[65] Robertson, A.; Whalley, W. B. Journal of the Chemical Society 1950, 1882.
[66] Agbakwuru, E.; Whalley, W. B. Journal of the Chemical Society, Perkin Transanctions
1 1976, 1392.
[67] Olaniyi, A. A.; Powell, J. W.; Whalley, W. B. Journal of the Chemical Society, Perkin
Transanctions 1 1973, 179.
[68] Robertson, A.; Whalley, W. B. Journal of the Chemical Society 1950, 3117
[69] Melo, M. J; Sousa, M. M; Parola, A. J; Seixas de Melo, J. S.; Catarino, F.; Marçalo, J.;
Pina, F. Chemistry – A European Journal 2007, 13, 1417.
[70] Sousa, M. M.; Melo, M. J; Parola, A. J; Seixas de Melo, J. S.; Catarino, F.; Pina, F.;
Cook, F. E. M.; Simmonds, M. S. J.; Lopes, J. A. Journal of Chromatography A 2008,
submitted.
[71] Büllow, C.; Wagner, H. Chemische Berichte 1901, 34, 1782.
[72] a) Willsttäter, R.; Everest, A. E. Justus Liebigs Annalen der Chemie 1913, 401, 189. b)
Willsttäter, R.; Mallinson, H. Justus Liebigs Annalen der Chemie 1915, 408, 15 c)
Willsttäter, R.; Mallinson, H. Justus Liebigs Annalen der Chemie 1915, 408, 147.
[73] a) Perkin, A. G.; Robinson, R. Journal of the Chemical Society 1927, 3015. b) Pratt,
D.; Robinson, R.; Robertson, A. Journal of the Chemical Society 1927, 1975.
[74] Haslam, E. Practical Polyphenolics, from Structure to Molecular Recognition and
Physiological Action. Cambridge University Press: Cambridge, 1998.
[75] Brouillard, J. R.; Dubois, J. E. Journal of the American Chemical Society 1977, 99,
1359.
[76] McClelland, R. A.; Gedge, S. Journal of the American Chemical Society 1980, 102,
5838.
[77] a) Pina, F. Journal of the Chemical Society, Faraday Transactions 1998, 94, 2109. b)
Pina, F.; Maestri, M.; Balzani in Handbook of Photochemistry and Photobiology, vol. 3:
Supramolecular Photochemistry. (Ed.) Nalwa, H. S. American Scientific Publishers: ?,
England, 2003. c) Pina, F.; Melo, M. J.; Parola, A. J.; Maestri, M.; Balzani, V. Chemistry –
A European Journal 1998, 4, 2001. d) Pina, F.; Lima, J. C.; Parola, A. J.; Afonso, C. A.
Angewandte Chemie-International Edition 2004, 116, 1551. e) Pina, F.; Maestri, M.;
Balzani, V. Chemical Communications 1999, 107.
[78] Anthocyanidins are the aglicones of antocyanins, and this term was proposed by R.
Willstätter in 1913 [72a]. The structures identified by Willstätter were the anthocyanidin
chromophores. Only with the work of Robinson and others, the sugar substitution was

70
characterized. It is important to retain that anthocyanidins do not exist in Nature, namely
with a free OH in the 3 position the forms in solution will not be stable.
[79] a) Zorn, B.; García-Piñeres, A. J.; Castro, V.; Murillo, R.; Mora, V; Merfort, I.
Phytochemistry 2001, 56, 831. b) Devia, B. ; Llabres, G.; Wouters, J.; Dupont,V;
Escribano-Bailon, M. T.; Pascual-Teresa, S.; Angenot, L.; Tits, M. Phytochemical Analysis
2002, 13, 114.
[80] Thulin, M. Flora of Somalia, 4. Royal Botanic Gardens: Kew, 1995.
[81] Vaughan, J. The Pharmaceutical Journal 1852-1853, 12, 385.
[82] Trimble, H. American Journal of Pharmacy 1895, 516.
[83] Pina, F.; Benedito, L.; Melo, M. J.; Parola, A. J.; Lima, J. C.; Maçanita, A. Anales de
Química International Edition 1997, 93, 111.
[84] McClelland, R. A.; Gedge, S. Journal of the American Chemical Society 1980, 102,
5838.
[85] a) Goto, T.; Kondo, T. Angewandte Chemie-International Edition 1991, 30, 17. b)
Kondo, T.; Yoshida, K.; Nakagawa, A.; Kawai, T.; Tamura, H.; Goto, T. Nature 1992, 358,
515. c) Kondo, T.; Ueda, M.; Yoshida, K.; Titani, K.; Isobe, M.; Goto, T. Journal of the
American Chemical Society 1994. 116 ,7457. d) Kondo, T.; Oyama, K.-I.; Yoshida, K.
Angewandte Chemie-International Edition 2001, 40, 894.
[86] For luteolidin the amount of the red quinoid base found in the equilibrium was circa
30%. In Melo, M. J.; Moura, S.; Roque, A.; Maestri, M.; Pina, F. Journal of Photochemistry
and Photobiology A: Chemistry 2000, 135, 33.
[87] Clark, R. J. H.; Cooksey, C. J.; Daniels, M. A. M.; Withnall, R. Endeavour 1993, 17,
191.
[88] Balfour-Paul, J. Indigo. British Museum Press: London, 2000.
[89] Padden, A. N.; Dillon, V. M.; John, P.; Edmonds, J.; Collins, M. D.; Alvarez, N. Nature
1998, 396, 225.
[90] Fitzhugh, E. (Ed.); Artists Pigments – A Handbook of Their History and
Characteristics. vol. 3. Oxford University Press: Oxford, 1997.
[91] Wouters, J.; Verhecken, A. Journal of the Society of Dyers and Colourists 1991, 7,
266.
[92] Orska-Gawrys, J.; Surowiec, I.; Kehl, J.; Rejniak, H.; Urbaniak-Walczak, K.;
Trojanowicz, M. Journal of Chromatography A 2003, 989, 239.
[93] Surowiec, I.; Quye, A.; Trojanowicz, M. Journal of Chromatography A 2006,112, 209.
[94] Zhang, X. Analysis of Natural Yellow dyes using HPLC with Diode Array and Mass
Spectrometric Detection. PhD Thesis. Boston University: Boston, 2007.

71
[95] Maugard, T.; Enaud, E.; Choisy, P.; Legoy, M. Phytochemistry 2001, 58, 897.
[96] Kuramoto, N.; Kitao, T. Journal of the Society of Dyers and Colourists 1979, 95, 257.
[97] Kuramoto, N.; Kitao, T. Journal of the Society of Dyers and Colourists 1982, 98, 334.
[98] Novotná, P.; Boon, J. J.; vand der Horst, J.; Pacáková, V. Coloration Technology
2003, 119, 121.
[99] Galindo, C.; Jacques, P.; Kalt, A. Journal of Photochemistry and Photobiology A:
Chemistry 2001, 141, 47.
[100] Wentworth Jr., P; McDuhn, J. E.; Wentworth, A.; Takeuchi, A.; Nieva, J.; Jones, T.;
Bautista, T.; Ruedi, J.; Gutierrez, A.; Janda, K.; Babior, B.; Eschenmoser, A.; Lerner, R.
Science 2002, 298, 2195.
[101] Kettle, A. J.; Clark, B. M.; Winterbourn, C. C. Journal of Biological Chemistry 2004,
279, 18521.
[102] Dalmázio, I.; Urzedo, A.; Alves, T.; Catharino, R.; Eberlin, M.; Nascentes, C.;
Augusti, R. Journal of Mass Spectrometry 2007, 42, 1273.
[103] N. Gandra; Frank, A. T.; Le Gendre, O.; Sawwan, N.; Aebisher, V.; Liebman, J. F.;
Houk, K. N.; Greer, A.; Gao, R. Tetrahedron 2006, 62, 10771.
[104] Melo, J. S.; Moura, A. P.; Melo, M. J. Journal of Physical Chemistry A 2004, 108,
6975.
[105] Melo, J. S.; Rondão, R.;Burrows, H. D.; Melo, M. J.; Navaratnam, S.; Edge, R., Voss,
G. A European Journal of Chemical Physics and Physical Chemistry 2006, 7, 2303.
[106] Melo, J. S; Rondão, R.; Burrows, H. D.; Melo, M. J.; Navaratnam, S.; Edge, R. Voss,
G. Journal of Physical Chemistry A 2006, 110, 13653.
[107] Bond, A. M.; Marken, F.; Hill, E.; Compton, R. G.; Hügel, H. Journal of the Chemical
Society, Perkin Transactions 2 1997, 1735.
[108] Roessler, A.; Crttenand, D.; Dossenbach, O.; Marte, W.; Rys, P. Electrochimica Acta
2002, 47, 1989.
[109] Feller, R. Accelerated aging – Photochemical and Thermal aspects. The Getty
Conservation Institute: US, 1994.
[110] Pina, F.; Hatton, T. A. Langmuir 2008, 24, 2356.
[111] Kobzar, K.; Kessler, H.; Luy, B. Angewandte Chemie International Edition 2005, 44,
3145.
[112] Schloddera, E.; Shubinb, V.; El-Mohsnawyc, E.; Roegnerc, M. Biochimica et
Biophysica Acta – Bioenergetics 2007, 1767-6, 732.
[113] Wach, R.; Mitomo, H.; Nagasawa, N.; Yoshii, F. Radiation Physics and Chemistry
2003, 68, 771.

72
[114] The L*, a* and b* are coordinates used in the system CIELAB to characterize a
colour. L* represents the difference between light (L*=100) and dark (L*=0), a* represents
the difference between green (-a*) and red (+a*), and b* represents the difference between
yellow (+b*) and blue (-b*) in Berns, R. Billmeyer and Saltzman’s Principles of Color
Technology. 3rd edition. John Wiley & Sons: US, 2000.
[115] Wouters, J.; Rosario-Chirinos, N. Journal of the American Institute for Conservation
1992, 31-2, 237.
[116] Travis, A. S. History and Technology 2006, 22, 131.
[117] Holme, I. Coloration Technology 2006, 122, 235.
[118] Read, J. The Life and Work of Perkin in Perkin Centenary London -100 years of
Synthetic dyestuffs. Pergamon Press Ltd.: Great Britain, 1958.
[119] Perkin, W. H. Journal of the Chemical Society 1862, 14, 230.
[120] Perkin, W. H. Journal of the Chemical Society Transactions 1896, 596.
[121] Meldola, R. Proceedings of the Royal Society of London. Series A, Containing
Papers of a Mathematical and Physical Character 1908, 80-542, 38.
[122] Rowe, F. M. The Journal of the Society of Dyers and Colourists 1938, 54-12, 551.
[123] Perkin, W. H. Science 1906, 24, 488.
[124] Garfield, S. How one Man Invented a Colour that Changed the World? Faber and
Faber Limited: London, 2000.
[125] Travis, A. S.; Meth-Cohn, O. Chemistry in Britain 1995, 547.
[126] Perkin, W. H. BP1984, 1863.
[127] Travis, A. S. Chemistry and Industry 1988, 508.
[128] Perkin would not license his process to other British chemical manufacturers but
Simpson, Maule & Nicholson started to produce the intermediates nitrobenzene and
aniline, making great improvement in the scale up and as a result aniline was exported for
all France in 1859.
[129] Perkin, W. H. Journal of the Chemical Society Transactions 1879, 717.
[130] Travis, A. S. Ambix 1991, 38-3, 113.
[131] Travis, A. S. Die Allianz Von Wissenschaft under Industrie: August Wilhelm Hofmann
(1818-1892): Zei.t, Werk Wirkung. (Eds.) Christopher Meinel and Harmul Scholz.
Weinheinm VCH: Weinheinm 1992.
[132] Travis, A. The British Journal for the History of Science 1992, 25, 27.
[133] Travis, A. Endeavour 1992, 16, 59.
[134] Perkin, W. H. Proceedings of the Royal Society of London 1862-3, 13, 170.
[135] Perkin, W. H. Proceedings of the Royal Society 1864, 713.

73
[136] Fischer, O.; Hepp, E. Chemische Berichte 1893, 26, 1194.
[137] Nietzki, R. Chemische Berichte 1896, 29, 1442.
[138] Meth-Cohn, O.; Smith, M. Journal of the Chemical Society-Perkin Transactions 1
1994, 5.
[139] Melo, J. S.; Takato, S.; Sousa, M.; Melo, M. J.; Parola, A. J. Chemical
Communications 2007, 2624.
[140] Scaccia, R.; Coughlin, D.; Ball, D. Journal of Chemical Education 1998, 75-6, 769.
[141] Bommel, M. R.; Berghe, I. V.; Wallert, A. M.; Boitelle, V.; Wouters, J. Journal of
Chromatography A 2007, 1157, 260.
[142] Morris, P. J. T. History and Technology 2006, 22, 119.
[143] Sousa, M.; Melo, M. J.; Aguiar-Ricardo, A.; Cruz, P. The 14th Triennial Meeting the
Hague Preprints, ICOM Committee for Conservation, 2005, 2, 944.
[144] Tímár-Balázsy, Á.; Eastop, D. Chemical Principles of Textiles Conservation. Elsevier
Butterworth Heinemann: Oxford, 1998.
[145] From the 5 synthesis performed, the most similar with this one would be synthesis 1
and 2, where in both cases, a mauve dye enriched in methylated derivatives was
expected.
[146] Rose, R. Journal of Chemical Education 1926, 3-9, 973.

74
Appendix I: Experimental section
I.1 General
All reagents and solvents used were of analytical grade.
I.2 Instrumentation
I.2.1 HPLC-DAD
The dye analyses were performed in an analytical ThermoFinnigan Surveyor HPLC-DAD
system with a PDA 5, using a RP-18 analytic column (250x4.6 Nucleosil 300-5 C18). The
purification of the dyes chromophores in large amounts was performed in a semi-
preparative 6000 Merck Hitachi HPLC-DAD system with a L-6200 A Intelligent Pump, a L-
5025 Column Thermostat and a L-4500 DAD. The separations were carried out using a
RP-18 semi-preparative column (250x10 Nucleosil 300-7 C18). In both HPLC systems the
column was kept at controlled temperature (35 ºC). In the analytical system the samples
were injected onto the column via a Rheodyne injector with a 25 µL loop and in the semi-
preparative system a 200 µL loop was used. The system was re-equilibrated at the starting
eluent composition for 3-5 min before next injection. Several elution gradients were used
for the dye analyses and compounds purification:
1) General dye analysis with analytical HPLC-DAD: A solvent gradient of A-pure
methanol and B-0.15% aqueous perchloric acid 70% (v/v) was used at a flow rate of 1.7
ml/min; 0-2 min 7A:93B isocratic, 8 min 15A:85B linear, 25 min 75A:25B linear, 27 min
80A:20B linear, 29-40 min 100A isocratic [1].
2) Mauve dye analysis with analytical HPLC-DAD: A solvent gradient with A - Methanol,
B -CH3COONH4 0.05 M, C - CH3CN with a flow rate of 1.7 mL/min for the chromophores
separation was developed [2] (see table I.1): 0-2 min 20A: 50B: 30C isocratic; 10 min 25A:
35B: 40C linear; 20 min 40A: 20B: 40C linear; 25 min 50A:50C linear; 25-30 min 50A:50C
isocratic.

75
Table I.1 – Elution gradients used for mauve dye analysis.
Elution gradient Chromatogram Observations
A-pure methanol and B-0.15%
aqueous perchloric acid 70%
(v/v) with a flow rate of 1.7
ml/min; 0-2 min 7A:93B
isocratic, 8 min 15A:85B
linear, 25 min 75A:25B linear,
27 min 80A:20B linear, 29-40
min 100A isocratic.
5 10 15 20 25 30
0,00
0,05
0,10
0,15
0,20
0,25
Absorbance (A
u)
Retention time (minutes)
Current solvent gradient used
for all dye analysis in the DCR
laboratory. The mauveine
chromophores of a synthesized
mauve dye sample were eluted
very late and their separation
was poorly resolved.
A-pure methanol and B-0.15%
aqueous perchloric acid 70%
(v/v) with a flow rate of 1.7
ml/min; 0-2 min 7A:93B
isocratic, 5 min 20A:80B
linear, 23 min 75A:25B
linear, 27 min 75A:25B
linear, 29-40 min 100A
isocratic.
5 10 15 20 25 30
0,00
0,05
0,10
0,15
0,20
0,25
Absorbance (A
u)
Retention time (minutes)
Optimization of the previously
elution gradient. The mauveine
chromophores were eluted
earlier than the previously test,
however the separation of the
mauveine chromophores was
not improved.
A-pure methanol and B-0.15%
aqueous perchloric acid 70%
(v/v) with a flow rate of 1.7
ml/min; 0-2 min 7A:93B
isocratic, 5 min 30A:70B
linear, 23 min 95A:5B linear,
27 min 95A: 5B linear, 29-40
min 100A isocratic.
5 10 15 20 25 30
0,0
0,1
0,2
Absorbance (A
u)
Retention time (minutes)
Optimization of the previously
elution gradient. The mauveine
chromophores were eluted
earlier than the previously test,
however the separation of the
mauveine chromophores was
not improved.
A - CH3COONH4 0.05 M , B -
CH3CN with a flow rate of 1.7
mL/min: 0-10 min 35A: 65B
isocratic; 20-25 min 25A: 75B
isocratic; 30 min 20A:80B
linear.
0 5 10 15 20
0,0
0,2
0,4
0,6
0,8
Absorbance (A
u)
Retention time (minutes)
Elution gradient reported in
literature [2] tested in SCM1
mauve salt. The introduction of
the aqueous ammonium
acetate solvent allowed a better
separation of the mauveine
chromophores; however the
mauveines C1 and C were not
separated.
A B
B2 C1 C
B3+B4
A+B3
B+C1
C
B2+B4
A+B3
B+C1
C
B2+B4
A+B3
B+C1
C
B2+B4

76
A - Methanol, B -CH3COONH4
0.05 M , C - CH3CN with a
flow rate of 1.7 mL/min: 0-2
min 20A: 50B: 30C isocratic;
10 min 50A: 20B: 30C linear;
20 min 40A: 10B: 40C linear;
25 min 50A:50C linear; 25-30
min 50A:50C isocratic.
8 12 16 20
0,0
0,4
0,8
1,2
Absorbance (A
u)
Retention time (minutes)
Optimization of the previously
elution gradient. The
introduction of acetonitrile
allowed the separation of
mauveines C1 and C, however
the separation of mauveines B2
and B3 and B4 was worst than
the previous test
A - Methanol, B -CH3COONH4
0.05 M , C - CH3CN with a
flow rate of 1.7 mL/min: 0-2
min 20A: 50B: 30C isocratic;
10 min 25A: 35B: 40C linear;
20 min 40A: 20B: 40C linear;
25 min 50A:50C linear; 25-30
min 50A:50C isocratic.
5 10 15 20 25
0,0
0,2
0,4
0,6
0,8
1,0
Absorbance (A
u)
Retention time (minutes)
Optimization of the previously
elution gradient. A better
separation of all mauveine
chromophores was achieved.
3) Compounds purification with semi-preparative HPLC-DAD: A solvent gradient of A-
pure methanol and B-10% aqueous formic acid 99,9% (v/v) with a flow rate of 9 ml/min
was developed: 0-2 min 15A:85B isocratic, 3 min 50A:50B linear, 5 min 70A:30B linear, 7
min 90A:10B linear, 29-40 min 100A isocratic. This elution gradient was obtained following
a similar procedure reported for mauve dye analysis.
I.2.2 LC-MS
The LC-MS analyses were performed on a HPLC-MS instrument with a ProStar 410
autosampler, two 212-LC chromatography pumps, a ProStar 335 diode array detector and
a 500-MS ion trap mass spectrometer with an ES ion source (Varian, Inc.). The LC
separations were carried out using a Polaris C18-A column, with 5 µm of particle size
(150X2 mm). For the mauve dye analyses the mobile phase was composed by MeOH (A)
and 0.08% (v/v) formic acid (aq.) (B). The following gradient, adapted from the method 2
described above, was used at a flow rate of 0.03 mL/min: 0-2 min 50A: 50B isocratic; 10
min 60A: 40B: linear; 20 min 75A: 25B linear; 30-35 100A isocratic.
The mass spectra were obtained in the 500-MS ion trap mass spectrometer with an ES ion
source and acquired in positive ion mode. The operating parameters were optimized for
A B
B2 C1
C
B3+B4
A B
B2 C1
C
B3+B4

77
the sample Science Museum F1: the spray needle voltage was set at positive ion mode
5.7 kV, nitrogen was used both as nebulising and as a drying gas (35 psi and 15 psi,
respectively), drying gas temperature 350 °C ; capillary voltage 157 V and RF loading of
94 V.
I.2.3 MS
Field-desorption mass spectra (FD/MS) were run on a Micromass GC-TOF spectrometer
in positive ion mode.
High-resolution mass spectra (HRMS) were obtained by laser desorption/ionization (LDI)
with a Finnigan FT/MS 2001-DT Fourier transform ion cyclotron resonance mass
spectrometer (FTICRMS), equipped with a 3 Tesla superconducting magnet and coupled
to a Spectra-Physics Quanta-Ray GCR-11 Nd:YAG laser operated at the fundamental
wavelength (1064 nm).
I.2.4 NMR spectrometry
Compounds isolated from HPLC were lyophilized and further dried under vacuum at room
temperature. All compounds were dissolved in CD3OD, and the residual solvent peak was
used as a reference to calibrate spectra.The NMR spectra in CD3OD at 298.0 K were
obtained either on a Bruker AMX400 operating at 400.13 MHz (1H) and 100 MHz (13C) or
on a Bruker Avance 600 operating at 600.13 Hz (1H) and 150.91 Hz (13C). For each
compound, 1H, 13C, COSY, HSQC or HMQC, HMBC and eventually NOESY NMR spectra
were run. Proton assignments were done on the basis of chemical shifts and COSY
spectra; to confirm these assignments, NOESY spectra were run on one of the samples,
fully confirming the assignments. Carbon assignments were made on the basis of
chemical shifts, HSQC or HMQC, and HMBC NMR spectra.
I.2.5 IC-AEC
The counter-ions of mauve dye crystalline samples were identified in a 3000 Dionex ion
chromatography system with continuously regenerated trap column for reagent free ion
chromatography (ICS 3000 CR-TC RFIC), a ICS-3000 Conductivity Detector, a ICS-3000
Pump and a Ion Pack® CG 16 column with 5x50 mm guard column, using 37.5 mM KOH
as an eluent suppressor.

78
I.2.6 ICP-AES
The mordants analyses for mauve dye were performed in a Jobin-Yvon Ultima ICP-AES
(Inductively Coupled Plasma- Atomic Emission Spectroscopy), with a RF 40, 68 MHz
generator and a Czerny-Turner 1.00 m monochromator. The conditions used were: power
1000 kW; 12 L/min of argon flow, Meinhard nebuliser with 3 bar pressure; pump velocity of
20 rpm; 10ml/min of sample flow debit with three analyses for each sample. Before the
ICP-AES injection, calibration curves were constructed with ICP standards and the
correlation coefficients for the calibration curves were 0.99 for the range studied (0,2-1
ppm for iron and copper; 0.01-0.35 ppm for aluminium).
I.2.7 Optical Microscopy
The optical analysis were carried out in an optical Zeiss Axioplan Z Imaging microscope
with a Nikon digital camera DMX 1200F and in a Leica MZ16 stereomicroscope with a
Leica digital camera (Digilux 1) with fiberoptic light Leica system (Leica KI 1500 LCD).
I.2.8 Monochromatic irradiation
The monochromatic irradiations were performed in a xenon arc lamp with a Jobin Yvon
Divisional Instruments SA monochromator.
I.2.9 Solar Box Camera
The polychromatic irradiation was performed in a 3000e irradiation camera, with a xenon
lamp (λ >300nm), intensity of 800W/m2 and 70ºC BST.
I.2.10 UV/Vis spectroscopy
UV/Vis absorption spectra were recorded on a Cary 100 Bio UV-Vis Varian
spectrophotometer at room temperature.
I.2.11 Colorimeter
Colour determinations were made using a Datacolor International colorimeter. The optical
system of the measuring head uses diffuse illumination from a pulsed Xenon lamp over a 8
mm-diameter measuring area, with a 10o viewing angle geometry. The reference source
was D65 and the calibration was performed with a white bright tile standard plate and with
a black trap standard.

79
I.3 Methods
I.3.1 Dragon’s Blood
I.3.1.1 Resin samples
Eighty-three samples were analysed by HPLC-DAD; 37 from EBC, K (for more details see
chapter 1, section 1.3) were from items labelled: Daemonorops draco (5), Daemonorops
propinqua (a synonym of Daemonorops draco) (3), Daemonorops sp. (1), Dracaena
cinnabari (15), Dracaena draco (7), Dracaena schizantha (a synonym of Dracaena ombet)
(1), and Dracaena sp. (5). Other samples of Dracaena draco were from the Botanic garden
of Ajuda (2); Botanic garden of Lisbon (2); Botanic garden of Funchal, Madeira (9); Natural
Reserve of Dragon’s tree – Neves, Madeira (NRDT), (2); from different places/gardens of
Lisbon and Madeira (17) and from Cape Verde (1). 9 Dracaena cinnabari samples from
Socotra were made available by J. Pavlis [3]. Furthermore, 4 samples were purchased
from Kremer (2 Dracaena cinnabari samples), Zecchi (1 Daemonorops draco sample:
Sumatra and Borneo) and from Healing Waters & Sacred Spaces (1 Daemonorops draco
sample: Indonesia). From the 83 samples described above, only 46 samples were used to
build the dragon’s blood HPLC-DAD library, previously to EBC, K analysis, see table I.2.

80
Table I.2 - Library samples analysed by HPLC-DAD.
ID Species Source Estimated age/
Observations Dragon tree photo
1 Dracaena draco Botanical garden of
Ajuda, Lisbon (BGAL)
Centenary tree
(300-360 years old)
2 Dracaena draco BGAL Centenary tree
(150 years old)
3 Dracaena draco Botanical garden of
Lisbon
Centenary tree (circa 130
years old)
4 Dracaena draco Botanical garden of
Lisbon
Centenary tree (less than 200
years old)
5 Dracaena draco Botanical garden of
Funchal (BGF)
Less than 100 years old
This is the oldest dragon tree
in BGF.

81
6 Dracaena draco BGF Less than 100 years old
7 Dracaena draco BGF Less than 100 years old
8 Dracaena draco BGF Less than 100 years old
9 and
10
Dracaena draco
BGF
These dragon trees were the
branches of older dragons that
were recently planted in BGF.
9
10
10

82
11 Dracaena draco BGF
This dragon tree was the
branches of an older dragon
tree that was recently planted
in BGF.
12 Dracaena draco BGF Less than 10 years old
13 Dracaena draco BGF Less than 10 years old
14
and
15
Dracaena draco
Natural Park Madeira Centenary tree
16 Dracaena draco Lisbon, Palace of
Necessity Centenary tree
17 Dracaena draco Lisbon, Ultramarine
Historic Archive Centenary tree
14 15

83
18 Dracaena draco Lisbon, Military Govern Centenary tree
19 Dracaena draco Lisbon, Ribamar house Centenary tree
20 Dracaena draco Lisbon, Ribamar house Centenary tree
21 Dracaena draco Lisbon, Ribamar house Centenary tree
22 Dracaena draco Lisbon, Ribamar house Centenary tree

84
23 Dracaena draco Lisbon, Algés Centenary tree
24 Dracaena draco Lisbon, Carnide house Less than 100 years old
25 Dracaena draco Lisbon, Almada
Seminary Centenary tree
26 Dracaena draco Lisbon, Garden of
Cidade Universitaria 65 years old
27 Dracaena draco Madeira, Museum of
Quinta das Cruzes Centenary tree

85
28 Dracaena draco Madeira, Museum of
Quinta das Cruzes Less than 100 years
29 Dracaena draco Madeira, Park of Santa
Catarina Less than 20 years old
30 Dracaena draco Madeira, Park of Santa
Catarina Less than 30 years old
31 Dracaena draco Madeira, Garden of
IBTAM Centenary tree
32 Dracaena draco Madeira, Garden of
Avenida do Mar Less than 50 years old

86
33 Dracaena draco Cape Verde
(Figueiral do Paul) Less than 30 years old
34-42
Dracaena
cinnabari Socotra Centenary trees
43 Kremer -
44
Daemonorops
draco (as
Calamus draco)
Zecchi -
45 Daemonorops
draco Indonesia -
-
46 Dracaena
Schizantha
Kew garden, from
Ethiopia
29 years old.
Behind the Dracaena
schizantha (a) there is a
Dracaena cinnabari whit 41
years old (b).
a
b

87
I.3.1.2 Collection/sampling of resins
The resin samples collected in Portugal were obtained directly from botanically verified
dragon trees of different ages (from 10 to circa 200/350 years old, see table I.2), in three
different injured areas of the stem and branches (figure I.1). When possible, the samples
were also collected in different seasons of the year (summer and winter) and the results
were consistent.
Figure I.1 – a) Resin collected from the branch; b) Resin collected from the stem; c)
Extraction of the resin with acidified MeOH (AH-) and MeOH (A).
From the EBC, K, 50 mg samples were taken for detailed characterization from items
labeled Daemonorops draco (3), Daemonorops propinqua (a synonym of Daemonorops
draco) (2), Dracaena cinnabari (3), Dracaena draco (2) and Dracaena sp. (3). From the
remaining 24 samples of the collection only 0.5 mg were sampled.
The Dracaena collection of EBC, K is very heterogeneous, presenting different grades of
resin, namely a higher, valuable and pure grade [4] composed of tears of resin - “Edah
amsellah” - (e.g. 36611, figure I.2a) or fine marbles of resin; a second grade composed of
resin attached to bark or red powder - “Edah dukkah” – and also a third grade composed
of mixtures of resin, bark and powder - “Edah mukdehah” (e.g. 36809, figure I.2b). Large
pieces of red wood (e.g. 26421) were also found.
In the Daemonorops collection, the resin samples were very heterogeneous being
composed usually of a mixture of resin fruit scales, and other contaminants. The extraction
and processing of the resin into moulded cakes or sticks can incorporate a considerable
amount of impurities. Consequently, analysis from resin extracted directly from the fruit’s
scales was also performed (e.g. 35499, figure I.2c); for more details see chapter 1, section
3.1.
AH+ A
a b c

88
Figure I.2- a) Dracaena draco, tear resins, sample 36611 (magnification 7x); b) Dracaena
cinnabari, composed resin (resin, pigment and wood); sample 36809 (magnification 7x);
Daemonorops draco, fruits scales with resin, sample 35499 (magnification 7x).
I.3.1.3 Extraction of the dragon’s blood dye chromophores, purification and
characterization of the natural flavylium markers
The extraction conditions of the coloured compounds of dragon’s blood resins are a crucial
step in the resins distinction. Special attention should be paid in its identification in works
of art, where usually small samples can be taken for a single analysis and low
concentrations should be expected. An extraction with at least an acidic pH should be
performed in order to avoid the complex network of chemical reactions in which the
flavylium compounds are involved and obtain the single flavylium cation which allows the
rapid and easy identification of the resin as described in Chapter 1, section 3.1. Therefore,
the red colorants of the dragon’s blood resin samples were extracted with methanol
acidified with perchloric acid in water, pH≈1, for less than 2 minutes (figure I.1c).
The samples were filtered and analyzed by analytical HPLC-DAD. All the resin samples
were injected at least three times in HPLC-DAD, with exception of small samples from the
EBC, K, where less than 0.2 mg of resin was used in one HPLC-DAD analysis.
For the NMR and MS characterization of the flavylium markers, several runs with dragon’s
blood resins used in the HPLC-DAD library were performed in the preparative HPLC-DAD
system as reported above. Moreover, the dracorhodin network of chemical reactions
characterization was also performed with the flavylium isolated from the dragon’s blood
resin with HPLC-DAD.
The identification of the isolated flavylium markers was made on the basis of MS and NMR
(see appendix II – Dragon’s blood data), although the complete structure confirmation of
the 7,4’-dihydroxy-5-methoxyflavylium and the 7,4’-dihydroxyflavylium required their
synthesis [5-6].
b c a

89
I.3.1.4 PCA analysis
Principal components analysis (PCA) of dragon’s blood resins were carried out using
Matlab version 6.5 release 13. The PCA algorithm was written in-house. Given the
multivariate nature of the resin samples’ chromatograms, multivariate data analysis was
required in order to analyse samples. PCA was selected to perform a similarity analysis
[7]. Similarity between the dragon’s blood resin samples was assessed with the
chromatogram data between 15.3 and 28.9 minutes (all peaks were found to be within this
region). Prior to PCA, chromatograms were pre-processed using the standard normal
variate method and subjected to mean centering [7].
PCA results were analysed on the basis of the principal components retaining the major
part of the original chromatogram data variance. Since principal components represent the
original chromatograms in a smaller dimension, space scatter plots can be used to
visualize the original data.
I.3.1.4 Characterization of the network of chemical reactions of flavylium
compounds
The characterization of the network of chemical reactions of flavylium compounds was
performed in 99% water/MeOH (v/v) at 25 ºC with the UV/Vis spectrophotometer. The 7,4’-
dihydroxy-5-methoxyflavylium displayed low solubility in water and, as a result, the final
concentration of the solution after filtering with 0.45 µm acrodisc filters was very low (circa
1x10⁻⁶ M). The concentration of the dracorhodin flavylium was also very low, as it was
obtained from the dragon’s blood resins after HPLC separation.
The pH of the solutions was adjusted with the addition of HClO4 or NaOH solutions and
universal buffer, and measured by a Metrohm 713 pH meter. The reaction kinetics were
monitored by UV/Vis absorption.
I.3.2 Indigo
1.3.2.1 Actinometry
For the monochromatic irradiation at 335 nm, the intensity of the incident light (I0) was
calculated with the potassium hexacyanocobaltate(III) actinometer ([Co(CN)6]3-) [8],
whereas in the irradiation at 610 nm the Reinecke’s salt actinometer ([Cr(NH3)2(SCN)4]-)
was used [9].

90
To obtain the lamp I0 at 335 nm, a 3 mL solution of potassium hexacyanocobaltate(III)
actinometer 10-2 M in water, pH=2, was irradiated in a quartz cell with 1 cm optical path
under constant agitation during 10 minutes. Every 2 minutes, a UV/Vis spectrum of the
solution was obtained. The formation of the pentacyanocobaltate(II) product
([Co(CN)5(H2O)]2-), according to equation (1), was followed at 380 nm, with a quantum
yield of 0.31 [8].
Co(CN)63- + H3O
+ � Co(CN)5(H2O)2- + HCN (1)
To calculate the intensity of light, the following expression was used:
I0= (2)
Vsol is the volume of irradiated solution in mL (3 mL), ∆A is the change in absorbance at
the monitoring wavelength (380 nm) over the irradiation time period, ∆t, corrected by the
light absorption of the reagent at 335 nm(λirr), ∆ε is the difference between the molar
absorption coefficients of reagent (ε(R)=10 M-1cm-1) and product (ε(P)=280 M-1cm-1) at the
monitoring wavelength (270 nm), and ΦR is the quantum yield of reaction (1) (ΦR=0.31).
The I0 was calculated with the program Moggicor.
To obtain the lamp I0 at 610 nm, a solution of [Cr(NH3)2(SCN)4]- 0.05 M in water, pH=5.3
(natural pH of Reinecke’s salt in water), previously recrystallized also with water at 40 ºC in
the dark, was irradiated under constant agitation for 2, 4 and 6 minutes, corresponding
each irradiation time to an individual 3 mL quartz cell. Moreover, a thermal blank was kept
in the dark for comparison with the irradiated samples. The irradiation of the Reinecke’s
salt causes the substitution of a SCN- ligand by a water molecule:
[Cr(NH3)2(SCN)4]- + H2O � [Cr(NH3)2(SCN)3(H2O)]- + SCN- (3)
To obtain the lamp I0, the released SCN- is complexed with ferric nitrate forming a red
compound:
Fe3+ + SCN- � Fe(SCN)2+ (4)
hν
Vsol . (∆A/∆ε)
1000.ΦR . ∆t
hν
hν

91
Therefore, 2 mL of each irradiated solution and the blank were diluted with 0.1 M Fe(NO3)3
in 0.5 M HCLO4 to a final volume of 5 mL in a volumetric flask. Finally, the UV/Vis spectra
of the solutions with the resulting iron (III) thiocyanate complex were traced and the
formation of the product was followed at 450 nm (equation (4). This actinometry was
performed twice, being the results very similar. However, in the second time, a higher
amount of thiocyanate ion was present in the starting Reinecke’s salt solution.
The intensity of light was calculated with equation (2), where the Vsol considered took into
account the dilution performed with 2 mL of the irradiated solution, as described above
(Vsol=3x(5/2), ∆A was the absorbance variation at 450 nm corrected by the light absorption
of the reagent at 610 nm, ∆ε used was 4270 M-1cm-1 (εP450=4300 M-1cm-1 and εR
450=30 M-
1cm-1), and the ΦR used was 0.31 [8].
I.3.2.2 Homogeneous media – monochromatic irradiation
1x10⁻⁴ M Indigo/DMF solutions in 3 mL quartz cells with 1 cm optical path and very well-
stirred were submitted to monochromatic irradiation at 335 and 610 nm in the presence of
O2 with atmospheric conditions, in degassed solutions (high vacuum line) and in N2
atmosphere. Degassed solutions enabled to obtain lower levels of O2 than N2 bubbling and
therefore were chosen for the ΦR in the absence of molecular oxygen.
For the O2-free atmosphere, the indigo/DMF solution was submitted to circa 0.5 h of
freezing and de-freezing cycles (3) with liquid nitrogen in the high vacuum line. In the
argon atmosphere, the indigo/DMF solution was submitted to 15 min of bubbling with
argon, to assure that O2 was not present.
1x10⁻⁴ M indigo carmine dissolved in DMF or in water was irradiated in 3 mL quartz cells
with 1 cm optical path and very well-stirred at 335 and 610 nm in the presence of oxygen.
The I0 was obtained as reported for Indigo.
For indigo photodegradation studies, small aliquots of the irradiated solution (50 µL) were
analysed with HPLC-DAD at each irradiation time. In indigo carmine photodegradation,
only the last irradiation time was analysed by HPLC-DAD.
I.3.2.2.1 Quantum yield
The quantum yield was calculated with the following expression:
ΦR = (5)
Vsol . (∆A/∆ε) 1000.Iabs . ∆t

92
Iabs is the total light absorbed by the solution at the irradiation wavelength; the Iabs is equal
to I0 x (1-10-Airr) when A<2 or Iabs=I0 when A>2. The other terms were obtained as reported
for equation 2. The ∆ε, calculated at the monitoring wavelength (610 nm for indigo and 617
nm for indigo carmine), only considered the ε of the reagent as the main product formed is
colourless. The program Moggiccor was also used to obtain the ΦR.
I.3.2.3 Heterogeneous media – monochromatic irradiation
Solid gels of indigo carmine in carboxymethylcellulose (M.W. 270000) and commercial
gelatine (Vahine and Jerónimos), as well as bacteriological gelatine (Aldrich), were
irradiated at 335 and 610 nm in the presence of oxygen. For the cellulose based gel, 0.4 g
of CMC was dissolved in 4 mL of hot water (at circa 90 ºC) with constant agitation and the
help of an ultrasonic bath, when necessary. 4 mL of indigo carmine 1x10⁻⁴ M in water were
added to the CMC gel and the resulting mixture was submitted to the ultrasonic bath until
the air bubbles disappeared. Finally, circa 3 mL of CMC gel were placed in a 3 mL quartz
cell for monochromatic irradiation and other 3 mL were kept in the dark for thermal control.
The Vahine and Jerónimos gelatine sheets were kept in a cold water bath overnight,
previously to the formation of solid gels with indigo carmine, in order to remove impurities
as sugars or other additives.
0.4 g of washed gelatine was dissolved in hot water (at circa 90 ºC) under constant
agitation. After its complete dissolution, 4 mL of indigo carmine 1x10⁻⁴ M in cold water was
added. Before the gelatine solidification, the solution was transferred to a 3 mL quartz cell,
as reported for the CMC gel. The irradiation path was the same as for the CMC gel. The
procedure for bacteriological gelatine was the same reported for Vahine and Jerónimos
gelatines; however, this gelatine was not submitted to a cold water bath overnight as it
promoted the gelatine dissolution.
The final irradiated gels were dissolved in MeOH, filtered with 0.45 µm acrodisc filters and
analysed by HPLC-DAD.
I.3.2.3.1 Quantum yield
The quantum yield in heterogeneous media was calculated as in the homogeneous media
using equation (5). However, only half volume of the gel was irradiated (see figure I.3) and,
therefore, the volume considered was 1.45 mL (calculated through the measurement of
the optical path exposed to light) [9].

93
Figure I.3 – Gelatine indigo carmine gel before a) and after b) 335nm irradiation.
I.3.2.4 Heterogeneous media - polychromatic irradiation
Circa 0.10 mg of indigo were deposited on a creased glass surface (1 cm2) with a small
brush and irradiated in the Solar Box camera during 2700 hours, see figure I.4. Three cells
were taken at circa each 500 hours of irradiation. The final colour was measured with the
colorimeter prior to HPLC-DAD analysis. The indigo was extracted from the cells with DMF
and immediately analysed by HPLC-DAD to prevent further deterioration.
Figure I.4 – Indigo cells irradiated in the solar box.
I.3.2.5 Indigo photodegradation HPLC-DAD calibration curves
Previously to analysis of indigo photodegradation in liquid and solid state, calibration
curves were made with indigo and isatin standards dissolved in DMF for the concentration
range expected (from 1x10⁻⁴ M to 1x10⁻⁶ M). Afterwards, the respective areas of the
compounds were calculated at their maximum wavelength with the chromatographic
program Chromquest and represented as a function of the concentration. The correlation
coefficients for all the calibration curves were good, ≥ 0.98, for the concentration range
studied.
I.3.2.6 Andean indigo dyed fibres extraction
The dyes were extracted from circa 0.3 mg of fibre with 400 µL of DMF and heating for 30
min at 60 ºC with magnetic stirring in a glass vial. Before the extraction, the vial was
submitted to 5 minutes of vacuum and argon cycles to assure that O2 was not present.
After the extraction, the solvent was evaporated under vacuum. The residue was dissolved
a b
0h 2700h

94
in 40 µL of DMF and then centrifuged to separate the particulate matter. The upper 30 µL
of solution were removed and analysed in the HPLC-DAD. The extract was analysed
immediately after the concentration, to reduce the risk of degradation.
I.3.3 Mauve dye
I.3.3.1 Syntheses
The several syntheses of mauve dye followed the same basic procedure as described in
[10], where different proportions of the starting materials were used (for more details, see
chapter 3, section 3.3):
The p-toluidine was dissolved in water around 30 ºC with a large spin vane. Afterwards,
aniline, o-toluidine and 1M sulphuric acid were added. When all the compounds were
dissolved, potassium dichromate dissolved in water was added to the mixture. The
solution was stirred for two hours under constant temperature (circa 30 ºC) and then
filtered. The crude product obtained was washed under suction with water, hexane and
finally 25% MeOH/H2O. In between the three washings, the residue was dried at circa 110
ºC first for 30 min and then for 10 min.
I. 3.3.2 Mauve dye sources
20 mauve samples were analysed by HPLC-DAD: 4 different mauve dyes synthesized as
described in chapter 3, section 3.1; 7 historic mauveine salts and 7 historic textile samples
dyed with mauve from important museums, 2 mauve dyed textiles from the JCE 1926 and
DHA 2001 books and a mauve dyed silk textile according to the original Perkin’s recipe; for
more details table I.3.

95
Table I.3 – Historical mauve samples
Sample ID Description
Date
attribution
in the
literature
[11]
Labels/Other information
from the Museums/
Observations
Photo
TEXTILES SAMPLES
Science
Museum
F5
1947-117
Silk. Dark red
purple colour.
10 cm of width
1.19 mg.
1856-7 (?)
Small piece of silk fabric dyed
with mauve of pattern supplied
allegedly to Queen Victoria
about 1860.
Sample sent by the SM (left), magnification 7x;
silk fabric (right) [12].
Perth
Museum
Silk. Dark red
purple colour.
Colour not
homogeneous
on the back.
0.5 cm2
8.19 mg.
1856-7 (?)
Gift by the Pullar family in 1938
to the PM and in the register
notes it is written that this
sample was “cut from the first
length of material dyed by Dr
Perkins [sic] by his new
process in Pullar’s works, Perth
in 1856”.
Front (left) and Back (right), magnification 7x
Science
Museum
F6
1947-333
Wool. Dark red
purple colour.
25.46mg.
1862
Mauve dyed shawl exhibited at
International Exhibition of
1862.
Sample sent by the SM (left), magnification 7x;
shawl (right) [12].
Science
Museum
F1
1947-116,
Pt1
Silk. Dark red
purple colour.
10 cm of widht
0.32 mg.
Magnification 16x.
Science
Museum
F2
1947-116,
Pt2
Silk. Pale
purple colour.
5 cm of widht
0.16 mg
1860 (?)
Possibly made for the 1862
International Exhibition and
given to SM by Miss A. F.
Perkin in 1947.
-

96
Science
Museum
F3
1947-116,
Pt3
Silk. Dark red
purple colour.
10 cm of widht
0.45 mg.
Mounted mauve silk skein.
Possibly made for the 1862
International Exhibition and
given to SM by Miss A. F.
Perkin in 1947.
Magnification 7x
Science
Museum
F4
1947-116,
pt4
Cotton.
Heterogeneous
colour.
10 cm of widht
2.29 mg.
Possibly made for the 1862
International Exhibition and
given to SM by Miss A. F.
Perkin in 1947.
Magnification 7x
SALTS SAMPLES*
Science
Museum 1
(1952-175)
Dark black
purple colour.
High content of
rectangular
particles.
“Original Mauveine Prepared
by Sir William Henry Perkin in
1865”.
Formerly in Imperial College,
donated in 1952 to the Science
Museum. Analysed by Meth-
Cohn and Smith [13].
Magnification 200x, transmitted light
Science
Museum 2
(1947-
115/1)
Dark black
purple colour.
Irregular
spherical
particles.
“Mauveine Salt”.
Donated to the SM by Miss A F
Perkin in 1947.
Magnification 100x, transmitted light
Science
Museum 3
(1947-
115/2)
Dark black
purple colour.
Irregular
spherical
particles.
“Mauveine HCl”.
Donated to the SM by Miss A F
Perkin in 1947.
Magnification 100x, reflected light-dark ground
Science
Museum 4
(1947-
115/3)
Dark black
purple colour.
Irregular
spherical
particles.
1862 (?)
“Mauveine acetate”.
Donated to the SM by Miss A F
Perkin in 1947.
Magnification 100x, transmitted ligh

97
Museum SI
Manchester
1
Dark black
purple colour.
Irregular
spherical
particles and or
agglomerates.
1862 (?)
1906 (?)
Given by the Kirkpatrick branch
of the Perkin family to ICI and
subsequently transferred to the
MSIM. It has a broken factory
seal on the cork and appears
to come from the Grenford
Green works of Perkins &
Sons. It is labelled as “Crude
Mauveine Acetate”
“(‘[Perkin&Sons/P]atent[Anil]ine
Pur[ple]’)”, 1862 Manchester
Museum of Science and
Industry, Manchester (Inv. No
L1999.2.8).
Analysed by Meth-Cohn and
Smith [13].
Magnification 100x, reflected light –white ground
Museum SI
Manchester
2
Dark black
purple colour.
Irregular
spherical
particles.
-
From the Schunck collection of
MSIM and is labelled as
“mauveine C27 H24 N4”. The
handwriting looks like other
samples in the collections and
was probably written by
Schunck or his assistant.
Magnification 100x, transmitted light
Chandler
Museum 1
Dark black
purple colour.
High content of
rectangular
particles
1906 (?)
From the CM at Columbia
University, New York City and
given to Professor Charles
Chandler by W. H. Perkin
during his visit to New York in
October 1906.
Magnification 400x, reflected light – dark
ground
MAUVE FROM OTHER SOURCES
JCE
Blue shade of
purple colour.
Circa 2.5cm of
width and 1cm
of height.
1926 L*=31.24±0.03; a*=24.69±0.00;
b*=-30.64±0.01**

98
DHA
Red shade of
purple colour.
Circa 2.5cm of
width and 1cm
of height.
2001 L*=45.43±0,17; a*=19.19±0,07;
b*=-20.92±0.06**
SYNTHESIZED MAUVE AND MAUVE DYED TEXTILE AT FCT-UNL
FCT
Red shade of
purple colour.
Circa 2cm of
width and
1.5cm of
height.
2007 L*=44.93±0.61; a*=19.21±0.35;
b*=-11.30±0.37**
2006
Major compounds:
1, Mauveine B2 and C
2, Mauveine B
3, no formation of mauve dye
Synthesis
JCE 1998
Colour
obtained:
1, dark purple;
2, purple; 3,
brown; 4,
brown; 5 light
purple 2007
Major compounds:
4, no formation of mauve dye
5, Pseudo-mauveine
* The colours of the salt samples in the optical microscope were always golden-green with
reflected light and black with transmitted light for minor magnifications.
** The L*, a* and b* are coordinates used in the system CIELAB to characterize a colour.
L* represents the difference between light (L*=100) and dark (L*=0), a* represents the
difference between green (-a*) and red (+a*), and b* represents the difference between
yellow (+b*) and blue (-b*) [14]
I.3.3.3 Extraction and characterization of mauve dye
Prior to HPLC-DAD and/or LC-MS analysis, the mauve salt samples were dissolved in
methanol while the chromophores recoveries from fibres with less than 0.2 mg were
obtained using soft extraction methods.
Six extraction procedures to enable the recovery of all mauveine chromophores were
tested in textile historical reconstructions, that is, silk textiles dyed with Science Museum 1
according to Perkin’s recipes[15]: extraction 1: MeOH; extraction 2: MeOH / H2O (25:75,
v/v); extraction 3: MeOH / HCOOH 98 % (95:5, v/v); extraction 4: 0.2 M oxalic acid /
1 2 3
1
4 5

99
MeOH / acetone / water (1:3:3:4, v/v/v/v); extraction 5: MeOH + 1 drop of 0.01 M HCl /
H2O (pH = 2); extraction 6: MeOH + 1 drop of NaOH / H2O (pH = 10). The extraction
procedures were carried out as follows: a small sample of thread (around 0.1 mg) was
extracted with 400 µL of the solution mixture in 1.5 ml eppendorfs for 30 min at 60 ºC
(water bath) under constant stirring [16]. After extraction, each extract was dried in a
vacuum system, where the resulting dry residues were reconstituted with 50 µL of
methanol and then centrifuged to separate the particulate matter. The upper 30 µL
solutions were removed and analysed with HPLC-DAD.
All the mauve-dyed samples were extracted with method 5 which revealed to be the most
efficient method (see table I.4 and figure I.5). Moreover the colored extract obtained from
the mauve dyed fabric with this method revealed that the mauveine chromophores from
the dyeing bath were absorbed homogeneously, this is in equal proportion by the textile
(table I.5). When there was enough sample amount, methods 3 and 1 were also applied
and standard deviation values calculated.
Table I.4 –Extraction methods tested in mauve dyed silk textile according to Perkin’s
recipes.
Extraction method Mauveine A and B (%)*
1 53
2 25
3 65
4 -
5 100
6 -
*The peak areas were measured at 551nm. The areas were then normalized with the
major compound area. Correction is made by dividing the raw area by the fiber weight.
Figure I.5 – Perth Museum sample before (a) and after (b) extraction with MeOH / HCOOH
98 % (95:5, v/v).
a b

100
Table I.5 – Mauveine chromophores distribution in mauve dyed textile after dyes recovery
and in ScM1 salt sample.
Mauveine Mauve dyed textile ScM1 salt
pseudo-mauveine <1 1
mauveine C25a+C25b 2 2
mauveine A 50 50
mauveine B 22 23
mauveine B2 11 10
mauveine B3+B4 6 5
mauveine C 4 4
mauveine C1 5 5
For the mass spectrometry (FDMS and FTICRMS) and NMR (1H and 13C) characterization,
several runs with the mauve dye obtained from synthesis 1 (see table I.3 and chapter 3,
section 3.3) [10] in the semi-preparative HPLC-DAD, as described in section I.2.1, were
performed. The Science Museum F6, Science Museum F1 and Museum SI Manchester 2
samples were also characterized by LC-MS.
The counter-ions analysis of mauve historic salts 1X10⁻⁵ M in water was performed with
HPLC anion exchange chromatography. Previously, a data base with ion standards
dissolved in water were also analysed (see table I.6).
Table I.6. Ion standards and respective retention times (tr) in water*.
Standard (M) tr (min)
4.8±0.1 Acetate (5×10⁻⁵)
9.5±0.3
Chloride (5×10⁻⁴) 8.1±0.2
Sulphate (5×10⁻⁴) 12.4±0.4
Nitrate (5×10⁻⁴) 21.7±0.3
*The standards were dissolved in water since with methanol the acetate standard
precipitates giving rise to a broad band, masking the identification of other ion standards.
I.3.3.4 Mordant analysis
Fe, Al, and Sn mordant identification was performed in three mauve-dyed textile samples
(Science Museum F4, Science Museum F6 and Perth Museum) using ICP-AES. Circa 1-3
mg of fibre were digested with HNO3 65% for 1h in the ultrasonic bath. After complete

101
dissolution, the HNO3 was diluted with water to a total volume of 4 mL and 9%
concentration (v/v).
I.3.3.5 Polychromatic irradiation
Two mauve yarns dyed as in the original recipes [15] (see table I.3 and I.5), and two yarns
from the SCMF5 and SCMF6 textiles samples were submitted to an accelerated aging
study in the Solar Box camera during 200 h at 700 MJ/m2. The colour fading was
monitored with the colorimeter and HPLC-DAD approximately every 12 h.
References
[1] Casteele, K. V.; Geiger, H.; Loose, R.; van Sumere, C. F. Journal of Chromatography
A 1983, 259, 291.
[2] This method was created after a research on HPLC methods used for similar organic
dyes as methyl violet: a); Tarbin, J. A.; Barnes, K.A.; Bygrave, J.; Farrington, W.H.H.,
Analyst 1998, 123, 2567. b) Samanidou, V. F.; Nikolaidou, K. I.; Papadoyannis, I.N.,
Journal of Liquid chromatography and Related Technologies 2004, 27-2, 215.
[3] Adolt, R.; Pavlis, J. Trees 2004, 18, 43.
[4] Pearson, J.; Prendergast, H.D.V. Economic Botany 2001, 55, 474.
[5] Melo, M. J; Sousa, M. M; Parola, A. J; Seixas de Melo, J. S.; Catarino, F.; Marçalo, J.;
Pina, F. Chemistry – A European Journal 2007, 13, 1417.
[6] Pina, F.; Benedito, L.; Melo, M. J.; Parola, A. J.; Lima, J. C.; Maçanita, A. Anales de
Química International Edition 1997, 93, 111.
[7] Naes, T.; Isaksson, T.; Fearn, T.; Davies, T. Multivariate Calibration and Classification,
NIR Publications, Chicester: UK, 2004.
[8] Pina, F.; Moggi, L.; Manfrin, M.; Balzani, V.; Hosseini, M.; Lehn, J. M. Gazzeta Chimica
Italiana 1989, 119, 65.
[9] Montalti, M.; Credi, A.; Prodi, L.; Gandolfi, M. Handbook of Photochemistry. 3rd edition.
CRC Press, Boca Raton: US, 2006.
[10] Pina, F.; Hatton, T.A. Langmuir 2008, 24, 2356.
[11] Scaccia, R.; Coughlin, D.; Ball, D. Journal of Chemical Education 1998, 75-6, 769.
[12] Morris, P. J. T. History and Technology 2006, 22, 119.
[13] In http://www.sciencemuseum.org.uk , April 2008.
[14] Meth-Cohn, O.; Smith, M. Journal of the Chemical Society-Perkin Transactions 1
1994, 5.
[15] Perkin, W. H. Journal of Chemical Society 1862, 14, 230.
[16] Zhang, X.; Laursen, R. A. Analytical Chemistry 2005, 77, 2022

102
Appendix II – Dragon’s Blood data
II.1. NMR and MS characterization
II.1.1 7,4’-dihydroxy-5-methoxyflavyliu (dracoflavylium)
For the first time, the 7,4’-dihydroxy-5-methoxyflavylium (dracoflavylium) was isolated with
HPLC from Dracaena draco dragon’s blood resins and characterized by HRMS (calculated
for C16H11O4–, 267.06628); m/z 253.04991 [M-CH3]
– (calculated for C15H9O4–, 253.05063).
The results obtained were compared with the synthesized flavylium, as the natural
dracoflavylium separated by HPLC-DAD revealed the presence of minor impurities. The
isolated compound had the same retention time, UV-Vis spectra by HPLC-DAD (20.50
min, λmax=477 nm) and the same molecular mass peaks (HRMS: m/z 267.06646 [M-H]–
(calculated for C16H11O4–, 267.06628); m/z 253.05025 [M-CH3]
– (calculated for C15H9O4–,
253.05063) of the synthesised flavylium.
The 1H NMR spectra of the isolated and of the synthesised compounds in acidic CD3OD
are identical, except for some peak overlap due to the presence of minor impurities in the
isolated sample.
Elemental analysis for the synthesized compound: exp. (calc. for C16H14O8S.3.5H2O;
FW=429.40 g mol–1) %C 44.91 (44.76), %H 4.02 (4.93), %S 7.35 (7.47). 1H NMR (400
MHz, CD3OD/CF3CO2D, 30 °C, AH+ form): see figure II.1 and table II.1; in agreement with
published data for this compound [1]; (D2O/NaOD, pD>12, 30 °C, equilibrated, Ct2– form):
δ/ppm 3.59 (s, 3H, OCH3), 5.33 (s, 1H, H6 or H8), 6.37 (d, J=9.0 Hz, 2H, H3’+H5’) , 7.51
(d, J=15.9 Hz, 1H, H3), 7.58-7.63 (m, 3H, H6 or H8, H2’+H6’), 8.09 (d, J=15.9 Hz, 1H, H4).
Figure II.1 - 7,4’-dihydroxy-5-methoxyflavylium hydrogen sulphate
O
OH
HO
3'
4'
5'
2'
1'
6'
1
2
3
45
6
78
10
9
OMe
+

103
Table II.1 – 1H and 13C-NMR data for 7,4’-dihydroxy-5-methoxyflavylium hydrogen
sulphate. [a]
Position 1H δδδδ/ppm
(J/Hz)
COSY 13C (δδδδ/ppm) HMBC [b]
2 173.1
3 8.09 (d, 9.2) 4 111.1 C2, C10
4 9.08 (d, 9.2) 3 149.1 C2, C9, C5
5 161.0
6 6.78 (s) 8 100.9 C5, C10, C8
7 160.3
8 7.03 (s) 6 96.7 C7, C10, C6
9 172.4
10 113.8
1' 121.0
2',6’ 8.32 (d, 9.3) 3',5' 133.4 C2, C4’, (C2’, C6’)
3',5' 7.07 (d, 9.3) 2',6’ 118.5 (C3’, C5’), C1’
4' 167.6
5-OCH3 4.09 (s) 57.8 C1
[a] Data recorded at 400/100 MHz in CD3OD/CF3CO2D [b] Correlation from H to the
indicated carbons.
II.1.2 7-hydroxy-5-methoxy-6-methylflavylium (dracorhodin)
The occurrence of 7-hydroxy-5-methoxy-6-methylflavylium (dracorhodin) in dragon’s blood
resins was confirmed by isolation with HPLC and characterization by HRMS (m/z [M-H]-
265.09516, [M-H]-; calcd. for C17H13O3-: 265.09484; M is the quinoid base) and 1H and 13C
NMR (see figure II.2 and table II.2); to our best knowledge, this is the first full
spectroscopic characterization of this compound.
Figure II.2 - 7-hydroxy-5-methoxy-6-methylflavylium.
OHO
3'
4'
5'
2'
1'
6'
1
2
3
45
6
78
9
10
OMe
+

104
Table II.2 – 1H and 13C-NMR data for 7-hydroxy-5-methoxy-6-methylflavylium
(dracorhodin) isolated from a Daemonorops sp. commercial resin by HPLC-DAD.[a]
Position 1H δδδδ/ppm
(J/Hz)
13C (δδδδ/ppm) HMBC [b]
2 171.8 -
3 8.31 (d, 8.6) 113.2 C2, C10
4 9.20 (d, 8.6) 151.1 C2
5 158.5
6 125.3
7 172.0
8 7.31 99.3 [c]
9 [c]
10 117.9
1' 130.5
2',6 8.36 (d, 7.6) 129.9 C2, C4’, (C2’, C6’)
3',5' 7.07 (t, 7.5) 130.9 C1’, (C3’, C5’)
4' 7.74 (t, 7.4) 136.4 C2’, C6’
5-OCH3 3.99 64.0 C5
6-CH3 2.28 22.4 C5, C6, C7
[a] Data recorded at 400/100 MHz in CD3OD/DCl (pD ~ 0.1); [b] Correlation from H to the
indicated carbons; [c] These signals could not be detected at the level of accumulation
used.
II.1.2 7,4’-dihydroxyflavylium
For the first time, the 7,4’-dihydroxyflavylium was identified in Dracaena cinnabari resins
after isolation by HPLC and characterization by HRMS (m/z 237.07512, [M-H]-; calcd. for
C15H9O3-: 237.07725; M is the quinoid base) and 1H and 13C NMR. The structure
assignment was confirmed with synthesised 7,4’-dihydroxyflavylium chloride [2] whose MS
and NMR data (see figure II.3 and table II.3) were identical to those of the isolated
compound. Also, the isolated compound had the same retention time in HPLC-DAD (18.03
min) and the same λmax = 462 nm of the synthesised flavylium.

105
Figure II.3 - 7,4’-dihydroxyflavylium.
Table II.3 –1H and 13C NMR data for 7,4’-dihydroxyflavylium isolated from a Dracaena
cinnabari commercial resin by HPLC-DAD. [a]
Position 1H δδδδ/ppm (J/Hz) 13C (δδδδ/ppm) HMBC [b]
2 173.7
3 8.24 (d, 8.7) 113.3 C2, C10
4 9.00 (d, 8.7) 154.4 C2, C5, C9
5 8.09 (d, 8.9) 133.9 C4, C7, C9, C10
6 7.36 (dd, 2.0, 8.9) 122.3 C8, C10
7 170.1
8 7.44 (d, 2.0) 103.7 C7, C9, C10
9 160.1
10 119.9
1' 121.2
2',6 8.36 (d, 8.9) 134.0 C2, C4’, (C2’, C6’)
3',5' 7.04 (d, 8.9) 118.6 C1’, C4’, (C3’, C5’)
4' 168.0
[a] Data recorded at 400/100 MHz in CD3OD/DCl (pD ~ 0.1); [b] Correlation from H to the
indicated carbons.
II.2 PCA analysis
The PCA analysis of Daemonorops draco and Daemonorops propinqua samples (figure
II.4) revealed that it is not possible to distinguish between them. These results confirmed
the recent studies of Rustiami [3] and, as a result, the world check list of these plants was
updated [4]. For Dracaena ombet, the situation was different, as a specimen correctly
identified from this species could be distinguished from Dracaena cinnabari species (figure
II.5; for more details see chapter1, section, 3.3).
O
OH
HO
3'
4'
5'
2'
1'
6'
1
2
3
45
6
78
9
10
+

106
-2 -1 0 1
0
1
2
Principal Component#3 (8,7099%)
Principal Component #2 (13,2568%)
Figure II.4 - PCA analysis of samples from EBC, K (open stars) and HPLC library samples
labelled Daemonorops draco (solid stars) and Daemonorops propinqua (triangles). All the
samples fall in the same area and it was not possible to distinguish between the two,
which fits in with the recent assignment of D. propinqua as a synonym of D. draco [3].
-20 -15 -10 -5 0 5 10
-10
-5
0
5
10
Principal Component 4# (8,8%)
Principal Component 2 (18,4%)
Dracaena Ombet - HPE, K
36816 - EBC, K
Figure II.5 - PCA analysis of samples labelled Dracaena cinnabari and Dracaena
schizantha from EBC, K and HPE, K. The sample from the living Dracaena ombet
(synonym D. schizantha) is clearly different from the EBC, K 36816 sample which is
labelled as Dracaena schizantha. The D. schizantha is identical to the other dracaena
cinnabari EBC, K samples.

107
II.3 Network of Chemical reactions
II.3.1 Dracoflavylium
The network of chemical reactions reported for dracoflavylium (fig. 1.14, Chapter 1, p. 13)
can be accounted by the following set of equations:
AH+ + H2O A + H3O
+
Ka1
=[A][H
+]
[AH+]
(1)
AH+ + H2O B + H
+
Kh
=[B][H
+]
[AH+]
(2)
B Cc K
t=
[Cc]
[B]
(3)
Cc Ct K
i=
[Cc]
[Ct]
(4)
A + H2O A- + H3O
+ K
a 2=
[A−][H
+]
[A]
(5)
Ct + H2O Ct- + H3O+
KCt1
=[Ct
−][H
+]
[Ct]
(6)
Ct- + H2O Ct
2- + H3O
+
KCt 2 =
[Ct2−
][H+]
[Ct−]
(7)
Considering that at the equilibrium the concentration of B and Cc is negligible, (as
observed experimentally), Co is the summation of the concentration of all species at the
equilibrium:
C0 = [AH+]+ [A]+ [Ct] + [A
−] + [Ct
−] + [Ct
2−] (8)
It can be easily demonstrated that the mole fraction distribution of each species at the
equilibrium is given by:
[AH+]
C0
=[H
+]
3
D (9)
[A]
C0
=K
a1[H+]
D
2
(10)

108
[Ct]
C0
=K
hK
tK
i[H
+]
2
D (11)
[A−]
C0
=K
a1Ka 2[H+]
D (12)
[Ct−]
C0
=K
Ct1KhK
tK
i)[H
+]
D (13)
[Ct2−
]
C0
=K
hK
tK
iK
Ct1KCt 2
D (14)
D = [H+]
3 + (Ka1 + K
hK
tK
i)[H
+]
2 + (Ka1Ka2 + K
hK
tK
iK
Ct1)[H+] + K
hK
tK
iK
Ct1KCt 2 (15)
The equilibrium constants that have been calculated are the following: K '
a=10
−3.8K
a1 =10−4
Ka 2 =10
−7.5K
Ct1 =10−7.0
KCt 2 =10
−9.9
The ratio Ka1/K’a should give the percentage of the base at the equilibrium 64%. Moreover
the product KhKtKi can be made equal to 5.9x10⁻⁵ (corresponding to 37 % of Ct).
The mole fraction distribution of the several species can now be calculated, and are
represented in Figure 1.20, chapter 1, p.29).
II.3.1.1 Confirmation of the A- amount at the equilibrium
In order to confirm the mole fraction distribution of the ionized base, a pH jump from 1 to
8.8 was carried out, see figure II.6. The calculated percentage of A- at this pH values, 41%
is in agreement with the predicted value.
0
0.1
0.2
0.3
220 300 380 460 540 620 700
A
Wavelength (nm)
6 days at room temperature pH=8.8
41% A-
Figure II.6 - pH jump of the compound 7,4’-dihydroxy-5-methoxyflavylium, from 1 to 8.8 at room temperature.

109
II.3.2 Dracorhodin and 7,4’-dihydroxyflavylium
For dracorhodin the same set of equations accounted for dracoflavylium can be
considered, however the equilibrium constants and mole fraction distribution of the several
species involved in the equilibrium was not calculated as the amount separated by HPLC-
DAD was not enough to repeat for a second time the pH jumps preliminary tests.
Nevertheless it was possible to calculate the percentage of the base at the equilibrium
through the ratio Ka1/K’a (~63%).
For the 7,4’-dihydroxyflavilium the network of chemical reaction and respective equations
is already published in the literature [5].
II.4 References
[1] Costantino, L.; Rastelli, G.; Rossi, M. C.; Albasini, A. Journal Chemical Society, Perkin
Transactions 2 1995, 227.
[2] Pina, F.; Lima, J. C.; Parola, A. J.; Afonso, C. A. M. Angewandte Chemie-International
Edition 2004, 43, 1525.
[3] Rustiami, H.; Setyowati, F. M.; Kartawinata, K. Journal of Tropical Ethnobiology 2004,
1-2, 65.
[4] Govaerts, R.; Dransfield, J. World Checklist of Palms. Royal Botanic Gardens: Kew,
2005.
[5] Pina, F.; Benedito, L.; Melo, M. J.; Parola, A. J.; Lima, J. C.; Maçanita, A. Anales de
Química International Edition 1997, 93, 111.

110
Appendix III – Indigo Data
III.1 I0 and photodegradation quantum yields
The I0 obtained for the 335 nm and 610 nm irradiation with the equation 2 (for more details
see appendix I, section 1.3.2.1) is presented in table III.1
I0=
(2)
Table III.1 – I0 and parameters considered for the 335 nm and 610 nm irradiations.
Actinometry I0 (Einstein/min) m* Vsol (mL) Observations
1.0 x 10⁻⁶ 0.0283
1.1 x 10⁻⁶ 0.0309
1.3 x 10⁻⁶ 0.0349
Cell near to the
monochromator
7.7 x 10⁻⁷ 0.0216
335 nm
7.3 x 10⁻⁷ 0.0203
3
Cell far from the
monochromator
1.7 x 10⁻⁷ 0.0732 610 nm
1.8 x 10⁻⁷ 0.0317 3*(5/2)
Cell near to the
monochromator
*The m is the equation slope of ∆A over the irradiation time period, ∆t, after the correction
of light (when necessary) for the reagent at the irradiation wavelength.
The indigo ΦR obtained for the 335 nm and 610 nm irradiations with the equation 5 (for
more details see appendix I, section 1.3.2.1) are presented in table III.2
ΦR = (5)
Table III.2 – IndigoΦR and parameters considered for the 335 nm and 610 nm irradiation.
λirr (nm) Indigo/DMF I0 (Einstein/min) ΦΦΦΦR M Vsol (mL)
O2 7.3 x 10⁻⁷ 8 x 10⁻³ 0.0417 335
O2 free 7.3 x 10⁻⁷ 3 x 10⁻⁴ 0.0015
O2 1.8 x 10⁻⁷ 2 x 10⁻³ 0.0017 610
O2 free 1.8 x 10⁻⁷ * *
3
∗ΦR not calculated with the available set-up.
Vsol . (∆A/∆ε)
1000.ΦR . ∆t
Vsol . (∆A/∆ε) 1000.Iabs . ∆t

111
The indigo carmine ΦR in liquid and solid media obtained for the 335 nm and 610 nm
irradiations with the equation 5 are presented in table III.3
Table III.3 – Indigo carmine ΦR and parameters considered for the 335 nm and 610 nm
irradiations.
λirr (nm) Indigo Carmine/
Medium I0 (Einstein/min) ΦΦΦΦR m
Vsol
(mL)
H2O 1.1 x 10⁻⁶ 9 x 10⁻⁶ 6.8E-05
DMF 1.1 x 10⁻⁶ 2 x 10⁻³ 0.0140 3
CMC 7.7 x 10⁻⁷ 5 x 10⁻⁴ 0.0053
Vahine gelatine 7.7 x 10⁻⁷ 4 x 10⁻⁴ 0.0040
Jerónimos gelatine 7.7 x 10⁻⁷ 9 x 10⁻⁴ 0.0100
335
Bacteriological
gelatine 7.7 x 10⁻⁷
2 x 10⁻³ 0.0173
1.45
H2O 1.1 x 10⁻⁶ * - 3 CMC 1.7 x 10⁻⁷ 2 x 10⁻⁴ 0.0008
Vahine gelatine 1.7 x 10⁻⁷ 5 x 10⁻⁴ 0.0011
Jerónimos gelatine 1.7 x 10⁻⁷ 4 x 10⁻⁴ 0.0010
610
Bacteriological
gelatine
1.7 x 10⁻⁷ 3 x 10⁻⁴ 0.0007
1.45
* ΦR not calculated with the available set-up.
III.2 Indigo photodegradation HPLC-DAD calibration curves
The expressions obtained with indigo and isatin HPLC-DAD calibration curves, previously
to HPLC-DAD analysis of indigo irradiated at 335 and 610 nm, are presented in table III.4
Table III.4 – HPLC-DAD calibration curves of indigo and isatin
Compound Concentration
range (M) Equation (y=mx+b)
Correlation
coefficient
Indigo 6.1010x + 18908 0.9858
Isatin
1.5 x 10⁻⁴ - 1.5 x
10-5 1.1011x - 185817 0.9931

112
III.3 HPLC-DAD characterization
III.3.1 Indigo dye
The HPLC-DAD chromatograms of indigo dye in homogeneous medium (DMF), irradiated
at 335 nm and acquired at 275 nm are presented in figure III.1. The irradiations at 610 nm
and in heterogeneous media at both wavelengths revealed the same chromatographic
pattern. After the indigo photodegradation isatin (rt=10.5min; λmax=302) and two unknown
compounds were formed (compound 1: rt=6.3min; λmax=311nm; compound 2: rt=8.2min;
λmax=311, 432nm), see figure III.1.
5 10 15 20 25 30
0,0
0,4
Absorbance (A
u)
Retention times (minutes)
5 10 15 20 25 30
0,0
0,1
Absorbance (A
u)
Retention time (minutes)
Figure III.1 – HPLC-DAD chromatogram of indigo dye in DMF at 275 nm. a) Before the
irradiation; tirr=0 min, Indigotin=1x10⁻⁴ M; b) After the irradiation; tirr=120 min,
Indigotin=1x10⁻⁶M.
III.3.2 Indigo carmine
The HPLC-DAD chromatograms of indigo carmine in homogeneous medium (water),
irradiated at 335 nm and acquired at 275 nm are presented in figure III.2. The irradiations
at 610 nm and in heterogeneous media at both wavelengths revealed the same
chromatographic pattern.
a b Indigotin
Indigotin
Isatin
1 2

113
0 5 10 15 20 25 30
0,00
0,28
Absorbance (A
u)
Retention time (minutes)
0 5 10 15 20 25 30
0,00
0,28
Absorbance (au)
Retention time (minutes)
Figure III.2– HPLC-DAD chromatogram of indigo carmine ≈1x10⁻⁵ M at 275 nm. a) Before
the irradiation; tirr=0 min, sulfoindigotin=1x10⁻⁴ M; b) After the irradiation; tirr=9 h,
sulfoindigotin.
III.4 Solar Box exposure
According to Feller [1] the total light annual exposure found in a museum in London is
1.55% of the exterior exposure (900Kwht [2]).
Indigo faded almost with circa of 5950MJ over 2700h of irradiation with a light source
simulating the outdoor exposure (λ>300nm). Therefore it is expected that in a museum
indigo will fade after circa 120 years of exhibition, which correspond to a compound class
A (excellent material for conservation) [1]:
One year of light exposure in London: 900Kwt=3240 MJ.
3240*1.55/100=50.22
5950/50.22=118.48 years in a museum
III.5 Indigo Andean Textiles
The HPLC-DAD chromatogram of an indigo Andean textile sample (Skirt, 21.2581 (200BC
– 200AD) acquired at 275 nm is presented in figure III.3. All the samples analysed
exhibited a similar chromatographic pattern. Previously to HPLC-DAD analysis of Andean
textiles, calibration curves were made with indigo, isatin and indirubin standards dissolved
in DMF for the concentration range expected (from 1x10⁻⁵ M to 1x10⁻⁶ M). Afterwards, the
respective areas of the compounds were calculated at their maximum wavelength with the
chromatographic program Chromquest[3] and represented as a function of the
concentration. The correlation coefficients for all the calibration curves were good, ≥ 0.98
Sulfoindigotin Sulfoindigotin
Isatin sulfonic acid
a b

114
0 5 10 15 20 25 30
0,00
0,05
0,10
0,15
0,20
Absorbance (A
u)
Retention time (min)
Figure III.3 - HPLC-DAD chromatogram of an indigo Andean textile sample Skirt, 21.2581
(200BC – 200AD), acquired at 610 nm.
III.6 References
[1] Feller, R. Accelerated aging – Photochemical and Thermal aspects. The Getty
Conservation Institute: United States of America, 1994.
[2] In http://www.geni.org/globalenergy/library/renewable-energy-
resources/world/europe/solar-europe/solar-united-kingdom.shtml, April 2008.
[3] 4.1 ed., ChromQuest 4.1, Thermo Scientific, 2003.
Indigotin
Indirubin

115
Appendix IV – Mauve dye data
IV.1 Syntheses – Stoichiometries of the mauveine chromophores
IV.1.1 Formation of Mauveine A
For the formation of Mauveine A, 2 equivalents of aniline; 1 of o-toluidine and 1 of p-
toluidine are required (see figure IV.1).
Figure IV.1 – Formation of mauveine A.
The equation of formation of mauveine A can be written as:
2C6H7N + o-C7H9N + p-C7H9N ⇔ C26H23N4+ + 9H+ + 10e- (1)
Considering the equation involving the oxidant, potassium dichromate:
K2Cr2O7 + 6e – + 14H+ ⇔ 2Cr3+ + 7H2O + 2K+
(2)
The global equation of the reaction is:
6C6H7N + 3o-C7H9N + 3p-C7H9N + 5K2Cr2O7 + 30e – + 70H+ ⇔ 3C26H23N4+ + 27H+ + 30e –
+ 10Cr3+ + 35H2O + 10K+ (3)
Replacing H+ by H2SO4:
12C6H7N + 6o-C7H9N + 6p-C7H9N + 10K2Cr2O7 + 43H2SO4 ⇔ 3{(C26H23N4)2(SO4)} +
10Cr2(SO4)3 + 35 H2O + 10K2SO4 (4)
N+
N
NH2 NHH2N
Orto-toluidine
NH2
2x aniline
NH2
Para-toluidine
Mauveine A
X-

116
IV.1.2 Formation of Mauveine B
For the formation of Mauveine B, 1 equivalent of aniline; 2 of o-toluidine and 1 of p-
toluidine are required (see figure IV.2).
Figure IV.2 –Formation of mauveine B.
The equation of formation of mauveine B can be written as:
C6H7N + 2o-C7H9N + p-C7H9N ⇔ C27H24N4+ + 10H+ + 11e- (5)
Considering the equation involving the oxidant, potassium dichromate:
K2Cr2O7 + 6e – + 14H+ ⇔ 2Cr3+ + 7H2O + 2K+ (2)
The global equation of the reaction is:
6C6H7N + 12o-C7H9N + 6p-C7H9N + 11K2Cr2O7 + 66e – + 154H+ ⇔ 6C27H24N4+ + 60H+ +
66e– + 22Cr3+ + 77H2O + 22K+ (6)
Replacing H+ by H2SO4:
6C6H7N + 12o-C7H9N + 6p-C7H9N + 11K2Cr2O7 + 47H2SO4 ⇔ 3{(C27H24N4)2(SO4)3} +
11Cr2(SO4)3 + 77H2O + 11K2SO4 (7)
N+
N
NH2 NH
NH2
H2N
NH2
aniline 2x Orto-toluidine
Para-toluidine
Mauveine B
X-

117
IV.1.3 Formation of Pseudo-mauveine
For the formation of Pseudo-mauveine, 4 equivalents of aniline are required (see figure
IV.3).
Figure IV.3 –Formation of pseudo-mauveine.
The equation of formation of pseudo-mauveine can be written as:
4C6H7N ⇔ C24H20N4+ + 8H+ + 9e- (8)
Considering the equation involving the oxidant, potassium dichromate:
K2Cr2O7 + 6e – + 14H+ ⇔ 2Cr3+ + 7H2O + 2K+ (2)
The global equation of the reaction is:
8C6H7N + 3K2Cr2O7 + 18e – + 42H+ ⇔ 2C24H20N4+ + 16H+ + 18e – + 6Cr3+ + 21H2O + 6K+ (9)
Replacing H+ by H2SO4:
8C6H7N + 3K2Cr2O7 + 13H2SO4 ⇔ (C24H20N4)2(SO4) + 3Cr2(SO4)3 + 21H2O + 3K2SO4 (10)
NH2
4x aniline
N+
N
NH2 NH
Pseudo-mauveine
X-

118
These stoichometry results for mauveine A, B and pseudo-mauveine reveal that the
amount of the reagents for the 4 syntheses performed (table IV.1), specially the amounts
of K2Cr2O7 and H2SO4, were not enough for the complete reactions to occur (see table
IV.2).
Table IV.1 – Concentration of the starting materials used in the 4 mauve dye syntheses.
Starting Material Synthesis
Amount Aniline o-Toluidine p-Toluidine K2Cr2O7 H2SO4
mol 0.056 0.056 0.114 1
JCE 1998 mL/mg 5.2 mL 6 mL 12.2 g
mol 0.056 0.112 0.057 2
Mauveine B mL/mg 5.2 mL 12 mL 6.1 g
mol 0.112 0.056 0.057 3
Mauveine A mL/mg 10.4 mL 6 mL 6.1 g
mol 0.056 0.0056 0.0057 4
Pseudo-
mauveine C24
mL/mg 5.2 mL 0.6 mL 0.61 g
0.010 mol
(3 g)
0.060 mol
(60 mL of
H2SO4 1 M)
Table IV.2 – Concentrations of K2Cr2O7 and H2SO4 necessary for the different mauveines
chromophores formation in syntheses 2, 3 and 4
Synthesis Reagent
2 (B) 3 (A) 4 (C24)
K2Cr2O7 (mol) 0.103 0.093 0.021
H2SO4 (mol) 0.439 0.401 0.091
For the syntheses 2 and 3 almost 10 times more amount H2SO4 were needed. In the
synthesis 2, also 10 times more K2Cr2O7 was necessary to the formation of mauveine B. In
the synthesis 4 the limiting reagent was K2Cr2O7 being necessary almost 2 times more of
this oxidant.

119
IV.2 Mauve summarized characterization
The MS, NMR and HPLC data are summarized in table IV.3; for more details, see next
sections.
Table IV.3 - Structures and summarized spectral dat for mauveine compounds isolated
from different historical samples.
mauveine A mauveine B Mauveine B2 mauveine C
FDMS m/z
HRMS m/z
391.2
391.19172
(calc. for C26H23N4+:
391.19226)
405.3
405.20737
(calc. for C27H25N4+:
405.20791)
405.3
405.20737
(calc. for C27H25N4+:
405.20791)
419.3
419.22302
(calc. for C28H27N4+:
419.22356)
Structure
(1H NMR)
N
N
NHH2N
N
N
NHH2N
N
N
NHH2N
N
N
NHH2N
HPLC-DAD
tr /min
λmáx/nm
16.57
549
21.10
548
16.85
550
22.88
549
pseudo-mauveine mauveine C25a mauveine C25b Mauveine C25c
FDMS m/z
HRMS m/z
364.17
363.16042
(calc. for C24H19N4+:
363.16096)
378.47
377.17607
(calc. for C25H21N4+:
377.17661)
378.47
377.17607
(calc. for C25H21N4+:
377.17661)
378.47
377.17607
(calc. for C25H21N4+:
377.17661)
structure
(1H NMR)
N
N
NHH2N
N
N
NHH2N
N
N
NHH2N
-
HPLC-DAD
tr /min
λmáx/nm
11.83
547
14.12
548
14.12
548
16.08
548
Mauveine B3 Mauveine B4 Mauveine C1 Mauveine D
FDMS m/z
HRMS m/z
405.3
405.20737
(calc. for C27H25N4+:
405.20791)
405.3
405.20737
(calc. for C27H25N4+:
405.20791)
419.3
419.22302
(calc. for C28H27N4+:
419.22356)
433.2
433.23867
(calc. for C29H29N4+:
433.23921)
HPLC-DAD
tr /min
λmáx/nm
17.70
544
18.12
544
22.23
541
23.67
545

120
IV.3 HPLC-DAD/LC-MS characterization of historical samples
IV.3.1 Mauve dyed textile samples
The HPLC-DAD chromatograms of mauve dyed textiles acquired at 550 nm are presented
in figure IV.4. The peak areas of the chromophores were obtained with the
chromatographic software ChromQuest [1]. These areas were then corrected for the
different molar absorptivity of each compound and are shown in chapter 3, section 3.3.
The following molar absorptivities were determined: (ε / M-1 cm-1) mauveine A = 22000;
mauveine B = 29000; mauveine B2 = 33000; mauveine C = 36500, giving rise to the
following correcting factors: mauveine A = 0.6; mauveine B = 0.8; mauveine B2 = 0.9
(value also used for mauveines B3 and B4); mauveine C = 1 (value also used for
mauveine C1).
Figure IV.4 – Mauve dyed textiles HPLC-DAD chromatograms obtained at λ = 551 nm for A:
Science Museum F1; B: Science Museum F2; C: Science Museum F3; D: Science Museum F4, E:
Science Museum F5; F: Perth Museum; G: Science Museum F6. All the samples were extracted
with MeOH + 1 drop of HCl/H2O (pH=2), for more details see extraction methods Appendix I-
Experimental section. The major compounds identified correspond to the numbered peaks: 1-
pseudo-mauveine; 2- mauveines C25a + C25b; 3- mauveine A; 4- mauveines B3 + B4; 5- mauveine
B2; 6- mauveine B; 7- mauveine C1; 8 - Mauveine C.

121
The names for the compounds given in table IV.3 are in accordance with those introduced
by Meth-Cohn and Smith in 1994 [2]. The logic assisting these names is based on the
number of methyl groups around the 7-amino-5-phenyl-3-(phenylamino)phenazin-5-ium
core (pseudo-mauveine) common to all mauveine compounds: two methyl groups -
mauveines A; three methyl groups - mauveines B; four methyl groups - mauveines C.
Peaks 3 and 6 correspond, respectively, to the mauveine A and the mauveine B described
by Meth-Cohn and Smith in 1994 [2]; peaks 5 and 8 correspond, respectively, to
mauveines B2 and C [3]; peak 1 was identified as pseudo-mauveine; the compounds
corresponding to peak 4 were designated as mauveine B3 and mauveine B4 since they
are isomers of mauveine B; the compound corresponding to peak 7 was named mauveine
C1 since it is an isomer of mauveine C; finally, the compounds corresponding to peak 2
are two C25 isomers containing one methyl group each and were designated as mauveine
C25a and mauveine C25b.
The MS determination of some mauveine minor compounds, namely those corresponding
to peaks 4 and 8, was performed by LC-MS for sample Science Museum 1 and for a
mauve-dyed textile sample Science Museum F6 (see figure IV.5 and figure IV.6,
respectively). The Museum SI Manchester 2 sample was also analysed by LC-MS (see
figure IV.7).
Figure IV.5 - HPLC-MS total ion chromatogram (TIC) of A) Science Museum 1 salt sample;
B) 419 m/z compounds; C) 405 m/z compounds; D) 391 m/z compounds, E) 377 m/z
compounds. The compounds identified in TIC correspond to the numbered peaks: 4-
mauveines B3 + B4; 5- mauveine B2; 6- mauveine B, 7- mauveine C1, 8- mauveine C.

122
Figure IV.6 - HPLC-MS total ion chromatogram (TIC) of A) Science Museum F6 mauve
dyed shawl; B) 419 m/z compounds; C) 405 m/z compounds; D) 391 m/z compounds, E)
377 m/z compounds. The compounds identified in TIC correspond to the numbered peaks:
4- mauveines B3 + B4; 5- mauveine B2; 6- mauveine B, 8- mauveine C.

123
Figure IV.7 - HPLC-MS total ion chromatogram (TIC) of A) Museum SI Manchester 2 salt
sample; B) 391 m/z compounds; C) 377 m/z compounds; D) 363 m/z compounds. The
compounds identified in TIC correspond to the numbered peaks: 1- pseudo-mauveine; 2-
mauveines C25a and C25b; 3- mauveine A.

124
IV.3.2 Mauve salt samples
The HPLC-DAD chromatograms for mauve salt samples are shown in Figure IV.8. The
structures are identical to those found in the mauve dyed textiles samples and can be
found in Table IV.3.
Figure IV.8 - Mauve salts HPLC-DAD chromatograms obtained at λ = 551 nm for A: Science
Museum 1; B: Science Museum 2; C: Science Museum 3; D: Science Museum 4, E: Museum SI
Manchester 1; F: Chandler Museum; G: Museum SI Manchester 2 (This sample was analyzed with
the Polaris C18-A column (150mm × 2mm) in order to separate successfully the mauveine C25
isomers). All the samples were dissolved in methanol. The major compounds identified correspond
to the numbered peaks: 1- pseudo-mauveine; 2- two C25 isomers; 3- mauveine A; 4- mauveines B3
+ B4; 5- mauveine B2; 6- mauveine B; 7- mauveine C1; 8 - mauveine C. For more details see
chapter 3 and table IV.1 for structures.

125
IV.3.3 Mauve from other sources
The HPLC-DAD chromatograms acquired at 550 nm are presented in Figure IV.9. In the
DHA 2001 sample, the major compound is Mauve A (38%), whereas in the tissue taken
from JCE 1926 volume the major compounds are mauveine C25a + C25b isomers (80%).
Figure IV.9 - Mauve-dyed textiles HPLC-DAD chromatograms obtained at λ=551 nm for A:
JCE 1926, [4]; B: DHA 2001, [5]. All the samples were extracted with methanol with one
drop of HCl (for more details see appendix I, section I.3.3.3). The major compounds
identified correspond to the numbered peaks: 1- pseudo-mauveine; 2- mauveines C25a +
C25b; 3- mauveine A; 4- mauveines B3 + B4; 5- mauveine B2; 6- mauveine B; 7- mauveine
C1; 8 - mauveine C. For more details see text and table IV.3 for structures.
Together with the mauveine salt from Schunk’s collection, the fibre dyed with mauve from
the 1926 library volume of the Journal of Chemical Education is the only sample where
mauveine C25 compounds are present as major chromophores. The availability of this
volume in numerous libraries makes it a standard for the analysis of mauveine-like
compounds.

126
IV.4 NMR characterization (structure elucidation)
The NMR data (1H and 13C) of the mauveine chromophores isolated by HPLC-DAD is
presented in tables IV.4-IV.8. Spectra were run at 298.0 K, in CD3OD, at 400.13 Hz (1H)
and 100.00 Hz (13C) for pseudo-mauveine and mauveines B2 and C and at 600.13 Hz (1H)
and 150.91 Hz (13C) for isomeric mauveines C25a and C25b. HMBC data refers to
correlations of each hydrogen atom to the indicated carbon atoms.
IV.4.1 Mauveine B2
N+
N
NHH2N
1
2
34
1'
2'
3'4'
6'
5'
8
9
67
1010a
4a5
9a
5a
1''2''
3''4''
6''
5''
Figure IV.10 - Mauveine B2: 7-amino-8-methyl-5-p-tolyl-3-(p-tolylamino)phenazin-5-ium.
Table IV.4 - 1H- and 13C-NMR data for the isolated mauveine B2.
Position 1H δδδδ/ppm (J/Hz) 13C (δδδδ/ppm) HMBC
1 8.01 (d, 9.3) 134.36 3, 4a
2 7.41 (dd, 9.3, 2.2) 121.57
3 153.91
4 6.33 (d, 2.2) 95.12 2, 10a
4a 137.88
5a 137.60
6 6.08 (s) 95.27 8, 9a
7 159.10
8 131.92
9 7.92 (s) 133.68 5a, 7, 8-CH3
9a 139.01
10a 137.70
1’ 137.36
2’,6’ 7.03 (d, 8.4) 123.45 2’,6’, 4’
3’,5’ 7.12 (d, 8.4) 131.05 1’, 3’,5’, 4’-CH3
4’ 136.77
1’’ 135.23
2’’,6’’ 7.36 (d, 8.1) 128.51 2’’,6’’, 4’’
3’’,5’’ 7.61 (d, 8.1) 133.00 1’’, 3’’,5’’, 4’’-CH3
4’’ 142.82
8-CH3 2.37 (s) 20.96 7, 8, 9
4’-CH3 2.30 (s) 17.54 2’, 3’, 4’
4’’-CH3 2.52 (s) 21.31 3’’, 4’’

127
IV.4.2 Mauveine C
N+
N
NHH2N
Figure IV.11 - Mauveine C: 7-amino-1,8-dimethyl-5-p-tolyl-3-(p-tolylamino)phenazin-5-ium
Table IV.5 - 1H- and 13C-NMR data for the isolated mauveine C.
Position 1H δδδδ/ppm (J/Hz) 13C (δδδδ/ppm) HMBC
1 138.99
2 7.25 (br. s) 121.02
3 153.70
4 6.17 (d, 2.0) 93.78 2, 10a
4a 143.83
5a 137.3
6 6.11 (s) 95.09 8, 9a
7 158.67
8 131.17
9 7.89 (s) 133.90 5a, 7, 8-CH3
9a 137.3
10a 137.61
1’ 137.3
2’,6’ 7.01 (d, 8.2) 123.58 2’,6’, 4’
3’,5’ 7.11 (d, 8.2) 131.01 1’, 3’,5’, 4’-CH3
4’ 136.73
1’’ 135.55
2’’,6’’ 7.33 (d, 8.1) 128.52 1’’, 2’’,6’’, 4’’
3’’,5’’ 7.60 (d, 8.1) 132.95 1’’, 3’’,5’’, 4’’-CH3
4’’ 142.70
1-CH3 2.77 (s) 17.88 1, 2, 10a
8-CH3 2.37 (s) 17.53 7, 8, 9
4’-CH3 2.30 (s) 20.95 3’, 4’
4’’-CH3 2.52 (s) 21.30 3’’, 4’’

128
IV.4.3 Pseudo-mauveine
N+
N
NHH2N
Figure IV.12- Pseudo-mauveine: 7-amino-5-phenyl-3-(phenylamino)phenazin-5-ium
Table IV.6 - 1H- and 13C-NMR data for the isolated pseudo-mauveine.
Position 1H δδδδ/ppm (J/Hz) 13C (δδδδ/ppm) HMBC Position
1 7.95 (d, 9.2) 134.75 3, 4a
2 7.43 (m) 121.77 10a
3 154.11
4 6.33 (d, 1.3) 95.45 2, 10a 4 ↔ 2’,6’, 2’’,6’’
4a 138.08
5a 138.89
6 6.02 (d, 1.4) 94.88 8, 9a 6 ↔ 2’’,6’’
7 159.70
8 7.28 (dd, 8.0, 1.3) 123.36 9a
9 8.02 (d, 9.2) 135.43 5a, 7
9a 139.17
10a 137.66
1’ 139.90
2’,6’ 7.14 (m) 123.30 2’,6’, 4’
3’,5’ 7.30 (m) 130.61 1’, 3’,5’
4’ 7.13 (m) 126.72 2’,6’
1’’ 137.74
2’’,6’’ 7.51 (d, 7.4) 128.81 2’’,6’’, 4’’
3’’,5’’ 7.81 (m) 132.63 1’’, 3’’,5’’
4’’ 7.75 (m) 126.72 2’’,6’’

129
IV.4.4 Mauveine C25a
N+
N
NHH2N
Figure IV.13 – Mauveine C25a: 7-amino-8-methyl-5-phenyl-3-(phenylamino)phenazin-5-ium
Table IV.7 - 1H- and 13C-NMR data for the isolated mauveine C25a.
Position 1H δδδδ/ppm (J/Hz) 13C (δδδδ/ppm) HMBC
1 8.04 (d, 9.4) 134.74 3, 4a
2 7.44 (dd, 9.4, 2.0) 121.63 10a
3 153.52
4 6.38 (d, 2.0) 95.38 2, 3, 10a
4a 137.53
5a 137.74
6 6.11 (s) 94.98 5a, 7, 8, 8-CH3, 9a
7 159.36
8 132.24
9 7.87 (d, 1) 133.79 5a, 7, 8-CH3
9a 139.38
10a 137.66
1’ 140.06
2’,6’ 7.14 (m) 123.13 1’, 2’,6’, 3’,5’, 4’
3’,5’ 7.29 (dd, 8, 8) 130.60 1’, 2’,6’, 3’,5’
4’ 7.13 (m) 126.50 2’,6’
1’’ 137.77
2’’,6’’ 7.52 (d, 7) 128.83 1’’, 2’’,6’’, 4’’
3’’,5’’ 7.81 (dd, 8, 8) 132.62 1’’, 2’’,6’’, 4’’
4’’ 7.75 (t, 8) 132.19 1’’, 2’’,6’’, 3’’,5’’
8-CH3 2.38 17.58 7, 8, 9, 9a

130
IV.4.5 Mauveine C25b
N+
N
NHH2N
Figure IV.14 – Mauveine C25b 7-amino-5-phenyl-3-(p-tolylamino)phenazin-5-ium.
Table IV.8 - 1H- and 13C-NMR data for the isolated mauveine C25b.
Position 1H δδδδ/ppm (J/Hz) 13C (δδδδ/ppm) HMBC
1 8.01 (d, 9.2) 134.46 3, 4a
2 7.41 (dd, 9.2, 2.0) 121.83 10a
3 154.32
4 6.29 (d, 2.0) 95.08 2, 3, 10a
4a 138.23
5a 138.86
6 6.01 (d, 2.0) 94.87 7, 8, 9a
7 159.56
8 7.27 (dd, 9.2, 2.0) 123.02 9a
9 7.95 (d, 9.4) 135.37 5a, 7
9a 138.86
10a 137.80
1’ 137.18
2’,6’ 7.02 (d, 8.0) 123.38 2’,6’, 3’,5’, 4’
3’,5’ 7.12 (m) 131.08 1’, 2’,6’, 3’,5’, 4’-
CH3
4’ 136.92
1’’ 137.85
2’’,6’’ 7.51 (d, 7) 129.08 1’’, 2’’,6’’, 4’’
3’’,5’’ 7.81 (dd, 8, 8) 132.65 1’’, 2’’,6’’, 3’’,5’’
4’’ 7.75 (t, 8) 132.19 2’’,6’’, 1’’
4’-CH3 2.29 20.97 2’,6’, 3’,5’, 4’

131
IV.5 ICP-AES characterization of the mordents from mauve dyed textiles
The results obtained with ICP-AES are summarized in table IV.9.
Table IV.9 - Mordant analysis of three mauve-dyed textile samples.
Sample/textile Iron (mg) / textile
(g)
Tin (mg)/ textile
(g)
Aluminium (mg) /
textile (g)
Science Museum F4 /
cotton 1.20 10.06 -
Science Museum F6 /
wool 5.59 - 5.89
Perth Museum / silk 1.06 - -
IV.6 HPLC anion exchange chromatography of counter ions from mauve salts
The HPLC anion exchange chromatograms of counter ions are presented in figure IV.15
and their relative percentage in table IV.10. The mauve salts chromatograms were
compared with ion standards presented in table I.5, appendix I.

132
Figure IV.15 - Mauve salts HPLC-AEC chromatograms obtained for A: Science
Museum 1; B: Science Museum 2; C: Science Museum 3; D: Science Museum 4, E:
Museum SI Manchester 1; F: Chandler Museum; G: Museum SI Manchester 2. All the
mauveine salts were dissolved in water, with exception of Science Museum 2 sample
which did not dissolve in water and thus methanol had to be added*. The major
compounds identified correspond to the signalled peaks: A - acetate; C - chloride; S -
sulphate. For more details see chapter 3, section 3.3 and Table IV.9 with relative areas.
* decreasing order of solubility in water: Science Museum 1, Science Museum 4,
Chandler Museum, Museum SI Manchester 1 >> Museum SI Manchester 2 > Science
Museum 3 >>> Science Museum 2. The sample’s solubility is clearly related to the
increase in the percentage of the sulphate counter-ion.

133
Table IV.10 - Counter-ions of the mauve salt samples.
counter-ions Sample
acetate (%) chloride (%) sulphate (%)
Science Museum 1 97 3 0
Science Museum 2* 2 0 98
Science Museum 3 19 4 67
Science Museum 4 82 6 9
Museum SI Manchester 1 86 7 6
Museum SI Manchester 2 68 13 17
Chandler Museum 2 100 0 0
*For the Science Museum 2 sample which did not dissolve in water, the value for the
acetate percentage in this sample was obtained by comparison with the acetate standard
in methanol.
IV.7 Solar Box exposure
Mauve dye faded almost with circa of 700MJ over 200h of irradiation with a light source
simulating the outdoor exposure (λ>300nm). Therefore it is expected that in a museum
mauve will fade after circa 14 years of exhibition, which correspond to a compound class C
(unstable material) [3]:
One year of light exposure in London: 900Kwt=3240 MJ.
3240*1.55/100=50.22
700/50.22=13.94 years in a museum
IV.8 References
[1] 4.1 ed., ChromQuest 4.1, Thermo Scientific, 2003.
[2] Meth-Cohn, O.; Smith, M. Journal of the Chemical Society-Perkin Transactions 1 1994,
5.
[3] Melo, J. S.; Takato, S.; Sousa, M.; Melo, M. J.; Parola, A. J. Chemical Communications
2007, 2624.
[4] Rose, R. E. Journal of Chemical Education 1926, 8, 973.
[5] Dronsfield, A.; Edmonds, J. Dyes History and Archaeology 2001, 6, 1.
[6] Scaccia, R.; Coughlin, D.; Ball, D. Journal of Chemical Education 1998, 75-6, 769.