Embed Size (px)
Citation preview
Universidade de Lisboa
Faculdade de Ciência
Departamento de Biologia Animal
A study on regeneration:
insights from the zebrafish caudal fin and neural
retina
Jorge Miguel Ramalho Borbinha
Mestrado em Biologia Evolutiva e do Desenvolvimento
Dissertação Orientada por:
Raquel Lourenço
(Centro de Estudos de Doenças Crónicas)
Sólveig Thorsteinsdóttir
(Faculdade de Ciências da Universidade de Lisboa)
2016


I
Acknowledgements
The only part in this work that my supervisors don’t need to correct. Hope I don’t mess this up.
First of all, I would like to thank Dr. António Jacinto for letting me work in his group. It was
truly a wonderful experience and I enjoyed every second of it (except for that small accident in
the lab with the erlenmeyer).
Secondly, to my supervisors, Ana Sofia and Raquel. You two are simply amazing. I know that
I am not the smartest and the most skilful student in the world, and I also know that I did many
mistakes, but never once did you even raised your voice to me. You always treated me with
respect, you always helped me when I needed, and more importantly you had so much patience.
Your guidance not only made me a better scientist, but also a better person, and for that I will
never be able to thank you enough.
To Professor Sólveig, for being my intern supervisor, for helping me during my Master’s
program, and for making me a fan of Developmental Biology.
I would also like to thank the Tissue Morphogenesis and Repair group, the Fish and Histology
facilities, and the Neuronal Growth and Plasticity group, for all the support, good times and,
for some of you, for actually saving me (well, at least my right hand). A special thanks to Ana
Farinho, Diogo Paramos, Lara Carvalho and Susana Ponte, my “back-up” supervisors, as I liked
to call you, for always keeping me motivated, for the great advices and for all the laughs. You
are truly good friends.
Lastly, to my awesome family, for the support and motivation, and for putting up with my
increasingly cranky mood, and of course, to Dalila Silva, you were my “rival”, supporter and
the main reason for me to keep improving. I love you all for this. Thank you.
“So long, and thanks for all the fish”.
Now my dear reader, the acknowledgements are over, so relax, stretch your legs, and prepare
yourself to read a thesis that involved a lot of hard work and (literally) blood. I hope you enjoy
this. Good luck and may the force be with you.

II

III
Resumo
A regeneração é a capacidade que um organismo tem de recuperar totalmente, após uma lesão, a
estrutura e função de um tecido, órgão ou membro danificado. Dado que os humanos não possuem
grande capacidade regenerativa, estudos têm sido feitos no sentido de compreender quais os processos
celulares e moleculares na base deste evento em organismos que possuem, naturalmente, capacidade de
regenerar. Um dos modelos animais mais usados neste contexto é o peixe-zebra, Danio rerio. Este
modelo animal possui a capacidade de regenerar a maioria dos seus órgãos e apêndices, e uma fácil
manipulação genética, que permite criar linhas transgénicas e mutantes.
O peixe-zebra possui uma extraordinária capacidade de regenerar tecidos como a barbatana caudal e a
retina. Após amputação da cauda, inicia-se um processo de cicatrização da ferida, onde esta é coberta
por células da epiderme, seguida pela migração de células para o plano de amputação onde vão formar
uma estrutura designada blastema, composta por células em proliferação que vão regenerar o tecido
perdido. Por fim há uma fase de crescimento que é caracterizada por processos de diferenciação, de
modo a restaurar a estrutura e função originais da cauda. Um dos tecidos mais abundantes na cauda é o
tecido ósseo. O nosso grupo e outros demonstraram que a regeneração do tecido ósseo ocorre através da
desdiferenciação dos osteoblastos maduros, que adquirem capacidade proliferativa e formam osteo-
progenitores, capazes de se rediferenciar e regenerar o novo tecido ósseo. Contudo, um estudo recente
demonstrou que após ablação dos osteoblastos presentes na cauda, a regeneração do osso progride
normalmente, sugerindo a existência de outras fontes celulares capazes de originar novos osteoblastos
nesta situação. Um dos possíveis candidatos são os pericitos, células perivasculares associadas aos vasos
sanguíneos da barbatana caudal. Estas células partilham vários marcadores com células estaminais do
mesênquima humanas e são capazes de originar osteoblastos in vitro. Assim sendo, um dos objetivos
deste trabalho é explorar que tecidos, ou tipos celulares, têm a capacidade de originar osteoblasts in vivo
durante o processo regenerativo, quando a população de osteoblastos residente está comprometida, com
particular enfâse na população de pericitos.
A retina é o tecido do olho responsável por converter a luz em sinais químicos e transportá-los para o
cérebro. Esta é composta por vários tipos celulares, entre eles as células Müller Glia, que após lesão da
retina desdiferenciam, entrando em seguida no ciclo celular. Desta forma, produzem progenitores
neurais que migram para a camada danificada e se diferenciam no tipo celular danificado. Contudo,
como este processo regenerativo progride na ausência das células Müller Glia nunca foi estudado no
peixe-zebra. É igualmente importante descobrir fatores que possam regular as várias etapas da
regeneração da retina. Sabe-se que a via de sinalização Hippo está envolvida na regeneração de vários
órgãos e estruturas. Dados preliminares do nosso grupo indicam também que o efetor desta via, Yap,
está presente nas células Müller Glia durante o desenvolvimento larvar. Deste modo decidimos
averiguar se a via de sinalização Hippo e o seu efetor Yap têm alguma função durante a regeneração da
retina.
Assim, neste trabalho propusemos investigar por um lado como é que os tecidos da barbatana caudal
respondem à ablação dos osteoblastos, e qual o papel dos pericitos e a sua contribuição para a
regeneração desta estrutura; por outro criar uma linha de ablação de células Müller Glia que nos
permitirá investigar como é que a regeneração da retina ocorre na ausência das mesmas; e se o Yap
poderá ter alguma função durante o processo normal de regeneração da retina.
Observámos que, após amputação, em caudas desprovidas de osteoblastos, as regiões da epiderme e o
mesênquima da barbatana caudal adjacentes à matriz óssea, são os primeiros tecidos a responder a este
evento aumentando a proliferação celular e possivelmente originando novos progenitores osteogénicos,
sugerindo o seu potencial como fontes osteogénicas durante a regeneração. Decidimos também

IV
averiguar o papel dos pericitos como uma possível fonte de osteoblastos durante a regeneração. Para
isso, tentámos criar uma linha transgénica que permita a ablação específica desta população e outra linha
para seguir permanentemente a linhagem celular dos pericitos. Para ambas as construções usámos um
promotor específico das células que se pretende analisar, o promotor do gene sdf1α, que foi demonstrado
marcar estas células na barbatana caudal. Para gerar a linha de ablação usámos como base o sistema
NTR/Mtz, construindo um plasmídeo no qual a enzima NTR, que tem capacidade de induzir morte
celular, está sob o controlo do promotor sdf1α. Apesar de duas tentativas diferentes de criar esta linha,
nenhuma delas se verificou viável. De futuro teremos de pensar e adaptar estratégias mais eficientes
para criar esta linha de ablação. Por outro lado, para criar uma linha para seguir a descendência dos
pericitos usámos como base o sistema Cre/Lox. Com esse objetivo, construímos um plasmídeo onde o
promotor do sdf1α controla a expressão da CreERT2 recombinase, induzível por tamoxifeno. Foi possível
criar com êxito uma linha transgénica estável, Tg(sdf1α:CREERT2; Crya:VENUS), que foi cruzada com
a linha Tg(β-actin2:loxP-DsRed-loxP-GFP) que irá permitir a marcação permanente e o seguimento
dos pericitos e da sua descendência. Estas duas linhas servem para avaliar se esta população de células
perivasculares é essencial e se contribui de alguma forma para o processo regenerativo, principalmente
para a formação de novo tecido ósseo.
Relativamente ao estudo da regeneração da retina, decidimos criar uma linha de ablação das células
Müller Glia, usando a mesma estratégia NTR/Mtz. Para tal, usámos o promotor do gene gfap, marcador
de células Müller Glia diferenciadas, e tentámos gerar a linha gfap:GFP-NTR. Estamos atualmente a
aguardar que os peixes cresçam para confirmar se algum poderá ser portador do transgene e deste modo
estabelecer uma linha estável. Com o intuito de termos um ensaio que nos permitisse induzir regeneração
na retina, implementámos no laboratório uma técnica já descrita que permite lesionar especificamente
os fotorreceptores através de exposição à luz UV. Aplicámos esta técnica primeiro em peixes-zebra
selvagem, onde verificámos a resposta regenerativa esperada, e em seguida à linha transgénica DN-yap
na qual, após aplicação de choque térmico, se induz a expressão de uma forma negativa da proteína Yap.
Infelizmente, os pontos temporais escolhidos para a recolha de tecido são ainda insuficientes para se
conseguir observar uma possível perturbação no processo de regeneração dos fotorreceptores. Contudo,
após choque-térmico, pudemos observar redução num marcador específico das células Müller Glia e a
progressão no ciclo celular não parece ser afetada, sugerindo assim que o Yap não é necessário para a
sua desdiferenciação e proliferação. Contudo, não podemos excluir a hipótese deste fator ser apenas
necessário num ponto mais tardio da regeneração, por exemplo, durante a diferenciação dos
fotorreceptores. Para isso teremos de fazer recolhas do tecido em períodos mais tardios durante o
processo regenerativo.
Em conclusão, este trabalho apresenta principalmente resultados preliminares onde nos focámos na
utilização e geração de linhas transgénicas, e no estudo de vias de sinalização, numa tentativa de
identificar novos candidatos que possam auxiliar na regeneração do sistema esquelético e da retina, não
só após lesão, mas também no contexto de patologias associadas a estes órgãos. Em mamíferos, estes
sistemas estão desprovidos de capacidade regenerativa, podendo ser danificados e ficar com a sua função
comprometida. Desta forma, é importante descobrir novos mecanismos celulares e moleculares que
possam contribuir para o estabelecimento de novas terapias capazes de promover e induzir a capacidade
regenerativa destas estruturas em mamíferos.
Palavras-chave: Regeneração; Osteoblastos; Pericitos; Células Müller Glia; Yap

V
Abstract
Regeneration is the capacity to fully restore the structure and function of an organ or limb, upon damage
or injury. One of the most popular animal models used to study the mechanisms underlying tissue
regeneration is the zebrafish, Danio rerio. Two tissues that hold an outstanding regenerative capacity
are the caudal fin and the retina.
Caudal fin skeletal tissue regeneration occurs via dedifferentiation of mature osteoblasts. However, upon
osteoblast ablation, the regenerative process is not impaired, suggesting the existence of other cell
sources capable of producing new osteoblasts. Possible candidates are the pericytes, shown to be capable
of differentiating into osteoblasts in vitro. Upon injury in the neural retina, Müller Glia cells
dedifferentiate and produce neuronal progenitors that allow damaged tissue recovery. However, how
regeneration progresses in the absence of these cells has never been addressed, and the pathways that
can modulate the process of retina regeneration are not fully understood. The Hippo pathway is a
possible candidate to mediate retina regeneration, since it has an important role during the regeneration
of several organs and recent data indicates that the Hippo pathway effector Yap is localized in the Müller
Glia.
Our results indicate that during fin regeneration, upon mature osteoblast ablation, the epidermis and the
mesenchyme surrounding the bone matrix respond by increasing cell proliferating and by producing
osteo-progenitors, suggesting that they could act as potential sources for de novo osteoblasts formation.
In addition, to address if pericytes are a possible source of new osteoblasts, we tried to generate a
pericyte ablation line, and succeeded in generating a pericyte-lineage tracing line. Regarding retina
regeneration, in order to explore the role of Müller Glia during this process, we generated a Müller Glia
cell ablation transgenic line, soon to be validated. To assess the contribution of Yap also in the context
of retina regeneration, we induced photoreceptor damage in a Dominant Negative Yap transgenic
zebrafish and observed no impairment until 6 days post injury, suggesting that Yap does not contribute
towards dedifferentiation or proliferation of Müller Glia cells
In this work, we focused on establishing transgenic lines and in assessing new pathways that could assist
us in better understanding the regeneration of the skeletal tissue and neural retina. When these are
damaged in mammals, in the context of osteo-degenerative disorders and retinopathies, both systems
fail to regenerate properly, leading to severe impairment of normal tissue functions. It is therefore of
major importance to unravel the cellular and molecular mechanism underlying tissue regeneration to
promote more efficient therapeutic strategies to improve the regenerative capacity of these tissues in
mammalian systems.
Key-words: Regeneration; Osteoblasts; Pericytes; Müller Glia Cells; Yap
VI
Abbreviations
AMD – Age-related macular degeneration
BEL – Basal epidermal layer
BF – Bright field
Bp – Base pairs
CA – Constitutively Active
CFP – Cyan fluorescent protein
CMZ – Ciliary marginal zone
CNS – Central nervous system
crya-α – Crystalline-α a
DAPI – 4’,6 – diamidino-2-phenylindole
DN – Dominant Negative
Dpa – Days post-amputation
Dpf – Days post-fertilization
DpUV – Days post-UV treatment
EdU – 5-ethynyl-2´-deoxyuridin
FP – Fluorescent protein
GCL – Ganglion cell layer
GFP – Green Fluorescent Protein
GFAP – Glial fibrillary acidic protein
GS – Glutamine synthetase
H – Hours
hMSC – Human mesenchymal stem cells
Hpa – Hours post-amputation
INL – Inner nuclear layerins – Insulin
IP – Intraperitoneal injection
MGs – Müller Glia cells
Min – Minutes
MSC – Mesenchymal stem cells
Mtz – Metronidazole
NTR – Nitroreductase
ON – Overnight
ONL – Outer nuclear layer
osc – osteocalcin
osx – osterix
PBS – Phosphate Buffered Saline
pdgfrβ – platelet-derived growth factor receptor β
PVC – Perivascular cells
RE – Restriction enzymes
RFP – Red Fluorescent Protein
RP – Retinitis pigmentosa
RPE – Retinal pigmented epithelium
RT – Room Temperature
Runx2 – Runt-related transcription factor 2
SD – Standard deviation
sdf1α – stromal cell-derived factor 1α
TAD – Transcriptional activation domain
WT – Wild type
Yap – Yes-associated protein

VII
Index
Acknowledgements ................................................................................................................................. I
Resumo ................................................................................................................................................. III
Abstract .................................................................................................................................................. V
Abbreviations ........................................................................................................................................ VI
Chapter 1 – Introduction ...................................................................................................................... 1 1.1 – Tissue regenerative capacity and mechanisms in animals .............................................................. 1 1.1.1 – Diversity of regenerative abilities among animals ...................................................................... 1 1.1.2 – Cellular mechanisms of regeneration .......................................................................................... 1 1.2 – Zebrafish as a model system to study tissue regeneration .............................................................. 1 1.2.1 – Caudal fin regeneration ............................................................................................................... 2 1.2.2 – Neural retina regeneration ........................................................................................................... 4 1.3 – Tools to study regeneration ............................................................................................................ 6 1.3.1 – NTR/Mtz system for specific cell ablation .................................................................................. 6 1.3.2 – Cre-LoxP system for lineage-tracing analysis ............................................................................. 6 1.4 – Objectives ....................................................................................................................................... 7
Chapter 2 – Experimental procedures ................................................................................................ 8 2.1 – Zebrafish lines and maintenance .................................................................................................... 8 2.2 – Generation of transgenic lines ........................................................................................................ 8 2.2.1 – Pericytes ablation constructs ....................................................................................................... 8 2.2.2 – Müller Glia ablation constructs ................................................................................................... 9 2.2.3 – Pericyte lineage-tracing construct ............................................................................................... 9 2.2.4 – Embryo injection and transgenesis .............................................................................................. 9 2.2.5 – Embryo screening ...................................................................................................................... 10 2.3 – Injury assays ................................................................................................................................. 10 2.3.1 – Caudal fin amputation ............................................................................................................... 10 2.3.2 – Retinal light lesions ................................................................................................................... 10 2.4 – Osteoblast Ablation procedure ..................................................................................................... 11 2.5 – EdU intraperitoneal injection ....................................................................................................... 11 2.6 – Heatshock treatment ..................................................................................................................... 11 2.7 – Tissue preparation and Cryosections ............................................................................................ 11 2.8 – Immunofluorescence assays ......................................................................................................... 11 2.9 – Image acquisition ......................................................................................................................... 12 2.10 – Image analysis ............................................................................................................................ 12 2.11 – Statistical analysis ...................................................................................................................... 12
Chapter 3 – Results ............................................................................................................................. 13 3.1 – Unravelling the osteogenic sources during caudal fin regeneration ............................................. 13 3.1.1 – Ablation of mature osteoblasts .................................................................................................. 13 3.1.2 – Proliferation analysis during caudal fin regeneration after osteoblast ablation ......................... 13 3.1.3 – Assessing osteo-progenitor formation during regeneration in osteoblast depleted fins ............ 16 3.1.4 – Pericytes in vivo dynamics during caudal fin regeneration ....................................................... 17 3.1.5 – Generation of pericytes lineage-tracing and ablation lines ....................................................... 19 3.2 – Exploring the process of retina regeneration ................................................................................ 21 3.2.1 – Generation of a Müller Glia ablation line .................................................................................. 21

VIII
3.2.2 – Exploring a possible role of Yap during photoreceptors regeneration in adult zebrafish ......... 21
Chapter 4 – Discussion ........................................................................................................................ 26 4.1 – New osteogenic sources in osteoblast-depleted fins .................................................................... 26 4.1.1 – Epidermis and mesenchyme as potential sources for de novo osteoblast formation ................. 26 4.1.2 – Pericytes as potential candidates for new osteo-progenitor formation ...................................... 27 4.2 – Exploring the process of retina regeneration ................................................................................ 28 4.2.1 – Development of a transgenic line to specifically ablate Müller Glia ........................................ 28 4.2.2 – Exploring a possible role of the Hippo/Yap signalling pathway during photoreceptors
regeneration ....................................................................................................................................... 29 4.3 – Concluding Remarks .................................................................................................................... 31
Chapter 5 – Bibliography ................................................................................................................... 32
Attachments ........................................................................................................................................ 36
- 1 -
Chapter 1 - Introduction
1.1 – Tissue regenerative capacity and mechanisms in animals
Throughout evolution, animals have developed mechanisms of repair in order to restore lost or damaged
body parts after injury. The perfect repair mechanism should fully restore, both in terms of shape and
function, the damaged region. This process is designated regeneration [1].
1.1.1 – Diversity of regenerative abilities among animals
The capacity to regrow missing body parts is widely observed across the animal kingdom. Over the
course of evolution there is a striking hierarchy of regenerative capacity among organisms.
Invertebrates, like Hydra and planarians, are able to regenerate entire animals from small fragments.
Vertebrates, such as Axolotl, Xenopus or teleost fish, do not have such an extended regenerative capacity
but are able to fully regenerate their limbs or appendages, and several organs [2-4]. In contrast, mammals
have a very limited capacity to regenerate lost tissues. They are capable of performing homeostatic
regeneration, meaning that they can replace cells that are lost during daily activities, like epithelial or
blood cells [3]. They can also regenerate the liver, up to some extent, however they cannot efficiently
regenerate other organs, large sections of their body or limbs [5]. Instead, after damage or injury, these
structures tend to deposit large amounts of extracellular matrix, culminating in the formation of a scar
tissue and leading to an impairment of normal tissue or organ function [6].
1.1.2 – Cellular mechanisms of regeneration
Despite the regenerative differences between organisms, the most fundamental hallmarks of the
regenerative process are very similar. For instance, cell death resulting from the wounding helps in
activating a wound healing process to close the wound site, thus preventing further infections.
Innervation of the uninjured structure is extremely important, being responsible for inducing cell
proliferation and differentiation, which are required to obtain a complete and fully functional tissue [4].
The regenerative capacity differs not only between organs and organisms but also in terms of strategies
used to promote efficient replacing of the missing tissue [1]. It has been shown that the cells that will
compose the regenerated tissue can arise by different cellular mechanisms: (i) from an already existent
pool of tissue resident stem cells, which are capable of self-renewing and produce one or more
differentiated cell types (e.g. in planarian, regeneration is exclusively dependent on a population of
pluripotent stem cells, called neoblasts, which are spread across their body and are capable of giving
rise to essentially every cell type, including themselves); (ii) from dedifferentiation of fully
differentiated cells, which involves the loss of the differentiated character and acquisition of a
proliferative progenitor-like state (e.g. process characteristic of limb regeneration in urodele amphibians
where the skeletal muscle cells adjacent to the wound dedifferentiate to form a pool of less differentiated
cells capable of proliferation); (iii) or it can result from a transdifferentiation process, consisting on the
conversion of an existing differentiated cell into another cell type (e.g. newt’s lens regeneration in which
pigmented epithelial cells can transdifferentiate into the lost cell types to repair the damages lens) [7-8].
1.2 – Zebrafish as a model system to study tissue regeneration
Throughout the years, several animal models have shed light into the cellular and molecular mechanism
that control regeneration. In the last few years, the zebrafish (Danio rerio) became one of the most
powerful models to study the mechanism underlying tissue regeneration [9]. The zebrafish started being
used in the 1970s to study vertebrate development due to its practical advantages such as easy
reproduction, transparent embryos with external development, short generation time, large progenies

- 2 -
proper for large scale screens, and even observation of cell behaviours in vivo through high resolution
live imaging [10-12]. Another important feature is its amenability to genetic manipulation, allowing the
generation of transgenic and mutant lines. Importantly, zebrafish also has an outstanding regenerative
capacity, being a suitable candidate to study the mechanisms underlying tissue regeneration. It can fully
regrow several organs, such as the heart, retina, brain and spinal cord and large sections of the body,
like the fins [10].
1.2.1 – Caudal fin regeneration
The zebrafish caudal fin is one of the best models to study tissue regeneration, being easily accessible
to surgery and its amputation does not compromise animal survival. After amputation, caudal fin
regeneration occurs over the course of 1-2 weeks and has an almost unlimited capacity to regenerate as
it restores normal size, tissue architecture and function, even when cut multiple times [13]. It is a
relatively simple structure composed of several tissues and cell types such as pigmented cells,
osteoblasts, fibroblasts, artery and vein endothelium, nerves, skin and resident blood cells [14]. One of
the main components of the fin is the skeletal tissue, which is composed of several segmented bony rays,
produced by a monolayer of bone secreting cells, osteoblasts. Each bony ray is covered by a multilayer
epidermis and defines an inner mesenchymal compartment containing the blood vessels, nerves,
pigment cells and fibroblasts (Figure 1) [15].
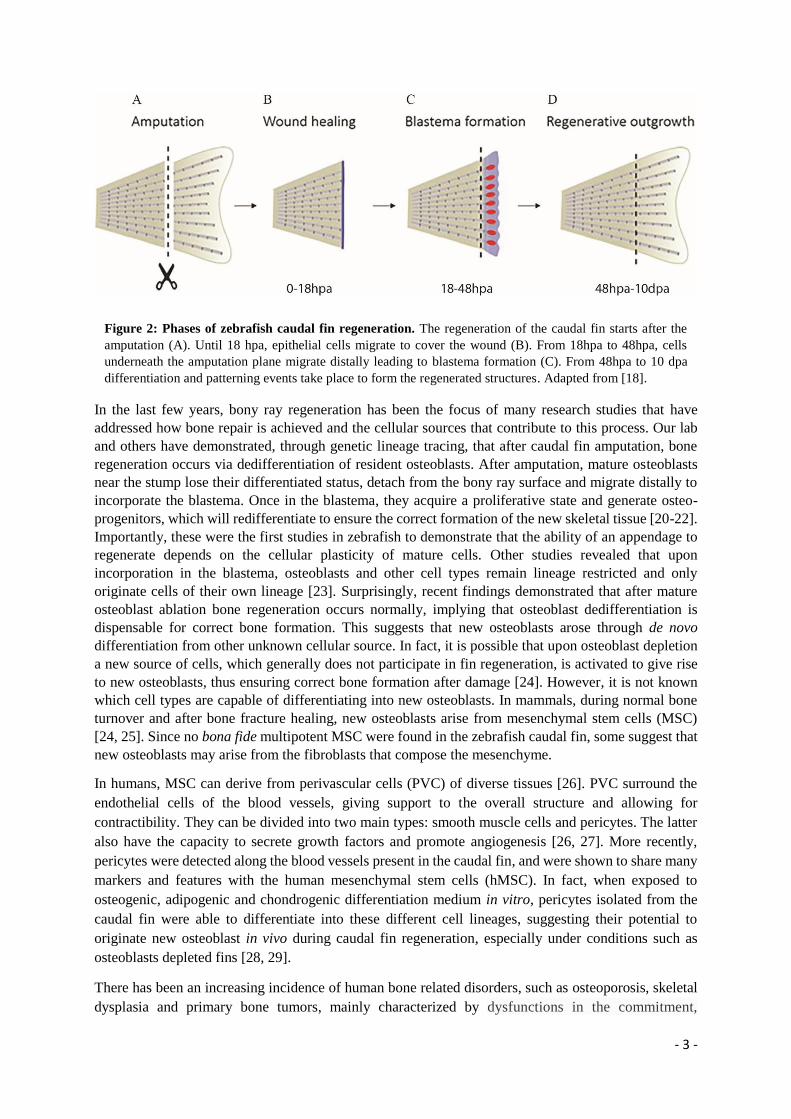
Morgan was the first to study caudal fin regeneration in 1901 and classified it as an epimorphic process,
since it depends on the formation of a specialized structure called blastema [16]. After amputation a
regenerative program with three main phases is activated. The process is initiated with wound healing
(0-18 hours post-amputation (hpa)), where epithelial cells migrate to cover the wound, forming the
wound epidermis, which is also responsible for secreting factors that induce the next steps of the
regeneration process [17]. The wounding repair phase is followed by the formation of the blastema (18-
48 hpa), a structure composed of a mass of proliferative and less differentiated cells, that provide the
adequate final number of cells to restore the lost tissue. Finally, the regenerative outgrowth phase takes
place (48 hpa-10 days post-amputation (dpa)), which involves patterning and differentiation events to
restore original tissue architecture and function (Figure 2) [18]. One of the most debated topics regarding
caudal fin regeneration has been the origin of the cells that compose the blastema. The most accepted
hypothesis nowadays suggests that cells derive through dedifferentiation of the mature cells below the
amputation plane. Nevertheless, even though many factors that control the blastema formation and
proliferation are known, the cell lineages that contribute to its formation have not yet been fully
characterized [19].
Figure 1: Schematic view of the Zebrafish caudal fin bony-ray structure. The caudal fin (A) is composed
by several segmented bony-rays (B). (C) Illustrative image of a longitudinal section of a bony-ray. Bone is
covered by a monolayer of osteoblasts and encloses a mesenchymal compartment, composed of fibroblast-like
cells. This structure is covered by a multilayered epidermis. Adapted from [22, 23].
- 3 -
In the last few years, bony ray regeneration has been the focus of many research studies that have
addressed how bone repair is achieved and the cellular sources that contribute to this process. Our lab
and others have demonstrated, through genetic lineage tracing, that after caudal fin amputation, bone
regeneration occurs via dedifferentiation of resident osteoblasts. After amputation, mature osteoblasts
near the stump lose their differentiated status, detach from the bony ray surface and migrate distally to
incorporate the blastema. Once in the blastema, they acquire a proliferative state and generate osteo-
progenitors, which will redifferentiate to ensure the correct formation of the new skeletal tissue [20-22].
Importantly, these were the first studies in zebrafish to demonstrate that the ability of an appendage to
regenerate depends on the cellular plasticity of mature cells. Other studies revealed that upon
incorporation in the blastema, osteoblasts and other cell types remain lineage restricted and only
originate cells of their own lineage [23]. Surprisingly, recent findings demonstrated that after mature
osteoblast ablation bone regeneration occurs normally, implying that osteoblast dedifferentiation is
dispensable for correct bone formation. This suggests that new osteoblasts arose through de novo
differentiation from other unknown cellular source. In fact, it is possible that upon osteoblast depletion
a new source of cells, which generally does not participate in fin regeneration, is activated to give rise
to new osteoblasts, thus ensuring correct bone formation after damage [24]. However, it is not known
which cell types are capable of differentiating into new osteoblasts. In mammals, during normal bone
turnover and after bone fracture healing, new osteoblasts arise from mesenchymal stem cells (MSC)
[24, 25]. Since no bona fide multipotent MSC were found in the zebrafish caudal fin, some suggest that
new osteoblasts may arise from the fibroblasts that compose the mesenchyme.
In humans, MSC can derive from perivascular cells (PVC) of diverse tissues [26]. PVC surround the
endothelial cells of the blood vessels, giving support to the overall structure and allowing for
contractibility. They can be divided into two main types: smooth muscle cells and pericytes. The latter
also have the capacity to secrete growth factors and promote angiogenesis [26, 27]. More recently,
pericytes were detected along the blood vessels present in the caudal fin, and were shown to share many
markers and features with the human mesenchymal stem cells (hMSC). In fact, when exposed to
osteogenic, adipogenic and chondrogenic differentiation medium in vitro, pericytes isolated from the
caudal fin were able to differentiate into these different cell lineages, suggesting their potential to
originate new osteoblast in vivo during caudal fin regeneration, especially under conditions such as
osteoblasts depleted fins [28, 29].
There has been an increasing incidence of human bone related disorders, such as osteoporosis, skeletal
dysplasia and primary bone tumors, mainly characterized by dysfunctions in the commitment,
Figure 2: Phases of zebrafish caudal fin regeneration. The regeneration of the caudal fin starts after the
amputation (A). Until 18 hpa, epithelial cells migrate to cover the wound (B). From 18hpa to 48hpa, cells
underneath the amputation plane migrate distally leading to blastema formation (C). From 48hpa to 10 dpa
differentiation and patterning events take place to form the regenerated structures. Adapted from [18].
- 4 -
differentiation, survival and function of osteoblast. Thus, it is of major importance to decipher not only
how osteoblasts are able to promote bone regeneration, but also which cell types have the ability to
originate new osteoblasts, when this population is compromised. This would help to promote more
efficient therapeutic strategies in regenerative medicine, not only in global tissue replacement, but
particularly for new bone formation during fracture healing or massive bone loss in humans.
1.2.2 – Neural retina regeneration
Injuries in the mammalian central nervous system (CNS) tend to lead to irreparable damage due to its
lack of ability to regenerate, being extremely important to find strategies to induce its repair. One simple
and accessible structure of the zebrafish CNS, capable of regeneration, is the neural retina. Even though
its structure and function are conserved among vertebrates, the lack of regenerative capacity in mammals
leads to ocular disorders upon cell degeneration. Loss of photoreceptors can be found in retinal
dystrophies (such as age-related macular degeneration (AMD) or Retinitis Pigmentosa (RP)) and death
of retinal ganglion cells contribute to vision loss in glaucoma. Since these visual impairments are a
major health problem, the zebrafish neural retina became a good system to highlight the mechanisms
underlying its regenerative capacity [30, 31].
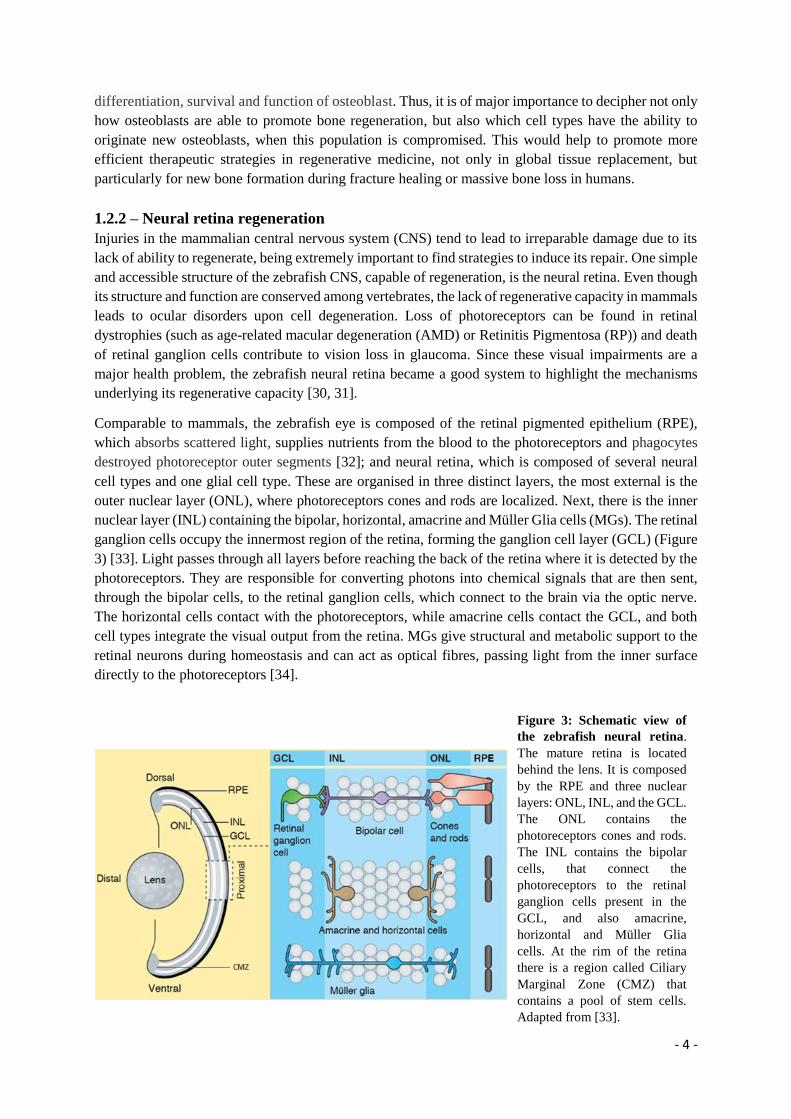
Comparable to mammals, the zebrafish eye is composed of the retinal pigmented epithelium (RPE),
which absorbs scattered light, supplies nutrients from the blood to the photoreceptors and phagocytes
destroyed photoreceptor outer segments [32]; and neural retina, which is composed of several neural
cell types and one glial cell type. These are organised in three distinct layers, the most external is the
outer nuclear layer (ONL), where photoreceptors cones and rods are localized. Next, there is the inner
nuclear layer (INL) containing the bipolar, horizontal, amacrine and Müller Glia cells (MGs). The retinal
ganglion cells occupy the innermost region of the retina, forming the ganglion cell layer (GCL) (Figure
3) [33]. Light passes through all layers before reaching the back of the retina where it is detected by the
photoreceptors. They are responsible for converting photons into chemical signals that are then sent,
through the bipolar cells, to the retinal ganglion cells, which connect to the brain via the optic nerve.
The horizontal cells contact with the photoreceptors, while amacrine cells contact the GCL, and both
cell types integrate the visual output from the retina. MGs give structural and metabolic support to the
retinal neurons during homeostasis and can act as optical fibres, passing light from the inner surface
directly to the photoreceptors [34].
Figure 3: Schematic view of
the zebrafish neural retina.
The mature retina is located
behind the lens. It is composed
by the RPE and three nuclear
layers: ONL, INL, and the GCL.
The ONL contains the
photoreceptors cones and rods.
The INL contains the bipolar
cells, that connect the
photoreceptors to the retinal
ganglion cells present in the
GCL, and also amacrine,
horizontal and Müller Glia
cells. At the rim of the retina
there is a region called Ciliary
Marginal Zone (CMZ) that
contains a pool of stem cells.
Adapted from [33].

- 5 -
While the mammalian retina has no intrinsic repair
processes to replace lost cells, the zebrafish has an
extraordinary ability to, throughout life,
continuously add new cells to the retina, due to the
presence of a pool of stem cells. This pool of cells is
localized at the periphery of the retina, in a region
known as the ciliary marginal zone (CMZ) (Figure
3) [33]. In addition, under homeostatic conditions,
there are also clusters of proliferating retinal
progenitors around some MGs that are restricted to
the rod photoreceptor lineage [35, 36]. In a context
of retinal injury, MGs have been demonstrated to
regenerate all retinal neuron types [37]. They are
stimulated to dedifferentiate, losing the expression
of specific markers, such as glial fibrillary acidic
protein (GFAP) and glutamine synthetase (GS),
reentry cell cycle, and produce neuronal progenitors
that will migrate to the injured layer and
differentiate into the lost cells (Figure 4) [38-40]. In
mammals these cells are required to keep normal
retinal structure, since their ablation leads to
photoreceptor death and disorganization of retinal
neurons [41]. However, although they cannot
regenerate lost neurons, they appear to have a
dormant neurogenic potential [42]. It is thus
extremely important to study these cells in the
context of zebrafish retina regeneration, being good
targets for regenerative therapies.
Few signalling pathways are known to contribute
to MGs regenerative program. Following retinal
injury, dying cells produce pro-inflammatory cytokines (TNFα) which trigger the activation of cytokines
growth factors and Wnt pathway in MGs, leading to their reprogramming and proliferation [31].
However, it is still important to discover new factors that might contribute to these events. The Hippo
signalling pathway, which restricts tissue growth and promotes cell death, has recently emerged has
being required for organ regeneration [43, 44]. In vertebrates, Hippo’s homologue, Mst 1/2, leads to the
phosphorylation of Yes-associated Protein (Yap) and Transcriptional co-activator PDZ-binding motif
(Taz), thus inhibiting tissue growth. When the pathway is inactive, Yap is able to enter the nucleus and
activate its target genes mainly related to cell proliferation [45]. Our group recently showed that Yap
influences cell proliferation and is indispensable for blastema formation during caudal fin regeneration
[46]. In addition, recent reports indicate that Yap is required to promote entry of non-dividing cells into
the cell cycle, during heart and liver regeneration [43, 44]. Preliminary results from our group also
indicate that in zebrafish Yap is localized in MGs, thus making the Hippo signalling pathway an
interesting candidate to explore as a possible new pathway to be involved in neural retina regeneration.
For these reasons, it is extremely important to further assess the role of MGs during retina regeneration
and, at the same time, to explore a possible role of Yap in stimulating Müller Glia cell-derived progenitor
proliferation in the context of retina lesions.
Figure 4: Generation of multipotent Müller glial
cell-derived progenitors for retinal repair. After
injury in the retina (A), Müller glia cells (MGs)
undergo a reprogramming event (B) leading to
asymmetrical nuclear divisions (C). These generate
multipotent progenitors that migrate to the damaged
layers (D) regenerating the lost cell types (E).
Adapted from [38].

- 6 -
1.3 – Tools to study regeneration
In the past few years several techniques have been developed and improved in zebrafish to allow to
tackle important questions regarding tissue regeneration. These techniques include targeted and specific
cell ablation and assessment of specific cell lineages.
1.3.1 – NTR/MTZ system for specific cell ablation
In the context of development and regeneration studies, targeted cell ablation methods have been
developed to assess cell lineage relationships or to evaluate specific cell roles. The search for an effective
targeted conditional ablation technique in zebrafish led to the development of the Escherichia coli
Nitroreductase (NTR)/Metronidazole (Mtz) system. Importantly, this method became one of the most
widely used in the zebrafish community to address novel cellular mechanisms underlying the
regeneration process. This system is based on the ability of the NTR enzyme to convert a non-toxic
prodrug, Mtz, into a cytotoxic agent that causes the death of the NTR-expressing cells without affecting
the neighbouring cells. In this system, NTR is usually under the control of a tissue-specific promoter
(expressed in the cell population of interest), making it spatially specific. It is generally fused with a
fluorescent protein (FP) allowing for cell tracking and providing an easy and accessible way to confirm
the success of the ablation (Figure 5). Since the ablation is only triggered upon adding Mtz in the water,
it is also temporally specific. This technique is also reversible, since tissue recovery could be observed
after the ablation process [47-49]. Importantly, the analysis of how organisms and tissues can recover
from an ablation event could aid to uncover the roles of specific tissues and their contribution to the
regenerative process. It may also reveal novel cellular and molecular mechanisms underlying tissue
regeneration, bringing new insights to the field of regenerative medicine.
1.3.2 – Cre-loxP system for lineage-tracing analysis
One of the most classical questions in the regeneration field is the origin of the cells that compose the
regenerated tissue. The identification of a single cell progeny is possible through a process called lineage
tracing. This is achieved by permanently labeling a specific cell or tissue so that its descendants are
easily traceable, thus providing information about the number of progeny of a single cell, their location
and their differentiated status.
One of the most used systems to track cells is the site-specific recombination system Cre-loxP, which
has been adapted to zebrafish. In this system, a zebrafish line has a tamoxifen inducible Cre
recombinase, fused with tamoxifen receptor ERT2, expressed under the control of a tissue specific
promotor, so that it is produced in the cells/tissue of interest. That line is crossed with a second line in
which, for instance, a ubiquitous promoter drives the expression of a fluorescent reporter that is flanked
by a loxP-STOP-loxP sequence, downstream of which there is a second different reporter. In these
double transgenic animals, all cells will express the first fluorescent reporter, however upon tamoxifen
A B
Figure 5 – Experimental design for Mtz/NTR tissue-specific ablation. A tissue-specific promoter (tsp) is
driving the expression of NTR coupled with a fluorescent protein (FP) (A). After adding Mtz, FP-NTR
expressing cells (blue) undergo apoptosis and die (brown), while leaving the remaining cells unarmed (B).
Adapted from [48].
- 7 -
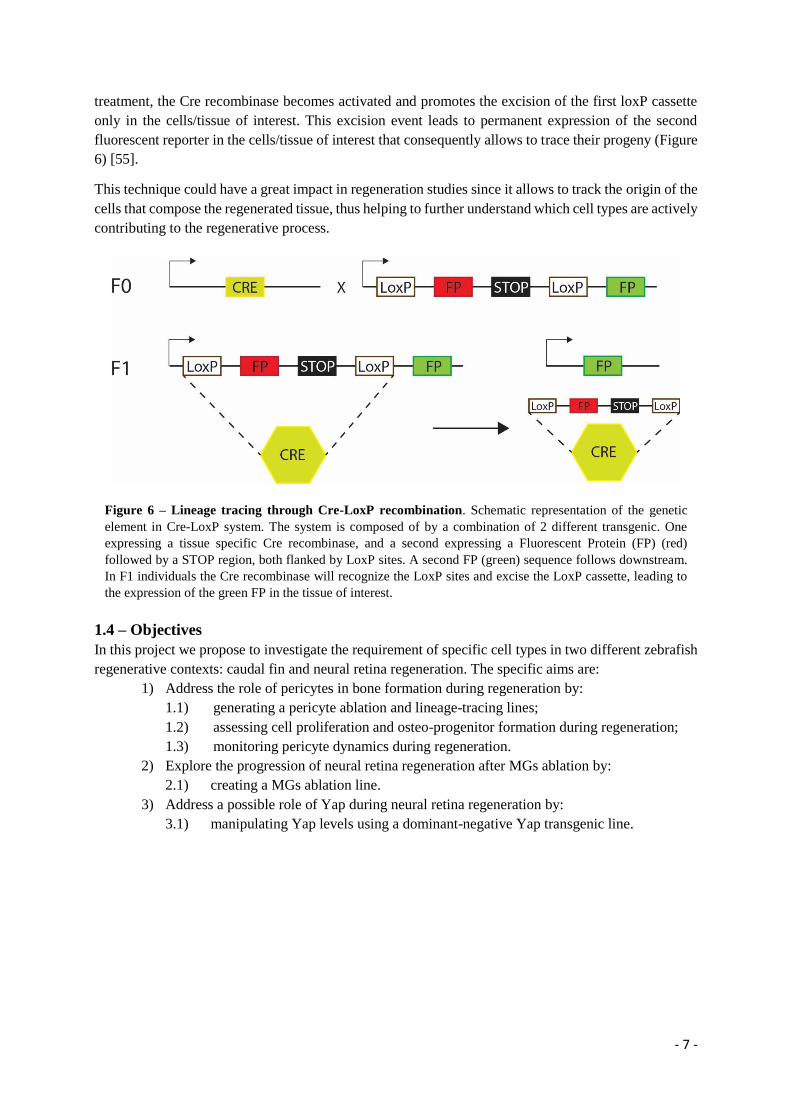
treatment, the Cre recombinase becomes activated and promotes the excision of the first loxP cassette
only in the cells/tissue of interest. This excision event leads to permanent expression of the second
fluorescent reporter in the cells/tissue of interest that consequently allows to trace their progeny (Figure
6) [55].
This technique could have a great impact in regeneration studies since it allows to track the origin of the
cells that compose the regenerated tissue, thus helping to further understand which cell types are actively
contributing to the regenerative process.
1.4 – Objectives
In this project we propose to investigate the requirement of specific cell types in two different zebrafish
regenerative contexts: caudal fin and neural retina regeneration. The specific aims are:
1) Address the role of pericytes in bone formation during regeneration by:
1.1) generating a pericyte ablation and lineage-tracing lines;
1.2) assessing cell proliferation and osteo-progenitor formation during regeneration;
1.3) monitoring pericyte dynamics during regeneration.
2) Explore the progression of neural retina regeneration after MGs ablation by:
2.1) creating a MGs ablation line.
3) Address a possible role of Yap during neural retina regeneration by:
3.1) manipulating Yap levels using a dominant-negative Yap transgenic line.
Figure 6 – Lineage tracing through Cre-LoxP recombination. Schematic representation of the genetic
element in Cre-LoxP system. The system is composed of by a combination of 2 different transgenic. One
expressing a tissue specific Cre recombinase, and a second expressing a Fluorescent Protein (FP) (red)
followed by a STOP region, both flanked by LoxP sites. A second FP (green) sequence follows downstream.
In F1 individuals the Cre recombinase will recognize the LoxP sites and excise the LoxP cassette, leading to
the expression of the green FP in the tissue of interest.
- 8 -
Chapter 2 - Experimental procedures
2.1 – Zebrafish lines and maintenance
All wild type (WT) and transgenic lines used in this project (for detailed information see supplementary
Table1) were maintained in a re-circulating system with a 14 hour/day and 10 hour/night cycle at 28°C.
Embryos were kept at 28ºC in Embryo Medium [51] until they reached 6 days post-fertilization (dpf),
time at which they were transferred to the circulating system to grow. All experiments were performed
in 4-12 months old adults.
2.2 – Generation of transgenic lines
2.2.1 – Pericyte ablation constructs:
In order to create a pericyte ablation line using the NTR/Mtz system two constructs were generated:
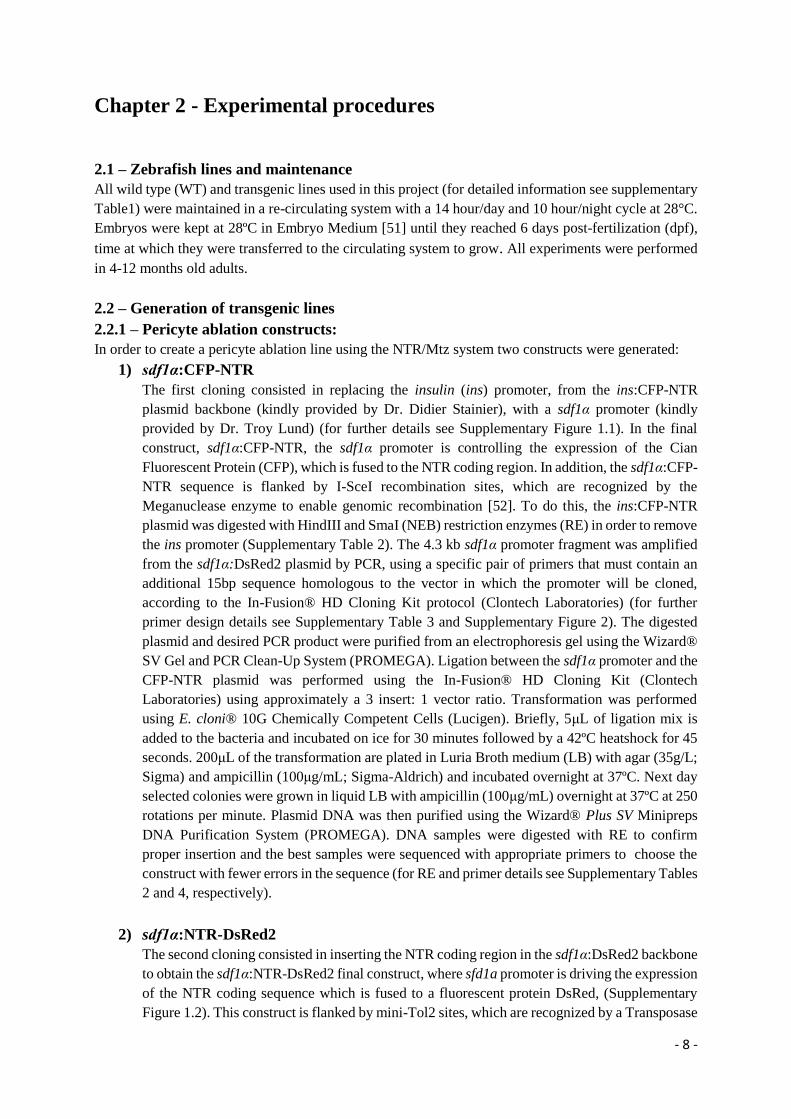
1) sdf1α:CFP-NTR
The first cloning consisted in replacing the insulin (ins) promoter, from the ins:CFP-NTR
plasmid backbone (kindly provided by Dr. Didier Stainier), with a sdf1α promoter (kindly
provided by Dr. Troy Lund) (for further details see Supplementary Figure 1.1). In the final
construct, sdf1α:CFP-NTR, the sdf1α promoter is controlling the expression of the Cian
Fluorescent Protein (CFP), which is fused to the NTR coding region. In addition, the sdf1α:CFP-
NTR sequence is flanked by I-SceI recombination sites, which are recognized by the
Meganuclease enzyme to enable genomic recombination [52]. To do this, the ins:CFP-NTR
plasmid was digested with HindIII and SmaI (NEB) restriction enzymes (RE) in order to remove
the ins promoter (Supplementary Table 2). The 4.3 kb sdf1α promoter fragment was amplified
from the sdf1α:DsRed2 plasmid by PCR, using a specific pair of primers that must contain an
additional 15bp sequence homologous to the vector in which the promoter will be cloned,
according to the In-Fusion® HD Cloning Kit protocol (Clontech Laboratories) (for further
primer design details see Supplementary Table 3 and Supplementary Figure 2). The digested
plasmid and desired PCR product were purified from an electrophoresis gel using the Wizard®
SV Gel and PCR Clean-Up System (PROMEGA). Ligation between the sdf1α promoter and the
CFP-NTR plasmid was performed using the In-Fusion® HD Cloning Kit (Clontech
Laboratories) using approximately a 3 insert: 1 vector ratio. Transformation was performed
using E. cloni® 10G Chemically Competent Cells (Lucigen). Briefly, 5μL of ligation mix is
added to the bacteria and incubated on ice for 30 minutes followed by a 42ºC heatshock for 45
seconds. 200μL of the transformation are plated in Luria Broth medium (LB) with agar (35g/L;
Sigma) and ampicillin (100μg/mL; Sigma-Aldrich) and incubated overnight at 37ºC. Next day
selected colonies were grown in liquid LB with ampicillin (100μg/mL) overnight at 37ºC at 250
rotations per minute. Plasmid DNA was then purified using the Wizard® Plus SV Minipreps
DNA Purification System (PROMEGA). DNA samples were digested with RE to confirm
proper insertion and the best samples were sequenced with appropriate primers to choose the
construct with fewer errors in the sequence (for RE and primer details see Supplementary Tables
2 and 4, respectively).
2) sdf1α:NTR-DsRed2
The second cloning consisted in inserting the NTR coding region in the sdf1α:DsRed2 backbone
to obtain the sdf1α:NTR-DsRed2 final construct, where sfd1a promoter is driving the expression
of the NTR coding sequence which is fused to a fluorescent protein DsRed, (Supplementary
Figure 1.2). This construct is flanked by mini-Tol2 sites, which are recognized by a Transposase
- 9 -
that allows genome integration [53]. To do this, the sdf1α: DsRed2 plasmid was digested with
AgeI (NEB) restriction enzyme and then dephosphorylated with Alkaline Phosphatase, Calf
Intestinal (NEB) (1unit/1ug of plasmid DNA) (Supplementary Table 2). The NTR coding
sequence was amplified by PCR from the col10a1:GFP-NTR plasmid (generated in the lab)
using a specific pair of primers (Supplementary Table 3). To generate a fusion protein between
the NTR and the DsRed2 coding sequences, the NTR STOP codon was converted into a Serine.
Both products were purified from an electrophoresis gel (Supplementary Table 3). Cloning was
performed as described above.
2.2.2 – Müller Glia ablation construct
To create a Müller Glia ablation line using the NTR/MTZ system two constructs were generated:
1) gfap:CFP-NTR
The first cloning consisted in replacing the ins promoter from the ins:CFP-NTR backbone, by
the gfap promoter to obtain the gfap:CFP-NTR final construct. In this, the gfap promoter is
driving the expression of CFP that is fused to the NTR coding sequence, all flanked by I-SceI
sites, allowing recombination with Meganuclease (Supplementary Figure 1.3). For this, the
ins:CFP-NTR plasmid was digested with the enzymes HindIII and SmaI (NEB) in order to
remove the ins promoter (Supplementary Table 2). The gfap promotor (5’UTR sequence and
Exon1) was directly amplified by PCR from the gfap:GFP plasmid backbone (Addgene plasmid
#39761), using a specific pair of primers (Supplementary Table 3) [54]. The digestion and
desired PCR product were purified and cloning was performed as described above.
2) gfap:GFP-NTR
The second cloning consisted in replacing the col10a1 promoter and the Green Fluorescent
Protein (GFP) sequence, from the col10a1:GFP-NTRo plasmid backbone, by the gfap:GFP
sequence to obtain the gfap:GFP-NTR plasmid. In the final construct the gfap promoter is
driving the expression of GFP fused to the NTR coding sequence, and flanked by I-SceI sites,
allowing recombination with Meganuclease (Supplementary Figure 1.4). For this, the
col10a1:GFP-NTR plasmid was digested with the enzymes KpnI and XhoI (NEB), in order to
remove the col10a1 promoter (Supplementary Table 2). The gfap:GFP sequence was amplified
by PCR from the gfap:GFP plasmid using specific primers (Supplementary Table 3). The last
codon was not included in the amplicon since it encoded a STOP signal. The digestion and PCR
product were purified and cloning proceeded as described above.
2.2.3 Pericyte lineage-tracing construct
The pericyte lineage-tracing construct was generated in collaboration with the zCRE Europeam
consortium. This construct, sdf1α:CREERT2;crya-α:VENUS consists of two independent cassettes: in one
cassette the sdf1α promoter was sub-cloned upstream the coding region of the Cre recombinase enzyme,
which is fused to the estrogen receptor; in the other cassette the promoter of crystalline-alpha a (crya-
α) is controlling the expression of a fluorescent reporter, Venus, which allows to easily screen for
transgene carriers. The sequences are flanked by mini-Tol2 sites that are recognized by Transposase to
allow genomic integration.
2.2.4 Embryo injection and transgenesis
WT AB strain zebrafish embryos were injected at one cell-stage using a pressure injector (PV820
Pneumatic PicoPump) (hold pressure= 3psi; eject pressure= 20psi), glass capillaries and a Nikon
SMZ745 stereoscope.
- 10 -
For the injection of the sdf1α:CFP-NTR, gfap:CFP-NTR and gfap:GFP-NTR constructs, capillaries
were filled with injection mix (50ng/μL DNA; 1X Taq Buffer with KCl (Fermentas); 5mM MgCl2
(Fermentas); 1unit/mL Meganuclease I-SceI (Roche); or, 50ng/μL DNA; 1X Buffer CutSmart (NEB);
1unit/mL Meganuclease I-SceI (NEB)) and calibration was performed in order to inject 100pg per
embryo.
For the injection of the sdf1α:NTR-DsRed2 and sdf1α:CREERT2; crya-α:VENUS plasmids, transposase
mRNA was synthetized from a plasmid containing the transposase coding sequence (Tol2 kit: Multisite
Gateway Technology, provided by Dr. Kawakami). Plasmid was digested with NotI (Thermo Fisher
Scientific) and mRNA synthetized using the mMESSAGE mMACHINE® Kit (Life Technologies),
following the manufacturer’s protocol. A mix containing 21,4ng/μL of transposase’s mRNA and
53,6ng/μL of construct was injected at one-cell stage embryos. Calibration was assembled in order to
inject 75pg of DNA per embryo.
2.2.5 Embryo screening
Embryos were screened in a Zeiss Lumar V12 stereoscope using: a CFP filter for the Tg(sdf1α:CFP-
NTR) and Tg(gfap:CFP-NTR) lines; a TexasRed filter for the Tg(sdf1α:NTR-DsRed2) line; and a GFP
filter for Tg(gfap:GFP-NTR) and Tg(sdf1α:CREERT2;crya-α:VENUS) lines. Positive embryos were
selected for fluorescent signals that mimicked the expression patterns for sdf1α (fluorescence in the tail
bud and head) and crya-α (fluorescence in the eye) at 3dpf, or for gfap (fluorescence in the eye, brain
and spinal cord), and at 4dpf.
Positive-selected embryos were raised until sexual maturity (3-6 months) time at which they were
outcrossed with WT AB fish in order to identify founders (germ line carriers) to generate stable
transgenic lines. The strongest Tg(sdf1α:CREERT2;crya-α:VENUS) founders were crossed with the
transgenic line Tg(βactin2:Lox-DsRED-STOP-Lox-EGFP)s928 referred as βact2:RSG, kindly provided
by Dr. Didier Stainier. Embryos were screened under GFP and TexasRed filters and double-positives
selected to grow until adulthood.
2.3 – Injury assays
2.3.1 – Caudal fin amputation Caudal fin amputation was performed with a sterile razor blade on fish anesthetized with 160mg/mL
MS-222 (Tricaine-S). Amputation was made 1 or 2 segments below the first bone-segment divergence,
removing approximately one half of the fin. Animals were allowed to regenerate in an incubator at 33°C
and fins collected at predefined time-points post-amputation.
2.3.2 – Retinal light lesions
High intensity light lesions were induced to kill photoreceptors. Adult zebrafish were first placed in the
dark for 10 days prior to light exposure, in an incubator at 28ºC. They were then transferred to a 250 ml
glass beaker, filled with 100mL of system water, which was then placed inside 1L glass beaker filled
with 100mL water, to function as a thermal buffer. A UV-light source was positioned 5 cm from the
beaker. Fish were exposed to UV light (~100k lux) for 30 minutes (min) and posteriorly kept in an
incubator at 28ºC with normal day/night cycle. Zebrafish were sacrificed with Tricaine-S for subsequent
eye removal at the desired time-points.
- 11 -
2.4 – Osteoblast Ablation procedure
For osteoblast ablation the zebrafish lines Tg(osterix:mCherry-NTR)pd46, referred to as osx:NTR, and
Tg(osterix:mCherry-NTR; Ola.Bglap:EGFP), referred to as osx:NTR; osc:GFP, were incubated either
with 9mM of Mtz (Sigma, M1547) dissolved in system water or with drug vehicle (controls), 0,2%
DMSO, and maintained for 24 hours (h) in the dark at 28 ˚C. Subsequently, both Mtz and vehicle treated
animals were rinsed and returned to recirculating system water and left to recover for 48h. Afterwards,
both controls and fish with high efficient osteoblast ablation were subjected to caudal fin amputation.
2.5 – EdU intraperitoneal injection
To evaluate cell proliferation after osteoblast ablation, we performed EdU (5-ethynyl-2´-deoxyuridin,
Life Technologies) incorporation assays. Animals were anesthetized and injected via intraperitoneal
injection (IP) with 20uL of an EdU solution (10mM diluted in 1X Phosphate Buffered Saline (PBS))
with an insulin U-100 G needle 0,3mL, 3 hours prior to caudal fin collection.
2.6 – Heat shock treatment
To manipulate Hippo/Yap signalling pathway and address its role during photoreceptor regeneration, a
heat shock inducible transgenic line that expresses a dominant negative form of Yap was used:
Tg(hsp70l:RFP-dnyap1), referred to as DN-yap. Fish were subjected to daily heat shocks in a water bath
at 38˚C for one hour and subsequently transferred to an incubator at 28ºC. Procedure was repeated during
7 days and eyes collected at the desired time-points.
2.7 – Tissue preparation and Cryosections
Fins and eyes were fixed overnight (ON) in 4% Paraformaldehyde. After fixation fins were stored in
100% methanol at -20°C until required. They were then gradually rehydrated in series of Methanol/PBS
1x (75%, 50% and 25%) and incubated ON in a 30% sucrose solution. Eyes were incubated in increasing
sucrose gradients: 5% sucrose ON incubation, 20% sucrose ON incubation and 30% sucrose ON
incubation. Once in 30% sucrose, fins and eyes were embedded in 7,5% gelatin/ 15% sucrose in PBS
1x and subsequently frozen in liquid nitrogen. Longitudinal caudal fins and transversal eye sections
were then cut at 12μm using a Microm cryostat (Cryostat Leica CM3050 S) and maintained at -20°C.
2.8 – Immunofluorescence assays
Fin and eye sections were thawed for 15 minutes at room temperature (RT), washed twice in 1X PBS at
37°C for 10min, incubated in 0.1M glycine (Sigma, in PBS1x) for 10min and permeabilized in PBTD
(PBS1x with 1%Tween and 1%DMSO). Afterwards they were incubated in a blocking solution (PBTD
with 5% Goat Serum) for at least 2h at RT. Samples were then incubated with primary antibodies
overnight at 4ºC. Next day samples were washed with PBTD 3 times, 10min each, and then incubated
with secondary antibodies ON at 4ºC (for further antibody details see Supplementary Table 5). Next
day, slides were washed in PBS for 30min and stained with 4’,6- diamidino-2-phenylindole (DAPI;
0.001mg/mL in PBS, Sigma) for 5min in the dark. Slides were washed 3 times with 1X PBS, 5min each,
and mounted in the DAKO fluorescent Mounting Medium. Slides were then stored at 4ºC until image
acquisition.
For anti-PCNA staining, after thawing, slides were subjected to an antigen retrieval step, in which they
were incubated for 10min at 95ºC in Sodium Citrate Buffer (10mM Tri-sodium citrate with 0,05%
Tween20, pH6).
For anti-Runx2 staining, after glycine incubation, slides were permeabilized with acetone for 7min at -
20ºC, subsequently washed with PBT (PBS1x with 0,2% TritonX-100) and blocked with PBT

- 12 -
containing 10% non-fat dry milk. Before incubating with secondary antibody, slides were washed for
30min at RT, with PBT with NaCl 0,65mM.
For anti-YAP staining, after glycine incubation, slides were permeabilized with acetone for 7min at -
20ºC, followed by a PBDX (1% BSA, 1% DMSO, 0,2% Triton-100, 50% PBS1x in Milli-Q water)
wash. Slides were then blocked with PBDX containing 1,5% Goat Serum.
For EdU detection assay, the manufacturer’s protocol from Click-iT® Plus EdU Imaging Kits (Life
Technologies) was followed. Briefly, after permeabilization with PBT, samples were incubated with the
Click it reaction cocktail for 30min in the dark. Afterwards they were washed with PBT and the protocol
followed as described above.
2.9 – Image acquisition
Pictures of adult caudal fins and injected embryos were acquired using a fluorescence stereoscope Zeiss
Lumar V-12 using CFP, GFP and TexasRed filters, a 0,8X objective and the Zen 2 PRO software.
Immuno-labelled cryosections were analysed in a confocal microscope Zeiss LSM710 using the
software ZEN 2010B SP1. Caudal fin sections were imaged using a 40X water objective with 0,6x
zoom, and the 405, 488, 568, and 633 excitation wavelengths. Neural retina sections were imaged using
a 10X air objective with 0,6x zoom, and a 40X water objective with 1x and 0,6x zooms, and the 488
and 633 excitation wavelengths.
For live imaging analysis of pericyte dynamics in vivo during regeneration, fish from the double
transgenic Tg(sdf-1α:DsRed2; fli1a:EGFP), were anesthetized and placed under a confocal microscope
Zeiss LSM710. Fish were imaged with the 10x air objective using the bright field and the 488 and 568
excitation wavelengths. Images were acquired always in the same region of the fin (one segment bellow
the amputation plane and blastema region) every 12 hours following amputation, until 72hpa.
2.10 – Image analysis
For confocal image analysis, maximum intensity z-stack projections were made using Fiji (ImageJ).
EdU positive cells counting were performed using the Cell-counter plugin and normalized to total fin
area. The live-imaging images were analyzed with ImageJ’s StackReg and MultiStackReg plugins.
Stitching of live imaging and neural retina imager were done using the Stitching plugin. Images were
processed using the Adobe Photoshop CS5 and Adobe Illustrator CC.
2.11 – Statistical Analysis
For EdU positive cells quantification, at least 9 blastemas, corresponding to 3 animals per condition,
were used. Data is expressed as the number of EdU positive cells per 100µm2 and means ± Standard
Deviation (SD) are displayed in the graphic. Statistical significance between controls (vehicle) and MTZ
treated fish was determined by non-paired, non-parametric comparison, using the Mann-Whitney U test
in the Prism (Graphpad) software. Only p-values < 0,05 were considered statistically significant.

- 13 -
Chapter 3 – Results
3.1 – Unravelling new osteogenic sources during caudal fin regeneration
After caudal fin amputation mature osteoblasts are known to dedifferentiate and migrate distally to
incorporate the blastema where they proliferate and generate osteo-progenitors [21-23]. However
mature osteoblasts were shown to be dispensable for this process since upon osteoblast ablation, bone
regeneration occurs normally [24], suggesting that other cellular sources are activated to compensate
the lack of mature osteoblast. Unravelling these cellular sources could help to further understand how
bone regeneration is accomplished under challenging conditions.
3.1.1 – Ablation of mature osteoblasts
A fundamental tool to ascertain the potential alternative sources of new osteoblast during caudal fin
regeneration when the mature osteoblasts population is compromised, is the osteoblast ablation
transgenic line Tg(osterix:mCherry-NTRo)pd46 [24], referred as osx:NTR. This line contains the
fluorescent protein mCherry and the enzyme NTR, downstream of the regulatory sequence of osx, an
osteoblast specific transcription factor important to trigger intermediate stages of osteogenesis. This
transgenic line enables to specifically ablate all osteoblasts present in the adult zebrafish by adding the
prodrug Mtz to the water. The NTR, expressed exclusively by osteoblasts, degrades the Mtz into a
cytotoxic component which kills these cells. The efficiency of the ablation is monitored by mCherry. It
has been demonstrated that after amputation, mature osteoblasts dedifferentiate and produce osteo-
progenitors responsible for bone regeneration in normal conditions. This mature population is often
visualized by the expression of osteocalcin (osc), a hormone important for bone mineralization and
secreted solely by mature osteoblasts. To confirm proper mature osteoblast ablation, we crossed the osc
reporter line Tg(ola.Bglap:EGFP) [21], referred to as osc:EGFP, with the osx:NTR ablation line and
started by reproducing the osteoblast ablation protocol.
The osx:NTR; osc:EGFP fish were divided into two groups: control (vehicle) and Mtz treatment. The
control group was incubated with 0,2% DMSO (vehicle) while the experimental group was incubated
with 9mM Mtz, for 24h. Fish were allowed to recover for 2 days before caudal fin amputation (Figure
7A). In control animals, it is visible that osx is expressed along the bony rays’ surface, while osc has a
more segmented expression pattern (Figure 7B). Their expression does not change after the DMSO
treatment (Figure 7C). As expected, in contrast to the control, animals treated with Mtz had a dramatic
loss of osx- and osc-driven fluorescence 2 days after Mtz treatment, when compared to pre-treatment
levels, meaning that osteoblast were effectively ablated (Figure 7D-E). Therefore, we were able to
reproduce efficiently the osteoblast ablation protocol [24].
3.1.2 – Proliferation analysis during caudal fin regeneration after osteoblast ablation
After reproducing the osteoblast ablation procedure, we decided to analyse which cells and/or tissues
had a proliferative response to the ablation. To do this we induced osteoblast ablation and amputated the
caudal fin to trigger regeneration. Proliferation was assessed by EdU incorporation, labelling cells
during cell cycle S Phase. We established 5 time-points for tissue collection: uncut (represents a non-
regenerative condition); 6hpa and 15hpa (before blastema formation); 24hpa and 30hpa (blastema
formation) (Figure 8).

- 14 -
In the uncut and 6hpa control
conditions, no EdU-positive cells are
observed, indicating that there is no
proliferation during this time-
window, and osteoblasts (labelled by
osx) are present throughout the bone
surface (Figure 8A, C and K). On the
other hand, in the uncut and 6hpa
Mtz treated conditions, we observe a
significant increase in the number of
EdU-positive cells, mainly in the
epidermis (yellow arrowheads).
Also, no osx-positive cells are
detected, indicating successful
osteoblast ablation (Figure 8B, D
and K). In the control condition at
15hpa, EdU-positive cells are
present in the epidermis and in the
mesenchyme (Figure 8E (yellow
arrowheads) and K) but in a scattered
way, while in the Mtz treated
condition there is a significant
increase in EdU-positive cells,
especially in epidermal and
mesenchymal regions adjacent to the
bone surface (Figure 8F (yellow
arrowheads) and K). At 24hpa, both
control and Mtz treated conditions
present a general increase of
proliferating cells mainly in the
mesenchymal compartment,
although significantly higher in the
Mtz treated fins (Figure 8G-H, and K). At 30hpa, in both conditions there is a similar increase in the
number of EdU-positive cells (Figure 8I-J and K). As expected, we can observe that only at 24 and
30hpa in the control condition osx positive cells have incorporated the blastema to aid in the bone
formation phase (Figure 8G, I (arrow)). Overall, this demonstrates that upon osteoblast ablation there is
a significant increase of cell proliferation until 24hpa, when compared control conditions, possibly to
compensate the lack of osteoblasts. This increase was particular striking in epidermal and mesenchymal
regions adjacent to the bone surface in the initial time-points before blastema formation.
Figure 7 – Osteoblasts ablation assay. (A) Schematic
representation of the experimental outline used to induce
osteoblasts ablation. (B-C) Representative example of control
condition before (B) and after (C) DMSO treatment. (D-E)
Representative example of Mtz treated condition, prior (D) and after
(E) adding Mtz. Green: osc:EGFP; Red: osx:NTR. Scale bar= 1mm.

- 15 -
Figure 8 – Analysis of proliferation after mature osteoblast ablation. Representative images of proliferation
dynamics in a control condition (DMSO) (A; C; E; G; I) versus Mtz treated condition (B; D; F; H; J) in osx:NTR
zebrafish during several time-points. (K) Quantification of the average number of EdU-positive cells per 100µm2
using non-parametric Mann-Whitney test; Mean and SD are displayed; n=9 sections of 3 animals/condition were
analysed. P-value < 0,05. Yellow arrowheads represent examples of EdU-positive cells. White arrows represent
examples of osx-positive cells. White dashed lines represent amputation plane. Orange dashed lines delineate
the bone segment. Green: EdU-positive cells; Red: osx:NTR; White: DAPI. A=Anterior, P=Posterior,
E=Epidermis, B=Bone, M=Mesenchyme. Scale bar =50µm.
- 16 -
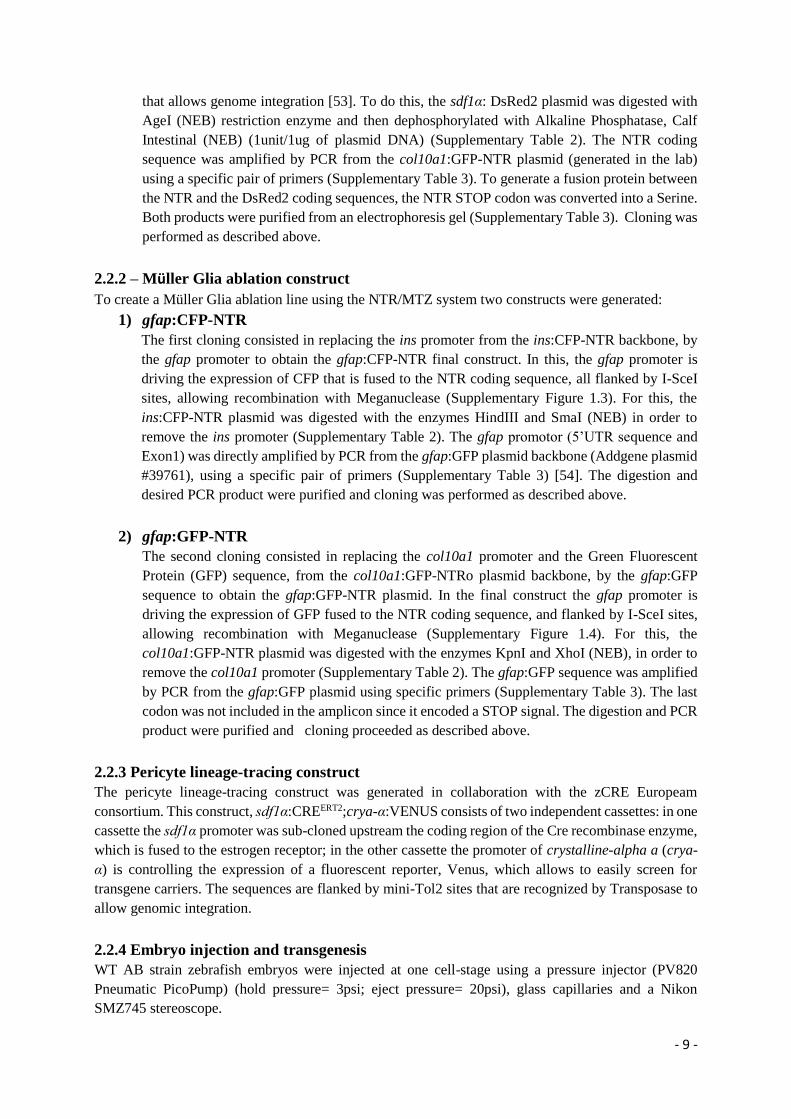
3.1.3 – Assessing osteo-progenitor formation during regeneration in osteoblast depleted
fins
Afterwards, we decided to analyse Runx2 localization (using a Runx2 antibody), a transcription factor
indicator of osteoblast lineage commitment, and see whether it is present in other tissues upon
amputation. To do that we used osx:NTR; osc:EGFP double transgenic zebrafish and performed the
osteoblast ablation protocol, as previously described (Figure 9, osx channel is not shown to facilitate
data interpretation).
In the uncut control condition, osteoblast present in the bone segment express both osc and osx, and
osteoblasts in the intersegment express solely osx (Figure 9A-A’ (arrows) and Supplementary Figure 4).
Importantly, we observe that Runx2 is present in segment and intersegment osteoblasts, co-localizing
with osx expression, and no Runx2 single-positive cells were observed (Figure 9A-A’’ and
Supplementary Figure 4), indicating that in homeostasis no early committed osteo-progenitors are
present in the caudal fin, which could serve as a source of new osteoblasts during regeneration. In the
uncut Mtz treated condition, we observe a near complete absence of osc, indicating a successful mature
osteoblast ablation, and few Runx2-positive cells appearing next to the bone surface facing the epidermis
(Figure 9B-B’ – white arrowheads). At 15hpa, in the control condition, some Runx2-single positive cells
(white arrowheads) start to appear in the mesenchyme just adjacent to mature osteoblasts, osc-positive
(arrows), underneath the amputation plane (Figure 9C-C’), while in the Mtz treated condition, we
observe a higher number of Runx2-single positive cells specially emerging both in the epidermal and
mesenchymal regions adjacent to the bone surface (Figure 9D-D’ – white arrowheads). At 24hpa, in the
control, as expected, we observe mature osteoblasts (osc-positive) that have migrated towards the stump
to form the blastema (Figure 9E’-E’ – arrows). We also observe Runx2-single positive cells displaying
the same behaviour (Figure 9E-E’ – white arrowheads). In contrast, in Mtz treated fins, only Runx2-
single positive cells were observed reaching the blastema region (Figure 9F-F’ – white arrowheads). At
30hpa, control fins had both osc-positive cells and Runx2-single positive cells at the blastema (Figure
9G-G’ – arrow and white arrowheads, respectively). In Mtz treated condition, only Runx2-single
positive cells were seen in the blastema region (Figure 9H-H’ – arrowheads).
In summary, in osteoblasts depleted fins, Runx2-positive cells start to arise before blastema formation,
mainly at the interphase between the bone surface and the epidermal and mesenchymal compartments
later contributing to blastema formation. Interestingly, we also observe that in normal condition, upon
amputation, some Runx2-singlepositive cells also appear in the mesenchymal compartment and seem to
contribute to blastema formation together with the resident osteoblast population.
- 17 -
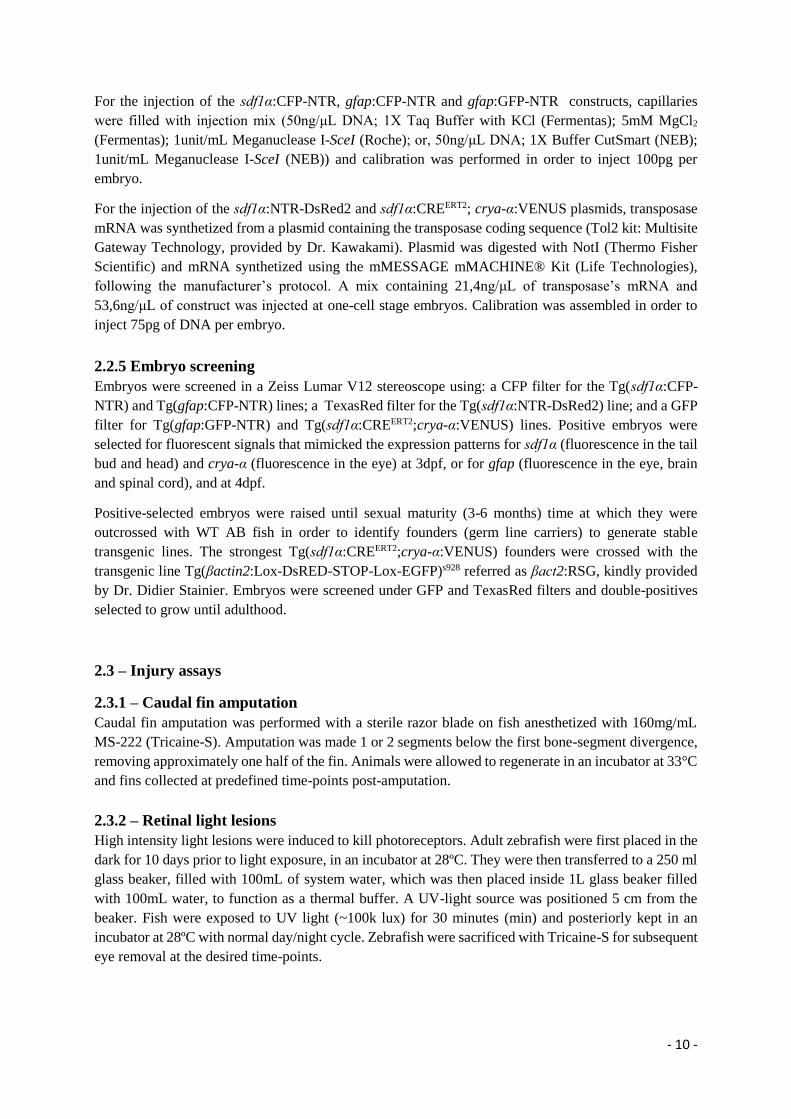
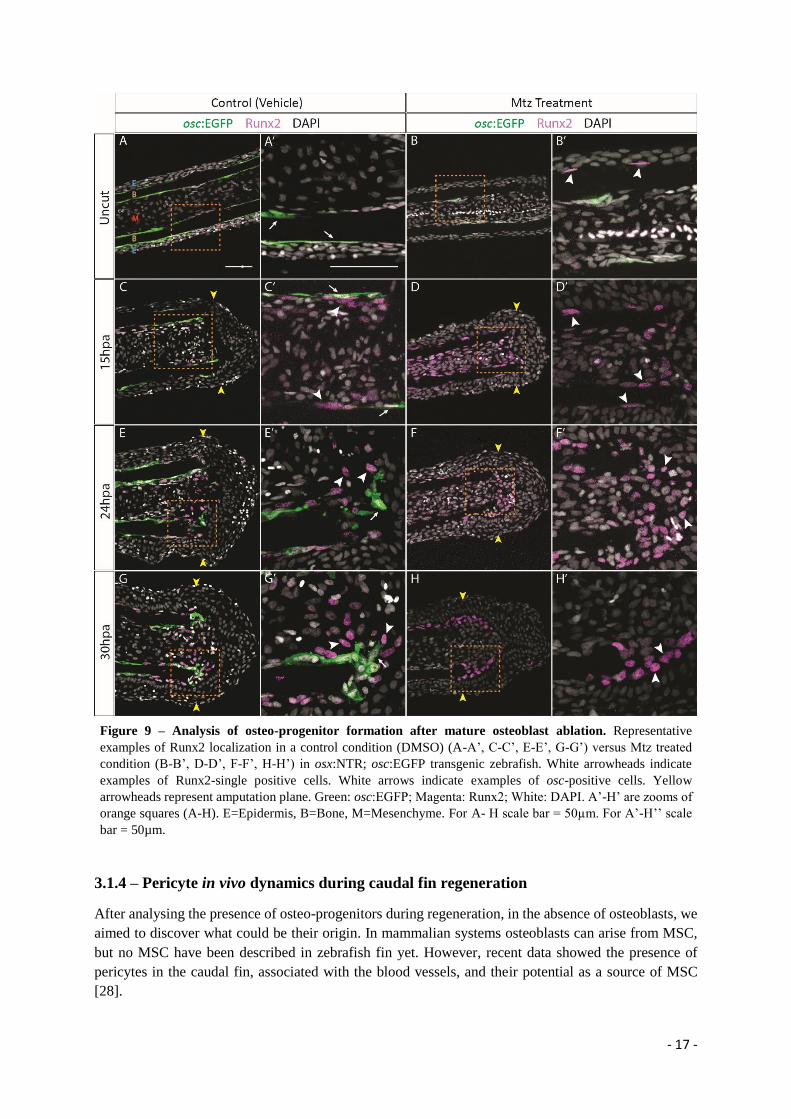
3.1.4 – Pericyte in vivo dynamics during caudal fin regeneration
After analysing the presence of osteo-progenitors during regeneration, in the absence of osteoblasts, we
aimed to discover what could be their origin. In mammalian systems osteoblasts can arise from MSC,
but no MSC have been described in zebrafish fin yet. However, recent data showed the presence of
pericytes in the caudal fin, associated with the blood vessels, and their potential as a source of MSC
[28].
Figure 9 – Analysis of osteo-progenitor formation after mature osteoblast ablation. Representative
examples of Runx2 localization in a control condition (DMSO) (A-A’, C-C’, E-E’, G-G’) versus Mtz treated
condition (B-B’, D-D’, F-F’, H-H’) in osx:NTR; osc:EGFP transgenic zebrafish. White arrowheads indicate
examples of Runx2-single positive cells. White arrows indicate examples of osc-positive cells. Yellow
arrowheads represent amputation plane. Green: osc:EGFP; Magenta: Runx2; White: DAPI. A’-H’ are zooms of
orange squares (A-H). E=Epidermis, B=Bone, M=Mesenchyme. For A- H scale bar = 50µm. For A’-H’’ scale
bar = 50µm.
- 18 -
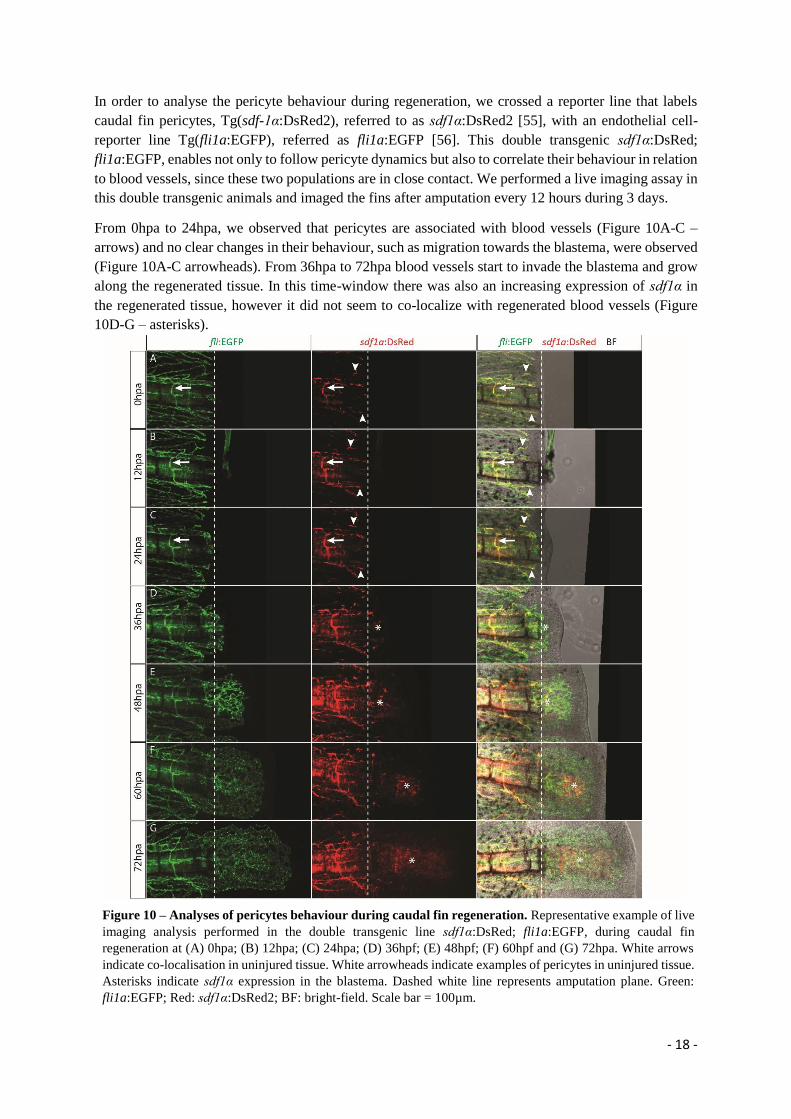
In order to analyse the pericyte behaviour during regeneration, we crossed a reporter line that labels
caudal fin pericytes, Tg(sdf-1α:DsRed2), referred to as sdf1α:DsRed2 [55], with an endothelial cell-
reporter line Tg(fli1a:EGFP), referred as fli1a:EGFP [56]. This double transgenic sdf1α:DsRed;
fli1a:EGFP, enables not only to follow pericyte dynamics but also to correlate their behaviour in relation
to blood vessels, since these two populations are in close contact. We performed a live imaging assay in
this double transgenic animals and imaged the fins after amputation every 12 hours during 3 days.
From 0hpa to 24hpa, we observed that pericytes are associated with blood vessels (Figure 10A-C –
arrows) and no clear changes in their behaviour, such as migration towards the blastema, were observed
(Figure 10A-C arrowheads). From 36hpa to 72hpa blood vessels start to invade the blastema and grow
along the regenerated tissue. In this time-window there was also an increasing expression of sdf1α in
the regenerated tissue, however it did not seem to co-localize with regenerated blood vessels (Figure
10D-G – asterisks).
Figure 10 – Analyses of pericytes behaviour during caudal fin regeneration. Representative example of live
imaging analysis performed in the double transgenic line sdf1α:DsRed; fli1a:EGFP, during caudal fin
regeneration at (A) 0hpa; (B) 12hpa; (C) 24hpa; (D) 36hpf; (E) 48hpf; (F) 60hpf and (G) 72hpa. White arrows
indicate co-localisation in uninjured tissue. White arrowheads indicate examples of pericytes in uninjured tissue.
Asterisks indicate sdf1α expression in the blastema. Dashed white line represents amputation plane. Green:
fli1a:EGFP; Red: sdf1α:DsRed2; BF: bright-field. Scale bar = 100µm.
- 19 -
Live-imaging analysis was shown to be inconclusive, and therefore, further experiments are required to
address pericyte contribution to the regenerative process.
3.1.5 – Generation of pericyte lineage-tracing and ablation lines
In order to understand if pericytes can originate other cell types, especially osteoblasts during
regeneration, we decided to create a pericyte lineage-tracing transgenic line, based on the Cre/loxP
system. The construct was generated in collaboration with the zCre European consortium. In the final
construct sdf1α:CREERT2;crya-α:VENUS, the sdf1α promoter is controlling the expression of a
tamoxifen inducible Cre recombinase. The crya-α:VENUS sequence allows for the expression of
VENUS fluorescent protein in the crystalline, which will help screening positive carriers.
This construct was injected at one-cell stage (Figure 11A), and positive embryos expressing VENUS in
the eye (Figure 11C – arrowheads) were selected and grown until adulthood to screen for founders (germ
line carriers) and establish a stable transgenic line. We obtained a good number of founders that were
crossed with the line Tg(βactin2:Lox-DsRED-STOP-Lox-EGFP)s928, referred to as β-act2:RSG, which
contain the ubiquitous promoter β-act2 controlling the expression of DsRed fluorescent protein
ubiquitously. Double positive embryos, sdf1α:CREERT2; β-act2:RSG were selected (Figure 11D) and are
currently growing.
To further address the role of pericytes during regeneration, we attempted to create a pericyte ablation
line. For that, we started by developing a construct where the sdf1α promoter was driving the expression
of CFP fused to the NTR coding sequence, sdf1α:CFP-NTR. The final construct was confirmed by
enzymatic digestion (Supplementary Figure 5A) and sequenced, to ascertain for potential errors.
Construct was injected and embryos screened for expected sdf1α pattern: head and fin fold at 3 dpf.
Unfortunately, the number of positive injected embryos was very low and no germ line carriers were
found. This led us to develop an alternative strategy, where we decided to clone the NTR sequence in
the sdf1α:DsRed2 original plasmid, thus generating the construct sdf1α:NTR-DsRed2. Final construct
was confirmed through enzymatic digestion (Supplementary Figure 5B), sequenced and injected.
However, no positive embryos were detected. Therefore, new strategies will have to be developed in
order to ablate the pericyte population present in the caudal fin.

- 20 -
Figure 11 – Generation of transgenic lines. (A) List of injected constructs. (B) WT non-injected embryo with
no fluorescence in the lens (arrowhead). (C) WT positive embryo injected with sdf1α:CREERT2; VENUS
expression is observed in the lens (arrowhead). (D) sdf1α:CREERT2;β-actin:RSG double transgenic. (E-F)
gfap:GFP and gfap:GFP-NTR positive larvae at 4dpf. (E) Reporter line gfap:GFP with GFP expressed in the
eye, brain and spinal cord (arrows). (F) Embryo injected with gfap:GFP-NTR construct with GFP expression in
the eye (arrows). For B-D scale bars = 500µm. For E scale bar = 500µm. For F scale bar = 500µm.

- 21 -
3.2 – Exploring the process of retina regeneration
During zebrafish retina regeneration, MGs are capable of dedifferentiating, giving rise to a proliferative
population of retinal progenitors that migrate to the injured zone and regenerate the damaged retinal
layers [38]. However, how the regenerative process unveils in the absence of these cells has not yet been
addressed in the zebrafish. Also, despite being associated with the regeneration of several organs, Yap
function has never been addressed in the context of neural retina regeneration.
3.2.1 – Generation of a Müller Glia ablation line
In order to explore how retina regeneration progresses in the absence of MGs, we decided to create a
transgenic line that would specifically ablate these cells. The Gfap is characteristic of glial cells of the
CNS, being produced by astrocytes in the brain and spinal cord, and specific of MGs in the neural retina
[54]. We decided to amplify the 5’UTR/Exon1 sequence from the gfap promoter and cloned it upstream
of the CFP-NTR sequence, in order to obtained the gfap:CFP-NTR final construct. We digested
(Supplementary Figure 5C) and sequenced the construct to confirm correct cloning. Embryos were
injected at one-cell stage (Figure 11A) and screened for the expected expression pattern correspondent
to the reporter line Tg(gfap:GFP): eye, brain and spinal cord (Figure 11E – arrows) [54]. Few positive
embryos were selected, with GFP being restricted to the eye and not detected in brain and spinal cord.
Nevertheless, no germ line carriers were found. Therefore, we developed a second approach, and cloned
the gfap:GFP in a different vector upstream of a NTR sequence, obtaining the final construct gfap:GFP-
NTR. Like before, we digested (Supplementary Figure 5D) and sequenced the construct to confirm
correct cloning. Upon injection in one-cell stage, a good number of embryos was positive for GFP
expression, mainly restricted to the eye (Figure 11F – arrows). GFP-positive embryos are currently
growing until adulthood, when they will be screened for founders.
3.2.2 – Exploring a possible role of Yap during photoreceptors regeneration in adult
zebrafish
We have recently observed that Yap localizes in the zebrafish retina MGs during embryonic
development and larval stages (Figure 12 – arrowheads). In addition, preliminary results appear to
indicate that Yap is required to regulate photoreceptors regeneration in zebrafish larval stages (data not
shown). Considering that MGs are required for neural retina regeneration, and Yap is present in these
cells during development, we decided to investigate a possible role of Yap in adult neural retina
regeneration.
Figure 12 – Yap localization in
Müller Glia cells during retina
differentiation. (A-C’)
Representative staining for Yap in
3dpf gfap:GFP transgenic larvae,
where it is visible that gfap, MGs
marker, and Yap co-localize
(arrowheads). A’-C’ correspond to a
zoom of the white square (A-C).
Green: gfap:GFP ; Red: Yap. L=Left.
R=Right. For A-C scale bar= 50µm.
For A’-C’ scale bar= 10µm.
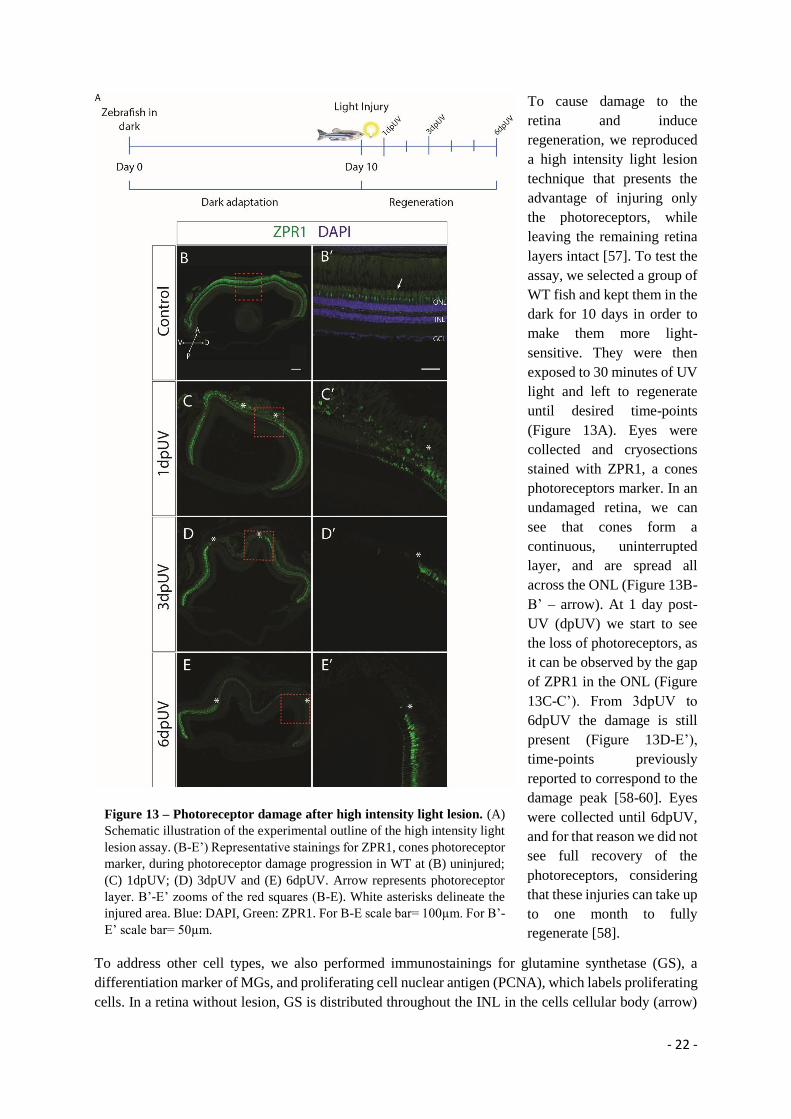
- 22 -
To cause damage to the
retina and induce
regeneration, we reproduced
a high intensity light lesion
technique that presents the
advantage of injuring only
the photoreceptors, while
leaving the remaining retina
layers intact [57]. To test the
assay, we selected a group of
WT fish and kept them in the
dark for 10 days in order to
make them more light-
sensitive. They were then
exposed to 30 minutes of UV
light and left to regenerate
until desired time-points
(Figure 13A). Eyes were
collected and cryosections
stained with ZPR1, a cones
photoreceptors marker. In an
undamaged retina, we can
see that cones form a
continuous, uninterrupted
layer, and are spread all
across the ONL (Figure 13B-
B’ – arrow). At 1 day post-
UV (dpUV) we start to see
the loss of photoreceptors, as
it can be observed by the gap
of ZPR1 in the ONL (Figure
13C-C’). From 3dpUV to
6dpUV the damage is still
present (Figure 13D-E’),
time-points previously
reported to correspond to the
damage peak [58-60]. Eyes
were collected until 6dpUV,
and for that reason we did not
see full recovery of the
photoreceptors, considering
that these injuries can take up
to one month to fully
regenerate [58].
To address other cell types, we also performed immunostainings for glutamine synthetase (GS), a
differentiation marker of MGs, and proliferating cell nuclear antigen (PCNA), which labels proliferating
cells. In a retina without lesion, GS is distributed throughout the INL in the cells cellular body (arrow)
Figure 13 – Photoreceptor damage after high intensity light lesion. (A)
Schematic illustration of the experimental outline of the high intensity light
lesion assay. (B-E’) Representative stainings for ZPR1, cones photoreceptor
marker, during photoreceptor damage progression in WT at (B) uninjured;
(C) 1dpUV; (D) 3dpUV and (E) 6dpUV. Arrow represents photoreceptor
layer. B’-E’ zooms of the red squares (B-E). White asterisks delineate the
injured area. Blue: DAPI, Green: ZPR1. For B-E scale bar= 100µm. For B’-
E’ scale bar= 50µm.

- 23 -
and in extended protrusions that contact with the ONL and GCL (arrowheads) (Figure 14A-A’). Staining
for PCNA indicated that there is no cell proliferation (Figure 14B). At 1dpUV, when photoreceptors
start to die, no visible changes in the GS and PCNA levels are observed (Figure 14C-D). At 3dpUV
however, we observe a decrease in GS levels, which appears to be restricted to the damaged
photoreceptor area (Figure 14E-E’), indicative of MGs dedifferentiation process [40]. At this time-point
we also observe an increase in the number of PCNA-positive cells, mainly in the INL, indicating cell
cycle re-entry and proliferation of progenitor cells (Figure 14F). At 6dpUV, the decrease of GS levels
is still visible (Figure 14G-G’). There appear to be more PCNA-positive cells in the ONL (Figure 14H),
which corresponds with the migration of progenitor cells to the damaged layer, to compensate for the
lost photoreceptors. These results are in accordance with what has previously been described
nevertheless, these data still need to be quantified and further time-points addressed.
Figure 14 – Cell dedifferentiation and proliferation in adult retina after high intensity light lesion. (A-
A’, C-C’, E-E’, G-G’) Representative stainings for GS, MGs marker, during photoreceptor regeneration in
WT. Arrow indicates MGs nuclear body in the INL. Arrowheads indicate MGs extended protrusions. A’, C’
E’ and G’ zooms of orange squares. (B, D, F, H) Representative stainings for PCNA, during photoreceptor
regeneration in WT. White asterisks delineate the injured area. Blue: DAPI, Red: GS (A,A’, C,C’, E,E’, G,G’)
or PCNA (B, D, F, H). For A, B, C, E and G scale bar= 100µm. For A’, C’, D, E’, F, G’ and H scale bar=
50µm.
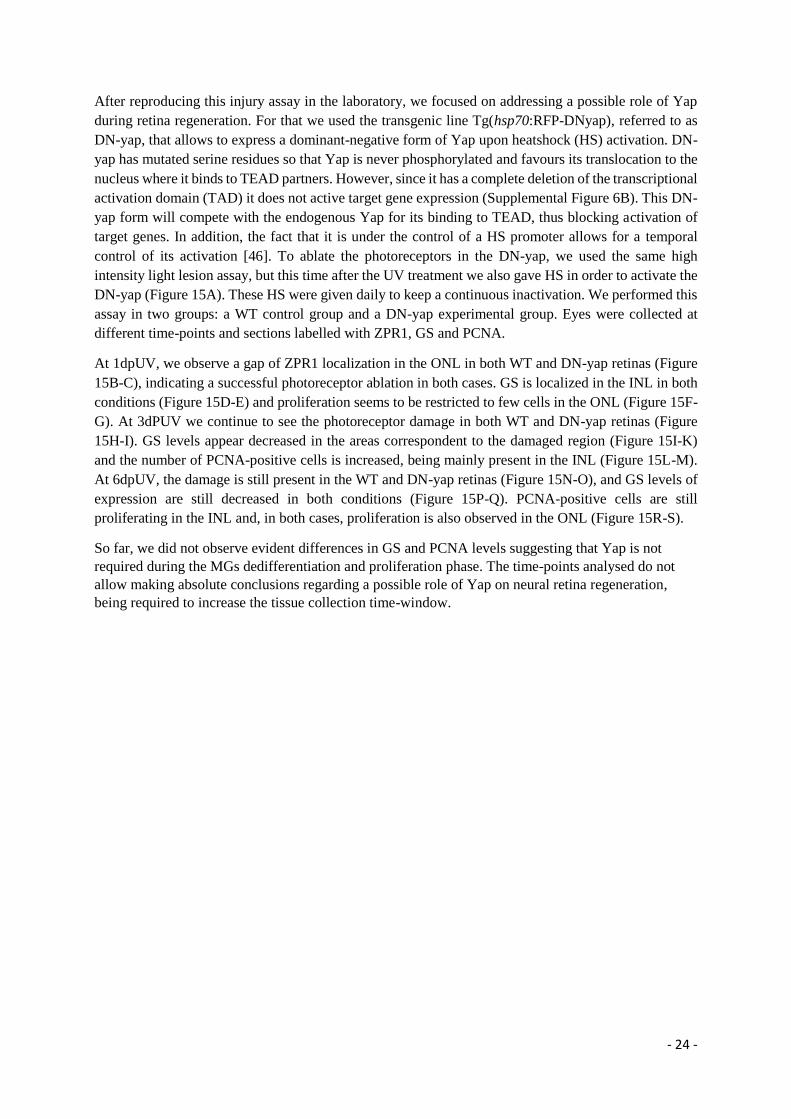
- 24 -
After reproducing this injury assay in the laboratory, we focused on addressing a possible role of Yap
during retina regeneration. For that we used the transgenic line Tg(hsp70:RFP-DNyap), referred to as
DN-yap, that allows to express a dominant-negative form of Yap upon heatshock (HS) activation. DN-
yap has mutated serine residues so that Yap is never phosphorylated and favours its translocation to the
nucleus where it binds to TEAD partners. However, since it has a complete deletion of the transcriptional
activation domain (TAD) it does not active target gene expression (Supplemental Figure 6B). This DN-
yap form will compete with the endogenous Yap for its binding to TEAD, thus blocking activation of
target genes. In addition, the fact that it is under the control of a HS promoter allows for a temporal
control of its activation [46]. To ablate the photoreceptors in the DN-yap, we used the same high
intensity light lesion assay, but this time after the UV treatment we also gave HS in order to activate the
DN-yap (Figure 15A). These HS were given daily to keep a continuous inactivation. We performed this
assay in two groups: a WT control group and a DN-yap experimental group. Eyes were collected at
different time-points and sections labelled with ZPR1, GS and PCNA.
At 1dpUV, we observe a gap of ZPR1 localization in the ONL in both WT and DN-yap retinas (Figure
15B-C), indicating a successful photoreceptor ablation in both cases. GS is localized in the INL in both
conditions (Figure 15D-E) and proliferation seems to be restricted to few cells in the ONL (Figure 15F-
G). At 3dPUV we continue to see the photoreceptor damage in both WT and DN-yap retinas (Figure
15H-I). GS levels appear decreased in the areas correspondent to the damaged region (Figure 15I-K)
and the number of PCNA-positive cells is increased, being mainly present in the INL (Figure 15L-M).
At 6dpUV, the damage is still present in the WT and DN-yap retinas (Figure 15N-O), and GS levels of
expression are still decreased in both conditions (Figure 15P-Q). PCNA-positive cells are still
proliferating in the INL and, in both cases, proliferation is also observed in the ONL (Figure 15R-S).
So far, we did not observe evident differences in GS and PCNA levels suggesting that Yap is not
required during the MGs dedifferentiation and proliferation phase. The time-points analysed do not
allow making absolute conclusions regarding a possible role of Yap on neural retina regeneration,
being required to increase the tissue collection time-window.

- 25 -
Figure 15 – High intensity light lesion in DN-yap adult fish. (A) Schematic illustration of the experimental
outline of the high intensity light lesion protocol for DN-Yap transgenic. (B-S) Representative images of ZPR1,
GS and PCNA labelling during neural retina regeneration in: WT (B, D, F, H, J, L, N, P, R) and in DN-Yap
(C, E, G, I, K, M, O, Q, S). White asterisks delineate the injured area. Blue: DAPI, Green: ZPR1, Red: GS (D,
E, J, K, P and Q), or PCNA (F, G, L, M, R and S). For B-E, H-K and N-K scale bar = 100µm. For F, G, L, M,
R and S scale bar = 50µm.
- 26 -
Chapter 4 – Discussion
Discovering the molecular and cellular mechanisms that induce and control regeneration could have
great impact in the field of regenerative medicine. Several animal models have been used to answer
particular questions in this context, such as the zebrafish. Not only does it have a high regenerative
capacity, but its genome is easily manipulated, enabling the creation of transgenic lines that allow, for
example, to follow gene expressions, to track cell lineages and to selectively ablate a specific cell type.
In this project we took full advantage of these characteristics to unravel several key questions regarding
caudal fin and neural retina regeneration.
4.1 – New osteogenic sources in osteoblast-depleted fins
4.1.1 – Epidermis and mesenchyme as potential sources for de novo osteoblast formation
It has been shown that during caudal fin regeneration, mature osteoblasts dedifferentiate and migrate
towards the blastema, where they proliferate to originate new osteoblasts [21, 22]. However, when this
osteoblast population is compromised prior to amputation, new osteoblasts arise from de novo
differentiation [24], suggesting that there are other cellular sources capable of differentiating into osteo-
progenitors and contribute to bone regeneration. Unravelling potential osteogenic sources was one of
the main objectives of this project. Primarily, we managed to successfully reproduce the osteoblast
ablation procedure (Figure 7), which allowed us to analyse proliferation dynamics and Runx2
localization, a marker of osteogenic commitment, in the absence of mature osteoblasts.
Here, we observed that in osteoblast depleted fins, when compared to control conditions, there was a
significant increase of proliferation from uncut until 24hpa, starting in the epidermis and then in the
mesenchymal compartment just adjacent to the bone surface. From 24 to 30hpa this difference between
control and Mtz treated fins was no longer observed (Figure 8). It is known that dying cells can release
several factors (for example, reactive oxygen species) that can influence, for instance, the proliferation
of neighbouring cells [61]. This significant increase in the number of proliferating cells at early time-
points, could indeed be stimulated by dying osteoblast after Mtz treatment. Importantly, this activation
of cell proliferation could be required to compensate the osteoblasts that were lost after ablation, and the
first tissues that seem to respond are the epidermal and mesenchymal regions in close contact with the
bone matrix.
Afterwards, we explored which tissues could have the potential to become committed towards
osteogenesis during regeneration in control and Mtz treated animals. We observed that in Mtz treated
conditions new osteo-progenitors, Runx2-single positive cells, start to emerge progressively, from the
uncut to 15hpa, especially in the regions that surround the bone matrix, epidermis and mesenchyme
(Figure 9). Subsequently, at later time-points during blastema formation, these cells seem to incorporate
the blastema where they will likely contribute to the formation of new osteoblasts that will promote bone
repair. In control conditions, new osteoblasts should arise from dedifferentiation of mature osteoblasts
after reaching the blastema. However, we also observe Runx2-single positive osteo-progenitors arising
in the mesenchymal compartment just adjacent to mature osteoblasts at around 15hpa, before blastema
formation phase. It is unclear whether these single Runx2-positive cells that emerge in normal
regenerative conditions, prior to blastema formation, arise already from mature osteoblast
dedifferentiation or if the mesenchymal cells that are in close contact with mature osteoblasts can also
contribute as a source of osteo-progenitors that is activated regardless of mature osteoblast ablation and
acts in parallel with dedifferentiation to promote bone regeneration.
- 27 -
Both observations of proliferation and Runx2 expression, during caudal fin regeneration in osteoblast
depleted fins, suggest that the first tissues that respond to the ablation are the epidermis and the
mesenchymal fibroblasts, in regions at the interphase with the bone surface. In vitro studies have
demonstrated that MSC differentiation into osteoblasts is enhanced when they are cultured in
mineralized scaffolds that mimic the bone matrix microenvironment [62]. This could suggest that after
ablation, due to factors released by dying osteoblasts, neighbouring cells are stimulated to proliferate in
the epidermis and mesenchyme. These proliferating cells are in close contact with the bone matrix
surface, that could act as a signalling centre, and may help to induce de novo osteogenic differentiation
in both tissues.
Supporting this hypothesis of the epidermis as an osteogenic source, is a study performed in axolotl,
where transgenic cells from the dermis that express GFP were transplanted into a WT recipient prior to
limb amputation. It was observed that cells from the dermis were capable of contributing to the
formation of new skeleton [63]. Also, in zebrafish, the most basal layer of the epidermis, called basal
epidermal layer (BEL), is composed of epidermal stem cells that have been shown to be capable of
originating new keratinocytes [64]. Our group has a lineage-tracing line that is expressed specifically in
the BEL, Tg(krtt1c19e:CREERT2;cmcl2:EGFP) [65], kindly provided by Dr. Hammershmidt, which
could be used to assess if these cells could contribute to the formation of new osteo-progenitors.
Unfortunately, to address whether the mesenchyme fibroblasts could contribute to bone repair in
osteoblast depleted fins, such analyses would be difficult since these cells share the expression of many
markers with osteoblasts and exclusive mesenchymal markers are lacking. Overall these results suggest
that both epidermal and mesenchymal regions, adjacent to the bone surface, may have the potential to
serve as important sources for new osteo-progenitor formation during regeneration upon osteoblast
ablation. However further studies are required to clearly demonstrate if these two different types of
tissues can contribute to regeneration as potential osteogenic sources.
4.1.2 – Pericytes as potential candidates for new osteo-progenitor formation
In mammals, during normal bone turnover and upon fracture healing, new osteoblasts derive from MSC.
However, no bona fide MSC have been found in zebrafish yet. It was recently demonstrated that
zebrafish caudal fin is populated by pericytes, which closely resemble hMSC. These cells are seen along
the surface of blood vessels, including the central vessels of the bony-ray mesenchyme and can be
visualised by the expression of sdf1α [28]. We hypothesised that pericytes, since they share important
features with MSCs and are localized in the vasculature of the mesenchymal compartment, could be a
source for de novo osteoblast formation.
First we started by analysing the dynamics of these cells, during caudal fin regeneration, through a live-
imaging assay using the blood vessels as a reference. Since mature osteoblasts take about 24h to reach
the blastema upon amputation [21], we were expecting to observe migration of pericytes towards the
blastema during this time-window, if they had a role during blastema formation. However, until 24hpa,
no major differences in pericyte behaviour were observed, with the resident population remaining
associated with the blood vessels in the uninjured tissue. It has been demonstrated through in situ
hybridization that at 24hpa there is no expression of sdf1α in the caudal fin [66]. Nevertheless, DsRed2
extended half-life would still allow to keep track of pericytes movements during the first 24hpa [28],
which helps in sustaining the hypothesis that these cells may not migrate to incorporate the blastema.
From 24 to 72hpa, as expected, we observe a quick vascular regeneration accompanied with an up-
regulation of DsRed2 expression in the blastema, region that does not seem to co-localise with the

- 28 -
vasculature [28]. Since, no resident pericytes seem to have migrated to the blastema, upregulation of
sdf1a must come from de novo expression in other cell types in the regenerated tissue. Given that SDF1α
is a chemokine known to be important for chemotaxis, cell proliferation and survival [28], it is not
surprising if it has additional functions during blastema formation. In fact, it has been shown through in
situ hybridization that, after amputation, sdf1a is strongly expressed in the blastema and its receptors in
are expressed the wound epidermis that encloses the blastema, triggering epidermal cell proliferation
[28, 66]. Therefore, we were unable to conclude if pericytes contribute to blastema formation.
In order to further assess the contribution of pericytes for caudal fin regeneration, we decided to generate
a pericyte lineage-tracing transgenic line sdf1α:CRE ERT2. At the moment we have 6 different stable
transgenic lines, from different founders, that were combined with the β-act2:RSG line (Figure 11).
When reaching adulthood, sdf1α:CRE; β-act2:RSG double transgenics will be subjected to tamoxifen
treatment so that Cre will be active, leading to permanent GFP expression in pericytes and in their
progeny, even if the expression of sdf1α is downregulated during regeneration. More importantly, it will
allow to address what cell types they can originate upon amputation by performing immunostainings,
specially to co-localize with osteoblast markers, such as Runx2 or Osx.
Additionally, we also aimed to generate a pericyte-ablation line to further evaluate their requirement.
We obtained no positive carriers for the transgenic line Tg(sdf1α:CFP-NTR), suggesting a possible
problem of construct integration in the genome. In the second attempt to generate the transgenic line
Tg(sdf1α:NTR-DsRed), no DsRed-positive fluorescent embryos were detected upon injection,
suggesting a problem at the level of the construct structure or sequence. In order to obtain a fusion
protein between the NTR sequence and the DsRed, we changed the NTR STOP codon for a serine. Since
serine is a polar amino-acid, with neutral charge, and with hydrophilic properties, it is possible that this
amino-acid led to a malfunction of the fusion protein. It is also important to mention that both integration
techniques worked in other experiments performed in this project. We will have to consider an
alternative strategy to generate a sdf1α-NTR construct. Another hypothesis is to test a different
promoter, such as the platelet-derived growth factor receptor β (pdgfrβ) [29]. Whether the sdf1α-
pericytes are exactly equivalent to pdgfrβ-expressing pericytes is still unknown. However, pdgfrβ is
characteristic of all perivascular cells, which also includes the smooth muscle cells [29] and can
potentially lead to the ablation of an additional cell type. In addition, since pericytes have a significant
role in blood vessels formation and maintenance [27], we would expect to have defects in new blood
vessel morphology and patterning during regeneration if this population is compromised.
In conclusion, both the pericyte lineage-tracing and the NTR ablation lines are essential to understand
the contribution of these cells for caudal fin regeneration. Importantly, these two lines will also help to
ascertain if pericytes can be a potential source of new osteoblasts during normal regeneration, or if they
are a source that is usually dormant and only activated upon osteoblast ablation.
4.2 – Exploring the process of retina regeneration
4.2.1 – Development of a transgenic line to specifically ablate Müller glia
In zebrafish, MGs have a very important role during neural retina regeneration. After an injury they are
capable of dedifferentiating and proliferating to replace the damaged cell types [38]. However, it is not
known if tissue regeneration is achieved in their absence.
To answer this question, we decided to establish a MGs ablation line Tg(gfap:CFP-NTR) using the gfap
regulatory regions (5’UTR and the first 16bp of Exon1) from the original plasmid gfap:GFP [54].
- 29 -
Injected embryos were screened for CFP expression in the eye, brain and spinal cord, reproducing the
Tg(gfap:GFP) expression pattern. Few embryos were positive and only expressed CFP in the eye region.
This difference in the expression pattern is possibly related with the fact that we did not amplify the
complete described gfap regulatory region [54]. The complete region also includes Intron1, which we
were unable to sequence from the purchased gfap:GFP plasmid. Nevertheless, since CFP was detected
in the eye, we decided to proceed and allow these embryos to grow until adulthood. Unfortunately, none
of them was a germ line carrier, which could indicate an inefficient transgenesis. The vector backbone
used to generate this construct was the same as the one used to create the sdf1α:CFP-NTR plasmid,
which also lead to no adult founders. This could suggest that the original vector had some problem that
interfered with correct transgenesis. For this reason, we sub-cloned gfap:GFP sequence in a different
NTR vector to generate the Tg(gfap:GFP-NTR). With this construct, we obtained a considerable amount
of GFP-positive embryos with expression in the eye, which are currently growing to be screened for
founders.
If we are able to successfully generate the MGs ablation line, our main goal will be to ablate these cells
and induce damage in the photoreceptors in order to assess whether the retina is able to compensate for
the lack of MGs and, if so, what cell types are activated to ensure normal retina regeneration. In mouse,
the ablation of MGs led to retinal disorganization, thinner ONL, photoreceptors death and vascular
changes, like excessive blood vessel proliferation, leading to reduced retinal function [41]. This suggests
that loss of MGs may lead to retinal degenerative diseases. We expect to observe similar structural
problems and impairment in the regeneration of photoreceptors. If the regeneration is not compromised,
that might indicate that other cellular sources are able to compensate the absence of MGs. As soon as
we validate the line, we will be able to answer these questions and understand more about this
regenerative process.
4.2.2 – Exploring a possible role of the Hippo/Yap signalling pathway during
photoreceptors regeneration
The role of Hippo signalling pathway has recently been associated with tissue regeneration. In Xenopus
and zebrafish DN-yap inhibits the regeneration of the hindlimb and caudal fin, respectively, by
compromising cell proliferation in the blastema [44]. In mice, for instance, Yap deletion can abolish the
regenerative capacity of neonatal heart, while its overexpression in adults promotes entry of non-
dividing cells into the cell cycle, triggering proliferation of cardiomyocytes upon heart injury [43]. In
addition, our lab has demonstrated that the pathway effector Yap contributes to zebrafish caudal fin
regeneration by controlling cell proliferation in the blastema [46]. Data from the lab also showed that
Yap is present in MGs of differentiated retina in larvae (Figure 12), where it appears to be required to
regulate photoreceptors regeneration. Consequently, we decided to investigate if Yap could have a role
during adult retina regeneration.
In order to specifically damage the zebrafish retina and induce regeneration, we first reproduced in our
laboratory a well described light-induced injury assay that consists in specifically damaging the
photoreceptors by UV exposure. It is known that this leads to a quick and progressive death of
photoreceptors triggering a regenerative response in which MGs near the injury dedifferentiate (first 24
hours post-UV). During this process they reduce the expression of differentiation markers, like gs or
gfap, re-enter cell cycle and give origin to neuronal progenitor cells (from 1 to 3dpUV). These
progenitors will then migrate to the ONL where they proliferate and start to differentiate to replace the
lost photoreceptors (around 5dpUV). This process can last from 20 to 30 days, depending on the
extension of the lesion [40, 67]. We confirmed the set of these events by performing the UV injury assay

- 30 -
in adult WT fish. We were able to induce damage to the photoreceptors and, as a readout, we observed
a decrease in the levels of GS and increase in the number of PCNA-positive cells in the INL (at 3dpUV)
and later in the ONL (at 6dpUV) (Figure 14). The addressed time-points did not allow us to observe
complete photoreceptor regeneration (Figure 13), reason why we will need to increase this temporal
window. However, we successfully established the light-injury assay and observed some of the expected
features of the regenerative process.
In order to explore if Yap is required during retina regeneration, we decided to induce photoreceptors
damage in adult DN-yap zebrafish. When compared to WT control, we observed that photoreceptor
damage progressed in a similar way in DN-yap at least until the addressed time-points (6dpUV). GS
levels appear to decrease around the same time (3dpUV) in both cases, suggesting that Yap is not
necessary for MGs to dedifferentiate, as mentioned above. Cells also appear to start proliferating at the
same time in the INL (3dpUV) and then in the ONL (6dpUV) in both cases (Figure 15), indicating that
Yap may not be required to regulate the initial proliferation of progenitor cells.
So far we had only detected Yap in the MGs during embryonic and larval stages. We also aimed to
localize Yap in the adult retina, but we never detected any signal by immunostaining (data not shown).
This could indicate that Yap is not necessary in adult MGs during homeostasis. To address if Yap is
only active in MGs in a context of regeneration, we performed Yap immunostainings in lesioned retinas,
from 1-6dpUV, but unfortunately we did not observe Yap in the retina. This lead us to speculate that
either the immunostaining protocol needs to be further optimized to detect Yap in this adult tissue, or it
could mean that in fact Yap is not localized in the adult retina and is not required for the initial steps of
regeneration. A recent study revealed the transcriptome profile of zebrafish MGs at 8 and 16 hours post
photoreceptor lesion, when these cells are still dedifferentiating. The aim was to identify gene changes
associated with stem cell properties of MGs. Of notice, is the fact that no changes were reported in the
Hippo pathway [67], suggesting that this pathway may not have a role during the first steps of retina
regeneration. Nevertheless, these results do not exclude a possible role of Yap during photoreceptor
differentiation. To evaluate this, we need to increase our sample size and extend the time-points for
tissue collection.
In alternative to the DN-yap transgenic line we will also use a yap null-/- mutant, established in the lab
in collaboration with Dr. Didier Stanier. This mutant has a stop codon in the middle of the TEAD BD,
leading to an early truncation of the protein. Using this mutant, we will be able to fully confirm if an
intrinsic absence of Yap leads to any impairment in neural retina regeneration. In addition, we have a
complementary approach where we will also address if an increase of Yap signalling influences
regeneration. For that we are using a transgenic line where a heatshock promoter is controlling the
expression of a constitutively active form of Yap, Tg(hsp70:RFP-CAyap). This form of Yap has a
mutation in phosphorylation sites, allowing CA-yap to always enter the nucleus and activate target genes
expression. We also plan on using a promoter-reporter line of a well characterized Yap target gene, the
connective tissue growth factor a (ctgfa) [68], which levels have been detected to increase in CA-yap
fish in the context of caudal fin regeneration [46]. Considering this, we aim to characterize ctgfa
activation in adult Tg(ctgfa:EGFP) retinas during homeostasis and upon light injury. If ctgfa is produced
upon damage, it may suggest that Yap is required during neural retina regeneration. It is however
important to mention that ctgfa is also regulated by other pathways, like Wnt or Tgfβ, and therefore a
positive presence of ctgfa does not guarantee a role of Yap in neural retina regeneration.
- 31 -
4.3 – Concluding Remarks
In this project we studied the regeneration of the skeletal system, aiming to uncover the sources with the
potential to originate new osteoblasts upon mature osteoblast ablation. One of our main candidates were
pericytes. We decided to generate tools that could unravel their contribution to the regenerative process,
and tried to generate a pericyte ablation line and established a pericyte lineage-tracing line soon to be
tested. However, we also demonstrated evidence that the epidermal and mesenchymal cells, present
adjacent to the bone surface, strongly respond to osteoblasts ablation and seem to produce new osteo-
progenitors. In the future we would like to test the requirement of pericytes, epidermis and mesenchyme
to bone regeneration by using ablation and lineage tracing transgenic lines. Importantly, we also would
like to understand if these populations can contribute to bone repair in a normal tissue regeneration
context or if they are normally inactive and are triggered only upon osteoblast ablation. Importantly, in
mammals, new osteoblasts arise from MSC but, along life, their availability tends to decrease becoming
progressively more scarce. Also, in some osteogenic disorders, like osteoporosis, the lack of osteoblasts
can lead to bone fragility and fracture. It is therefore important to discover new potential osteogenic
sources, that could assist in bone remodelling and in producing new osteoblasts, during ageing and
during fracture healing.
We also studied the regeneration of one component of the CNS, the neural retina. A key constituent of
this structure are MGs, responsible for conferring structural stability in mammals and zebrafish, but also
being capable of regenerating the neural retina in the latter. However, how this regenerative process
unveils in their absence has never been studied, and therefore we aimed at generating a MGs ablation
line. Retinopathies, like the aforementioned Retinitis Pigmentosa, which leads to photoreceptor loss,
can cause severe visual impairments in humans. Thus, it is of extreme interest to discover which
pathways regulate the dedifferentiation and proliferation of MGs in zebrafish in hope of developing
possible treatments. For that reason, we also choose to address if the Hippo pathway effector Yap had a
role in neural retina regeneration. We show that Yap does not seem to be important for MGs
dedifferentiation and proliferation phase, but this does not exclude a possible role of Yap at latter time-
points during photoreceptor differentiation. Thus, we need to broaden our tissue collection time-points
after retinal lesion to answer this question.
In conclusion, our efforts in investigating the processes of the caudal fin and neural retina regeneration
led to the establishment of new lines and techniques that can assist us in future experiments. Deciphering
the cell types that can potentially be differentiated towards osteoblastogenesis, how neural retina
regenerates and the pathways that contribute to this process in vivo, may have a wide range of
implications. This could help, in the future, to promote more efficient strategies to improve the
regenerative capacity of these tissues in mammalian systems. Therefore, we expect that this study will
further illuminate the cellular and molecular mechanisms that regulate bone and neural retina
regeneration in zebrafish and contribute to the field of regenerative medicine.

- 32 -
Chapter 5 – Bibliography
1. Tornini, V. A. & Poss, K. D. Keeping at arm’s length during regeneration. Dev. Cell 29, 139–
145 (2014).
2. Tanaka, E. M. & Reddien, P. W. The Cellular Basis for Animal Regeneration. Dev. Cell 21, 172–
185 (2011).
3. Poss, K. D. Advances in understanding tissue regenerative capacity and mechanisms in animals.
Nat. Rev. Genet. 11, 710–722 (2010).
4. King, R. S. & Newmark, P. A. The cell biology of regeneration. J. Cell Biol. 196, 553–562
(2012).
5. Riehle, K. J. et al. New Concepts in Liver Regeneration. J. Gastroenterol. Hepatol. 26, 203–
212 (2011).
6. Gurtner, G. et al. Wound repair and regeneration. Nature 453, 314–321 (2008).
7. Jopling, C. et al. Dedifferentiation, transdifferentiation and reprogramming: three routes to
regeneration. Nat. Rev. Mol. Cell Biol. 12, 79–89 (2011).
8. Bergmann, A. & Steller, H. Apoptosis, stem cells, and tissue regeneration. Sci. Signal. 3, 1–8
(2010).
9. Shi, W. C. et al. Using zebrafish as the model organism to understand organ regeneration. Sci.
China Life Sci. 58, 343–351 (2015).
10. Gemberling, M. et al. The zebrafish as a model for complex tissue regeneration. Trends Genet.
29, 611–620 (2013).
11. Marí-Beffa, M. et al. Zebrafish fins as a model system for skeletal human studies. Sci. World J.
3, 1114–1127 (2007).
12. Soroldoni, D. et al. Simple and Efficient Transgenesis with Meganuclease Constructs in
Zebrafish. Zebrafish 546, 117–130 (2009).
13. Azevedo, A. et al. The regenerative capacity of the zebrafish caudal fin is not affected by
repeated amputations. PLoS One 6, 1–8 (2011).
14. Marí-Beffa, M. et al. Histochemically defined cell states during tail fin regeneration in teleost
fishes. Differentiation 60, 139–149 (1996).
15. Becerra, J. et al. Structure of the tail fin in teleosts. Cell Tissue Res. 230, 127–137 (1983).
16. Morgan, T. H. Regeneration. New York Macmillan Co. (1901).
17. Chablais, F. & Jazwinska, A. IGF signaling between blastema and wound epidermis is required
for fin regeneration. Development 137, 871–879 (2010).
18. Kawakami, A. Stem cell system in tissue regeneration in fish. Dev. Growth Differ. 52, 77–87
(2010).
19. Stewart, S. & Stankunas, K. Limited dedifferentiation provides replacement tissue during
zebrafish fin regeneration. Dev. Biol. 365, 339–349 (2012).

- 33 -
20. Brown, A. M. et al. Osteoblast maturation occurs in overlapping proximal-distal compartments
during fin regeneration in zebrafish. Dev. Dyn. 238, 2922–2928 (2009).
21. Sousa, S. et al. Differentiated skeletal cells contribute to blastema formation during zebrafish fin
regeneration. Development 138, 3897–3905 (2011).
22. Knopf, F. et al. Bone regenerates via dedifferentiation of osteoblasts in the zebrafish fin. Dev.
Cell 20, 713–724 (2011).
23. Tu, S. & Johnson, S. L. Fate restriction in the growing and regenerating zebrafish fin. Dev. Cell
20, 725–732 (2011).
24. Singh, S. P. et al. Regeneration of Amputated Zebrafish Fin Rays from De Novo Osteoblasts.
Dev. Cell 22, 879–886 (2012).
25. Bielby, R., Jones, E. & McGonagle, D. The role of mesenchymal stem cells in maintenance and
repair of bone. Injury 38, 26–32 (2007).
26. Crisan, M. et al. A Perivascular Origin for Mesenchymal Stem Cells in Multiple Human Organs.
Cell Stem Cell 3, 301–313 (2008).
27. Bergers, G. & Song, S. The role of pericytes in blood-vessel formation and maintenance. Neuro.
Oncol. 7, 452–464 (2005).
28. Lund, T. C. et al. Sdf1 expression reveals a source of perivascular-derived mesenchymal stem
cells in zebrafish. Stem Cells 32, 2767–2779 (2014).
29. Ando, K. et al. Clarification of mural cell coverage of vascular endothelial cells by live imaging
of zebrafish. Development 1328–1339 (2016).
30. Fleisch, V. C. et al. Investigating regeneration and functional integration of CNS neurons:
Lessons from zebrafish genetics and other fish species. Biochim. Biophys. Acta - Mol. Basis Dis.
1812, 364–380 (2011).
31. Hamon, A. et al. Müller glial cell-dependent regeneration of the neural retina: An overview
across vertebrate model systems. Dev. Dyn. (2015).
32. Strauss, O. The Retinal Pigment Epithelium in Visual Function. Physiol. Rev. 85, 845–881
(2005).
33. Centanin, L. & Wittbrodt, J. Retinal neurogenesis. Development 141, 241–4 (2014).
34. Franze, K. et al. Muller cells are living optical fibers in the vertebrate retina. Proc. Natl. Acad.
Sci. 104, 8287–8292 (2007).
35. Raymond, P. et al. Molecular characterization of retinal stem cells and their niches in adult
zebrafish. BMC Dev. Biol. 6, 1–17 (2006).
36. Bernardos, R. L. et al. Late-Stage Neuronal Progenitors in the Retina Are Radial Muller Glia
That Function as Retinal Stem Cells. J. Neurosci. 27, 7028–7040 (2007).
37. Fausett, B. V. & Goldman, D. A Role for α1 Tubulin-Expressing Muller Glia in Regeneration of
the Injured Zebrafish Retina. J. Neurosci. 26, 6303–6313 (2006).
38. Goldman, D. Müller glial cell reprogramming and retina regeneration. Nat. Rev. Neurosci. 15,
431–42 (2014).
- 34 -
39. Fimbel, S. M. et al. Regeneration of inner retinal neurons after intravitreal injection of ouabain
in zebrafish. J. Neurosci. 27, 1712–1724 (2007).
40. Thummel, R. et al. Characterization of Müller glia and neuronal progenitors during adult
zebrafish retinal regeneration. Exp. Eye Res. 87, 433–444 (2009).
41. Byrne, L. C. et al. AAV-Mediated, Optogenetic Ablation of Müller Glia Leads to Structural and
Functional Changes in the Mouse Retina. PLoS One 8, 1–13 (2013).
42. Yao, K. et al. Wnt Regulates Proliferation and Neurogenic Potential of Müller Glial Cells via a
Lin28/let-7 miRNA-Dependent Pathway in Adult Mammalian Retinas. Cell Rep. 17, 165–178
(2016).
43. Moya, I. M. & Halder, G. The Hippo pathway in cellular reprogramming and regeneration of
different organs. Curr. Opin. Cell Biol. 43, 62–68 (2016).
44. Juan, W. C. & Hong, W. Targeting the Hippo Signaling Pathway for Tissue Regeneration and
Cancer Therapy. Genes 7, 1–25 (2016).
45. Halder, G. & Johnson, R. L. Hippo signaling: growth control and beyond. Development 138, 9–
22 (2011).
46. Mateus, R. et al. Control of tissue growth by Yap relies on cell density and F-actin in zebrafish
fin regeneration. Development 142, 2752–2763 (2015).
47. Curado, S. et al. Conditional targeted cell ablation in zebrafish: A new tool for regeneration
studies. Dev. Dyn. 236, 1025–1035 (2007).
48. Curado, S. et al. Nitroreductase-mediated cell/tissue ablation in zebrafish: a spatially and
temporally controlled ablation method with applications in developmental and regeneration
studies. Nat. Protoc. 3, 948–954 (2008).
49. Rieger, S. Ablation of β-cells in Tg(ins :NTR-mCherry) transgenic zebrafish using
metronidazole. DiaComp Protoc. 2–3 (2013).
50. Kretzschmar, K. & Watt, F. M. Lineage tracing. Cell 148, 33–45 (2012).
51. Westerfield, M. The zebrafish book. A guide for the laboratory use of zebrafish (Danio rerio).
4th ed., Univ. of Oregon Press, Eugene (2000).
52. Thermes, V. et al. I-SceI meganuclease mediates highly efficient transgenesis in fish. Mech. Dev.
118, 91–98 (2002).
53. Kwan, K. M. et al. The Tol2kit: A multisite gateway-based construction Kit for Tol2 transposon
transgenesis constructs. Dev. Dyn. 236, 3088–3099 (2007).
54. Bernardos, R. L. & Raymond, P. A. GFAP transgenic zebrafish. Gene Expr. Patterns 6, 1007–
1013 (2006).
55. Glass, T. J. et al. Stromal cell – derived factor-1 and hematopoietic cell homing in an adult
zebrafish model of hematopoietic cell transplantation. Blood 118, 766–774 (2011).
56. Lawson, N. D. & Weinstein, B. M. In vivo imaging of embryonic vascular development using
transgenic zebrafish. Dev. Biol. 248, 307–318 (2002).
- 35 -
57. Vihtelic, T. S. & Hyde, D. R. Light induced rod and cone cell death and regeneration in the adult
albino zebrafish (Danio rerio) retina. J. Neurobiol. 44, 289–307 (2000).
58. Thomas, J. L. et al. Characterization of multiple light damage paradigms reveals regional
differences in photoreceptor loss. Exp. Eye Res. 97, 105–116 (2012).
59. Vihtelic, T. S. et al. Retinal regional differences in photoreceptor cell death and regeneration in
light-lesioned albino zebrafish. Exp. Eye Res. 82, 558–575 (2006).
60. Weber, A. et al. Characterization of light lesion paradigms and optical coherence tomography as
tools to study adult retina regeneration in zebrafish. PLoS One 8, 1-21 (2013).
61. Gauron, C. et al. Sustained production of ROS triggers compensatory proliferation and is
required for regeneration to proceed. Sci. Rep. 3, 1-9 (2013).
62. Alford, A. I. et al. Extracellular matrix networks in bone remodeling. Int. J. Biochem. Cell Biol.
65, 20–31 (2015).
63. Kragl, M. et al. Cells keep a memory of their tissue origin during axolotl limb regeneration.
Nature 460, 60–65 (2009).
64. Lee, R. T. H. et al. Basal keratinocytes contribute to all strata of the adult zebrafish epidermis.
PLoS One 9, 1–11 (2014).
65. Fischer, B. et al. p53 and TAp63 Promote Keratinocyte Proliferation and Differentiation in
Breeding Tubercles of the Zebrafish. PLoS Genet. 10, 1–17 (2014).
66. Dufourcq, P. & Vriz, S. The chemokine SDF-1 regulates blastema formation during zebrafish
fin regeneration. Dev. Genes Evol. 216, 635–639 (2006).
67. Sifuentes, C. J. et al. Rapid, Dynamic Activation of Müller Glial Stem Cell Responses in
Zebrafish. Investig. Opthalmology Vis. Sci. 57, 5148–5160 (2016).
68. Zhao, B. et al. TEAD mediates YAP-dependent gene induction and growth control TEAD
mediates YAP-dependent gene induction and growth control. Genes Dev. 22, 1962–1971 (2008).

- 36 -
Attachments
Supplementary table 1 – List of zebrafish lines used in the project
Zebrafish Lines Abbreviation Description
Wild-type AB WT Wild-type strain
Tg(gfap:GFP) gfap:GFP Reporter line: expresses GFP in
glial cells
Tg(hsp70l:RFP-dnyap1) DN-yap
Heatshock inducible transgenic
line: activates a dominant negative
form of Yap upon heatshock
Tg(ola.Bglap:EGFP) osc:EGFP Reporter line: expresses EGFP in
mature osteoblasts
Tg(osterix:mCherry-NTRo)pd46 osx:NTR
Osteoblasts ablation line: expresses
mCherry in osteoblasts; used to
induce specific osteoblast ablation
Tg(sdf-1α:DsRed2) sdf1α:DsRed2 Reporter line: expresses DsRed in
pericytes
Tg(fli1a:EGFP) fli11a:EGFP Reporter line: expresses EGFP in
endothelial cells
Tg(β-actin2:loxP-DsRed-loxP-
GFP) β-act2:RSG
Reporter line: expresses DsRed in
every cell. Allows for
recombination
Transgenic lines generated Abbreviation
Description
Tg(sdf1α:CREERT2; crya-
α:VENUS) sdf1α:CRE
Lineage tracing line: Expresses
CREERT2 recombinase in cells that
express sdf1α promoter, including
pericytes

- 37 -
Supplementary table 2 – List of enzymes used for cloning
Plasmids Enzymes Product
Length
Purified
sequence Objective
ins:CFP-NTR HindIII (NEB) and
SmaI (NEB) 7500 bp CFP-NTR
To generate the
sdf1α:CFP-NTR and
gfap:CFP-NTR construct
sdf1α:dsRed AgeI (NEB) 8807 bp sdf1α:dsRed
To generate the
sdf1α:NTR-DsRed
construct
Transposase NotI (Thermo
Fisher Scientific) 6034 bp Transposase
To linearize transposase
plasmid for mRNA
transcription
col10a1:EGFP-
NTR
KpnI (NEB) and
XhoI (NEB) 3851 bp NTR
To generate the gfap:CFP-
NTR construct
sdf1α:CFP-
NTR
HindIII (NEB) and
SmaI (NEB)
1230 bp,
3160 bp and
7500 bp
- To confirm correct
insertion
Sdf1α:NTR-
DsRed AgeI (NEB)
640 bp and
9456 bp -
To confirm correct
insertion
gfap:CFP-NTR HindIII (NEB) and
SmaI (NEB)
3027 bp and
7500 bp -
To confirm correct
insertion
gfap:GFP-NTR KpnI (NEB) 3032 bp and
4603 bp -
To confirm correct
insertion
Supplementary table 3 – List of primers used for cloning
Gene Forward
Primer
Reverse
Primer
Annealing
temperature
Product
Length Objective
sdf1α GCTCACGCGTAA
GCTTCCAAACTT
TTCTGACGACTT
TGCTCACCATGAA
TTCGTTTGCAGTG
TGAAGAAGAG
60ºC 4383 bp
To generate the
sdf1α:CFP-NTR
construct
ntr
ACTGCAAACGGA
TCCACCGGTCAT
GGACATCATCAG
CGTG
GAGGCCATGGTG
GCGACCGGTGAG
GGTGATGTTCTGG
GGC
61ºC 640 bp
To generate the
sdf1α:NTR-
DsRed construct
gfap
GCTCACGCGTAA
GCTTCACCTTTG
GGATGTAGTGGA
ACG
ATTCCTGCAGCCC
GGGGAGGAACGC
TGGGACTCCAT
65ºC 3020 bp
To generate the
gfap:CFP-NTR
construct
gfap:GFP
GGCGAATTGGGT
ACCCACCTTTGG
GATGTAGTGGAA
CG
AAGCTTGAGCTCG
AGTCTTGTACAGC
TCGTCCATGCC
63ºC 3777 bp
To generate the
gfap:GFP-NTR
construct
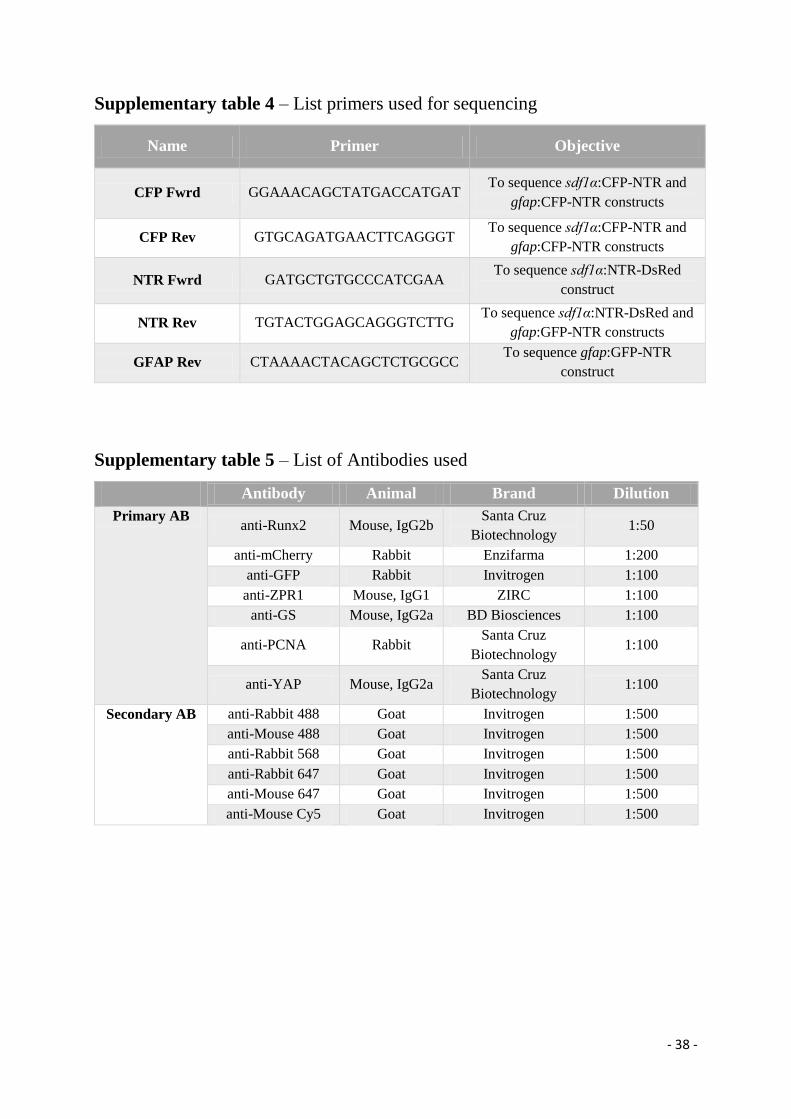
- 38 -
Supplementary table 4 – List primers used for sequencing
Name Primer Objective
CFP Fwrd GGAAACAGCTATGACCATGAT To sequence sdf1α:CFP-NTR and
gfap:CFP-NTR constructs
CFP Rev GTGCAGATGAACTTCAGGGT To sequence sdf1α:CFP-NTR and
gfap:CFP-NTR constructs
NTR Fwrd GATGCTGTGCCCATCGAA To sequence sdf1α:NTR-DsRed
construct
NTR Rev TGTACTGGAGCAGGGTCTTG To sequence sdf1α:NTR-DsRed and
gfap:GFP-NTR constructs
GFAP Rev CTAAAACTACAGCTCTGCGCC To sequence gfap:GFP-NTR
construct
Supplementary table 5 – List of Antibodies used
Antibody Animal Brand Dilution
Primary AB anti-Runx2 Mouse, IgG2b
Santa Cruz
Biotechnology 1:50
anti-mCherry Rabbit Enzifarma 1:200
anti-GFP Rabbit Invitrogen 1:100
anti-ZPR1 Mouse, IgG1 ZIRC 1:100
anti-GS Mouse, IgG2a BD Biosciences 1:100
anti-PCNA Rabbit Santa Cruz
Biotechnology 1:100
anti-YAP Mouse, IgG2a Santa Cruz
Biotechnology 1:100
Secondary AB anti-Rabbit 488 Goat Invitrogen 1:500
anti-Mouse 488 Goat Invitrogen 1:500
anti-Rabbit 568 Goat Invitrogen 1:500
anti-Rabbit 647 Goat Invitrogen 1:500
anti-Mouse 647 Goat Invitrogen 1:500
anti-Mouse Cy5 Goat Invitrogen 1:500
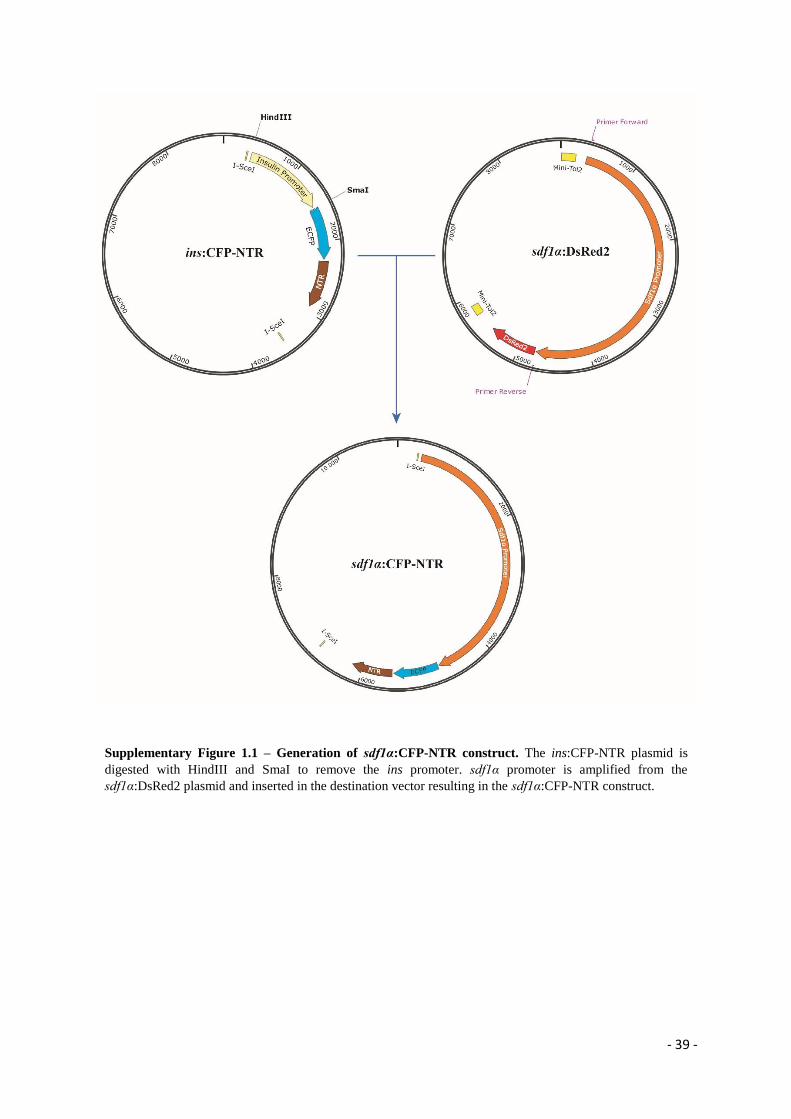
- 39 -
Supplementary Figure 1.1 – Generation of sdf1α:CFP-NTR construct. The ins:CFP-NTR plasmid is
digested with HindIII and SmaI to remove the ins promoter. sdf1α promoter is amplified from the
sdf1α:DsRed2 plasmid and inserted in the destination vector resulting in the sdf1α:CFP-NTR construct.

- 40 -
Supplementary Figure 1.2 – Creation of sdf1α:NTR-DsRed2 construct. The sdf1α:DsRed2 plasmid is
digested with AgeI. NTR sequence is amplified from the col10a1:GFP-NTR and inserted in the destination
vector generating the sdf1α:NTR-DsRed2 construct.

- 41 -
Supplementary Figure 1.3 – Creation of gfap:CFP-NTR construct. The ins:CFP-NTR plasmid is digested
with HindIII and and SmaI to remove the ins promoter. gfap promoter is amplified from the gfap:GFP plasmid
and inserted in the destination vector resulting the gfap:CFP-NTR construct.

- 42 -
Supplementary Figure 1.4 – Creation of gfap:GFP-NTR construct. The col10a1:GFP-NTR plasmid is
digested with KpnI and XhoI to remove the col10a1 promoter and the GFP sequence. gfap promoter and GFP
sequence is amplified from the gfap:GFP plasmid and inserted in the destination vector resulting the gfap:GFP-
NTR construct.

- 43 -
Supplementary Figure 2 –Schematic representation of the In-Fusion cloning strategy. (Step 1) Linearized
destination vector. (Step 2) Amplification of the gene of interest with primers that must contain a 15 base-pair
(bp) extension homology to the destination vector ends. (Step 3) Recombination between the homologous
sequences of the linearized vector with the PCR product. (Step 4) Transformation of E. coli with the new
construct. Adapted from In-Fusion® HD Cloning Kit User Manual.

- 44 -
Supplementary Figure 3 – Experimental setup of the UV light exposure. Adult zebrafish (up to 6 animals)
are placed inside a 250ml beaker, filled with 100mL of system water and covered with tin foil to reflect UV
light. This beaker is placed inside a 1000mL beaker with 200mL of system water. UV light source (~100k lux)
is placed 5cm away from the beaker.
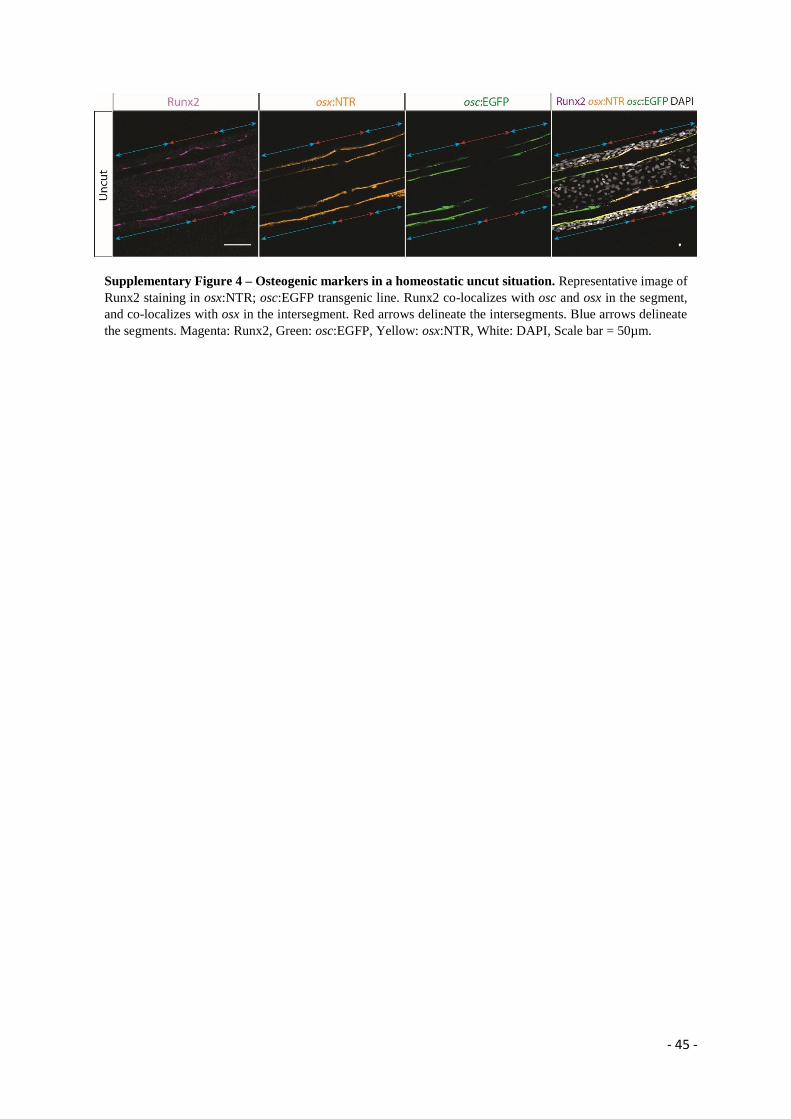
- 45 -
Supplementary Figure 4 – Osteogenic markers in a homeostatic uncut situation. Representative image of
Runx2 staining in osx:NTR; osc:EGFP transgenic line. Runx2 co-localizes with osc and osx in the segment,
and co-localizes with osx in the intersegment. Red arrows delineate the intersegments. Blue arrows delineate
the segments. Magenta: Runx2, Green: osc:EGFP, Yellow: osx:NTR, White: DAPI, Scale bar = 50µm.

- 46 -
Supplementary Figure 5 – Confirmation by restriction enzyme digestion of the correct cloning of the
ablation constructs (A) Digestion of sdf1α:CFP-NTR plasmids with HindIII and SmaI enzymes; desired
bands sizes correspond to 1230bp, 3160bp and 7500bp. (B) Digestion of sdf1α:NTR-DsRed plasmids with
AgeI enzyme; desired bands sizes correspond to 640bp and 9456bp. (C) Digestion of gfap:CFP-NTR plasmids
with HindIII and SmaI enzymes desired bands correspond to 3027bp and 7500bp. (D) Digestion of gfap:GFP-
NTR plasmids with KpnI enzyme; desired bands correspond to 3032bp and 4603bp). Green wells correspond
to digestions with bands of the desired size. White wells correspond to non-digested plasmids. Red wells
correspond to digestions with undesired size bands.

- 47 -
Supplementary Figure 6 – Yap and DN-yap protein structures. (A) WT Yap has a TEAD Binding Domain
(TEAD BD), two WW domains and a Transcriptional Activation Domain (TAD). Yap is phosphorylated at the
level of several serine residues (S21, S69, S87, S119 and S335) and thus prevented from entering the nucleus.
(B) Dominant-Negative form of Yap (DN-yap) with serines mutated into alanines, thus preventing Yap
phosphorylation. DN-yap goes to the nucleus and binds to TEAD regions however, due to a deletion of the
TAD, it will not activate its target genes. This DN-yap is under the control of a HS promoter and coupled to a
RFP for tracking. The sequence also contains a RFP under the control of a crya-β promoter for screening.