Embed Size (px)
Citation preview

INTERCORR2016_154
Copyright 2016, ABRACO
Trabalho apresentado durante o INTERCORR 2016, em Búzios/RJ no mês de maio de 2016.
As informações e opiniões contidas neste trabalho são de exclusiva responsabilidade do(s) autor(es).
_________________________________________________________________________________________ a Engenheiro de Materiais – Laboratório de Corrosão, Proteção e Reciclagem de Materiais/UFRGS
b PHD; Professor – Laboratório de Corrosão, Proteção e Reciclagem de Materiais/UFRGS
c PHD; Professora – Laboratório de Corrosão, Proteção e Reciclagem de Materiais/UFRGS
Aluminium leaching during tribocorrosion in acidic, alkaline and neutral
solutions: cooking simulation
Giovanni U. Brunoa, Álvaro Meneguzzi
b, Jane Zoppas Ferreira
c
Abstract
Some studies suspect that aluminium, among other elements, could cause dementia or some
cognitive impairment in human beings as consequence from long exposures to the
environment. This survey intended to measure how much aluminium is lixiviated during the
cooking process with aluminium pots. The study considered pH variation, working in acidic,
alkaline and neutral solutions. A tribometer equipment simulated the wear made by a kitchen
spoon, often used during food preparation, and these simulations were inside compartments
containing these solutions. After the simulation, the solutions were collected and analyzed by
atomic absorption spectroscopy to verify the present aluminium quantity. It’s possible to state
from this study that the use of aluminium pots should be restricted. If used deliberately, it
liberates high amounts of aluminium into the food, above the provisional tolerable weekly
intake (WHO). This study didn’t consider high temperatures as parameters. It’s known that
temperature raise makes the environment more aggressive, having more dissolution power
and solubilization capacity.
keywords: aluminium, aluminum, tribometer, tribocorrosion.
Introduction
Some studies suspect that aluminium, among other elements, could cause dementia or some
cognitive impairment in human beings as consequence from long exposures to the
environment (1) (2). As aluminium is the most abundant metallic element in the earth’s crust
(around 8%), it’s common to find it in many different ways in nature: Silicates, oxides and
hydroxides, combined with other elements, and complexes with organic matter. It’s correct,
therefore, to state that we are well adapted to live in an environment rich in aluminium. The
aluminium entry into the human body can occur in many different ways, between food,
medications and even drinking water (3). According to the World Health Organization
(WHO) (4), the provisional tolerable weekly intake (PTWI) for aluminium from all sources,
established by the Joint FAO/WHO Expert Committee on Food Additives (JECFA), is 1
mg/kg of body weight, including additives.
INTERCORR2016_154
2
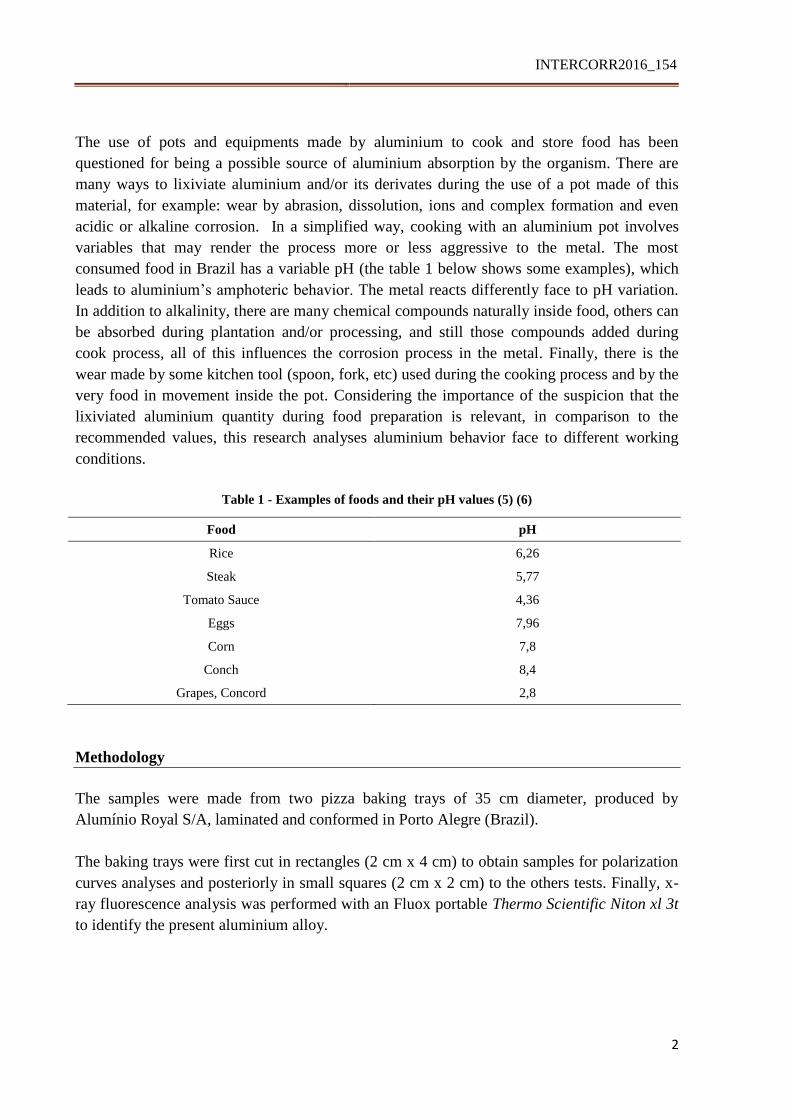
The use of pots and equipments made by aluminium to cook and store food has been
questioned for being a possible source of aluminium absorption by the organism. There are
many ways to lixiviate aluminium and/or its derivates during the use of a pot made of this
material, for example: wear by abrasion, dissolution, ions and complex formation and even
acidic or alkaline corrosion. In a simplified way, cooking with an aluminium pot involves
variables that may render the process more or less aggressive to the metal. The most
consumed food in Brazil has a variable pH (the table 1 below shows some examples), which
leads to aluminium’s amphoteric behavior. The metal reacts differently face to pH variation.
In addition to alkalinity, there are many chemical compounds naturally inside food, others can
be absorbed during plantation and/or processing, and still those compounds added during
cook process, all of this influences the corrosion process in the metal. Finally, there is the
wear made by some kitchen tool (spoon, fork, etc) used during the cooking process and by the
very food in movement inside the pot. Considering the importance of the suspicion that the
lixiviated aluminium quantity during food preparation is relevant, in comparison to the
recommended values, this research analyses aluminium behavior face to different working
conditions.
Table 1 - Examples of foods and their pH values (5) (6)
Food pH
Rice 6,26
Steak 5,77
Tomato Sauce 4,36
Eggs 7,96
Corn 7,8
Conch 8,4
Grapes, Concord 2,8
Methodology
The samples were made from two pizza baking trays of 35 cm diameter, produced by
Alumínio Royal S/A, laminated and conformed in Porto Alegre (Brazil).
The baking trays were first cut in rectangles (2 cm x 4 cm) to obtain samples for polarization
curves analyses and posteriorly in small squares (2 cm x 2 cm) to the others tests. Finally, x-
ray fluorescence analysis was performed with an Fluox portable Thermo Scientific Niton xl 3t
to identify the present aluminium alloy.
INTERCORR2016_154
3
The Solutions
Three solutions were made to the analysis as shown at table 2. The objective is to simulate
three situations that make the material behave differently. An acidic, an alkaline and a neutral
solution with chlorides.
Table 2 - The solutions used to simulate different food environments
Solution Concentration (mol/L) pH
NaCl 0,1 7
CH3COOH 0,1 2,6
NaOH 0,1 12,5
Polarization Curves
The curves were performed in the three different solutions, using an Autolab equipment,
suiting up parameters for each case. To the acidic and the neutral solutions the curves ranged
from -1,6 V to 1,0 V and to the alkaline solution ranged from -1,9 to -1,0 V. The analysis
were performed with a scan rate of 0,02 V/s.
For each experiment a rectangular sample was degreased uniformly with detergent and a soft
sponge for five minutes. An electrochemical cell was prepared for each sample, remaining in
contact with the solution during ten minutes before the analysis. The cell kept exposed to the
solution a round surface of the sample of 0,62 cm².
Tribology
The abrasion tests were performed following ASTM G 133 standards, with a tribometer
CETR – Test Equipment Tribology, with ball on plate method. The wear procedure were
performed by an alumina sphere (4,7 mm of diameter), with a constant force of 1 N, in a
frequency of 2 Hz, covering a 2 mm track repeatedly during 20 minutes. The open circuit
potentials (OCP) were also measured 20 minutes before, during and 20 minutes after the
abrasion analysis.
The samples were immersed and rubbed inside 30 ml of each solution previously announced,
varying the coefficient of friction in each essay. At the end, the solutions were collected to
further tests.
INTERCORR2016_154
4
Atomic Absorption Spectroscopy (AAS)
The solutions collected in the end of tribology tests were submitted to atomic absorption
spectroscopy analysis at the Ecology Center of Biosciences Institute at the Universidade
Federal do Rio Grande do Sul (UFRGS).
The tests were performed with AAS/nitrous oxide-acetylene flame methodology and the
collected sample from the alkaline solution was neutralized with nitric acid before the
spectroscopy essay. The samples were submitted to aluminium detection and the used method
had a detection limit of 0,077 mg/L.
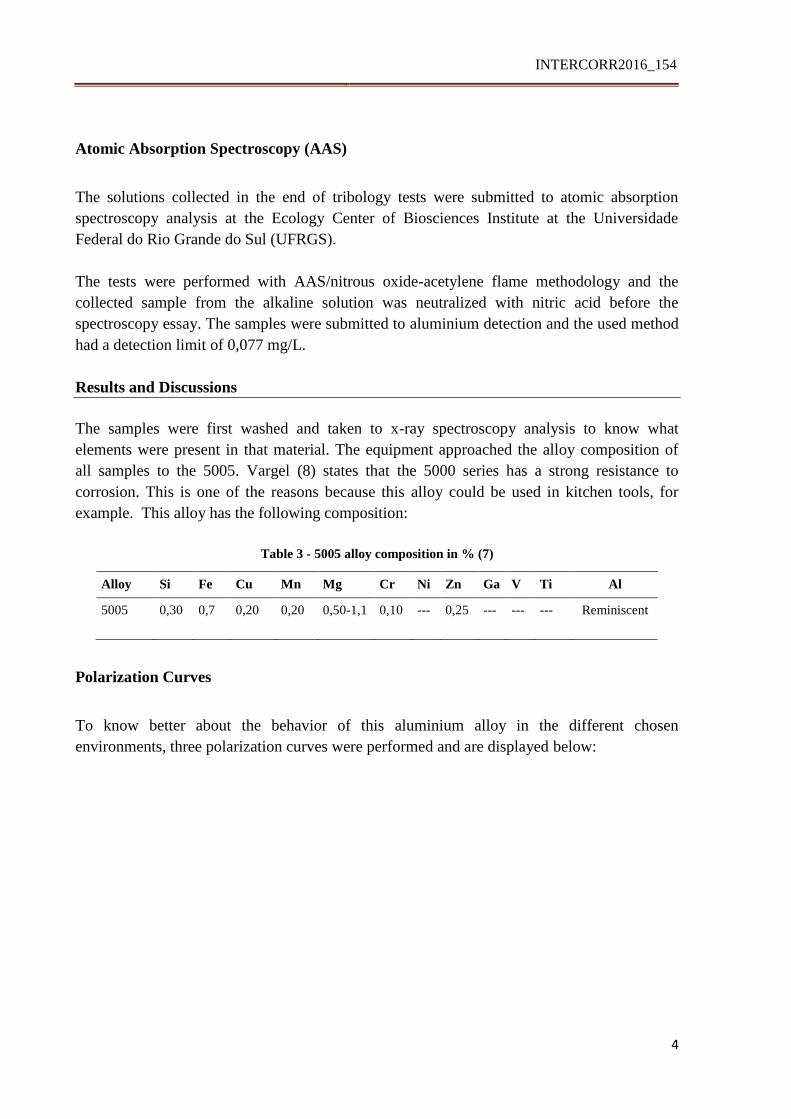
Results and Discussions
The samples were first washed and taken to x-ray spectroscopy analysis to know what
elements were present in that material. The equipment approached the alloy composition of
all samples to the 5005. Vargel (8) states that the 5000 series has a strong resistance to
corrosion. This is one of the reasons because this alloy could be used in kitchen tools, for
example. This alloy has the following composition:
Table 3 - 5005 alloy composition in % (7)
Alloy Si Fe Cu Mn Mg Cr Ni Zn Ga V Ti Al
5005 0,30 0,7 0,20 0,20 0,50-1,1 0,10 --- 0,25 --- --- --- Reminiscent
Polarization Curves
To know better about the behavior of this aluminium alloy in the different chosen
environments, three polarization curves were performed and are displayed below:
INTERCORR2016_154
5
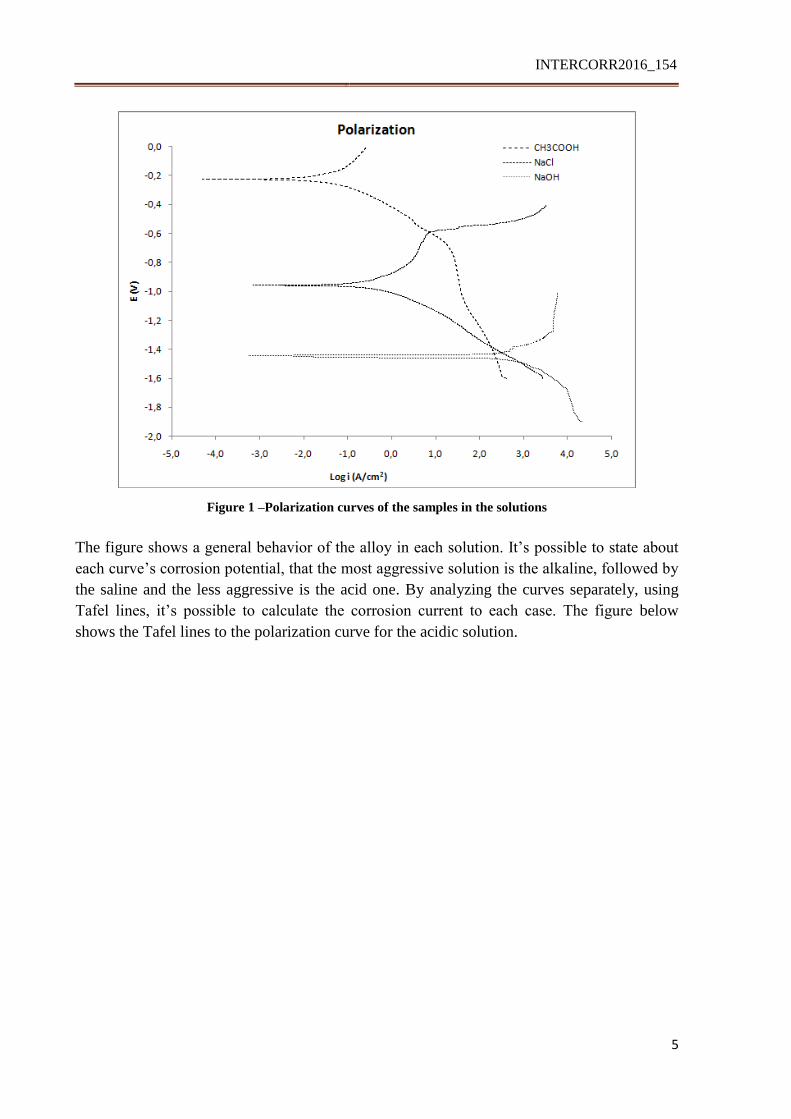
Figure 1 –Polarization curves of the samples in the solutions
The figure shows a general behavior of the alloy in each solution. It’s possible to state about
each curve’s corrosion potential, that the most aggressive solution is the alkaline, followed by
the saline and the less aggressive is the acid one. By analyzing the curves separately, using
Tafel lines, it’s possible to calculate the corrosion current to each case. The figure below
shows the Tafel lines to the polarization curve for the acidic solution.

INTERCORR2016_154
6
Figure 2 - Tafel lines of the anodic and cathodic curves of the metal in acetic acid
The intersection point of the two Tafel lines indicates the logarithm of the corrosion current,
log icorr = -0,5584 mA/cm². The figure below shows the intersection of the Tafel lines to the
saline solution.
INTERCORR2016_154
7
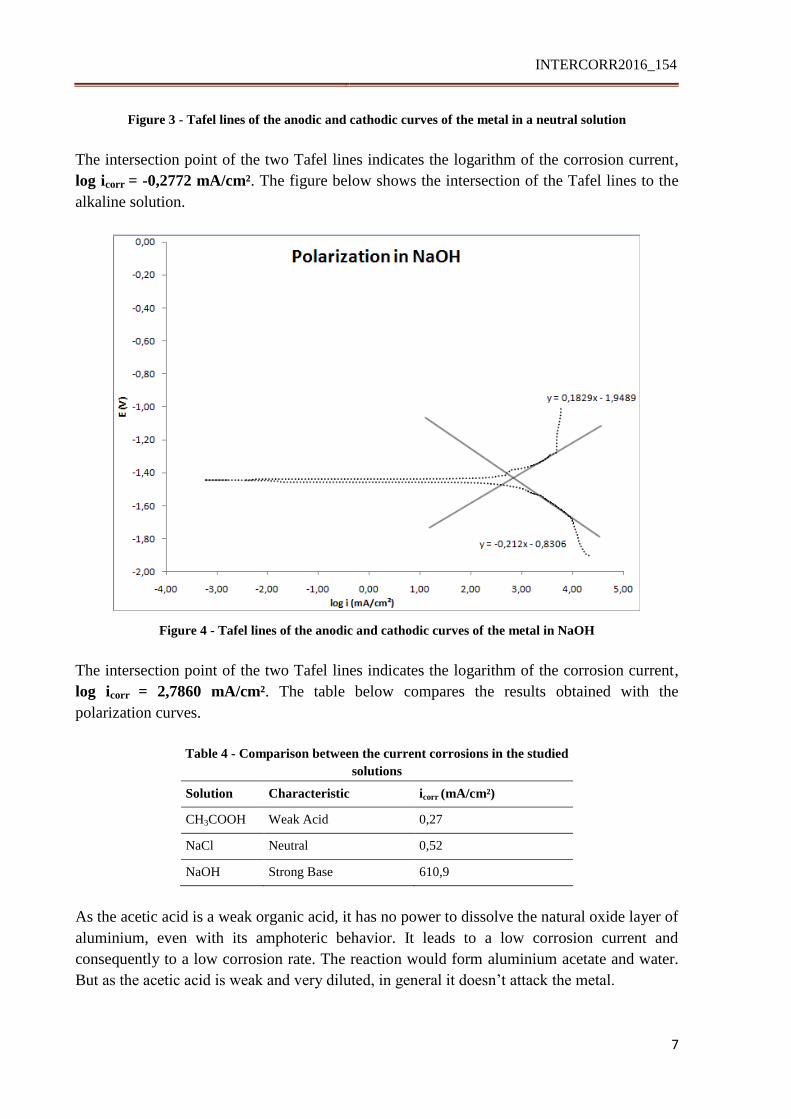
Figure 3 - Tafel lines of the anodic and cathodic curves of the metal in a neutral solution
The intersection point of the two Tafel lines indicates the logarithm of the corrosion current,
log icorr = -0,2772 mA/cm². The figure below shows the intersection of the Tafel lines to the
alkaline solution.
Figure 4 - Tafel lines of the anodic and cathodic curves of the metal in NaOH
The intersection point of the two Tafel lines indicates the logarithm of the corrosion current,
log icorr = 2,7860 mA/cm². The table below compares the results obtained with the
polarization curves.
Table 4 - Comparison between the current corrosions in the studied
solutions
Solution Characteristic icorr (mA/cm²)
CH3COOH Weak Acid 0,27
NaCl Neutral 0,52
NaOH Strong Base 610,9
As the acetic acid is a weak organic acid, it has no power to dissolve the natural oxide layer of
aluminium, even with its amphoteric behavior. It leads to a low corrosion current and
consequently to a low corrosion rate. The reaction would form aluminium acetate and water.
But as the acetic acid is weak and very diluted, in general it doesn’t attack the metal.
INTERCORR2016_154
8
In the case of the saline solution, the present ions make the environment more aggressive.
However, among the common metals, aluminium presents the best resistance to sodium
chloride. Salt favors pitting corrosion. The pitting density decreases with the raise of salt
concentration in the solution. As well, as expected to a saline solution, it was evidenced in the
curve a protrusion relative to pitting corrosion.
In the third case, the alkaline solution, the natural aluminium oxide layer is dissolved. It leads
to a considerable raise of corrosion current and consequently at corrosion rate of the metal,
which remains exposed to corrosive environment.
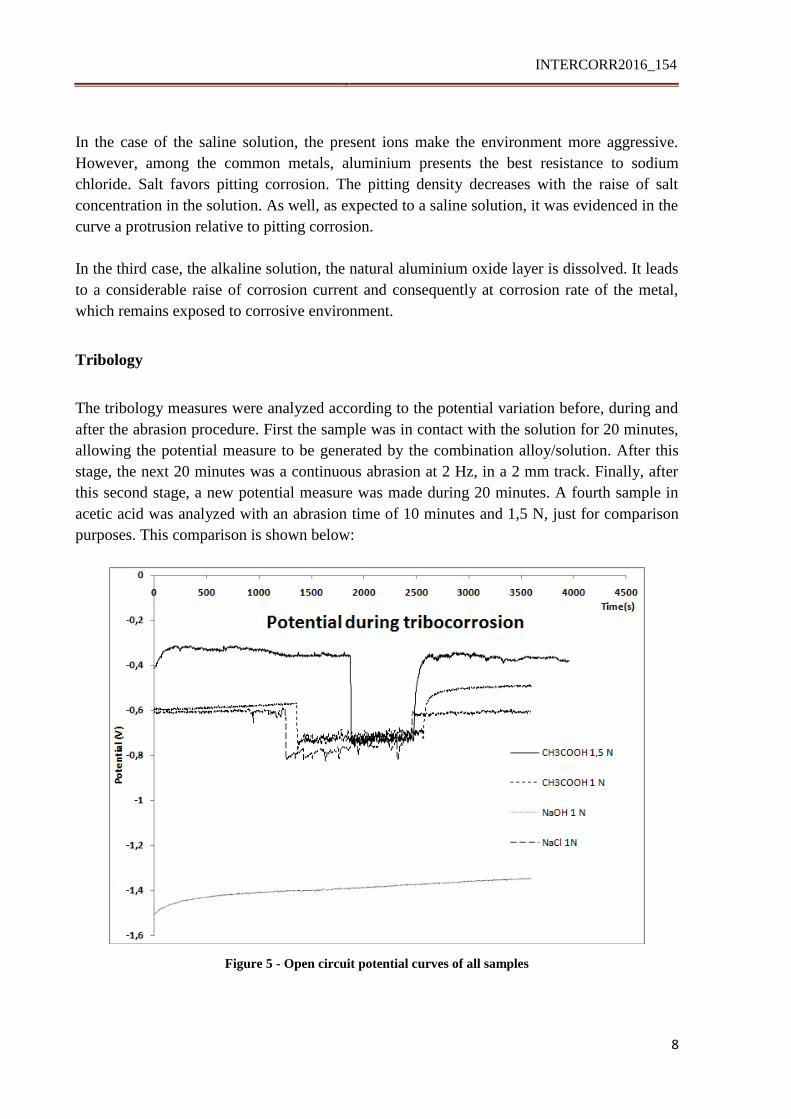
Tribology
The tribology measures were analyzed according to the potential variation before, during and
after the abrasion procedure. First the sample was in contact with the solution for 20 minutes,
allowing the potential measure to be generated by the combination alloy/solution. After this
stage, the next 20 minutes was a continuous abrasion at 2 Hz, in a 2 mm track. Finally, after
this second stage, a new potential measure was made during 20 minutes. A fourth sample in
acetic acid was analyzed with an abrasion time of 10 minutes and 1,5 N, just for comparison
purposes. This comparison is shown below:
Figure 5 - Open circuit potential curves of all samples

INTERCORR2016_154
9
It’s possible to notice that in both cases with acetic acid, there is a potential decrease during
the abrasion. That’s because the protector aluminium oxide layer was broken. At the
beginning of the analysis, the oxide thickness was different, but over time the curves are
headed to same value on balance with the solution.
In contact with the saline solution, the behavior was very similar to the acid solution.
However, the measures during the abrasion were more unstable, indicating a quicker
formation of the oxide layer. In this way, each time the track was made, a little oxide layer
was formed.
In the alkaline solution, the environment even allows the oxide layer to form. In a sufficiently
alkaline solution it’s dissolved and the metal becomes exposed to corrosion. It’s noticed that
the abrasion doesn’t chance the sample’s potential.
Coefficient of Friction
During the essays of tribology, the coefficients of friction were extracted between the alumina
sphere and the analyzed samples. A comparison of the values is found at the graphic below:
Figure 6 - Comparison between the coefficients of friction
The applied force by the equipment influences directly at the coefficient of friction and at the
curve stability for each solution. In acidic solution, the curve is very unstable, what shows the
INTERCORR2016_154
10
influence of the constant formation of the oxide layer during the abrasion process. In alkaline
solution, as the oxide layer is dissolved, the coefficient of friction varies a lot less. Finally, in
the saline solution there is certain stability. This may occur because the environment is less
aggressive and there is a quicker formation of the oxide layer.
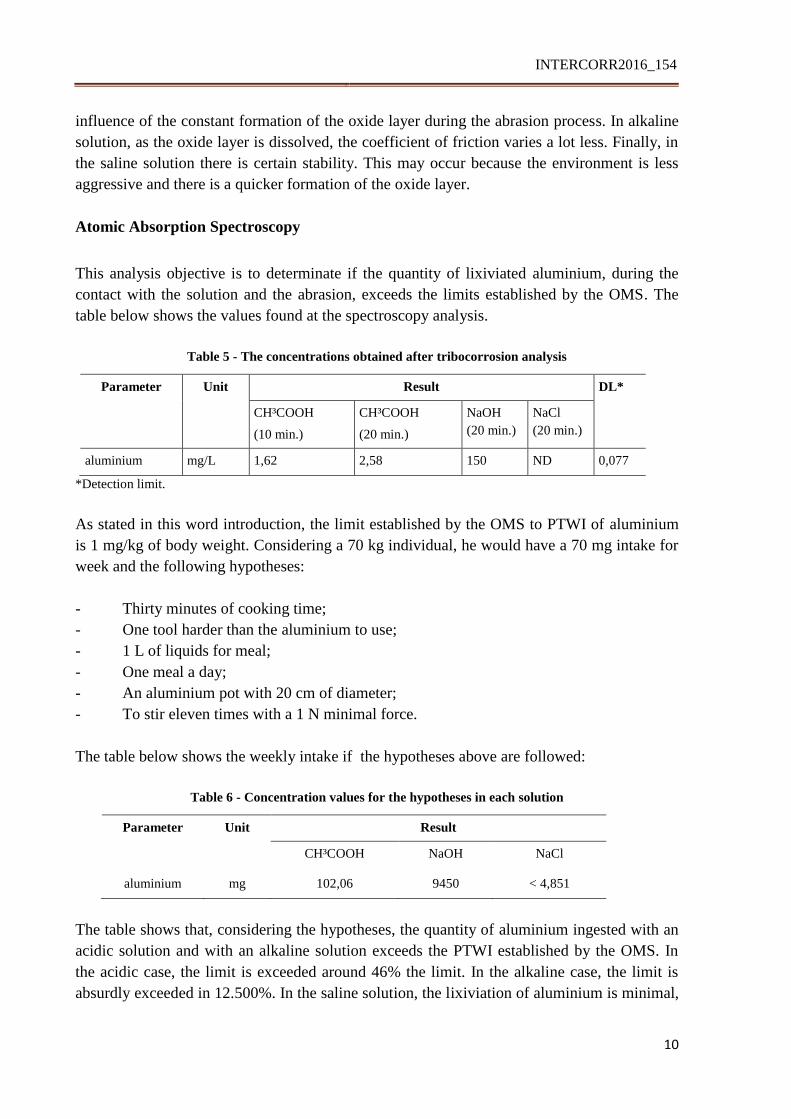
Atomic Absorption Spectroscopy
This analysis objective is to determinate if the quantity of lixiviated aluminium, during the
contact with the solution and the abrasion, exceeds the limits established by the OMS. The
table below shows the values found at the spectroscopy analysis.
Table 5 - The concentrations obtained after tribocorrosion analysis
Parameter Unit Result DL*
CH³COOH
(10 min.)
CH³COOH
(20 min.)
NaOH
(20 min.)
NaCl
(20 min.)
aluminium mg/L 1,62 2,58 150 ND 0,077
*Detection limit.
As stated in this word introduction, the limit established by the OMS to PTWI of aluminium
is 1 mg/kg of body weight. Considering a 70 kg individual, he would have a 70 mg intake for
week and the following hypotheses:
- Thirty minutes of cooking time;
- One tool harder than the aluminium to use;
- 1 L of liquids for meal;
- One meal a day;
- An aluminium pot with 20 cm of diameter;
- To stir eleven times with a 1 N minimal force.
The table below shows the weekly intake if the hypotheses above are followed:
Table 6 - Concentration values for the hypotheses in each solution
Parameter Unit Result
CH³COOH NaOH NaCl
aluminium mg 102,06 9450 < 4,851
The table shows that, considering the hypotheses, the quantity of aluminium ingested with an
acidic solution and with an alkaline solution exceeds the PTWI established by the OMS. In
the acidic case, the limit is exceeded around 46% the limit. In the alkaline case, the limit is
absurdly exceeded in 12.500%. In the saline solution, the lixiviation of aluminium is minimal,
INTERCORR2016_154
11
so much that it doesn’t reach the limit of detection of the equipment. So, the maximum it
could achieve in this case is less than 10% of the established limit, therefore the best
environment to use to cook in aluminium pots.
Conclusion
It’s possible to state from this study that the use of aluminium pots must be restricted and
made in a few specific cases. If used deliberately, the aluminium pot has huge chances of
lixiviating in the solution (food) high quantities of particles, above the limit established by the
OMS. This study didn’t consider high temperatures as parameter, which alarms to a more
dangerous situation, because found values at low temperature are already high and it’s known
that with temperature raise the solutions become more aggressive, have more dissolution
power and solubilization capacity, and in this conditions the issued vapor increases the
severity of wear in the pot.
According to the values found, foods which leads the environment alkaline or acidic should
not be cooked in aluminum pans. If done, with one meal it overcomes the PTWI. The use of
tools harder than aluminium (steel spoon, for example) should be avoided, because it helps to
remove the protector oxide layer and exposes the metal. The neutral solution with chlorides
was the only one to stay under the limit. Considering the use of some soft tool to cook, in
ambient temperature, the lowest aluminium quantity ingested is in this case.
Bibliographic References
(1) KAWAHARA, M.; KATO-NEGISHI, M.; Link between Aluminum and the
Pathogenesis of Alzheimer's Disease: The Integration of the Aluminum and Amyloid
Cascade Hypotheses, 2011.
(2) MCLACHLAN, D. R.; KRUCK, T. P,; LUKIW, W. J.; KRISHNAN, S. S.; Would
decreased aluminum ingestion reduce the incidence of Alzheimer's disease?, 1991.
(3) ASSOCIAÇÃO BRASILEIRA DO ALUMÍNIO, alumínio e saúde, www.abal.org.br.
(4) ORGANIZAÇÃO MUNDIAL DA SAÚDE, aluminium in drinking water, 2010.
(5) U.S. FOOD AND DRUG ADMINISTRATION, approximate pH of foods and food
products, 2007.
(6) DANTAS, S. T.; SARON, E. S.; DANTAS, F. B. H.; YAMASHITA, D, M.;
KIYATAKA, P. H. M.; determinação da dissolução de alumínio durante cozimento de
alimentos em panelas de alumínio, 2007.

INTERCORR2016_154
12
(7) ASM HANDBOOK, properties and selection: nonferrous alloys and special-purpose
materials, vol. 2, p. 53.
(8) VARGEL, C.; JACQUES, M.; SCHMIDT, M. P.; corrosion of aluminium, 2004.