Embed Size (px)
Citation preview

AJProença, Sistemas de Computação, UMinho, 2015/16 1
Avaliação de Desempenho no IA-32 (5)
Estrutura do tema Avaliação de Desempenho (IA-32)
1. A avaliação de sistemas de computação 2. Técnicas de otimização de código (IM) 3. Técnicas de otimização de hardware 4. Técnicas de otimização de código (DM) 5. Outras técnicas de otimização (cont.) 6. Medição de tempos
AJProença, Sistemas de Computação, UMinho, 2015/16 2
Análise de técnicas de otimização
Análise de técnicas de otimização (s/w) – técnicas de otimização de código (indep. máquina)
• já visto... – técnicas de otimização de código (dep. máquina)
• dependentes do processador (já visto...)
– outras técnicas de otimização • na compilação: otimizações efectuadas pelo Gcc • na identificação dos "gargalos" de desempenho
– code profiling – uso dum profiler para apoio à otimização – lei de Amdahl ... já visto ...
• dependentes da hierarquia da memória – a localidade espacial e temporal dum program ... já visto ... – influência da cache no desempenho ... próximo semestre...
AJProença, Sistemas de Computação, UMinho, 2015/16 3
Options That Control Optimization These options control various sorts of optimizations: -O -O1
Optimize. Optimizing compilation takes somewhat more time, and a lot more memory for a large function. (...) With -O, the compiler tries to reduce code size and execution time, without performing any optimizations that take a great deal of compilation time.
-O2 Optimize even more. GCC performs nearly all supported optimizations that do not involve a space-speed tradeoff. (...) this option increases both compilation time and the performance of the generated code. -O2 turns on all optional optimizations except for loop unrolling, function inlining, and register renaming.
-O3 Optimize yet more. -O3 turns on all optimizations specified by -O2 and also turns on the -finline-functions and -frename-registers options.
-O0 Do not optimize.
-Os Optimize for size. -Os enables all -O2 optimizations that do not typically increase code size. It also performs further optimizations designed to reduce code size.
Otimizações no Gnu C Compiler (1) (procurar em http://gcc.gnu.org/onlinedocs/... )
AJProença, Sistemas de Computação, UMinho, 2015/16 4
Otimizações para código com arrays e loops: -funroll-loops
Unroll loops whose number of iterations can be determined at compile time or upon entry to the loop. -funroll-loops implies both -fstrength-reduce and -frerun-cse-after-loop. This option makes code larger, and may or may not make it run faster.
-funroll-all-loops Unroll all loops, even if their number of iterations is uncertain when the loop is entered. This usually makes programs run more slowly. -funroll-all-loops implies the same options as -funroll-loops,
-fprefetch-loop-arrays If supported by the target machine, generate instructions to prefetch memory to improve the performance of loops that access large arrays.
-fmove-all-movables Forces all invariant computations in loops to be moved outside the loop.
-freduce-all-givs Forces all general-induction variables in loops to be strength-reduced.
Otimizações no Gnu C Compiler (2) ( procurar em http://gcc.gnu.org/onlinedocs/...)
AJProença, Sistemas de Computação, UMinho, 2015/16 5
Otimizações para inserção de funções em-linha: -finline-functions
Integrate all simple functions into their callers. The compiler heuristically decides which functions are simple enough to be worth integrating in this way. If all calls to a given function are integrated, and the function is declared static, then the function is normally not output as assembler code in its own right.
-finline-limit=n By default, gcc limits the size of functions that can be inlined. This flag allows the control of this limit for functions that are explicitly marked as inline (ie marked with the inline keyword ...) n is the size of functions that can be inlined in number of pseudo instructions (not counting parameter handling). The default value of n is 600. Increasing this value can result in more inlined code at the cost of compilation time and memory consumption. Decreasing usually makes the compilation faster and less code will be inlined (which presumably means slower programs).
Otimizações no Gnu C Compiler (3) (procurar em http://gcc.gnu.org/onlinedocs/...)
AJProença, Sistemas de Computação, UMinho, 2015/16 6
Ação!gcc –O2 –pg prog. –o prog ./prog
• executa como habitual/, mas tb gera o ficheiro gmon.out gprof prog
• GNU profiler: a partir de gmon.out gera informação que caracteriza o perfil do programa
Factos!– calcula (aproximadamente) o tempo gasto em cada função – método para cálculo do tempo (mais detalhe adiante)
• periodicamente (~ cada 10ms) interrompe o programa • determina que função está a ser executada nesse momento • incrementa o seu temporizador de um intervalo (por ex., 10ms)
– para cada função mantém ainda um contador (nº de vezes que foi invocada)
Otimização seletiva dum programa: a caracterização do seu perfil, code profiling
AJProença, Sistemas de Computação, UMinho, 2015/16 7
Uso do code profiling (1)
Uso do GProf em 3 passos:!– compilar com indicação explícita (-pg)
• ex.: análise do combine1_sum_int (vector com 107 elementos)
gcc -O2 -pg combine1_sum_int.c –o comb1
– executar o programa ./comb1
• vai gerar automaticamente o ficheiro gmon.out
– invocar o GProf para analisar os dados em gmon.out gprof comb1.exe [ > comb1.txt ]
• análise parcial do ficheiro comb1.txt a seguir…
AJProença, Sistemas de Computação, UMinho, 2015/16 8
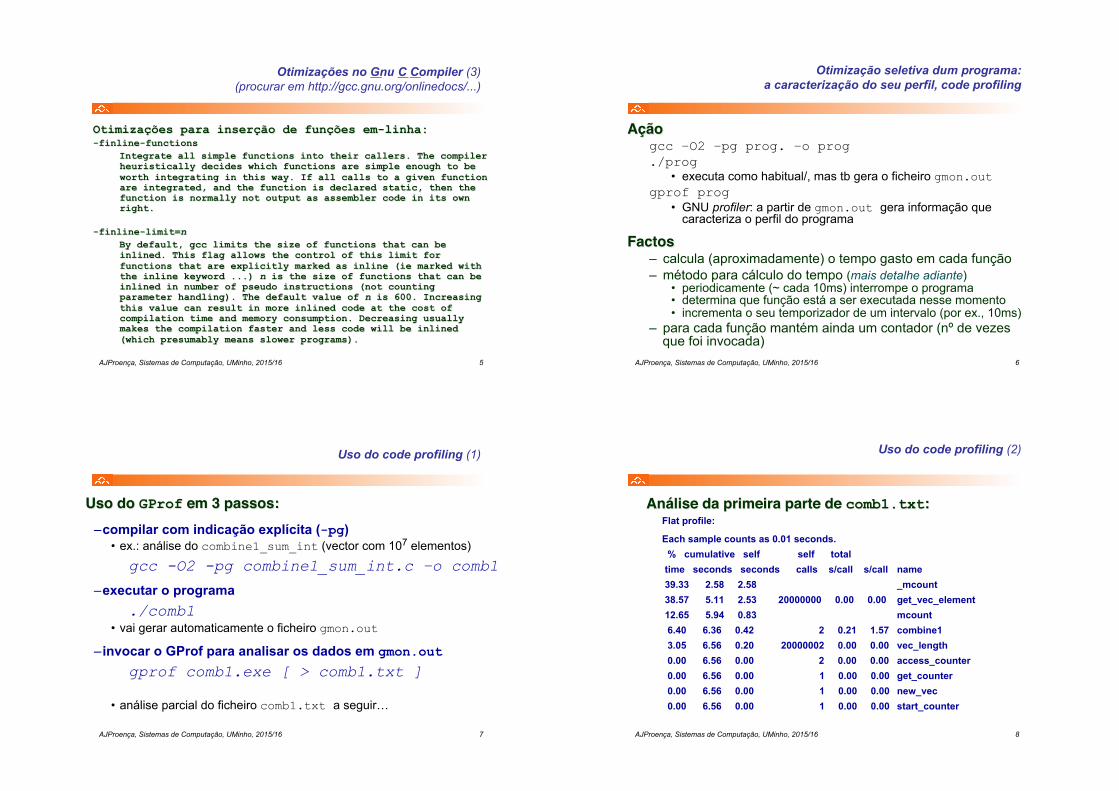
Análise da primeira parte de comb1.txt:!Flat profile:
Each sample counts as 0.01 seconds. % cumulative self self total time seconds seconds calls s/call s/call name 39.33 2.58 2.58 _mcount 38.57 5.11 2.53 20000000 0.00 0.00 get_vec_element 12.65 5.94 0.83 mcount 6.40 6.36 0.42 2 0.21 1.57 combine1 3.05 6.56 0.20 20000002 0.00 0.00 vec_length 0.00 6.56 0.00 2 0.00 0.00 access_counter 0.00 6.56 0.00 1 0.00 0.00 get_counter 0.00 6.56 0.00 1 0.00 0.00 new_vec 0.00 6.56 0.00 1 0.00 0.00 start_counter
Uso do code profiling (2)
AJProença, Sistemas de Computação, UMinho, 2015/16 9
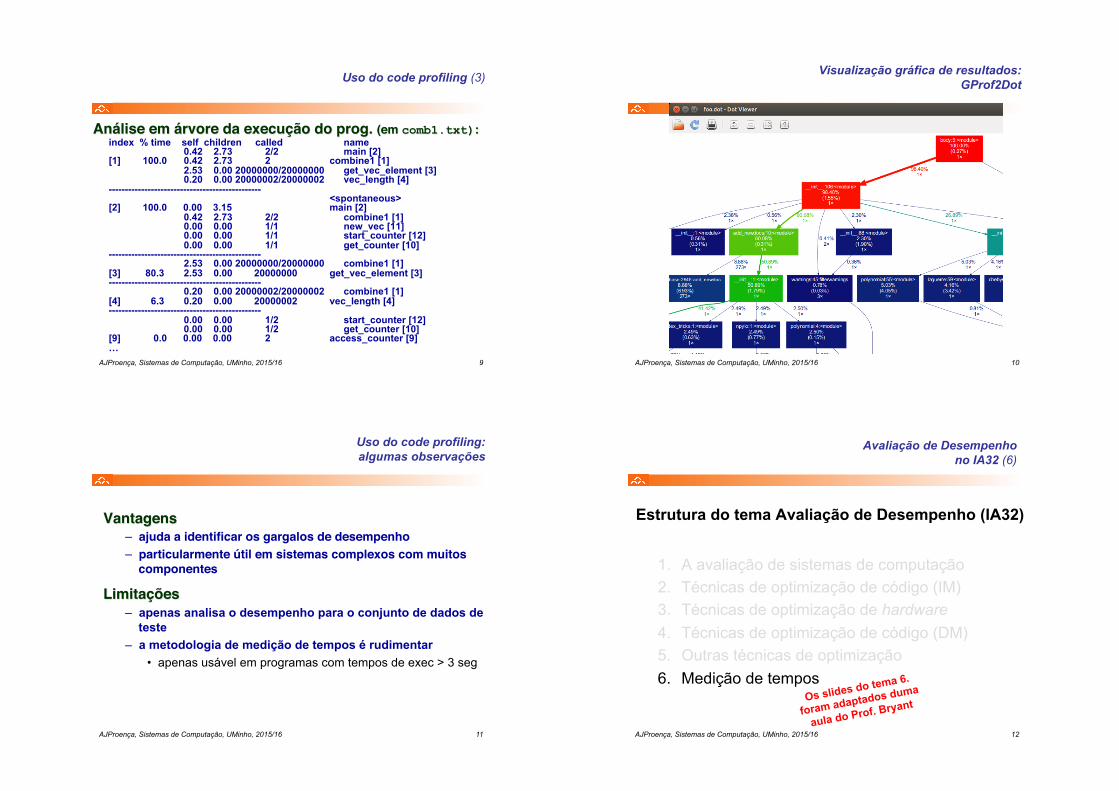
Análise em árvore da execução do prog. (em comb1.txt):!index % time self children called name 0.42 2.73 2/2 main [2] [1] 100.0 0.42 2.73 2 combine1 [1] 2.53 0.00 20000000/20000000 get_vec_element [3] 0.20 0.00 20000002/20000002 vec_length [4] ----------------------------------------------- <spontaneous> [2] 100.0 0.00 3.15 main [2] 0.42 2.73 2/2 combine1 [1] 0.00 0.00 1/1 new_vec [11] 0.00 0.00 1/1 start_counter [12] 0.00 0.00 1/1 get_counter [10] ----------------------------------------------- 2.53 0.00 20000000/20000000 combine1 [1] [3] 80.3 2.53 0.00 20000000 get_vec_element [3] ----------------------------------------------- 0.20 0.00 20000002/20000002 combine1 [1] [4] 6.3 0.20 0.00 20000002 vec_length [4] ----------------------------------------------- 0.00 0.00 1/2 start_counter [12] 0.00 0.00 1/2 get_counter [10] [9] 0.0 0.00 0.00 2 access_counter [9] …
Uso do code profiling (3)
AJProença, Sistemas de Computação, UMinho, 2015/16 10
Visualização gráfica de resultados: GProf2Dot
AJProença, Sistemas de Computação, UMinho, 2015/16 11
Vantagens!– ajuda a identificar os gargalos de desempenho!– particularmente útil em sistemas complexos com muitos
componentes!
Limitações!– apenas analisa o desempenho para o conjunto de dados de
teste – a metodologia de medição de tempos é rudimentar
• apenas usável em programas com tempos de exec > 3 seg
Uso do code profiling: algumas observações
AJProença, Sistemas de Computação, UMinho, 2015/16 12
Avaliação de Desempenho no IA32 (6)
Estrutura do tema Avaliação de Desempenho (IA32)
1. A avaliação de sistemas de computação 2. Técnicas de optimização de código (IM) 3. Técnicas de optimização de hardware 4. Técnicas de optimização de código (DM) 5. Outras técnicas de optimização 6. Medição de tempos
Os slides do tema 6.
foram adaptados duma
aula do Prof. Bryant
AJProença, Sistemas de Computação, UMinho, 2015/16 13
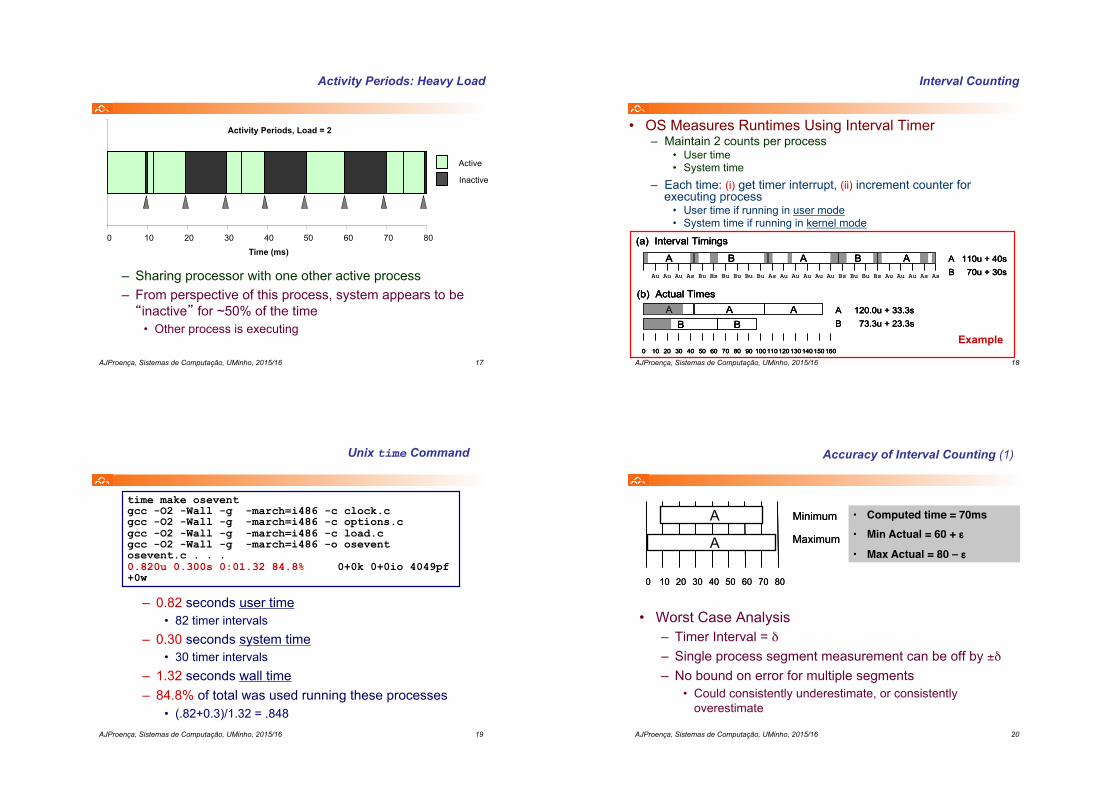
• Escalas fundamentais de tempo: – Processador: ~10–9 seg. – Eventos externos: ~10–2 seg.
• Keyboard input • Disk seek • Screen refresh
• Implicações – pode executar várias instr
enquanta espera que ocorram eventos externos
– pode alternar execução entre código de vários proc sem ser notado
Escala de Tempo (Processador de 1 GHz)
1.E-09 1.E-06 1.E-03 1.E+00 Tempo (seg)
1 ns 1 µ s 1 ms 1 s
Soma Int Multiplicação FP
Divisão FP Rotina de Interrupção Teclado
Acesso a Disco Refresh Monitor Teclar
Microscópica Macroscópica
O correr do tempo na perspectiva de um computador
AJProença, Sistemas de Computação, UMinho, 2015/16 14
Measurement Challenge
• How Much Time Does Program X Require? – CPU time
• How many total seconds are used when executing X? • Measure used for most applications • Small dependence on other system activities
– Actual (�Wall�) Time – How many seconds elapse between the start and the
completion of X? – Depends on system load, I/O times, etc.
• Confounding Factors – How does time get measured? – Many processes share computing resources
• Transient effects when switching from one process to another
• Suddenly, the effects of alternating among processes become noticeable
AJProença, Sistemas de Computação, UMinho, 2015/16 15
�Time� on a Computer System
real (wall clock) time!
= user time (time executing instructions in the user process)!
+! = real (wall clock) time!
We will use the word �time� to refer to user time.!
= system time (time executing instructions in kernel on behalf of user process)!
+!
= some other user�s time (time executing instructions in different user�s process)!
cumulative user time!AJProença, Sistemas de Computação, UMinho, 2015/16 16
Activity Periods: Light Load
– Most of the time spent executing one process
– Periodic interrupts every 10ms • Interval timer • Keep system from executing
one process to exclusion of others
– Other interrupts • Due to I/O activity
– Inactivity periods • System time spent
processing interrupts • ~250,000 clock cycles
Activity Periods, Load = 1!
0! 10! 20! 30! 40! 50! 60! 70! 80!
1!
Time (ms)!
Active!Inactive!
AJProença, Sistemas de Computação, UMinho, 2015/16 17
Activity Periods: Heavy Load
– Sharing processor with one other active process – From perspective of this process, system appears to be �inactive� for ~50% of the time
• Other process is executing
Activity Periods, Load = 2!
0! 10! 20! 30! 40! 50! 60! 70! 80!
1!
Time (ms)!
Active!Inactive!
AJProença, Sistemas de Computação, UMinho, 2015/16 18
Interval Counting
• OS Measures Runtimes Using Interval Timer – Maintain 2 counts per process
• User time • System time
– Each time: (i) get timer interrupt, (ii) increment counter for executing process
• User time if running in user mode • System time if running in kernel mode
Au Au Au As Bu Bs Bu Bu Bu Bu As Au Au Au Au Au Bs Bu Bu Bs Au Au Au As As
A 110u + 40sB 70u + 30s
(a) Interval Timings
B BAA A
(b) Actual Times
BAA
BA 120.0u + 33.3sB 73.3u + 23.3s
0 10 20 30 40 50 60 70 80 90 100 110 120 130 140 150 160
A
Au Au Au As Bu Bs Bu Bu Bu Bu As Au Au Au Au Au Bs Bu Bu Bs Au Au Au As As
A 110u + 40sB 70u + 30s
(a) Interval Timings
B BAA AAu Au Au As Bu Bs Bu Bu Bu Bu As Au Au Au Au Au Bs Bu Bu Bs Au Au Au As As
A 110u + 40sB 70u + 30s
(a) Interval Timings
B BAA A
(b) Actual Times
BAA
BA 120.0u + 33.3sB 73.3u + 23.3s
0 10 20 30 40 50 60 70 80 90 100 110 120 130 140 150 160
A(b) Actual Times
BAA
BA 120.0u + 33.3sB 73.3u + 23.3s
0 10 20 30 40 50 60 70 80 90 100 110 120 130 140 150 160
A
Example
AJProença, Sistemas de Computação, UMinho, 2015/16 19
Unix time Command
– 0.82 seconds user time • 82 timer intervals
– 0.30 seconds system time • 30 timer intervals
– 1.32 seconds wall time – 84.8% of total was used running these processes
• (.82+0.3)/1.32 = .848
time make osevent gcc -O2 -Wall -g -march=i486 -c clock.c gcc -O2 -Wall -g -march=i486 -c options.c gcc -O2 -Wall -g -march=i486 -c load.c gcc -O2 -Wall -g -march=i486 -o osevent osevent.c . . . 0.820u 0.300s 0:01.32 84.8% 0+0k 0+0io 4049pf+0w
AJProença, Sistemas de Computação, UMinho, 2015/16 20
Accuracy of Interval Counting (1)
• Worst Case Analysis – Timer Interval = δ – Single process segment measurement can be off by ±δ – No bound on error for multiple segments
• Could consistently underestimate, or consistently overestimate
0! 10! 20! 30! 40! 50! 60! 70! 80!
A!
A!
Minimum!
Maximum!
0! 10! 20! 30! 40! 50! 60! 70! 80!
A!
A!
Minimum!
Maximum!
• Computed time = 70ms!• Min Actual = 60 + ε!
• Max Actual = 80 – ε!
AJProença, Sistemas de Computação, UMinho, 2015/16 21
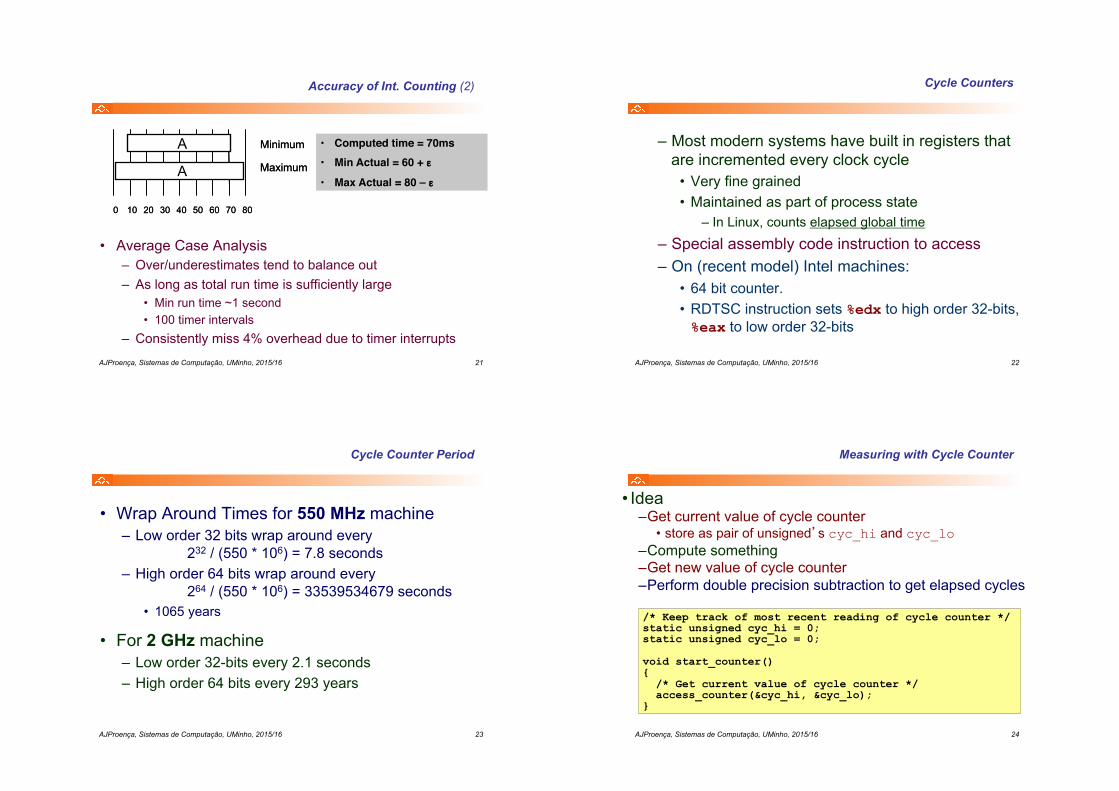
Accuracy of Int. Counting (2)
• Average Case Analysis – Over/underestimates tend to balance out – As long as total run time is sufficiently large
• Min run time ~1 second • 100 timer intervals
– Consistently miss 4% overhead due to timer interrupts
0! 10! 20! 30! 40! 50! 60! 70! 80!
A!
A!
Minimum!
Maximum!
0! 10! 20! 30! 40! 50! 60! 70! 80!
A!
A!
Minimum!
Maximum!
• Computed time = 70ms!• Min Actual = 60 + ε!
• Max Actual = 80 – ε!
AJProença, Sistemas de Computação, UMinho, 2015/16 22
Cycle Counters
– Most modern systems have built in registers that are incremented every clock cycle
• Very fine grained • Maintained as part of process state
– In Linux, counts elapsed global time
– Special assembly code instruction to access – On (recent model) Intel machines:
• 64 bit counter. • RDTSC instruction sets %edx to high order 32-bits, %eax to low order 32-bits
AJProença, Sistemas de Computação, UMinho, 2015/16 23
Cycle Counter Period
• Wrap Around Times for 550 MHz machine – Low order 32 bits wrap around every
232 / (550 * 106) = 7.8 seconds – High order 64 bits wrap around every
264 / (550 * 106) = 33539534679 seconds • 1065 years
• For 2 GHz machine – Low order 32-bits every 2.1 seconds – High order 64 bits every 293 years
AJProença, Sistemas de Computação, UMinho, 2015/16 24
Measuring with Cycle Counter
• Idea – Get current value of cycle counter
• store as pair of unsigned�s cyc_hi and cyc_lo – Compute something – Get new value of cycle counter – Perform double precision subtraction to get elapsed cycles
/* Keep track of most recent reading of cycle counter */ static unsigned cyc_hi = 0; static unsigned cyc_lo = 0; void start_counter() { /* Get current value of cycle counter */ access_counter(&cyc_hi, &cyc_lo); }
AJProença, Sistemas de Computação, UMinho, 2015/16 25
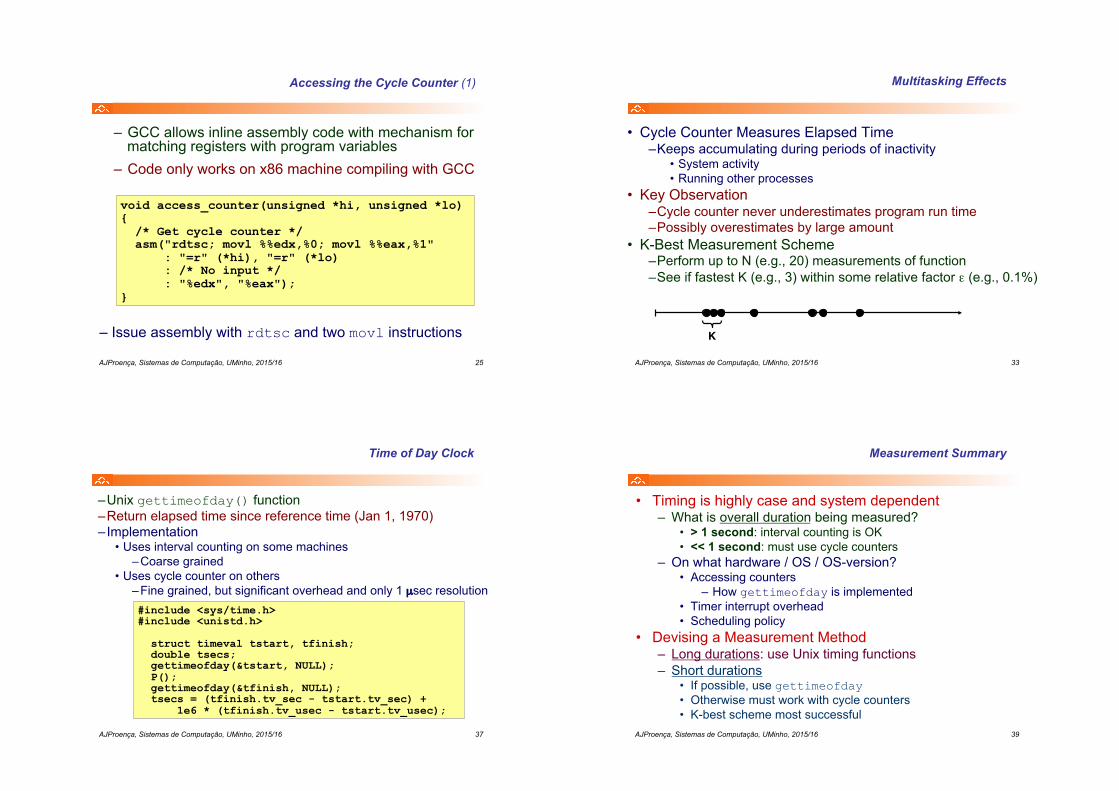
Accessing the Cycle Counter (1)
– GCC allows inline assembly code with mechanism for matching registers with program variables
– Code only works on x86 machine compiling with GCC
void access_counter(unsigned *hi, unsigned *lo) { /* Get cycle counter */ asm("rdtsc; movl %%edx,%0; movl %%eax,%1" : "=r" (*hi), "=r" (*lo) : /* No input */ : "%edx", "%eax"); }
– Issue assembly with rdtsc and two movl instructions
AJProença, Sistemas de Computação, UMinho, 2015/16 33
Multitasking Effects
• Cycle Counter Measures Elapsed Time – Keeps accumulating during periods of inactivity
• System activity • Running other processes
• Key Observation – Cycle counter never underestimates program run time – Possibly overestimates by large amount
• K-Best Measurement Scheme – Perform up to N (e.g., 20) measurements of function – See if fastest K (e.g., 3) within some relative factor ε (e.g., 0.1%)
K!
AJProença, Sistemas de Computação, UMinho, 2015/16 37
Time of Day Clock
– Unix gettimeofday() function – Return elapsed time since reference time (Jan 1, 1970) – Implementation
• Uses interval counting on some machines – Coarse grained
• Uses cycle counter on others – Fine grained, but significant overhead and only 1 µsec resolution #include <sys/time.h> #include <unistd.h> struct timeval tstart, tfinish; double tsecs; gettimeofday(&tstart, NULL); P(); gettimeofday(&tfinish, NULL); tsecs = (tfinish.tv_sec - tstart.tv_sec) + 1e6 * (tfinish.tv_usec - tstart.tv_usec);
AJProença, Sistemas de Computação, UMinho, 2015/16 39
Measurement Summary
• Timing is highly case and system dependent – What is overall duration being measured?
• > 1 second: interval counting is OK • << 1 second: must use cycle counters
– On what hardware / OS / OS-version? • Accessing counters
– How gettimeofday is implemented • Timer interrupt overhead • Scheduling policy
• Devising a Measurement Method – Long durations: use Unix timing functions – Short durations
• If possible, use gettimeofday • Otherwise must work with cycle counters • K-best scheme most successful