Embed Size (px)
Citation preview
STATISTICS BOTSWANA
Statistics Botswana. Private Bag 0024. Gaborone. BotswanaTel: (+267) 367 1300. Toll Free: 0800 600 200 Fax: (+267) 395 2201. Email: [email protected] Website: http://www.statsbots.org.bw
SURVEY REPORT 2017 ANNUAL AGRICULTURAL
(Revised Version)

ANNUAL AGRICULTURAL SURVEY REPORT 2017(Revised Version)
4
STATISTICS BOTSWANA
ANNUAL AGRICULTURAL SURVEY REPORT 2017 (Revised Version)
Published by
Statistics BotswanaPrivate Bag 0024, GABORONE
Phone: (267) 367 1300, Fax: (267) 3952 201
Email: [email protected] Website: http://www.statsbots.org.bw
Contact Unit: Agricultural Statistics SectionMinistry of Agricultural Development and Food Security
Department of Agricultural Research, Statistics and Policy DevelopmentPrivate Bag 003, GaboroneTelephone: (267) 3689 000,
Fax: (267) 3191 806
ISBN: 978-99968-2-073-1
June 2021
COPYRIGHT RESERVEDExtracts may be published if
Source is duly acknowledged
STATISTICS BOTSWANA
5ANNUAL AGRICULTURAL SURVEY REPORT 2017 (Revised Version)
PREFACE
This is a revised version of the 2017 Annual Agriculture Survery report that was released in January 2019. The revision is on figures under Ghanzi, Kgalagadi North and South in all the tables from Table 1.1 to Table 7.23. The revision was necessitated by the need to correct figures for Ghanzi and Kgalagadi districts, which were erroneously analysed with limited survey coverage. Indications are that the figures were not representative due to under coverage of different strata, which resulted in inaccurate figures for these districts. As a result, figures for Ghanzi, Kgalagadi North and South in all the tables in the report have now been estimated using the 2015 agriculture census figures for these districts.
The survey is part of a series of household surveys carried out by Statistics Botswana through the Agricultural Statistics Unit (ASU) and in collaboration with the Department of Agricultural Research, Statistics and Policy Development (DARSPD) of the Ministry of Agricultural Development and Food Security.
The aim of the agricultural surveys is to provide time series data on key production indicators in the livestock and crop sub-sectors for evidence-based decision-making, development planning as well as to monitor and evaluate Government development programmes and projects.
I wish to acknowledge all those who contributed to the successful completion of this survey. In particular, I would like to thank the Ministry of Agricultural Development and Food Security for their partnership in this exercise and farmers for their invaluable time and cooperation to provide data to our enumerators.
For more information and further enquires, contact the Directorate of Stakeholder Relations at 3671300. All Statistics Botswana outputs/publications are available on the website at www.statsbots.org.bw and at Statistics Botswana Library (Head-Office, Gaborone).
Dr. Burton S. MguniStatistician GeneralJune 2021
6
STATISTICS BOTSWANA
ANNUAL AGRICULTURAL SURVEY REPORT 2017 (Revised Version)
LIST OF AGRONYMS
ALDEP – Arable Land Development Policy
ASU – Agriculture Statistics Unit
CSO – Central Statistics Unit
CSPro – Census and Surveys Processing System
DARSPD – Department Agricultural Research, Statistics & Policy Development
EER – Establishment and Enterprise Register GDP – Gross Domestic Product
IMPS – Integrated Microcomputer Processing System
ISPAAD – Integrated Support Programme for Arable Agriculture Development
LIMID – Livestock Management and Infrastructure Development
MoA – Ministry of Agricultural Development and Food Security MFED – Ministry of Finance and Economic Development
NAMPAADD – National Master Plan for Arable Agriculture and Dairy Development
SLOCA – Services to Livestock Owners in Communal Areas
StatsBots – Statistics Botswana
TGLP – Tribal Grazing Land Policy
STATISTICS BOTSWANA
7ANNUAL AGRICULTURAL SURVEY REPORT 2017 (Revised Version)
TABLE OF CONTENTS
PREFACE 5LIST OF ACRONYMS 6TABLE OF CONTENTS 7LIST OF FIGURES AND SYMBOLS USED 9LIST OF SYMBOLS USED 9EXECUTIVE SUMMARY 10
CHAPTER 1: INTRODUCTION 10
CHAPTER 2: ANALYSIS OF RESULTS 11
TIME SERIES DATA TABLESTable 1.1 Livestock Population Trends (Traditional & Commercial): (‘000) 22Table 1.2 Cattle Production Indicator Trends: Births, Deaths and Offtake Rates (%) 23Table 1.3 Goats Production Indicator Trends: Births, Deaths and Offtake Rates (%) 24Table 1.4 Sheep Production Indicator Trends: Births, Deaths and Offtake Rates (%) 25Table 1.5 Traditional Sector: Area Planted Trends (‘000 Hectares) By Crop 26Table 1.6 Traditional Sector: Area Harvested Trends (‘000 Hectares) By Crop 27Table 1.7 Total Production Trends (Metric Tonnes) - (Commercial and traditional) By Crop 28Table 1.8 Traditional Sector: Yield per Hectare Planted (KG/HA) Trends By Crop 29
2017 ANNUAL AGRICULTURAL SURVEYS SUMMARY TABLESTable 2.1 Summary of Traditional and Commercial Sectors Livestock Statistics 31Table 2.2 Summary of Traditional and Commercial Sectors Crop Statistics 32Table 2.3: Traditional: land, Crop, Cattle, Goats and Sheep Holdings by District 33
HOLDERS AND THEIR CHARACTERISTICS: TRADITIONAL SECTOR:Table 3.1 Number of Holders by Gender and District 35Table 3.2 Number of Holders by Marital Status and District 35Table 3.3 Number of Male Holders by Marital Status and District 36Table 3.4 Number of Female Holders by Marital Status and District 36Table 3.5 Number of Holders by Age Group and District 37Table 3.6 Number of Holders by Type of Holding Operation and District 37Table 3.7 Number of Holdings by Holders’ Status and District 38Table 3.8 Number of Holdings by Access to Weather Forecast Information and utilization status & District 38Table 3.9 Number of Holdings by Awareness to Climate Change & District 39Table 3.10 Number of Holdings by Type of Climate Change Over the Years & District 39Table 3.11 Number of Holdings by Reliable Water Source for Livestock Watering and District 40Table 3.12 Number of Holdings by Ownership of Livestock Water Supply and District 40Table 3.13 Number of Holdings by Borehole Source of Energy and District 41Table 3.14 Number of Holdings by Livestock Feeds status and District 41Table 3.15 Number of Holdings by Cattle Vaccination and District 42Table 3.16 Number of Holdings by Type of Cattle Disease Controlled and District 42Table 3.17 Number of Holdings with employed Farm Worhers by District 43Table 3.18 Number of Farm Workers by Marital Status, Gender and District 43Table 3.19 Number of Farm Workers by Employee Status and District 44Table 3.20 Number of Farm Workers by Employment Status, Earnings and District 44
TRADITIONAL SECTOR: CATTLE Table 4.1A Cattle Holdings and Population by Gender and District 46Table 4.1B Cattle Holdings and Population by Age Group of Holder and District 47Table 4.2A Cattle Herd Composition by District 47Table 4.2B Percentage: Cattle Herd Composition BY District 48Table 4.3 Cattle Holdings by Type of Breed and District 48
8
STATISTICS BOTSWANA
ANNUAL AGRICULTURAL SURVEY REPORT 2017 (Revised Version)
Table 4.4 Cattle Population by Type of Breed and District 49Table 4.5A Cattle Inventory (Births, Deaths, Offtake …) by District 49Table 4.5B Percentage: Cattle Inventory (Births, Deaths, Offtake …) by District 50Table 4.6 Cattle Sales by Various Buyers and District 50Table 4.7 Cattle Revenue Received (PULA) by Various Buyers and District 51Table 4.8 Cattle Average Prices (PULA) by Various Buyers and District 52Table 4.9 Cattle Sales and Revenue Received (PULA) by District 52Table 4.10 Cattle Purchases and Cost Incurred (PULA) by District 53Table 4.11 Cattle Holdings by Cattle Breeding Method Used and District 53
TRADITIONAL SECTOR: SMALL STOCK (GOATS)Table 5.1A Goats Holdings and Population by Gender and District 55Table 5.1B Goats Holdings and Population by Age Group of Holder and District 56Table 5.2 Goats Composition by District 56Table 5.3 Goats Population by Type of Breed and District 57Table 5.4A Goats Inventory (Births, Deaths, Offtake …) by District 57Table 5.4B Percentage: Goats Inventory (Births, deaths, Offtake …) by District 58Table 5.5 Goats Sales and Revenue Received (PULA) by District 58Table 5.6 Goats Purchases and Cost Incurred (PULA) by District 59
TRADITIONAL SECTOR: SMALL STOCK (SHEEP)Table 5.7 Sheep Holdings and Population by Gender and District 61Table 5.8 Sheep Composition by District 62Table 5.9 Sheep Population by Type of Breed and District 62Table 5.10A Sheep Inventory (Births, Deaths, Offtake …) by District 63Table 5.10B Percentage: Sheep Inventory (Births, Deaths, Offtake …) by District 63Table 5.11 Sheep Sales and Revenue Received (PULA) by District 64Table 5.12 Sheep Purchases and Cost Incurred (PULA) by District 64
TRADITIONAL SECTOR: OTHER LIVESTOCKTable 6.1 Donkeys: Total Holdings and Population by Gender and District 66Table 6.2 Donkeys: Total Sales and Revenue Received (PULA) by District 67Table 6.3 Chickens: Total Holdings and Population by Gender and District 68Table 6.4 Chickens: Total Sales and Revenue Received (PULA) by District 69Table 6.5 Horses: Total Holdings and Population by Gender and District 70Table 6.6 Horses: Total Sales and Revenue Received (PULA) by District 71Table 6.7 Pigs: Total Holdings and Population by Gender and District 72Table 6.8 Pigs: Total Sales and Revenue Received (PULA) by District 73
TRADITIONAL SECTOR: CROP PRODUCTIONTable 7.1 Land Holdings, Land Area (Hectares) & Fields by Gender and District 75Table 7.2 Holdings Planted and Area Planted (Hectares) by Gender and District 76Table 7.3 Holdings Harvested & Area Harvested (Hectares) by Gender and District 77Table 7.4 Holdings Planted by Type of Crop and District 77Table 7.5 Holdings Harvested by Type of Crop and District 78Table 7.6 Area Planted (Hectares) by Type of Crop and District 78Table 7.7 Area Harvested (Hectares) by Type of Crop and District 79Table 7.8 Total Production (Metric Tonnes) by Type of Crop and District 79Table 7.9 Yield Per Hectare Planted (KG/HA) by Type of Crop and District 80Table 7.10 Yield Per Hectare Harvested (KG/HA) by Type of Crop and District 80Table 7.11A Sorghum Production Disposal (Metric Tonnes) by District 81Table 7.11B Maize Production Disposal (Metric Tonnes) by District 81Table 7.11C Pulses Production Disposal (Metric Tonnes) by District 82Table 7.11D Millet Production Disposal (Metric Tonnes) by District 82Table 7.11E Water melons Production Disposal (Metric Tonnes) by District 83
STATISTICS BOTSWANA
9ANNUAL AGRICULTURAL SURVEY REPORT 2017 (Revised Version)
Table 7.12A Sorghum Quantity Sold (KG) & Revenue Received (PULA) by District 83Table 7.12B Maize Quantity Sold (KG) & Revenue Received (PULA) by District 84Table 7.12C Pulses Quantity Sold (KG) & Revenue Received (PULA) by District 84Table 7.12D Millet Quantity Sold (KG) & Revenue Received (PULA) by District 85Table 7.12E Watermelons Quantity Sold (KG) & Revenue Received (PULA) by District 85Table 7.12F Land Holdings by Planting Location (Molapo, Dry land or both) and District 86Table 7.13 Land Holdings by Reasons for not Ploughing or Planting and District 86Table 7.14 Holdings Planted by Sources of Seeds and District 87Table 7.15 Land Holdings by Fencing Status and District 87Table 7.16 Holdings Planted by Weeding Status and District 88Table 7.17 Holdings Planted by Predominant Weeds and District 88Table 7.18 Holdings by Fertilizer Use Status and District 89Table 7.19 Land Holdings by Type of Soil of Arable Land by District 89Table 7.20 Holdings Planted By Draught Power Used and District 90Table 7.21 Holdings Planted by Provision of Draught Power Used and District 90Table 7.22 Holdings Planted By Payment of Draught Power Used and District 91Table 7.23 Holdings Planted By Method Used to Plant Seeds and District 91
LIST OF FIGURES
Figure 2.2.1: Cattle Population Trends (000): 2007 - 2017 12Figure 2.2.1A:Traditional Sector: Cattle Production Indicator Trends: 2007 - 2017 13Figure 2.2.2: Goats Population Trends (000): 2007 - 2017 13Figure 2.2.2A:Traditional Sector: Goats Production Indicator Trends: 2007 - 2017 14Figure 2.2.3: Sheep Population Trends (000): 2007 - 2017 14Figure 2.2.3A:Traditional Sector: Sheep Production Indicator Trends: 2007 - 2017 15Figure 2.3.1A:Traditional Sector: Land Holdings, Holdings Planted & Harvested: 2007 - 2017 16Figure 2.3.1B:Traditional Sector: Land Area, Area Planted & Harvested: 2007 - 2017 16Figure 2.3.2.1:Traditional Sector: Area Planted, Area Harvested & Production Trends - Sorghum: 2007 – 2017 18Figure 2.3.2.2:Traditional Sector: Area Planted, Area Harvested and Production Trends - Maize: 2007 – 2017 19Figure 2.3.2.3:Traditional Sector: Area Planted, Area Harvested & Production Trends - Millet: 2007 – 2017 19Figure 2.3.2.4:Traditional Sector: Area Planted, Area Harvested & Production Trends - Pulses: 2007 – 2017 20
Symbols used
‘0’ Denotes a number too small to be rounded‘-‘ Not Applicable‘( )’ Denotes a negative number
10
STATISTICS BOTSWANA
ANNUAL AGRICULTURAL SURVEY REPORT 2017 (Revised Version)
EXECUTIVE SUMMARY
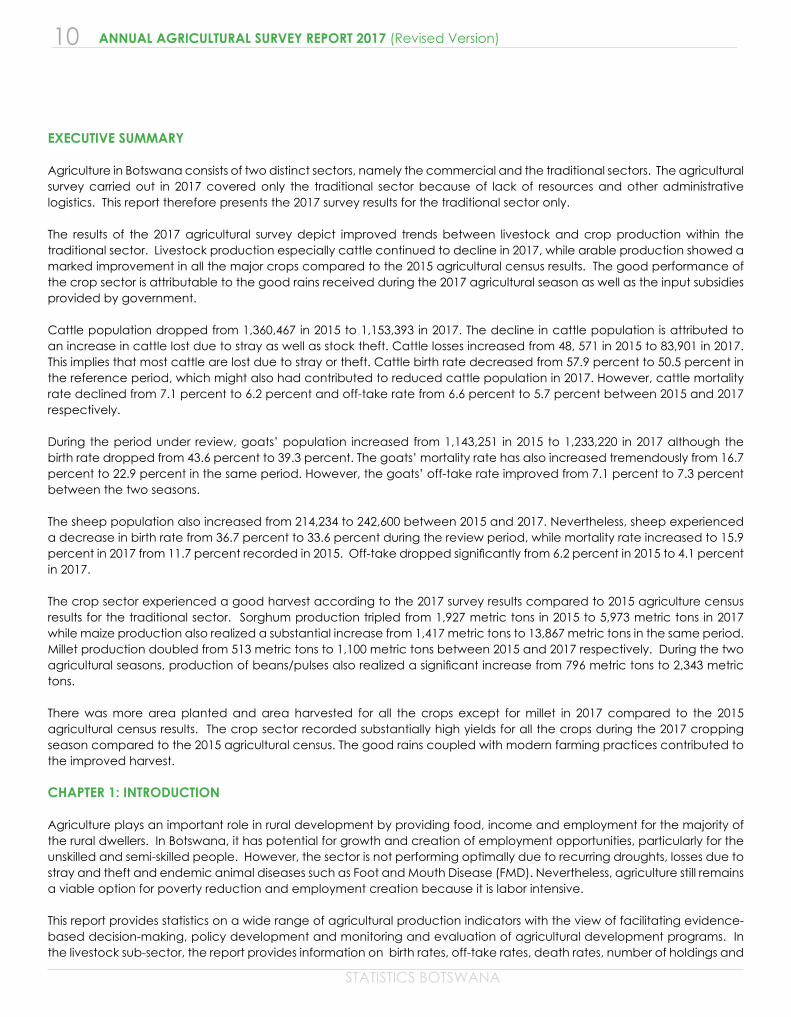
Agriculture in Botswana consists of two distinct sectors, namely the commercial and the traditional sectors. The agricultural survey carried out in 2017 covered only the traditional sector because of lack of resources and other administrative logistics. This report therefore presents the 2017 survey results for the traditional sector only.
The results of the 2017 agricultural survey depict improved trends between livestock and crop production within the traditional sector. Livestock production especially cattle continued to decline in 2017, while arable production showed a marked improvement in all the major crops compared to the 2015 agricultural census results. The good performance of the crop sector is attributable to the good rains received during the 2017 agricultural season as well as the input subsidies provided by government.
Cattle population dropped from 1,360,467 in 2015 to 1,153,393 in 2017. The decline in cattle population is attributed to an increase in cattle lost due to stray as well as stock theft. Cattle losses increased from 48, 571 in 2015 to 83,901 in 2017. This implies that most cattle are lost due to stray or theft. Cattle birth rate decreased from 57.9 percent to 50.5 percent in the reference period, which might also had contributed to reduced cattle population in 2017. However, cattle mortality rate declined from 7.1 percent to 6.2 percent and off-take rate from 6.6 percent to 5.7 percent between 2015 and 2017 respectively.
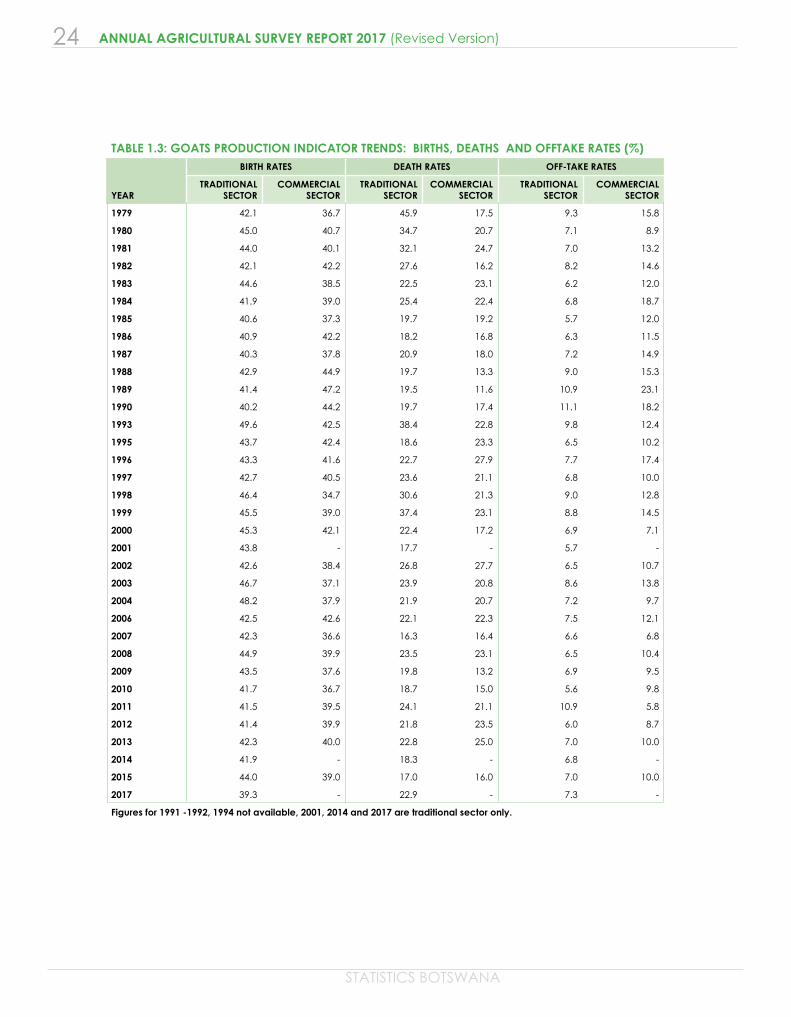
During the period under review, goats’ population increased from 1,143,251 in 2015 to 1,233,220 in 2017 although the birth rate dropped from 43.6 percent to 39.3 percent. The goats’ mortality rate has also increased tremendously from 16.7 percent to 22.9 percent in the same period. However, the goats’ off-take rate improved from 7.1 percent to 7.3 percent between the two seasons.
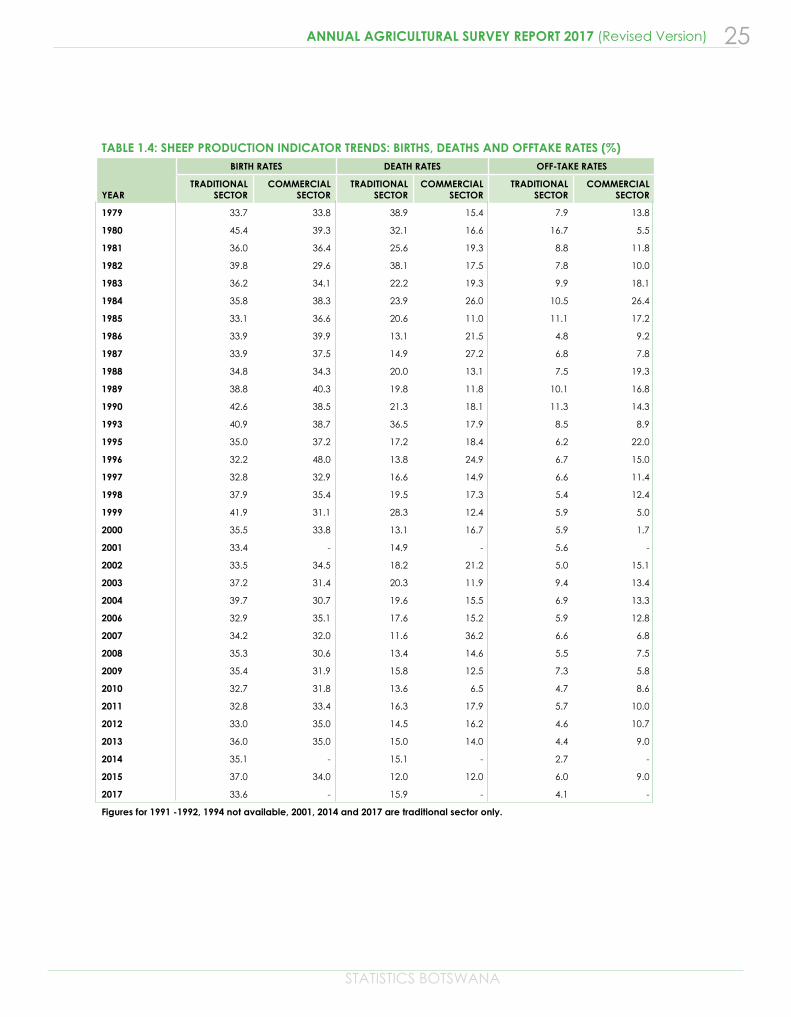
The sheep population also increased from 214,234 to 242,600 between 2015 and 2017. Nevertheless, sheep experienced a decrease in birth rate from 36.7 percent to 33.6 percent during the review period, while mortality rate increased to 15.9 percent in 2017 from 11.7 percent recorded in 2015. Off-take dropped significantly from 6.2 percent in 2015 to 4.1 percent in 2017.
The crop sector experienced a good harvest according to the 2017 survey results compared to 2015 agriculture census results for the traditional sector. Sorghum production tripled from 1,927 metric tons in 2015 to 5,973 metric tons in 2017 while maize production also realized a substantial increase from 1,417 metric tons to 13,867 metric tons in the same period. Millet production doubled from 513 metric tons to 1,100 metric tons between 2015 and 2017 respectively. During the two agricultural seasons, production of beans/pulses also realized a significant increase from 796 metric tons to 2,343 metric tons.
There was more area planted and area harvested for all the crops except for millet in 2017 compared to the 2015 agricultural census results. The crop sector recorded substantially high yields for all the crops during the 2017 cropping season compared to the 2015 agricultural census. The good rains coupled with modern farming practices contributed to the improved harvest.
CHAPTER 1: INTRODUCTION
Agriculture plays an important role in rural development by providing food, income and employment for the majority of the rural dwellers. In Botswana, it has potential for growth and creation of employment opportunities, particularly for the unskilled and semi-skilled people. However, the sector is not performing optimally due to recurring droughts, losses due to stray and theft and endemic animal diseases such as Foot and Mouth Disease (FMD). Nevertheless, agriculture still remains a viable option for poverty reduction and employment creation because it is labor intensive.
This report provides statistics on a wide range of agricultural production indicators with the view of facilitating evidence-based decision-making, policy development and monitoring and evaluation of agricultural development programs. In the livestock sub-sector, the report provides information on birth rates, off-take rates, death rates, number of holdings and
STATISTICS BOTSWANA
11ANNUAL AGRICULTURAL SURVEY REPORT 2017 (Revised Version)
livestock population, to name but a few. In the arable sub-sector, production indicators covered include area planted, area harvested, production and yield per hectare. Information on the agricultural holder characteristics such as gender and age are also covered.
The following chapter provides a detailed analysis of the 2017 survey results focusing exclusively on the traditional or subsistence sector.
CHAPTER 2: ANALYSIS OF THE RESULTS
2.1 Agricultural Holders Characteristics
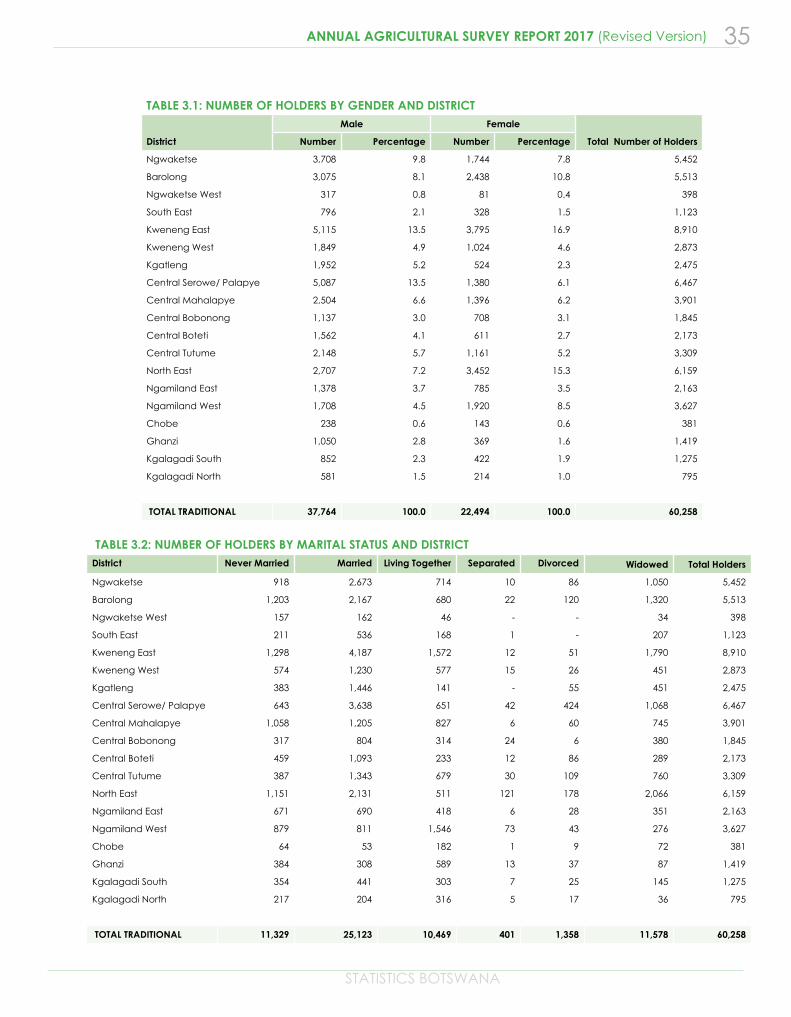
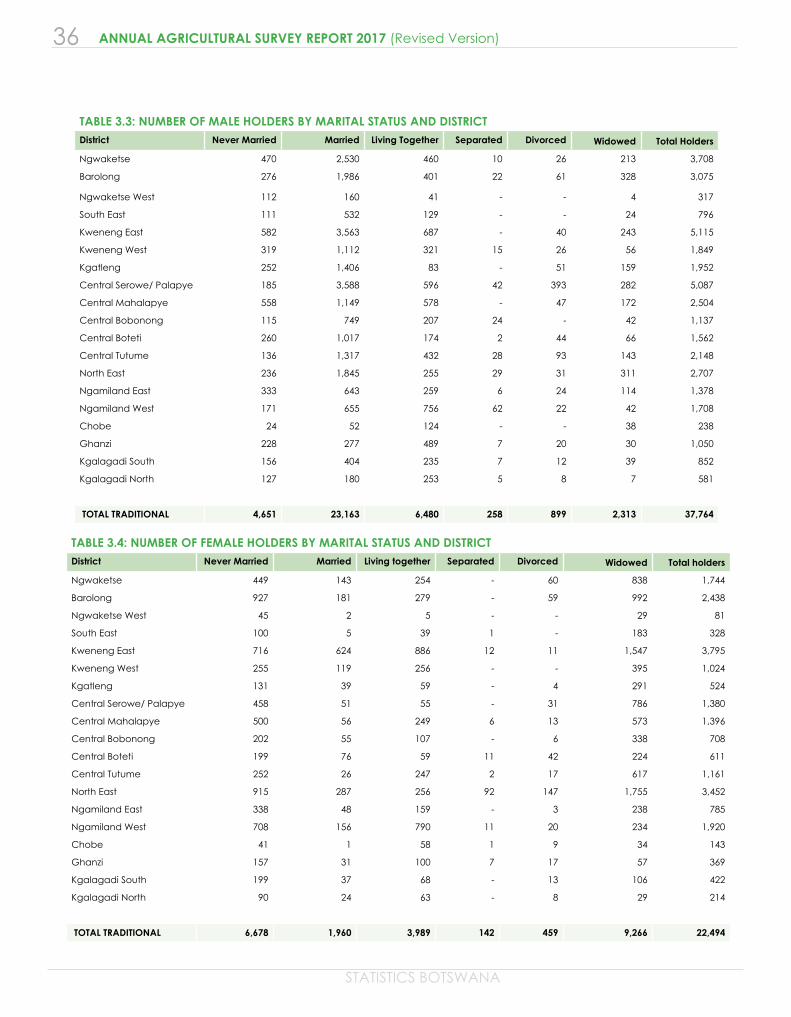
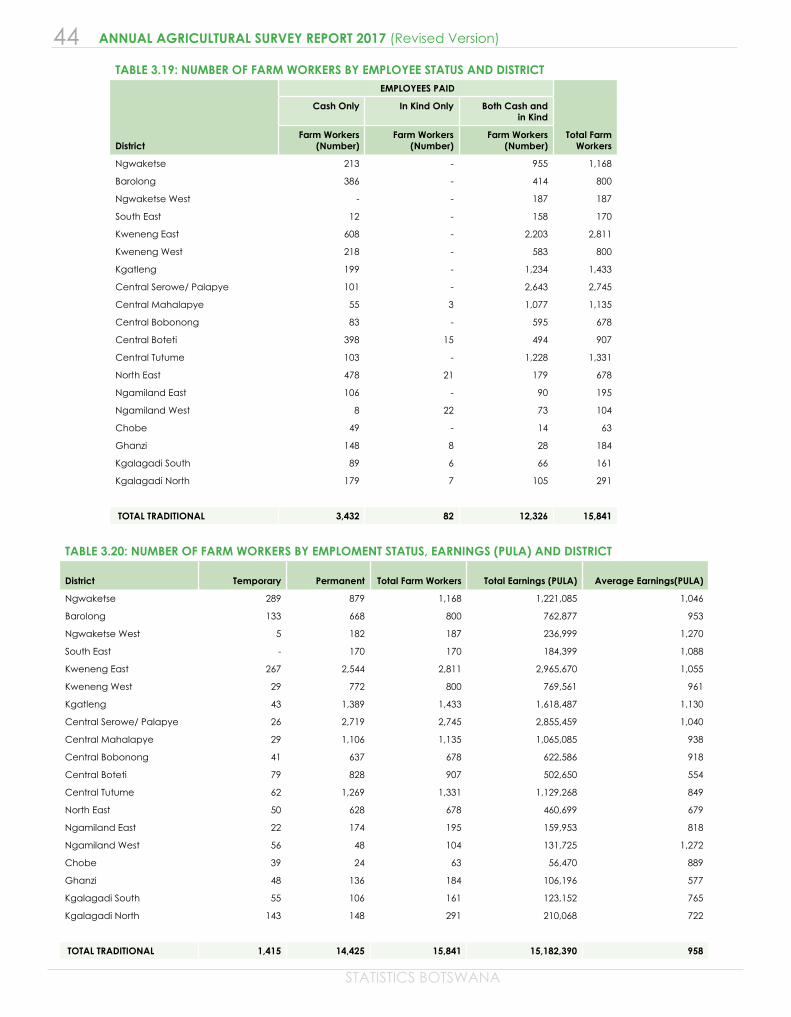
The results of the survey indicate that in the 2017 agricultural season, male holders continued to dominate farming at 37,764 (62.7) percent compared to their female counterparts with 22,494, which is only 37.3 percent participation (Table 3.1). There was an increase in the average farm wage from P832 in 2015 to P958 in 2017. This shows that most farmers pay their employees’ wages above the minimum wage, thus providing high incentive for workers to remain on farms. The minimum wages approved by Government were P550 and P700 for 2015 and 2017 respectively. According to the 2017 annual agricultural survey results, the majority of farm workers were permanent at 91.1 percent (Table 3.20).
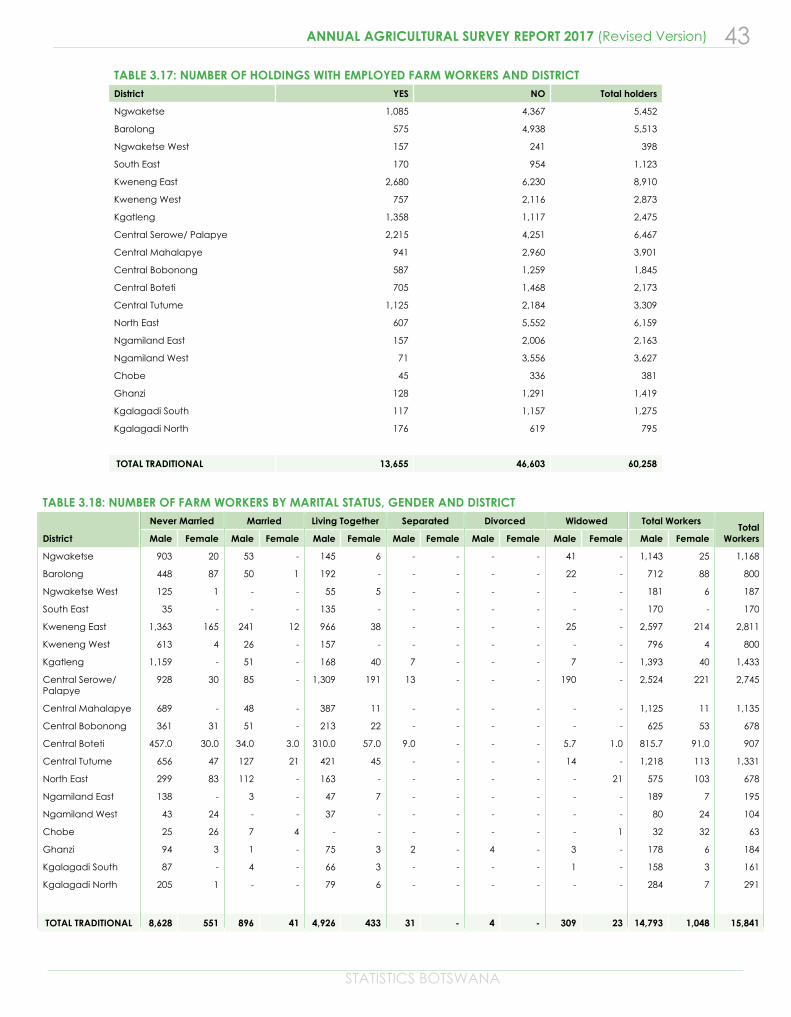
The results show that, 22.7 percent of the farmers employed farm workers during the 2017 agricultural season (Table 3.17). The majority of these farm workers are males accounting for 93.4 percent and 57.9 percent of the workers have never been married (Table 3.18).
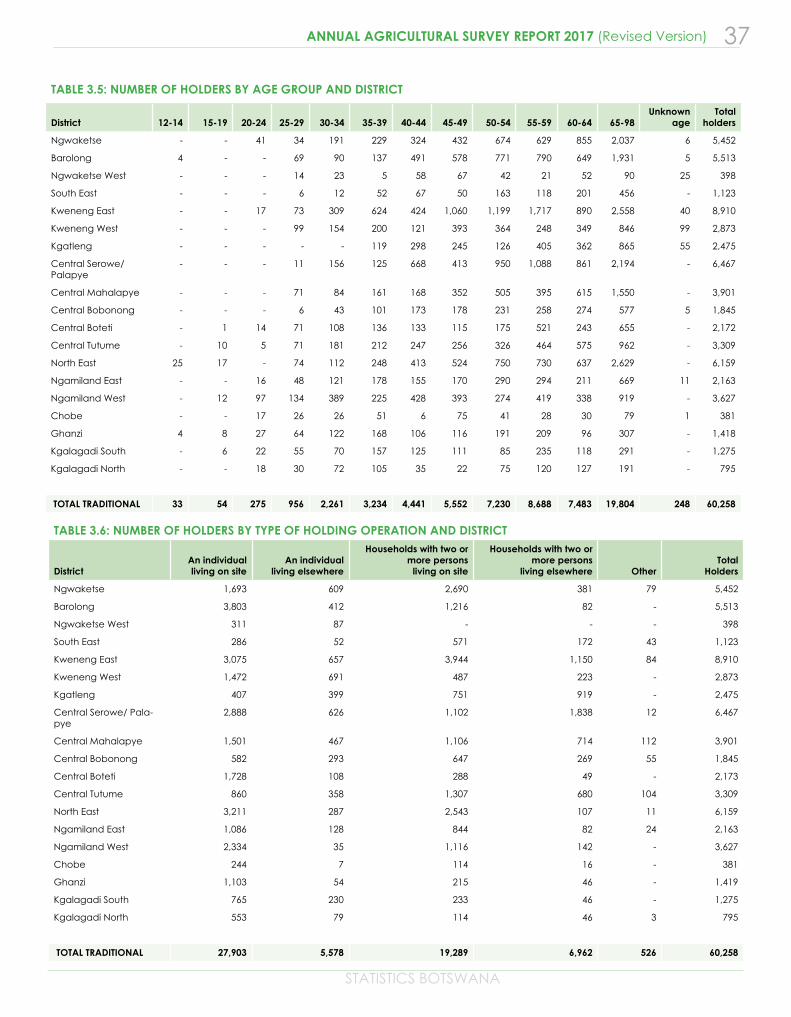
The participation of the youth in agriculture is still low according to the 2017 survey results. Out of a total of 60, 258 traditional holders countrywide, only 5.9 percent were aged between 15 and 35 years. The majority of farmers (32.9 percent) were in the age group 65 and above, followed by those in the 55-59 years category at 14.4 percent (Table 3.5). 2.2: Livestock Statistics
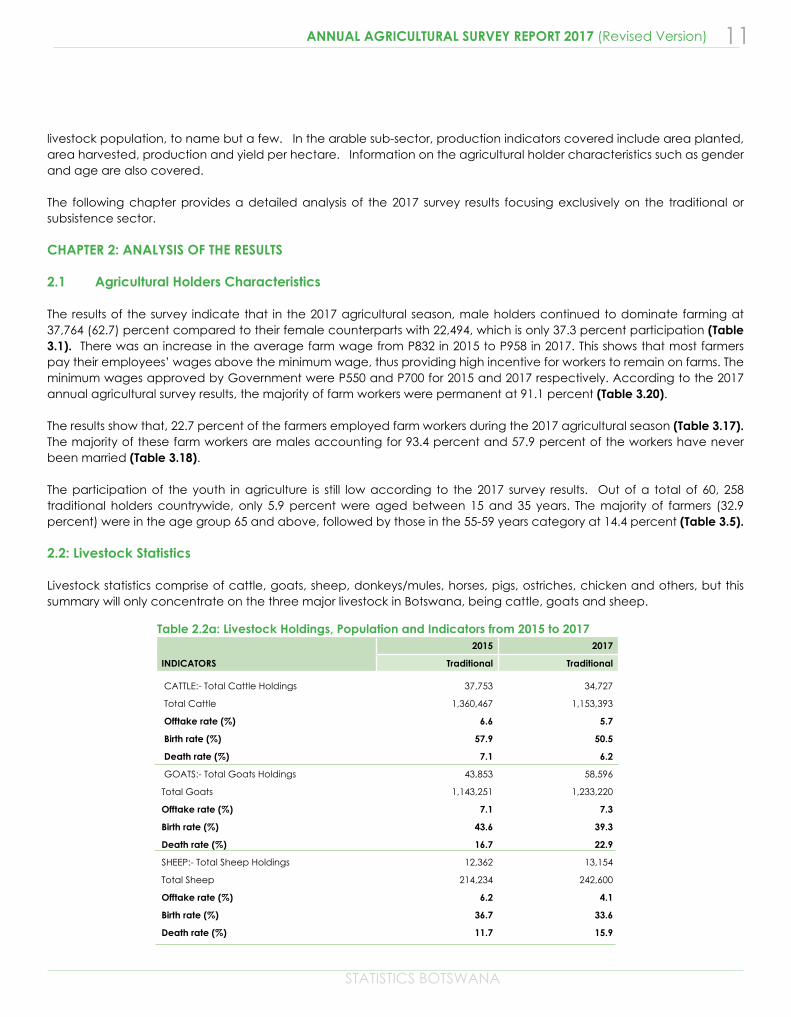
Livestock statistics comprise of cattle, goats, sheep, donkeys/mules, horses, pigs, ostriches, chicken and others, but this summary will only concentrate on the three major livestock in Botswana, being cattle, goats and sheep.
Table 2.2a: Livestock Holdings, Population and Indicators from 2015 to 2017
INDICATORS
2015 2017
Traditional Traditional
CATTLE:- Total Cattle Holdings 37,753 34,727
Total Cattle 1,360,467 1,153,393
Offtake rate (%) 6.6 5.7
Birth rate (%) 57.9 50.5
Death rate (%) 7.1 6.2
GOATS:- Total Goats Holdings 43,853 58,596
Total Goats 1,143,251 1,233,220
Offtake rate (%) 7.1 7.3
Birth rate (%) 43.6 39.3
Death rate (%) 16.7 22.9
SHEEP:- Total Sheep Holdings 12,362 13,154
Total Sheep 214,234 242,600
Offtake rate (%) 6.2 4.1
Birth rate (%) 36.7 33.6
Death rate (%) 11.7 15.9
12
STATISTICS BOTSWANA
ANNUAL AGRICULTURAL SURVEY REPORT 2017 (Revised Version)
Table 2.2a above indicates that the 2017 agricultural season registered a decrease in cattle population and an increase in goats and sheep population compared to the 2015 agricultural season. Cattle population reduced to 1,153,393 in 2017 from 1,360,467 in 2015. For the same period, goats’ population increased from 1,143,251 to 1,233,220 and sheep population also increased from 214,234 to 242,600. It is worth noting that, goat rearing is most popular with 97.2 percent compared to 57.6 percent for cattle and 21.8 percent for sheep holdings (Table 2.2a).
In terms of gender parity, the 2017 survey results reveal that males are the majority owners of livestock in the traditional sector. They own 73.8 percent of cattle, 62.4 percent of goats and 73.0 percent of sheep (Tables 4.1A, 5.1A and 5.7). The Central Serowe/Palapye district has the highest number of cattle population at 226,510 while the highest number of goats is 229,647 and sheep is 46,360 in Kweneng East district (Tables 4.1A, 5.1A and 5.7). For the past years, Central region has been dominating in terms of livestock population but Kweneng East district is now leading in respect of goats and sheep population.
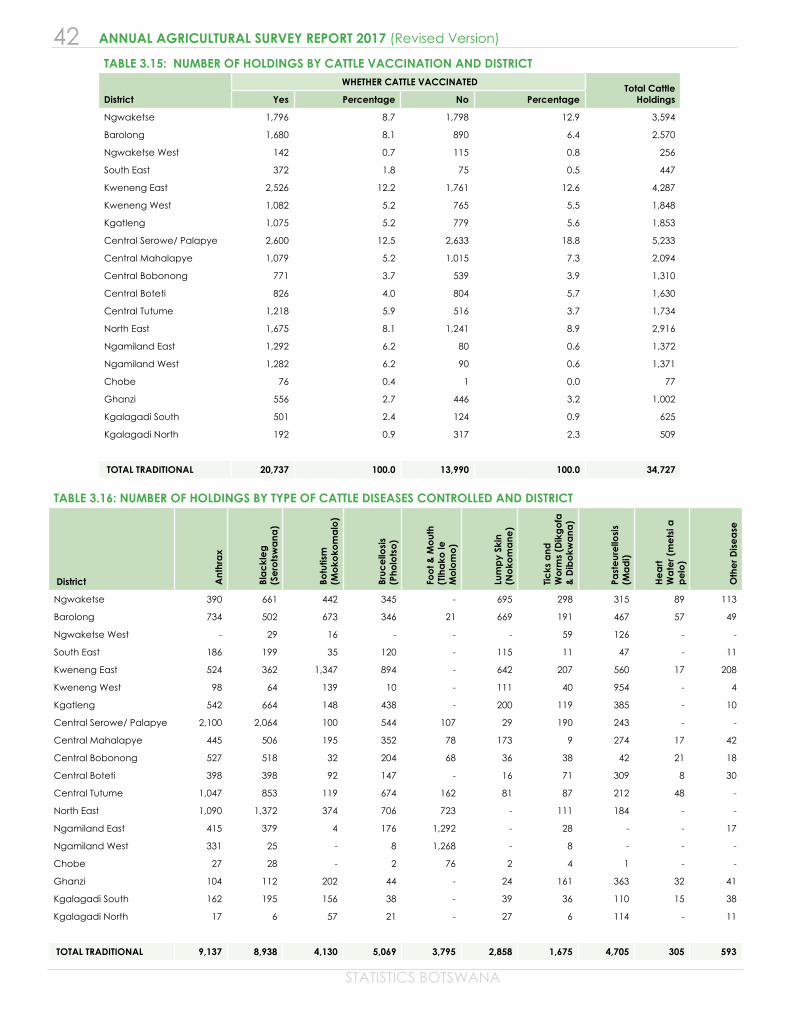
Supplementary feeding is not widely used in the traditional sector. Only 26.7 percent of cattle farmers practiced supplementary feeding while 18.5 percent and 25.2 percent of goats and sheep farmers respectively used supplementary feeds (Table 3.14). Notably, 59.7 percent of cattle farmers vaccinated their animals against various diseases (Tables 3.15). 2.2.1 Cattle Holdings and Population
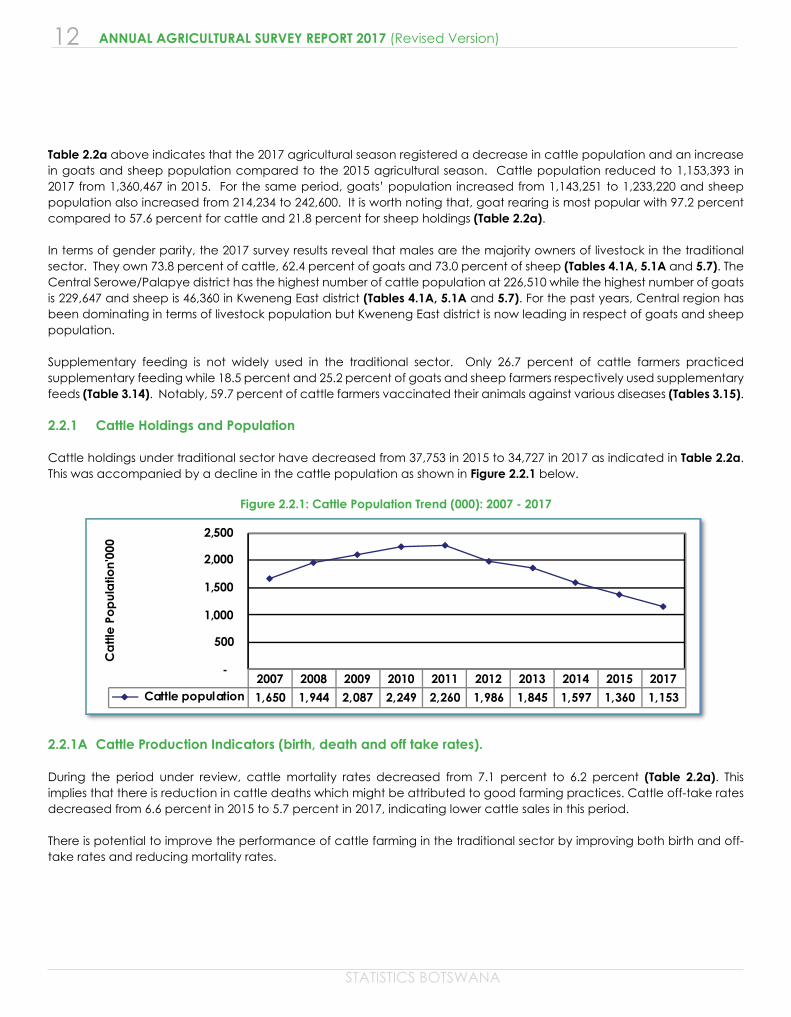
Cattle holdings under traditional sector have decreased from 37,753 in 2015 to 34,727 in 2017 as indicated in Table 2.2a. This was accompanied by a decline in the cattle population as shown in Figure 2.2.1 below.
Figure 2.2.1: Cattle Population Trend (000): 2007 - 2017
2.2.1A Cattle Production Indicators (birth, death and off take rates).
During the period under review, cattle mortality rates decreased from 7.1 percent to 6.2 percent (Table 2.2a). This implies that there is reduction in cattle deaths which might be attributed to good farming practices. Cattle off-take rates decreased from 6.6 percent in 2015 to 5.7 percent in 2017, indicating lower cattle sales in this period.
There is potential to improve the performance of cattle farming in the traditional sector by improving both birth and off-take rates and reducing mortality rates.
STATISTICS BOTSWANA
13ANNUAL AGRICULTURAL SURVEY REPORT 2017 (Revised Version)
2.2.2 Goats Holdings (Farmers) and Population Percent
Goats holdings increased from 43,853 in 2015 to 58,596 in 2017 (Table 2.2a). Likewise, the population of goats went up from 1,143,251 to 1,233,220 during the same period. However, goats’ population dropped extremely from 1,605,642 in 2014 to 1,143,251 in 2015 but increased to 1,233,220 in 2017.
As shown in Figure 2.2.2 below, goats’ population has not dropped below 1.6 million in the 10 year period except in 2013, 2015 and 2017 where it dropped to 1,500,215, 1,143,251 and 1,233,220 respectively.
Figure 2.2.2: Goats Population Trend: 2007 – 2017
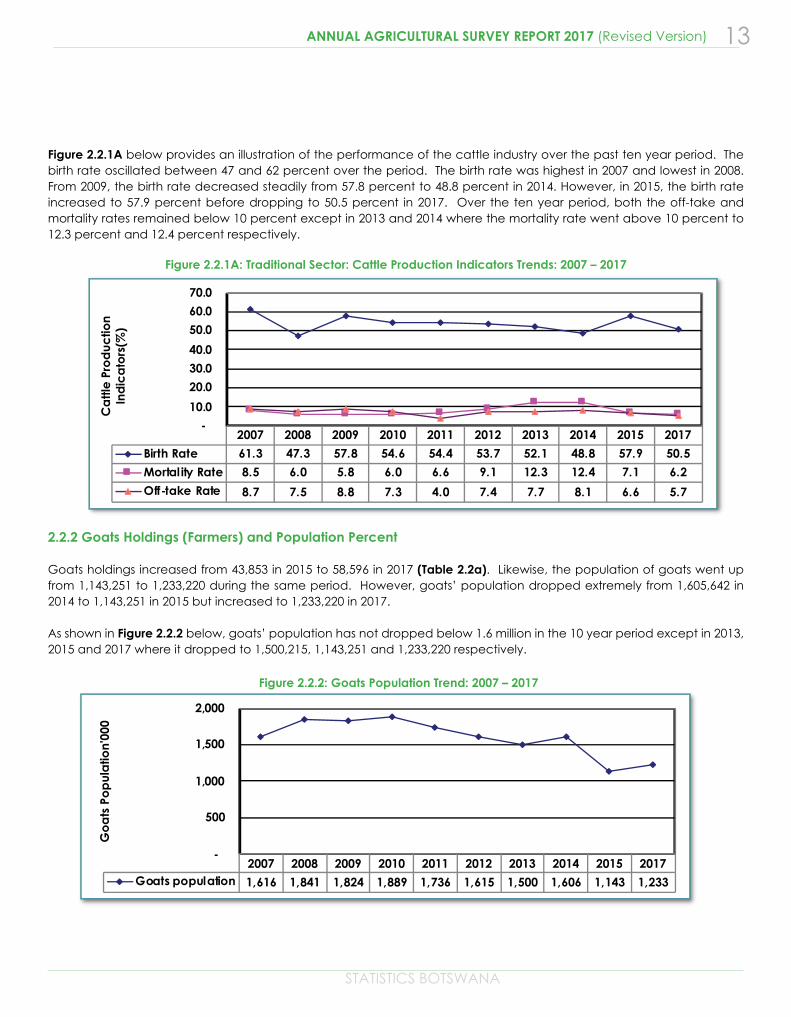
Figure 2.2.1A below provides an illustration of the performance of the cattle industry over the past ten year period. The birth rate oscillated between 47 and 62 percent over the period. The birth rate was highest in 2007 and lowest in 2008. From 2009, the birth rate decreased steadily from 57.8 percent to 48.8 percent in 2014. However, in 2015, the birth rate increased to 57.9 percent before dropping to 50.5 percent in 2017. Over the ten year period, both the off-take and mortality rates remained below 10 percent except in 2013 and 2014 where the mortality rate went above 10 percent to 12.3 percent and 12.4 percent respectively.
Figure 2.2.1A: Traditional Sector: Cattle Production Indicators Trends: 2007 – 2017
14
STATISTICS BOTSWANA
ANNUAL AGRICULTURAL SURVEY REPORT 2017 (Revised Version)
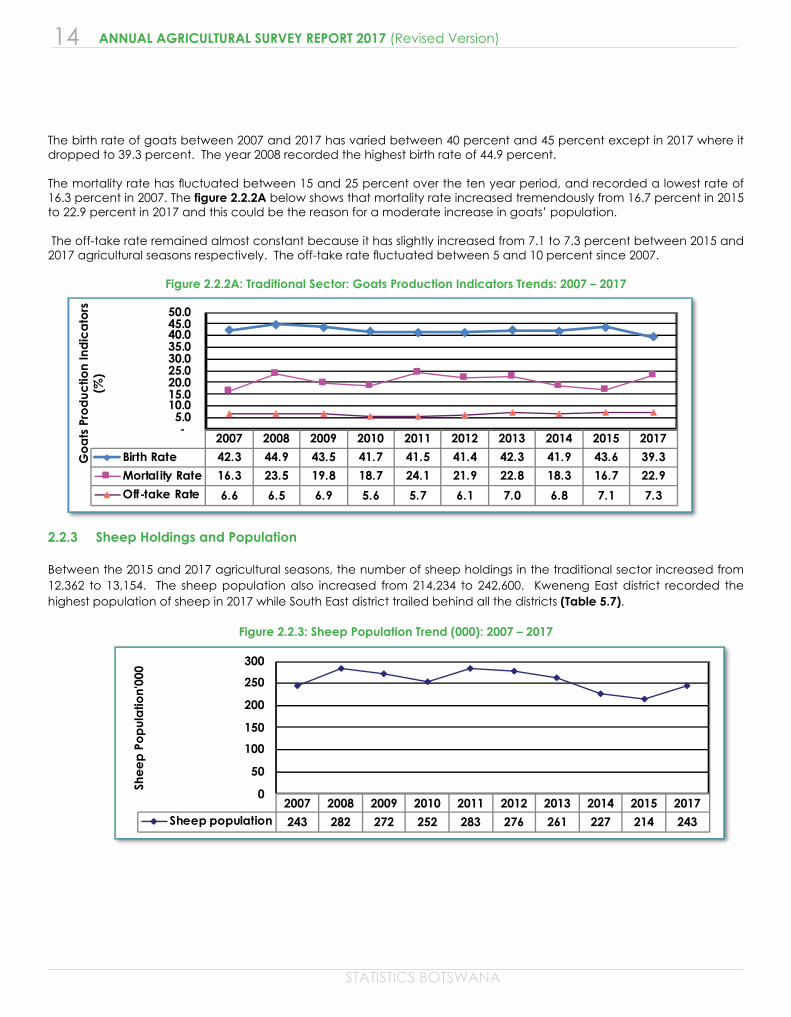
The birth rate of goats between 2007 and 2017 has varied between 40 percent and 45 percent except in 2017 where it dropped to 39.3 percent. The year 2008 recorded the highest birth rate of 44.9 percent.
The mortality rate has fluctuated between 15 and 25 percent over the ten year period, and recorded a lowest rate of 16.3 percent in 2007. The figure 2.2.2A below shows that mortality rate increased tremendously from 16.7 percent in 2015 to 22.9 percent in 2017 and this could be the reason for a moderate increase in goats’ population.
The off-take rate remained almost constant because it has slightly increased from 7.1 to 7.3 percent between 2015 and 2017 agricultural seasons respectively. The off-take rate fluctuated between 5 and 10 percent since 2007.
Figure 2.2.2A: Traditional Sector: Goats Production Indicators Trends: 2007 – 2017
2.2.3 Sheep Holdings and Population
Between the 2015 and 2017 agricultural seasons, the number of sheep holdings in the traditional sector increased from 12,362 to 13,154. The sheep population also increased from 214,234 to 242,600. Kweneng East district recorded the highest population of sheep in 2017 while South East district trailed behind all the districts (Table 5.7).
Figure 2.2.3: Sheep Population Trend (000): 2007 – 2017
STATISTICS BOTSWANA
15ANNUAL AGRICULTURAL SURVEY REPORT 2017 (Revised Version)
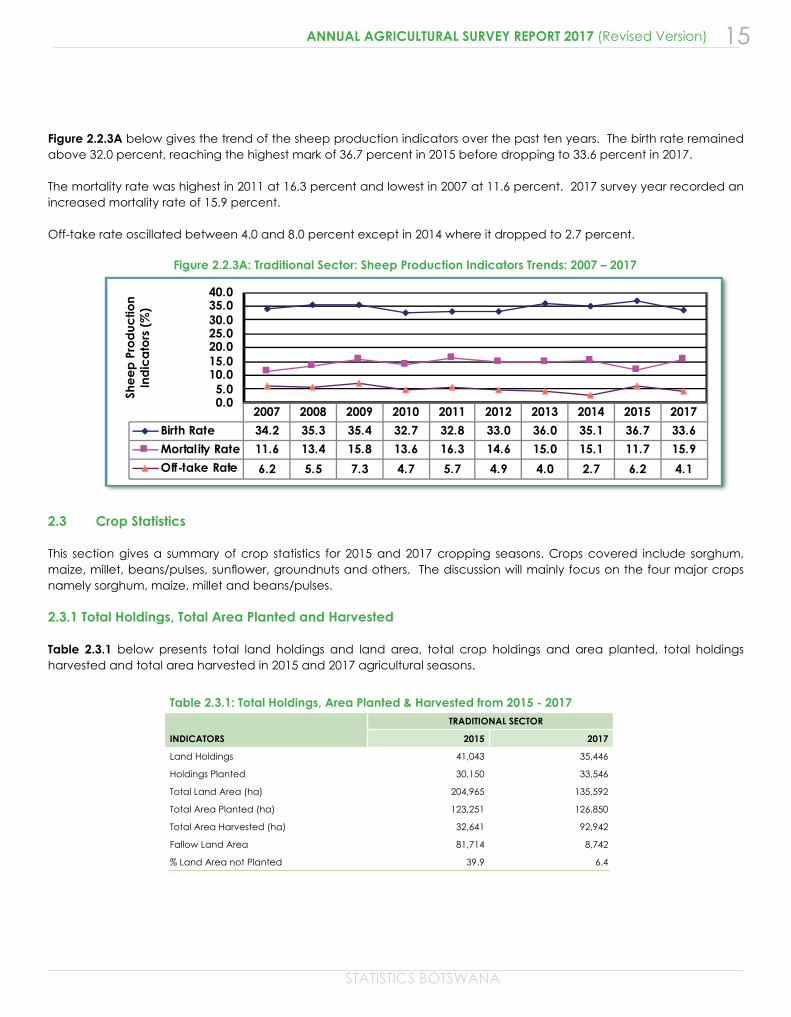
Figure 2.2.3A: Traditional Sector: Sheep Production Indicators Trends: 2007 – 2017
Figure 2.2.3A below gives the trend of the sheep production indicators over the past ten years. The birth rate remained above 32.0 percent, reaching the highest mark of 36.7 percent in 2015 before dropping to 33.6 percent in 2017.
The mortality rate was highest in 2011 at 16.3 percent and lowest in 2007 at 11.6 percent. 2017 survey year recorded an increased mortality rate of 15.9 percent. Off-take rate oscillated between 4.0 and 8.0 percent except in 2014 where it dropped to 2.7 percent.
2.3 Crop Statistics
This section gives a summary of crop statistics for 2015 and 2017 cropping seasons. Crops covered include sorghum, maize, millet, beans/pulses, sunflower, groundnuts and others. The discussion will mainly focus on the four major crops namely sorghum, maize, millet and beans/pulses.
2.3.1 Total Holdings, Total Area Planted and Harvested
Table 2.3.1 below presents total land holdings and land area, total crop holdings and area planted, total holdings harvested and total area harvested in 2015 and 2017 agricultural seasons.
Table 2.3.1: Total Holdings, Area Planted & Harvested from 2015 - 2017
INDICATORS
TRADITIONAL SECTOR
2015 2017
Land Holdings 41,043 35,446
Holdings Planted 30,150 33,546
Total Land Area (ha) 204,965 135,592
Total Area Planted (ha) 123,251 126,850
Total Area Harvested (ha) 32,641 92,942
Fallow Land Area 81,714 8,742
% Land Area not Planted 39.9 6.4
16
STATISTICS BOTSWANA
ANNUAL AGRICULTURAL SURVEY REPORT 2017 (Revised Version)
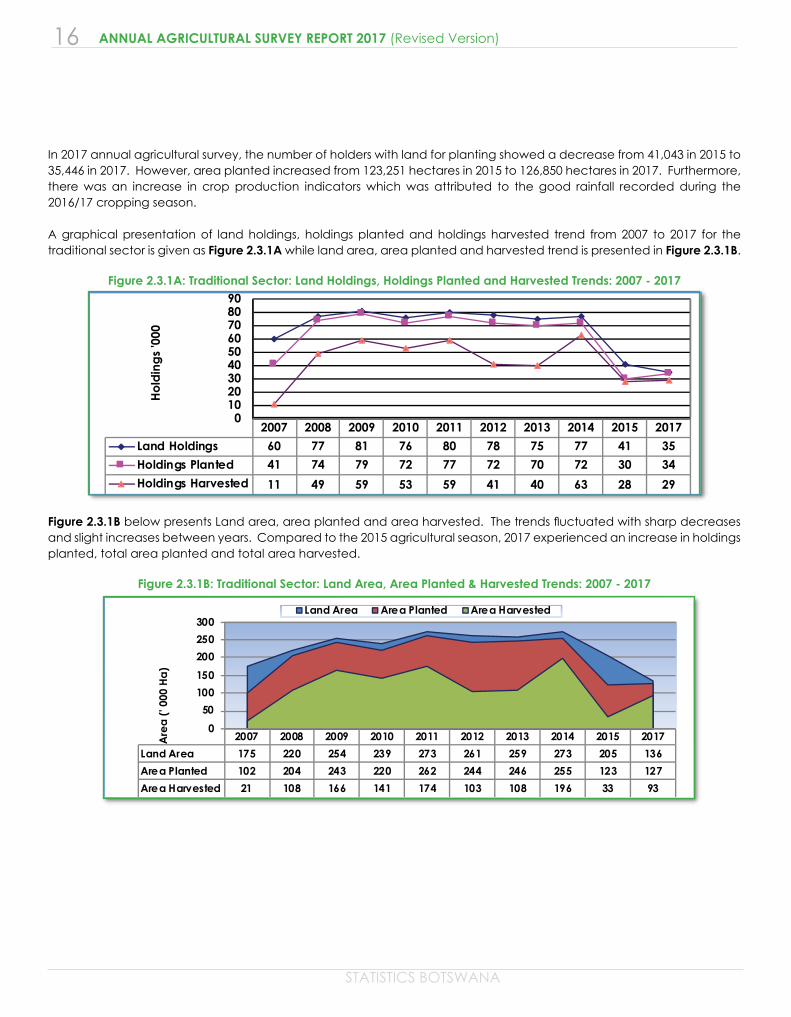
In 2017 annual agricultural survey, the number of holders with land for planting showed a decrease from 41,043 in 2015 to 35,446 in 2017. However, area planted increased from 123,251 hectares in 2015 to 126,850 hectares in 2017. Furthermore, there was an increase in crop production indicators which was attributed to the good rainfall recorded during the 2016/17 cropping season.
A graphical presentation of land holdings, holdings planted and holdings harvested trend from 2007 to 2017 for the traditional sector is given as Figure 2.3.1A while land area, area planted and harvested trend is presented in Figure 2.3.1B.
Figure 2.3.1A: Traditional Sector: Land Holdings, Holdings Planted and Harvested Trends: 2007 - 2017
Figure 2.3.1B below presents Land area, area planted and area harvested. The trends fluctuated with sharp decreases and slight increases between years. Compared to the 2015 agricultural season, 2017 experienced an increase in holdings planted, total area planted and total area harvested.
Figure 2.3.1B: Traditional Sector: Land Area, Area Planted & Harvested Trends: 2007 - 2017
STATISTICS BOTSWANA
17ANNUAL AGRICULTURAL SURVEY REPORT 2017 (Revised Version)
Table 2.3.2: Area Planted, Harvested, Production and Yields; 2015 and 2017
INDICATORS
TRADITIONAL SECTOR
2015 2017
Sorghum
Total Sorghum Holdings 18,226 19,916
Total Area Planted(ha) 23,223 23,759
Area Harvested (ha) 7,925 16,480
Production (Metric Tons) 1,927 5,973
Yield Per hectare Planted 83 251
Yield Per Hectare Harvested 243 362
Maize
Total Maize Holdings 31,154 35,041
Total Area Planted(ha) 61,803 61,684
Area Harvested (ha) 13,318 50,941
Production (Metric Tons) 1,417 13,867
Yield Per hectare Planted 23 225
Yield Per Hectare Harvested 106 272
Millet
Total Millet Holdings 6,565 6,260
Total Area Planted(ha) 4,981 3,133
Area Harvested (ha) 2,750 2,543
Production (Metric Tons) 513 1,100
Yield Per hectare Planted 103 351
Yield Per Hectare Harvested 187 433
Pulses/Beans
Total Beans/Pulses Holdings 36,595 35,863
Total Area Planted(ha) 22,573 27,223
Area Harvested (ha) 5,639 15,573
Production (Metric Tons) 796 2,343
Yield Per hectare Planted 35 86
Yield Per Hectare Harvested 141 150
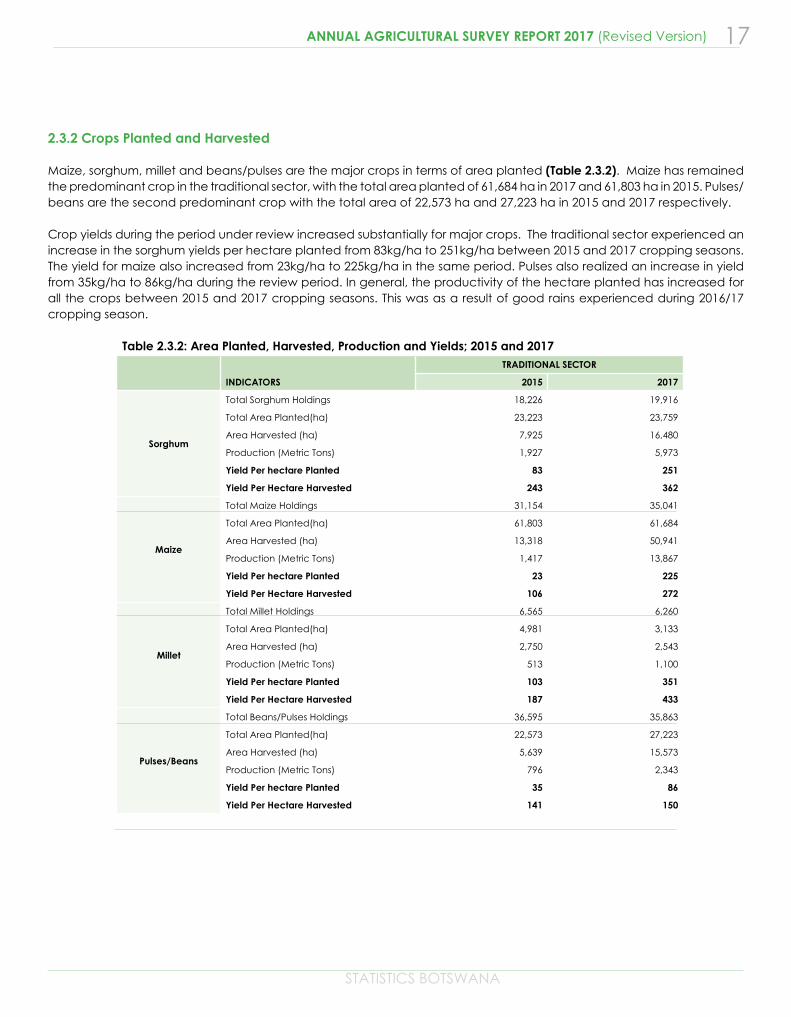
2.3.2 Crops Planted and Harvested
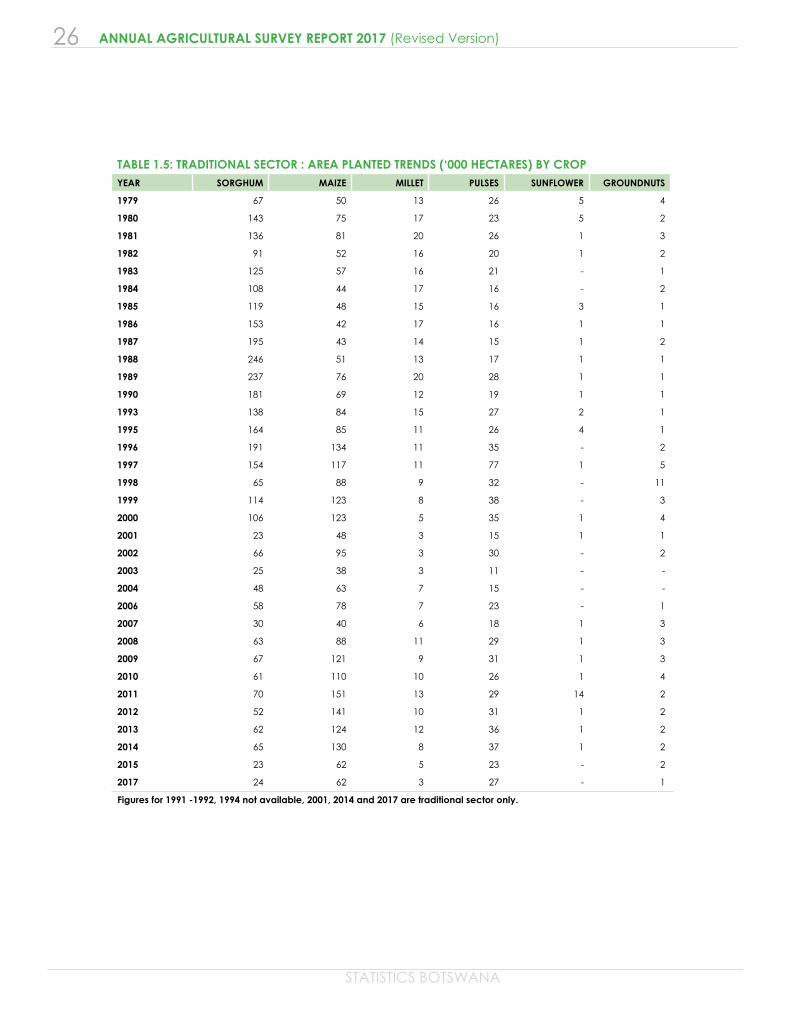
Maize, sorghum, millet and beans/pulses are the major crops in terms of area planted (Table 2.3.2). Maize has remained the predominant crop in the traditional sector, with the total area planted of 61,684 ha in 2017 and 61,803 ha in 2015. Pulses/beans are the second predominant crop with the total area of 22,573 ha and 27,223 ha in 2015 and 2017 respectively.
Crop yields during the period under review increased substantially for major crops. The traditional sector experienced an increase in the sorghum yields per hectare planted from 83kg/ha to 251kg/ha between 2015 and 2017 cropping seasons. The yield for maize also increased from 23kg/ha to 225kg/ha in the same period. Pulses also realized an increase in yield from 35kg/ha to 86kg/ha during the review period. In general, the productivity of the hectare planted has increased for all the crops between 2015 and 2017 cropping seasons. This was as a result of good rains experienced during 2016/17 cropping season.
18
STATISTICS BOTSWANA
ANNUAL AGRICULTURAL SURVEY REPORT 2017 (Revised Version)
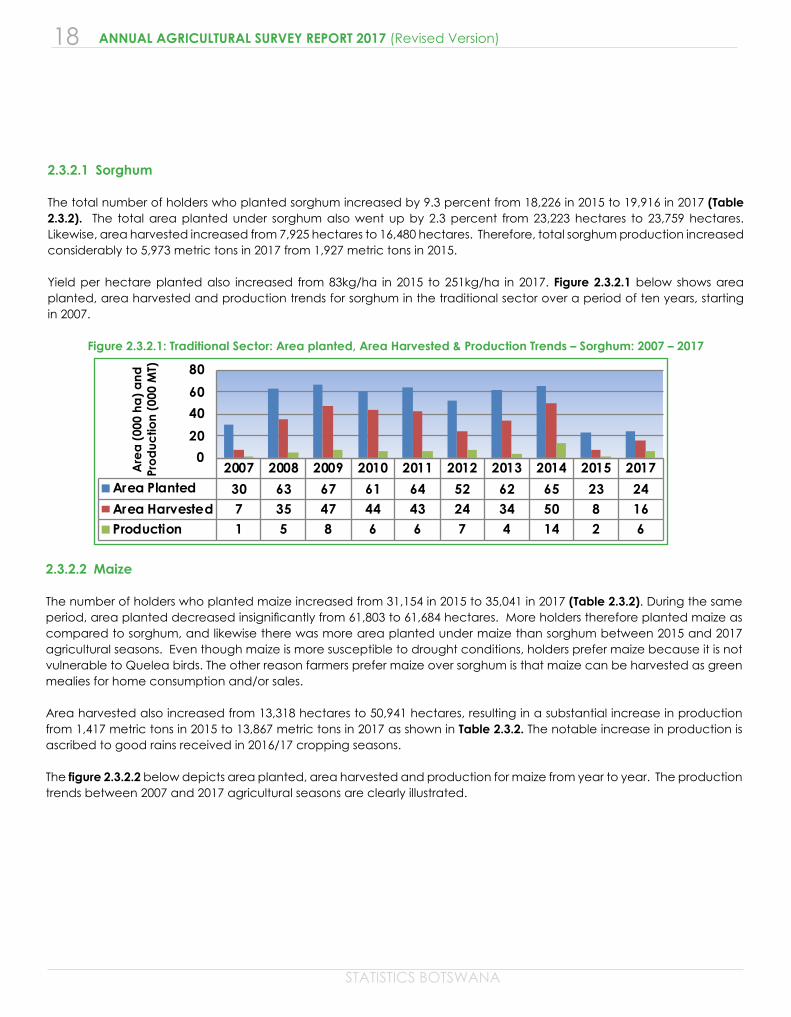
2.3.2.1 Sorghum
The total number of holders who planted sorghum increased by 9.3 percent from 18,226 in 2015 to 19,916 in 2017 (Table 2.3.2). The total area planted under sorghum also went up by 2.3 percent from 23,223 hectares to 23,759 hectares. Likewise, area harvested increased from 7,925 hectares to 16,480 hectares. Therefore, total sorghum production increased considerably to 5,973 metric tons in 2017 from 1,927 metric tons in 2015.
Yield per hectare planted also increased from 83kg/ha in 2015 to 251kg/ha in 2017. Figure 2.3.2.1 below shows area planted, area harvested and production trends for sorghum in the traditional sector over a period of ten years, starting in 2007.
Figure 2.3.2.1: Traditional Sector: Area planted, Area Harvested & Production Trends – Sorghum: 2007 – 2017
2.3.2.2 Maize
The number of holders who planted maize increased from 31,154 in 2015 to 35,041 in 2017 (Table 2.3.2). During the same period, area planted decreased insignificantly from 61,803 to 61,684 hectares. More holders therefore planted maize as compared to sorghum, and likewise there was more area planted under maize than sorghum between 2015 and 2017 agricultural seasons. Even though maize is more susceptible to drought conditions, holders prefer maize because it is not vulnerable to Quelea birds. The other reason farmers prefer maize over sorghum is that maize can be harvested as green mealies for home consumption and/or sales.
Area harvested also increased from 13,318 hectares to 50,941 hectares, resulting in a substantial increase in production from 1,417 metric tons in 2015 to 13,867 metric tons in 2017 as shown in Table 2.3.2. The notable increase in production is ascribed to good rains received in 2016/17 cropping seasons.
The figure 2.3.2.2 below depicts area planted, area harvested and production for maize from year to year. The production trends between 2007 and 2017 agricultural seasons are clearly illustrated.
2007 2008 2009 2010 2011 2012 2013 2014 2015 2017Area Planted 30 63 67 61 64 52 62 65 23 24Area Harvested 7 35 47 44 43 24 34 50 8 16Production 1 5 8 6 6 7 4 14 2 6
020406080
Are
a (0
00 h
a) a
nd
Prod
uctio
n (0
00 M
T)
STATISTICS BOTSWANA
19ANNUAL AGRICULTURAL SURVEY REPORT 2017 (Revised Version)
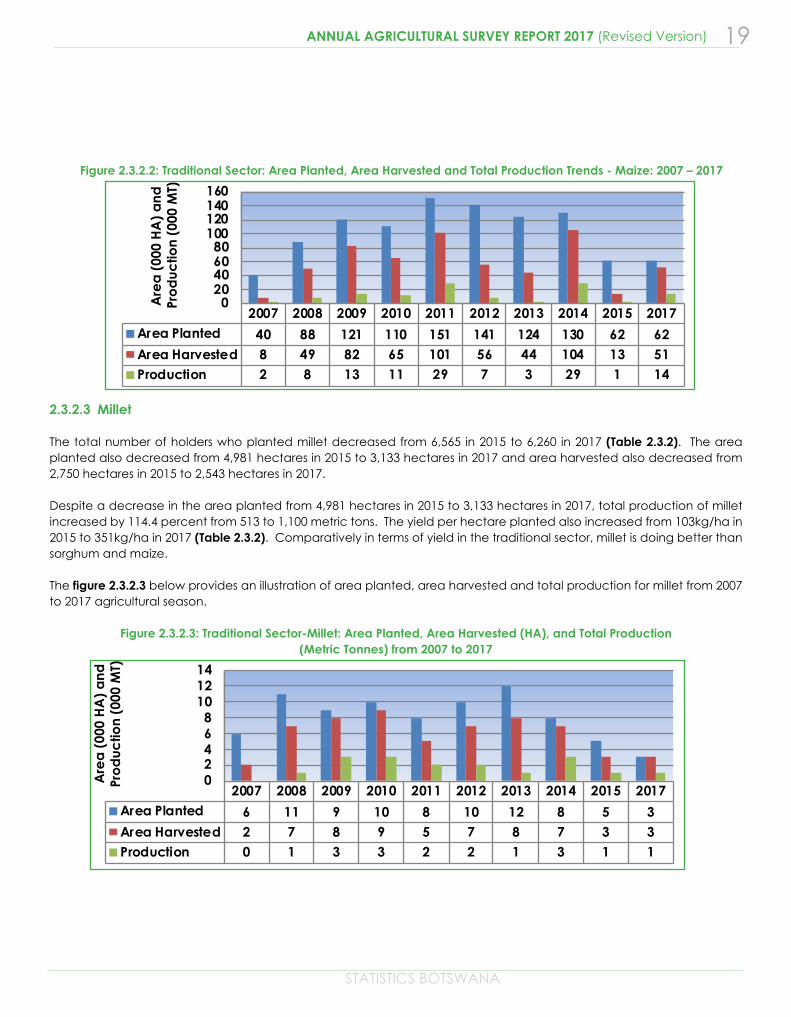
2.3.2.3 Millet
The total number of holders who planted millet decreased from 6,565 in 2015 to 6,260 in 2017 (Table 2.3.2). The area planted also decreased from 4,981 hectares in 2015 to 3,133 hectares in 2017 and area harvested also decreased from 2,750 hectares in 2015 to 2,543 hectares in 2017.
Despite a decrease in the area planted from 4,981 hectares in 2015 to 3,133 hectares in 2017, total production of millet increased by 114.4 percent from 513 to 1,100 metric tons. The yield per hectare planted also increased from 103kg/ha in 2015 to 351kg/ha in 2017 (Table 2.3.2). Comparatively in terms of yield in the traditional sector, millet is doing better than sorghum and maize.
The figure 2.3.2.3 below provides an illustration of area planted, area harvested and total production for millet from 2007 to 2017 agricultural season.
Figure 2.3.2.3: Traditional Sector-Millet: Area Planted, Area Harvested (HA), and Total Production (Metric Tonnes) from 2007 to 2017
Figure 2.3.2.2: Traditional Sector: Area Planted, Area Harvested and Total Production Trends - Maize: 2007 – 2017
2007 2008 2009 2010 2011 2012 2013 2014 2015 2017Area Planted 40 88 121 110 151 141 124 130 62 62Area Harvested 8 49 82 65 101 56 44 104 13 51Production 2 8 13 11 29 7 3 29 1 14
020406080
100120140160
Are
a (0
00 H
A) a
nd
Prod
uctio
n (0
00 M
T)
2007 2008 2009 2010 2011 2012 2013 2014 2015 2017Area Planted 6 11 9 10 8 10 12 8 5 3Area Harvested 2 7 8 9 5 7 8 7 3 3Production 0 1 3 3 2 2 1 3 1 1
02468
101214
Are
a (0
00 H
A) a
nd
Prod
uctio
n (0
00 M
T)
20
STATISTICS BOTSWANA
ANNUAL AGRICULTURAL SURVEY REPORT 2017 (Revised Version)
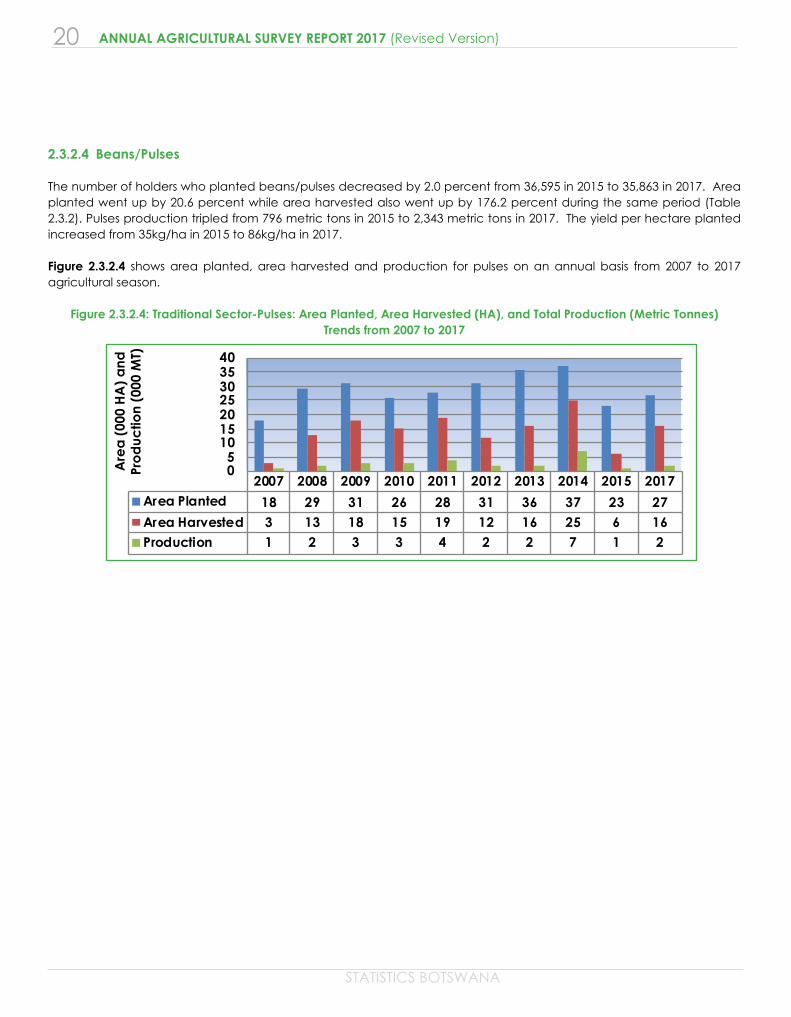
2.3.2.4 Beans/Pulses
The number of holders who planted beans/pulses decreased by 2.0 percent from 36,595 in 2015 to 35,863 in 2017. Area planted went up by 20.6 percent while area harvested also went up by 176.2 percent during the same period (Table 2.3.2). Pulses production tripled from 796 metric tons in 2015 to 2,343 metric tons in 2017. The yield per hectare planted increased from 35kg/ha in 2015 to 86kg/ha in 2017. Figure 2.3.2.4 shows area planted, area harvested and production for pulses on an annual basis from 2007 to 2017 agricultural season.
Figure 2.3.2.4: Traditional Sector-Pulses: Area Planted, Area Harvested (HA), and Total Production (Metric Tonnes) Trends from 2007 to 2017
TIME SERIES DATA TABLES
22
STATISTICS BOTSWANA
ANNUAL AGRICULTURAL SURVEY REPORT 2017 (Revised Version)
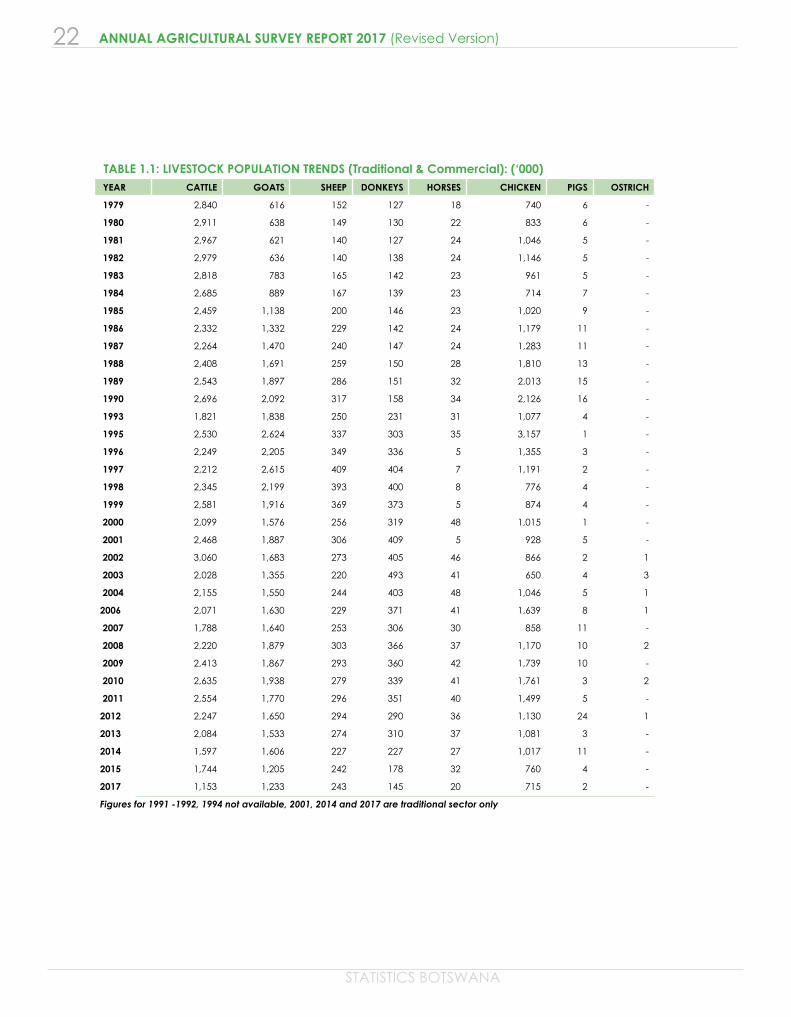
TABLE 1.1: LIVESTOCK POPULATION TRENDS (Traditional & Commercial): (‘000) YEAR CATTLE GOATS SHEEP DONKEYS HORSES CHICKEN PIGS OSTRICH
1979 2,840 616 152 127 18 740 6 -
1980 2,911 638 149 130 22 833 6 -
1981 2,967 621 140 127 24 1,046 5 -
1982 2,979 636 140 138 24 1,146 5 -
1983 2,818 783 165 142 23 961 5 -
1984 2,685 889 167 139 23 714 7 -
1985 2,459 1,138 200 146 23 1,020 9 -
1986 2,332 1,332 229 142 24 1,179 11 -
1987 2,264 1,470 240 147 24 1,283 11 -
1988 2,408 1,691 259 150 28 1,810 13 -
1989 2,543 1,897 286 151 32 2,013 15 -
1990 2,696 2,092 317 158 34 2,126 16 -
1993 1,821 1,838 250 231 31 1,077 4 -
1995 2,530 2,624 337 303 35 3,157 1 -
1996 2,249 2,205 349 336 5 1,355 3 -
1997 2,212 2,615 409 404 7 1,191 2 -
1998 2,345 2,199 393 400 8 776 4 -
1999 2,581 1,916 369 373 5 874 4 -
2000 2,099 1,576 256 319 48 1,015 1 -
2001 2,468 1,887 306 409 5 928 5 -
2002 3,060 1,683 273 405 46 866 2 1
2003 2,028 1,355 220 493 41 650 4 3
2004 2,155 1,550 244 403 48 1,046 5 1
2006 2,071 1,630 229 371 41 1,639 8 1
2007 1,788 1,640 253 306 30 858 11 -
2008 2,220 1,879 303 366 37 1,170 10 2
2009 2,413 1,867 293 360 42 1,739 10 -
2010 2,635 1,938 279 339 41 1,761 3 2
2011 2,554 1,770 296 351 40 1,499 5 -
2012 2,247 1,650 294 290 36 1,130 24 1
2013 2,084 1,533 274 310 37 1,081 3 -
2014 1,597 1,606 227 227 27 1,017 11 -
2015 1,744 1,205 242 178 32 760 4 -
2017 1,153 1,233 243 145 20 715 2 -
Figures for 1991 -1992, 1994 not available, 2001, 2014 and 2017 are traditional sector only
STATISTICS BOTSWANA
23ANNUAL AGRICULTURAL SURVEY REPORT 2017 (Revised Version)
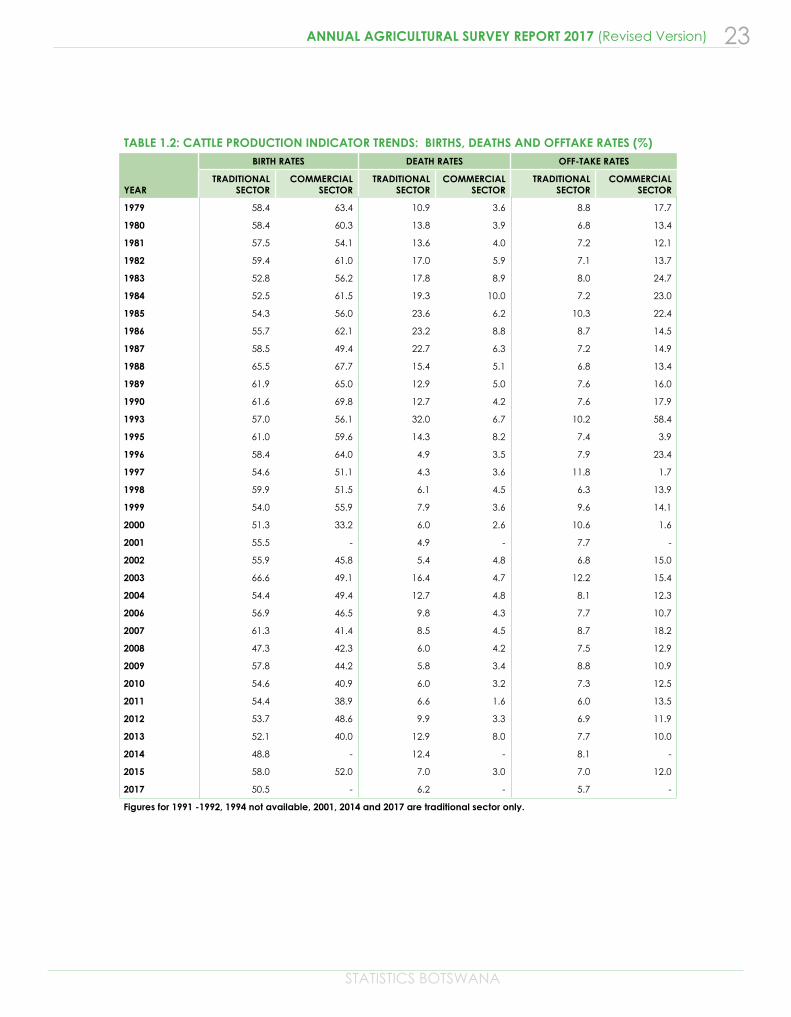
TABLE 1.2: CATTLE PRODUCTION INDICATOR TRENDS: BIRTHS, DEATHS AND OFFTAKE RATES (%)
YEAR
BIRTH RATES DEATH RATES OFF-TAKE RATES
TRADITIONAL SECTOR
COMMERCIAL SECTOR
TRADITIONAL SECTOR
COMMERCIAL SECTOR
TRADITIONAL SECTOR
COMMERCIAL SECTOR
1979 58.4 63.4 10.9 3.6 8.8 17.7
1980 58.4 60.3 13.8 3.9 6.8 13.4
1981 57.5 54.1 13.6 4.0 7.2 12.1
1982 59.4 61.0 17.0 5.9 7.1 13.7
1983 52.8 56.2 17.8 8.9 8.0 24.7
1984 52.5 61.5 19.3 10.0 7.2 23.0
1985 54.3 56.0 23.6 6.2 10.3 22.4
1986 55.7 62.1 23.2 8.8 8.7 14.5
1987 58.5 49.4 22.7 6.3 7.2 14.9
1988 65.5 67.7 15.4 5.1 6.8 13.4
1989 61.9 65.0 12.9 5.0 7.6 16.0
1990 61.6 69.8 12.7 4.2 7.6 17.9
1993 57.0 56.1 32.0 6.7 10.2 58.4
1995 61.0 59.6 14.3 8.2 7.4 3.9
1996 58.4 64.0 4.9 3.5 7.9 23.4
1997 54.6 51.1 4.3 3.6 11.8 1.7
1998 59.9 51.5 6.1 4.5 6.3 13.9
1999 54.0 55.9 7.9 3.6 9.6 14.1
2000 51.3 33.2 6.0 2.6 10.6 1.6
2001 55.5 - 4.9 - 7.7 -
2002 55.9 45.8 5.4 4.8 6.8 15.0
2003 66.6 49.1 16.4 4.7 12.2 15.4
2004 54.4 49.4 12.7 4.8 8.1 12.3
2006 56.9 46.5 9.8 4.3 7.7 10.7
2007 61.3 41.4 8.5 4.5 8.7 18.2
2008 47.3 42.3 6.0 4.2 7.5 12.9
2009 57.8 44.2 5.8 3.4 8.8 10.9
2010 54.6 40.9 6.0 3.2 7.3 12.5
2011 54.4 38.9 6.6 1.6 6.0 13.5
2012 53.7 48.6 9.9 3.3 6.9 11.9
2013 52.1 40.0 12.9 8.0 7.7 10.0
2014 48.8 - 12.4 - 8.1 -
2015 58.0 52.0 7.0 3.0 7.0 12.0
2017 50.5 - 6.2 - 5.7 -
Figures for 1991 -1992, 1994 not available, 2001, 2014 and 2017 are traditional sector only.
24
STATISTICS BOTSWANA
ANNUAL AGRICULTURAL SURVEY REPORT 2017 (Revised Version)
TABLE 1.3: GOATS PRODUCTION INDICATOR TRENDS: BIRTHS, DEATHS AND OFFTAKE RATES (%)
YEAR
BIRTH RATES DEATH RATES OFF-TAKE RATES
TRADITIONAL SECTOR
COMMERCIAL SECTOR
TRADITIONAL SECTOR
COMMERCIAL SECTOR
TRADITIONAL SECTOR
COMMERCIAL SECTOR
1979 42.1 36.7 45.9 17.5 9.3 15.8
1980 45.0 40.7 34.7 20.7 7.1 8.9
1981 44.0 40.1 32.1 24.7 7.0 13.2
1982 42.1 42.2 27.6 16.2 8.2 14.6
1983 44.6 38.5 22.5 23.1 6.2 12.0
1984 41.9 39.0 25.4 22.4 6.8 18.7
1985 40.6 37.3 19.7 19.2 5.7 12.0
1986 40.9 42.2 18.2 16.8 6.3 11.5
1987 40.3 37.8 20.9 18.0 7.2 14.9
1988 42.9 44.9 19.7 13.3 9.0 15.3
1989 41.4 47.2 19.5 11.6 10.9 23.1
1990 40.2 44.2 19.7 17.4 11.1 18.2
1993 49.6 42.5 38.4 22.8 9.8 12.4
1995 43.7 42.4 18.6 23.3 6.5 10.2
1996 43.3 41.6 22.7 27.9 7.7 17.4
1997 42.7 40.5 23.6 21.1 6.8 10.0
1998 46.4 34.7 30.6 21.3 9.0 12.8
1999 45.5 39.0 37.4 23.1 8.8 14.5
2000 45.3 42.1 22.4 17.2 6.9 7.1
2001 43.8 - 17.7 - 5.7 -
2002 42.6 38.4 26.8 27.7 6.5 10.7
2003 46.7 37.1 23.9 20.8 8.6 13.8
2004 48.2 37.9 21.9 20.7 7.2 9.7
2006 42.5 42.6 22.1 22.3 7.5 12.1
2007 42.3 36.6 16.3 16.4 6.6 6.8
2008 44.9 39.9 23.5 23.1 6.5 10.4
2009 43.5 37.6 19.8 13.2 6.9 9.5
2010 41.7 36.7 18.7 15.0 5.6 9.8
2011 41.5 39.5 24.1 21.1 10.9 5.8
2012 41.4 39.9 21.8 23.5 6.0 8.7
2013 42.3 40.0 22.8 25.0 7.0 10.0
2014 41.9 - 18.3 - 6.8 -
2015 44.0 39.0 17.0 16.0 7.0 10.0
2017 39.3 - 22.9 - 7.3 -
Figures for 1991 -1992, 1994 not available, 2001, 2014 and 2017 are traditional sector only.
STATISTICS BOTSWANA
25ANNUAL AGRICULTURAL SURVEY REPORT 2017 (Revised Version)
TABLE 1.4: SHEEP PRODUCTION INDICATOR TRENDS: BIRTHS, DEATHS AND OFFTAKE RATES (%)
YEAR
BIRTH RATES DEATH RATES OFF-TAKE RATES
TRADITIONAL SECTOR
COMMERCIAL SECTOR
TRADITIONAL SECTOR
COMMERCIAL SECTOR
TRADITIONAL SECTOR
COMMERCIAL SECTOR
1979 33.7 33.8 38.9 15.4 7.9 13.8
1980 45.4 39.3 32.1 16.6 16.7 5.5
1981 36.0 36.4 25.6 19.3 8.8 11.8
1982 39.8 29.6 38.1 17.5 7.8 10.0
1983 36.2 34.1 22.2 19.3 9.9 18.1
1984 35.8 38.3 23.9 26.0 10.5 26.4
1985 33.1 36.6 20.6 11.0 11.1 17.2
1986 33.9 39.9 13.1 21.5 4.8 9.2
1987 33.9 37.5 14.9 27.2 6.8 7.8
1988 34.8 34.3 20.0 13.1 7.5 19.3
1989 38.8 40.3 19.8 11.8 10.1 16.8
1990 42.6 38.5 21.3 18.1 11.3 14.3
1993 40.9 38.7 36.5 17.9 8.5 8.9
1995 35.0 37.2 17.2 18.4 6.2 22.0
1996 32.2 48.0 13.8 24.9 6.7 15.0
1997 32.8 32.9 16.6 14.9 6.6 11.4
1998 37.9 35.4 19.5 17.3 5.4 12.4
1999 41.9 31.1 28.3 12.4 5.9 5.0
2000 35.5 33.8 13.1 16.7 5.9 1.7
2001 33.4 - 14.9 - 5.6 -
2002 33.5 34.5 18.2 21.2 5.0 15.1
2003 37.2 31.4 20.3 11.9 9.4 13.4
2004 39.7 30.7 19.6 15.5 6.9 13.3
2006 32.9 35.1 17.6 15.2 5.9 12.8
2007 34.2 32.0 11.6 36.2 6.6 6.8
2008 35.3 30.6 13.4 14.6 5.5 7.5
2009 35.4 31.9 15.8 12.5 7.3 5.8
2010 32.7 31.8 13.6 6.5 4.7 8.6
2011 32.8 33.4 16.3 17.9 5.7 10.0
2012 33.0 35.0 14.5 16.2 4.6 10.7
2013 36.0 35.0 15.0 14.0 4.4 9.0
2014 35.1 - 15.1 - 2.7 -
2015 37.0 34.0 12.0 12.0 6.0 9.0
2017 33.6 - 15.9 - 4.1 -
Figures for 1991 -1992, 1994 not available, 2001, 2014 and 2017 are traditional sector only.
26
STATISTICS BOTSWANA
ANNUAL AGRICULTURAL SURVEY REPORT 2017 (Revised Version)
TABLE 1.5: TRADITIONAL SECTOR : AREA PLANTED TRENDS (‘000 HECTARES) BY CROP YEAR SORGHUM MAIZE MILLET PULSES SUNFLOWER GROUNDNUTS
1979 67 50 13 26 5 4
1980 143 75 17 23 5 2
1981 136 81 20 26 1 3
1982 91 52 16 20 1 2
1983 125 57 16 21 - 1
1984 108 44 17 16 - 2
1985 119 48 15 16 3 1
1986 153 42 17 16 1 1
1987 195 43 14 15 1 2
1988 246 51 13 17 1 1
1989 237 76 20 28 1 1
1990 181 69 12 19 1 1
1993 138 84 15 27 2 1
1995 164 85 11 26 4 1
1996 191 134 11 35 - 2
1997 154 117 11 77 1 5
1998 65 88 9 32 - 11
1999 114 123 8 38 - 3
2000 106 123 5 35 1 4
2001 23 48 3 15 1 1
2002 66 95 3 30 - 2
2003 25 38 3 11 - -
2004 48 63 7 15 - -
2006 58 78 7 23 - 1
2007 30 40 6 18 1 3
2008 63 88 11 29 1 3
2009 67 121 9 31 1 3
2010 61 110 10 26 1 4
2011 70 151 13 29 14 2
2012 52 141 10 31 1 2
2013 62 124 12 36 1 2
2014 65 130 8 37 1 2
2015 23 62 5 23 - 2
2017 24 62 3 27 - 1
Figures for 1991 -1992, 1994 not available, 2001, 2014 and 2017 are traditional sector only.
STATISTICS BOTSWANA
27ANNUAL AGRICULTURAL SURVEY REPORT 2017 (Revised Version)
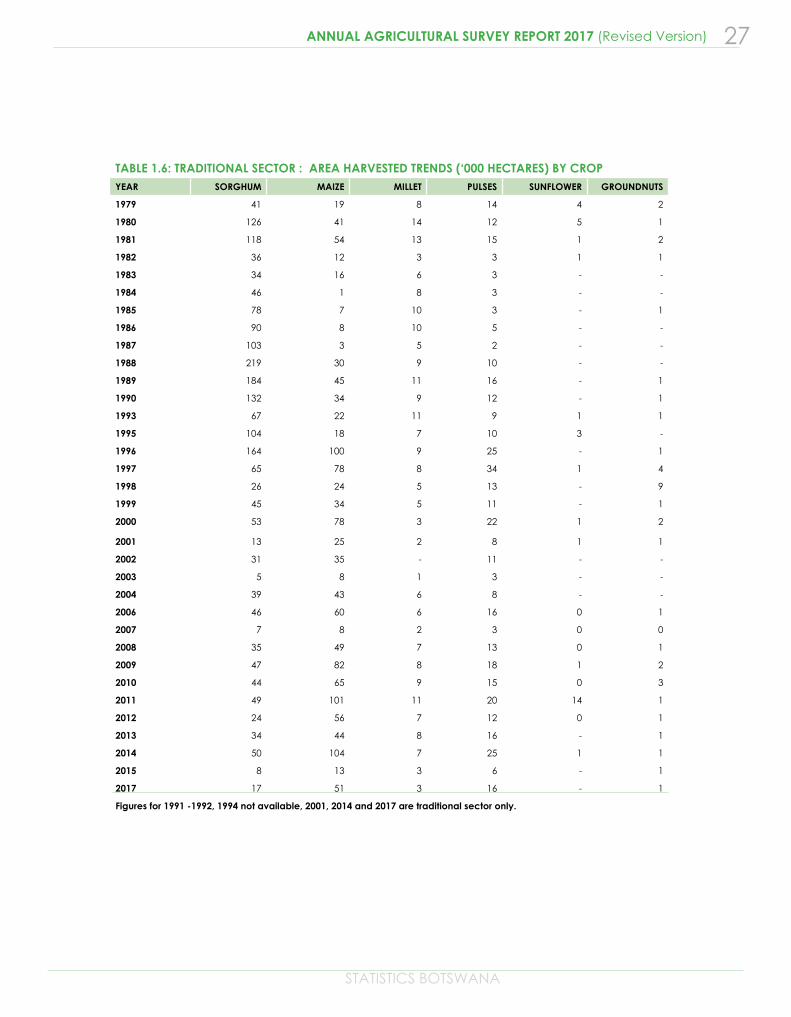
TABLE 1.6: TRADITIONAL SECTOR : AREA HARVESTED TRENDS (‘000 HECTARES) BY CROP YEAR SORGHUM MAIZE MILLET PULSES SUNFLOWER GROUNDNUTS
1979 41 19 8 14 4 2
1980 126 41 14 12 5 1
1981 118 54 13 15 1 2
1982 36 12 3 3 1 1
1983 34 16 6 3 - -
1984 46 1 8 3 - -
1985 78 7 10 3 - 1
1986 90 8 10 5 - -
1987 103 3 5 2 - -
1988 219 30 9 10 - -
1989 184 45 11 16 - 1
1990 132 34 9 12 - 1
1993 67 22 11 9 1 1
1995 104 18 7 10 3 -
1996 164 100 9 25 - 1
1997 65 78 8 34 1 4
1998 26 24 5 13 - 9
1999 45 34 5 11 - 1
2000 53 78 3 22 1 2
2001 13 25 2 8 1 1
2002 31 35 - 11 - -
2003 5 8 1 3 - -
2004 39 43 6 8 - -
2006 46 60 6 16 0 1
2007 7 8 2 3 0 0
2008 35 49 7 13 0 1
2009 47 82 8 18 1 2
2010 44 65 9 15 0 3
2011 49 101 11 20 14 1
2012 24 56 7 12 0 1
2013 34 44 8 16 - 1
2014 50 104 7 25 1 1
2015 8 13 3 6 - 1
2017 17 51 3 16 - 1
Figures for 1991 -1992, 1994 not available, 2001, 2014 and 2017 are traditional sector only.
28
STATISTICS BOTSWANA
ANNUAL AGRICULTURAL SURVEY REPORT 2017 (Revised Version)
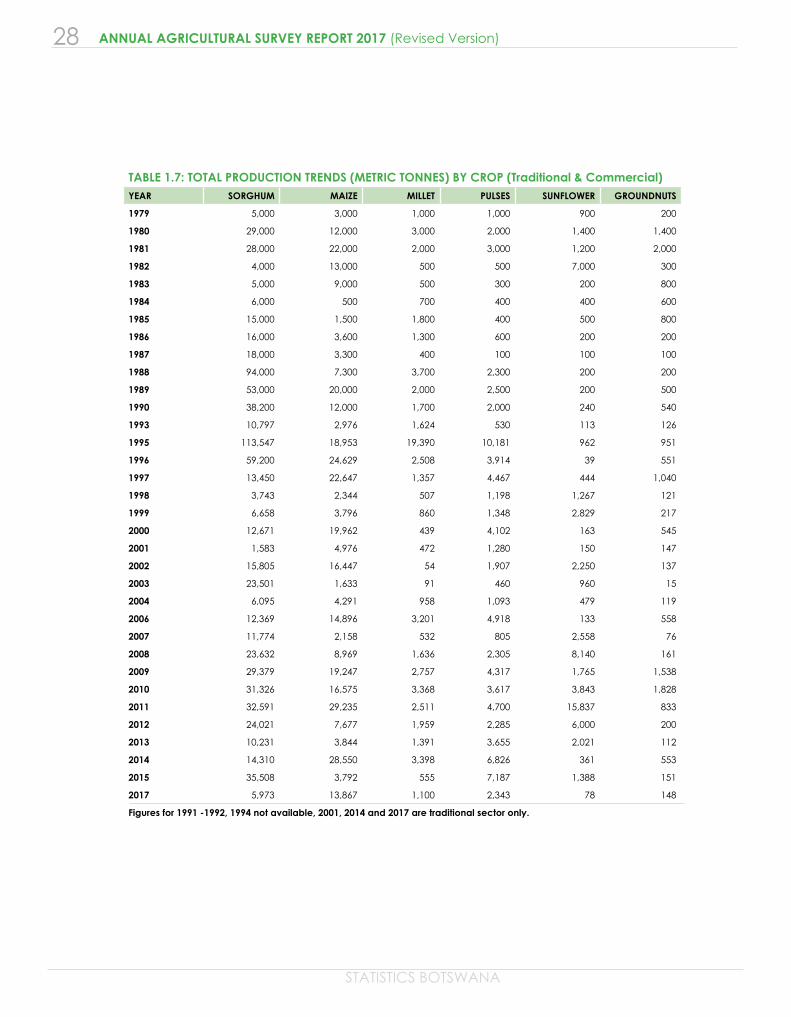
TABLE 1.7: TOTAL PRODUCTION TRENDS (METRIC TONNES) BY CROP (Traditional & Commercial)YEAR SORGHUM MAIZE MILLET PULSES SUNFLOWER GROUNDNUTS
1979 5,000 3,000 1,000 1,000 900 200
1980 29,000 12,000 3,000 2,000 1,400 1,400
1981 28,000 22,000 2,000 3,000 1,200 2,000
1982 4,000 13,000 500 500 7,000 300
1983 5,000 9,000 500 300 200 800
1984 6,000 500 700 400 400 600
1985 15,000 1,500 1,800 400 500 800
1986 16,000 3,600 1,300 600 200 200
1987 18,000 3,300 400 100 100 100
1988 94,000 7,300 3,700 2,300 200 200
1989 53,000 20,000 2,000 2,500 200 500
1990 38,200 12,000 1,700 2,000 240 540
1993 10,797 2,976 1,624 530 113 126
1995 113,547 18,953 19,390 10,181 962 951
1996 59,200 24,629 2,508 3,914 39 551
1997 13,450 22,647 1,357 4,467 444 1,040
1998 3,743 2,344 507 1,198 1,267 121
1999 6,658 3,796 860 1,348 2,829 217
2000 12,671 19,962 439 4,102 163 545
2001 1,583 4,976 472 1,280 150 147
2002 15,805 16,447 54 1,907 2,250 137
2003 23,501 1,633 91 460 960 15
2004 6,095 4,291 958 1,093 479 119
2006 12,369 14,896 3,201 4,918 133 558
2007 11,774 2,158 532 805 2,558 76
2008 23,632 8,969 1,636 2,305 8,140 161
2009 29,379 19,247 2,757 4,317 1,765 1,538
2010 31,326 16,575 3,368 3,617 3,843 1,828
2011 32,591 29,235 2,511 4,700 15,837 833
2012 24,021 7,677 1,959 2,285 6,000 200
2013 10,231 3,844 1,391 3,655 2,021 112
2014 14,310 28,550 3,398 6,826 361 553
2015 35,508 3,792 555 7,187 1,388 151
2017 5,973 13,867 1,100 2,343 78 148
Figures for 1991 -1992, 1994 not available, 2001, 2014 and 2017 are traditional sector only.
STATISTICS BOTSWANA
29ANNUAL AGRICULTURAL SURVEY REPORT 2017 (Revised Version)
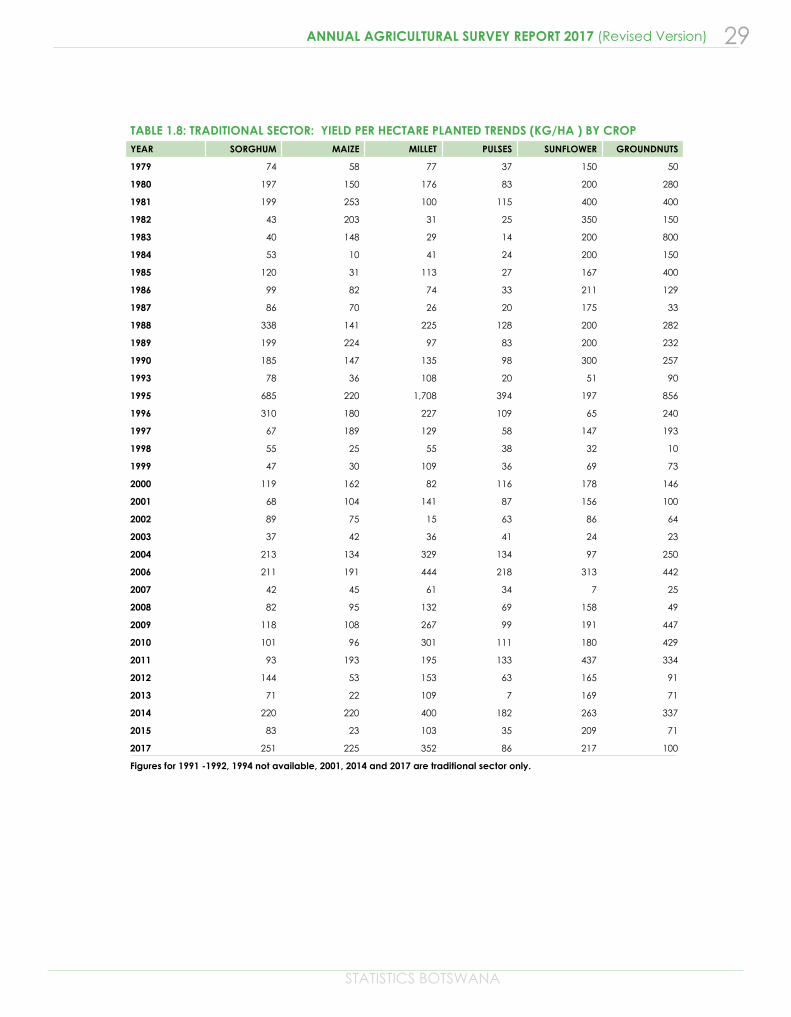
TABLE 1.8: TRADITIONAL SECTOR: YIELD PER HECTARE PLANTED TRENDS (KG/HA ) BY CROPYEAR SORGHUM MAIZE MILLET PULSES SUNFLOWER GROUNDNUTS
1979 74 58 77 37 150 50
1980 197 150 176 83 200 280
1981 199 253 100 115 400 400
1982 43 203 31 25 350 150
1983 40 148 29 14 200 800
1984 53 10 41 24 200 150
1985 120 31 113 27 167 400
1986 99 82 74 33 211 129
1987 86 70 26 20 175 33
1988 338 141 225 128 200 282
1989 199 224 97 83 200 232
1990 185 147 135 98 300 257
1993 78 36 108 20 51 90
1995 685 220 1,708 394 197 856
1996 310 180 227 109 65 240
1997 67 189 129 58 147 193
1998 55 25 55 38 32 10
1999 47 30 109 36 69 73
2000 119 162 82 116 178 146
2001 68 104 141 87 156 100
2002 89 75 15 63 86 64
2003 37 42 36 41 24 23
2004 213 134 329 134 97 250
2006 211 191 444 218 313 442
2007 42 45 61 34 7 25
2008 82 95 132 69 158 49
2009 118 108 267 99 191 447
2010 101 96 301 111 180 429
2011 93 193 195 133 437 334
2012 144 53 153 63 165 91
2013 71 22 109 7 169 71
2014 220 220 400 182 263 337
2015 83 23 103 35 209 71
2017 251 225 352 86 217 100
Figures for 1991 -1992, 1994 not available, 2001, 2014 and 2017 are traditional sector only.
30
STATISTICS BOTSWANA
ANNUAL AGRICULTURAL SURVEY REPORT 2017 (Revised Version)
2017 ANNUAL AGRICULTURAL SURVEY SUMMARY TABLES
STATISTICS BOTSWANA
31ANNUAL AGRICULTURAL SURVEY REPORT 2017 (Revised Version)
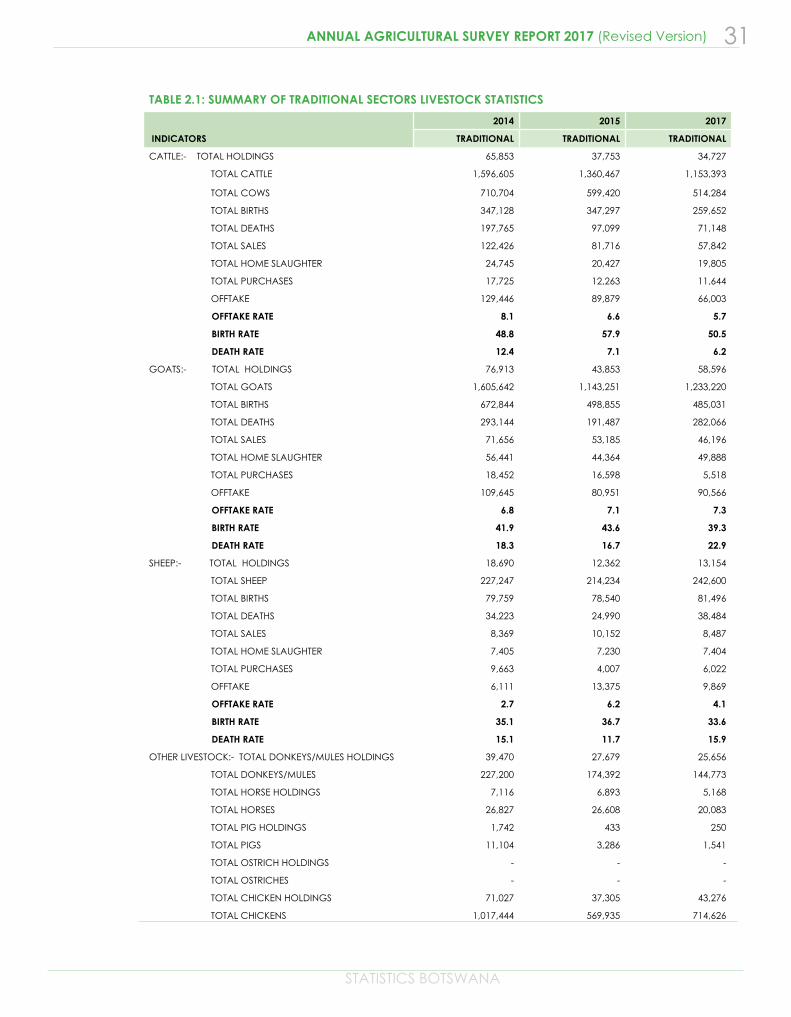
TABLE 2.1: SUMMARY OF TRADITIONAL SECTORS LIVESTOCK STATISTICS
INDICATORS
2014 2015 2017
TRADITIONAL TRADITIONAL TRADITIONAL
CATTLE:- TOTAL HOLDINGS 65,853 37,753 34,727
TOTAL CATTLE 1,596,605 1,360,467 1,153,393
TOTAL COWS 710,704 599,420 514,284
TOTAL BIRTHS 347,128 347,297 259,652
TOTAL DEATHS 197,765 97,099 71,148
TOTAL SALES 122,426 81,716 57,842
TOTAL HOME SLAUGHTER 24,745 20,427 19,805
TOTAL PURCHASES 17,725 12,263 11,644
OFFTAKE 129,446 89,879 66,003
OFFTAKE RATE 8.1 6.6 5.7
BIRTH RATE 48.8 57.9 50.5
DEATH RATE 12.4 7.1 6.2
GOATS:- TOTAL HOLDINGS 76,913 43,853 58,596
TOTAL GOATS 1,605,642 1,143,251 1,233,220
TOTAL BIRTHS 672,844 498,855 485,031
TOTAL DEATHS 293,144 191,487 282,066
TOTAL SALES 71,656 53,185 46,196
TOTAL HOME SLAUGHTER 56,441 44,364 49,888
TOTAL PURCHASES 18,452 16,598 5,518
OFFTAKE 109,645 80,951 90,566
OFFTAKE RATE 6.8 7.1 7.3
BIRTH RATE 41.9 43.6 39.3
DEATH RATE 18.3 16.7 22.9
SHEEP:- TOTAL HOLDINGS 18,690 12,362 13,154
TOTAL SHEEP 227,247 214,234 242,600
TOTAL BIRTHS 79,759 78,540 81,496
TOTAL DEATHS 34,223 24,990 38,484
TOTAL SALES 8,369 10,152 8,487
TOTAL HOME SLAUGHTER 7,405 7,230 7,404
TOTAL PURCHASES 9,663 4,007 6,022
OFFTAKE 6,111 13,375 9,869
OFFTAKE RATE 2.7 6.2 4.1
BIRTH RATE 35.1 36.7 33.6
DEATH RATE 15.1 11.7 15.9
OTHER LIVESTOCK:- TOTAL DONKEYS/MULES HOLDINGS 39,470 27,679 25,656
TOTAL DONKEYS/MULES 227,200 174,392 144,773
TOTAL HORSE HOLDINGS 7,116 6,893 5,168
TOTAL HORSES 26,827 26,608 20,083
TOTAL PIG HOLDINGS 1,742 433 250
TOTAL PIGS 11,104 3,286 1,541
TOTAL OSTRICH HOLDINGS - - -
TOTAL OSTRICHES - - -
TOTAL CHICKEN HOLDINGS 71,027 37,305 43,276
TOTAL CHICKENS 1,017,444 569,935 714,626
32
STATISTICS BOTSWANA
ANNUAL AGRICULTURAL SURVEY REPORT 2017 (Revised Version)
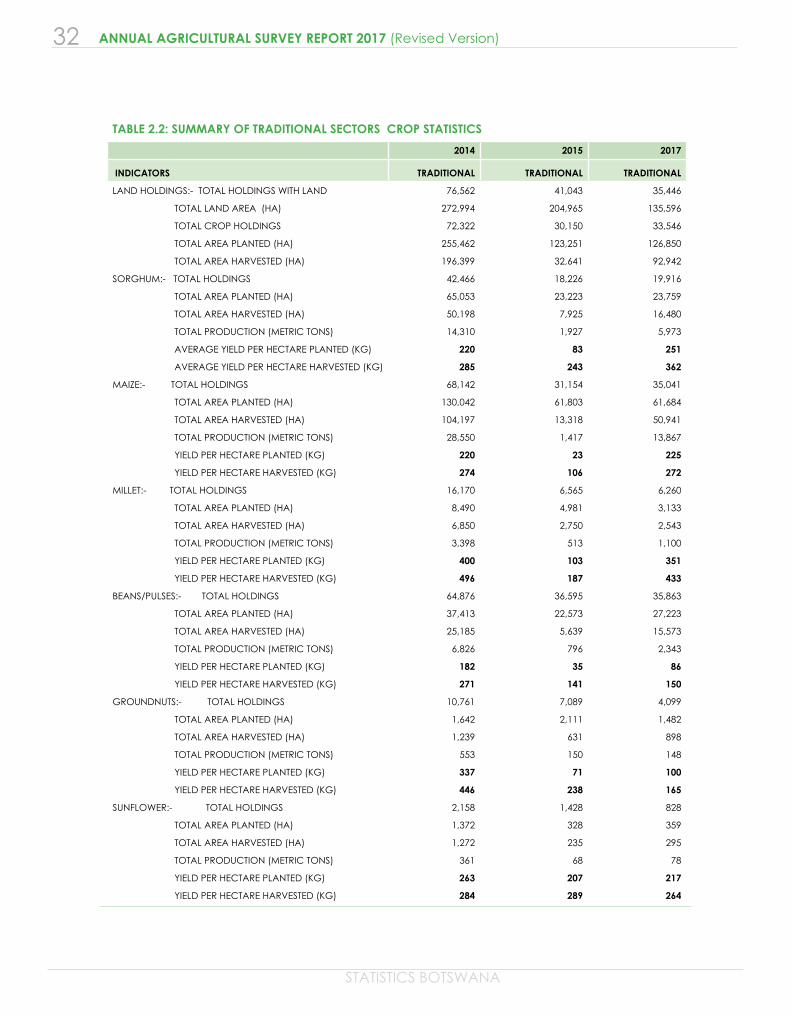
TABLE 2.2: SUMMARY OF TRADITIONAL SECTORS CROP STATISTICS
2014 2015 2017
INDICATORS TRADITIONAL TRADITIONAL TRADITIONAL
LAND HOLDINGS:- TOTAL HOLDINGS WITH LAND 76,562 41,043 35,446
TOTAL LAND AREA (HA) 272,994 204,965 135,596
TOTAL CROP HOLDINGS 72,322 30,150 33,546
TOTAL AREA PLANTED (HA) 255,462 123,251 126,850
TOTAL AREA HARVESTED (HA) 196,399 32,641 92,942
SORGHUM:- TOTAL HOLDINGS 42,466 18,226 19,916
TOTAL AREA PLANTED (HA) 65,053 23,223 23,759
TOTAL AREA HARVESTED (HA) 50,198 7,925 16,480
TOTAL PRODUCTION (METRIC TONS) 14,310 1,927 5,973
AVERAGE YIELD PER HECTARE PLANTED (KG) 220 83 251
AVERAGE YIELD PER HECTARE HARVESTED (KG) 285 243 362
MAIZE:- TOTAL HOLDINGS 68,142 31,154 35,041
TOTAL AREA PLANTED (HA) 130,042 61,803 61,684
TOTAL AREA HARVESTED (HA) 104,197 13,318 50,941
TOTAL PRODUCTION (METRIC TONS) 28,550 1,417 13,867
YIELD PER HECTARE PLANTED (KG) 220 23 225
YIELD PER HECTARE HARVESTED (KG) 274 106 272
MILLET:- TOTAL HOLDINGS 16,170 6,565 6,260
TOTAL AREA PLANTED (HA) 8,490 4,981 3,133
TOTAL AREA HARVESTED (HA) 6,850 2,750 2,543
TOTAL PRODUCTION (METRIC TONS) 3,398 513 1,100
YIELD PER HECTARE PLANTED (KG) 400 103 351
YIELD PER HECTARE HARVESTED (KG) 496 187 433
BEANS/PULSES:- TOTAL HOLDINGS 64,876 36,595 35,863
TOTAL AREA PLANTED (HA) 37,413 22,573 27,223
TOTAL AREA HARVESTED (HA) 25,185 5,639 15,573
TOTAL PRODUCTION (METRIC TONS) 6,826 796 2,343
YIELD PER HECTARE PLANTED (KG) 182 35 86
YIELD PER HECTARE HARVESTED (KG) 271 141 150
GROUNDNUTS:- TOTAL HOLDINGS 10,761 7,089 4,099
TOTAL AREA PLANTED (HA) 1,642 2,111 1,482
TOTAL AREA HARVESTED (HA) 1,239 631 898
TOTAL PRODUCTION (METRIC TONS) 553 150 148
YIELD PER HECTARE PLANTED (KG) 337 71 100
YIELD PER HECTARE HARVESTED (KG) 446 238 165
SUNFLOWER:- TOTAL HOLDINGS 2,158 1,428 828
TOTAL AREA PLANTED (HA) 1,372 328 359
TOTAL AREA HARVESTED (HA) 1,272 235 295
TOTAL PRODUCTION (METRIC TONS) 361 68 78
YIELD PER HECTARE PLANTED (KG) 263 207 217
YIELD PER HECTARE HARVESTED (KG) 284 289 264
STATISTICS BOTSWANA
33ANNUAL AGRICULTURAL SURVEY REPORT 2017 (Revised Version)
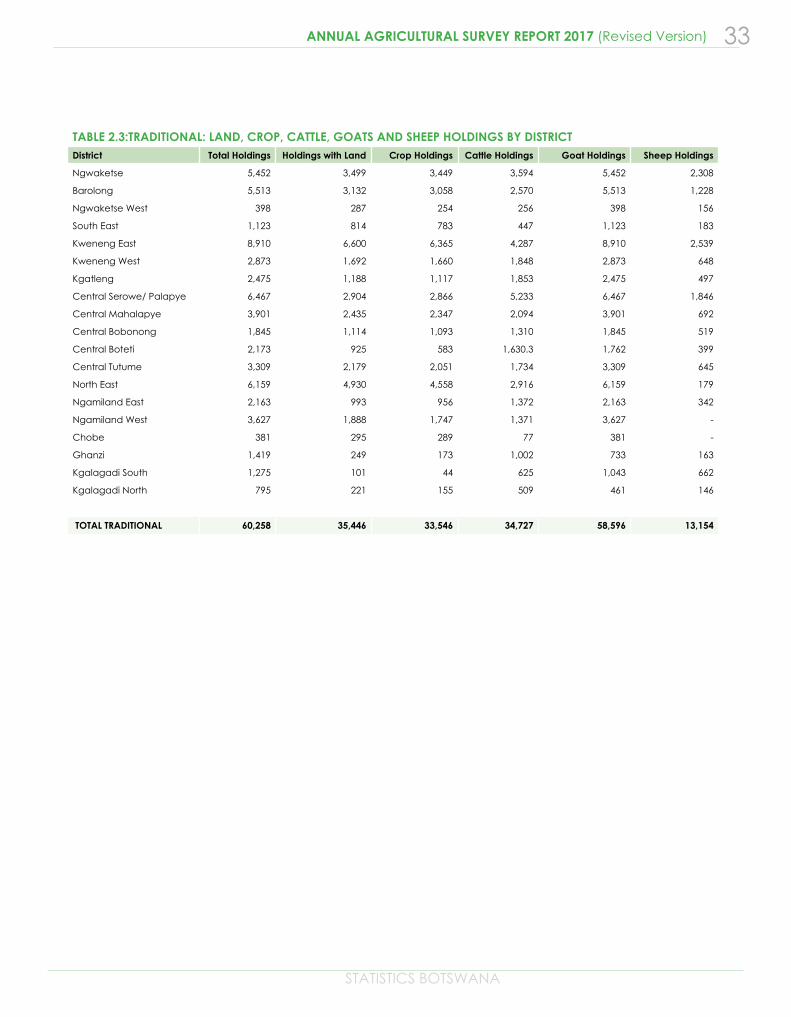
TABLE 2.3:TRADITIONAL: LAND, CROP, CATTLE, GOATS AND SHEEP HOLDINGS BY DISTRICT District Total Holdings Holdings with Land Crop Holdings Cattle Holdings Goat Holdings Sheep Holdings
Ngwaketse 5,452 3,499 3,449 3,594 5,452 2,308
Barolong 5,513 3,132 3,058 2,570 5,513 1,228
Ngwaketse West 398 287 254 256 398 156
South East 1,123 814 783 447 1,123 183
Kweneng East 8,910 6,600 6,365 4,287 8,910 2,539
Kweneng West 2,873 1,692 1,660 1,848 2,873 648
Kgatleng 2,475 1,188 1,117 1,853 2,475 497
Central Serowe/ Palapye 6,467 2,904 2,866 5,233 6,467 1,846
Central Mahalapye 3,901 2,435 2,347 2,094 3,901 692
Central Bobonong 1,845 1,114 1,093 1,310 1,845 519
Central Boteti 2,173 925 583 1,630.3 1,762 399
Central Tutume 3,309 2,179 2,051 1,734 3,309 645
North East 6,159 4,930 4,558 2,916 6,159 179
Ngamiland East 2,163 993 956 1,372 2,163 342
Ngamiland West 3,627 1,888 1,747 1,371 3,627 -
Chobe 381 295 289 77 381 -
Ghanzi 1,419 249 173 1,002 733 163
Kgalagadi South 1,275 101 44 625 1,043 662
Kgalagadi North 795 221 155 509 461 146
TOTAL TRADITIONAL 60,258 35,446 33,546 34,727 58,596 13,154
34
STATISTICS BOTSWANA
ANNUAL AGRICULTURAL SURVEY REPORT 2017 (Revised Version)
HOLDERS AND THEIR CHARACTERISTICS: TRADITIONAL SECTOR:
STATISTICS BOTSWANA
35ANNUAL AGRICULTURAL SURVEY REPORT 2017 (Revised Version)
TABLE 3.1: NUMBER OF HOLDERS BY GENDER AND DISTRICT
District
Male Female
Total Number of HoldersNumber Percentage Number Percentage
Ngwaketse 3,708 9.8 1,744 7.8 5,452
Barolong 3,075 8.1 2,438 10.8 5,513
Ngwaketse West 317 0.8 81 0.4 398
South East 796 2.1 328 1.5 1,123
Kweneng East 5,115 13.5 3,795 16.9 8,910
Kweneng West 1,849 4.9 1,024 4.6 2,873
Kgatleng 1,952 5.2 524 2.3 2,475
Central Serowe/ Palapye 5,087 13.5 1,380 6.1 6,467
Central Mahalapye 2,504 6.6 1,396 6.2 3,901
Central Bobonong 1,137 3.0 708 3.1 1,845
Central Boteti 1,562 4.1 611 2.7 2,173
Central Tutume 2,148 5.7 1,161 5.2 3,309
North East 2,707 7.2 3,452 15.3 6,159
Ngamiland East 1,378 3.7 785 3.5 2,163
Ngamiland West 1,708 4.5 1,920 8.5 3,627
Chobe 238 0.6 143 0.6 381
Ghanzi 1,050 2.8 369 1.6 1,419
Kgalagadi South 852 2.3 422 1.9 1,275
Kgalagadi North 581 1.5 214 1.0 795
TOTAL TRADITIONAL 37,764 100.0 22,494 100.0 60,258
TABLE 3.2: NUMBER OF HOLDERS BY MARITAL STATUS AND DISTRICTDistrict Never Married Married Living Together Separated Divorced Widowed Total Holders
Ngwaketse 918 2,673 714 10 86 1,050 5,452
Barolong 1,203 2,167 680 22 120 1,320 5,513
Ngwaketse West 157 162 46 - - 34 398
South East 211 536 168 1 - 207 1,123
Kweneng East 1,298 4,187 1,572 12 51 1,790 8,910
Kweneng West 574 1,230 577 15 26 451 2,873
Kgatleng 383 1,446 141 - 55 451 2,475
Central Serowe/ Palapye 643 3,638 651 42 424 1,068 6,467
Central Mahalapye 1,058 1,205 827 6 60 745 3,901
Central Bobonong 317 804 314 24 6 380 1,845
Central Boteti 459 1,093 233 12 86 289 2,173
Central Tutume 387 1,343 679 30 109 760 3,309
North East 1,151 2,131 511 121 178 2,066 6,159
Ngamiland East 671 690 418 6 28 351 2,163
Ngamiland West 879 811 1,546 73 43 276 3,627
Chobe 64 53 182 1 9 72 381
Ghanzi 384 308 589 13 37 87 1,419
Kgalagadi South 354 441 303 7 25 145 1,275
Kgalagadi North 217 204 316 5 17 36 795
TOTAL TRADITIONAL 11,329 25,123 10,469 401 1,358 11,578 60,258
36
STATISTICS BOTSWANA
ANNUAL AGRICULTURAL SURVEY REPORT 2017 (Revised Version)
TABLE 3.3: NUMBER OF MALE HOLDERS BY MARITAL STATUS AND DISTRICTDistrict Never Married Married Living Together Separated Divorced Widowed Total Holders
Ngwaketse 470 2,530 460 10 26 213 3,708
Barolong 276 1,986 401 22 61 328 3,075
Ngwaketse West 112 160 41 - - 4 317
South East 111 532 129 - - 24 796
Kweneng East 582 3,563 687 - 40 243 5,115
Kweneng West 319 1,112 321 15 26 56 1,849
Kgatleng 252 1,406 83 - 51 159 1,952
Central Serowe/ Palapye 185 3,588 596 42 393 282 5,087
Central Mahalapye 558 1,149 578 - 47 172 2,504
Central Bobonong 115 749 207 24 - 42 1,137
Central Boteti 260 1,017 174 2 44 66 1,562
Central Tutume 136 1,317 432 28 93 143 2,148
North East 236 1,845 255 29 31 311 2,707
Ngamiland East 333 643 259 6 24 114 1,378
Ngamiland West 171 655 756 62 22 42 1,708
Chobe 24 52 124 - - 38 238
Ghanzi 228 277 489 7 20 30 1,050
Kgalagadi South 156 404 235 7 12 39 852
Kgalagadi North 127 180 253 5 8 7 581
TOTAL TRADITIONAL 4,651 23,163 6,480 258 899 2,313 37,764
TABLE 3.4: NUMBER OF FEMALE HOLDERS BY MARITAL STATUS AND DISTRICT District Never Married Married Living together Separated Divorced Widowed Total holders
Ngwaketse 449 143 254 - 60 838 1,744
Barolong 927 181 279 - 59 992 2,438
Ngwaketse West 45 2 5 - - 29 81
South East 100 5 39 1 - 183 328
Kweneng East 716 624 886 12 11 1,547 3,795
Kweneng West 255 119 256 - - 395 1,024
Kgatleng 131 39 59 - 4 291 524
Central Serowe/ Palapye 458 51 55 - 31 786 1,380
Central Mahalapye 500 56 249 6 13 573 1,396
Central Bobonong 202 55 107 - 6 338 708
Central Boteti 199 76 59 11 42 224 611
Central Tutume 252 26 247 2 17 617 1,161
North East 915 287 256 92 147 1,755 3,452
Ngamiland East 338 48 159 - 3 238 785
Ngamiland West 708 156 790 11 20 234 1,920
Chobe 41 1 58 1 9 34 143
Ghanzi 157 31 100 7 17 57 369
Kgalagadi South 199 37 68 - 13 106 422
Kgalagadi North 90 24 63 - 8 29 214
TOTAL TRADITIONAL 6,678 1,960 3,989 142 459 9,266 22,494
STATISTICS BOTSWANA
37ANNUAL AGRICULTURAL SURVEY REPORT 2017 (Revised Version)
TABLE 3.5: NUMBER OF HOLDERS BY AGE GROUP AND DISTRICT
District 12-14 15-19 20-24 25-29 30-34 35-39 40-44 45-49 50-54 55-59 60-64 65-98 Unknown
age Total
holders
Ngwaketse - - 41 34 191 229 324 432 674 629 855 2,037 6 5,452
Barolong 4 - - 69 90 137 491 578 771 790 649 1,931 5 5,513
Ngwaketse West - - - 14 23 5 58 67 42 21 52 90 25 398
South East - - - 6 12 52 67 50 163 118 201 456 - 1,123
Kweneng East - - 17 73 309 624 424 1,060 1,199 1,717 890 2,558 40 8,910
Kweneng West - - - 99 154 200 121 393 364 248 349 846 99 2,873
Kgatleng - - - - - 119 298 245 126 405 362 865 55 2,475
Central Serowe/ Palapye
- - - 11 156 125 668 413 950 1,088 861 2,194 - 6,467
Central Mahalapye - - - 71 84 161 168 352 505 395 615 1,550 - 3,901
Central Bobonong - - - 6 43 101 173 178 231 258 274 577 5 1,845
Central Boteti - 1 14 71 108 136 133 115 175 521 243 655 - 2,172
Central Tutume - 10 5 71 181 212 247 256 326 464 575 962 - 3,309
North East 25 17 - 74 112 248 413 524 750 730 637 2,629 - 6,159
Ngamiland East - - 16 48 121 178 155 170 290 294 211 669 11 2,163
Ngamiland West - 12 97 134 389 225 428 393 274 419 338 919 - 3,627
Chobe - - 17 26 26 51 6 75 41 28 30 79 1 381
Ghanzi 4 8 27 64 122 168 106 116 191 209 96 307 - 1,418
Kgalagadi South - 6 22 55 70 157 125 111 85 235 118 291 - 1,275
Kgalagadi North - - 18 30 72 105 35 22 75 120 127 191 - 795
TOTAL TRADITIONAL 33 54 275 956 2,261 3,234 4,441 5,552 7,230 8,688 7,483 19,804 248 60,258
TABLE 3.6: NUMBER OF HOLDERS BY TYPE OF HOLDING OPERATION AND DISTRICT
DistrictAn individualliving on site
An individualliving elsewhere
Households with two ormore persons
living on site
Households with two ormore persons
living elsewhere OtherTotal
Holders
Ngwaketse 1,693 609 2,690 381 79 5,452
Barolong 3,803 412 1,216 82 - 5,513
Ngwaketse West 311 87 - - - 398
South East 286 52 571 172 43 1,123
Kweneng East 3,075 657 3,944 1,150 84 8,910
Kweneng West 1,472 691 487 223 - 2,873
Kgatleng 407 399 751 919 - 2,475
Central Serowe/ Pala-pye
2,888 626 1,102 1,838 12 6,467
Central Mahalapye 1,501 467 1,106 714 112 3,901
Central Bobonong 582 293 647 269 55 1,845
Central Boteti 1,728 108 288 49 - 2,173
Central Tutume 860 358 1,307 680 104 3,309
North East 3,211 287 2,543 107 11 6,159
Ngamiland East 1,086 128 844 82 24 2,163
Ngamiland West 2,334 35 1,116 142 - 3,627
Chobe 244 7 114 16 - 381
Ghanzi 1,103 54 215 46 - 1,419
Kgalagadi South 765 230 233 46 - 1,275
Kgalagadi North 553 79 114 46 3 795
TOTAL TRADITIONAL 27,903 5,578 19,289 6,962 526 60,258
38
STATISTICS BOTSWANA
ANNUAL AGRICULTURAL SURVEY REPORT 2017 (Revised Version)
TABLE 3.7: NUMBER OF HOLDINGS BY HOLDERS’ STATUS AND DISTRICT
District
YES NO
Total Holders Number Percentage Number Percentage
Ngwaketse 4,666 9.8 787 6.1 5,452
Barolong 4,305 9.1 1,208 9.4 5,513
Ngwaketse West 336 0.7 62 0.5 398
South East 879 1.9 245 1.9 1,123
Kweneng East 7,318 15.4 1,592 12.4 8,910
Kweneng West 2,301 4.9 572 4.5 2,873
Kgatleng 1,668 3.5 807 6.3 2,475
Central Serowe/ Palapye 5,148 10.9 1,319 10.3 6,467
Central Mahalapye 3,352 7.1 548 4.3 3,901
Central Bobonong 1,573 3.3 273 2.1 1,845
Central Boteti 1,808 3.8 365 2.8 2,173
Central Tutume 2,462 5.2 847 6.6 3,309
North East 3,994 8.4 2,165 16.9 6,159
Ngamiland East 1,815 3.8 348 2.7 2,163
Ngamiland West 3,057 6.4 570 4.5 3,627
Chobe 275 0.6 105 0.8 381
Ghanzi 1,040 2.2 378 3.0 1,419
Kgalagadi South 779 1.6 495 3.9 1,275
Kgalagadi North 664 1.4 131 1.0 795
TOTAL TRADITIONAL 47,441 100.0 12,817 100.0 60,258
TABLE 3.8: NUMBER OF HOLDINGS BY ACCESS TO WEATHER FORECAST INFORMATION AND UTILIZATION STATUS AND DISTRICT
District
WHETHER THE HOLDER HAS ACCESS
Total Holders
WHETHER THE HOLDER USES INFORMATION
Total HoldersYes No Yes No
Ngwaketse 4,328 1,124 5,452 4,150 178 4,328
Barolong 5,002 511 5,513 4,656 346 5,002
Ngwaketse West 315 83 398 262 52 315
South East 1,117 7 1,123 1,086 31 1,117
Kweneng East 6,252 2,658 8,910 4,387 1,865 6,252
Kweneng West 1,819 1,054 2,873 1,125 694 1,819
Kgatleng 2,467 9 2,475 2,401 66 2,467
Central Serowe/ Palapye 4,158 2,309 6,467 3,990 168 4,158
Central Mahalapye 3,425 475 3,901 3,091 335 3,425
Central Bobonong 1,378 467 1,845 1,206 173 1,378
Central Boteti 1,364 809 2,173 1,204 160 1,364
Central Tutume 2,727 582 3,309 2,626 102 2,727
North East 5,074 1,084 6,159 4,735 339 5,074
Ngamiland East 1,712 452 2,163 1,578 133 1,712
Ngamiland West 2,957 670 3,627 2,746 211 2,957
Chobe 297 83 381 294 3 297
Ghanzi 815 604 1,419 596 218 815
Kgalagadi South 792 482 1,275 648 144 792
Kgalagadi North 306 489 795 216 90 306
-
TOTAL TRADITIONAL 46,307 13,952 60,258 41,000 5,307 46,307
STATISTICS BOTSWANA
39ANNUAL AGRICULTURAL SURVEY REPORT 2017 (Revised Version)
TABLE 3.9: NUMBER OF HOLDINGS BY AWARENESS OF CLIMATE CHANGE AND DISTRICT
District
Whether the holder is aware of the climate change
Total HoldersYes No
Ngwaketse 4,658 794 5,452
Barolong 4,409 1,104 5,513
Ngwaketse West 327 71 398
South East 1,112 12 1,123
Kweneng East 7,018 1,892 8,910
Kweneng West 2,431 443 2,873
Kgatleng 2,465 11 2,475
Central Serowe/ Palapye 6,082 385 6,467
Central Mahalapye 3,557 344 3,901
Central Bobonong 1,376 469 1,845
Central Boteti 1,817 357 2,173
Central Tutume 3,191 118 3,309
North East 5,773 386 6,159
Ngamiland East 2,017 146 2,163
Ngamiland West 3,464 164 3,627
Chobe 361 20 381
Ghanzi 986 432 1,419
Kgalagadi South 989 286 1,275
Kgalagadi North 271 524 795
TOTAL TRADITIONAL 52,301 7,957 60,258
TABLE 3.10: NUMBER OF HOLDINGS BY TYPE OF CLIMATE CHANGES NOTICED OVER YEARS AND DISTRICTDistrict Shift in Seasons Out Break of Diseases / Pests Heavy Falls Severe Drought None
Ngwaketse 3,683 380 1,799 964 210
Barolong 2,977 432 1,522 803 74
Ngwaketse West 268 - 44 30 -
South East 260 85 565 285 -
Kweneng East 5,238 2,408 2,934 2,385 -
Kweneng West 905 133 441 1,038 -
Kgatleng 1,098 807 1,646 970 18
Central Serowe/ Palapye 4,725 - 631 1,783 -
Central Mahalapye 1,534 587 2,569 636 949
Central Bobonong 1,128 250 670 238 148
Central Boteti 1,107 37 27 907 32
Central Tutume 1,900 313 1,613 681 115
North East 4,442 741 2,311 1,577 80
Ngamiland East 1,504 511 606 631 50
Ngamiland West 2,290 353 288 508 35
Chobe 360 1 1 - 3
Ghanzi 294 61 61 782 6
Kgalagadi South 485 34 21 662 5
Kgalagadi North 188 20 3 74 2
TOTAL TRADITIONAL 34,389 7,153 17,755 14,954 1,727
40
STATISTICS BOTSWANA
ANNUAL AGRICULTURAL SURVEY REPORT 2017 (Revised Version)
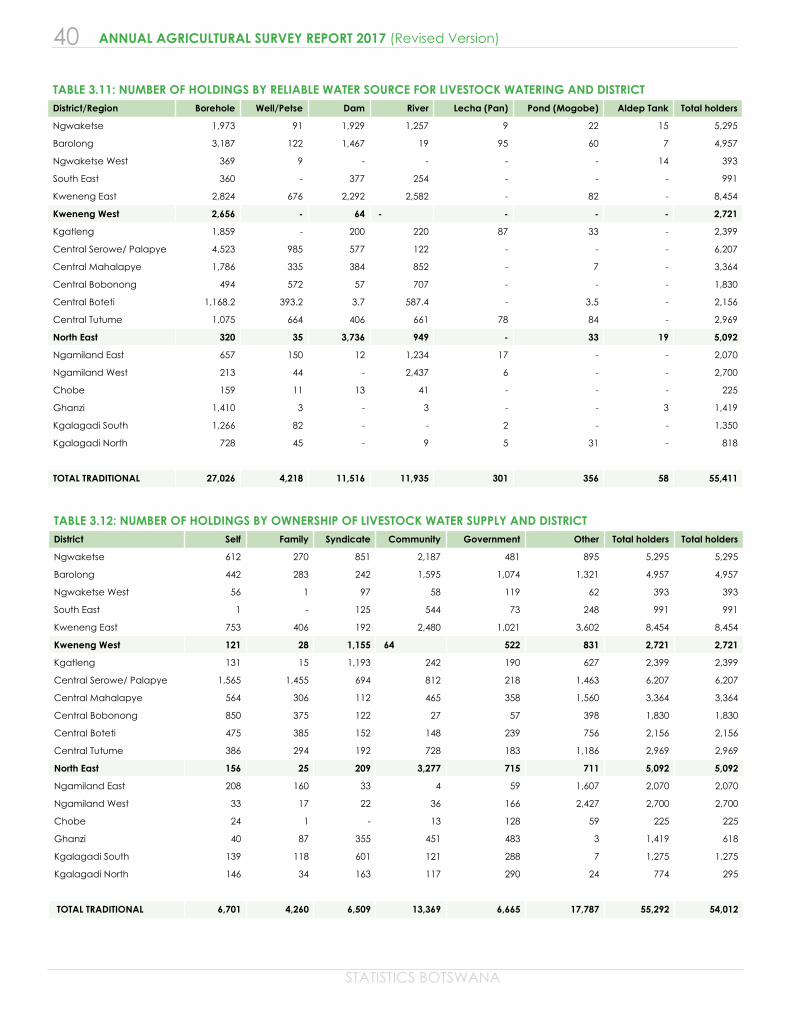
TABLE 3.11: NUMBER OF HOLDINGS BY RELIABLE WATER SOURCE FOR LIVESTOCK WATERING AND DISTRICTDistrict/Region Borehole Well/Petse Dam River Lecha (Pan) Pond (Mogobe) Aldep Tank Total holders
Ngwaketse 1,973 91 1,929 1,257 9 22 15 5,295
Barolong 3,187 122 1,467 19 95 60 7 4,957
Ngwaketse West 369 9 - - - - 14 393
South East 360 - 377 254 - - - 991
Kweneng East 2,824 676 2,292 2,582 - 82 - 8,454
Kweneng West 2,656 - 64 - - - - 2,721
Kgatleng 1,859 - 200 220 87 33 - 2,399
Central Serowe/ Palapye 4,523 985 577 122 - - - 6,207
Central Mahalapye 1,786 335 384 852 - 7 - 3,364
Central Bobonong 494 572 57 707 - - - 1,830
Central Boteti 1,168.2 393.2 3.7 587.4 - 3.5 - 2,156
Central Tutume 1,075 664 406 661 78 84 - 2,969
North East 320 35 3,736 949 - 33 19 5,092
Ngamiland East 657 150 12 1,234 17 - - 2,070
Ngamiland West 213 44 - 2,437 6 - - 2,700
Chobe 159 11 13 41 - - - 225
Ghanzi 1,410 3 - 3 - - 3 1,419
Kgalagadi South 1,266 82 - - 2 - - 1,350
Kgalagadi North 728 45 - 9 5 31 - 818
TOTAL TRADITIONAL 27,026 4,218 11,516 11,935 301 356 58 55,411
TABLE 3.12: NUMBER OF HOLDINGS BY OWNERSHIP OF LIVESTOCK WATER SUPPLY AND DISTRICTDistrict Self Family Syndicate Community Government Other Total holders Total holders
Ngwaketse 612 270 851 2,187 481 895 5,295 5,295
Barolong 442 283 242 1,595 1,074 1,321 4,957 4,957
Ngwaketse West 56 1 97 58 119 62 393 393
South East 1 - 125 544 73 248 991 991
Kweneng East 753 406 192 2,480 1,021 3,602 8,454 8,454
Kweneng West 121 28 1,155 64 522 831 2,721 2,721
Kgatleng 131 15 1,193 242 190 627 2,399 2,399
Central Serowe/ Palapye 1,565 1,455 694 812 218 1,463 6,207 6,207
Central Mahalapye 564 306 112 465 358 1,560 3,364 3,364
Central Bobonong 850 375 122 27 57 398 1,830 1,830
Central Boteti 475 385 152 148 239 756 2,156 2,156
Central Tutume 386 294 192 728 183 1,186 2,969 2,969
North East 156 25 209 3,277 715 711 5,092 5,092
Ngamiland East 208 160 33 4 59 1,607 2,070 2,070
Ngamiland West 33 17 22 36 166 2,427 2,700 2,700
Chobe 24 1 - 13 128 59 225 225
Ghanzi 40 87 355 451 483 3 1,419 618
Kgalagadi South 139 118 601 121 288 7 1,275 1,275
Kgalagadi North 146 34 163 117 290 24 774 295
TOTAL TRADITIONAL 6,701 4,260 6,509 13,369 6,665 17,787 55,292 54,012
STATISTICS BOTSWANA
41ANNUAL AGRICULTURAL SURVEY REPORT 2017 (Revised Version)
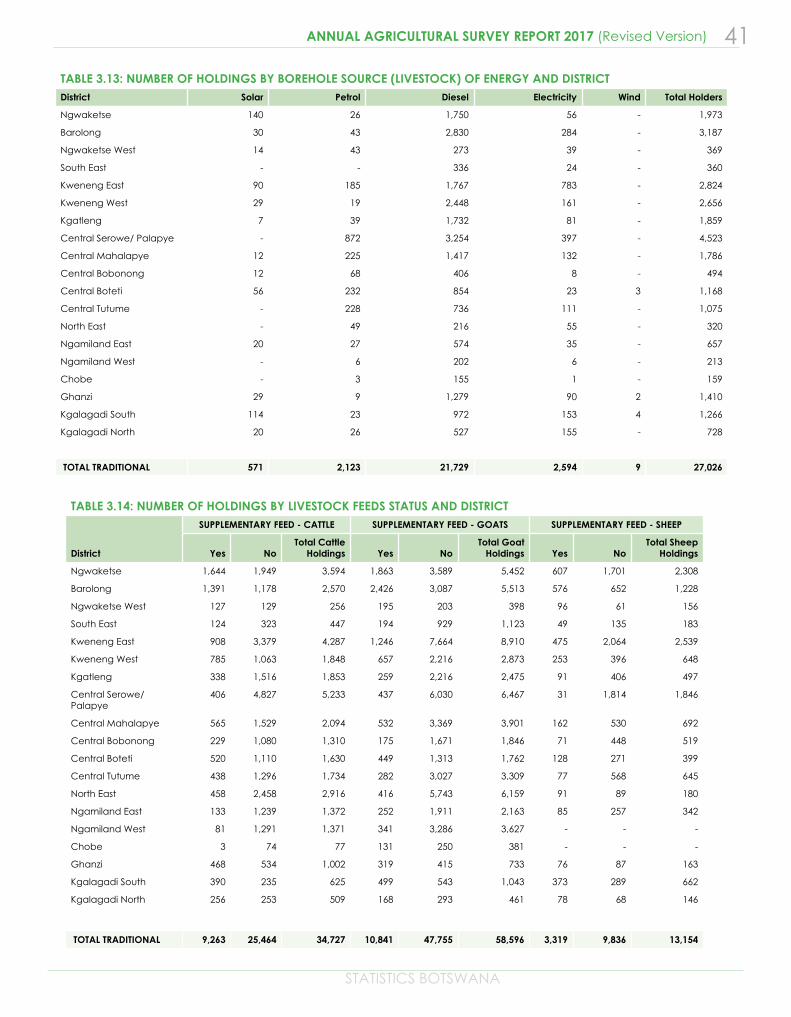
TABLE 3.13: NUMBER OF HOLDINGS BY BOREHOLE SOURCE (LIVESTOCK) OF ENERGY AND DISTRICTDistrict Solar Petrol Diesel Electricity Wind Total Holders
Ngwaketse 140 26 1,750 56 - 1,973
Barolong 30 43 2,830 284 - 3,187
Ngwaketse West 14 43 273 39 - 369
South East - - 336 24 - 360
Kweneng East 90 185 1,767 783 - 2,824
Kweneng West 29 19 2,448 161 - 2,656
Kgatleng 7 39 1,732 81 - 1,859
Central Serowe/ Palapye - 872 3,254 397 - 4,523
Central Mahalapye 12 225 1,417 132 - 1,786
Central Bobonong 12 68 406 8 - 494
Central Boteti 56 232 854 23 3 1,168
Central Tutume - 228 736 111 - 1,075
North East - 49 216 55 - 320
Ngamiland East 20 27 574 35 - 657
Ngamiland West - 6 202 6 - 213
Chobe - 3 155 1 - 159
Ghanzi 29 9 1,279 90 2 1,410
Kgalagadi South 114 23 972 153 4 1,266
Kgalagadi North 20 26 527 155 - 728
TOTAL TRADITIONAL 571 2,123 21,729 2,594 9 27,026
TABLE 3.14: NUMBER OF HOLDINGS BY LIVESTOCK FEEDS STATUS AND DISTRICT
District
SUPPLEMENTARY FEED - CATTLE SUPPLEMENTARY FEED - GOATS SUPPLEMENTARY FEED - SHEEP
Yes NoTotal Cattle
Holdings Yes NoTotal Goat
Holdings Yes NoTotal Sheep
Holdings
Ngwaketse 1,644 1,949 3,594 1,863 3,589 5,452 607 1,701 2,308
Barolong 1,391 1,178 2,570 2,426 3,087 5,513 576 652 1,228
Ngwaketse West 127 129 256 195 203 398 96 61 156
South East 124 323 447 194 929 1,123 49 135 183
Kweneng East 908 3,379 4,287 1,246 7,664 8,910 475 2,064 2,539
Kweneng West 785 1,063 1,848 657 2,216 2,873 253 396 648
Kgatleng 338 1,516 1,853 259 2,216 2,475 91 406 497
Central Serowe/ Palapye
406 4,827 5,233 437 6,030 6,467 31 1,814 1,846
Central Mahalapye 565 1,529 2,094 532 3,369 3,901 162 530 692
Central Bobonong 229 1,080 1,310 175 1,671 1,846 71 448 519
Central Boteti 520 1,110 1,630 449 1,313 1,762 128 271 399
Central Tutume 438 1,296 1,734 282 3,027 3,309 77 568 645
North East 458 2,458 2,916 416 5,743 6,159 91 89 180
Ngamiland East 133 1,239 1,372 252 1,911 2,163 85 257 342
Ngamiland West 81 1,291 1,371 341 3,286 3,627 - - -
Chobe 3 74 77 131 250 381 - - -
Ghanzi 468 534 1,002 319 415 733 76 87 163
Kgalagadi South 390 235 625 499 543 1,043 373 289 662
Kgalagadi North 256 253 509 168 293 461 78 68 146
TOTAL TRADITIONAL 9,263 25,464 34,727 10,841 47,755 58,596 3,319 9,836 13,154
42
STATISTICS BOTSWANA
ANNUAL AGRICULTURAL SURVEY REPORT 2017 (Revised Version)
TABLE 3.16: NUMBER OF HOLDINGS BY TYPE OF CATTLE DISEASES CONTROLLED AND DISTRICT
District Ant
hra
x
Bla
ckl
eg
(Se
rots
wa
na)
Botu
tism
(M
oko
kom
alo
)
Bruc
ello
sis
(Pho
lots
o)
Foo
t & M
out
h (T
lha
ko le
M
olo
mo
)
Lum
py
Skin
(N
oko
ma
ne)
Tic
ks a
nd
Wo
rms
(Dik
go
fa
& D
ibo
kwa
na)
Past
eur
ello
sis
(Ma
di)
He
art
Wa
ter (
me
tsi a
p
elo
)
Oth
er D
ise
ase
Ngwaketse 390 661 442 345 - 695 298 315 89 113
Barolong 734 502 673 346 21 669 191 467 57 49
Ngwaketse West - 29 16 - - - 59 126 - -
South East 186 199 35 120 - 115 11 47 - 11
Kweneng East 524 362 1,347 894 - 642 207 560 17 208
Kweneng West 98 64 139 10 - 111 40 954 - 4
Kgatleng 542 664 148 438 - 200 119 385 - 10
Central Serowe/ Palapye 2,100 2,064 100 544 107 29 190 243 - -
Central Mahalapye 445 506 195 352 78 173 9 274 17 42
Central Bobonong 527 518 32 204 68 36 38 42 21 18
Central Boteti 398 398 92 147 - 16 71 309 8 30
Central Tutume 1,047 853 119 674 162 81 87 212 48 -
North East 1,090 1,372 374 706 723 - 111 184 - -
Ngamiland East 415 379 4 176 1,292 - 28 - - 17
Ngamiland West 331 25 - 8 1,268 - 8 - - -
Chobe 27 28 - 2 76 2 4 1 - -
Ghanzi 104 112 202 44 - 24 161 363 32 41
Kgalagadi South 162 195 156 38 - 39 36 110 15 38
Kgalagadi North 17 6 57 21 - 27 6 114 - 11
TOTAL TRADITIONAL 9,137 8,938 4,130 5,069 3,795 2,858 1,675 4,705 305 593
TABLE 3.15: NUMBER OF HOLDINGS BY CATTLE VACCINATION AND DISTRICT
District
WHETHER CATTLE VACCINATED Total Cattle
Holdings Yes Percentage No Percentage
Ngwaketse 1,796 8.7 1,798 12.9 3,594
Barolong 1,680 8.1 890 6.4 2,570
Ngwaketse West 142 0.7 115 0.8 256
South East 372 1.8 75 0.5 447
Kweneng East 2,526 12.2 1,761 12.6 4,287
Kweneng West 1,082 5.2 765 5.5 1,848
Kgatleng 1,075 5.2 779 5.6 1,853
Central Serowe/ Palapye 2,600 12.5 2,633 18.8 5,233
Central Mahalapye 1,079 5.2 1,015 7.3 2,094
Central Bobonong 771 3.7 539 3.9 1,310
Central Boteti 826 4.0 804 5.7 1,630
Central Tutume 1,218 5.9 516 3.7 1,734
North East 1,675 8.1 1,241 8.9 2,916
Ngamiland East 1,292 6.2 80 0.6 1,372
Ngamiland West 1,282 6.2 90 0.6 1,371
Chobe 76 0.4 1 0.0 77
Ghanzi 556 2.7 446 3.2 1,002
Kgalagadi South 501 2.4 124 0.9 625
Kgalagadi North 192 0.9 317 2.3 509
TOTAL TRADITIONAL 20,737 100.0 13,990 100.0 34,727
STATISTICS BOTSWANA
43ANNUAL AGRICULTURAL SURVEY REPORT 2017 (Revised Version)
TABLE 3.17: NUMBER OF HOLDINGS WITH EMPLOYED FARM WORKERS AND DISTRICTDistrict YES NO Total holders
Ngwaketse 1,085 4,367 5,452
Barolong 575 4,938 5,513
Ngwaketse West 157 241 398
South East 170 954 1,123
Kweneng East 2,680 6,230 8,910
Kweneng West 757 2,116 2,873
Kgatleng 1,358 1,117 2,475
Central Serowe/ Palapye 2,215 4,251 6,467
Central Mahalapye 941 2,960 3,901
Central Bobonong 587 1,259 1,845
Central Boteti 705 1,468 2,173
Central Tutume 1,125 2,184 3,309
North East 607 5,552 6,159
Ngamiland East 157 2,006 2,163
Ngamiland West 71 3,556 3,627
Chobe 45 336 381
Ghanzi 128 1,291 1,419
Kgalagadi South 117 1,157 1,275
Kgalagadi North 176 619 795
TOTAL TRADITIONAL 13,655 46,603 60,258
TABLE 3.18: NUMBER OF FARM WORKERS BY MARITAL STATUS, GENDER AND DISTRICT
District
Never Married Married Living Together Separated Divorced Widowed Total WorkersTotal
WorkersMale Female Male Female Male Female Male Female Male Female Male Female Male Female
Ngwaketse 903 20 53 - 145 6 - - - - 41 - 1,143 25 1,168
Barolong 448 87 50 1 192 - - - - - 22 - 712 88 800
Ngwaketse West 125 1 - - 55 5 - - - - - - 181 6 187
South East 35 - - - 135 - - - - - - - 170 - 170
Kweneng East 1,363 165 241 12 966 38 - - - - 25 - 2,597 214 2,811
Kweneng West 613 4 26 - 157 - - - - - - - 796 4 800
Kgatleng 1,159 - 51 - 168 40 7 - - - 7 - 1,393 40 1,433
Central Serowe/ Palapye
928 30 85 - 1,309 191 13 - - - 190 - 2,524 221 2,745
Central Mahalapye 689 - 48 - 387 11 - - - - - - 1,125 11 1,135
Central Bobonong 361 31 51 - 213 22 - - - - - - 625 53 678
Central Boteti 457.0 30.0 34.0 3.0 310.0 57.0 9.0 - - - 5.7 1.0 815.7 91.0 907
Central Tutume 656 47 127 21 421 45 - - - - 14 - 1,218 113 1,331
North East 299 83 112 - 163 - - - - - - 21 575 103 678
Ngamiland East 138 - 3 - 47 7 - - - - - - 189 7 195
Ngamiland West 43 24 - - 37 - - - - - - - 80 24 104
Chobe 25 26 7 4 - - - - - - - 1 32 32 63
Ghanzi 94 3 1 - 75 3 2 - 4 - 3 - 178 6 184
Kgalagadi South 87 - 4 - 66 3 - - - - 1 - 158 3 161
Kgalagadi North 205 1 - - 79 6 - - - - - - 284 7 291
TOTAL TRADITIONAL 8,628 551 896 41 4,926 433 31 - 4 - 309 23 14,793 1,048 15,841
44
STATISTICS BOTSWANA
ANNUAL AGRICULTURAL SURVEY REPORT 2017 (Revised Version)
TABLE 3.19: NUMBER OF FARM WORKERS BY EMPLOYEE STATUS AND DISTRICT
District
EMPLOYEES PAID
Total Farm Workers
Cash Only In Kind Only Both Cash and in Kind
Farm Workers (Number)
Farm Workers (Number)
Farm Workers(Number)
Ngwaketse 213 - 955 1,168
Barolong 386 - 414 800
Ngwaketse West - - 187 187
South East 12 - 158 170
Kweneng East 608 - 2,203 2,811
Kweneng West 218 - 583 800
Kgatleng 199 - 1,234 1,433
Central Serowe/ Palapye 101 - 2,643 2,745
Central Mahalapye 55 3 1,077 1,135
Central Bobonong 83 - 595 678
Central Boteti 398 15 494 907
Central Tutume 103 - 1,228 1,331
North East 478 21 179 678
Ngamiland East 106 - 90 195
Ngamiland West 8 22 73 104
Chobe 49 - 14 63
Ghanzi 148 8 28 184
Kgalagadi South 89 6 66 161
Kgalagadi North 179 7 105 291
TOTAL TRADITIONAL 3,432 82 12,326 15,841
TABLE 3.20: NUMBER OF FARM WORKERS BY EMPLOMENT STATUS, EARNINGS (PULA) AND DISTRICT
District
Temporary
Permanent Total Farm Workers Total Earnings (PULA) Average Earnings(PULA)
Ngwaketse 289 879 1,168 1,221,085 1,046
Barolong 133 668 800 762,877 953
Ngwaketse West 5 182 187 236,999 1,270
South East - 170 170 184,399 1,088
Kweneng East 267 2,544 2,811 2,965,670 1,055
Kweneng West 29 772 800 769,561 961
Kgatleng 43 1,389 1,433 1,618,487 1,130
Central Serowe/ Palapye 26 2,719 2,745 2,855,459 1,040
Central Mahalapye 29 1,106 1,135 1,065,085 938
Central Bobonong 41 637 678 622,586 918
Central Boteti 79 828 907 502,650 554
Central Tutume 62 1,269 1,331 1,129,268 849
North East 50 628 678 460,699 679
Ngamiland East 22 174 195 159,953 818
Ngamiland West 56 48 104 131,725 1,272
Chobe 39 24 63 56,470 889
Ghanzi 48 136 184 106,196 577
Kgalagadi South 55 106 161 123,152 765
Kgalagadi North 143 148 291 210,068 722
TOTAL TRADITIONAL 1,415 14,425 15,841 15,182,390 958
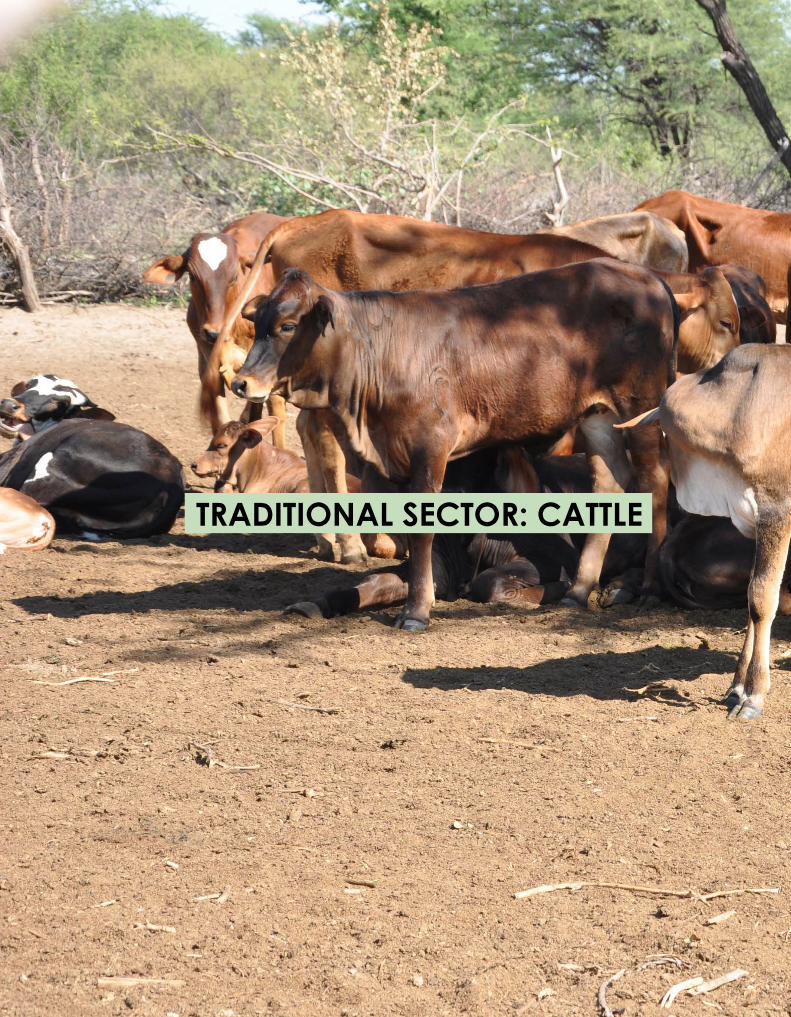
STATISTICS BOTSWANA
45ANNUAL AGRICULTURAL SURVEY REPORT 2017 (Revised Version)
TRADITIONAL SECTOR: CATTLE
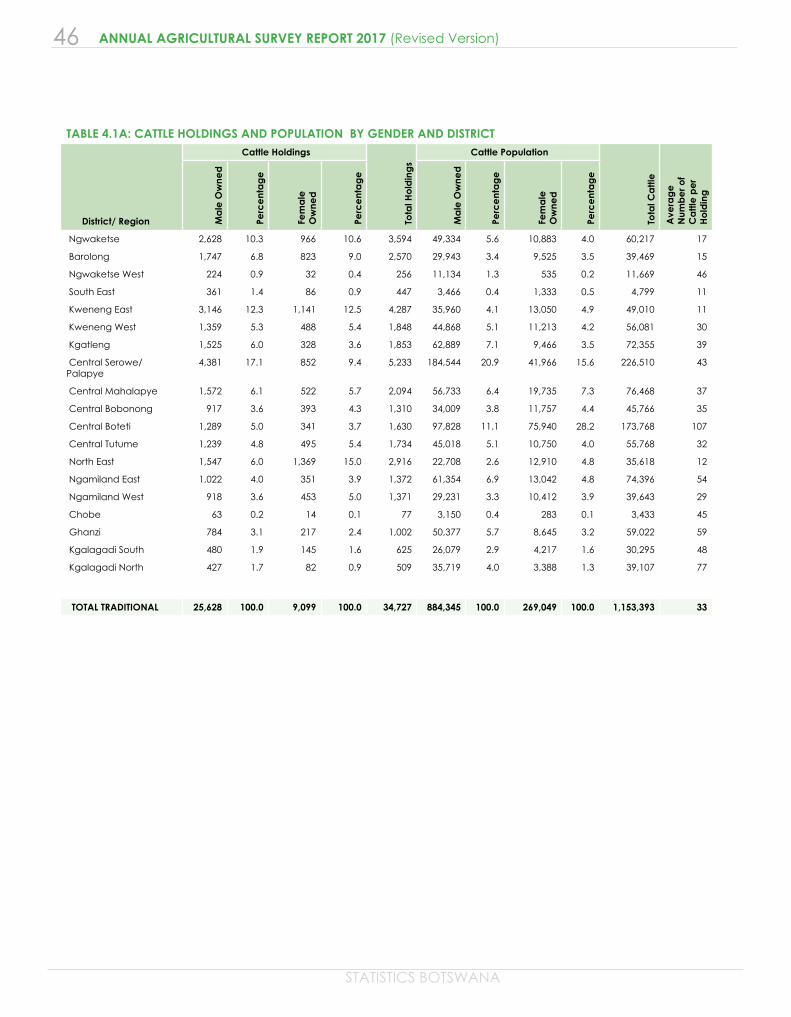
46
STATISTICS BOTSWANA
ANNUAL AGRICULTURAL SURVEY REPORT 2017 (Revised Version)
TABLE 4.1A: CATTLE HOLDINGS AND POPULATION BY GENDER AND DISTRICT
District/ Region
Cattle Holdings
Tota
l Ho
ldin
gs
Cattle Population
Tota
l Ca
ttle
Ave
rag
e
Num
be
r of
Ca
ttle
pe
r H
old
ing
Ma
le O
wne
d
Perc
ent
ag
e
Fem
ale
O
wne
d
Perc
ent
ag
e
Ma
le O
wne
d
Perc
ent
ag
e
Fem
ale
O
wne
d
Perc
ent
ag
e
Ngwaketse 2,628 10.3 966 10.6 3,594 49,334 5.6 10,883 4.0 60,217 17
Barolong 1,747 6.8 823 9.0 2,570 29,943 3.4 9,525 3.5 39,469 15
Ngwaketse West 224 0.9 32 0.4 256 11,134 1.3 535 0.2 11,669 46
South East 361 1.4 86 0.9 447 3,466 0.4 1,333 0.5 4,799 11
Kweneng East 3,146 12.3 1,141 12.5 4,287 35,960 4.1 13,050 4.9 49,010 11
Kweneng West 1,359 5.3 488 5.4 1,848 44,868 5.1 11,213 4.2 56,081 30
Kgatleng 1,525 6.0 328 3.6 1,853 62,889 7.1 9,466 3.5 72,355 39
Central Serowe/ Palapye
4,381 17.1 852 9.4 5,233 184,544 20.9 41,966 15.6 226,510 43
Central Mahalapye 1,572 6.1 522 5.7 2,094 56,733 6.4 19,735 7.3 76,468 37
Central Bobonong 917 3.6 393 4.3 1,310 34,009 3.8 11,757 4.4 45,766 35
Central Boteti 1,289 5.0 341 3.7 1,630 97,828 11.1 75,940 28.2 173,768 107
Central Tutume 1,239 4.8 495 5.4 1,734 45,018 5.1 10,750 4.0 55,768 32
North East 1,547 6.0 1,369 15.0 2,916 22,708 2.6 12,910 4.8 35,618 12
Ngamiland East 1,022 4.0 351 3.9 1,372 61,354 6.9 13,042 4.8 74,396 54
Ngamiland West 918 3.6 453 5.0 1,371 29,231 3.3 10,412 3.9 39,643 29
Chobe 63 0.2 14 0.1 77 3,150 0.4 283 0.1 3,433 45
Ghanzi 784 3.1 217 2.4 1,002 50,377 5.7 8,645 3.2 59,022 59
Kgalagadi South 480 1.9 145 1.6 625 26,079 2.9 4,217 1.6 30,295 48
Kgalagadi North 427 1.7 82 0.9 509 35,719 4.0 3,388 1.3 39,107 77
TOTAL TRADITIONAL 25,628 100.0 9,099 100.0 34,727 884,345 100.0 269,049 100.0 1,153,393 33
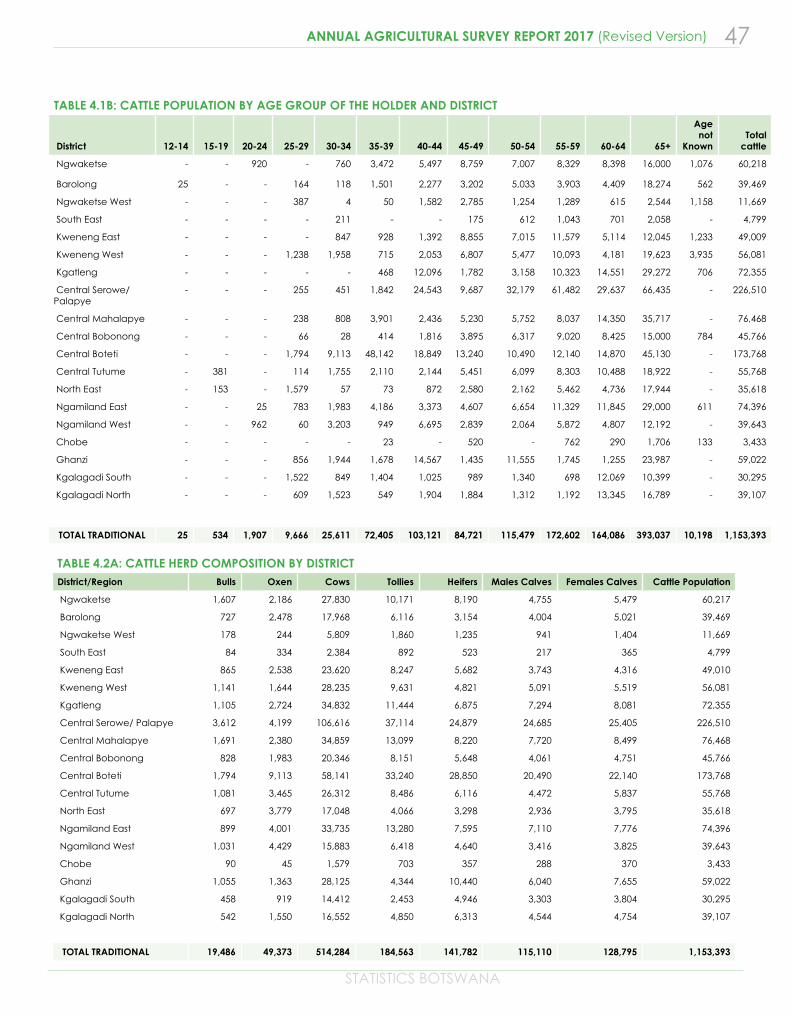
STATISTICS BOTSWANA
47ANNUAL AGRICULTURAL SURVEY REPORT 2017 (Revised Version)
TABLE 4.1B: CATTLE POPULATION BY AGE GROUP OF THE HOLDER AND DISTRICT
District 12-14 15-19 20-24 25-29 30-34 35-39 40-44 45-49 50-54 55-59 60-64 65+
Age not
Known Total cattle
Ngwaketse - - 920 - 760 3,472 5,497 8,759 7,007 8,329 8,398 16,000 1,076 60,218
Barolong 25 - - 164 118 1,501 2,277 3,202 5,033 3,903 4,409 18,274 562 39,469
Ngwaketse West - - - 387 4 50 1,582 2,785 1,254 1,289 615 2,544 1,158 11,669
South East - - - - 211 - - 175 612 1,043 701 2,058 - 4,799
Kweneng East - - - - 847 928 1,392 8,855 7,015 11,579 5,114 12,045 1,233 49,009
Kweneng West - - - 1,238 1,958 715 2,053 6,807 5,477 10,093 4,181 19,623 3,935 56,081
Kgatleng - - - - - 468 12,096 1,782 3,158 10,323 14,551 29,272 706 72,355
Central Serowe/ Palapye
- - - 255 451 1,842 24,543 9,687 32,179 61,482 29,637 66,435 - 226,510
Central Mahalapye - - - 238 808 3,901 2,436 5,230 5,752 8,037 14,350 35,717 - 76,468
Central Bobonong - - - 66 28 414 1,816 3,895 6,317 9,020 8,425 15,000 784 45,766
Central Boteti - - - 1,794 9,113 48,142 18,849 13,240 10,490 12,140 14,870 45,130 - 173,768
Central Tutume - 381 - 114 1,755 2,110 2,144 5,451 6,099 8,303 10,488 18,922 - 55,768
North East - 153 - 1,579 57 73 872 2,580 2,162 5,462 4,736 17,944 - 35,618
Ngamiland East - - 25 783 1,983 4,186 3,373 4,607 6,654 11,329 11,845 29,000 611 74,396
Ngamiland West - - 962 60 3,203 949 6,695 2,839 2,064 5,872 4,807 12,192 - 39,643
Chobe - - - - - 23 - 520 - 762 290 1,706 133 3,433
Ghanzi - - - 856 1,944 1,678 14,567 1,435 11,555 1,745 1,255 23,987 - 59,022
Kgalagadi South - - - 1,522 849 1,404 1,025 989 1,340 698 12,069 10,399 - 30,295
Kgalagadi North - - - 609 1,523 549 1,904 1,884 1,312 1,192 13,345 16,789 - 39,107
TOTAL TRADITIONAL 25 534 1,907 9,666 25,611 72,405 103,121 84,721 115,479 172,602 164,086 393,037 10,198 1,153,393
TABLE 4.2A: CATTLE HERD COMPOSITION BY DISTRICTDistrict/Region Bulls Oxen Cows Tollies Heifers Males Calves Females Calves Cattle Population
Ngwaketse 1,607 2,186 27,830 10,171 8,190 4,755 5,479 60,217
Barolong 727 2,478 17,968 6,116 3,154 4,004 5,021 39,469
Ngwaketse West 178 244 5,809 1,860 1,235 941 1,404 11,669
South East 84 334 2,384 892 523 217 365 4,799
Kweneng East 865 2,538 23,620 8,247 5,682 3,743 4,316 49,010
Kweneng West 1,141 1,644 28,235 9,631 4,821 5,091 5,519 56,081
Kgatleng 1,105 2,724 34,832 11,444 6,875 7,294 8,081 72,355
Central Serowe/ Palapye 3,612 4,199 106,616 37,114 24,879 24,685 25,405 226,510
Central Mahalapye 1,691 2,380 34,859 13,099 8,220 7,720 8,499 76,468
Central Bobonong 828 1,983 20,346 8,151 5,648 4,061 4,751 45,766
Central Boteti 1,794 9,113 58,141 33,240 28,850 20,490 22,140 173,768
Central Tutume 1,081 3,465 26,312 8,486 6,116 4,472 5,837 55,768
North East 697 3,779 17,048 4,066 3,298 2,936 3,795 35,618
Ngamiland East 899 4,001 33,735 13,280 7,595 7,110 7,776 74,396
Ngamiland West 1,031 4,429 15,883 6,418 4,640 3,416 3,825 39,643
Chobe 90 45 1,579 703 357 288 370 3,433
Ghanzi 1,055 1,363 28,125 4,344 10,440 6,040 7,655 59,022
Kgalagadi South 458 919 14,412 2,453 4,946 3,303 3,804 30,295
Kgalagadi North 542 1,550 16,552 4,850 6,313 4,544 4,754 39,107
TOTAL TRADITIONAL 19,486 49,373 514,284 184,563 141,782 115,110 128,795 1,153,393
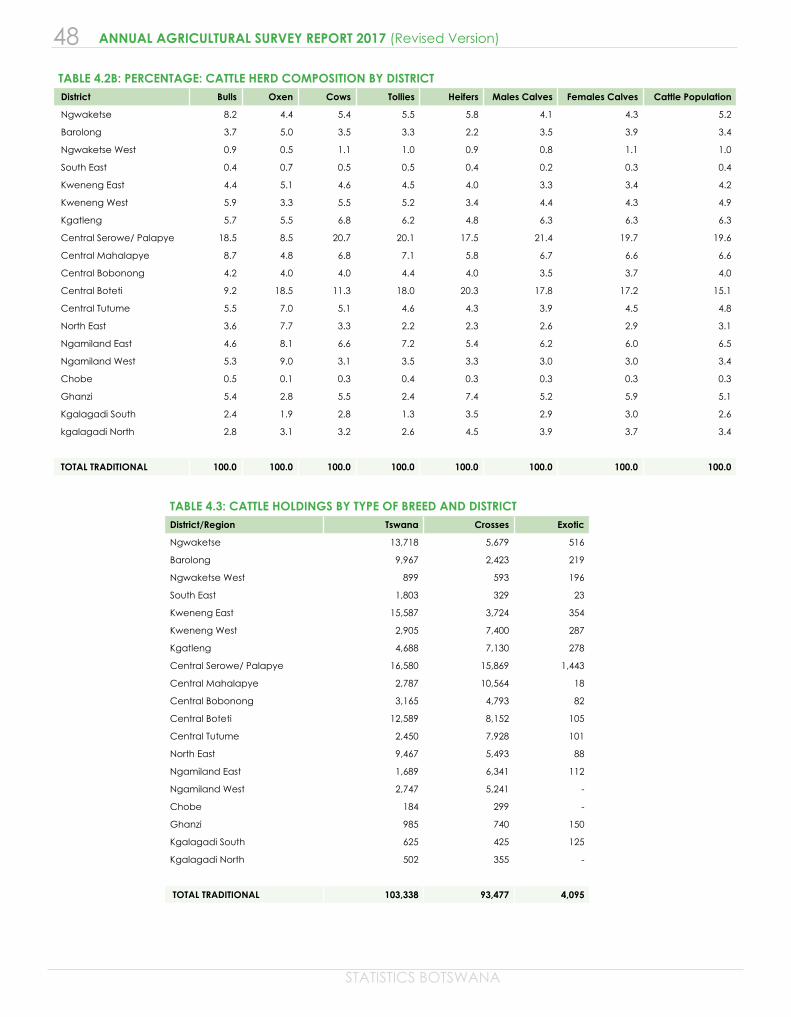
48
STATISTICS BOTSWANA
ANNUAL AGRICULTURAL SURVEY REPORT 2017 (Revised Version)
TABLE 4.2B: PERCENTAGE: CATTLE HERD COMPOSITION BY DISTRICT District Bulls Oxen Cows Tollies Heifers Males Calves Females Calves Cattle Population
Ngwaketse 8.2 4.4 5.4 5.5 5.8 4.1 4.3 5.2
Barolong 3.7 5.0 3.5 3.3 2.2 3.5 3.9 3.4
Ngwaketse West 0.9 0.5 1.1 1.0 0.9 0.8 1.1 1.0
South East 0.4 0.7 0.5 0.5 0.4 0.2 0.3 0.4
Kweneng East 4.4 5.1 4.6 4.5 4.0 3.3 3.4 4.2
Kweneng West 5.9 3.3 5.5 5.2 3.4 4.4 4.3 4.9
Kgatleng 5.7 5.5 6.8 6.2 4.8 6.3 6.3 6.3
Central Serowe/ Palapye 18.5 8.5 20.7 20.1 17.5 21.4 19.7 19.6
Central Mahalapye 8.7 4.8 6.8 7.1 5.8 6.7 6.6 6.6
Central Bobonong 4.2 4.0 4.0 4.4 4.0 3.5 3.7 4.0
Central Boteti 9.2 18.5 11.3 18.0 20.3 17.8 17.2 15.1
Central Tutume 5.5 7.0 5.1 4.6 4.3 3.9 4.5 4.8
North East 3.6 7.7 3.3 2.2 2.3 2.6 2.9 3.1
Ngamiland East 4.6 8.1 6.6 7.2 5.4 6.2 6.0 6.5
Ngamiland West 5.3 9.0 3.1 3.5 3.3 3.0 3.0 3.4
Chobe 0.5 0.1 0.3 0.4 0.3 0.3 0.3 0.3
Ghanzi 5.4 2.8 5.5 2.4 7.4 5.2 5.9 5.1
Kgalagadi South 2.4 1.9 2.8 1.3 3.5 2.9 3.0 2.6
kgalagadi North 2.8 3.1 3.2 2.6 4.5 3.9 3.7 3.4
TOTAL TRADITIONAL 100.0 100.0 100.0 100.0 100.0 100.0 100.0 100.0
TABLE 4.3: CATTLE HOLDINGS BY TYPE OF BREED AND DISTRICT District/Region Tswana Crosses Exotic
Ngwaketse 13,718 5,679 516
Barolong 9,967 2,423 219
Ngwaketse West 899 593 196
South East 1,803 329 23
Kweneng East 15,587 3,724 354
Kweneng West 2,905 7,400 287
Kgatleng 4,688 7,130 278
Central Serowe/ Palapye 16,580 15,869 1,443
Central Mahalapye 2,787 10,564 18
Central Bobonong 3,165 4,793 82
Central Boteti 12,589 8,152 105
Central Tutume 2,450 7,928 101
North East 9,467 5,493 88
Ngamiland East 1,689 6,341 112
Ngamiland West 2,747 5,241 -
Chobe 184 299 -
Ghanzi 985 740 150
Kgalagadi South 625 425 125
Kgalagadi North 502 355 -
TOTAL TRADITIONAL 103,338 93,477 4,095
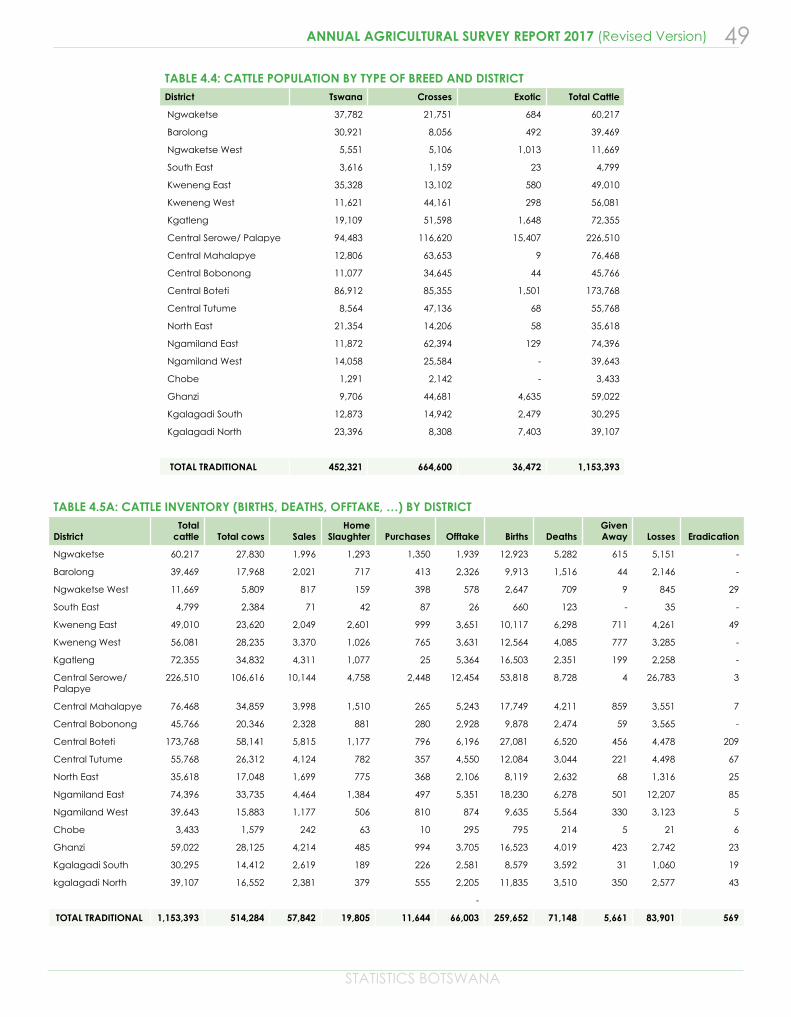
STATISTICS BOTSWANA
49ANNUAL AGRICULTURAL SURVEY REPORT 2017 (Revised Version)
TABLE 4.4: CATTLE POPULATION BY TYPE OF BREED AND DISTRICTDistrict Tswana Crosses Exotic Total Cattle
Ngwaketse 37,782 21,751 684 60,217
Barolong 30,921 8,056 492 39,469
Ngwaketse West 5,551 5,106 1,013 11,669
South East 3,616 1,159 23 4,799
Kweneng East 35,328 13,102 580 49,010
Kweneng West 11,621 44,161 298 56,081
Kgatleng 19,109 51,598 1,648 72,355
Central Serowe/ Palapye 94,483 116,620 15,407 226,510
Central Mahalapye 12,806 63,653 9 76,468
Central Bobonong 11,077 34,645 44 45,766
Central Boteti 86,912 85,355 1,501 173,768
Central Tutume 8,564 47,136 68 55,768
North East 21,354 14,206 58 35,618
Ngamiland East 11,872 62,394 129 74,396
Ngamiland West 14,058 25,584 - 39,643
Chobe 1,291 2,142 - 3,433
Ghanzi 9,706 44,681 4,635 59,022
Kgalagadi South 12,873 14,942 2,479 30,295
Kgalagadi North 23,396 8,308 7,403 39,107
TOTAL TRADITIONAL 452,321 664,600 36,472 1,153,393
TABLE 4.5A: CATTLE INVENTORY (BIRTHS, DEATHS, OFFTAKE, …) BY DISTRICT
DistrictTotal
cattle Total cows SalesHome
Slaughter Purchases Offtake Births DeathsGiven Away Losses Eradication
Ngwaketse 60,217 27,830 1,996 1,293 1,350 1,939 12,923 5,282 615 5,151 -
Barolong 39,469 17,968 2,021 717 413 2,326 9,913 1,516 44 2,146 -
Ngwaketse West 11,669 5,809 817 159 398 578 2,647 709 9 845 29
South East 4,799 2,384 71 42 87 26 660 123 - 35 -
Kweneng East 49,010 23,620 2,049 2,601 999 3,651 10,117 6,298 711 4,261 49
Kweneng West 56,081 28,235 3,370 1,026 765 3,631 12,564 4,085 777 3,285 -
Kgatleng 72,355 34,832 4,311 1,077 25 5,364 16,503 2,351 199 2,258 -
Central Serowe/ Palapye
226,510 106,616 10,144 4,758 2,448 12,454 53,818 8,728 4 26,783 3
Central Mahalapye 76,468 34,859 3,998 1,510 265 5,243 17,749 4,211 859 3,551 7
Central Bobonong 45,766 20,346 2,328 881 280 2,928 9,878 2,474 59 3,565 -
Central Boteti 173,768 58,141 5,815 1,177 796 6,196 27,081 6,520 456 4,478 209
Central Tutume 55,768 26,312 4,124 782 357 4,550 12,084 3,044 221 4,498 67
North East 35,618 17,048 1,699 775 368 2,106 8,119 2,632 68 1,316 25
Ngamiland East 74,396 33,735 4,464 1,384 497 5,351 18,230 6,278 501 12,207 85
Ngamiland West 39,643 15,883 1,177 506 810 874 9,635 5,564 330 3,123 5
Chobe 3,433 1,579 242 63 10 295 795 214 5 21 6
Ghanzi 59,022 28,125 4,214 485 994 3,705 16,523 4,019 423 2,742 23
Kgalagadi South 30,295 14,412 2,619 189 226 2,581 8,579 3,592 31 1,060 19
kgalagadi North 39,107 16,552 2,381 379 555 2,205 11,835 3,510 350 2,577 43
-
TOTAL TRADITIONAL 1,153,393 514,284 57,842 19,805 11,644 66,003 259,652 71,148 5,661 83,901 569
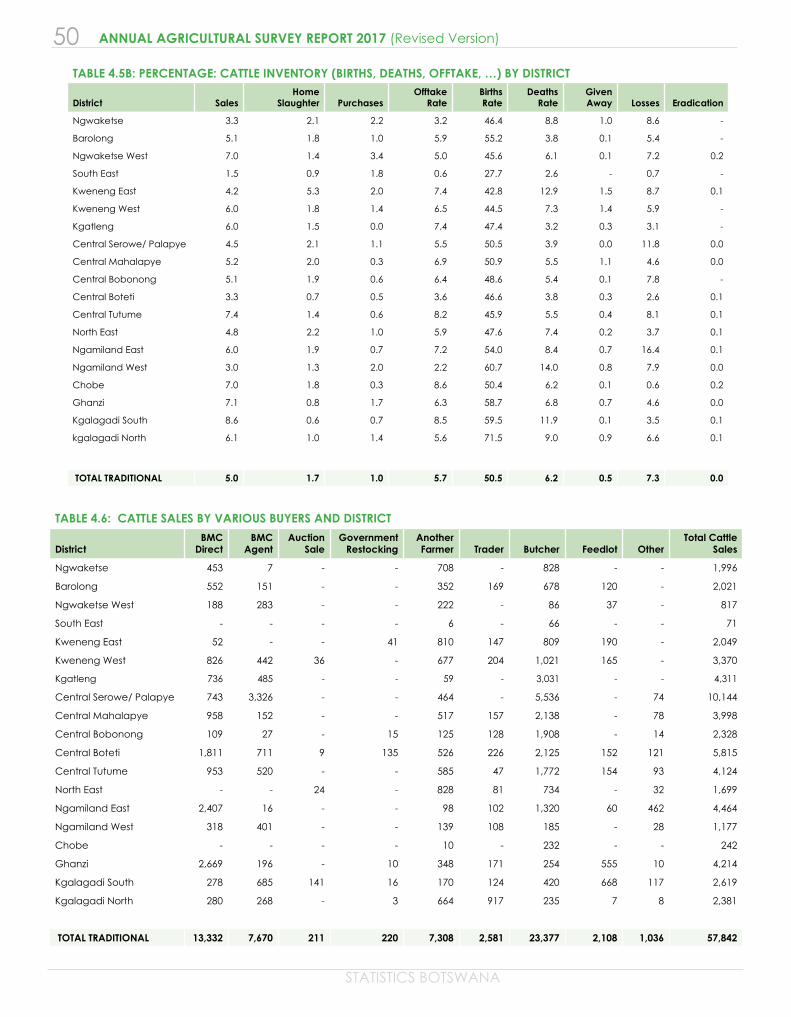
50
STATISTICS BOTSWANA
ANNUAL AGRICULTURAL SURVEY REPORT 2017 (Revised Version)
TABLE 4.5B: PERCENTAGE: CATTLE INVENTORY (BIRTHS, DEATHS, OFFTAKE, …) BY DISTRICT
District SalesHome
Slaughter PurchasesOfftake
RateBirths Rate
Deaths Rate
Given Away Losses Eradication
Ngwaketse 3.3 2.1 2.2 3.2 46.4 8.8 1.0 8.6 -
Barolong 5.1 1.8 1.0 5.9 55.2 3.8 0.1 5.4 -
Ngwaketse West 7.0 1.4 3.4 5.0 45.6 6.1 0.1 7.2 0.2
South East 1.5 0.9 1.8 0.6 27.7 2.6 - 0.7 -
Kweneng East 4.2 5.3 2.0 7.4 42.8 12.9 1.5 8.7 0.1
Kweneng West 6.0 1.8 1.4 6.5 44.5 7.3 1.4 5.9 -
Kgatleng 6.0 1.5 0.0 7.4 47.4 3.2 0.3 3.1 -
Central Serowe/ Palapye 4.5 2.1 1.1 5.5 50.5 3.9 0.0 11.8 0.0
Central Mahalapye 5.2 2.0 0.3 6.9 50.9 5.5 1.1 4.6 0.0
Central Bobonong 5.1 1.9 0.6 6.4 48.6 5.4 0.1 7.8 -
Central Boteti 3.3 0.7 0.5 3.6 46.6 3.8 0.3 2.6 0.1
Central Tutume 7.4 1.4 0.6 8.2 45.9 5.5 0.4 8.1 0.1
North East 4.8 2.2 1.0 5.9 47.6 7.4 0.2 3.7 0.1
Ngamiland East 6.0 1.9 0.7 7.2 54.0 8.4 0.7 16.4 0.1
Ngamiland West 3.0 1.3 2.0 2.2 60.7 14.0 0.8 7.9 0.0
Chobe 7.0 1.8 0.3 8.6 50.4 6.2 0.1 0.6 0.2
Ghanzi 7.1 0.8 1.7 6.3 58.7 6.8 0.7 4.6 0.0
Kgalagadi South 8.6 0.6 0.7 8.5 59.5 11.9 0.1 3.5 0.1
kgalagadi North 6.1 1.0 1.4 5.6 71.5 9.0 0.9 6.6 0.1
TOTAL TRADITIONAL 5.0 1.7 1.0 5.7 50.5 6.2 0.5 7.3 0.0
TABLE 4.6: CATTLE SALES BY VARIOUS BUYERS AND DISTRICT
DistrictBMC
DirectBMC
AgentAuction
SaleGovernment
RestockingAnother Farmer Trader Butcher Feedlot Other
Total Cattle Sales
Ngwaketse 453 7 - - 708 - 828 - - 1,996
Barolong 552 151 - - 352 169 678 120 - 2,021
Ngwaketse West 188 283 - - 222 - 86 37 - 817
South East - - - - 6 - 66 - - 71
Kweneng East 52 - - 41 810 147 809 190 - 2,049
Kweneng West 826 442 36 - 677 204 1,021 165 - 3,370
Kgatleng 736 485 - - 59 - 3,031 - - 4,311
Central Serowe/ Palapye 743 3,326 - - 464 - 5,536 - 74 10,144
Central Mahalapye 958 152 - - 517 157 2,138 - 78 3,998
Central Bobonong 109 27 - 15 125 128 1,908 - 14 2,328
Central Boteti 1,811 711 9 135 526 226 2,125 152 121 5,815
Central Tutume 953 520 - - 585 47 1,772 154 93 4,124
North East - - 24 - 828 81 734 - 32 1,699
Ngamiland East 2,407 16 - - 98 102 1,320 60 462 4,464
Ngamiland West 318 401 - - 139 108 185 - 28 1,177
Chobe - - - - 10 - 232 - - 242
Ghanzi 2,669 196 - 10 348 171 254 555 10 4,214
Kgalagadi South 278 685 141 16 170 124 420 668 117 2,619
Kgalagadi North 280 268 - 3 664 917 235 7 8 2,381
TOTAL TRADITIONAL 13,332 7,670 211 220 7,308 2,581 23,377 2,108 1,036 57,842
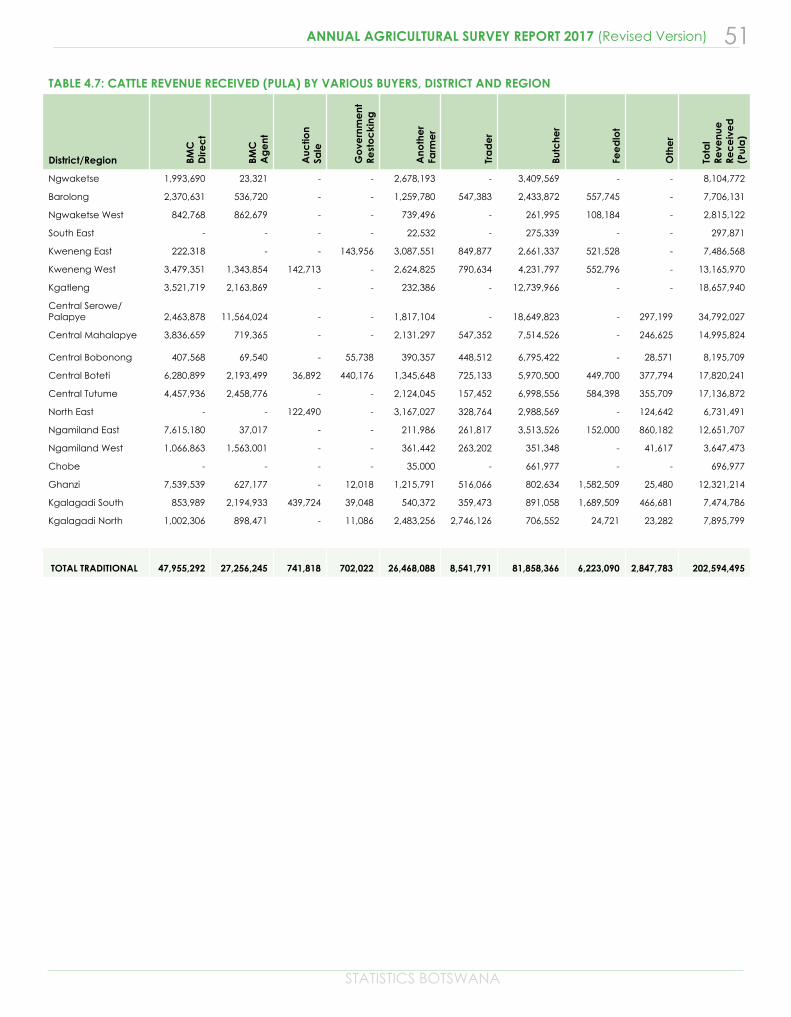
STATISTICS BOTSWANA
51ANNUAL AGRICULTURAL SURVEY REPORT 2017 (Revised Version)
TABLE 4.7: CATTLE REVENUE RECEIVED (PULA) BY VARIOUS BUYERS, DISTRICT AND REGION
District/Region BMC
Dire
ct
BMC
Ag
ent
Auc
tion
Sale
Go
vern
me
ntRe
sto
cki
ng
Ano
the
rFa
rme
r
Tra
de
r
Butc
her
Fee
dlo
t
Oth
er
Tota
l Re
venu
eRe
ce
ive
d
(Pul
a)
Ngwaketse 1,993,690 23,321 - - 2,678,193 - 3,409,569 - - 8,104,772
Barolong 2,370,631 536,720 - - 1,259,780 547,383 2,433,872 557,745 - 7,706,131
Ngwaketse West 842,768 862,679 - - 739,496 - 261,995 108,184 - 2,815,122
South East - - - - 22,532 - 275,339 - - 297,871
Kweneng East 222,318 - - 143,956 3,087,551 849,877 2,661,337 521,528 - 7,486,568
Kweneng West 3,479,351 1,343,854 142,713 - 2,624,825 790,634 4,231,797 552,796 - 13,165,970
Kgatleng 3,521,719 2,163,869 - - 232,386 - 12,739,966 - - 18,657,940
Central Serowe/ Palapye 2,463,878 11,564,024 - - 1,817,104 - 18,649,823 - 297,199 34,792,027
Central Mahalapye 3,836,659 719,365 - - 2,131,297 547,352 7,514,526 - 246,625 14,995,824
Central Bobonong 407,568 69,540 - 55,738 390,357 448,512 6,795,422 - 28,571 8,195,709
Central Boteti 6,280,899 2,193,499 36,892 440,176 1,345,648 725,133 5,970,500 449,700 377,794 17,820,241
Central Tutume 4,457,936 2,458,776 - - 2,124,045 157,452 6,998,556 584,398 355,709 17,136,872
North East - - 122,490 - 3,167,027 328,764 2,988,569 - 124,642 6,731,491
Ngamiland East 7,615,180 37,017 - - 211,986 261,817 3,513,526 152,000 860,182 12,651,707
Ngamiland West 1,066,863 1,563,001 - - 361,442 263,202 351,348 - 41,617 3,647,473
Chobe - - - - 35,000 - 661,977 - - 696,977
Ghanzi 7,539,539 627,177 - 12,018 1,215,791 516,066 802,634 1,582,509 25,480 12,321,214
Kgalagadi South 853,989 2,194,933 439,724 39,048 540,372 359,473 891,058 1,689,509 466,681 7,474,786
Kgalagadi North 1,002,306 898,471 - 11,086 2,483,256 2,746,126 706,552 24,721 23,282 7,895,799
TOTAL TRADITIONAL 47,955,292 27,256,245 741,818 702,022 26,468,088 8,541,791 81,858,366 6,223,090
2,847,783 202,594,495
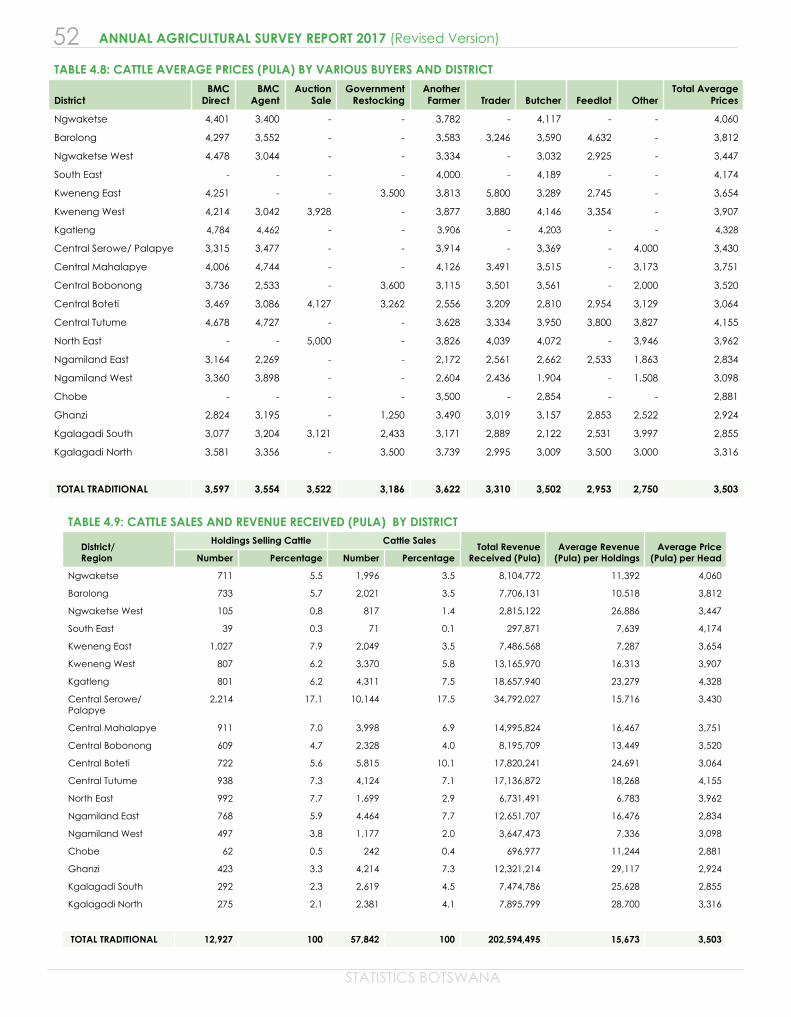
52
STATISTICS BOTSWANA
ANNUAL AGRICULTURAL SURVEY REPORT 2017 (Revised Version)
TABLE 4.8: CATTLE AVERAGE PRICES (PULA) BY VARIOUS BUYERS AND DISTRICT
DistrictBMC
DirectBMC
AgentAuction
SaleGovernment
RestockingAnother Farmer Trader Butcher Feedlot Other
Total Average Prices
Ngwaketse 4,401 3,400 - - 3,782 - 4,117 - - 4,060
Barolong 4,297 3,552 - - 3,583 3,246 3,590 4,632 - 3,812
Ngwaketse West 4,478 3,044 - - 3,334 - 3,032 2,925 - 3,447
South East - - - - 4,000 - 4,189 - - 4,174
Kweneng East 4,251 - - 3,500 3,813 5,800 3,289 2,745 - 3,654
Kweneng West 4,214 3,042 3,928 - 3,877 3,880 4,146 3,354 - 3,907
Kgatleng 4,784 4,462 - - 3,906 - 4,203 - - 4,328
Central Serowe/ Palapye 3,315 3,477 - - 3,914 - 3,369 - 4,000 3,430
Central Mahalapye 4,006 4,744 - - 4,126 3,491 3,515 - 3,173 3,751
Central Bobonong 3,736 2,533 - 3,600 3,115 3,501 3,561 - 2,000 3,520
Central Boteti 3,469 3,086 4,127 3,262 2,556 3,209 2,810 2,954 3,129 3,064
Central Tutume 4,678 4,727 - - 3,628 3,334 3,950 3,800 3,827 4,155
North East - - 5,000 - 3,826 4,039 4,072 - 3,946 3,962
Ngamiland East 3,164 2,269 - - 2,172 2,561 2,662 2,533 1,863 2,834
Ngamiland West 3,360 3,898 - - 2,604 2,436 1,904 - 1,508 3,098
Chobe - - - - 3,500 - 2,854 - - 2,881
Ghanzi 2,824 3,195 - 1,250 3,490 3,019 3,157 2,853 2,522 2,924
Kgalagadi South 3,077 3,204 3,121 2,433 3,171 2,889 2,122 2,531 3,997 2,855
Kgalagadi North 3,581 3,356 - 3,500 3,739 2,995 3,009 3,500 3,000 3,316
TOTAL TRADITIONAL 3,597 3,554 3,522 3,186 3,622 3,310 3,502 2,953 2,750 3,503
TABLE 4.9: CATTLE SALES AND REVENUE RECEIVED (PULA) BY DISTRICT
District/ Region
Holdings Selling Cattle Cattle SalesTotal Revenue
Received (Pula)Average Revenue
(Pula) per HoldingsAverage Price
(Pula) per HeadNumber Percentage Number Percentage
Ngwaketse 711 5.5 1,996 3.5 8,104,772 11,392 4,060
Barolong 733 5.7 2,021 3.5 7,706,131 10,518 3,812
Ngwaketse West 105 0.8 817 1.4 2,815,122 26,886 3,447
South East 39 0.3 71 0.1 297,871 7,639 4,174
Kweneng East 1,027 7.9 2,049 3.5 7,486,568 7,287 3,654
Kweneng West 807 6.2 3,370 5.8 13,165,970 16,313 3,907
Kgatleng 801 6.2 4,311 7.5 18,657,940 23,279 4,328
Central Serowe/ Palapye
2,214 17.1 10,144 17.5 34,792,027 15,716 3,430
Central Mahalapye 911 7.0 3,998 6.9 14,995,824 16,467 3,751
Central Bobonong 609 4.7 2,328 4.0 8,195,709 13,449 3,520
Central Boteti 722 5.6 5,815 10.1 17,820,241 24,691 3,064
Central Tutume 938 7.3 4,124 7.1 17,136,872 18,268 4,155
North East 992 7.7 1,699 2.9 6,731,491 6,783 3,962
Ngamiland East 768 5.9 4,464 7.7 12,651,707 16,476 2,834
Ngamiland West 497 3.8 1,177 2.0 3,647,473 7,336 3,098
Chobe 62 0.5 242 0.4 696,977 11,244 2,881
Ghanzi 423 3.3 4,214 7.3 12,321,214 29,117 2,924
Kgalagadi South 292 2.3 2,619 4.5 7,474,786 25,628 2,855
Kgalagadi North 275 2.1 2,381 4.1 7,895,799 28,700 3,316
TOTAL TRADITIONAL 12,927 100 57,842 100 202,594,495 15,673 3,503
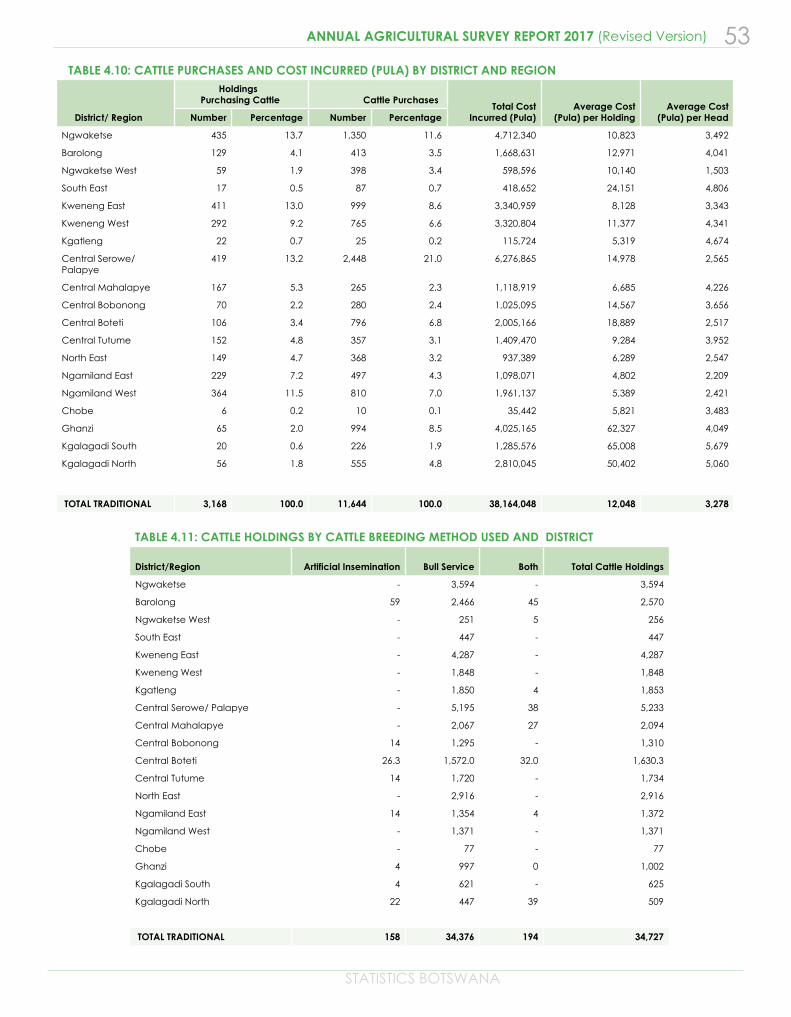
STATISTICS BOTSWANA
53ANNUAL AGRICULTURAL SURVEY REPORT 2017 (Revised Version)
TABLE 4.10: CATTLE PURCHASES AND COST INCURRED (PULA) BY DISTRICT AND REGION
District/ Region
Holdings Purchasing Cattle Cattle Purchases
Total Cost Incurred (Pula)
Average Cost (Pula) per Holding
Average Cost (Pula) per HeadNumber Percentage Number Percentage
Ngwaketse 435 13.7 1,350 11.6 4,712,340 10,823 3,492
Barolong 129 4.1 413 3.5 1,668,631 12,971 4,041
Ngwaketse West 59 1.9 398 3.4 598,596 10,140 1,503
South East 17 0.5 87 0.7 418,652 24,151 4,806
Kweneng East 411 13.0 999 8.6 3,340,959 8,128 3,343
Kweneng West 292 9.2 765 6.6 3,320,804 11,377 4,341
Kgatleng 22 0.7 25 0.2 115,724 5,319 4,674
Central Serowe/ Palapye
419 13.2 2,448 21.0 6,276,865 14,978 2,565
Central Mahalapye 167 5.3 265 2.3 1,118,919 6,685 4,226
Central Bobonong 70 2.2 280 2.4 1,025,095 14,567 3,656
Central Boteti 106 3.4 796 6.8 2,005,166 18,889 2,517
Central Tutume 152 4.8 357 3.1 1,409,470 9,284 3,952
North East 149 4.7 368 3.2 937,389 6,289 2,547
Ngamiland East 229 7.2 497 4.3 1,098,071 4,802 2,209
Ngamiland West 364 11.5 810 7.0 1,961,137 5,389 2,421
Chobe 6 0.2 10 0.1 35,442 5,821 3,483
Ghanzi 65 2.0 994 8.5 4,025,165 62,327 4,049
Kgalagadi South 20 0.6 226 1.9 1,285,576 65,008 5,679
Kgalagadi North 56 1.8 555 4.8 2,810,045 50,402 5,060
TOTAL TRADITIONAL 3,168 100.0 11,644 100.0 38,164,048 12,048 3,278
TABLE 4.11: CATTLE HOLDINGS BY CATTLE BREEDING METHOD USED AND DISTRICT District/Region Artificial Insemination Bull Service Both Total Cattle Holdings
Ngwaketse - 3,594 - 3,594
Barolong 59 2,466 45 2,570
Ngwaketse West - 251 5 256
South East - 447 - 447
Kweneng East - 4,287 - 4,287
Kweneng West - 1,848 - 1,848
Kgatleng - 1,850 4 1,853
Central Serowe/ Palapye - 5,195 38 5,233
Central Mahalapye - 2,067 27 2,094
Central Bobonong 14 1,295 - 1,310
Central Boteti 26.3 1,572.0 32.0 1,630.3
Central Tutume 14 1,720 - 1,734
North East - 2,916 - 2,916
Ngamiland East 14 1,354 4 1,372
Ngamiland West - 1,371 - 1,371
Chobe - 77 - 77
Ghanzi 4 997 0 1,002
Kgalagadi South 4 621 - 625
Kgalagadi North 22 447 39 509
TOTAL TRADITIONAL 158 34,376 194 34,727
54
STATISTICS BOTSWANA
ANNUAL AGRICULTURAL SURVEY REPORT 2017 (Revised Version)
TRADITIONAL SECTOR: SMALL STOCK (GOATS)
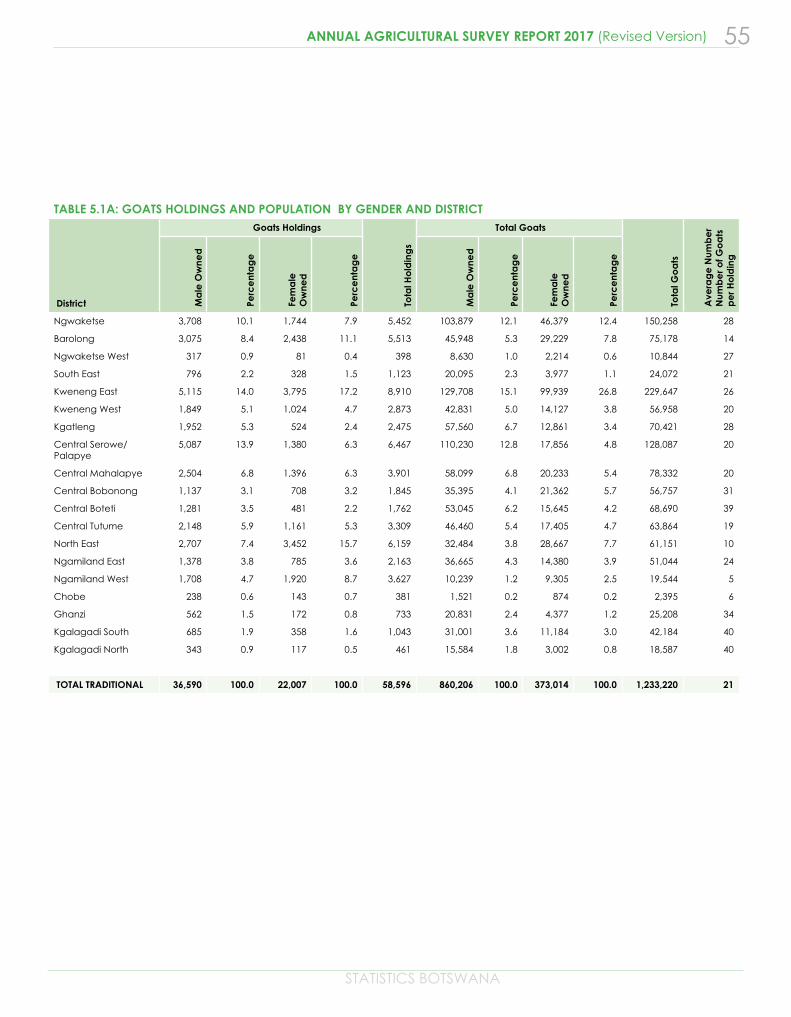
STATISTICS BOTSWANA
55ANNUAL AGRICULTURAL SURVEY REPORT 2017 (Revised Version)
TABLE 5.1A: GOATS HOLDINGS AND POPULATION BY GENDER AND DISTRICT
District
Goats Holdings
Tota
l Ho
ldin
gs
Total Goats
Tota
l Go
ats
Ave
rag
e N
umb
er
Num
be
r of G
oa
ts
pe
r Ho
ldin
g
Ma
le O
wne
d
Perc
ent
ag
e
Fem
ale
O
wne
d
Perc
ent
ag
e
Ma
le O
wne
d
Perc
ent
ag
e
Fem
ale
O
wne
d
Perc
ent
ag
e
Ngwaketse 3,708 10.1 1,744 7.9 5,452 103,879 12.1 46,379 12.4 150,258 28
Barolong 3,075 8.4 2,438 11.1 5,513 45,948 5.3 29,229 7.8 75,178 14
Ngwaketse West 317 0.9 81 0.4 398 8,630 1.0 2,214 0.6 10,844 27
South East 796 2.2 328 1.5 1,123 20,095 2.3 3,977 1.1 24,072 21
Kweneng East 5,115 14.0 3,795 17.2 8,910 129,708 15.1 99,939 26.8 229,647 26
Kweneng West 1,849 5.1 1,024 4.7 2,873 42,831 5.0 14,127 3.8 56,958 20
Kgatleng 1,952 5.3 524 2.4 2,475 57,560 6.7 12,861 3.4 70,421 28
Central Serowe/ Palapye
5,087 13.9 1,380 6.3 6,467 110,230 12.8 17,856 4.8 128,087 20
Central Mahalapye 2,504 6.8 1,396 6.3 3,901 58,099 6.8 20,233 5.4 78,332 20
Central Bobonong 1,137 3.1 708 3.2 1,845 35,395 4.1 21,362 5.7 56,757 31
Central Boteti 1,281 3.5 481 2.2 1,762 53,045 6.2 15,645 4.2 68,690 39
Central Tutume 2,148 5.9 1,161 5.3 3,309 46,460 5.4 17,405 4.7 63,864 19
North East 2,707 7.4 3,452 15.7 6,159 32,484 3.8 28,667 7.7 61,151 10
Ngamiland East 1,378 3.8 785 3.6 2,163 36,665 4.3 14,380 3.9 51,044 24
Ngamiland West 1,708 4.7 1,920 8.7 3,627 10,239 1.2 9,305 2.5 19,544 5
Chobe 238 0.6 143 0.7 381 1,521 0.2 874 0.2 2,395 6
Ghanzi 562 1.5 172 0.8 733 20,831 2.4 4,377 1.2 25,208 34
Kgalagadi South 685 1.9 358 1.6 1,043 31,001 3.6 11,184 3.0 42,184 40
Kgalagadi North 343 0.9 117 0.5 461 15,584 1.8 3,002 0.8 18,587 40
TOTAL TRADITIONAL 36,590 100.0 22,007 100.0 58,596 860,206 100.0 373,014 100.0 1,233,220 21
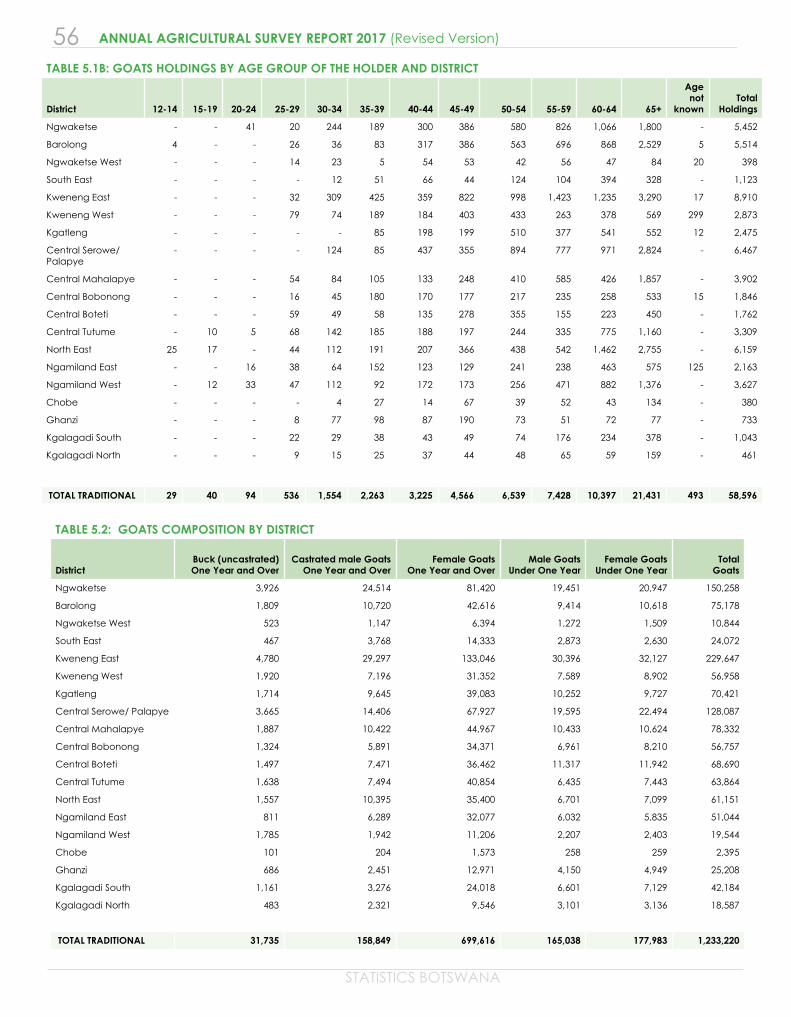
56
STATISTICS BOTSWANA
ANNUAL AGRICULTURAL SURVEY REPORT 2017 (Revised Version)
TABLE 5.1B: GOATS HOLDINGS BY AGE GROUP OF THE HOLDER AND DISTRICT
District 12-14 15-19 20-24 25-29 30-34 35-39 40-44 45-49 50-54 55-59 60-64 65+
Age not
knownTotal
Holdings
Ngwaketse - - 41 20 244 189 300 386 580 826 1,066 1,800 - 5,452
Barolong 4 - - 26 36 83 317 386 563 696 868 2,529 5 5,514
Ngwaketse West - - - 14 23 5 54 53 42 56 47 84 20 398
South East - - - - 12 51 66 44 124 104 394 328 - 1,123
Kweneng East - - - 32 309 425 359 822 998 1,423 1,235 3,290 17 8,910
Kweneng West - - - 79 74 189 184 403 433 263 378 569 299 2,873
Kgatleng - - - - - 85 198 199 510 377 541 552 12 2,475
Central Serowe/ Palapye
- - - - 124 85 437 355 894 777 971 2,824 - 6,467
Central Mahalapye - - - 54 84 105 133 248 410 585 426 1,857 - 3,902
Central Bobonong - - - 16 45 180 170 177 217 235 258 533 15 1,846
Central Boteti - - - 59 49 58 135 278 355 155 223 450 - 1,762
Central Tutume - 10 5 68 142 185 188 197 244 335 775 1,160 - 3,309
North East 25 17 - 44 112 191 207 366 438 542 1,462 2,755 - 6,159
Ngamiland East - - 16 38 64 152 123 129 241 238 463 575 125 2,163
Ngamiland West - 12 33 47 112 92 172 173 256 471 882 1,376 - 3,627
Chobe - - - - 4 27 14 67 39 52 43 134 - 380
Ghanzi - - - 8 77 98 87 190 73 51 72 77 - 733
Kgalagadi South - - - 22 29 38 43 49 74 176 234 378 - 1,043
Kgalagadi North - - - 9 15 25 37 44 48 65 59 159 - 461
TOTAL TRADITIONAL 29 40 94 536 1,554 2,263 3,225 4,566 6,539 7,428 10,397 21,431 493 58,596
TABLE 5.2: GOATS COMPOSITION BY DISTRICT
District Buck (uncastrated)
One Year and OverCastrated male Goats
One Year and OverFemale Goats
One Year and OverMale Goats
Under One YearFemale Goats
Under One YearTotal
Goats
Ngwaketse 3,926 24,514 81,420 19,451 20,947 150,258
Barolong 1,809 10,720 42,616 9,414 10,618 75,178
Ngwaketse West 523 1,147 6,394 1,272 1,509 10,844
South East 467 3,768 14,333 2,873 2,630 24,072
Kweneng East 4,780 29,297 133,046 30,396 32,127 229,647
Kweneng West 1,920 7,196 31,352 7,589 8,902 56,958
Kgatleng 1,714 9,645 39,083 10,252 9,727 70,421
Central Serowe/ Palapye 3,665 14,406 67,927 19,595 22,494 128,087
Central Mahalapye 1,887 10,422 44,967 10,433 10,624 78,332
Central Bobonong 1,324 5,891 34,371 6,961 8,210 56,757
Central Boteti 1,497 7,471 36,462 11,317 11,942 68,690
Central Tutume 1,638 7,494 40,854 6,435 7,443 63,864
North East 1,557 10,395 35,400 6,701 7,099 61,151
Ngamiland East 811 6,289 32,077 6,032 5,835 51,044
Ngamiland West 1,785 1,942 11,206 2,207 2,403 19,544
Chobe 101 204 1,573 258 259 2,395
Ghanzi 686 2,451 12,971 4,150 4,949 25,208
Kgalagadi South 1,161 3,276 24,018 6,601 7,129 42,184
Kgalagadi North 483 2,321 9,546 3,101 3,136 18,587
TOTAL TRADITIONAL 31,735 158,849 699,616 165,038 177,983 1,233,220
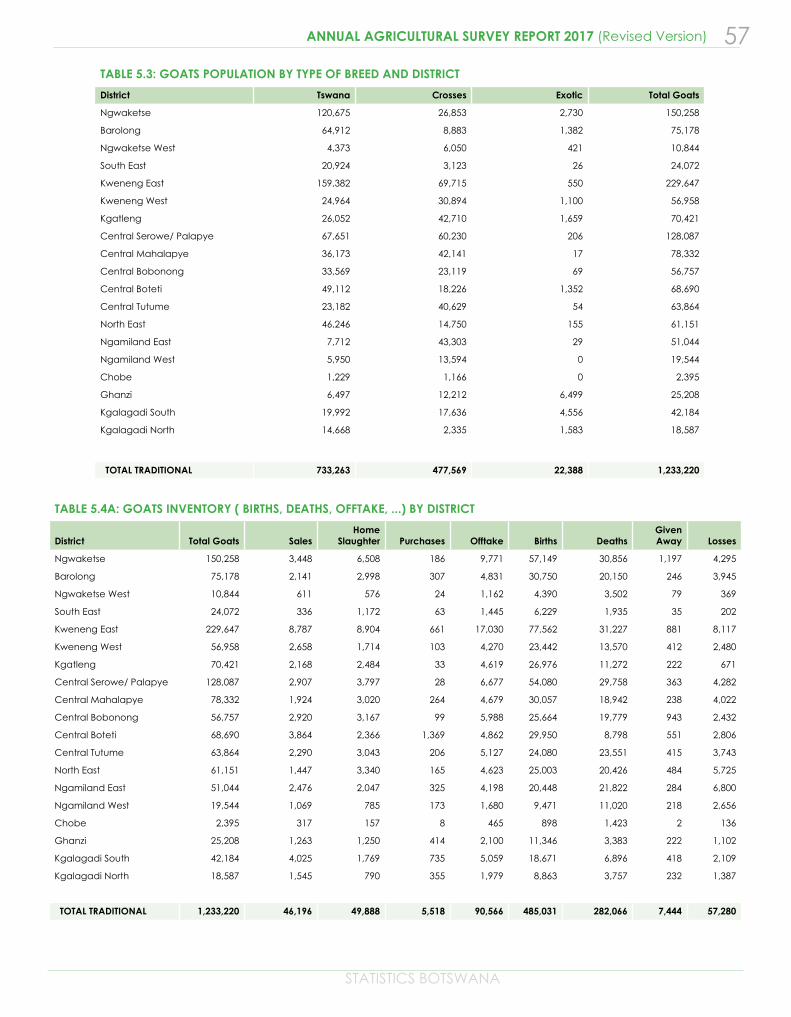
STATISTICS BOTSWANA
57ANNUAL AGRICULTURAL SURVEY REPORT 2017 (Revised Version)
TABLE 5.3: GOATS POPULATION BY TYPE OF BREED AND DISTRICT
District Tswana Crosses Exotic Total Goats
Ngwaketse 120,675 26,853 2,730 150,258
Barolong 64,912 8,883 1,382 75,178
Ngwaketse West 4,373 6,050 421 10,844
South East 20,924 3,123 26 24,072
Kweneng East 159,382 69,715 550 229,647
Kweneng West 24,964 30,894 1,100 56,958
Kgatleng 26,052 42,710 1,659 70,421
Central Serowe/ Palapye 67,651 60,230 206 128,087
Central Mahalapye 36,173 42,141 17 78,332
Central Bobonong 33,569 23,119 69 56,757
Central Boteti 49,112 18,226 1,352 68,690
Central Tutume 23,182 40,629 54 63,864
North East 46,246 14,750 155 61,151
Ngamiland East 7,712 43,303 29 51,044
Ngamiland West 5,950 13,594 0 19,544
Chobe 1,229 1,166 0 2,395
Ghanzi 6,497 12,212 6,499 25,208
Kgalagadi South 19,992 17,636 4,556 42,184
Kgalagadi North 14,668 2,335 1,583 18,587
TOTAL TRADITIONAL 733,263 477,569 22,388 1,233,220
TABLE 5.4A: GOATS INVENTORY ( BIRTHS, DEATHS, OFFTAKE, ...) BY DISTRICT
District Total Goats SalesHome
Slaughter Purchases Offtake Births DeathsGiven Away Losses
Ngwaketse 150,258 3,448 6,508 186 9,771 57,149 30,856 1,197 4,295
Barolong 75,178 2,141 2,998 307 4,831 30,750 20,150 246 3,945
Ngwaketse West 10,844 611 576 24 1,162 4,390 3,502 79 369
South East 24,072 336 1,172 63 1,445 6,229 1,935 35 202
Kweneng East 229,647 8,787 8,904 661 17,030 77,562 31,227 881 8,117
Kweneng West 56,958 2,658 1,714 103 4,270 23,442 13,570 412 2,480
Kgatleng 70,421 2,168 2,484 33 4,619 26,976 11,272 222 671
Central Serowe/ Palapye 128,087 2,907 3,797 28 6,677 54,080 29,758 363 4,282
Central Mahalapye 78,332 1,924 3,020 264 4,679 30,057 18,942 238 4,022
Central Bobonong 56,757 2,920 3,167 99 5,988 25,664 19,779 943 2,432
Central Boteti 68,690 3,864 2,366 1,369 4,862 29,950 8,798 551 2,806
Central Tutume 63,864 2,290 3,043 206 5,127 24,080 23,551 415 3,743
North East 61,151 1,447 3,340 165 4,623 25,003 20,426 484 5,725
Ngamiland East 51,044 2,476 2,047 325 4,198 20,448 21,822 284 6,800
Ngamiland West 19,544 1,069 785 173 1,680 9,471 11,020 218 2,656
Chobe 2,395 317 157 8 465 898 1,423 2 136
Ghanzi 25,208 1,263 1,250 414 2,100 11,346 3,383 222 1,102
Kgalagadi South 42,184 4,025 1,769 735 5,059 18,671 6,896 418 2,109
Kgalagadi North 18,587 1,545 790 355 1,979 8,863 3,757 232 1,387
TOTAL TRADITIONAL 1,233,220 46,196 49,888 5,518 90,566 485,031 282,066 7,444 57,280
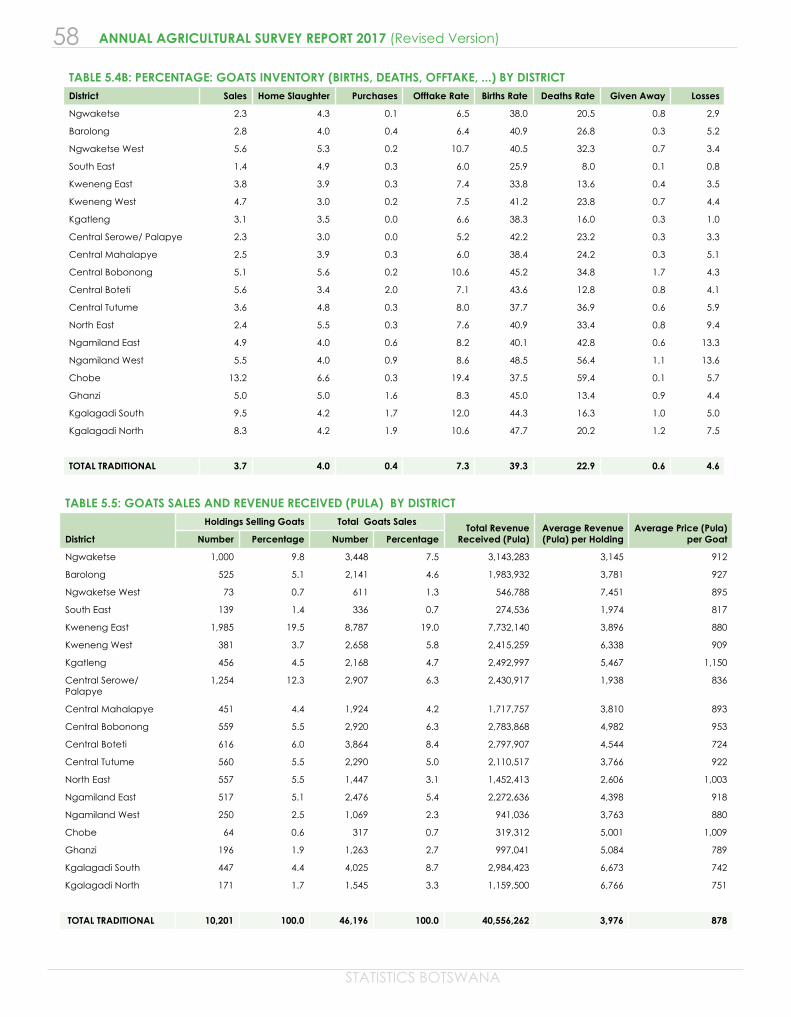
58
STATISTICS BOTSWANA
ANNUAL AGRICULTURAL SURVEY REPORT 2017 (Revised Version)
TABLE 5.4B: PERCENTAGE: GOATS INVENTORY (BIRTHS, DEATHS, OFFTAKE, ...) BY DISTRICTDistrict Sales Home Slaughter Purchases Offtake Rate Births Rate Deaths Rate Given Away Losses
Ngwaketse 2.3 4.3 0.1 6.5 38.0 20.5 0.8 2.9
Barolong 2.8 4.0 0.4 6.4 40.9 26.8 0.3 5.2
Ngwaketse West 5.6 5.3 0.2 10.7 40.5 32.3 0.7 3.4
South East 1.4 4.9 0.3 6.0 25.9 8.0 0.1 0.8
Kweneng East 3.8 3.9 0.3 7.4 33.8 13.6 0.4 3.5
Kweneng West 4.7 3.0 0.2 7.5 41.2 23.8 0.7 4.4
Kgatleng 3.1 3.5 0.0 6.6 38.3 16.0 0.3 1.0
Central Serowe/ Palapye 2.3 3.0 0.0 5.2 42.2 23.2 0.3 3.3
Central Mahalapye 2.5 3.9 0.3 6.0 38.4 24.2 0.3 5.1
Central Bobonong 5.1 5.6 0.2 10.6 45.2 34.8 1.7 4.3
Central Boteti 5.6 3.4 2.0 7.1 43.6 12.8 0.8 4.1
Central Tutume 3.6 4.8 0.3 8.0 37.7 36.9 0.6 5.9
North East 2.4 5.5 0.3 7.6 40.9 33.4 0.8 9.4
Ngamiland East 4.9 4.0 0.6 8.2 40.1 42.8 0.6 13.3
Ngamiland West 5.5 4.0 0.9 8.6 48.5 56.4 1.1 13.6
Chobe 13.2 6.6 0.3 19.4 37.5 59.4 0.1 5.7
Ghanzi 5.0 5.0 1.6 8.3 45.0 13.4 0.9 4.4
Kgalagadi South 9.5 4.2 1.7 12.0 44.3 16.3 1.0 5.0
Kgalagadi North 8.3 4.2 1.9 10.6 47.7 20.2 1.2 7.5
TOTAL TRADITIONAL 3.7 4.0 0.4 7.3 39.3 22.9 0.6 4.6
TABLE 5.5: GOATS SALES AND REVENUE RECEIVED (PULA) BY DISTRICT
District
Holdings Selling Goats Total Goats SalesTotal Revenue
Received (Pula)Average Revenue (Pula) per Holding
Average Price (Pula) per Goat Number Percentage Number Percentage
Ngwaketse 1,000 9.8 3,448 7.5 3,143,283 3,145 912
Barolong 525 5.1 2,141 4.6 1,983,932 3,781 927
Ngwaketse West 73 0.7 611 1.3 546,788 7,451 895
South East 139 1.4 336 0.7 274,536 1,974 817
Kweneng East 1,985 19.5 8,787 19.0 7,732,140 3,896 880
Kweneng West 381 3.7 2,658 5.8 2,415,259 6,338 909
Kgatleng 456 4.5 2,168 4.7 2,492,997 5,467 1,150
Central Serowe/ Palapye
1,254 12.3 2,907 6.3 2,430,917 1,938 836
Central Mahalapye 451 4.4 1,924 4.2 1,717,757 3,810 893
Central Bobonong 559 5.5 2,920 6.3 2,783,868 4,982 953
Central Boteti 616 6.0 3,864 8.4 2,797,907 4,544 724
Central Tutume 560 5.5 2,290 5.0 2,110,517 3,766 922
North East 557 5.5 1,447 3.1 1,452,413 2,606 1,003
Ngamiland East 517 5.1 2,476 5.4 2,272,636 4,398 918
Ngamiland West 250 2.5 1,069 2.3 941,036 3,763 880
Chobe 64 0.6 317 0.7 319,312 5,001 1,009
Ghanzi 196 1.9 1,263 2.7 997,041 5,084 789
Kgalagadi South 447 4.4 4,025 8.7 2,984,423 6,673 742
Kgalagadi North 171 1.7 1,545 3.3 1,159,500 6,766 751
TOTAL TRADITIONAL 10,201 100.0 46,196 100.0 40,556,262 3,976 878
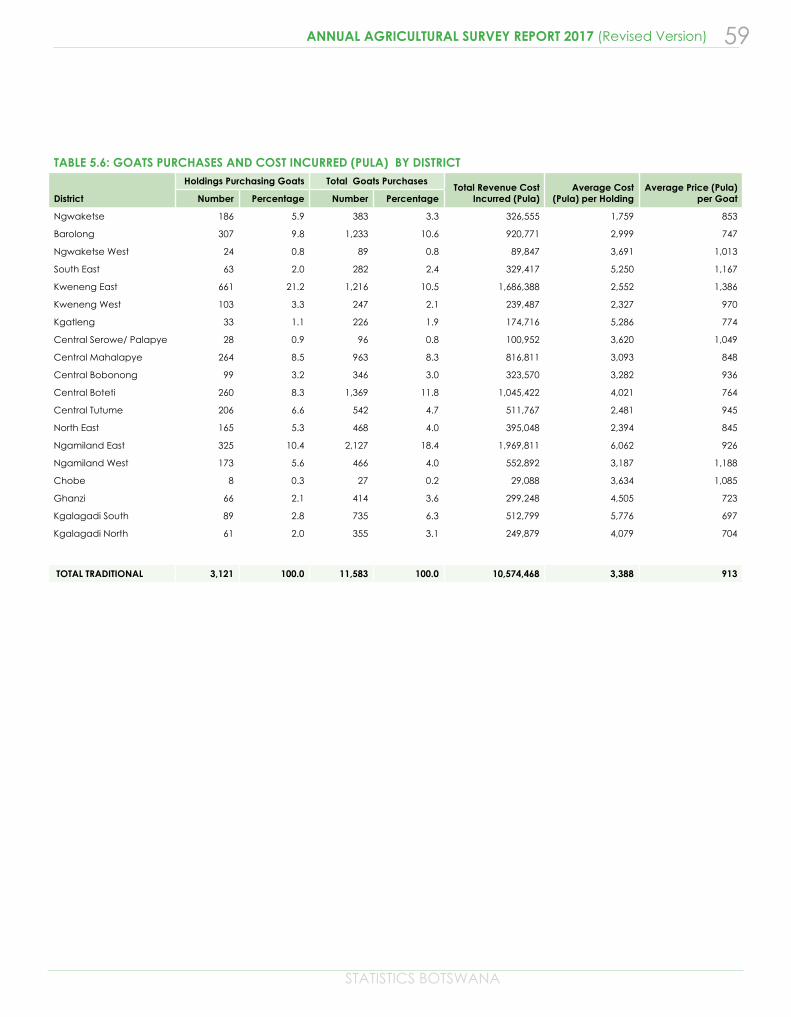
STATISTICS BOTSWANA
59ANNUAL AGRICULTURAL SURVEY REPORT 2017 (Revised Version)
TABLE 5.6: GOATS PURCHASES AND COST INCURRED (PULA) BY DISTRICT
District
Holdings Purchasing Goats Total Goats PurchasesTotal Revenue Cost
Incurred (Pula)Average Cost
(Pula) per HoldingAverage Price (Pula)
per Goat Number Percentage Number Percentage
Ngwaketse 186 5.9 383 3.3 326,555 1,759 853
Barolong 307 9.8 1,233 10.6 920,771 2,999 747
Ngwaketse West 24 0.8 89 0.8 89,847 3,691 1,013
South East 63 2.0 282 2.4 329,417 5,250 1,167
Kweneng East 661 21.2 1,216 10.5 1,686,388 2,552 1,386
Kweneng West 103 3.3 247 2.1 239,487 2,327 970
Kgatleng 33 1.1 226 1.9 174,716 5,286 774
Central Serowe/ Palapye 28 0.9 96 0.8 100,952 3,620 1,049
Central Mahalapye 264 8.5 963 8.3 816,811 3,093 848
Central Bobonong 99 3.2 346 3.0 323,570 3,282 936
Central Boteti 260 8.3 1,369 11.8 1,045,422 4,021 764
Central Tutume 206 6.6 542 4.7 511,767 2,481 945
North East 165 5.3 468 4.0 395,048 2,394 845
Ngamiland East 325 10.4 2,127 18.4 1,969,811 6,062 926
Ngamiland West 173 5.6 466 4.0 552,892 3,187 1,188
Chobe 8 0.3 27 0.2 29,088 3,634 1,085
Ghanzi 66 2.1 414 3.6 299,248 4,505 723
Kgalagadi South 89 2.8 735 6.3 512,799 5,776 697
Kgalagadi North 61 2.0 355 3.1 249,879 4,079 704
TOTAL TRADITIONAL 3,121 100.0 11,583 100.0 10,574,468 3,388 913
60
STATISTICS BOTSWANA
ANNUAL AGRICULTURAL SURVEY REPORT 2017 (Revised Version)
TRADITIONAL SECTOR: SMALL STOCK (SHEEP)
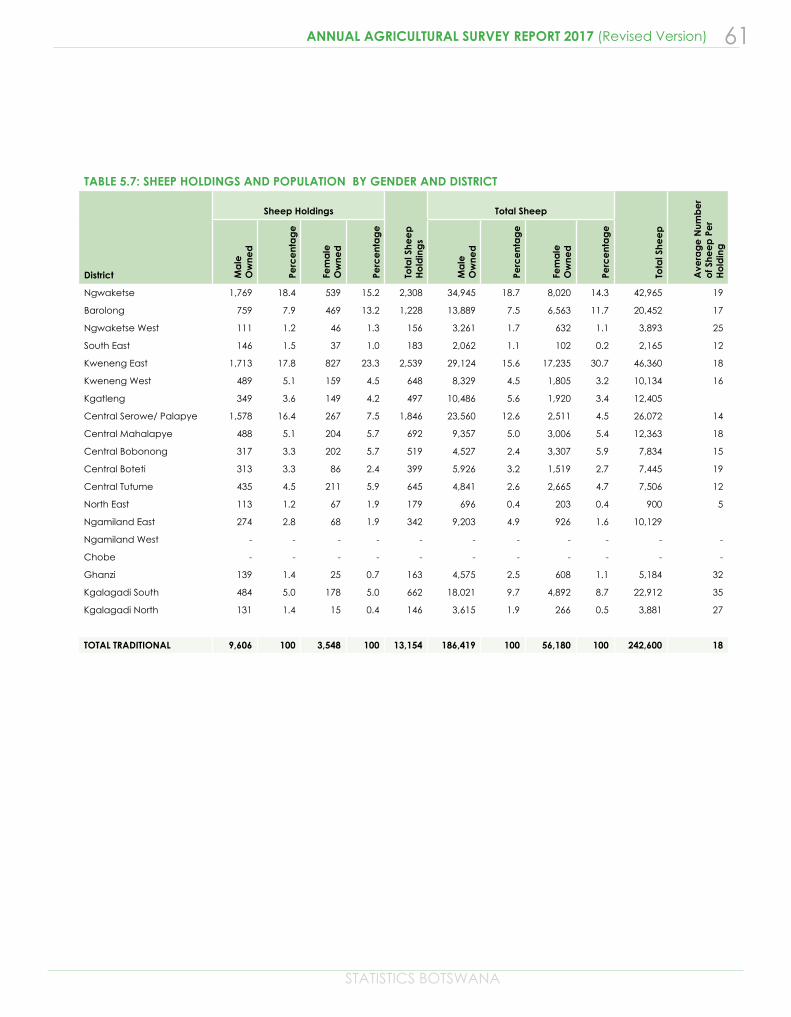
STATISTICS BOTSWANA
61ANNUAL AGRICULTURAL SURVEY REPORT 2017 (Revised Version)
TABLE 5.7: SHEEP HOLDINGS AND POPULATION BY GENDER AND DISTRICT
District
Sheep Holdings
Tota
l She
ep
H
old
ing
s
Total Sheep
Tota
l She
ep
Ave
rag
e N
umb
er
of S
hee
p P
er
Ho
ldin
g
Ma
le
Ow
ned
Perc
ent
ag
e
Fem
ale
O
wne
d
Perc
ent
ag
e
Ma
le
Ow
ned
Perc
ent
ag
e
Fem
ale
O
wne
d
Perc
ent
ag
e
Ngwaketse 1,769 18.4 539 15.2 2,308 34,945 18.7 8,020 14.3 42,965 19
Barolong 759 7.9 469 13.2 1,228 13,889 7.5 6,563 11.7 20,452 17
Ngwaketse West 111 1.2 46 1.3 156 3,261 1.7 632 1.1 3,893 25
South East 146 1.5 37 1.0 183 2,062 1.1 102 0.2 2,165 12
Kweneng East 1,713 17.8 827 23.3 2,539 29,124 15.6 17,235 30.7 46,360 18
Kweneng West 489 5.1 159 4.5 648 8,329 4.5 1,805 3.2 10,134 16
Kgatleng 349 3.6 149 4.2 497 10,486 5.6 1,920 3.4 12,405
Central Serowe/ Palapye 1,578 16.4 267 7.5 1,846 23,560 12.6 2,511 4.5 26,072 14
Central Mahalapye 488 5.1 204 5.7 692 9,357 5.0 3,006 5.4 12,363 18
Central Bobonong 317 3.3 202 5.7 519 4,527 2.4 3,307 5.9 7,834 15
Central Boteti 313 3.3 86 2.4 399 5,926 3.2 1,519 2.7 7,445 19
Central Tutume 435 4.5 211 5.9 645 4,841 2.6 2,665 4.7 7,506 12
North East 113 1.2 67 1.9 179 696 0.4 203 0.4 900 5
Ngamiland East 274 2.8 68 1.9 342 9,203 4.9 926 1.6 10,129
Ngamiland West - - - - - - - - - - -
Chobe - - - - - - - - - - -
Ghanzi 139 1.4 25 0.7 163 4,575 2.5 608 1.1 5,184 32
Kgalagadi South 484 5.0 178 5.0 662 18,021 9.7 4,892 8.7 22,912 35
Kgalagadi North 131 1.4 15 0.4 146 3,615 1.9 266 0.5 3,881 27
TOTAL TRADITIONAL 9,606 100 3,548 100 13,154 186,419 100 56,180 100 242,600 18
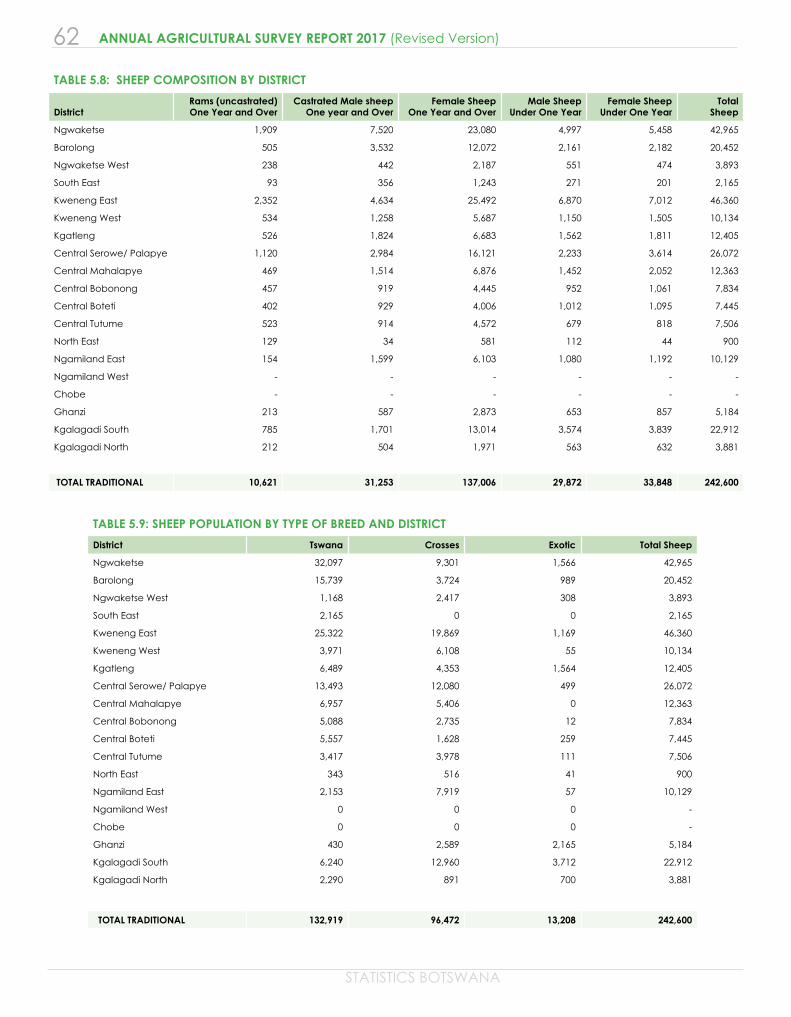
62
STATISTICS BOTSWANA
ANNUAL AGRICULTURAL SURVEY REPORT 2017 (Revised Version)
TABLE 5.8: SHEEP COMPOSITION BY DISTRICT
District Rams (uncastrated) One Year and Over
Castrated Male sheep One year and Over
Female Sheep One Year and Over
Male Sheep Under One Year
Female Sheep Under One Year
Total Sheep
Ngwaketse 1,909 7,520 23,080 4,997 5,458 42,965
Barolong 505 3,532 12,072 2,161 2,182 20,452
Ngwaketse West 238 442 2,187 551 474 3,893
South East 93 356 1,243 271 201 2,165
Kweneng East 2,352 4,634 25,492 6,870 7,012 46,360
Kweneng West 534 1,258 5,687 1,150 1,505 10,134
Kgatleng 526 1,824 6,683 1,562 1,811 12,405
Central Serowe/ Palapye 1,120 2,984 16,121 2,233 3,614 26,072
Central Mahalapye 469 1,514 6,876 1,452 2,052 12,363
Central Bobonong 457 919 4,445 952 1,061 7,834
Central Boteti 402 929 4,006 1,012 1,095 7,445
Central Tutume 523 914 4,572 679 818 7,506
North East 129 34 581 112 44 900
Ngamiland East 154 1,599 6,103 1,080 1,192 10,129
Ngamiland West - - - - - -
Chobe - - - - - -
Ghanzi 213 587 2,873 653 857 5,184
Kgalagadi South 785 1,701 13,014 3,574 3,839 22,912
Kgalagadi North 212 504 1,971 563 632 3,881
TOTAL TRADITIONAL 10,621 31,253 137,006 29,872 33,848 242,600
TABLE 5.9: SHEEP POPULATION BY TYPE OF BREED AND DISTRICT
District Tswana Crosses Exotic Total Sheep
Ngwaketse 32,097 9,301 1,566 42,965
Barolong 15,739 3,724 989 20,452
Ngwaketse West 1,168 2,417 308 3,893
South East 2,165 0 0 2,165
Kweneng East 25,322 19,869 1,169 46,360
Kweneng West 3,971 6,108 55 10,134
Kgatleng 6,489 4,353 1,564 12,405
Central Serowe/ Palapye 13,493 12,080 499 26,072
Central Mahalapye 6,957 5,406 0 12,363
Central Bobonong 5,088 2,735 12 7,834
Central Boteti 5,557 1,628 259 7,445
Central Tutume 3,417 3,978 111 7,506
North East 343 516 41 900
Ngamiland East 2,153 7,919 57 10,129
Ngamiland West 0 0 0 -
Chobe 0 0 0 -
Ghanzi 430 2,589 2,165 5,184
Kgalagadi South 6,240 12,960 3,712 22,912
Kgalagadi North 2,290 891 700 3,881
TOTAL TRADITIONAL 132,919 96,472 13,208 242,600
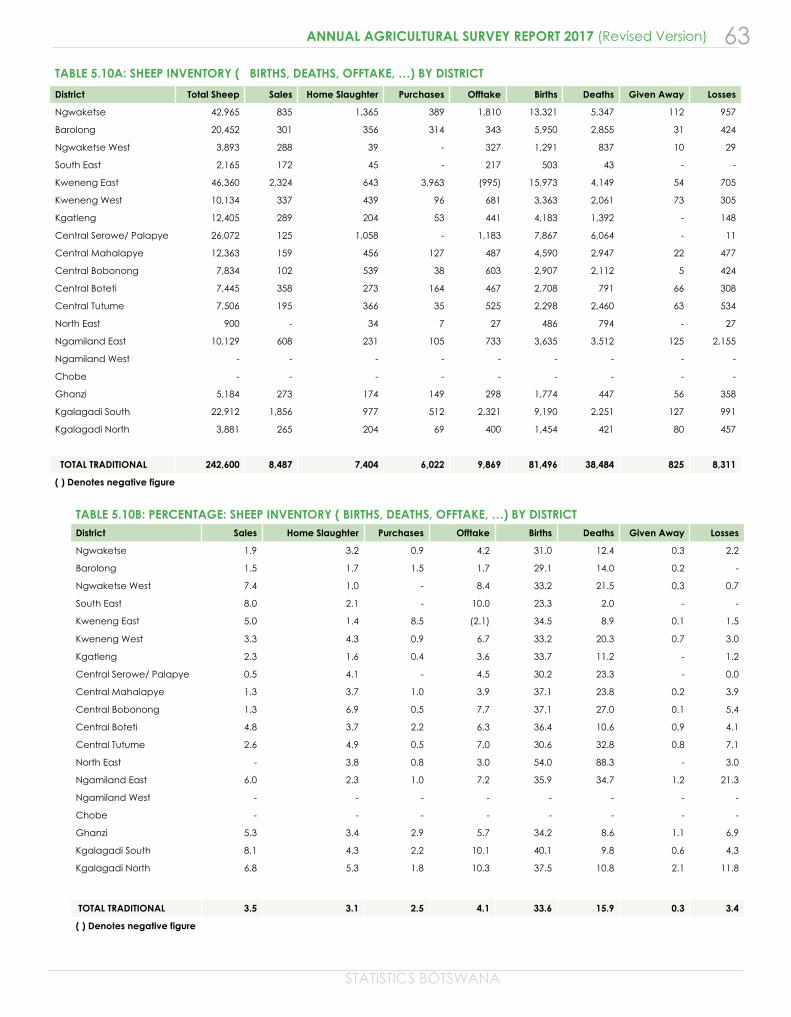
STATISTICS BOTSWANA
63ANNUAL AGRICULTURAL SURVEY REPORT 2017 (Revised Version)
TABLE 5.10A: SHEEP INVENTORY ( BIRTHS, DEATHS, OFFTAKE, …) BY DISTRICT
District Total Sheep Sales Home Slaughter Purchases Offtake Births Deaths Given Away Losses
Ngwaketse 42,965 835 1,365 389 1,810 13,321 5,347 112 957
Barolong 20,452 301 356 314 343 5,950 2,855 31 424
Ngwaketse West 3,893 288 39 - 327 1,291 837 10 29
South East 2,165 172 45 - 217 503 43 - -
Kweneng East 46,360 2,324 643 3,963 (995) 15,973 4,149 54 705
Kweneng West 10,134 337 439 96 681 3,363 2,061 73 305
Kgatleng 12,405 289 204 53 441 4,183 1,392 - 148
Central Serowe/ Palapye 26,072 125 1,058 - 1,183 7,867 6,064 - 11
Central Mahalapye 12,363 159 456 127 487 4,590 2,947 22 477
Central Bobonong 7,834 102 539 38 603 2,907 2,112 5 424
Central Boteti 7,445 358 273 164 467 2,708 791 66 308
Central Tutume 7,506 195 366 35 525 2,298 2,460 63 534
North East 900 - 34 7 27 486 794 - 27
Ngamiland East 10,129 608 231 105 733 3,635 3,512 125 2,155
Ngamiland West - - - - - - - - -
Chobe - - - - - - - - -
Ghanzi 5,184 273 174 149 298 1,774 447 56 358
Kgalagadi South 22,912 1,856 977 512 2,321 9,190 2,251 127 991
Kgalagadi North 3,881 265 204 69 400 1,454 421 80 457
TOTAL TRADITIONAL 242,600 8,487 7,404 6,022 9,869 81,496 38,484 825 8,311
( ) Denotes negative figure
TABLE 5.10B: PERCENTAGE: SHEEP INVENTORY ( BIRTHS, DEATHS, OFFTAKE, …) BY DISTRICTDistrict Sales Home Slaughter Purchases Offtake Births Deaths Given Away Losses
Ngwaketse 1.9 3.2 0.9 4.2 31.0 12.4 0.3 2.2
Barolong 1.5 1.7 1.5 1.7 29.1 14.0 0.2 -
Ngwaketse West 7.4 1.0 - 8.4 33.2 21.5 0.3 0.7
South East 8.0 2.1 - 10.0 23.3 2.0 - -
Kweneng East 5.0 1.4 8.5 (2.1) 34.5 8.9 0.1 1.5
Kweneng West 3.3 4.3 0.9 6.7 33.2 20.3 0.7 3.0
Kgatleng 2.3 1.6 0.4 3.6 33.7 11.2 - 1.2
Central Serowe/ Palapye 0.5 4.1 - 4.5 30.2 23.3 - 0.0
Central Mahalapye 1.3 3.7 1.0 3.9 37.1 23.8 0.2 3.9
Central Bobonong 1.3 6.9 0.5 7.7 37.1 27.0 0.1 5.4
Central Boteti 4.8 3.7 2.2 6.3 36.4 10.6 0.9 4.1
Central Tutume 2.6 4.9 0.5 7.0 30.6 32.8 0.8 7.1
North East - 3.8 0.8 3.0 54.0 88.3 - 3.0
Ngamiland East 6.0 2.3 1.0 7.2 35.9 34.7 1.2 21.3
Ngamiland West - - - - - - - -
Chobe - - - - - - - -
Ghanzi 5.3 3.4 2.9 5.7 34.2 8.6 1.1 6.9
Kgalagadi South 8.1 4.3 2.2 10.1 40.1 9.8 0.6 4.3
Kgalagadi North 6.8 5.3 1.8 10.3 37.5 10.8 2.1 11.8
TOTAL TRADITIONAL 3.5 3.1 2.5 4.1 33.6 15.9 0.3 3.4
( ) Denotes negative figure
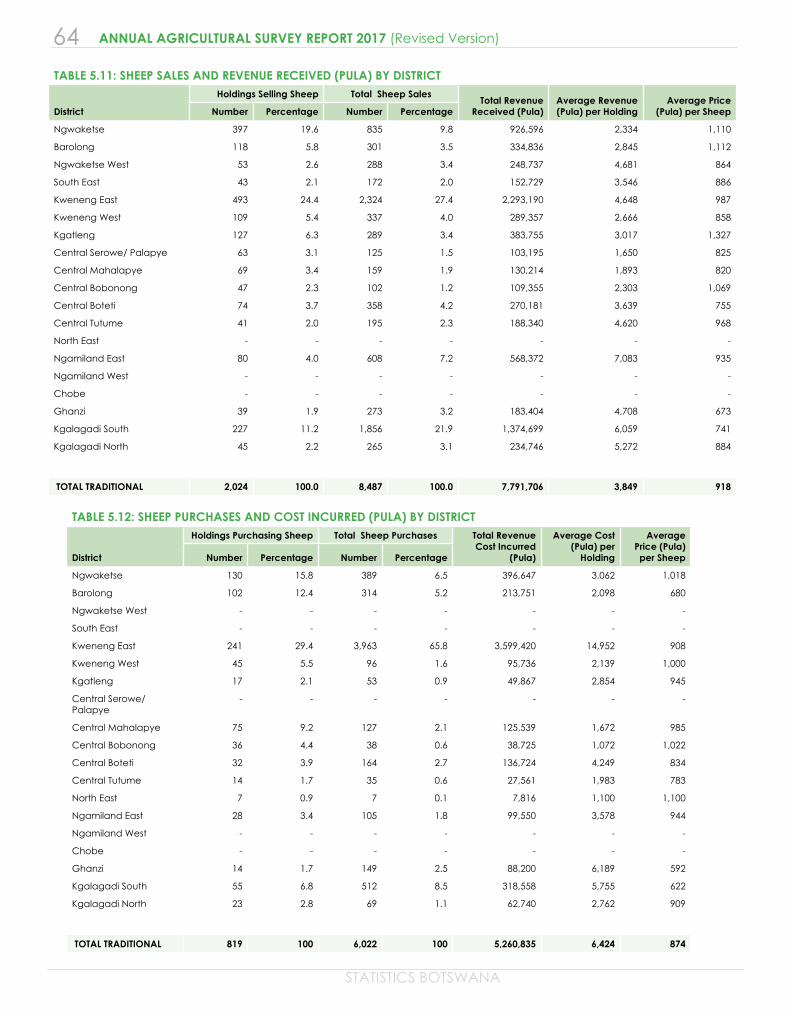
64
STATISTICS BOTSWANA
ANNUAL AGRICULTURAL SURVEY REPORT 2017 (Revised Version)
TABLE 5.11: SHEEP SALES AND REVENUE RECEIVED (PULA) BY DISTRICT
District
Holdings Selling Sheep Total Sheep SalesTotal Revenue
Received (Pula)Average Revenue (Pula) per Holding
Average Price (Pula) per Sheep Number Percentage Number Percentage
Ngwaketse 397 19.6 835 9.8 926,596 2,334 1,110
Barolong 118 5.8 301 3.5 334,836 2,845 1,112
Ngwaketse West 53 2.6 288 3.4 248,737 4,681 864
South East 43 2.1 172 2.0 152,729 3,546 886
Kweneng East 493 24.4 2,324 27.4 2,293,190 4,648 987
Kweneng West 109 5.4 337 4.0 289,357 2,666 858
Kgatleng 127 6.3 289 3.4 383,755 3,017 1,327
Central Serowe/ Palapye 63 3.1 125 1.5 103,195 1,650 825
Central Mahalapye 69 3.4 159 1.9 130,214 1,893 820
Central Bobonong 47 2.3 102 1.2 109,355 2,303 1,069
Central Boteti 74 3.7 358 4.2 270,181 3,639 755
Central Tutume 41 2.0 195 2.3 188,340 4,620 968
North East - - - - - - -
Ngamiland East 80 4.0 608 7.2 568,372 7,083 935
Ngamiland West - - - - - - -
Chobe - - - - - - -
Ghanzi 39 1.9 273 3.2 183,404 4,708 673
Kgalagadi South 227 11.2 1,856 21.9 1,374,699 6,059 741
Kgalagadi North 45 2.2 265 3.1 234,746 5,272 884
TOTAL TRADITIONAL 2,024 100.0 8,487 100.0 7,791,706 3,849 918
TABLE 5.12: SHEEP PURCHASES AND COST INCURRED (PULA) BY DISTRICT
District
Holdings Purchasing Sheep Total Sheep Purchases Total Revenue Cost Incurred
(Pula)
Average Cost (Pula) per
Holding
Average Price (Pula) per Sheep Number Percentage Number Percentage
Ngwaketse 130 15.8 389 6.5 396,647 3,062 1,018
Barolong 102 12.4 314 5.2 213,751 2,098 680
Ngwaketse West - - - - - - -
South East - - - - - - -
Kweneng East 241 29.4 3,963 65.8 3,599,420 14,952 908
Kweneng West 45 5.5 96 1.6 95,736 2,139 1,000
Kgatleng 17 2.1 53 0.9 49,867 2,854 945
Central Serowe/ Palapye
- - - - - - -
Central Mahalapye 75 9.2 127 2.1 125,539 1,672 985
Central Bobonong 36 4.4 38 0.6 38,725 1,072 1,022
Central Boteti 32 3.9 164 2.7 136,724 4,249 834
Central Tutume 14 1.7 35 0.6 27,561 1,983 783
North East 7 0.9 7 0.1 7,816 1,100 1,100
Ngamiland East 28 3.4 105 1.8 99,550 3,578 944
Ngamiland West - - - - - - -
Chobe - - - - - - -
Ghanzi 14 1.7 149 2.5 88,200 6,189 592
Kgalagadi South 55 6.8 512 8.5 318,558 5,755 622
Kgalagadi North 23 2.8 69 1.1 62,740 2,762 909
TOTAL TRADITIONAL 819 100 6,022 100 5,260,835 6,424 874
STATISTICS BOTSWANA
65ANNUAL AGRICULTURAL SURVEY REPORT 2017 (Revised Version)
TRADITIONAL SECTOR: OTHER LIVESTOCK
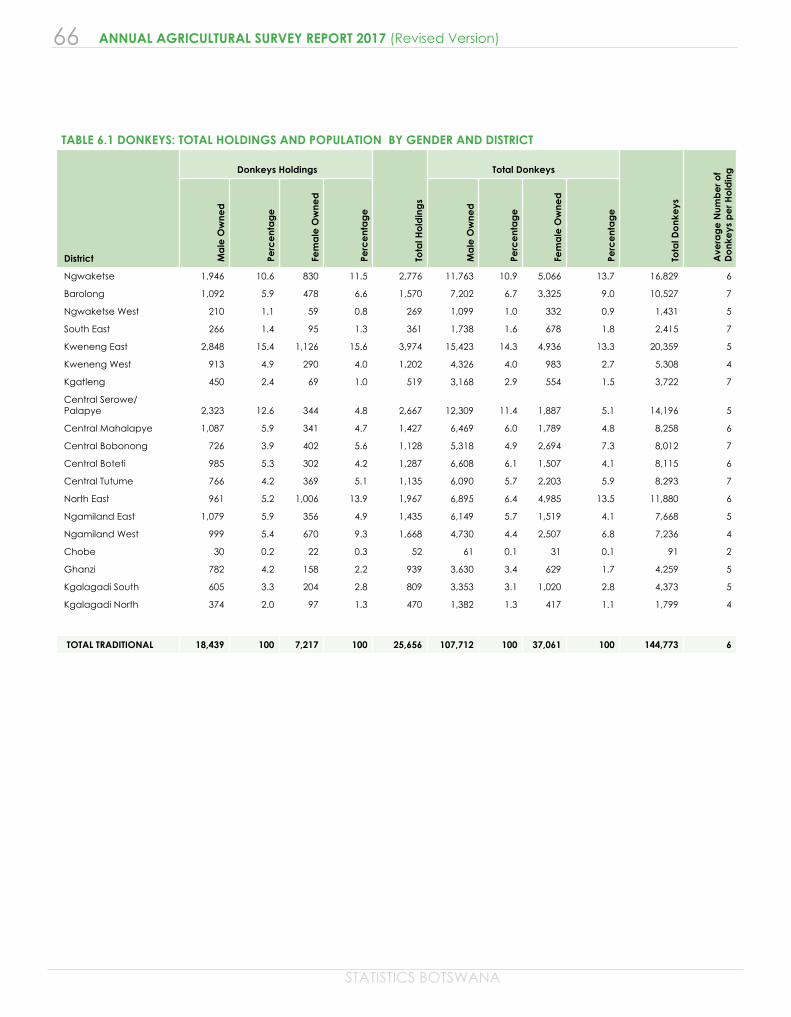
66
STATISTICS BOTSWANA
ANNUAL AGRICULTURAL SURVEY REPORT 2017 (Revised Version)
TABLE 6.1 DONKEYS: TOTAL HOLDINGS AND POPULATION BY GENDER AND DISTRICT
District
Donkeys Holdings
Tota
l Ho
ldin
gs
Total Donkeys
Tota
l Do
nke
ys
Ave
rag
e N
umb
er o
fD
onk
eys
pe
r Ho
ldin
g
Ma
le O
wne
d
Perc
ent
ag
e
Fem
ale
Ow
ned
Perc
ent
ag
e
Ma
le O
wne
d
Perc
ent
ag
e
Fem
ale
Ow
ned
Perc
ent
ag
e
Ngwaketse 1,946 10.6 830 11.5 2,776 11,763 10.9 5,066 13.7 16,829 6
Barolong 1,092 5.9 478 6.6 1,570 7,202 6.7 3,325 9.0 10,527 7
Ngwaketse West 210 1.1 59 0.8 269 1,099 1.0 332 0.9 1,431 5
South East 266 1.4 95 1.3 361 1,738 1.6 678 1.8 2,415 7
Kweneng East 2,848 15.4 1,126 15.6 3,974 15,423 14.3 4,936 13.3 20,359 5
Kweneng West 913 4.9 290 4.0 1,202 4,326 4.0 983 2.7 5,308 4
Kgatleng 450 2.4 69 1.0 519 3,168 2.9 554 1.5 3,722 7
Central Serowe/ Palapye 2,323 12.6 344 4.8 2,667 12,309 11.4 1,887 5.1 14,196 5
Central Mahalapye 1,087 5.9 341 4.7 1,427 6,469 6.0 1,789 4.8 8,258 6
Central Bobonong 726 3.9 402 5.6 1,128 5,318 4.9 2,694 7.3 8,012 7
Central Boteti 985 5.3 302 4.2 1,287 6,608 6.1 1,507 4.1 8,115 6
Central Tutume 766 4.2 369 5.1 1,135 6,090 5.7 2,203 5.9 8,293 7
North East 961 5.2 1,006 13.9 1,967 6,895 6.4 4,985 13.5 11,880 6
Ngamiland East 1,079 5.9 356 4.9 1,435 6,149 5.7 1,519 4.1 7,668 5
Ngamiland West 999 5.4 670 9.3 1,668 4,730 4.4 2,507 6.8 7,236 4
Chobe 30 0.2 22 0.3 52 61 0.1 31 0.1 91 2
Ghanzi 782 4.2 158 2.2 939 3,630 3.4 629 1.7 4,259 5
Kgalagadi South 605 3.3 204 2.8 809 3,353 3.1 1,020 2.8 4,373 5
Kgalagadi North 374 2.0 97 1.3 470 1,382 1.3 417 1.1 1,799 4
TOTAL TRADITIONAL 18,439 100 7,217 100 25,656 107,712 100 37,061 100 144,773 6
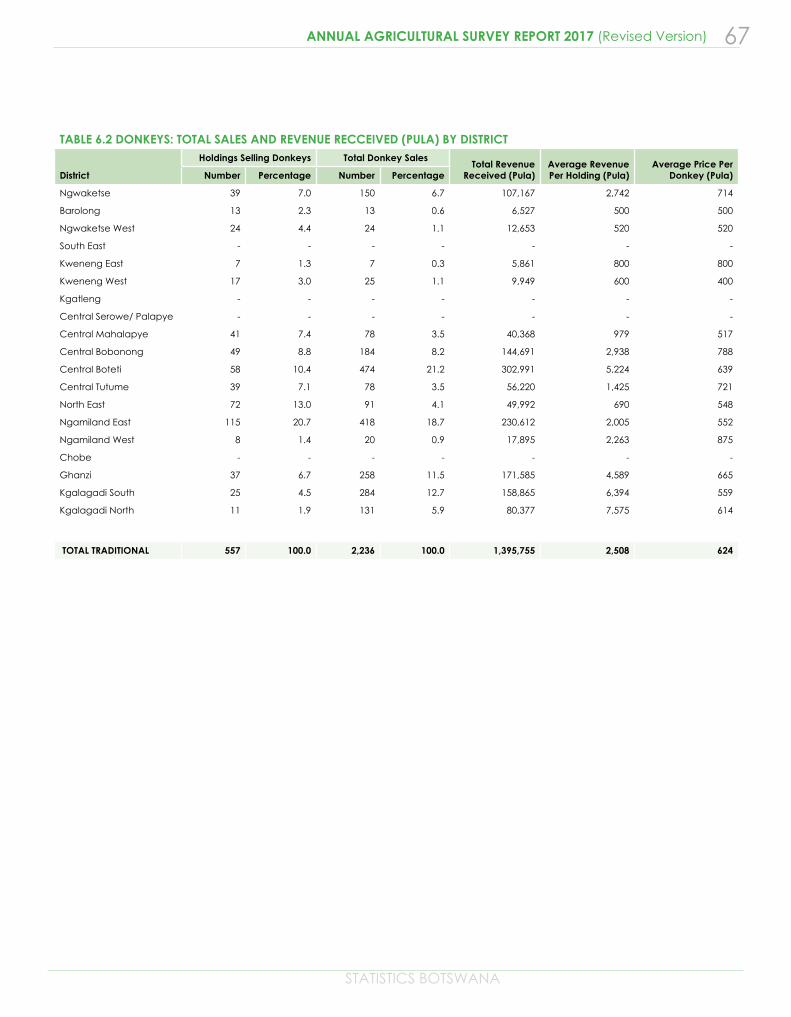
STATISTICS BOTSWANA
67ANNUAL AGRICULTURAL SURVEY REPORT 2017 (Revised Version)
TABLE 6.2 DONKEYS: TOTAL SALES AND REVENUE RECCEIVED (PULA) BY DISTRICT
District
Holdings Selling Donkeys Total Donkey SalesTotal Revenue
Received (Pula)Average RevenuePer Holding (Pula)
Average Price Per Donkey (Pula) Number Percentage Number Percentage
Ngwaketse 39 7.0 150 6.7 107,167 2,742 714
Barolong 13 2.3 13 0.6 6,527 500 500
Ngwaketse West 24 4.4 24 1.1 12,653 520 520
South East - - - - - - -
Kweneng East 7 1.3 7 0.3 5,861 800 800
Kweneng West 17 3.0 25 1.1 9,949 600 400
Kgatleng - - - - - - -
Central Serowe/ Palapye - - - - - - -
Central Mahalapye 41 7.4 78 3.5 40,368 979 517
Central Bobonong 49 8.8 184 8.2 144,691 2,938 788
Central Boteti 58 10.4 474 21.2 302,991 5,224 639
Central Tutume 39 7.1 78 3.5 56,220 1,425 721
North East 72 13.0 91 4.1 49,992 690 548
Ngamiland East 115 20.7 418 18.7 230,612 2,005 552
Ngamiland West 8 1.4 20 0.9 17,895 2,263 875
Chobe - - - - - - -
Ghanzi 37 6.7 258 11.5 171,585 4,589 665
Kgalagadi South 25 4.5 284 12.7 158,865 6,394 559
Kgalagadi North 11 1.9 131 5.9 80,377 7,575 614
TOTAL TRADITIONAL 557 100.0 2,236 100.0 1,395,755 2,508 624
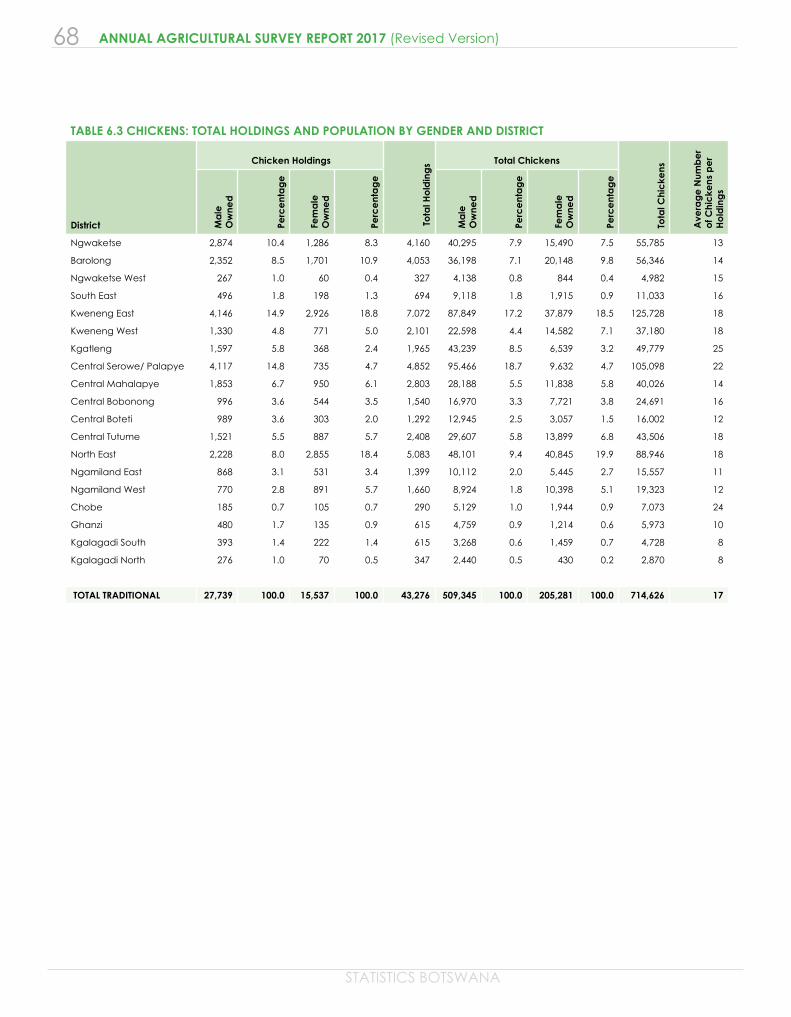
68
STATISTICS BOTSWANA
ANNUAL AGRICULTURAL SURVEY REPORT 2017 (Revised Version)
TABLE 6.3 CHICKENS: TOTAL HOLDINGS AND POPULATION BY GENDER AND DISTRICT
District
Chicken Holdings
To
tal H
old
ing
s Total Chickens
Tota
l Chi
cke
ns
Ave
rag
e N
umb
er
of C
hic
kens
pe
r H
old
ing
s
Ma
le
Ow
ned
Perc
ent
ag
e
Fem
ale
O
wne
d
Perc
ent
ag
e
Ma
le
Ow
ned
Perc
ent
ag
e
Fem
ale
O
wne
d
Perc
ent
ag
e
Ngwaketse 2,874 10.4 1,286 8.3 4,160 40,295 7.9 15,490 7.5 55,785 13
Barolong 2,352 8.5 1,701 10.9 4,053 36,198 7.1 20,148 9.8 56,346 14
Ngwaketse West 267 1.0 60 0.4 327 4,138 0.8 844 0.4 4,982 15
South East 496 1.8 198 1.3 694 9,118 1.8 1,915 0.9 11,033 16
Kweneng East 4,146 14.9 2,926 18.8 7,072 87,849 17.2 37,879 18.5 125,728 18
Kweneng West 1,330 4.8 771 5.0 2,101 22,598 4.4 14,582 7.1 37,180 18
Kgatleng 1,597 5.8 368 2.4 1,965 43,239 8.5 6,539 3.2 49,779 25
Central Serowe/ Palapye 4,117 14.8 735 4.7 4,852 95,466 18.7 9,632 4.7 105,098 22
Central Mahalapye 1,853 6.7 950 6.1 2,803 28,188 5.5 11,838 5.8 40,026 14
Central Bobonong 996 3.6 544 3.5 1,540 16,970 3.3 7,721 3.8 24,691 16
Central Boteti 989 3.6 303 2.0 1,292 12,945 2.5 3,057 1.5 16,002 12
Central Tutume 1,521 5.5 887 5.7 2,408 29,607 5.8 13,899 6.8 43,506 18
North East 2,228 8.0 2,855 18.4 5,083 48,101 9.4 40,845 19.9 88,946 18
Ngamiland East 868 3.1 531 3.4 1,399 10,112 2.0 5,445 2.7 15,557 11
Ngamiland West 770 2.8 891 5.7 1,660 8,924 1.8 10,398 5.1 19,323 12
Chobe 185 0.7 105 0.7 290 5,129 1.0 1,944 0.9 7,073 24
Ghanzi 480 1.7 135 0.9 615 4,759 0.9 1,214 0.6 5,973 10
Kgalagadi South 393 1.4 222 1.4 615 3,268 0.6 1,459 0.7 4,728 8
Kgalagadi North 276 1.0 70 0.5 347 2,440 0.5 430 0.2 2,870 8
TOTAL TRADITIONAL 27,739 100.0 15,537 100.0 43,276 509,345 100.0 205,281 100.0 714,626 17
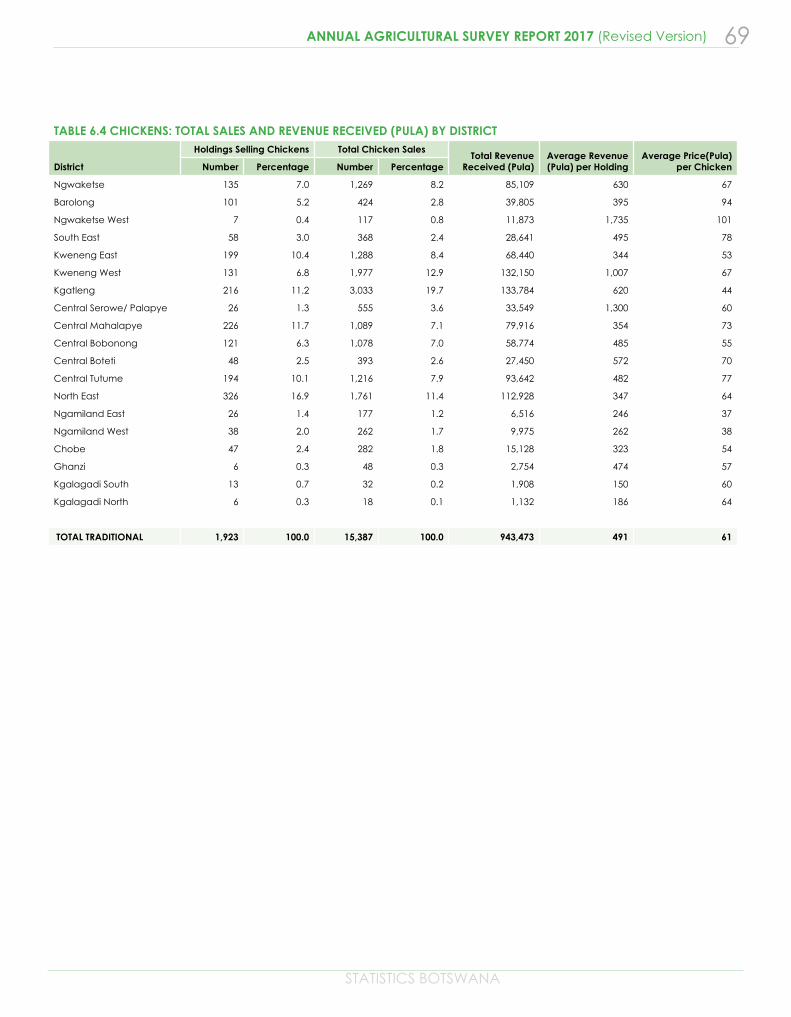
STATISTICS BOTSWANA
69ANNUAL AGRICULTURAL SURVEY REPORT 2017 (Revised Version)
TABLE 6.4 CHICKENS: TOTAL SALES AND REVENUE RECEIVED (PULA) BY DISTRICT
District
Holdings Selling Chickens Total Chicken SalesTotal Revenue
Received (Pula)Average Revenue (Pula) per Holding
Average Price(Pula) per Chicken Number Percentage Number Percentage
Ngwaketse 135 7.0 1,269 8.2 85,109 630 67
Barolong 101 5.2 424 2.8 39,805 395 94
Ngwaketse West 7 0.4 117 0.8 11,873 1,735 101
South East 58 3.0 368 2.4 28,641 495 78
Kweneng East 199 10.4 1,288 8.4 68,440 344 53
Kweneng West 131 6.8 1,977 12.9 132,150 1,007 67
Kgatleng 216 11.2 3,033 19.7 133,784 620 44
Central Serowe/ Palapye 26 1.3 555 3.6 33,549 1,300 60
Central Mahalapye 226 11.7 1,089 7.1 79,916 354 73
Central Bobonong 121 6.3 1,078 7.0 58,774 485 55
Central Boteti 48 2.5 393 2.6 27,450 572 70
Central Tutume 194 10.1 1,216 7.9 93,642 482 77
North East 326 16.9 1,761 11.4 112,928 347 64
Ngamiland East 26 1.4 177 1.2 6,516 246 37
Ngamiland West 38 2.0 262 1.7 9,975 262 38
Chobe 47 2.4 282 1.8 15,128 323 54
Ghanzi 6 0.3 48 0.3 2,754 474 57
Kgalagadi South 13 0.7 32 0.2 1,908 150 60
Kgalagadi North 6 0.3 18 0.1 1,132 186 64
TOTAL TRADITIONAL 1,923 100.0 15,387 100.0 943,473 491 61
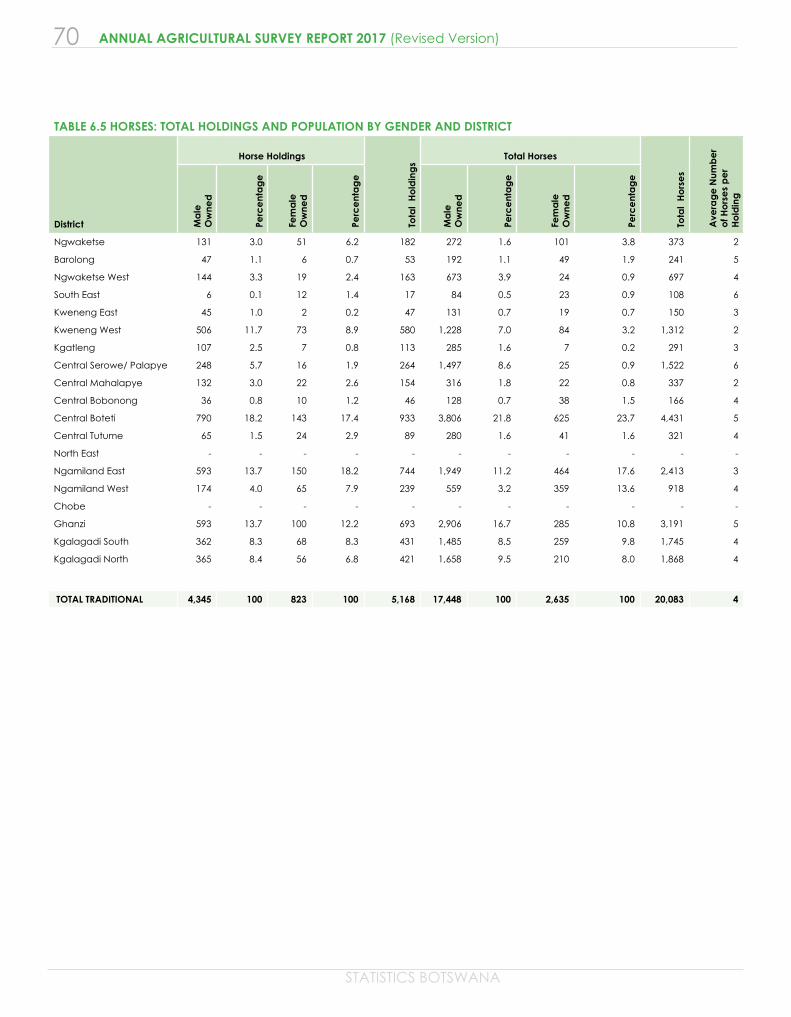
70
STATISTICS BOTSWANA
ANNUAL AGRICULTURAL SURVEY REPORT 2017 (Revised Version)
TABLE 6.5 HORSES: TOTAL HOLDINGS AND POPULATION BY GENDER AND DISTRICT
District
Horse Holdings
Tota
l H
old
ing
s
Total Horses
Tota
l H
ors
es
Ave
rag
e N
umb
er
of H
ors
es
pe
r H
old
ing
Ma
le
Ow
ned
Perc
ent
ag
e
Fem
ale
O
wne
d
Perc
ent
ag
e
Ma
le
Ow
ned
Perc
ent
ag
e
Fem
ale
O
wne
d
Perc
ent
ag
e
Ngwaketse 131 3.0 51 6.2 182 272 1.6 101 3.8 373 2
Barolong 47 1.1 6 0.7 53 192 1.1 49 1.9 241 5
Ngwaketse West 144 3.3 19 2.4 163 673 3.9 24 0.9 697 4
South East 6 0.1 12 1.4 17 84 0.5 23 0.9 108 6
Kweneng East 45 1.0 2 0.2 47 131 0.7 19 0.7 150 3
Kweneng West 506 11.7 73 8.9 580 1,228 7.0 84 3.2 1,312 2
Kgatleng 107 2.5 7 0.8 113 285 1.6 7 0.2 291 3
Central Serowe/ Palapye 248 5.7 16 1.9 264 1,497 8.6 25 0.9 1,522 6
Central Mahalapye 132 3.0 22 2.6 154 316 1.8 22 0.8 337 2
Central Bobonong 36 0.8 10 1.2 46 128 0.7 38 1.5 166 4
Central Boteti 790 18.2 143 17.4 933 3,806 21.8 625 23.7 4,431 5
Central Tutume 65 1.5 24 2.9 89 280 1.6 41 1.6 321 4
North East - - - - - - - - - - -
Ngamiland East 593 13.7 150 18.2 744 1,949 11.2 464 17.6 2,413 3
Ngamiland West 174 4.0 65 7.9 239 559 3.2 359 13.6 918 4
Chobe - - - - - - - - - - -
Ghanzi 593 13.7 100 12.2 693 2,906 16.7 285 10.8 3,191 5
Kgalagadi South 362 8.3 68 8.3 431 1,485 8.5 259 9.8 1,745 4
Kgalagadi North 365 8.4 56 6.8 421 1,658 9.5 210 8.0 1,868 4
TOTAL TRADITIONAL 4,345 100 823 100 5,168 17,448 100 2,635 100 20,083 4
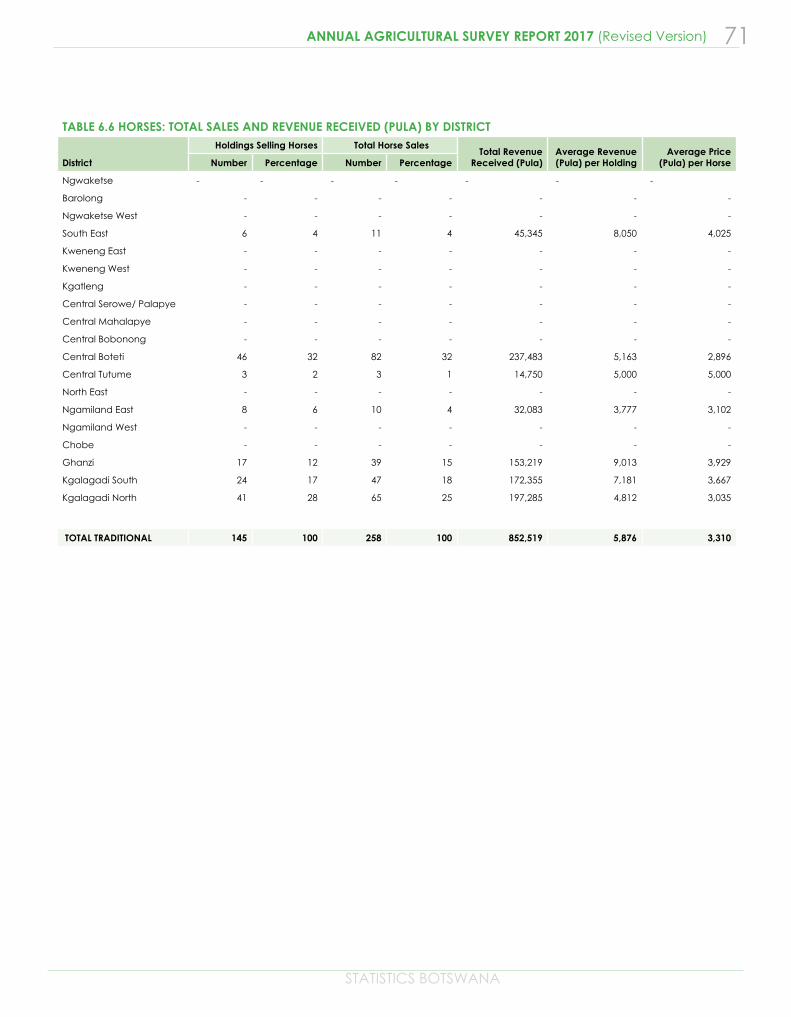
STATISTICS BOTSWANA
71ANNUAL AGRICULTURAL SURVEY REPORT 2017 (Revised Version)
TABLE 6.6 HORSES: TOTAL SALES AND REVENUE RECEIVED (PULA) BY DISTRICT
District
Holdings Selling Horses Total Horse SalesTotal Revenue
Received (Pula)Average Revenue (Pula) per Holding
Average Price (Pula) per Horse Number Percentage Number Percentage
Ngwaketse - - - - - - -
Barolong - - - - - - -
Ngwaketse West - - - - - - -
South East 6 4 11 4 45,345 8,050 4,025
Kweneng East - - - - - - -
Kweneng West - - - - - - -
Kgatleng - - - - - - -
Central Serowe/ Palapye - - - - - - -
Central Mahalapye - - - - - - -
Central Bobonong - - - - - - -
Central Boteti 46 32 82 32 237,483 5,163 2,896
Central Tutume 3 2 3 1 14,750 5,000 5,000
North East - - - - - - -
Ngamiland East 8 6 10 4 32,083 3,777 3,102
Ngamiland West - - - - - - -
Chobe - - - - - - -
Ghanzi 17 12 39 15 153,219 9,013 3,929
Kgalagadi South 24 17 47 18 172,355 7,181 3,667
Kgalagadi North 41 28 65 25 197,285 4,812 3,035
TOTAL TRADITIONAL 145 100 258 100 852,519 5,876 3,310
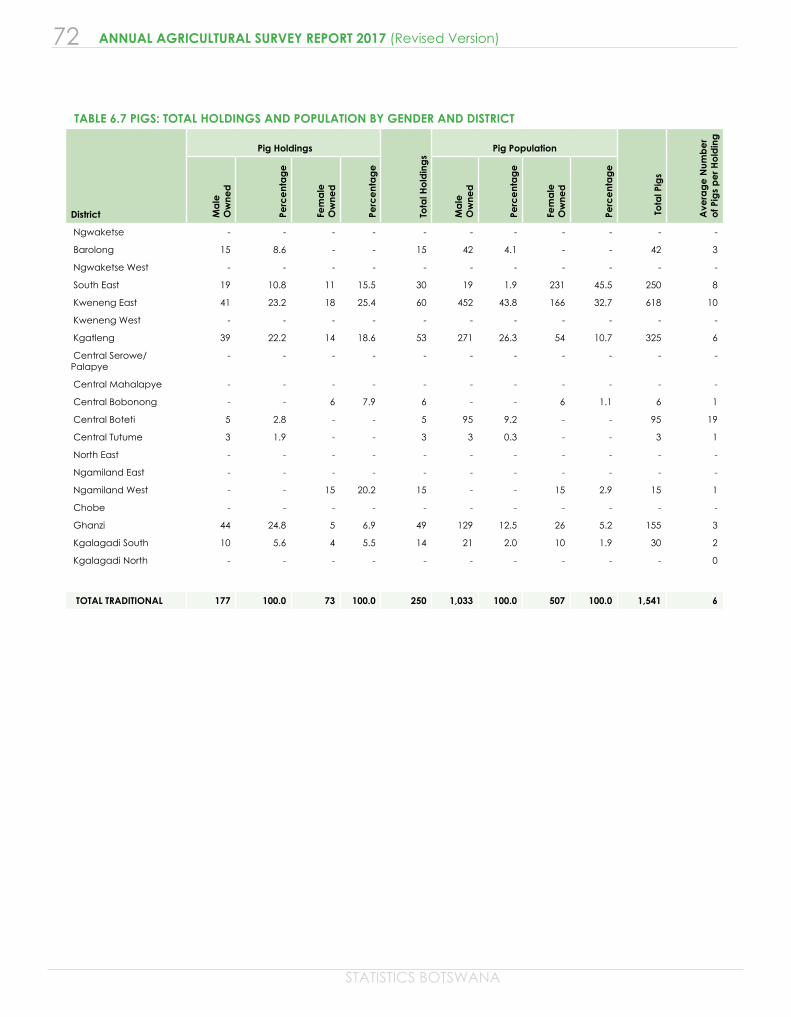
72
STATISTICS BOTSWANA
ANNUAL AGRICULTURAL SURVEY REPORT 2017 (Revised Version)
TABLE 6.7 PIGS: TOTAL HOLDINGS AND POPULATION BY GENDER AND DISTRICT
District
Pig Holdings
Tota
l Ho
ldin
gs
Pig Population
To
tal P
igs
Ave
rag
e N
umb
er
of P
igs
pe
r Ho
ldin
g
Ma
leO
wne
d
Perc
ent
ag
e
Fem
ale
O
wne
d
Perc
ent
ag
e
Ma
le
Ow
ned
Perc
ent
ag
e
Fem
ale
O
wne
d
Perc
ent
ag
e
Ngwaketse - - - - - - - - - - -
Barolong 15 8.6 - - 15 42 4.1 - - 42 3
Ngwaketse West - - - - - - - - - - -
South East 19 10.8 11 15.5 30 19 1.9 231 45.5 250 8
Kweneng East 41 23.2 18 25.4 60 452 43.8 166 32.7 618 10
Kweneng West - - - - - - - - - - -
Kgatleng 39 22.2 14 18.6 53 271 26.3 54 10.7 325 6
Central Serowe/ Palapye
- - - - - - - - - - -
Central Mahalapye - - - - - - - - - - -
Central Bobonong - - 6 7.9 6 - - 6 1.1 6 1
Central Boteti 5 2.8 - - 5 95 9.2 - - 95 19
Central Tutume 3 1.9 - - 3 3 0.3 - - 3 1
North East - - - - - - - - - - -
Ngamiland East - - - - - - - - - - -
Ngamiland West - - 15 20.2 15 - - 15 2.9 15 1
Chobe - - - - - - - - - - -
Ghanzi 44 24.8 5 6.9 49 129 12.5 26 5.2 155 3
Kgalagadi South 10 5.6 4 5.5 14 21 2.0 10 1.9 30 2
Kgalagadi North - - - - - - - - - - 0
TOTAL TRADITIONAL 177 100.0 73 100.0 250 1,033 100.0 507 100.0 1,541 6
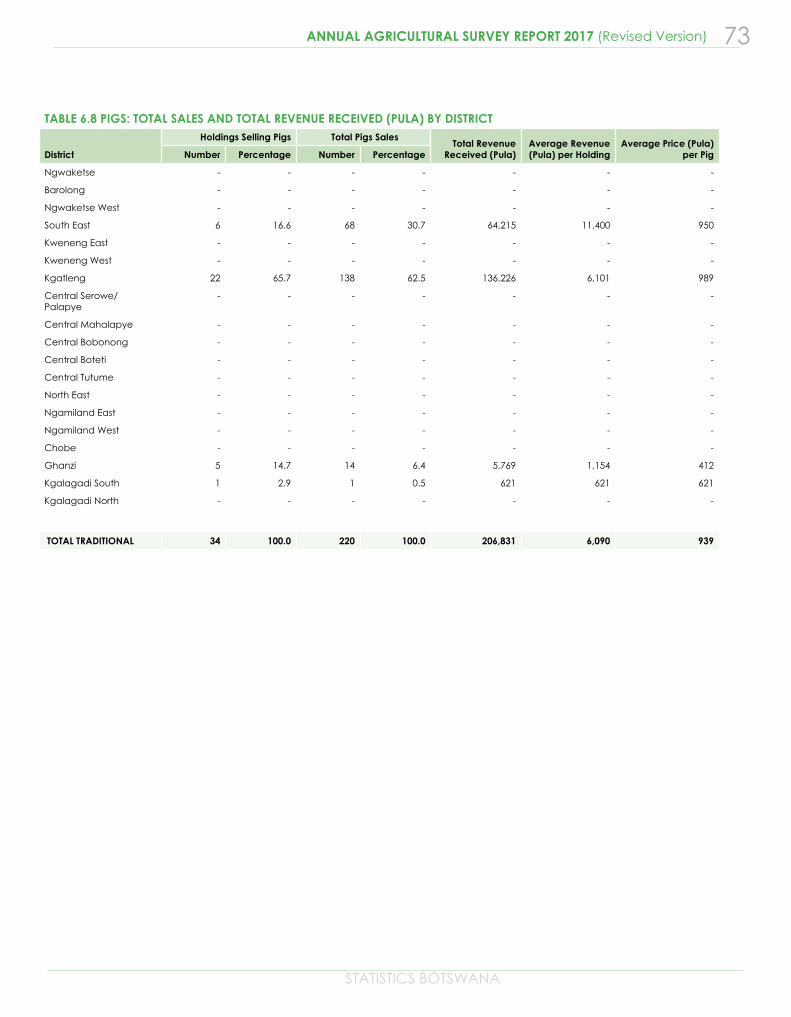
STATISTICS BOTSWANA
73ANNUAL AGRICULTURAL SURVEY REPORT 2017 (Revised Version)
TABLE 6.8 PIGS: TOTAL SALES AND TOTAL REVENUE RECEIVED (PULA) BY DISTRICT
District
Holdings Selling Pigs Total Pigs SalesTotal Revenue
Received (Pula)Average Revenue (Pula) per Holding
Average Price (Pula) per Pig Number Percentage Number Percentage
Ngwaketse - - - - - - -
Barolong - - - - - - -
Ngwaketse West - - - - - - -
South East 6 16.6 68 30.7 64,215 11,400 950
Kweneng East - - - - - - -
Kweneng West - - - - - - -
Kgatleng 22 65.7 138 62.5 136,226 6,101 989
Central Serowe/ Palapye
- - - - - - -
Central Mahalapye - - - - - - -
Central Bobonong - - - - - - -
Central Boteti - - - - - - -
Central Tutume - - - - - - -
North East - - - - - - -
Ngamiland East - - - - - - -
Ngamiland West - - - - - - -
Chobe - - - - - - -
Ghanzi 5 14.7 14 6.4 5,769 1,154 412
Kgalagadi South 1 2.9 1 0.5 621 621 621
Kgalagadi North - - - - - - -
TOTAL TRADITIONAL 34 100.0 220 100.0 206,831 6,090 939
74
STATISTICS BOTSWANA
ANNUAL AGRICULTURAL SURVEY REPORT 2017 (Revised Version)
TRADITIONAL SECTOR: CROP PRODUCTION
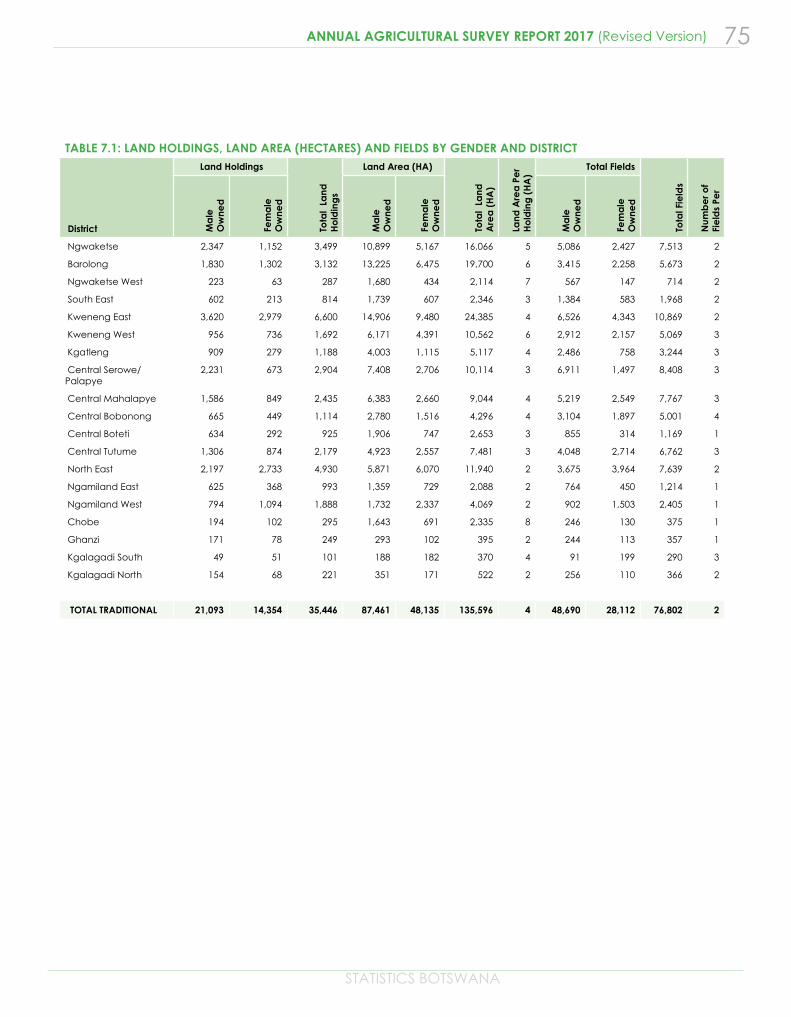
STATISTICS BOTSWANA
75ANNUAL AGRICULTURAL SURVEY REPORT 2017 (Revised Version)
TABLE 7.1: LAND HOLDINGS, LAND AREA (HECTARES) AND FIELDS BY GENDER AND DISTRICT
District
Land Holdings
Tota
l La
nd
Ho
ldin
gs
Land Area (HA)
Tota
l La
nd
Are
a (
HA
)
Land
Are
a P
er
Ho
ldin
g (
HA
)
Total Fields
Tota
l Fie
lds
Num
be
r of
Fie
lds
Per
Ma
le
Ow
ned
Fem
ale
O
wne
d
Ma
le
Ow
ned
Fem
ale
O
wne
d
Ma
le
Ow
ned
Fem
ale
O
wne
d
Ngwaketse 2,347 1,152 3,499 10,899 5,167 16,066 5 5,086 2,427 7,513 2
Barolong 1,830 1,302 3,132 13,225 6,475 19,700 6 3,415 2,258 5,673 2
Ngwaketse West 223 63 287 1,680 434 2,114 7 567 147 714 2
South East 602 213 814 1,739 607 2,346 3 1,384 583 1,968 2
Kweneng East 3,620 2,979 6,600 14,906 9,480 24,385 4 6,526 4,343 10,869 2
Kweneng West 956 736 1,692 6,171 4,391 10,562 6 2,912 2,157 5,069 3
Kgatleng 909 279 1,188 4,003 1,115 5,117 4 2,486 758 3,244 3
Central Serowe/ Palapye
2,231 673 2,904 7,408 2,706 10,114 3 6,911 1,497 8,408 3
Central Mahalapye 1,586 849 2,435 6,383 2,660 9,044 4 5,219 2,549 7,767 3
Central Bobonong 665 449 1,114 2,780 1,516 4,296 4 3,104 1,897 5,001 4
Central Boteti 634 292 925 1,906 747 2,653 3 855 314 1,169 1
Central Tutume 1,306 874 2,179 4,923 2,557 7,481 3 4,048 2,714 6,762 3
North East 2,197 2,733 4,930 5,871 6,070 11,940 2 3,675 3,964 7,639 2
Ngamiland East 625 368 993 1,359 729 2,088 2 764 450 1,214 1
Ngamiland West 794 1,094 1,888 1,732 2,337 4,069 2 902 1,503 2,405 1
Chobe 194 102 295 1,643 691 2,335 8 246 130 375 1
Ghanzi 171 78 249 293 102 395 2 244 113 357 1
Kgalagadi South 49 51 101 188 182 370 4 91 199 290 3
Kgalagadi North 154 68 221 351 171 522 2 256 110 366 2
TOTAL TRADITIONAL 21,093 14,354 35,446 87,461 48,135 135,596 4 48,690 28,112 76,802 2
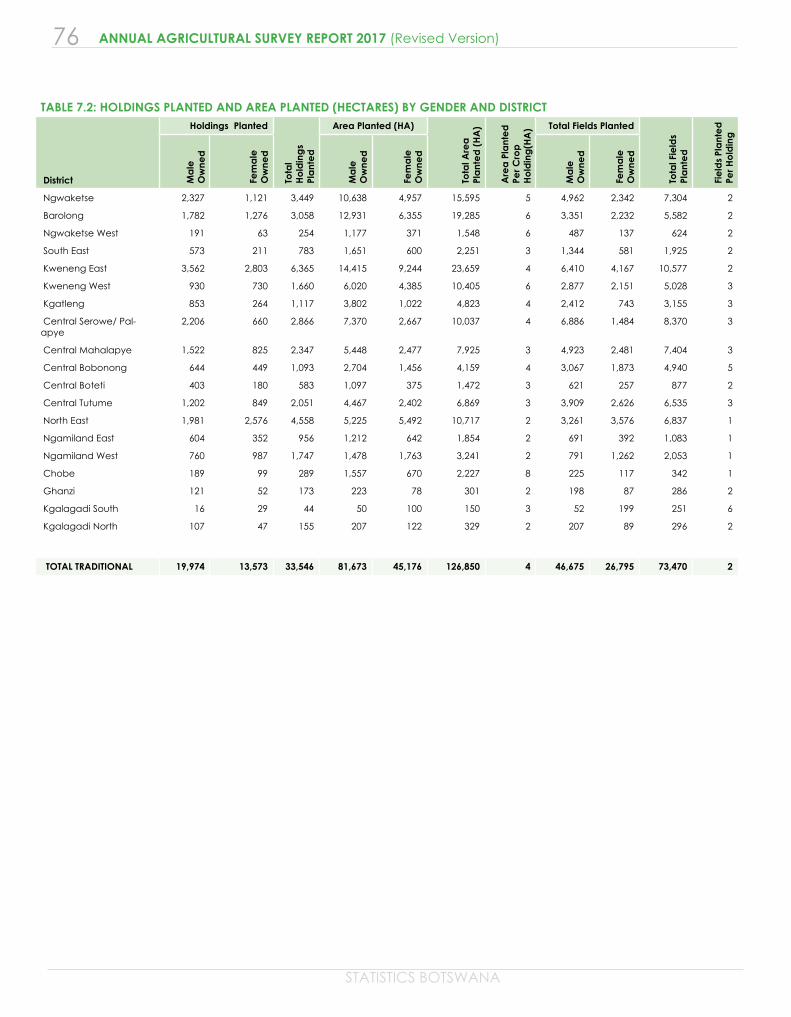
76
STATISTICS BOTSWANA
ANNUAL AGRICULTURAL SURVEY REPORT 2017 (Revised Version)
TABLE 7.2: HOLDINGS PLANTED AND AREA PLANTED (HECTARES) BY GENDER AND DISTRICT
District
Holdings Planted
Tota
l H
old
ing
s Pl
ant
ed
Area Planted (HA)
Tota
l Are
a
Pla
nte
d (
HA
)
Are
a P
lant
ed
Pe
r Cro
p
Ho
ldin
g(H
A) Total Fields Planted
Tota
l Fie
lds
Pl
ant
ed
Fie
lds
Pla
nte
d
Per H
old
ing
Ma
le
Ow
ned
Fem
ale
O
wne
d
Ma
le
Ow
ned
Fem
ale
O
wne
d
Ma
le
Ow
ned
Fem
ale
O
wne
d
Ngwaketse 2,327 1,121 3,449 10,638 4,957 15,595 5 4,962 2,342 7,304 2
Barolong 1,782 1,276 3,058 12,931 6,355 19,285 6 3,351 2,232 5,582 2
Ngwaketse West 191 63 254 1,177 371 1,548 6 487 137 624 2
South East 573 211 783 1,651 600 2,251 3 1,344 581 1,925 2
Kweneng East 3,562 2,803 6,365 14,415 9,244 23,659 4 6,410 4,167 10,577 2
Kweneng West 930 730 1,660 6,020 4,385 10,405 6 2,877 2,151 5,028 3
Kgatleng 853 264 1,117 3,802 1,022 4,823 4 2,412 743 3,155 3
Central Serowe/ Pal-apye
2,206 660 2,866 7,370 2,667 10,037 4 6,886 1,484 8,370 3
Central Mahalapye 1,522 825 2,347 5,448 2,477 7,925 3 4,923 2,481 7,404 3
Central Bobonong 644 449 1,093 2,704 1,456 4,159 4 3,067 1,873 4,940 5
Central Boteti 403 180 583 1,097 375 1,472 3 621 257 877 2
Central Tutume 1,202 849 2,051 4,467 2,402 6,869 3 3,909 2,626 6,535 3
North East 1,981 2,576 4,558 5,225 5,492 10,717 2 3,261 3,576 6,837 1
Ngamiland East 604 352 956 1,212 642 1,854 2 691 392 1,083 1
Ngamiland West 760 987 1,747 1,478 1,763 3,241 2 791 1,262 2,053 1
Chobe 189 99 289 1,557 670 2,227 8 225 117 342 1
Ghanzi 121 52 173 223 78 301 2 198 87 286 2
Kgalagadi South 16 29 44 50 100 150 3 52 199 251 6
Kgalagadi North 107 47 155 207 122 329 2 207 89 296 2
TOTAL TRADITIONAL 19,974 13,573 33,546 81,673 45,176 126,850 4 46,675 26,795 73,470 2
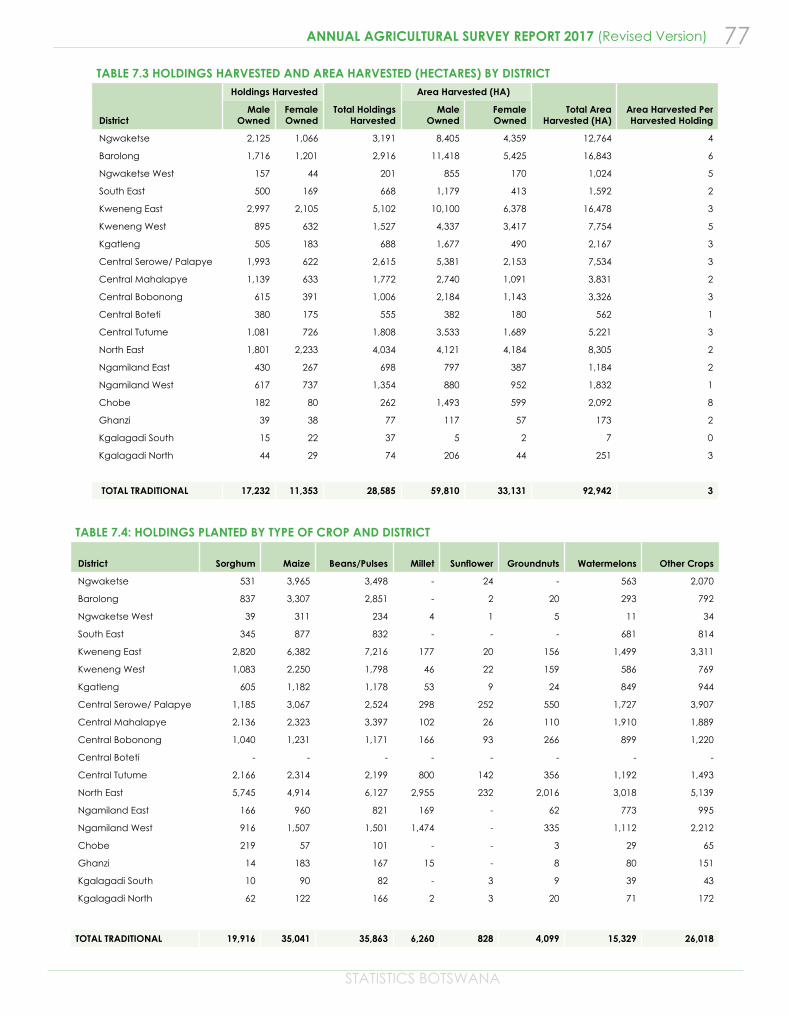
STATISTICS BOTSWANA
77ANNUAL AGRICULTURAL SURVEY REPORT 2017 (Revised Version)
TABLE 7.3 HOLDINGS HARVESTED AND AREA HARVESTED (HECTARES) BY DISTRICT
District
Holdings Harvested
Total Holdings Harvested
Area Harvested (HA)
Total Area Harvested (HA)
Area Harvested Per Harvested Holding
Male Owned
Female Owned
Male Owned
Female Owned
Ngwaketse 2,125 1,066 3,191 8,405 4,359 12,764 4
Barolong 1,716 1,201 2,916 11,418 5,425 16,843 6
Ngwaketse West 157 44 201 855 170 1,024 5
South East 500 169 668 1,179 413 1,592 2
Kweneng East 2,997 2,105 5,102 10,100 6,378 16,478 3
Kweneng West 895 632 1,527 4,337 3,417 7,754 5
Kgatleng 505 183 688 1,677 490 2,167 3
Central Serowe/ Palapye 1,993 622 2,615 5,381 2,153 7,534 3
Central Mahalapye 1,139 633 1,772 2,740 1,091 3,831 2
Central Bobonong 615 391 1,006 2,184 1,143 3,326 3
Central Boteti 380 175 555 382 180 562 1
Central Tutume 1,081 726 1,808 3,533 1,689 5,221 3
North East 1,801 2,233 4,034 4,121 4,184 8,305 2
Ngamiland East 430 267 698 797 387 1,184 2
Ngamiland West 617 737 1,354 880 952 1,832 1
Chobe 182 80 262 1,493 599 2,092 8
Ghanzi 39 38 77 117 57 173 2
Kgalagadi South 15 22 37 5 2 7 0
Kgalagadi North 44 29 74 206 44 251 3
TOTAL TRADITIONAL 17,232 11,353 28,585 59,810 33,131 92,942 3
TABLE 7.4: HOLDINGS PLANTED BY TYPE OF CROP AND DISTRICT
District Sorghum Maize Beans/Pulses Millet Sunflower Groundnuts Watermelons Other Crops
Ngwaketse 531 3,965 3,498 - 24 - 563 2,070
Barolong 837 3,307 2,851 - 2 20 293 792
Ngwaketse West 39 311 234 4 1 5 11 34
South East 345 877 832 - - - 681 814
Kweneng East 2,820 6,382 7,216 177 20 156 1,499 3,311
Kweneng West 1,083 2,250 1,798 46 22 159 586 769
Kgatleng 605 1,182 1,178 53 9 24 849 944
Central Serowe/ Palapye 1,185 3,067 2,524 298 252 550 1,727 3,907
Central Mahalapye 2,136 2,323 3,397 102 26 110 1,910 1,889
Central Bobonong 1,040 1,231 1,171 166 93 266 899 1,220
Central Boteti - - - - - - - -
Central Tutume 2,166 2,314 2,199 800 142 356 1,192 1,493
North East 5,745 4,914 6,127 2,955 232 2,016 3,018 5,139
Ngamiland East 166 960 821 169 - 62 773 995
Ngamiland West 916 1,507 1,501 1,474 - 335 1,112 2,212
Chobe 219 57 101 - - 3 29 65
Ghanzi 14 183 167 15 - 8 80 151
Kgalagadi South 10 90 82 - 3 9 39 43
Kgalagadi North 62 122 166 2 3 20 71 172
TOTAL TRADITIONAL 19,916 35,041 35,863 6,260 828 4,099 15,329 26,018
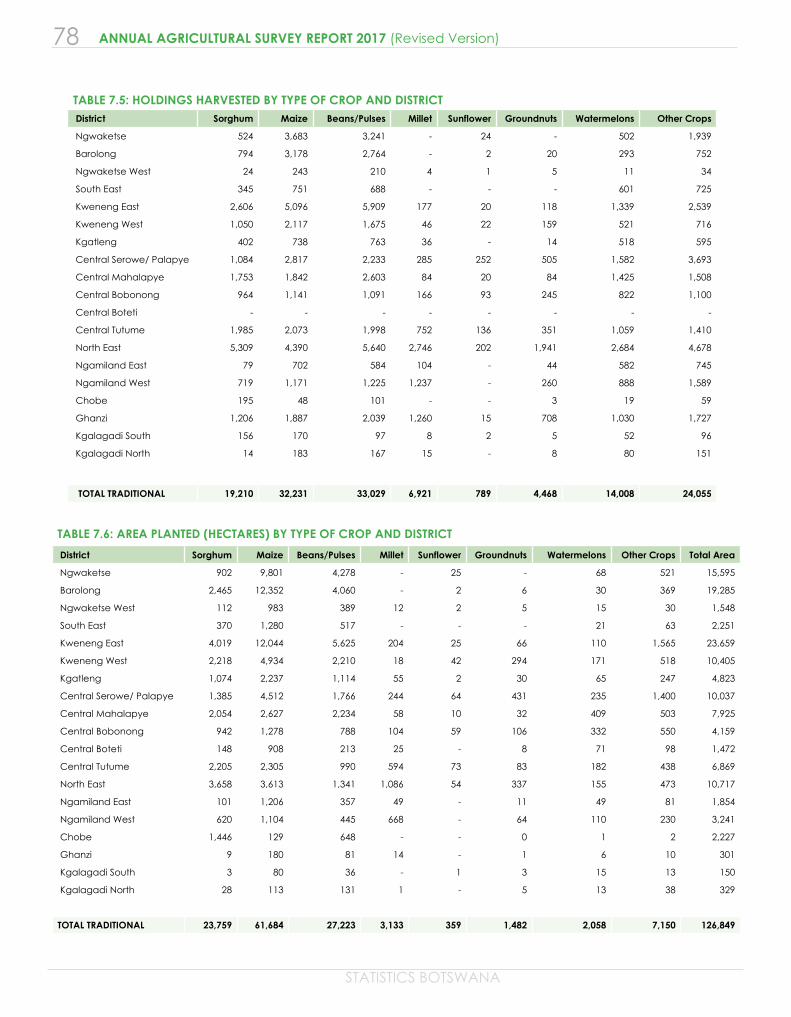
78
STATISTICS BOTSWANA
ANNUAL AGRICULTURAL SURVEY REPORT 2017 (Revised Version)
TABLE 7.5: HOLDINGS HARVESTED BY TYPE OF CROP AND DISTRICT District Sorghum Maize Beans/Pulses Millet Sunflower Groundnuts Watermelons Other Crops
Ngwaketse 524 3,683 3,241 - 24 - 502 1,939
Barolong 794 3,178 2,764 - 2 20 293 752
Ngwaketse West 24 243 210 4 1 5 11 34
South East 345 751 688 - - - 601 725
Kweneng East 2,606 5,096 5,909 177 20 118 1,339 2,539
Kweneng West 1,050 2,117 1,675 46 22 159 521 716
Kgatleng 402 738 763 36 - 14 518 595
Central Serowe/ Palapye 1,084 2,817 2,233 285 252 505 1,582 3,693
Central Mahalapye 1,753 1,842 2,603 84 20 84 1,425 1,508
Central Bobonong 964 1,141 1,091 166 93 245 822 1,100
Central Boteti - - - - - - - -
Central Tutume 1,985 2,073 1,998 752 136 351 1,059 1,410
North East 5,309 4,390 5,640 2,746 202 1,941 2,684 4,678
Ngamiland East 79 702 584 104 - 44 582 745
Ngamiland West 719 1,171 1,225 1,237 - 260 888 1,589
Chobe 195 48 101 - - 3 19 59
Ghanzi 1,206 1,887 2,039 1,260 15 708 1,030 1,727
Kgalagadi South 156 170 97 8 2 5 52 96
Kgalagadi North 14 183 167 15 - 8 80 151
TOTAL TRADITIONAL 19,210 32,231 33,029 6,921 789 4,468 14,008 24,055
TABLE 7.6: AREA PLANTED (HECTARES) BY TYPE OF CROP AND DISTRICT
District Sorghum Maize Beans/Pulses Millet Sunflower Groundnuts Watermelons Other Crops Total Area
Ngwaketse 902 9,801 4,278 - 25 - 68 521 15,595
Barolong 2,465 12,352 4,060 - 2 6 30 369 19,285
Ngwaketse West 112 983 389 12 2 5 15 30 1,548
South East 370 1,280 517 - - - 21 63 2,251
Kweneng East 4,019 12,044 5,625 204 25 66 110 1,565 23,659
Kweneng West 2,218 4,934 2,210 18 42 294 171 518 10,405
Kgatleng 1,074 2,237 1,114 55 2 30 65 247 4,823
Central Serowe/ Palapye 1,385 4,512 1,766 244 64 431 235 1,400 10,037
Central Mahalapye 2,054 2,627 2,234 58 10 32 409 503 7,925
Central Bobonong 942 1,278 788 104 59 106 332 550 4,159
Central Boteti 148 908 213 25 - 8 71 98 1,472
Central Tutume 2,205 2,305 990 594 73 83 182 438 6,869
North East 3,658 3,613 1,341 1,086 54 337 155 473 10,717
Ngamiland East 101 1,206 357 49 - 11 49 81 1,854
Ngamiland West 620 1,104 445 668 - 64 110 230 3,241
Chobe 1,446 129 648 - - 0 1 2 2,227
Ghanzi 9 180 81 14 - 1 6 10 301
Kgalagadi South 3 80 36 - 1 3 15 13 150
Kgalagadi North 28 113 131 1 - 5 13 38 329
TOTAL TRADITIONAL 23,759 61,684 27,223 3,133 359 1,482 2,058 7,150 126,849
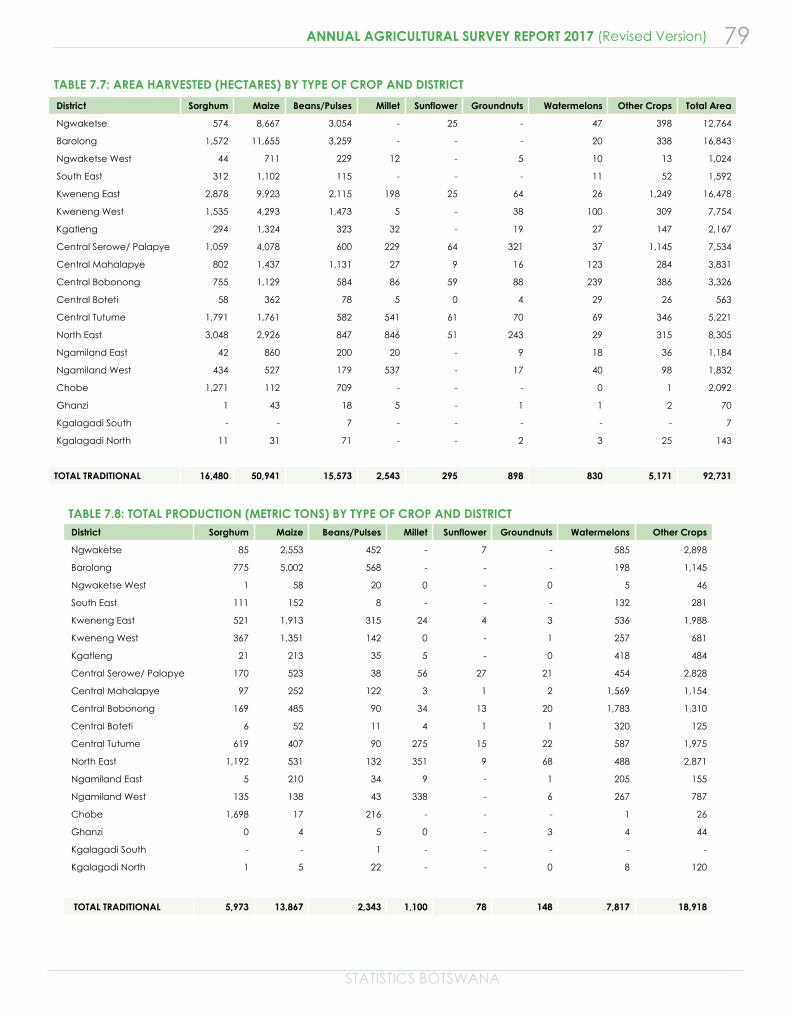
STATISTICS BOTSWANA
79ANNUAL AGRICULTURAL SURVEY REPORT 2017 (Revised Version)
TABLE 7.7: AREA HARVESTED (HECTARES) BY TYPE OF CROP AND DISTRICT
District Sorghum Maize Beans/Pulses Millet Sunflower Groundnuts Watermelons Other Crops Total Area
Ngwaketse 574 8,667 3,054 - 25 - 47 398 12,764
Barolong 1,572 11,655 3,259 - - - 20 338 16,843
Ngwaketse West 44 711 229 12 - 5 10 13 1,024
South East 312 1,102 115 - - - 11 52 1,592
Kweneng East 2,878 9,923 2,115 198 25 64 26 1,249 16,478
Kweneng West 1,535 4,293 1,473 5 - 38 100 309 7,754
Kgatleng 294 1,324 323 32 - 19 27 147 2,167
Central Serowe/ Palapye 1,059 4,078 600 229 64 321 37 1,145 7,534
Central Mahalapye 802 1,437 1,131 27 9 16 123 284 3,831
Central Bobonong 755 1,129 584 86 59 88 239 386 3,326
Central Boteti 58 362 78 5 0 4 29 26 563
Central Tutume 1,791 1,761 582 541 61 70 69 346 5,221
North East 3,048 2,926 847 846 51 243 29 315 8,305
Ngamiland East 42 860 200 20 - 9 18 36 1,184
Ngamiland West 434 527 179 537 - 17 40 98 1,832
Chobe 1,271 112 709 - - - 0 1 2,092
Ghanzi 1 43 18 5 - 1 1 2 70
Kgalagadi South - - 7 - - - - - 7
Kgalagadi North 11 31 71 - - 2 3 25 143
TOTAL TRADITIONAL 16,480 50,941 15,573 2,543 295 898 830 5,171 92,731
TABLE 7.8: TOTAL PRODUCTION (METRIC TONS) BY TYPE OF CROP AND DISTRICT District Sorghum Maize Beans/Pulses Millet Sunflower Groundnuts Watermelons Other Crops
Ngwaketse 85 2,553 452 - 7 - 585 2,898
Barolong 775 5,002 568 - - - 198 1,145
Ngwaketse West 1 58 20 0 - 0 5 46
South East 111 152 8 - - - 132 281
Kweneng East 521 1,913 315 24 4 3 536 1,988
Kweneng West 367 1,351 142 0 - 1 257 681
Kgatleng 21 213 35 5 - 0 418 484
Central Serowe/ Palapye 170 523 38 56 27 21 454 2,828
Central Mahalapye 97 252 122 3 1 2 1,569 1,154
Central Bobonong 169 485 90 34 13 20 1,783 1,310
Central Boteti 6 52 11 4 1 1 320 125
Central Tutume 619 407 90 275 15 22 587 1,975
North East 1,192 531 132 351 9 68 488 2,871
Ngamiland East 5 210 34 9 - 1 205 155
Ngamiland West 135 138 43 338 - 6 267 787
Chobe 1,698 17 216 - - - 1 26
Ghanzi 0 4 5 0 - 3 4 44
Kgalagadi South - - 1 - - - - -
Kgalagadi North 1 5 22 - - 0 8 120
TOTAL TRADITIONAL 5,973 13,867 2,343 1,100 78 148 7,817 18,918
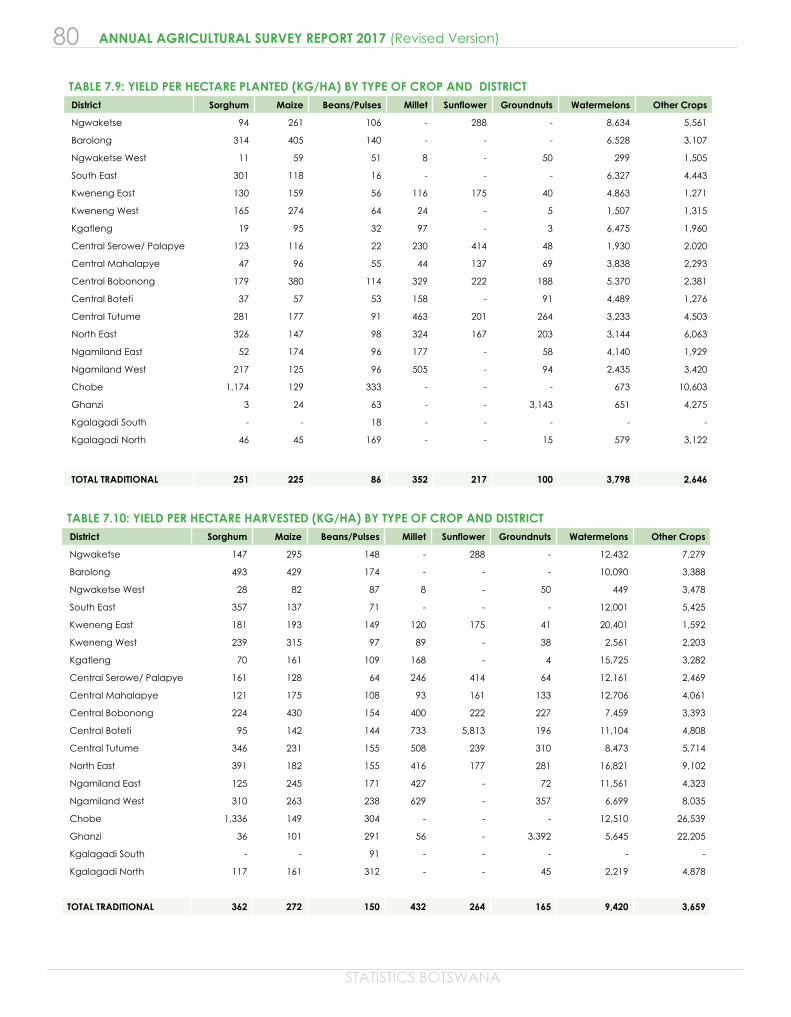
80
STATISTICS BOTSWANA
ANNUAL AGRICULTURAL SURVEY REPORT 2017 (Revised Version)
TABLE 7.9: YIELD PER HECTARE PLANTED (KG/HA) BY TYPE OF CROP AND DISTRICT District Sorghum Maize Beans/Pulses Millet Sunflower Groundnuts Watermelons Other Crops
Ngwaketse 94 261 106 - 288 - 8,634 5,561
Barolong 314 405 140 - - - 6,528 3,107
Ngwaketse West 11 59 51 8 - 50 299 1,505
South East 301 118 16 - - - 6,327 4,443
Kweneng East 130 159 56 116 175 40 4,863 1,271
Kweneng West 165 274 64 24 - 5 1,507 1,315
Kgatleng 19 95 32 97 - 3 6,475 1,960
Central Serowe/ Palapye 123 116 22 230 414 48 1,930 2,020
Central Mahalapye 47 96 55 44 137 69 3,838 2,293
Central Bobonong 179 380 114 329 222 188 5,370 2,381
Central Boteti 37 57 53 158 - 91 4,489 1,276
Central Tutume 281 177 91 463 201 264 3,233 4,503
North East 326 147 98 324 167 203 3,144 6,063
Ngamiland East 52 174 96 177 - 58 4,140 1,929
Ngamiland West 217 125 96 505 - 94 2,435 3,420
Chobe 1,174 129 333 - - - 673 10,603
Ghanzi 3 24 63 - - 3,143 651 4,275
Kgalagadi South - - 18 - - - - -
Kgalagadi North 46 45 169 - - 15 579 3,122
TOTAL TRADITIONAL 251 225 86 352 217 100 3,798 2,646
TABLE 7.10: YIELD PER HECTARE HARVESTED (KG/HA) BY TYPE OF CROP AND DISTRICT District Sorghum Maize Beans/Pulses Millet Sunflower Groundnuts Watermelons Other Crops
Ngwaketse 147 295 148 - 288 - 12,432 7,279
Barolong 493 429 174 - - - 10,090 3,388
Ngwaketse West 28 82 87 8 - 50 449 3,478
South East 357 137 71 - - - 12,001 5,425
Kweneng East 181 193 149 120 175 41 20,401 1,592
Kweneng West 239 315 97 89 - 38 2,561 2,203
Kgatleng 70 161 109 168 - 4 15,725 3,282
Central Serowe/ Palapye 161 128 64 246 414 64 12,161 2,469
Central Mahalapye 121 175 108 93 161 133 12,706 4,061
Central Bobonong 224 430 154 400 222 227 7,459 3,393
Central Boteti 95 142 144 733 5,813 196 11,104 4,808
Central Tutume 346 231 155 508 239 310 8,473 5,714
North East 391 182 155 416 177 281 16,821 9,102
Ngamiland East 125 245 171 427 - 72 11,561 4,323
Ngamiland West 310 263 238 629 - 357 6,699 8,035
Chobe 1,336 149 304 - - - 12,510 26,539
Ghanzi 36 101 291 56 - 3,392 5,645 22,205
Kgalagadi South - - 91 - - - - -
Kgalagadi North 117 161 312 - - 45 2,219 4,878
TOTAL TRADITIONAL 362 272 150 432 264 165 9,420 3,659
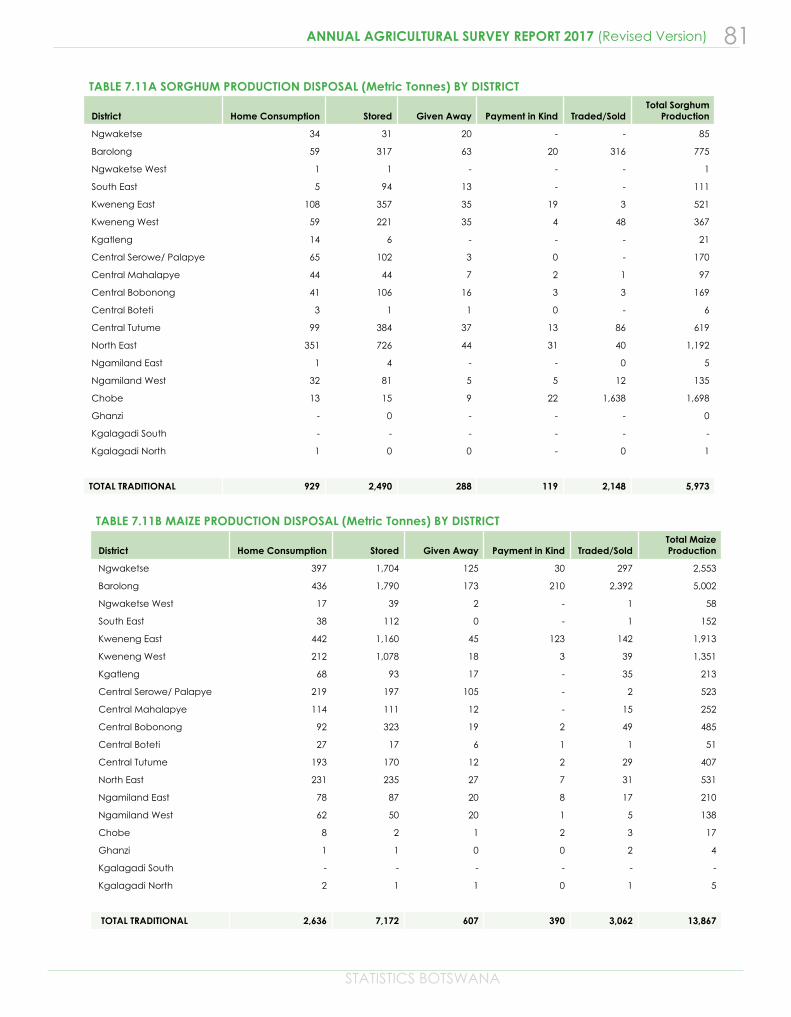
STATISTICS BOTSWANA
81ANNUAL AGRICULTURAL SURVEY REPORT 2017 (Revised Version)
TABLE 7.11A SORGHUM PRODUCTION DISPOSAL (Metric Tonnes) BY DISTRICT
District Home Consumption Stored Given Away Payment in Kind Traded/Sold Total Sorghum
Production
Ngwaketse 34 31 20 - - 85
Barolong 59 317 63 20 316 775
Ngwaketse West 1 1 - - - 1
South East 5 94 13 - - 111
Kweneng East 108 357 35 19 3 521
Kweneng West 59 221 35 4 48 367
Kgatleng 14 6 - - - 21
Central Serowe/ Palapye 65 102 3 0 - 170
Central Mahalapye 44 44 7 2 1 97
Central Bobonong 41 106 16 3 3 169
Central Boteti 3 1 1 0 - 6
Central Tutume 99 384 37 13 86 619
North East 351 726 44 31 40 1,192
Ngamiland East 1 4 - - 0 5
Ngamiland West 32 81 5 5 12 135
Chobe 13 15 9 22 1,638 1,698
Ghanzi - 0 - - - 0
Kgalagadi South - - - - - -
Kgalagadi North 1 0 0 - 0 1
TOTAL TRADITIONAL 929 2,490 288 119 2,148 5,973
TABLE 7.11B MAIZE PRODUCTION DISPOSAL (Metric Tonnes) BY DISTRICT
District Home Consumption Stored Given Away Payment in Kind Traded/Sold Total Maize Production
Ngwaketse 397 1,704 125 30 297 2,553
Barolong 436 1,790 173 210 2,392 5,002
Ngwaketse West 17 39 2 - 1 58
South East 38 112 0 - 1 152
Kweneng East 442 1,160 45 123 142 1,913
Kweneng West 212 1,078 18 3 39 1,351
Kgatleng 68 93 17 - 35 213
Central Serowe/ Palapye 219 197 105 - 2 523
Central Mahalapye 114 111 12 - 15 252
Central Bobonong 92 323 19 2 49 485
Central Boteti 27 17 6 1 1 51
Central Tutume 193 170 12 2 29 407
North East 231 235 27 7 31 531
Ngamiland East 78 87 20 8 17 210
Ngamiland West 62 50 20 1 5 138
Chobe 8 2 1 2 3 17
Ghanzi 1 1 0 0 2 4
Kgalagadi South - - - - - -
Kgalagadi North 2 1 1 0 1 5
TOTAL TRADITIONAL 2,636 7,172 607 390 3,062 13,867
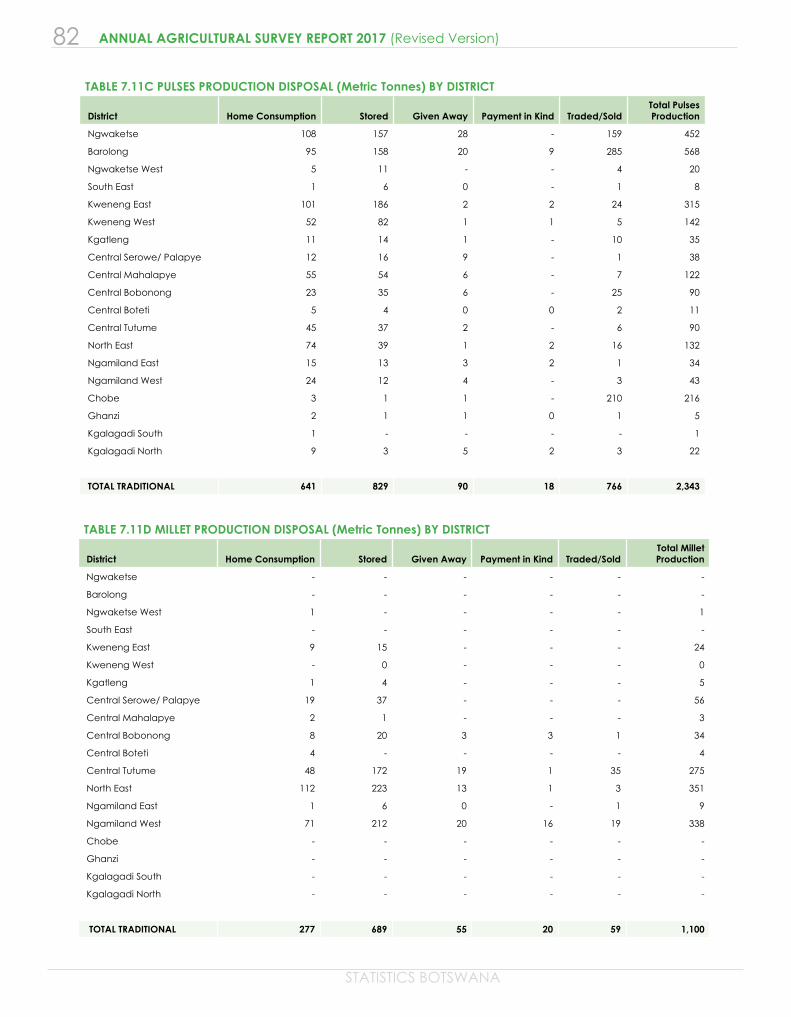
82
STATISTICS BOTSWANA
ANNUAL AGRICULTURAL SURVEY REPORT 2017 (Revised Version)
TABLE 7.11C PULSES PRODUCTION DISPOSAL (Metric Tonnes) BY DISTRICT
District Home Consumption Stored Given Away Payment in Kind Traded/Sold Total Pulses Production
Ngwaketse 108 157 28 - 159 452
Barolong 95 158 20 9 285 568
Ngwaketse West 5 11 - - 4 20
South East 1 6 0 - 1 8
Kweneng East 101 186 2 2 24 315
Kweneng West 52 82 1 1 5 142
Kgatleng 11 14 1 - 10 35
Central Serowe/ Palapye 12 16 9 - 1 38
Central Mahalapye 55 54 6 - 7 122
Central Bobonong 23 35 6 - 25 90
Central Boteti 5 4 0 0 2 11
Central Tutume 45 37 2 - 6 90
North East 74 39 1 2 16 132
Ngamiland East 15 13 3 2 1 34
Ngamiland West 24 12 4 - 3 43
Chobe 3 1 1 - 210 216
Ghanzi 2 1 1 0 1 5
Kgalagadi South 1 - - - - 1
Kgalagadi North 9 3 5 2 3 22
TOTAL TRADITIONAL 641 829 90 18 766 2,343
TABLE 7.11D MILLET PRODUCTION DISPOSAL (Metric Tonnes) BY DISTRICT
District Home Consumption Stored Given Away Payment in Kind Traded/Sold Total Millet Production
Ngwaketse - - - - - -
Barolong - - - - - -
Ngwaketse West 1 - - - - 1
South East - - - - - -
Kweneng East 9 15 - - - 24
Kweneng West - 0 - - - 0
Kgatleng 1 4 - - - 5
Central Serowe/ Palapye 19 37 - - - 56
Central Mahalapye 2 1 - - - 3
Central Bobonong 8 20 3 3 1 34
Central Boteti 4 - - - - 4
Central Tutume 48 172 19 1 35 275
North East 112 223 13 1 3 351
Ngamiland East 1 6 0 - 1 9
Ngamiland West 71 212 20 16 19 338
Chobe - - - - - -
Ghanzi - - - - - -
Kgalagadi South - - - - - -
Kgalagadi North - - - - - -
TOTAL TRADITIONAL 277 689 55 20 59 1,100
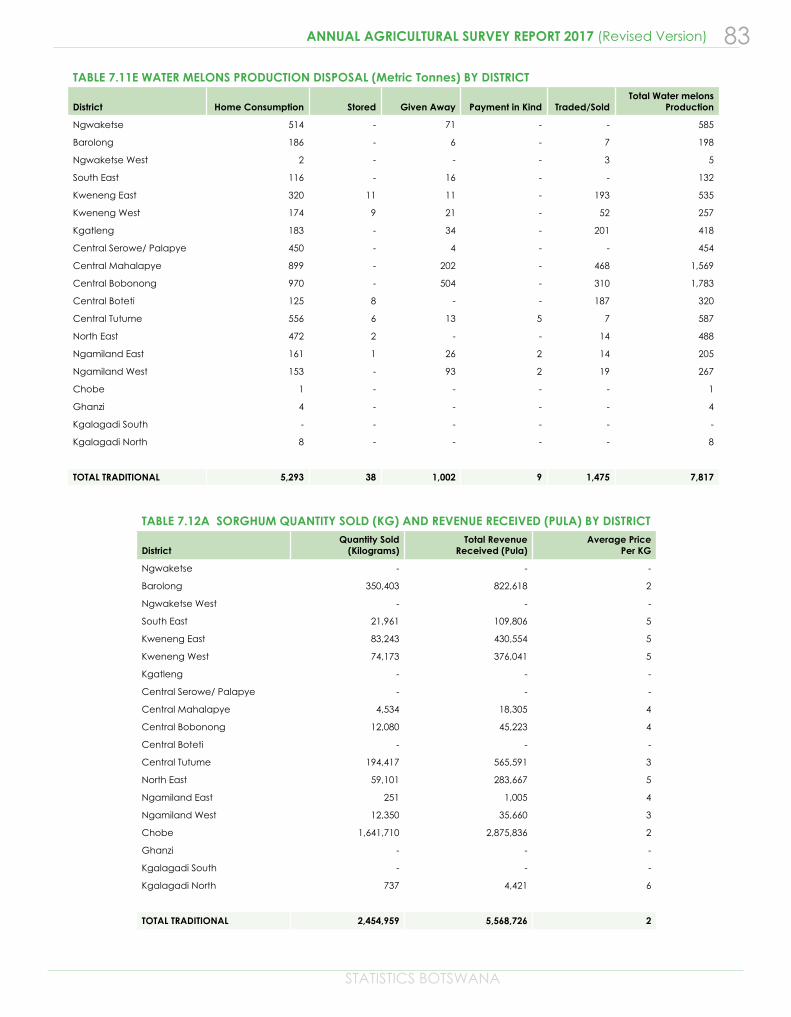
STATISTICS BOTSWANA
83ANNUAL AGRICULTURAL SURVEY REPORT 2017 (Revised Version)
TABLE 7.11E WATER MELONS PRODUCTION DISPOSAL (Metric Tonnes) BY DISTRICT
District Home Consumption Stored Given Away Payment in Kind Traded/Sold Total Water melons
Production
Ngwaketse 514 - 71 - - 585
Barolong 186 - 6 - 7 198
Ngwaketse West 2 - - - 3 5
South East 116 - 16 - - 132
Kweneng East 320 11 11 - 193 535
Kweneng West 174 9 21 - 52 257
Kgatleng 183 - 34 - 201 418
Central Serowe/ Palapye 450 - 4 - - 454
Central Mahalapye 899 - 202 - 468 1,569
Central Bobonong 970 - 504 - 310 1,783
Central Boteti 125 8 - - 187 320
Central Tutume 556 6 13 5 7 587
North East 472 2 - - 14 488
Ngamiland East 161 1 26 2 14 205
Ngamiland West 153 - 93 2 19 267
Chobe 1 - - - - 1
Ghanzi 4 - - - - 4
Kgalagadi South - - - - - -
Kgalagadi North 8 - - - - 8
TOTAL TRADITIONAL 5,293 38 1,002 9 1,475 7,817
TABLE 7.12A SORGHUM QUANTITY SOLD (KG) AND REVENUE RECEIVED (PULA) BY DISTRICT
District Quantity Sold
(Kilograms) Total Revenue
Received (Pula) Average Price
Per KG
Ngwaketse - - -
Barolong 350,403 822,618 2
Ngwaketse West - - -
South East 21,961 109,806 5
Kweneng East 83,243 430,554 5
Kweneng West 74,173 376,041 5
Kgatleng - - -
Central Serowe/ Palapye - - -
Central Mahalapye 4,534 18,305 4
Central Bobonong 12,080 45,223 4
Central Boteti - - -
Central Tutume 194,417 565,591 3
North East 59,101 283,667 5
Ngamiland East 251 1,005 4
Ngamiland West 12,350 35,660 3
Chobe 1,641,710 2,875,836 2
Ghanzi - - -
Kgalagadi South - - -
Kgalagadi North 737 4,421 6
TOTAL TRADITIONAL 2,454,959 5,568,726 2
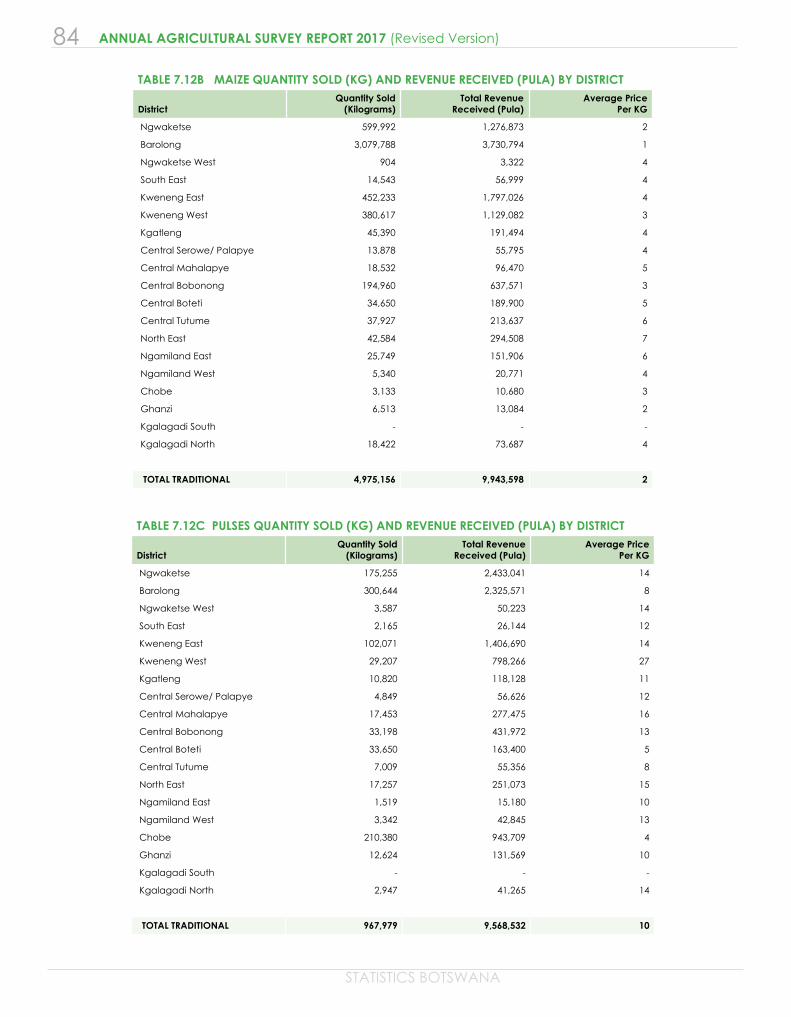
84
STATISTICS BOTSWANA
ANNUAL AGRICULTURAL SURVEY REPORT 2017 (Revised Version)
TABLE 7.12B MAIZE QUANTITY SOLD (KG) AND REVENUE RECEIVED (PULA) BY DISTRICT
District Quantity Sold
(Kilograms) Total Revenue
Received (Pula) Average Price
Per KG
Ngwaketse 599,992 1,276,873 2
Barolong 3,079,788 3,730,794 1
Ngwaketse West 904 3,322 4
South East 14,543 56,999 4
Kweneng East 452,233 1,797,026 4
Kweneng West 380,617 1,129,082 3
Kgatleng 45,390 191,494 4
Central Serowe/ Palapye 13,878 55,795 4
Central Mahalapye 18,532 96,470 5
Central Bobonong 194,960 637,571 3
Central Boteti 34,650 189,900 5
Central Tutume 37,927 213,637 6
North East 42,584 294,508 7
Ngamiland East 25,749 151,906 6
Ngamiland West 5,340 20,771 4
Chobe 3,133 10,680 3
Ghanzi 6,513 13,084 2
Kgalagadi South - - -
Kgalagadi North 18,422 73,687 4
TOTAL TRADITIONAL 4,975,156 9,943,598 2
TABLE 7.12C PULSES QUANTITY SOLD (KG) AND REVENUE RECEIVED (PULA) BY DISTRICT
District Quantity Sold
(Kilograms) Total Revenue
Received (Pula) Average Price
Per KG
Ngwaketse 175,255 2,433,041 14
Barolong 300,644 2,325,571 8
Ngwaketse West 3,587 50,223 14
South East 2,165 26,144 12
Kweneng East 102,071 1,406,690 14
Kweneng West 29,207 798,266 27
Kgatleng 10,820 118,128 11
Central Serowe/ Palapye 4,849 56,626 12
Central Mahalapye 17,453 277,475 16
Central Bobonong 33,198 431,972 13
Central Boteti 33,650 163,400 5
Central Tutume 7,009 55,356 8
North East 17,257 251,073 15
Ngamiland East 1,519 15,180 10
Ngamiland West 3,342 42,845 13
Chobe 210,380 943,709 4
Ghanzi 12,624 131,569 10
Kgalagadi South - - -
Kgalagadi North 2,947 41,265 14
TOTAL TRADITIONAL 967,979 9,568,532 10
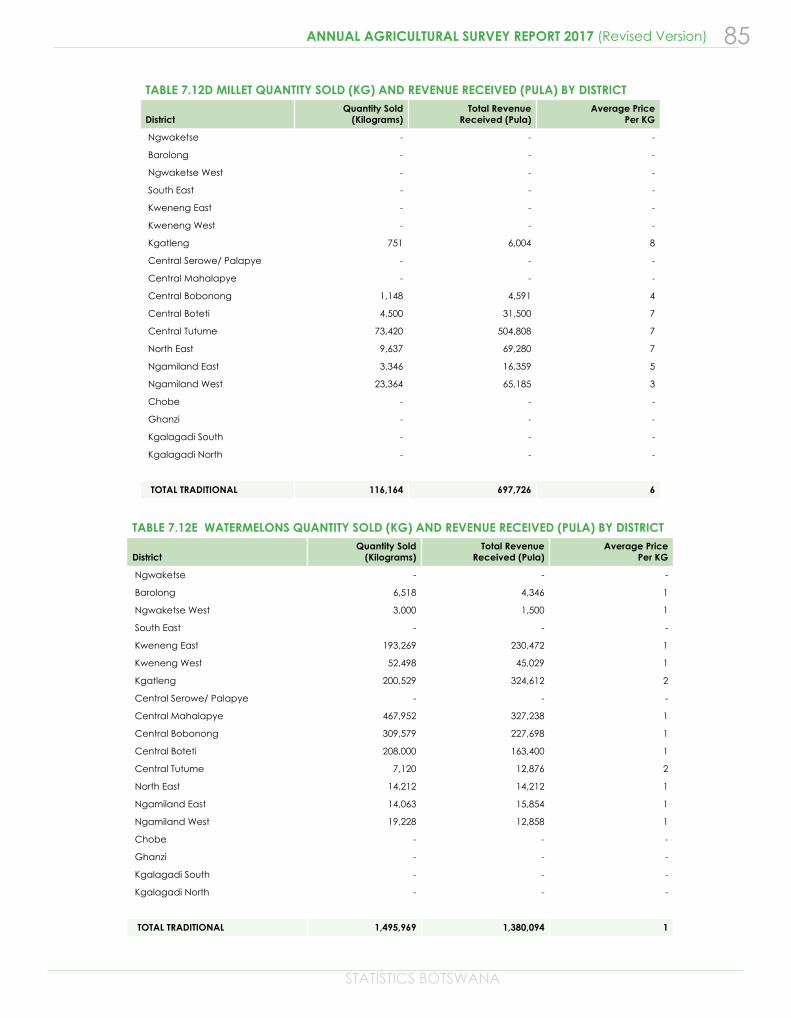
STATISTICS BOTSWANA
85ANNUAL AGRICULTURAL SURVEY REPORT 2017 (Revised Version)
TABLE 7.12D MILLET QUANTITY SOLD (KG) AND REVENUE RECEIVED (PULA) BY DISTRICT
District Quantity Sold
(Kilograms) Total Revenue
Received (Pula) Average Price
Per KG
Ngwaketse - - -
Barolong - - -
Ngwaketse West - - -
South East - - -
Kweneng East - - -
Kweneng West - - -
Kgatleng 751 6,004 8
Central Serowe/ Palapye - - -
Central Mahalapye - - -
Central Bobonong 1,148 4,591 4
Central Boteti 4,500 31,500 7
Central Tutume 73,420 504,808 7
North East 9,637 69,280 7
Ngamiland East 3,346 16,359 5
Ngamiland West 23,364 65,185 3
Chobe - - -
Ghanzi - - -
Kgalagadi South - - -
Kgalagadi North - - -
TOTAL TRADITIONAL 116,164 697,726 6
TABLE 7.12E WATERMELONS QUANTITY SOLD (KG) AND REVENUE RECEIVED (PULA) BY DISTRICT
District Quantity Sold
(Kilograms) Total Revenue
Received (Pula) Average Price
Per KG
Ngwaketse - - -
Barolong 6,518 4,346 1
Ngwaketse West 3,000 1,500 1
South East - - -
Kweneng East 193,269 230,472 1
Kweneng West 52,498 45,029 1
Kgatleng 200,529 324,612 2
Central Serowe/ Palapye - - -
Central Mahalapye 467,952 327,238 1
Central Bobonong 309,579 227,698 1
Central Boteti 208,000 163,400 1
Central Tutume 7,120 12,876 2
North East 14,212 14,212 1
Ngamiland East 14,063 15,854 1
Ngamiland West 19,228 12,858 1
Chobe - - -
Ghanzi - - -
Kgalagadi South - - -
Kgalagadi North - - -
TOTAL TRADITIONAL 1,495,969 1,380,094 1
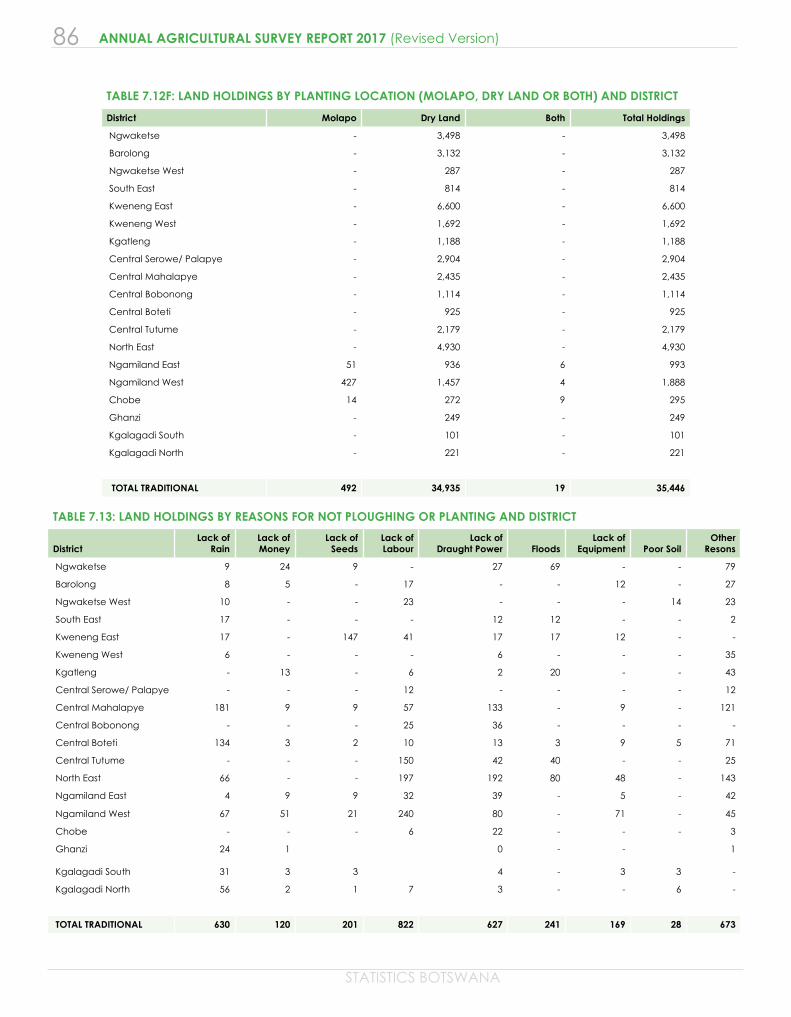
86
STATISTICS BOTSWANA
ANNUAL AGRICULTURAL SURVEY REPORT 2017 (Revised Version)
TABLE 7.12F: LAND HOLDINGS BY PLANTING LOCATION (MOLAPO, DRY LAND OR BOTH) AND DISTRICT
District Molapo Dry Land Both Total Holdings
Ngwaketse - 3,498 - 3,498
Barolong - 3,132 - 3,132
Ngwaketse West - 287 - 287
South East - 814 - 814
Kweneng East - 6,600 - 6,600
Kweneng West - 1,692 - 1,692
Kgatleng - 1,188 - 1,188
Central Serowe/ Palapye - 2,904 - 2,904
Central Mahalapye - 2,435 - 2,435
Central Bobonong - 1,114 - 1,114
Central Boteti - 925 - 925
Central Tutume - 2,179 - 2,179
North East - 4,930 - 4,930
Ngamiland East 51 936 6 993
Ngamiland West 427 1,457 4 1,888
Chobe 14 272 9 295
Ghanzi - 249 - 249
Kgalagadi South - 101 - 101
Kgalagadi North - 221 - 221
TOTAL TRADITIONAL 492 34,935 19 35,446
TABLE 7.13: LAND HOLDINGS BY REASONS FOR NOT PLOUGHING OR PLANTING AND DISTRICT
District Lack of
Rain Lack of Money
Lack of Seeds
Lack of Labour
Lack of Draught Power Floods
Lack of Equipment Poor Soil
Other Resons
Ngwaketse 9 24 9 - 27 69 - - 79
Barolong 8 5 - 17 - - 12 - 27
Ngwaketse West 10 - - 23 - - - 14 23
South East 17 - - - 12 12 - - 2
Kweneng East 17 - 147 41 17 17 12 - -
Kweneng West 6 - - - 6 - - - 35
Kgatleng - 13 - 6 2 20 - - 43
Central Serowe/ Palapye - - - 12 - - - - 12
Central Mahalapye 181 9 9 57 133 - 9 - 121
Central Bobonong - - - 25 36 - - - -
Central Boteti 134 3 2 10 13 3 9 5 71
Central Tutume - - - 150 42 40 - - 25
North East 66 - - 197 192 80 48 - 143
Ngamiland East 4 9 9 32 39 - 5 - 42
Ngamiland West 67 51 21 240 80 - 71 - 45
Chobe - - - 6 22 - - - 3
Ghanzi 24 1 0 - - 1
Kgalagadi South 31 3 3 4 - 3 3 -
Kgalagadi North 56 2 1 7 3 - - 6 -
TOTAL TRADITIONAL 630 120 201 822 627 241 169 28 673
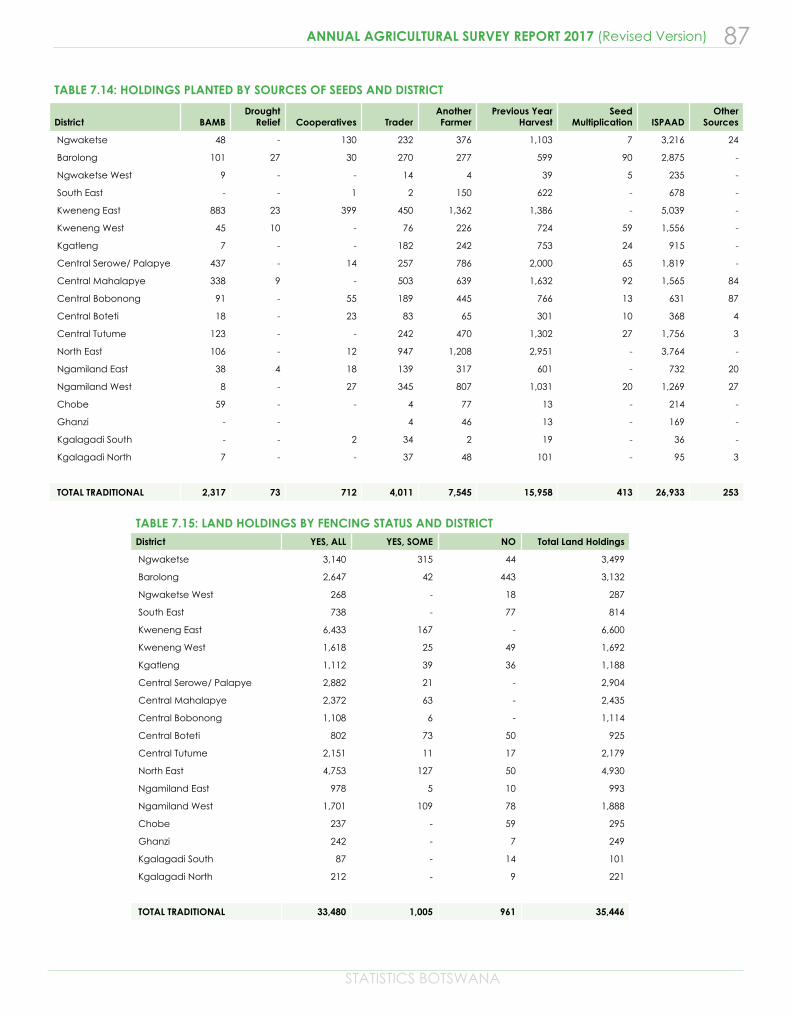
STATISTICS BOTSWANA
87ANNUAL AGRICULTURAL SURVEY REPORT 2017 (Revised Version)
TABLE 7.14: HOLDINGS PLANTED BY SOURCES OF SEEDS AND DISTRICT
District BAMBDrought
Relief Cooperatives Trader Another
Farmer Previous Year
HarvestSeed
Multiplication ISPAADOther
Sources
Ngwaketse 48 - 130 232 376 1,103 7 3,216 24
Barolong 101 27 30 270 277 599 90 2,875 -
Ngwaketse West 9 - - 14 4 39 5 235 -
South East - - 1 2 150 622 - 678 -
Kweneng East 883 23 399 450 1,362 1,386 - 5,039 -
Kweneng West 45 10 - 76 226 724 59 1,556 -
Kgatleng 7 - - 182 242 753 24 915 -
Central Serowe/ Palapye 437 - 14 257 786 2,000 65 1,819 -
Central Mahalapye 338 9 - 503 639 1,632 92 1,565 84
Central Bobonong 91 - 55 189 445 766 13 631 87
Central Boteti 18 - 23 83 65 301 10 368 4
Central Tutume 123 - - 242 470 1,302 27 1,756 3
North East 106 - 12 947 1,208 2,951 - 3,764 -
Ngamiland East 38 4 18 139 317 601 - 732 20
Ngamiland West 8 - 27 345 807 1,031 20 1,269 27
Chobe 59 - - 4 77 13 - 214 -
Ghanzi - - 4 46 13 - 169 -
Kgalagadi South - - 2 34 2 19 - 36 -
Kgalagadi North 7 - - 37 48 101 - 95 3
TOTAL TRADITIONAL 2,317 73 712 4,011 7,545 15,958 413 26,933 253
TABLE 7.15: LAND HOLDINGS BY FENCING STATUS AND DISTRICTDistrict YES, ALL YES, SOME NO Total Land Holdings
Ngwaketse 3,140 315 44 3,499
Barolong 2,647 42 443 3,132
Ngwaketse West 268 - 18 287
South East 738 - 77 814
Kweneng East 6,433 167 - 6,600
Kweneng West 1,618 25 49 1,692
Kgatleng 1,112 39 36 1,188
Central Serowe/ Palapye 2,882 21 - 2,904
Central Mahalapye 2,372 63 - 2,435
Central Bobonong 1,108 6 - 1,114
Central Boteti 802 73 50 925
Central Tutume 2,151 11 17 2,179
North East 4,753 127 50 4,930
Ngamiland East 978 5 10 993
Ngamiland West 1,701 109 78 1,888
Chobe 237 - 59 295
Ghanzi 242 - 7 249
Kgalagadi South 87 - 14 101
Kgalagadi North 212 - 9 221
TOTAL TRADITIONAL 33,480 1,005 961 35,446
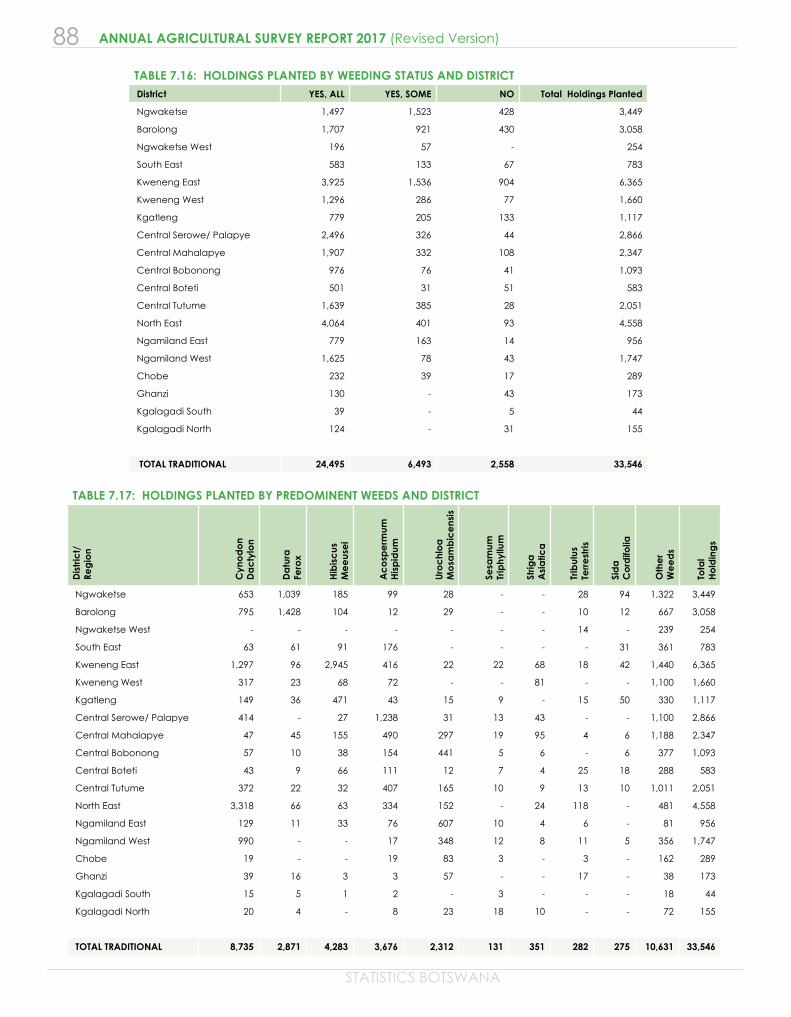
88
STATISTICS BOTSWANA
ANNUAL AGRICULTURAL SURVEY REPORT 2017 (Revised Version)
TABLE 7.16: HOLDINGS PLANTED BY WEEDING STATUS AND DISTRICT District YES, ALL YES, SOME NO Total Holdings Planted
Ngwaketse 1,497 1,523 428 3,449
Barolong 1,707 921 430 3,058
Ngwaketse West 196 57 - 254
South East 583 133 67 783
Kweneng East 3,925 1,536 904 6,365
Kweneng West 1,296 286 77 1,660
Kgatleng 779 205 133 1,117
Central Serowe/ Palapye 2,496 326 44 2,866
Central Mahalapye 1,907 332 108 2,347
Central Bobonong 976 76 41 1,093
Central Boteti 501 31 51 583
Central Tutume 1,639 385 28 2,051
North East 4,064 401 93 4,558
Ngamiland East 779 163 14 956
Ngamiland West 1,625 78 43 1,747
Chobe 232 39 17 289
Ghanzi 130 - 43 173
Kgalagadi South 39 - 5 44
Kgalagadi North 124 - 31 155
TOTAL TRADITIONAL 24,495 6,493 2,558 33,546
TABLE 7.17: HOLDINGS PLANTED BY PREDOMINENT WEEDS AND DISTRICT
Dis
tric
t/Re
gio
n
Cyn
od
on
Da
cty
lon
Da
tura
Fe
rox
Hib
isc
us
Me
eus
ei
Ac
osp
erm
umH
isp
idum
Uro
chl
oa
Mo
sam
bic
ens
is
Sesa
mum
Tr
iphy
llum
Strig
a
Asi
atic
a
Trib
ulus
Te
rre
stris
Sid
a
Co
rdifo
lia
Oth
er
We
ed
s
Tota
lH
old
ing
s
Ngwaketse 653 1,039 185 99 28 - - 28 94 1,322 3,449
Barolong 795 1,428 104 12 29 - - 10 12 667 3,058
Ngwaketse West - - - - - - - 14 - 239 254
South East 63 61 91 176 - - - - 31 361 783
Kweneng East 1,297 96 2,945 416 22 22 68 18 42 1,440 6,365
Kweneng West 317 23 68 72 - - 81 - - 1,100 1,660
Kgatleng 149 36 471 43 15 9 - 15 50 330 1,117
Central Serowe/ Palapye 414 - 27 1,238 31 13 43 - - 1,100 2,866
Central Mahalapye 47 45 155 490 297 19 95 4 6 1,188 2,347
Central Bobonong 57 10 38 154 441 5 6 - 6 377 1,093
Central Boteti 43 9 66 111 12 7 4 25 18 288 583
Central Tutume 372 22 32 407 165 10 9 13 10 1,011 2,051
North East 3,318 66 63 334 152 - 24 118 - 481 4,558
Ngamiland East 129 11 33 76 607 10 4 6 - 81 956
Ngamiland West 990 - - 17 348 12 8 11 5 356 1,747
Chobe 19 - - 19 83 3 - 3 - 162 289
Ghanzi 39 16 3 3 57 - - 17 - 38 173
Kgalagadi South 15 5 1 2 - 3 - - - 18 44
Kgalagadi North 20 4 - 8 23 18 10 - - 72 155
TOTAL TRADITIONAL 8,735 2,871 4,283 3,676 2,312 131 351 282 275 10,631 33,546
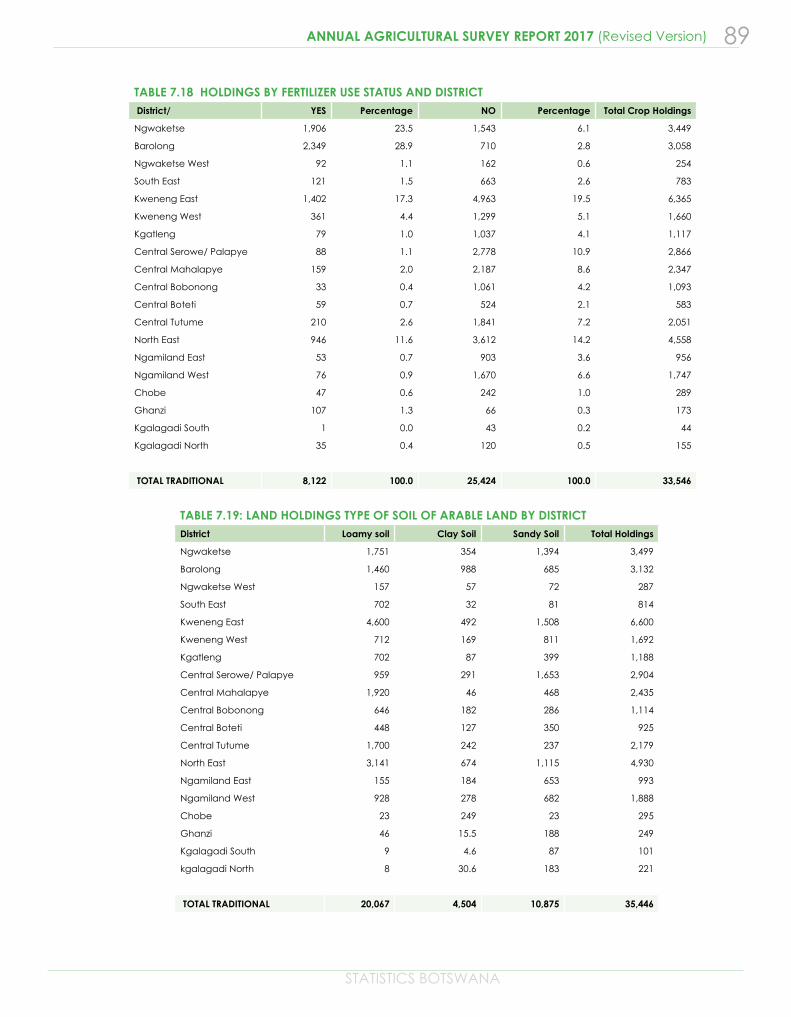
STATISTICS BOTSWANA
89ANNUAL AGRICULTURAL SURVEY REPORT 2017 (Revised Version)
TABLE 7.18 HOLDINGS BY FERTILIZER USE STATUS AND DISTRICT District/ YES Percentage NO Percentage Total Crop Holdings
Ngwaketse 1,906 23.5 1,543 6.1 3,449
Barolong 2,349 28.9 710 2.8 3,058
Ngwaketse West 92 1.1 162 0.6 254
South East 121 1.5 663 2.6 783
Kweneng East 1,402 17.3 4,963 19.5 6,365
Kweneng West 361 4.4 1,299 5.1 1,660
Kgatleng 79 1.0 1,037 4.1 1,117
Central Serowe/ Palapye 88 1.1 2,778 10.9 2,866
Central Mahalapye 159 2.0 2,187 8.6 2,347
Central Bobonong 33 0.4 1,061 4.2 1,093
Central Boteti 59 0.7 524 2.1 583
Central Tutume 210 2.6 1,841 7.2 2,051
North East 946 11.6 3,612 14.2 4,558
Ngamiland East 53 0.7 903 3.6 956
Ngamiland West 76 0.9 1,670 6.6 1,747
Chobe 47 0.6 242 1.0 289
Ghanzi 107 1.3 66 0.3 173
Kgalagadi South 1 0.0 43 0.2 44
Kgalagadi North 35 0.4 120 0.5 155
TOTAL TRADITIONAL 8,122 100.0 25,424 100.0 33,546
TABLE 7.19: LAND HOLDINGS TYPE OF SOIL OF ARABLE LAND BY DISTRICT District Loamy soil Clay Soil Sandy Soil Total Holdings
Ngwaketse 1,751 354 1,394 3,499
Barolong 1,460 988 685 3,132
Ngwaketse West 157 57 72 287
South East 702 32 81 814
Kweneng East 4,600 492 1,508 6,600
Kweneng West 712 169 811 1,692
Kgatleng 702 87 399 1,188
Central Serowe/ Palapye 959 291 1,653 2,904
Central Mahalapye 1,920 46 468 2,435
Central Bobonong 646 182 286 1,114
Central Boteti 448 127 350 925
Central Tutume 1,700 242 237 2,179
North East 3,141 674 1,115 4,930
Ngamiland East 155 184 653 993
Ngamiland West 928 278 682 1,888
Chobe 23 249 23 295
Ghanzi 46 15.5 188 249
Kgalagadi South 9 4.6 87 101
kgalagadi North 8 30.6 183 221
TOTAL TRADITIONAL 20,067 4,504 10,875 35,446
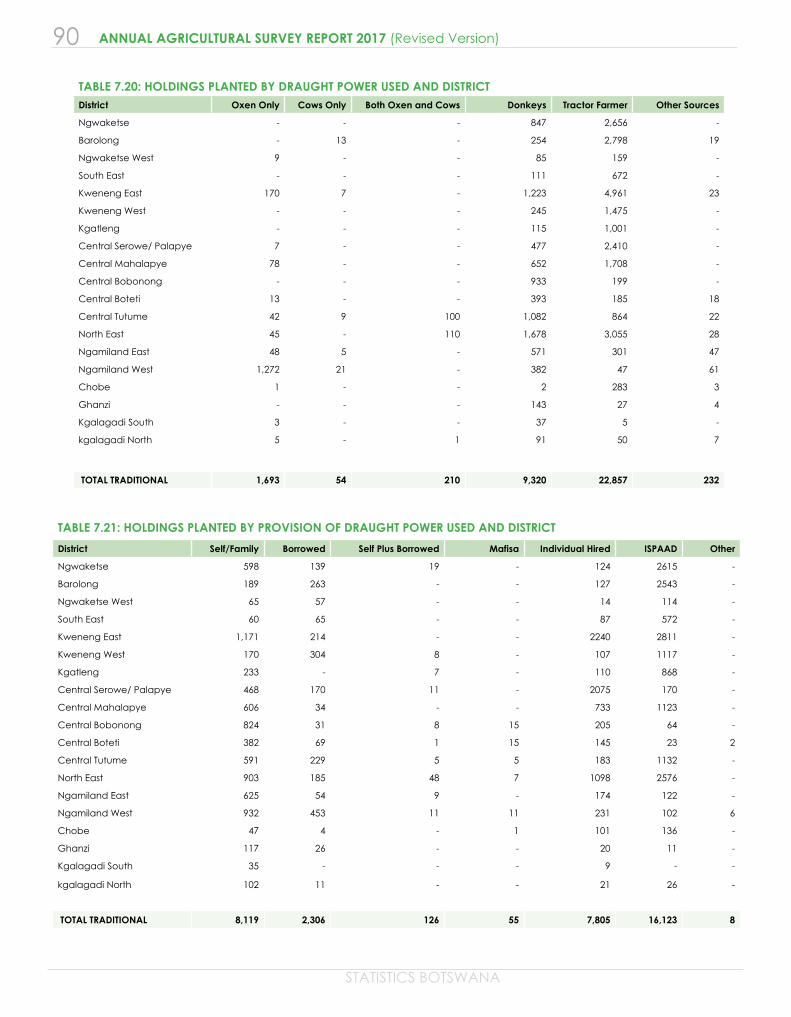
90
STATISTICS BOTSWANA
ANNUAL AGRICULTURAL SURVEY REPORT 2017 (Revised Version)
TABLE 7.20: HOLDINGS PLANTED BY DRAUGHT POWER USED AND DISTRICT District Oxen Only Cows Only Both Oxen and Cows Donkeys Tractor Farmer Other Sources
Ngwaketse - - - 847 2,656 -
Barolong - 13 - 254 2,798 19
Ngwaketse West 9 - - 85 159 -
South East - - - 111 672 -
Kweneng East 170 7 - 1,223 4,961 23
Kweneng West - - - 245 1,475 -
Kgatleng - - - 115 1,001 -
Central Serowe/ Palapye 7 - - 477 2,410 -
Central Mahalapye 78 - - 652 1,708 -
Central Bobonong - - - 933 199 -
Central Boteti 13 - - 393 185 18
Central Tutume 42 9 100 1,082 864 22
North East 45 - 110 1,678 3,055 28
Ngamiland East 48 5 - 571 301 47
Ngamiland West 1,272 21 - 382 47 61
Chobe 1 - - 2 283 3
Ghanzi - - - 143 27 4
Kgalagadi South 3 - - 37 5 -
kgalagadi North 5 - 1 91 50 7
TOTAL TRADITIONAL 1,693 54 210 9,320 22,857 232
TABLE 7.21: HOLDINGS PLANTED BY PROVISION OF DRAUGHT POWER USED AND DISTRICT
District Self/Family Borrowed Self Plus Borrowed Mafisa Individual Hired ISPAAD Other
Ngwaketse 598 139 19 - 124 2615 -
Barolong 189 263 - - 127 2543 -
Ngwaketse West 65 57 - - 14 114 -
South East 60 65 - - 87 572 -
Kweneng East 1,171 214 - - 2240 2811 -
Kweneng West 170 304 8 - 107 1117 -
Kgatleng 233 - 7 - 110 868 -
Central Serowe/ Palapye 468 170 11 - 2075 170 -
Central Mahalapye 606 34 - - 733 1123 -
Central Bobonong 824 31 8 15 205 64 -
Central Boteti 382 69 1 15 145 23 2
Central Tutume 591 229 5 5 183 1132 -
North East 903 185 48 7 1098 2576 -
Ngamiland East 625 54 9 - 174 122 -
Ngamiland West 932 453 11 11 231 102 6
Chobe 47 4 - 1 101 136 -
Ghanzi 117 26 - - 20 11 -
Kgalagadi South 35 - - - 9 - -
kgalagadi North 102 11 - - 21 26 -
TOTAL TRADITIONAL 8,119 2,306 126 55 7,805 16,123 8
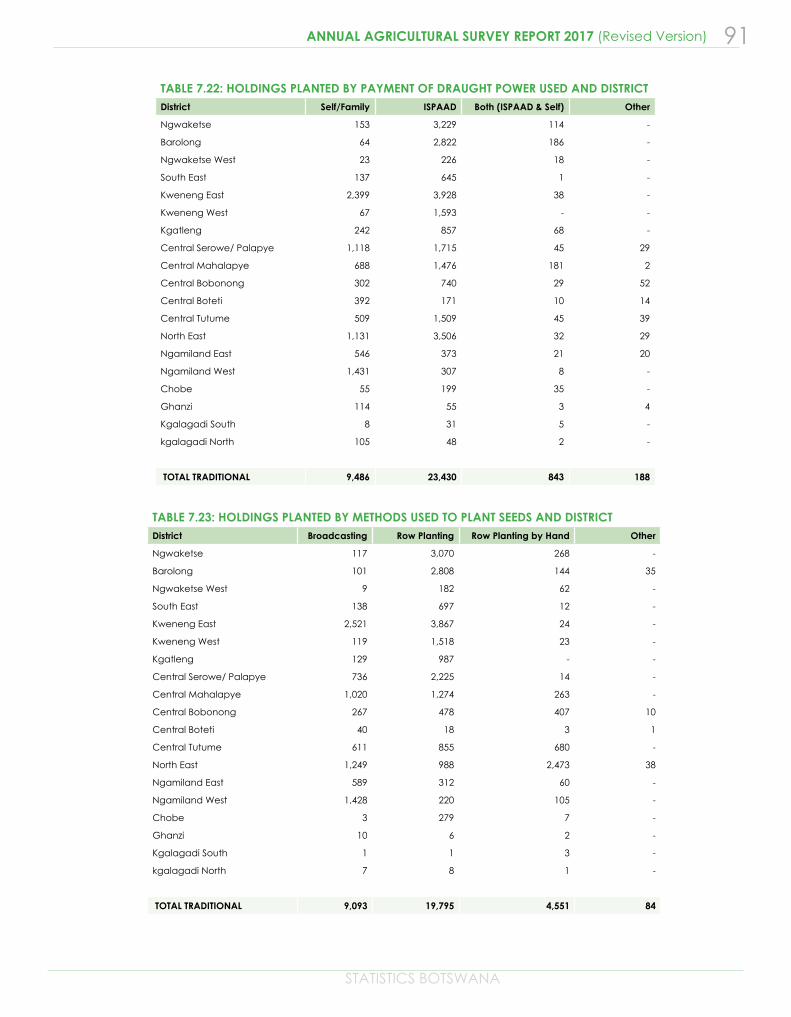
STATISTICS BOTSWANA
91ANNUAL AGRICULTURAL SURVEY REPORT 2017 (Revised Version)
TABLE 7.22: HOLDINGS PLANTED BY PAYMENT OF DRAUGHT POWER USED AND DISTRICT District Self/Family ISPAAD Both (ISPAAD & Self) Other
Ngwaketse 153 3,229 114 -
Barolong 64 2,822 186 -
Ngwaketse West 23 226 18 -
South East 137 645 1 -
Kweneng East 2,399 3,928 38 -
Kweneng West 67 1,593 - -
Kgatleng 242 857 68 -
Central Serowe/ Palapye 1,118 1,715 45 29
Central Mahalapye 688 1,476 181 2
Central Bobonong 302 740 29 52
Central Boteti 392 171 10 14
Central Tutume 509 1,509 45 39
North East 1,131 3,506 32 29
Ngamiland East 546 373 21 20
Ngamiland West 1,431 307 8 -
Chobe 55 199 35 -
Ghanzi 114 55 3 4
Kgalagadi South 8 31 5 -
kgalagadi North 105 48 2 -
TOTAL TRADITIONAL 9,486 23,430 843 188
TABLE 7.23: HOLDINGS PLANTED BY METHODS USED TO PLANT SEEDS AND DISTRICT District Broadcasting Row Planting Row Planting by Hand Other
Ngwaketse 117 3,070 268 -
Barolong 101 2,808 144 35
Ngwaketse West 9 182 62 -
South East 138 697 12 -
Kweneng East 2,521 3,867 24 -
Kweneng West 119 1,518 23 -
Kgatleng 129 987 - -
Central Serowe/ Palapye 736 2,225 14 -
Central Mahalapye 1,020 1,274 263 -
Central Bobonong 267 478 407 10
Central Boteti 40 18 3 1
Central Tutume 611 855 680 -
North East 1,249 988 2,473 38
Ngamiland East 589 312 60 -
Ngamiland West 1,428 220 105 -
Chobe 3 279 7 -
Ghanzi 10 6 2 -
Kgalagadi South 1 1 3 -
kgalagadi North 7 8 1 -
TOTAL TRADITIONAL 9,093 19,795 4,551 84
ISBN: 978-99968-2-073-1