Embed Size (px)
Citation preview

Revista ISSN 1806-1877 nº 63 - Junho de 2011
Artigos brasileiros da Bienal Paris 2010e do XI EDAO

Para mais informaçõ[email protected] • Tel.: (21) 2556-5929
A biblioteca on-line do CIGRÉ está disponível em www.e-cigre.org
São mais de 6.000 títulos de publicações do CIGRÉ, incluindo: ELECTRA,
Brochuras Técnicas, Sessões Técnicas e Simpósios.
Os sócios do CIGRÉ-Brasil têm acesso gratuito a 2.000 títulos para
download. E descontos nas demais publicações.
Junho20 – São Paulo – SPWORkShOP INTERNACIONAL SOBRE CABOS ELÉTRICOSCOmITê DE ESTuDO B1
26 a 28 – rio de janeiro – rjCuRSO SOBRE DINâmICA DE SISTEmAS DE POTêNCIACOmITê DE ESTuDO C2
Julho25 a 27 - Belém - PaII SIGAmT – SEmINáRIO INTERNACIONAL DE GERENCIAmENTO DE ATIvOS, mANuTENçãO DA TRANSmISSãO E DESEmPENhO DO SISTEmA ELÉTRICOCOmITê DE ESTuDO C4
Agosto3 e 4 – rio de janeiro - rjWORkShOP – SuPERAçãO DE DISJuNTORES POR TENSãO DE RESTABELECImENTO TRANSITóRIA - TRTCOmITê DE ESTuDO A3
14 a 17 – Curitiba - PrIX SImPASE - SImPóSIO DE AuTOmAçãO DE SISTEmAS ELÉTRICOS
Setembro1 e 2 - Brasília – dFCuRSO DE LINhAS DE TRANSmISSãO Em CORRENTE CONTíNuACOmITê DE ESTuDO B2
Outubro 23 a 26 – Florianópolis - SCXXI SNPTEE - SEmINáRIO NACIONAL DE PRODuçãO E TRANSmISSãO DE ENERGIA ELÉTRICA
Calendário de eventos
2011

EletroEvolução - Sistemas de potência
iSSn 1806-1877 - nº 63 - junho de 2011
Conselho editorial:Saulo José Nascimento Cisneiros (PR) – CIGRÉ/ONS
João Guedes de Campos Barros – CEPELMaria Alzira Noli Silveira – EPE
Paulo Gomes – ONSJosé Sidnei Colombo Martini – USP/POLIJosé Wenderley Marangon Lima – UNIFEIHélio Moreira Valgas – ENERGY CHOICE
João Batista Guimarães Ferreira da Silva – DAMP ELECTRICPaulo Cesar Fernandez – CEs A/ELETROBRÁS
Ruy Carlos Ramos de Menezes – CEs B/UFRGSLuiz Augusto Barroso – CEs C/PSR
Orsino Oliveira Filho – CEs D/CEPELLuiz Carlos Leal Cherchiglia (ex-PR) – CONSULTOR
projeto gráfiCo e edição:Flávia Guimarães
impressão:Rona Editora
tiragem:1.000 exemplares
eletroevolução – sistemas de potênCiaé publicada pelo Comitê Nacional Brasileiro de Produção e
Transmissão de Energia Elétrica (CIGRÉ-Brasil)
diretoria Cigré-brasil:Antônio Varejão de Godoy
Diretor PresidenteJosias Matos de Araújo
Diretor 1º Vice-presidenteSaulo José Nascimento Cisneiros
Diretor 2º Vice-presidenteAntonio Simões Pires
Diretor FinanceiroSérgio do Espírito SantoDiretor Administrativo
endereço:CiGrÉ-Brasil
Praia do Flamengo, 66 – Bloco B – Sala 408 – FlamengoRio de Janeiro – RJ – CEP 22210-903 – Tel: (21) 2556.5929
sum
ário
75
4
2
lista dos Comitês de estudoRepresentantes Brasileiros
editorial
6 notíCias
14 Bienal paris 2010System for integration of Protectionand Control devices
18 Bienal paris 2010on uncertainties of reliability indices
28 Bienal paris 2010large Scale iintegration of renewable Sourcesin the Brazilian Bulk Power System
36 Bienal paris 2010Brazilian Power System: Criteria, operatingStandard metrics and Performance indicators
43 Bienal paris 2010analysis of Socio-environmental Costs in theoperational Phase of Hydropower Projects in Brazil
55 Bienal paris 2010a Telecommunications mobile unit forTransmission lines emergency Scenarios
60 Xi edaoSistema de diagnóstico de Perturbaçõesem Tempo real
67 Xi edaodesenvolvimento de método paraaperfeiçoamento de operadores através da imersão em ambiente de Simulação
49 Bienal paris 2010Procedures to evaluate Socio-environmental Costs during the Planning Phase of Transmission Systems
Calendário de eventos
Revista ISSN 1806-1877 nº 63 - Junho de 2011
Artigos brasileiros da Bienal Paris 2010e do XI EDAO

4 eleTroeVoluÇão JUNHO 2011
editorial
dia 28 de abril, em assembléia Geral do Cigré-Brasil, foi eleita a atual diretoria para o mandato de quatro anos. esta nossa instituição tem por missão produzir e compartilhar o conhecimento nos segmentos de transmissão e geração de energia elétrica do Setor elétrico Brasileiro.
a missão de presidir o Cigré Brasil constitui-se em um desafio extremamente estimulante. Há três grandes aspectos que o tornam ainda maior: (a) o ambiente do Setor que, mesmo sendo competitivo, tem demandado a produção cada vez mais intensa de novos conhecimentos que viabilizem o suporte de energia ao crescimento econômico do país; (b) a necessidade de realmente integrar a cultura, a maturidade e o conhecimento de duas diferentes gerações de profissionais, os antigos, de “cabelos prata” e os novos, verdadeiros“ artesões das redes sociais” e, finalmente, (c) a sucessão
de várias exitosas gestões do Cigré Brasil, que transformaram o Comitê Brasileiro no maior e mais importante comitê nacional de todo o Cigré.
a experiência adquirida ao participar das duas últimas gestões da entidade, a liderança e a qualificação técnica dos meus colegas de diretoria reconhecida no Brasil e no mundo, certamente solidifica nossa crença de que os desafios serão superados ao longo dos próximos quatro anos.
a aquisição da sede própria e a conseguinte instalação do Cigré nesse prédio, a organização do arcabouço normativo que faz a rotina da entidade operar com segurança são metas já cumpridas e permitirão que esta nova Gestão percorra cinco novas diretrizes:
1. elaborar o Planejamento estratégico para o período 2011-2015.2. dar continuidade ao trabalho de profissionalização da GeSTão do CiGré – Brasil, ampliando e diversificando a captação de recursos.3. Programar e estimular o uso da TeCnoloGia diGiTal na GeSTão adminiSTraTiVa e TéCniCa do CiGré–Brasil.4. Continuar a aproximar o Cigré-Brasil das principais organizações, entidades e empresas do Setor elétrico, das universidades e da Sociedade em geral.
ComPromiSSo Com o CiGré

eleTroeVoluÇão JUNHO 2011 5
editorial
5. dar continuidade à ampliação das atividades técnicas e científicas do Cigré-Brasil no Brasil e no mundo.
Para percorrer os caminhos que conduzam à implementação destas cinco diretrizes será necessário controlar e melhorar a rotina do dia a dia, através da avaliação periódica dos indicadores de desempenho do Comitê Técnico e dos indicadores financeiros da entidade. além do que, será fundamental criar indicadores de gestão administrativa e da gestão do próprio Cigré, que mensurem os resultados e, não apenas, o esforço da gestão. nosso objetivo será desenvolver a Gestão que agora se inicia buscando uma aproximação, cada vez maior, com os princípios de gestão da FnQ (Fundação nacional da Qualidade), baseado no modelo de excelência na Gestão (meG) e com a consciência e a experiência de que sem medir, não se gerencia.
além da busca constante da melhoria da rotina, a estratégia desta gestão estará suportada na estruturação de uma visão para o Cigré sustentável, próximo do Setor elétrico e da Sociedade, fundamental para alavancar o crescimento do Setor e do País. nosso sonho é trazer para o Cigré, na comemoração dos seus 40 anos de existência, as linhas futuras de uma entidade sustentável e indispensável
para a produção do conhecimento essencial ao Setor elétrico Brasileiro.
Finalmente, reafirmamos nossa certeza de que nossos objetivos serão atingidos, pois não representam o sonho do Presidente, mas de todos aqueles que fazem o Cigré Brasil, sobretudo dos Comitês de estudo, dos Conselhos de administração e Fiscal, e da diretoria, onde todos, por princípio, acreditam e praticam a construção coletiva do conhecimento!
Antonio varejao de GodoyPresidente

6 eleTroeVoluÇão JUNHO 2011
notíCias
a reunião anual de 2011 do SC a3 será realizada em Viena, Áustria,
atendendo a convite formal feito pelo Comitê nacional da Áustria, junto com
um Colóquio Técnico e um Tutorial, na primeira semana de setembro de 2011.
estão programadas também reuniões de Working Groups do SC a3. Foi definida a
participação de 2 representantes do Ce a3 (jorge amon e Paulo Fernandez) como
membros na Comissão organizadora dos eventos associados à reunião anual de
2011 do SC a3, e também na comissão avaliadora dos resumos de artigos a serem
apresentados no Colóquio Técnico. o Colóquio Técnico tem os seguintes temas
preferenciais: HV equipment for new network conditions, life-management of HV
equipment e Sustainable technologies, impact on/of environment.
o Ce a3 do Cigré Brasil teve os seguintes artigos aprovados para este
evento: Series Capacitor - Brazilian experience with series compensation of
transmission lines (a. C. Carvalho, H. Pessoa oliveira, a. d’ajuz, P. Guimarães
Peixoto); determination of requirements for short circuit currents with delayed
zeros through digital computer simulations using the aTP program (j. amon. F.,
P. C. Fernandez, r. a. a.Gonçalves); Brazilian successful experience in the usage of
Current limiting reactors for Short Circuit limitation (j. amom F., P. C. Fernandez, e.
H. rose, a. d´ajuz, a. Castanheira); on-line insulation diagnostics for Surge arresters
By Partial discharge measurement (a. Tomaz, H. amorim, a. levy, j. a. rodrigues, T.
Baptista) e overstress - Criteria for tracking transmission equipment overstress (a.
C. Carvalho, r. Tenorio, m. Waldron, m. escoto, n. lemaitre, S. moroni).
Comitê de estudo a3
Comitê de estudo C5
está em elaboração o primeiro livro editado pelo Cigré-Brasil, titulado “mercados,
economia e regulação do Setor de energia”. o livro é o resultado de contribuições
realizadas pelos membros do Ce C5 e terá 14 capítulos cobrindo temas da regulação,
economia e mercados de energia elétrica. a previsão de lançamento é para o inicio
do segundo semestre de 2011.
o Ce C5 realizou em 1o de abril sua 1a reunião de trabalho de 2011, onde foram
discutidas a criação de novos grupos de trabalho e a realização de Workshop ainda
em 2011. a 2a reunião de trabalho ainda será agendada e ocorrerá no final de 2011.
durante os dias 9 e 10 novembro 2011, o SC C5 realizará um Colloquium sobre
mercados e regulação em Sydney, austrália, onde também ocorrerão reuniões dos
grupos de trabalho e a reunião anual do SC.

eleTroeVoluÇão JUNHO 2011 7
notíCias
nos dias 22 e 23 de março de 2011 foi realizado
no Centro de Convenções da Bolsa do rio, localizado
no centro da cidade do rio de janeiro, o Workshop
sobre desempenho e requisitos de Projetos de elos de
Corrente Contínua. este encontro, realizado pelo Ce B4,
recebeu o patrocínio da aBB, alstom Grid e Siemens, e
contou com o apoio da eletrobras Furnas.
Com a proximidade do leilão dos corredores de
transmissão associados aos novos projetos de geração
remota na região amazônica, em que a tecnologia
de transmissão em HVdC se apresenta como a mais
econômica e adequada, o Ce B4 julgou que seria oportuno
promover uma discussão mais profunda sobre esse tema,
aproveitando-se a experiência operativa do elo HVdC de
itaipu ao longo de quase três décadas de operação bem-
sucedida, e também da experiência mais recente adquirida
no projeto dos elos em HVdC do Projeto do rio madeira.
neste contexto, o presente workshop se propôs a
compartilhar experiências, através de palestras técnicas
e mesas redondas. Foram discutidos diversos tópicos,
entre os quais critérios e metodologias de análise no
planejamento e operação, marcos regulatórios envolvidos
com HVdC, confiabilidade, disponibilidade e desempenho
de elos HVdC inseridos no sistema interligado, contribuindo
para a disseminação de conhecimentos e a utilização de
experiências bem sucedidas em projetos futuros.
Foram inscritos cerca de 210 participantes,
representando 46 diferentes empresas ou instituições.
esta diversidade de entidades garantiu um rico debate
entre os principais agentes envolvidos em transmissão
em HVdC. em princípio este seria um evento dirigido
ao público brasileiro. no entanto, foi uma grata surpresa
receber a adesão de diversos participantes de outros
países latino-americanos, e mesmo de países europeus.
originalmente o evento seria realizado no auditório de
Furnas (Botafogo, rio de janeiro), mas por motivo de força
maior nas vésperas do evento, sua realização foi transferida
para o Centro de Convenções da Bolsa do rio, que dispunha
de auditório igualmente confortável. esse imprevisto de
última hora permitiu que todos os inscritos participassem
do evento, mesmo aqueles que estavam em lista de espera,
face à menor capacidade do auditório de Furnas.
Comitê de estudos B4elos de Corrente Contínua e eletrônica de Potência –
promove Workshop sobre desempenho e requisitos deProjetos de elos de Corrente Contínua

8 eleTroeVoluÇão JUNHO 2011
notíCias
o evento foi aberto pelo Coordenador do Ce B4, Sérgio
do espirito Santo (Furnas), juntamente com o Secretário
do Ce B4, Wo Wei Ping (Cepel), e, representando o Cigré-
Brasil, Paulo César esmeraldo (ePe).
Foram realizadas 20 sessões técnicas, entre palestras
e mesas redondas, divididas em 4 blocos, em que
participaram 20 especialistas brasileiros e 5 estrangeiros.
estavam reunidos os mais destacados profissionais
atuantes na área do HVdC no âmbito mundial como
palestrantes e debatedores, dentre os quais vieram do
exterior: andré Canelhas (alstom Grid), dag Soerangr
(Siemens), ji Xiaotong (SGCC-China), nigel Shore (aBB),
Song Shengli (SGCC-China), Victor lescale (aBB). os
demais, que atuam no Brasil, foram: antônio Guarini
(onS), antonio ricardo Carvalho (Cepel), Benjamin
Bijarano (iemadeira), Cesar ribeiro Zani (Furnas), dalton
Brasil (onS), dourival Carvalho jr (ePe), Fernando Cattan
jusan (Furnas), Gabriel doyle (aneel), joão Barros
(Cepel), john Graham (aBB), josé jardini (uSP/j2), luiz
Felipe Willcox (Cepel), manfredo lima (Chesf ), márcio
Szechtman (dual), mario lemes (Siemens), nilo josé
de macedo (Furnas), Paulo Gomes (onS), Paulo César
esmeraldo (ePe), Sérgio do espírito Santo (Furnas).
o workshop foi estruturado em 4 blocos distribuídos ao
longo dos dois dias do evento. o primeiro consistiu de um
bloco introdutório com uma visão panorâmica da aplicação
no Brasil e no mundo, na área do planejamento e operação,
além de temas regulatórios envolvendo o HVdC. o
segundo bloco cobriu assuntos relativos a confiabilidade e
disponibilidade de instalações em HVdC. no terceiro foram
discutidas questões associadas a filtros Ca e CC, flutuações
de tensão e compensação reativa. Por último percorreu-se
os tópicos ligados a desempenho e interação de elos HVdC
com os sistemas interligados. ao final de cada bloco, eram
realizadas mesas-redondas sobre o respectivo tema, o que
permitiu se realizar frutíferas discussões com a expressiva

eleTroeVoluÇão JUNHO 2011 9
participação dos profissionais na platéia.
ao final do primeiro dia, os participantes puderam se
reunir no jantar de confraternização, realizado no restaurante
Porcão rio’s (localizado no Flamengo), que contou com cerca
de 160 presentes, estendendo assim a oportunidade de
travar maiores contatos profissionais e pessoais.
no último dia foram sorteados diversos brindes
para os participantes presentes: 2 netbooks lG, 5 livros
da alstom Grid “HVdC – Connecting to the future”
(oferecimento da alstom Grid), 2 livros do jos arrillaga
(“Flexible Power Transmission: The HVdC options”) e
5 exemplares da Brochura Técnica 001 do Cigré-Brasil
(“interligações HVdC por Conversores com Capacitores
de Comutação (CCC) - GT B4-34”). aliás, este último foi
a primeira brochura produzida pelo Cigré-Brasil, e por
ora a única impressa, resultado de um longo trabalho
produzido pelo GT coordenado pelo joão Barros (Cepel).
Pelos relatos dos participantes ao final do evento,
juntamente com as opiniões manifestadas nas Fichas de
avaliação, o evento atingiu seu objetivo ao disseminar
o conhecimento associado com a tecnologia do HVdC,
atendendo assim as expectativas dos participantes.
neste workshop em particular desejou-se buscar a
experiência nos projetos anteriores e atuais (itaipu e
madeira), para melhorias em futuros empreendimentos
em HVdC. o Ce B4 está convicto de que foi dado mais
um passo para um entendimento mais profundo do
HVdC em geral, e a comunidade envolvida está mais
bem preparada para uma possível transmissão HVdC
associada a usina de Belo monte em especial.
Foram retornadas 71 Fichas de avaliação, com média
geral de 4,3 (máximo de 5).
as apresentações foram disponibilizadas na internet
imediatamente após o evento, e posteriormente, serão
novamente distribuídas num dVd, juntamente com os
vídeos de todas as apresentações técnicas do evento.
Para divulgação, foi criado o website para o evento
- http://www.cigre.org.br/hvdc - através do qual
as inscrições foram realizadas, e onde estão postadas
notícias do mesmo, assim como os registros fotográficos.
notíCias

10 eleTroeVoluÇão JUNHO 2011
notíCias
no período de 28 de março a 1º de abril de 2011
o CiGré-Brasil com muito orgulho e satisfação foi
anfitrião da reunião anual do Comitê Técnico do CiGré.
o Comitê Técnico do CiGré é composto pelos 16
Coordenadores dos Comitês de estudo internacionais
do CiGré, pelo seu Coordenador o engenheiro
Klaus Fröhlich, por representantes do Conselho de
administração, pelo atual Secretário Geral engenheiro
François meslier e pelo Secretário Geral anterior jean
Kowal.
a reunião do Comitê Técnico é de grande
importância para a nossa instituição, pois é nela que
se realiza a Coordenação dos trabalhos dos Comitês
de estudo, definindo estratégias e metas, bem como
aperfeiçoando a geração e o compartilhamento do
conhecimento, pilar básico e maior razão da existência
do CiGré.
a reunião foi realizada no hotel marina na cidade
do rio de janeiro e contou com 23 participantes. no
dia 28 de março foram realizadas visitas técnicas a
usina de itaipu e a subestação de Foz do iguaçu de
Furnas e, no dia 1º de abril, visitas a sede do CiGré-Brasil
a aos laboratórios do Cepel na ilha do Fundão.
adicionalmente o CiGré-Brasil ofereceu um
jantar de confraternização no dia 30 de março e um
jantar seguido de show folclórico no dia 31 de março,
oportunidades essas que encantaram os visitantes com
a tradicional hospitalidade e cordialidade brasileiras.
durante o coquetel de boas vindas realizado no dia
29 de março o CiGré-Brasil, por meio de seu Presidente
o engenheiro josé Henrique machado Fernandes,
entregou ao secretário Geral e ao Coordenador do
Comitê Técnico, placas de agradecimento a essa visita
tão especial.
a visita dos membros do Comitê Técnico a sede
do CiGré-Brasil e ao Cepel contou com a honrosa
participação do engenheiro andré merlin Presidente
do CiGré, o qual foi também homenageado com uma
Comitê Técnico do Cigré realiza excelente reunião no Brasil

eleTroeVoluÇão JUNHO 2011 11
notíCias
placa em agradecimento a sua visita ao Brasil e ao seu
importante apoio às iniciativas do Comitê nacional
Brasileiro.
Por meio dessa visita os participantes puderam
conhecer o nosso escritório central, o nosso quadro
de funcionárias e as inúmeras atividades por nós
desenvolvidas.
Sem dúvida os ilustres visitantes ficaram bem
impressionados e bastante satisfeitos em melhor
conhecerem o trabalho desenvolvido pelo CiGré-
Brasil, tendo manifestado em diversas oportunidades
as respectivas satisfações e reconhecimentos.
Por fim a diretoria do CiGré-Brasil agradece ao
grande apoio recebido dos associados erli Ferreira
Figueiredo e marcio Szechtman, membros do Comitê
organizador da reunião do Comitê Técnico, as
empresas itaipu, Furnas e Cepel, pelas excelentes visitas
técnicas proporcionadas, bem como as funcionárias da
secretaria Flávia e natasha pelo profissionalismo e pela
qualidade do trabalho desenvolvido.
no dia 28 de abril passado, no rio de janeiro,
realizou-se o jantar em homenagem ao novo
Sócio Honorário do CiGré-Brasil, o engenheiro e
Professor josé antonio jardini.
durante o jantar, que contou com a presença
da diretoria executiva, de membros do Conselho
de administração e de Sócios Honorários do
CiGré-Brasil, o nosso Presidente josé Henrique
machado Fernandes, manifestou sua satisfação
pela escolha do professor jardini e aproveitou a
oportunidade para agradecer, em nome do CiGré-
Brasil, os relevantes serviços prestados por ele em
favor de nossa entidade.
na homenagem, o Professor jardini foi
agraciado com o título de Sócio Honorário
recebendo uma placa comemorativa com os
dizeres:
“o CiGré-Brasil, em reconhecimento aos
relevantes serviços prestados pelo engenheiro
joSé anTonio jardini em prol da entidade e do
desenvolvimento da ciência, outorga-lhe o título
de SÓCio HonorÁrio”.
em seguida o homenageado proferiu um
pequeno discurso sobre a sua trajetória de
participação no CiGré, ao longo de sua vida,
ressaltando com grande orgulho e satisfação
a importância de nossa entidade para o seu
desenvolvimento e crescimento profissional,
como também pessoal.
adicionalmente o engenheiro e Professor
jardini ressaltou que “é uma grande satisfação
participar de um grupo de pessoas que tem por
objetivo uma sempre melhor engenharia. o CiGré
nos dá esta oportunidade. Tem sido e continuará a
ser uma grande honra trabalhar com aqueles que
movimentam esta maquina”.
josé antônio jardini éo novo sócio Honorário do Cigré-Brasil

12 eleTroeVoluÇão JUNHO 2011
notíCias
no dia 29 de abril de 2011 foi realizada a 36ª assembléia Geral ordinária do CiGré-Brasil. essa
assembléia marcou o encerramento do mandato da diretoria que conduziu o CiGré-Brasil no período
de março de 2007 a abril de 2011.
nessa assembléia ocorreu também a eleição da diretoria para o período de maio de 2011 a abril de
2015, composta pelos seguintes engenheiros:
• Presidente: Antonio Varejão de Godoy
• 1º Vice-Presidente: Josias Matos de Araújo
• 2º Vice-Presidente: Saulo José Nascimento Cisneiros
• Diretor Financeiro: Antônio Simões Pires
• Diretor Administrativo: Sérgio do Espírito Santo
após o encerramento da assembléia Geral ocorreu a cerimônia de inclusão da foto do Presidente
josé Henrique machado Fernandes na Galeria dos Presidentes.
adicionalmente houve a inauguração da Galeria das diretorias, como uma justa homenagem
àqueles que, de forma voluntária, participaram da diretoria do período 2007 a 2011, e proporcionaram
uma grande contribuição para a disseminação do ideal do CiGré de geração e compartilhamento do
conhecimento no campo da eletricidade, bem como para o engrandecimento do CiGré-Brasil.
direToria do CiGré-BraSil do PerÍodo 2007/2001enCerra mandaTo e noVa direToria é eleiTa

eleTroeVoluÇão JUNHO 2011 13
notíCias
no período de 25 a 27/07/2011 será realizado na cidade de Belém, estado do Pará,
no Teatro maria Sylvia nunes da estação das docas, o ii SiGamT, promoção do
CiGre-BraSil e Cier/BraCier e organização da eletrobras eletronorte.
destinado aos profissionais atuantes nas áreas de gerenciamento de ativos, manutenção e
desempenho do sistema elétrico do segmento de transmissão, ligados às empresas nacionais e
internacionais do setor elétrico. está também aberto a fabricantes, fornecedores, órgãos reguladores,
centros de pesquisas, professores, pesquisadores, estudantes de universidades e outros envolvidos com
o tema.
o ii SiGamT abordará os seguintes temas aplicados ao Segmento Transmissão:
• Gerenciamento de Ativos e de Riscos.
• Novas Tecnologias, Metodologias e Ferramentas aplicadas na Gestão de Ativos.
• Gestão da Manutenção.
• Impactos Ambientais nos Resultados.
• Desempenho do Sistema Elétrico.
o ii SiGamT representa uma excelente oportunidade para a troca de experiências e intercâmbio
técnico-científico entre os participantes nacionais e internacionais, além de permitir o debate do cenário
atual e futuro de gerenciamento de ativos e de riscos e manutenção da transmissão. (aSCom BraCier,
31/05)
ii Seminário internacional de Gerenciamento de ativos,manutenção da Transmissão e desempenho
do Sistema elétrico - SiGamT
25 a 27/julho de 2011 - Belém do Pará - Brasil
Contacto: [email protected]

14 eleTroeVoluÇão JUNHO 2011
artigo B5-101 apresentado na Bienal Paris 2010
System for integration of Protectionand Control devices
Bienal paris 2010
SummARY - CHeSF is one of the largest and most important utilities in Brazil. it is responsible for the generation and transmission of power for nearly 50 million people in northeast Brazil. CHeSF’s power system comprises 97 substations and 18,232 km of transmission lines, 96 % in the levels of 230 and 500 kV, covering approximately 1,200,000 km2. many substations are located far away from the maintenance centers, bringing difficulties when an immediate action is needed in the field. one of the ideas is to decentralize the maintenance process as much as possible. on the other hand, this involves many organizational difficulties as well as high costs.
intelligent electronic devices (ied) have been largely used for a number of applications in the area of Protection, Control and automation. ieds incorporate themselves a number of new features such as the supervision of trip logics and voltage/current analog inputs, therefore contributing for the minimization of hidden failures. new ied features are also important for relay selectivity studies as well as for supervision and post fault analysis.
accessing information from ieds is still difficult. in many situations it is necessary to move specialized personnel to the substations for this purpose causing last minute problems and inconveniences like expenditures not previously planned.
Post fault analysis and improvements in relay coordination studies have been performed using the resources available so far, sometimes leading to incomplete conclusions or even reissuing new analyses.
depending on the situation the response time becomes a very important point of the process of disturbance analysis. it is a requirement as per the rules of the Brazilian Grid Procedures that Power Companies respond promptly, and also provide appropriate documentation regarding disturbances in the power system. usually the most important information comes from the protective devices.
CHeSF has strongly invested on telecommunication infrastructure, linking all its facilities with high capacity data transport, therefore providing basic conditions for the design and the implementation of the System for integration of Protection and Control devices, which will give support to the maintenance and operation of the power transmission system.
This article describes the characteristics of the solution being implemented by CHeSF, which aims to integrate all ieds by providing suitable conditions for remote access of fault data and parameterization. incorporating new features of investigation and supervision, the basic principle of this System is to provide greater flexibility to the maintenance and disturbance analysis teams.
kEYWORDS - ied, protection, disturbance analysis, database, ComTrade, integration, WeB, intranet, protection devices.
G.A. ARRUDAJ.F. MESQUITAI.P. SIQUEIRA
J.C. LIMAS.G. CAUPONI
Companhia Hidro elétrica do são Francisco - CHesF

eleTroeVoluÇão JUNHO 2011 15
downloading or changing of parameters in the ied. other modules provide the following features:
storage data of protection and control devices, database management, lists of alarms and events, System administration, and SmS and email messages.
2.0 SYSTem arCHiTeCTure
The System for integration of Protection and Control devices consists of three distinct blocks, installed at the Central Station (recife), regional Stations (Salvador, maceió, Sobradinho, recife, Fortaleza and Teresina) and local Stations (substations).
each local Station (Figure 1) has a Concentrator, installed with hardware and configuration compatible to an industrial PC, for communication with various Terminal Servers, which in turn communicate with a maximum of 20 ieds. Galvanic isolation and electric/optical converters are included. The Terminal Server is installed preferably in the same physical location of the devices being monitored (relay houses or control room). The Concentrator and Terminal Server are connected to the same substation local area network (ethernet). Software, specific to each manufacturer is installed in the Concentrator with proprietary protocols for communication with all devices being monitored.
Figure 1
The firewall installed as a gateway for the local network is implemented through hardware (industrial PC), running the application under linux, and free to migrate to other operational systems but also having tools that facilitate the manipulation of rules.
1.0 SoluTion
The main purpose of the System for integration of Protection and Control devices is to provide a way for remotely communicate with protection devices, so that data will be collected and used for various purposes such as disturbance analysis and post fault evaluation of relay performance. The possibility of changing settings remotely without the onus of sending a crew to the field is another plus. additionally, the System provides alternative tools for the maintenance such as high definition video transmission data, allowing, when required, video conferences and more detailed discussions. The System incorporates other features like ambient information of temperature and humidity at the relay houses and outside cubicles, making it possible to monitor the environmental conditions to which most important protection and control devices are submitted.
By the time of its conception, four years ago, this project was unique in Brazil. recently, a similar idea has been reported by another Brazilian utility.
Considering the variety of ieds the System has the ability to communicate with all of them despite the different protocols and access modes provided by the manufactures.
developed under WeB functionality, the System provides data already collected for viewing from any workstation connected to the intranet with the possibility of being integrated with the internet in the near future. These features incorporate the best techniques for information protection such as user authentication, VPn, Firewall, etc.
The System has an automatic module for collection of oscillography and internal events from ieds, using mechanisms for monitoring and alarming, pointing out possible inconsistencies on the collected data or communication failures.
Through the Search module, using WeB interface, one can view collected data for the preparation of graphs, statistics and other reports.
There is also the Parameter audit module, which is used by the maintenance teams as a supporting tool, which automatically performs a comparison between the internal parameters of the ied and the order of production issued by the protection engineer. This action can be performed after every
Bienal paris 2010
16 eleTroeVoluÇão JUNHO 2011
3.0 FunCTional deSCriPTion oF THe SYSTem
The System for integration of Protection and Control devices provides information collected from substations in a centralized fashion and offers several features for supervision, where the main ones are described below:
AuTOmATIC DATA COLLECTION mODuLE
This module is responsible for the automatic collection of oscillography, list of events and parameterization of the devices being monitored and environmental information (temperature and humidity) of relay houses. The set of applications is installed in the local Concentrator computer, making use of specific software from the manufacturers of the ieds.
The automatic communication with the ieds is accomplished through a script (“robot-software”) that automatically opens the communication software and send commands (sequence of clicks) to perform the desired action. a command for an automatic data collection may be performed by a scheduled scan or by an immediate request from the ied right after its operation, indicating the existence of new events.
oscillography is converted to the ieee ComTrade format and then sent to the Central Station. The events are available in the form of text file or CSV (Comma Separated Values) and then sent to the Central Station. The parameterization is provided in the form of text file for use in the audit module and also as proprietary file format. Temperature and humidity data are available in spreadsheet format, which allow for the creation of graphs and statistics to monitor the environment where ieds are installed.
all data collected from the ieds are sent to the Central Station via a FTP server installed locally.
AuDIT mODuLE
This module runs at the Central Station and aims to compare parameters of the devices being supervised with the official orders of Production (ied settings) stored in the database server. if differences occur, an alarm message is sent to a pre-defined list of people. as a result, a text file is displayed pointing out the differences one by one.
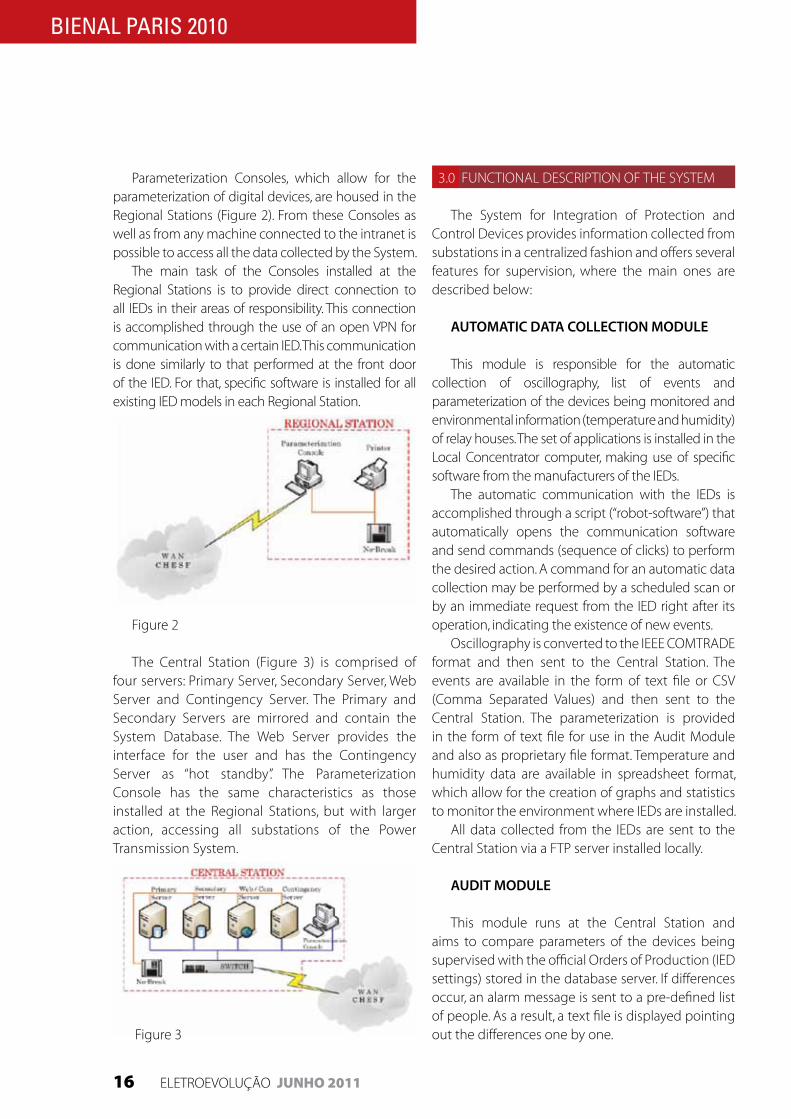
Parameterization Consoles, which allow for the parameterization of digital devices, are housed in the regional Stations (Figure 2). From these Consoles as well as from any machine connected to the intranet is possible to access all the data collected by the System.
The main task of the Consoles installed at the regional Stations is to provide direct connection to all ieds in their areas of responsibility. This connection is accomplished through the use of an open VPn for communication with a certain ied. This communication is done similarly to that performed at the front door of the ied. For that, specific software is installed for all existing ied models in each regional Station.
Figure 2
The Central Station (Figure 3) is comprised of four servers: Primary Server, Secondary Server, Web Server and Contingency Server. The Primary and Secondary Servers are mirrored and contain the System database. The Web Server provides the interface for the user and has the Contingency Server as “hot standby”. The Parameterization Console has the same characteristics as those installed at the regional Stations, but with larger action, accessing all substations of the Power Transmission System.
Figure 3
Bienal paris 2010

eleTroeVoluÇão JUNHO 2011 17
Prompt responses required by society regarding disturbance analysis and difficulties of accessing records from ieds prevented us not to use such information in a number of situations, consequently leading to incomplete reports and making it difficult to visualize improvements on the protection practices, setting calculation studies and new functions that could be implemented on these devices.
moreover, the possibility to access ieds remotely has contributed for the speed of action of the maintenance crews during programmed or urgent interventions, especially for distant substations from the maintenance centers.
a new feature that has been incorporated to the System is the ability to provide live images from the relay houses, allowing conditions for long distance conferences during maintenance.
The System for integration of Protection and Control devices became an important tool for diagnosing protection performance during disturbances in the Power Transmission System and also for offering tools to optimize the work performed by the maintenance crews.
5.0 BiBlioGraPHY
[1]Sistema de integração de dispositivos de Proteção, Controle e regulação (Viii STPC, rio de janeiro, Brazil, 2005)
[2] Sistema de integração de dispositivos de Proteção e Controle (Seminário aPTel, rio de janeiro, Brazil, 2009)
vIDEO TRANSmISSION SYSTEm
The System for integration of Protection and Control devices incorporates features for video transmission with the primary goal of supporting the maintenance crews in the field so that images may be used in real time for discussions and technical definitions. image transmission uses a private communication network that allows limiting the bandwidth used, thus avoiding the collapse of the telecommunication systems.
4.0 ConCluSionS
The System for integration of Protection and Control devices is designed to help the maintenance crews and the disturbance analysis team, allowing them to access and to use data from the ieds, thanks to the development of digital technology. Fault data (oscillography and events) and environmental data (temperature and humidity) will be available in a centralized fashion. also periodic audits on the parameterization files will be performed
The primary function is to access devices, providing in a centralized fashion, fault data (oscillography and events), environmental information and parameter files audit.
The architecture of the System (Figure 4) provides various forms of supervision of the process and operation not yet fully explored. Currently the System integrates 41 substations comprising about 1000 ieds but is still growing due to new ieds that will be incorporated into the power stations as a result of an on going process of retrofit and also by a continued growth in the power sector.
Figure 4 - architecture
Bienal paris 2010

18 eleTroeVoluÇão JUNHO 2011
Bienal paris 2010
F. CÂMARA NETOFUrnas Centrais elétricas
s.a., rio de Janeiro
M.TH. SCHILLINGFluminense Federal University
– UFF, niterói
A.M. LEITE DA SILVAFederal University of itajubá –
UniFei, itajubá
M.A.N. SILVEIRAempresa de pesquisa
energética – epe, rio de Janeiro
A.M. REICentro de pesquisas de
energia elétrica – Cepel, rio de Janeiro
artigo a1-301 apresentado na Bienal Paris 2010
on uncertainties of reliability indices
Bienal paris 2010
SummARY - This paper provides means for overcoming difficulties in the conceptual interpretation of the reliability indices originated from typical probabilistic adequacy analyses of transmission power systems. initially, one lists a set of factors that contributes for producing significant statistic magnitudes of numerical values. Then, a referential paradigm is obtained for the Brazilian Power System, according the methodology used in several companies in Brazil. Taking as a reference the obtained standard, a series of experiments are carried out, obtaining the variation range of the severity index and a set of other traditional indices used in reliability analysis.
kEYWORDS - adequacy analysis, Planning criteria, reliability indices, risk analysis, Transmission reliability, uncertainty and variability.
1. 0 inTroduCTion
The recent restructuring of the Brazilian electrical energy sector, aimed at stimulating competition between companies, was possible due to the introduction of a free market, thus allowing the negotiation of the price of purchase and sale of electric energy. The main goal of this new approach is to assure the supply of the best quality electric energy for society at the lowest cost. By following this new model, the governmental agencies responsible for planning and operating the Brazilian Power System (BPS) should be able to meet the increasing demand of energy by always seeking inexpensive alternatives without risking system security.
in order to achieve this goal, it is important to define the necessary conditions for an acceptable electric performance. The Brazilian electric sector, so far, has been using the deterministic criteria “n-1” as reference. This criterion forces the system to keep up with the demand by ensuring the limits of suitable loading and voltage, in case of sudden loss of equipment. The BPS, however, does not fully follow this deterministic criterion. a very costly investment would be necessary to do so. in order to exemplify this situation, it was verified that the extent of adherence to the criterion “n-1” is around 90%. it means that 10% of all single contingencies in the transmission network could suffer violations. The conventional deterministic analysis suggests that the generators, transmission lines, and transformers should be associated with probabilities one or zero that represent failure state or normal operation. This consideration helps to identify a failure state, which could bring catastrophic consequences to the system. However, the probability of its occurrence would be very low, resulting, therefore, in an acceptable risk level. on the other hand, for much less severe failures, but with high probability of occurrence, the risk level might be unacceptable for customers. in both cases, the conventional deterministic analysis ignores the risk concept, resulting in unnecessarily expensive or even unsafe solutions.
The search for an efficient, secure, and inexpensive operational system requires an adequate treatment for the reliability analysis. Based on the
eleTroeVoluÇão JUNHO 2011 19
Bienal paris 2010
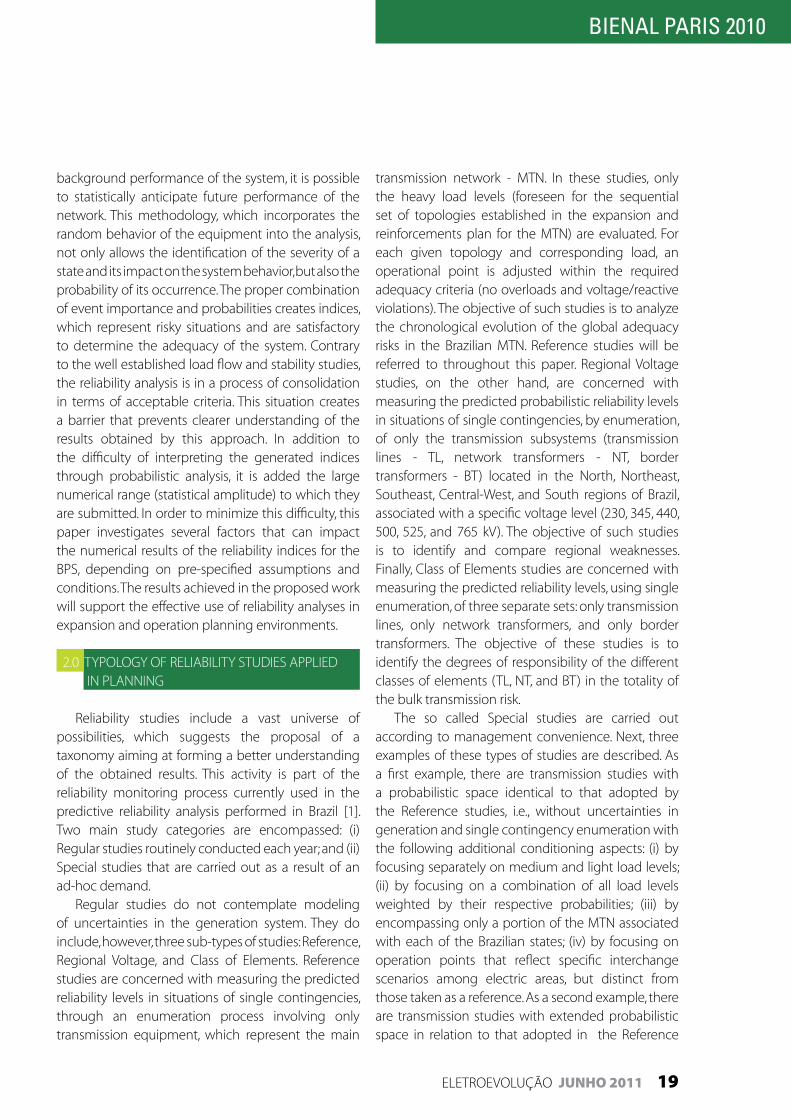
transmission network - mTn. in these studies, only the heavy load levels (foreseen for the sequential set of topologies established in the expansion and reinforcements plan for the mTn) are evaluated. For each given topology and corresponding load, an operational point is adjusted within the required adequacy criteria (no overloads and voltage/reactive violations). The objective of such studies is to analyze the chronological evolution of the global adequacy risks in the Brazilian mTn. reference studies will be referred to throughout this paper. regional Voltage studies, on the other hand, are concerned with measuring the predicted probabilistic reliability levels in situations of single contingencies, by enumeration, of only the transmission subsystems (transmission lines - Tl, network transformers - nT, border transformers - BT) located in the north, northeast, Southeast, Central-West, and South regions of Brazil, associated with a specific voltage level (230, 345, 440, 500, 525, and 765 kV). The objective of such studies is to identify and compare regional weaknesses. Finally, Class of elements studies are concerned with measuring the predicted reliability levels, using single enumeration, of three separate sets: only transmission lines, only network transformers, and only border transformers. The objective of these studies is to identify the degrees of responsibility of the different classes of elements (Tl, nT, and BT) in the totality of the bulk transmission risk.
The so called Special studies are carried out according to management convenience. next, three examples of these types of studies are described. as a first example, there are transmission studies with a probabilistic space identical to that adopted by the reference studies, i.e., without uncertainties in generation and single contingency enumeration with the following additional conditioning aspects: (i) by focusing separately on medium and light load levels; (ii) by focusing on a combination of all load levels weighted by their respective probabilities; (iii) by encompassing only a portion of the mTn associated with each of the Brazilian states; (iv) by focusing on operation points that reflect specific interchange scenarios among electric areas, but distinct from those taken as a reference. as a second example, there are transmission studies with extended probabilistic space in relation to that adopted in the reference
background performance of the system, it is possible to statistically anticipate future performance of the network. This methodology, which incorporates the random behavior of the equipment into the analysis, not only allows the identification of the severity of a state and its impact on the system behavior, but also the probability of its occurrence. The proper combination of event importance and probabilities creates indices, which represent risky situations and are satisfactory to determine the adequacy of the system. Contrary to the well established load flow and stability studies, the reliability analysis is in a process of consolidation in terms of acceptable criteria. This situation creates a barrier that prevents clearer understanding of the results obtained by this approach. in addition to the difficulty of interpreting the generated indices through probabilistic analysis, it is added the large numerical range (statistical amplitude) to which they are submitted. in order to minimize this difficulty, this paper investigates several factors that can impact the numerical results of the reliability indices for the BPS, depending on pre-specified assumptions and conditions. The results achieved in the proposed work will support the effective use of reliability analyses in expansion and operation planning environments.
2.0 TYPoloGY oF reliaBiliTY STudieS aPPlied in PlanninG
reliability studies include a vast universe of possibilities, which suggests the proposal of a taxonomy aiming at forming a better understanding of the obtained results. This activity is part of the reliability monitoring process currently used in the predictive reliability analysis performed in Brazil [1]. Two main study categories are encompassed: (i) regular studies routinely conducted each year; and (ii) Special studies that are carried out as a result of an ad-hoc demand.
regular studies do not contemplate modeling of uncertainties in the generation system. They do include, however, three sub-types of studies: reference, regional Voltage, and Class of elements. reference studies are concerned with measuring the predicted reliability levels in situations of single contingencies, through an enumeration process involving only transmission equipment, which represent the main

20 eleTroeVoluÇão JUNHO 2011
Bienal paris 2010
spatial aggregations such as loss of load probability (lolP), expected power or demand not supplied (ePnS), and loss of load frequency (lolF). additional secondary indices such as expected energy not supplied (eenS), loss of load expectation (lole), and loss of load duration (lold) are obtained as well. The system problem probability index (SPP) is the direct result of accounting for occurring failure modes, before the application of remedial measures. it is also quite common to use an approximate calculation of interruption costs associated with the expected energy not supplied.
4. 0 FaCTorS aFFeCTinG reliaBiliTY indiCeS
The numerical values of reliability indices are mainly affected by the following aspects: (i) modeling hypotheses, (ii) statistical data uncertainties, and (iii) numerical algorithms and computational procedures. This section will address only the reference studies.
4.1 modeling of primary energy sources and generation
in Brazil, the influence of primary hydraulic energy sources in reliability studies may be taken into account by defining suitable probabilities to different possible dispatch scenarios. However, in the reference studies previously mentioned, an initial base-case dispatch is conveniently adjusted, between the lowest and highest limits allowed for each generating unit, in order to eliminate reliability base-case violations. This dispatch is set with unitary probability. in this perspective, primary hydraulic sources do not contribute to state-space probabilistic values used in the reference study. When the influence of energy sources uncertainties is explicitly considered, the analysis falls into the Special studies category. in the reference study, generation uncertainties are ignored. Therefore, even though represented in its totality, the generation system does not contribute to the probabilistic state-space. Therefore, each generator unit is deterministically represented in an individualized manner. The static compensators are similarly treated.
4.2 modeling of network topologyProbabilistic modeling of topology may include
representation of nodes (i.e. substations) and
studies, without uncertainties in generation and with the following additional conditioning aspects: (i) by representing non-mTn uncertainties – a portion of the topology that is not considered to be part of the mTn – (these evaluations are conducted by single enumeration of all the state-space and also separately, discriminated by segments that are the mTn and the non-mTn); (ii) same as the previous one but selecting states by monte Carlo simulation (mCS); (iii) by representing the uncertainties only in the non-mTn (single enumeration); (iv) same as (iii) but using mCS. Finally, as a third example, there are special studies with extended probabilistic space in relation to that adopted in the reference studies, but including uncertainties in generation equipment, i.e. the classical composite reliability: (i) by considering both mTn and generation system uncertainties, one full system single enumeration and two partial enumerations, the first one detailing only the mTn and the other one focusing only on generation stations; (ii) same as (i) but using a mCS; (iii) by considering uncertainties in both the main and non-main transmission network plus the generation system (one full system single enumeration and three additional partial enumerations detailing main transmission, non-main transmission, and the generation); (iv) same as (iii) but using mCS.
3. 0 Failure modeS and reliaBiliTY indiCeS
Currently, probabilistic reliability studies performed in Brazil consider only two kinds of failure modes: (i) continuity and (ii) adequacy. The first one is recognized as the nonexistence of voltage at measuring points, lack of supply continuity, the formation of islands, the presence of generation deficits, etc. The second one indicates the occurrence of overloads in circuits, voltage violations, violations of reactive power generation limits, violations of active power at swing buses, violations of maximum allowable interchange limits between areas, etc. Security failure modes [2], associated with dynamic phenomenon, have not yet been treated on a regular basis by Brazilian companies.
Severity (SeV) measured in system-minutes [3-5] is one of the most popular probabilistic reliability indices used by companies in Brazil. other traditional primary indices are also calculated under various
eleTroeVoluÇão JUNHO 2011 21
Bienal paris 2010
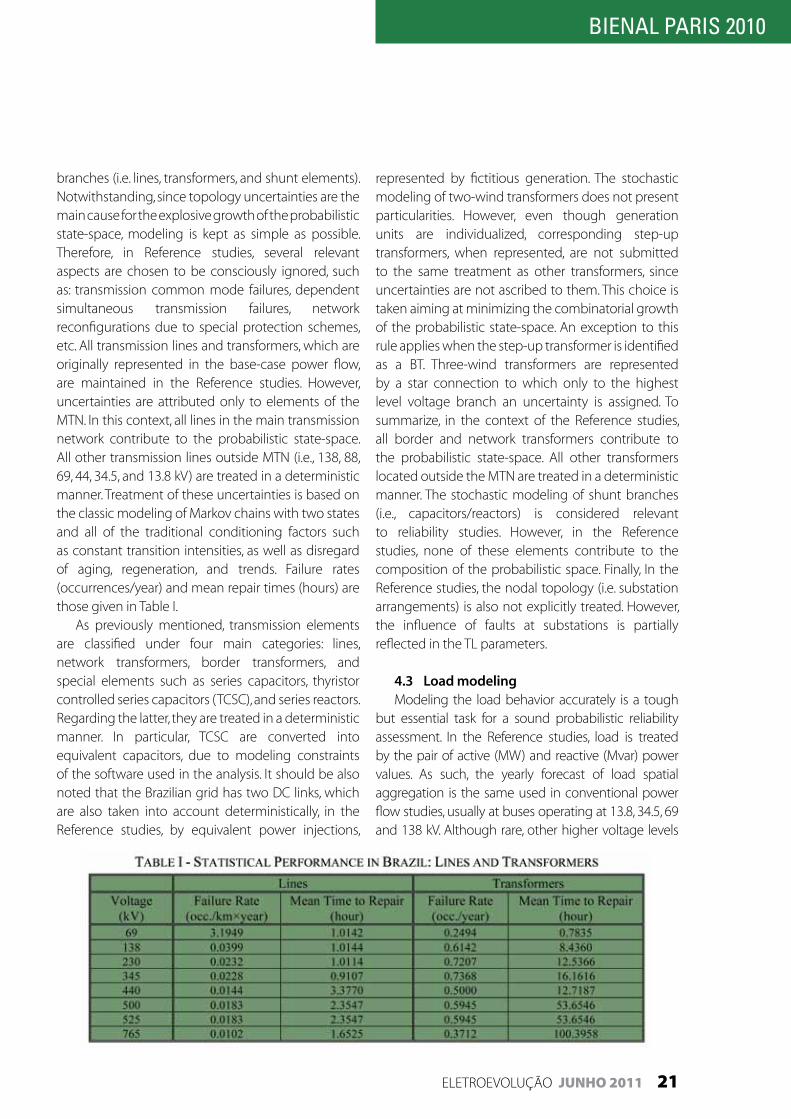
branches (i.e. lines, transformers, and shunt elements). notwithstanding, since topology uncertainties are the main cause for the explosive growth of the probabilistic state-space, modeling is kept as simple as possible. Therefore, in reference studies, several relevant aspects are chosen to be consciously ignored, such as: transmission common mode failures, dependent simultaneous transmission failures, network reconfigurations due to special protection schemes, etc. all transmission lines and transformers, which are originally represented in the base-case power flow, are maintained in the reference studies. However, uncertainties are attributed only to elements of the mTn. in this context, all lines in the main transmission network contribute to the probabilistic state-space. all other transmission lines outside mTn (i.e., 138, 88, 69, 44, 34.5, and 13.8 kV) are treated in a deterministic manner. Treatment of these uncertainties is based on the classic modeling of markov chains with two states and all of the traditional conditioning factors such as constant transition intensities, as well as disregard of aging, regeneration, and trends. Failure rates (occurrences/year) and mean repair times (hours) are those given in Table i.
as previously mentioned, transmission elements are classified under four main categories: lines, network transformers, border transformers, and special elements such as series capacitors, thyristor controlled series capacitors (TCSC), and series reactors. regarding the latter, they are treated in a deterministic manner. in particular, TCSC are converted into equivalent capacitors, due to modeling constraints of the software used in the analysis. it should be also noted that the Brazilian grid has two dC links, which are also taken into account deterministically, in the reference studies, by equivalent power injections,
represented by fictitious generation. The stochastic modeling of two-wind transformers does not present particularities. However, even though generation units are individualized, corresponding step-up transformers, when represented, are not submitted to the same treatment as other transformers, since uncertainties are not ascribed to them. This choice is taken aiming at minimizing the combinatorial growth of the probabilistic state-space. an exception to this rule applies when the step-up transformer is identified as a BT. Three-wind transformers are represented by a star connection to which only to the highest level voltage branch an uncertainty is assigned. To summarize, in the context of the reference studies, all border and network transformers contribute to the probabilistic state-space. all other transformers located outside the mTn are treated in a deterministic manner. The stochastic modeling of shunt branches (i.e., capacitors/reactors) is considered relevant to reliability studies. However, in the reference studies, none of these elements contribute to the composition of the probabilistic space. Finally, in the reference studies, the nodal topology (i.e. substation arrangements) is also not explicitly treated. However, the influence of faults at substations is partially reflected in the Tl parameters.
4.3 Load modelingmodeling the load behavior accurately is a tough
but essential task for a sound probabilistic reliability assessment. in the reference studies, load is treated by the pair of active (mW) and reactive (mvar) power values. as such, the yearly forecast of load spatial aggregation is the same used in conventional power flow studies, usually at buses operating at 13.8, 34.5, 69 and 138 kV. although rare, other higher voltage levels

22 eleTroeVoluÇão JUNHO 2011
Bienal paris 2010
also have load connections, which may be of a special kind or representing major consumers. For the purpose of adequacy assessment, the great majority of loads in the Brazilian system are modeled as constant power. However, some loads in the north and northeast regions require the use of functional voltage modeling (otherwise power flows will diverge). usually, the annual load curve is chronologically specified in clusters representing heavy, medium, and light load levels. This approach makes it viable the counting of frequencies and durations of each level. This treatment also allows the use of markovian models for the chronological load behavior. Finally, it is worth emphasizing that in the reference studies, heavy load levels are modeled deterministically or, in other words, load does not contribute to the construction of the probabilistic state-space. as previously mentioned, the full probabilistic treatment of load is considered as a Special study.
4.4 modeling of operative practices Further aspects associated with the operation
of power systems are recognizably pertinent to the evaluation of probabilistic reliability; i.e. maintenance modeling, transformation reserve, rotating reserve, special protection schemes, topological reconfigurations such as the sectioning of buses, etc. among these aspects, only transmission line and transformer capacities are considered in the reference studies conducted for the Brazilian system. Therefore, data about mVa values defining long- and short-term load carrying capacities, for both lines and transformers, are duly required.
4.5 Representation of uncertaintiesin reference studies, as well as most of Special
studies, the technique adopted for obtaining Brazilian transmission lines failure rates is based on the estimation of their lengths, combined with values from Table i. The estimation of the approximate length l of transmission lines is based on the equation l = 7.8 (X×B)1/2, where X represents the line reactance in % and B represents the line susceptance in mvar. This artifice produces good results, except in the case where underground cables are being considered. However, very few cables are present in the Brazilian mTn. regarding transformers, the failure rate refers to the equipment highest voltage and to the concept of local transformation function (this means it does not reflect the performance of each equipment, but the local performance). This approach is adopted in order to circumvent the problem caused by usual transformers displacements, which are defined by the prevailing maintenance strategies. as previously mentioned, in a reference study, uncertainties for generators are not considered. However, for the traditional composite transmission/generation reliability studies previously mentioned, data from Table ii is used.
4.6 Procedures for obtaining the reliability base-case
The reliability base-case should be individually obtained for each load level. Suitable switching of control equipments (i.e. shunt capacitors/reactors) is one of the essential conditions for a successful

eleTroeVoluÇão JUNHO 2011 23
Bienal paris 2010
simulation. To obtain a reliability case-base in a reference study, adequacy is the only relevant failure mode. normal limits, both for voltages and circuit loadings, should be monitored at this stage. loadings are measured as current values. The continuity failure mode is not relevant at this point, because the base-case does not consider contingencies of any kind. in order to eliminate base-case existing violations, both active and reactive power re-dispatching are allowed, observing the generators actual upper and lower limits, except at thermal plants, small hydro plants, and the two existing nuclear power plants, where the dispatch is fixed and identical to the initial power flow. equally allowed are variations from transformers on line tap changers, also respecting their limits. Finally, as a last resort to eliminate violations, a minimum load curtailment is applied, calculated through an optimal power flow (oPF) algorithm based on interior point techniques. owing to this procedure, the reliability indices of the reference studies may be associated to an operating condition, which is distinct from that one obtained with the original power flow tool. However, when there are no violations in the original power flow, it can be rightly accepted as a reliability base-case, without any further change. a detailed step-by-step description about this aspect will be given next. it is necessary to comment first about two concepts related with the nature of electrical areas. Control regions or regions of influence are a reference to the system regions or areas whose resources are used to eliminate violations. monitored regions or regions of interest refer to the system regions or areas whose specific performances should be monitored, including circuit loadings, bus voltages, and active and reactive power produced by generators. Performances outside these regions are not accounted for, as they may present violations that are not identified and consequently will not be eliminated. Therefore, reliability indices are accounted for only for load curtailments in buses that belong to the monitored regions. The procedure adopted in Brazil considers that this region of interest will be always a sub-region of the control region. it should be mentioned that, if the monitored region is taken as smaller region than the control region, bus load shedding outside the monitored region will not be accounted for in the calculation of reliability indices. in Brazil, this problem is
overcome by forcing the coincidence of both control and monitored regions. Therefore, in the reference studies, all areas of the Brazilian electrical system are called to act simultaneously as both control and monitored regions.
The system under analysis must be initially submitted to a traditional newton-raphson load flow evaluation, with all controls activated. in the hypothesis of obtaining a solution without violations, this result will be considered as the reliability base-case. if, however, voltage or load violations or violations of generation limits are observed, the following actions should be taken in the such preferential order: (a) adjustments in the power flow base-case should be made in order to manually eliminate all existing violations (this action is based solely on the analyst’s experience); (b) when the above-mentioned operation is not successful, violations should be tentatively eliminated using an oPF algorithm set to minimize any load shedding (the solution eventually obtained must be submitted to a validation criterion – currently, a solution is considered valid if the amount of load shedding does not exceed 0.5% of the system total load); (c) in extreme situations, when the previous action (b) demonstrates to be incapable of supplying an adequate solution, a progressive relaxation of circuits loading and voltage restrictions are allowed. at this stage, monitoring is conducted using the normal loading limits (from an electric current point of view) for transformers and transmission lines and, normal voltages for buses carrying loads, and active/reactive generation limits of the swing buses.
4.7Composition of the probabilistic state-space
it is well known that the composition of the probabilistic state-space heavily influences the values of reliability indices. This means that reliability indices are worthless unless the state-space is strictly defined. in the reference studies conducted in the Brazilian system, the probabilistic state-space is composed by the set of all aC Tl in the main transmission network (at this time, dC links are still treated deterministically), as well as all BT and nT. a state-space distinct from this configuration characterizes a need for a Special study, which is performed only by specific demand.

24 eleTroeVoluÇão JUNHO 2011
Bienal paris 2010
studies, only reactive power re-dispatching is allowed (active power re-dispatching is inhibited). Variations of transformers derivations, voltage adjustments in controlled buses and, as a last resort, minimum load shedding, calculated through an optimal power flow algorithm, are also considered. Currently, interconnection power flows are not treated as control variables;
• Concerning control and monitored regions: in the reference study, similarly to the preprocessing stage, all electric system areas are treated as both control and monitored regions;
• Concerning state-space analysis validation: in the reference study, the state-space analysis is considered to be validated if a maximum of up to 3% of all contingencies on the pre-defined list are unable to attain convergence when processed through the optimum power flow algorithm. This threshold was defined based on practical experience with the Brazilian system.
(c) reliability indices evaluation: all states, where it was necessary to use remedial measures to eliminate failure modes, contribute to the evaluated reliability indices. in the reference study, tolerance adopted for the enumeration process (in double precision) is equal to 1.0 e-36 pu. all reliability indices are presented with two significant decimals. details related with the computational tool currently used in Brazil are given in [6].
5. 0 eValuaTinG reliaBiliTY indeX unCerTainTieS
The Brazilian iSo has adopted the severity (i.e. system minutes) index as a reference for diagnosing predictive probabilistic risks in the mTn. Severity [1] is a normalized index, given by the ratio of eenS (mWh/year) by the system peak load (mW), with the result converted into minutes per year. Taking into consideration the set of premises and procedures previously described, the Brazilian power system was evaluated from a base case with monthly horizon, which reproduces more accurately the actual load and configuration of the system. in this work, the month of april of 2009 is chosen. The reference risk paradigm, identified as Case 1 in Table 3, is obtained through the enumeration of single contingencies of the mTn, without the re-dispatching of active power,
4.8 Numerical reliability evaluationaccording to the procedure adopted by the
Brazilian independent system operator (iSo), the evaluation of reliability requires the existence of a power flow base-case, converged and without violations. This is the so-called reliability base-case, obtained in the pre-processing stage, as previously mentioned. Conceptually speaking, the reliability calculation is made up of three traditional steps whose characteristics, adapted to the Brazilian system, are commented as follows:
(a) Selection of system states: in a reference study, the selection is made by the enumeration of a list of contingencies in Tl, nT, and BT that coincides exactly with the probabilistic state-space as previously defined (1717 branches). in special evaluations, when the selection of states is conducted through the mCS technique, the following guidelines should be observed: (i) number of samples of 100,000 (single lot); (ii) Tolerance (coefficient of variation) associated with lolP and ePnS indices: 3%; (iii) use of a standard initial seed – this is required so that all simulations can be reproduced.
(b) analysis of selected states: each selected state must be checked for the occurrence of any kind of failure mode. in their absence, the corresponding state is classified as a success state; otherwise it is classified as a failure state. in this last case, efforts are made to eliminate the failure through remedial measures, which are part of the operational resources of the electric system. The guidelines adopted in Brazil for this stage of the analysis are mentioned as follows:
• Concerning occurring failure modes: in Reference studies, failure modes are related to continuity, focused on the formation of islands and power deficits and adequacy, which includes violation of emergency limits allowed for voltages and violation of the normal limits allowed for lines and transformers loading, from the point of view of the current flow. up to quite recently, in Brazil, monitoring normal loading limits, in contingency situations, was justified not only because of legal issues as well as because of an intentional purpose of planning the system considering an operational maneuver margin. However, due to the increasing operational hurdles, this practice may soon change;
• Concerning remedial measures: in Reference

eleTroeVoluÇão JUNHO 2011 25
Bienal paris 2010
monitoring of the apparent power over the normal loading limit. on the other hand, in Case 12 (22.57 min.), one can notice the gain obtained with the monitoring of the apparent power over the emergency loading limit. in these examples, one can see that the severity index of the system can be reduced by 35% to 42% due to monitoring.
5.4 uncertainties due to state-space truncation
in Case 13 (185.03 min.), operational states are selected through non-sequential mCS technique which allows the simulation of multiple contingencies according to their probabilities of occurrence. one notices that the obtained result in this particular situation is 4.77 times greater than the result as an outcome of a single enumeration (Case 1: 38.80 min.).
5.5 Other analysisCase 14 (19.79 min.) is the reproduction of Case 12
with the addition of the re-dispatch of active power to the list of corrective measures, that is, all factors that contribute for the reduction of the severity index in the system are taken into consideration.
as the non-sequential mCS technique is not considered as regular study, despite its importance and efficiency, some results will be briefly presented to verify the sensitivity of the severity index in comparison to Case 13 (185.03 min.). in Case 15 (184.30 min.), the length of the transmission lines was estimated based on typical reactance values. Case 16 (104.30 min.) reflects the addition of re-dispatch of active power to the list of corrective measures. in Case 17 (118.00 min.), the flow is monitored by the apparent power over the loading emergency limit. in Case 18 (100.87 min.), the flow is monitored by the apparent power over the loading emergency limit with the addition of active power re-dispatch to the list of corrective measures.
6. 0 ConCluSion
The results presented in this work confirm that, as a function of the modeling premises, uncertainties representation, and assessment tools, the reliability indices have their magnitudes strongly influenced. Some of the uncertainties treated in this work have indeed inherent stochastic characteristics (e.g.,
only monitoring the normal active power limits of the transmission branches and the emergency limits of the bus voltage magnitudes under the heavy load regime of analysis. Thus, the severity index of the reference simulation is 38.80 minutes per year (see Table iii), considering a peak load of 66.15 GW.
5.1 uncertainties due to parameter effectsin Case 2, it is noticed the influence of input
parameter modeling in the assessment of system performance. as it can be seen in Table iii, the variation in the lines failure rate, given by the estimated length based on the average reactance values by voltage level, has reduced the severity index to 25.51 minutes. This case illustrates how sensitive the reliability indices are in respect to failure rates of the system. Case 1 is indeed more real and accurate than Case 2.
5.2 uncertainties due to remedial measuresCases 3 to 9 illustrate the influence of the inhibitions
of different corrective measures: optimization of the active power dispatch (P), optimization of the tap positioning (T), and optimization of the generation voltage profile (V). While Case 1 (P: 38.80 min) had only the active power re-dispatch inhibited, cases 3 (V: 21.15 min) and 4 (T: 22.84 min) had the inhibition of optimization of the generation voltage profile and of tapes positioning, respectively. Cases 5 (P, V: 24.50 min), 6 (P, T: 60.48 min), and 7 (V, T: 27.76 min) illustrated double inhibition situations, noticing the expected degradation of the severity index. Case 8 (P, V, T: 102.42 min) showed the extreme situation, without any corrective measures. Case 9 (20.36 min) showed the other extreme in which all corrective measures were called upon to act. The difference between the results of cases 8 and 9 indicates the margin of operational maneuvering available in the system. Since in Case 5 the total of operative states withdrawn from the statistics exceeded 3%, this result should be casted aside.
5.3 uncertainties due to monitoring practicesThe use of the emergency transmission loading
capacity gives the system a considerable reduction in the severity index, according to what was verified in Case 10 (25.34 min). another important reserve to be used, highlighted in Case 11 (26.70 min), is the

26 eleTroeVoluÇão JUNHO 2011
Bienal paris 2010
behavior of the transmission system, the state enumeration technique has great limitations since it evaluates only single contingencies for the Brazilian system, given that the computational effort for the simulation of high order contingencies is too high. on the other hand, through the non-sequential monte Carlo simulation method, it becomes possible to select the operative states by sampling. Thus, it is possible to assess the real behavior of the system when facing possible multiple contingencies. Therefore, it is suggested that the results arising from the enumeration technique be used only to assess the “n-1” adequacy of the system. This procedure provides a quantification of the percentage of single contingencies that may cause load shedding.
Finally, bearing in mind all assumptions and modeling aspects, the proper interpretation of the results produced by reliability assessment studies is the major task for power systems analysts. Therefore, expansion, operation, and maintenance planning criteria have to be carefully designed by planners and engineers in order to provide adequate decisions.
equipment unavailability), others could be classified as sources of variability (e.g., the use or not of re-dispatching function). in the paper, however, they were all called as uncertainties.
in relation to the modeling of the power network, the length estimation method for transmission lines, as a function of the typical reactance (Case 2), caused a significant difference in relation to the reference value (Case 1). This is an important alert about the concern that one must have in relation to input parameter accuracy in reliability assessment studies. The results were very similar when active power re-dispatching was allowed (Case 9), if compared to the monitoring of apparent power under the emergency limit (Case 12). The combination of these premises did not produce significant difference (Case 14), and, therefore, the respective practices are equivalent. one suggests, thus, that the monitoring of the flow be performed by the apparent power under the emergency limit so the system can be assessed with the same precision as the traditional power flow studies.
For allowing only part of the real stochastic

eleTroeVoluÇão JUNHO 2011 27
Bienal paris 2010
7.0 BiBlioGraPHY
[1] m.Th. Schilling, j.C.S. Souza, m.B. Coutto Filho, “Power system probabilistic reliability assessment: current procedures in Brazil” (ieee Trans. on PWrS, vol. 23, no. 3, pp. 868-876, aug. 2008).
[2] m.Th. Schilling, r. Billinton, m. Groetaers dos Santos, “Bibliography on power systems probabilistic security analysis 1968-2008” (int. journal of emerging electric Power Systems, vol. 10, no. 3, pp. 1-48, 2009).
[3] C.C. Fong, r. Billinton, r.o. Gunderson, P.m. o’neill, j. raksany, a.W. Schneider, B. Silverstein, “Bulk system reliability - measurement and indices” (ieee Trans. on Power Systems, vol. 4, no. 3, pp. 829-835, aug. 1989).
[4] Power System reliability analysis application Guide, (CiGré Working Group 38-03, Paris, 1987).
[5] W.H. Winter, B.K. lereverend, “Bulk electricity system operational performance: measurement systems and survey results” (CiGré Working Group 39.05, Paris, jul. 1989).
[6] a.m. rei, m.Th. Schilling, “reliability assessment of the Brazilian power system using enumeration and monte Carlo” (ieee Trans. on Power Systems, vol. 23., no. 3, pp. 1480-1487, aug. 2008).

28 eleTroeVoluÇão JUNHO 2011
Bienal paris 2010Bienal paris 2010
artigo C1-302 apresentado na Bienal Paris 2010
large Scale iintegration of renewable Sourcesin the Brazilian Bulk Power System
SummARY - The domestic electricity supply in Brazil is historically based on hydraulic sources which today count for 75% of the national power production. The inventoried hydroelectric potential lies mostly in the amazonic region — though faraway from the major load centres — being, therefore, object of serious restrictions associated with the high investment and complex environmental licensing regarding both generation and transmission facilities. This prospect comes up as one important factor to improve the participation of different sources in the energy matrix, with emphasis on the new renewable, such as small hydro projects, wind farms and biomass cogeneration plants.
This paper addresses the foremost issues related with the large scale integration of new renewable sources in the Brazilian national interconnected Power System. a broad wind penetration is imminent, but the biomass expansion has already demanded concrete actions, such as the change in the regulatory framework and the joint effort on the feasibility analyses that engaged the system operator, sugar cane producers, transmission and distribution utilities and the government. This paper also highlights the technical challenge to preserve the electrical security of the Brazilian grid taking into account the pertinent requirements, the proposal of transmission reinforcement and/or operational countermeasures on the existing network and the seasonal nature effects of the biomass generation. regardless the expressive energetic benefit, nearly all of the biomass plants in operation or to be integrated to the grid in the near future behave as generators during the season and as small loads in the off season. This seasonal behaviour imposes significant power flow variations to the HV and eHV networks, potentially amplifying the operational difficulties to control bus voltages and equipment loading. Similar effects are also expected in the short-circuit levels of HV networks, rising the discussion around the need of robust protection philosophies to withstand diverse conditions.
kEYWORDS - renewable – Biomass – Wind Generation – Small Hydro Plants – Grid Connection.
1. 0 inTroduCTion
renewable energy sources are in the basis of the Brazilian electric power industry. in 2008 the national energy production reached 448.8 TWh, being 75% of this amount delivered by conventional hydraulic generation, i.e. power plants with individual capacity exceeding 30 mW. The electricity consumption in the country increased by an average annual rate of 5%
I. GÁRDOSR.D. FURSTP. GOMESA. BIANCO
operador nacional do sistema elétrico — ons

eleTroeVoluÇão JUNHO 2011 29
Bienal paris 2010
from 2001 to 2008 and an improved pace of 5.6% is expected up to 2013. in turn, the policy for generation expansion established by the government in 2004 consists in the auctioning of new energy assets, which proved to be an attractive mechanism to new power plants given that, between 2005 and 2008, eleven public auctions were carried out resulting in the total capacity of 22.6 GW scheduled to start operation until 2013. These auctions are the major procurement mechanism for distribution companies to acquire energy to supply their captive consumers through the celebration of long-term Power Purchase agreements.
The inventoried hydroelectric potential lies mostly in the amazonic region — though far away from the major load centres — being, therefore, object of serious restrictions associated with the high investment and complex environmental licensing regarding both generation and transmission facilities. This prospect comes up as one important factor to improve the participation of different sources in the energy matrix, with emphasis on the so called alternative or new renewable ones, such as small hydro projects, wind farms and biomass cogeneration plants. The main onshore wind potential within the Brazilian territory lies in the northeast, while the biomass and small hydro plants are concentrated in the inner Southeast and Central West regions.
This paper briefly addresses the current state of the new renewable energy sources in Brazil, focusing wind, small hydro and biomass power plants, from its characterization to the experience to date and the challenges that system planners and operators are to be aware to accomplish a successful large scale integration process.
2.0 neW reneWaBle enerGY SourCeS in BraZil
The commercial energy production of the new renewable technologies in Brazil is currently based on onshore wind farms, small hydro power plants (SHP) and biomass cogeneration plants. The evolution of the generating capacity on these energy sources from 2001 to 2009 is depicted in Figure 1. it can be observed that biomass and SHP increased 3.2 GW and 2.1 GW, respectively, while the capacity on wind power plants remains around 500 mW.
Figure 1 – recent evolution of the generating capacity on new renewable energy sources in Brazil
2.1 Expansion policiesGiven the characteristics of the natural resources
in Brazil, hydroelectricity is to remain as the major option for the expansion in the energy supply. However, some government directives to increase the diversification on renewable sources as a means to enforce the security on the supply are being followed since the early 2000´s.
PROINFA
in 2002, the government created the incentive Program for alternative Sources of electrical energy – ProinFa, having as its strategic objectives: (i) diversification of the Brazilian energy matrix improving the security of supply; (ii) valuation of regional and local characteristics and potentialities with job creation and development of skilled labour force; and (iii) reduction of greenhouse gases emission. The first phase of ProinFa aimed to increase the generating capacity on wind, small hydro and biomass power plants by 3300 mW up to 2006, being 1100 mW for each of those sources. To mention some key features of ProinFa, the projects under the program must have a minimum of 60% of national products, and the purchase of the energy produced by those power plants would be granted by 20-year contracts signed down by eletrobrás. a total of 144 power projects were selected and, in the late 2009, 96 of the program hired plants were in due operation, adding 2106 mW to the Brazilian interconnected system generating capacity. There are approximately 450 mW yet to be added up to 2010 by 23 power plants currently under construction.

30 eleTroeVoluÇão JUNHO 2011
Bienal paris 2010Bienal paris 2010
Energy auction on alternative energy sources (LFA)
The new rules for the Brazilian electric sector established in 2004 strengthened a policy to encourage the expansion of alternative electricity sources and the competition with conventional hydro generation. as a consequence, the first energy auction on alternative sources was carried out in june 2007, adding 639 mW to the generating capacity of the national interconnected Power System (niPS). This supply expansion, being 542 mW on biomass cogeneration and 97 mW on small hydro plants, is to be in operation up to 2010.
Energy auction exclusively on biomass based sources (LER_BIO)
in august 2008, the ministry of mines and energy carried out the first energy auction exclusively focused on the biomass power generation. The negotiated energy was scheduled to be delivered in 2009 and 2010 as a means to reinforce the overall electricity supply until the start up of the madeira river power stations. a total of 321 mW average in 31 biomass plants were auctioned off, adding up 2380 mW to the generation capacity in the states of São Paulo, minas Gerais, mato Grosso do Sul, Goiás and Piauí.
Energy auction exclusively on wind based sources (LER_WIND) [1]
in the late 2009, a wind-only auction similar to that on biomass sources was carried out, resulting in the acquisition of 1805.7 mW of generating capacity from 71 wind power plants to start operation in 2012, located both in the Brazilian northeast (1619.7 mW) and South (186 mW) regions.
2.2 Overview of the existing capacity on new renewable sources
out of the current generating capacity of 106 GW, 20.6 GW are associated with non renewable, especially fossil, energy sources and 9.2 GW are in new renewable ones. Table i outlines the location and generating capacity of the different new renewable sources in Brazil. it is worth mentioning that wind power production sites are mainly in the coast of the Brazilian northeast region, while biomass and small hydro plants are concentrated in the inner Southeast and Central West regions.
Biomass based cogeneration facilities, especially sugar cane waste fired plants, are responsible for 61% of the total installed capacity in the new renewable sources. in the last years, the interest in sugar cane biomass based cogeneration (combined heat and power – CHP) has increased, especially as a result of the boost in the Brazilian ethanol production to supply both the domestic and foreign markets. The production of sugar and ethanol from sugar cane is a highly energy intensive process that, with some improvements in its efficiency, can generate impressive amounts of surplus electricity to be injected in the grid. The key for such improvement is the adoption of high pressure boilers and steam turbine generators, being 82bar/480oC designs the most common alternative to the old 22bar/300oC ones. The state of São Paulo, whose agricultural industry holds 60% of the national sugar cane production, plays the major role in the biomass based cogeneration. in addition, the state hosts dense local distribution and regional transmission systems well suited to dispose the energy surplus of mid-sized CHP plants.
Small hydro plants are defined in Brazil both by the installed capacity (1mW < Pinst ≤ 30mW) and the reservoir area not larger than 3.0 sq.km, or up to 13.0 sq.km, depending on the fall height. in the early 2000’s, more than 30% of the total capacity in small hydro plants were concentrated in the state of minas Gerais, then followed by São Paulo, Paraná and Santa Catarina. However, along the decade an impressive SHP expansion occurred, especially in the state of mato Grosso with 503 mW installed between 2002 and 2009 and almost 300 mW to start operation before 2012.
The use of wind generation is quite recent in Brazil, given that almost 98% of the current installed capacity were integrated to the grid after june 2006, as a consequence of ProinFa. However, there are dozens of small wind turbines working in isolated locations for various applications, such as pumping, battery charging and rural electrification. Thanks to the local atmospheric and topographical characteristics that ensure the aerogenerators an outstanding productivity, the highest concentration of the grid connected wind power plants lies in the coast of the Brazilian northeast region, especially the
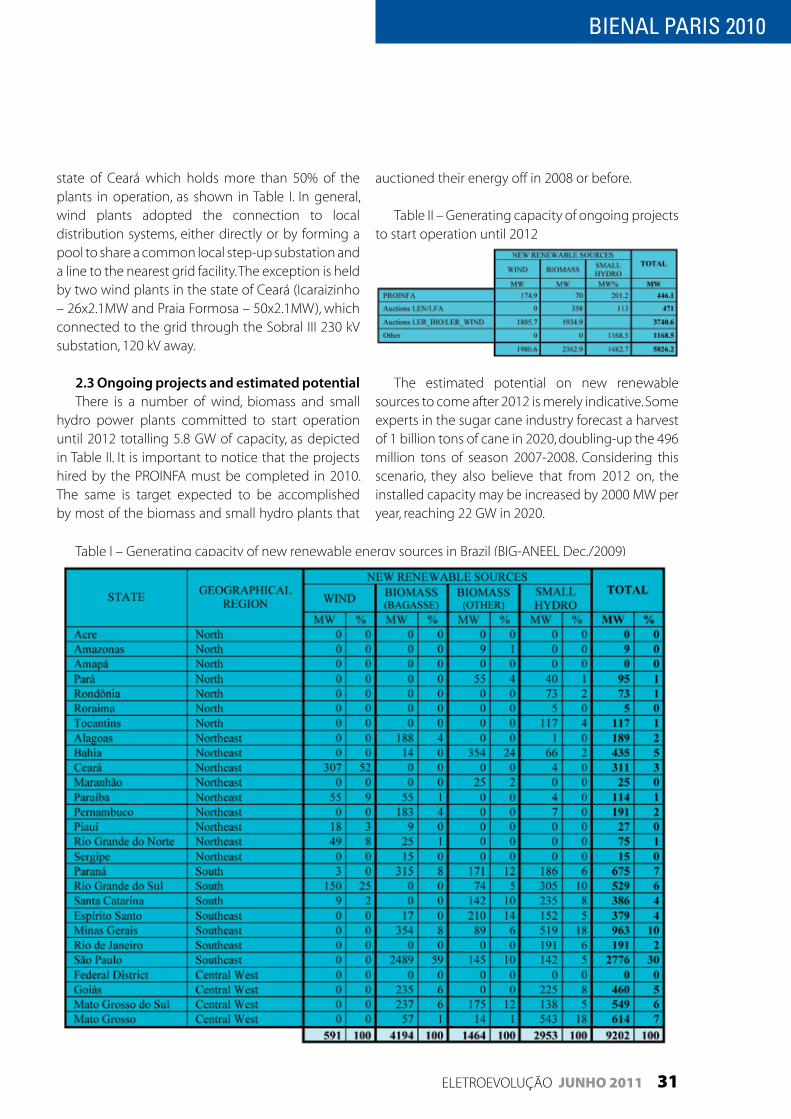
eleTroeVoluÇão JUNHO 2011 31
Bienal paris 2010
state of Ceará which holds more than 50% of the plants in operation, as shown in Table i. in general, wind plants adopted the connection to local distribution systems, either directly or by forming a pool to share a common local step-up substation and a line to the nearest grid facility. The exception is held by two wind plants in the state of Ceará (icaraizinho – 26x2.1mW and Praia Formosa – 50x2.1mW), which connected to the grid through the Sobral iii 230 kV substation, 120 kV away.
2.3 Ongoing projects and estimated potentialThere is a number of wind, biomass and small
hydro power plants committed to start operation until 2012 totalling 5.8 GW of capacity, as depicted in Table ii. it is important to notice that the projects hired by the ProinFa must be completed in 2010. The same is target expected to be accomplished by most of the biomass and small hydro plants that
auctioned their energy off in 2008 or before.
Table ii – Generating capacity of ongoing projects to start operation until 2012
The estimated potential on new renewable sources to come after 2012 is merely indicative. Some experts in the sugar cane industry forecast a harvest of 1 billion tons of cane in 2020, doubling-up the 496 million tons of season 2007-2008. Considering this scenario, they also believe that from 2012 on, the installed capacity may be increased by 2000 mW per year, reaching 22 GW in 2020.
Table i – Generating capacity of new renewable energy sources in Brazil (BiG-aneel dec./2009)

32 eleTroeVoluÇão JUNHO 2011
Bienal paris 2010Bienal paris 2010
in 2001, the potential for onshore wind power generation in Brazil was estimated as 143 GW (272.2 TWh/year), for 50 m height and average wind speeds equal or superior to 7 m/s. Taking into account the technology evolution in this field over the last years, an updated estimate at 100 m height is to be released in 2010, what will probably reveal a potential for onshore wind power generation many times larger than the already known. However, the offshore potential along the nearly 8,500 km long Brazilian coast remains unknown.
3.0 BeneFiTS To PoWer SYSTem PlanninG and oPeraTion
in addition to the well known mid and long-term benefits made available to the environment and economy from the adoption of renewable sources, there are a number of features to be used from the new renewable ones to provide the bulk power system with enhanced flexibility. Some of these features, which are briefly depicted below, are quite evident in Brazil.
3.1 Energetic complementarityThe sugar cane biomass electricity production
is strongly correlated with the sugar cane harvest season, which in the Brazilian Southeast region occurs between april and october, also corresponding to the dry period along which the water reservoir levels decrease. Therefore sugar cane biomass and conventional hydro power plants complement each other as energy sources along one year. as a measurable benefit from such seasonal complementarity, it was estimated that each 1000 mW average produced by biomass plants between april and october provides the Southeast dams with an increase of 4% in the water storage reserves, thus contributing to reduce both the risk of energy deficit and the operational marginal costs. a similar behaviour has been identified in the comparison between conventional hydro and wind power production in the Brazilian northeast region.
3.2 Proximity to the load centresWind, small hydro and biomass plants are
relatively small size projects, leading to short
construction times and low environmental impact. Theoretically, they are well suited to be placed close to the load centres, thus postponing investments in the transmission system expansion. However, the seasonal characteristic of these sources must be taken into account, given that during some months their power production may be drastically reduced or even turn to small loads, as most of the sugar cane biomass plants in the off season.
3.3 Expected availability The power delivered to the system by the sugar
cane biomass plants is approximately constant in the sugar cane harvest season. This is a consequence of the intense activity in the production of sugar and ethanol, requiring large and permanent steam supply which also drives the generators in the CHP process.
4.0 main CHallenGeS To THe larGe SCale inTeGraTion oF neW reneWaBle SourCeS
The access to the electrical grid is a right guaranteed to any generation asset owner in Brazil. it is founded in some principles of the electrical sector model in force, involving non-discriminatory treatment to users, compensation of the transport costs, encouragement to new investment in the supply expansion and tariff modicity as a directive for the rational use of the electrical system facilities, as well as the design of the grid expansion and reinforcement.
one of the challenges to the integration of new renewable sources faced so far was to establish technical requirements in the Grid Code to be fulfilled by the plants. especially for the wind power plants, many meetings with the manufacturers were carried out in this stage, both to ensure the compliance with the Grid Code technical requirements and raise the information needed to develop computer models to be used in the system studies.
along this section the principal concerns related to the integration of new sources, renewable ones in particular, are presented from a system operator point of view.

eleTroeVoluÇão JUNHO 2011 33
Bienal paris 2010
4.1 Impact on the grid expansionThe shallow connection concept is adopted in
Brazil, being the generator owner responsible for building the last mile connectivity, if it comprises transmission facilities used exclusively by that power plant. regardless the type of energy source to access the grid, detailed analyses of the electrical connection issues are routinely done, in which both local and system-wide effects associated with the introduction of that new element are determined. The recommendations from such analyses (e.g. construction of new lines, refurbishment of existing facilities, reactive power compensation, etc.) to guarantee the compliance of the system performance with the Grid Code standards are taken into account during the Three Year Consolidated Plan assembly.
Connection to the existing grid – few reinforcements needed
The first energy auction exclusively on the biomass power generation (ler_Bio) raised the interest of many ethanol producers, especially in the state of São Paulo, willing to make revenue on their energy surplus. Therefore, a potentially high number of candidate cogeneration plants were identified, making necessary a coordinating effort in the analysis of the large scale integration of such sources to the grid. in october 2007 a multi-institutional working group comprising more than 25 skilled professionals on power system analysis was created with the following assignments:
• consolidate the estimate of biomass cogeneration plants in São Paulo willing the grid connection within a 4-year horizon
• determine the capacity of the existing/planned electrical system to allow the intended surplus power injection by those plants
• identify the need of network (both transmission and distribution) expansion or reinforcements to accommodate the intended connections
• identify regulatory issues, especially those related with the sharing of connection facilities.
a total of 103 biomass cogeneration plants, either new or refurbished, were included in the WG consolidated estimate, gathering a power surplus of 4244 mW to be injected to the grid [2]. These plants
were supposed to start operation as follows: 66 until 2009, 31 in 2010 and the remaining up to 2012. The connection to the grid for almost all the plants was intended to be through the HV (mainly 138 kV and 88 kV) network that comprises the regional transmission and distribution systems in the interior of São Paulo. These systems, which are fed by the main Grid in several step-down (e.g. 440 kV to 138 kV) substations are responsible for the supply of roughly half of the state demand.
Steady state studies indicated that only few grid reinforcements, other than those already designed to be in operation within three years, would be necessary as a consequence of the large scale integration of biomass cogeneration in São Paulo. in some cases remedial actions, such as network reconfiguration and special protection schemes (e.g. tripping of some biomass cogeneration plants after line outages), would be necessary to avoid bus under-voltages and line/transformer overloads while the reinforcements are not completely implemented. The studies also indicated that short-circuit currents in some 138 kV substations would increase significantly, resulting in the overrating of 38 circuit breakers.
The WG report [3] was taken by the biomass generation owners in the state of São Paulo as a valid technical reference to apply for the auction (ler_Bio). These studies were brought up to date in november 2008 to consider a fair (and reduced) estimate of the cogeneration to be connected to grid, including the auction results. moreover, the analyses were extended to consider improved estimates of cogeneration plants to connect the existing grid in the states of minas Gerais, mato Grosso do Sul and Goiás. Table iii depicts the net injection and nameplate based capacity amounts considered in this evaluation.
Table iii – Biomass cogeneration to be connected to the existing grid as estimated in 2008
Three biomass cogeneration plants were considered in the state of minas Gerais, all connected to the 138 kV distribution grid in the western region,

34 eleTroeVoluÇão JUNHO 2011
Bienal paris 2010Bienal paris 2010
known as Triangle, which neighbours the northern São Paulo. in the state of mato Grosso do Sul the cogeneration plants are to be connected to the local distribution and, in Goiás, three plants with ratings above 100 mVa intended to inject its surplus power to the main Grid through new 230 kV substations.
Connection to the existing grid – expansion needed
The state of mato Grosso is almost three-times larger in area than São Paulo but its power system is by far less complex and meshed. until the mid-2000’s the southern mato Grosso was crossed by a 230 kV corridor from east to West, having a 500 kV transmission line running in parallel until the capital Cuiabá, from where a 450 km single 230 kV line was headed to the north. at that time, a hydroelectric generation potential around 1500 mW was indicated in the state of mato Grosso, being 3/4 of this amount based on 67 small hydro power plants to start operation within a 3-year period. These new power plants would be mostly located in the western/north-western mato Grosso, a region supplied by a single 138 kV distribution line. System planning studies were then carried out to develop a transmission expansion proposal based on 230 kV facilities (including 230/138 kV substations) to strengthen the major power corridors in the state of mato Grosso and, hence, transport the full production of the new conventional and small hydro plants. Part of the new 230 kV grid is already in operation and the remaining facilities are to be completed in the mid-2010. From the initial hydroelectric expansion estimate of 1500 mW, approximately 550 mW on small hydro power plants are in service or scheduled to start operation up to 2011.
Development of a new gridSimultaneously to the WG on the integration
of the biomass cogeneration plants in São Paulo, a system planning study was carried out to determine the grid expansion solution to allow the integration of 31 biomass (2250 mW) and 4 small hydro plants (65 mW) sparsely placed in the states of mato Grosso do Sul and Goiás [4]. The electrical grids in both states are roughly comparable to that in mato Grosso, i.e. the existing transmission facilities are concentrated in a
portion of the territory and the distribution system is not robust enough to transport the intended generation.
The solution developed by the planning studies was the adoption of collector systems carefully placed to minimize costs, both in investment and losses, thus allowing the shared connection of as many power plants as possible. in 2008 a decree established rules for the shared generation connection, so they could be a viable means to integrate pools of power plants, especially those located in the Greenfield, though far from the load centres and major transmission corridors. This approach is being considered in the integration of many of the wind power plants auctioned off in december 2009 (ler_Wind).
4.2 impact on the operational schedulingWind generation in particular is a concern for
the operational programming due to the difficulties with the wind forecasting. in the Brazilian northeast region, the system operator receives the monthly energy forecasting of each wind power plant connected to the main Grid, with a week to week granularity. Based on the past production of each wind farm, the information received from the wind plant owner is consolidated and it is divided day to day, for each 30 minutes. For now, in the South of Brazil the wind forecast is used, as an auxiliary tool to prepare the daily schedule.
regarding the biomass generation, the seasonal behaviour of this new renewable source comes as a paramount concern, given that it imposes significant power flow variations to the HV and eHV networks, potentially amplifying the operational difficulties to control bus voltages and equipment loading.
4.3 Impact on the system performance [5]Given the disperse nature of the new renewable
sources, two basic aspects might be addressed when the effect upon the system performance is a concern: (i) new renewable sources shall comply with the minimum protection and control requirements to guarantee the operational security; (ii) new renewable sources shall not be disconnected from the grid during system disturbances leading to frequency oscillations and voltage decline, otherwise they could amplify the consequences of the disturbance itself. Therefore, a permanent effort

eleTroeVoluÇão JUNHO 2011 35
Bienal paris 2010
must be made to improve the requirements in the Grid Code [6].
5.0 ConCluSion
The power industry in Brazil is highly based on renewable energy sources and this characteristic is to be maintained, with enhancing diversity, in the decades to come. The large scale integration of new renewable energy sources to the grid has started, being biomass cogeneration and small hydro plants the most demanding in terms of concrete actions so far. The acquired technical knowledge, both in the particular characteristics of the new renewable sources and in the effects resulting of their interaction with the bulk power system, is a key factor for the successful integration process. Therefore, a coordinated involvement of manufacturers, utilities, system planning/operation experts and regulatory agencies is needed as a means to improve rules and requirements to afford an economic and safe participation of the new renewable sources.
6.0 aCKnoWledGemenT
The authors wish to express their appreciation to mr. dalton o.C. Brasil, from onS, for the valuable discussions during the preparation of this paper.
7.0 BiBlioGraPHY
[1] Proposta para a expansão da Geração eólica no Brasil. (ePe – empresa de Pesquisa energética nota Técnica Pre 01/2009, February 2009, www.epe.gov.br) in Portuguese
[2] P. Gomes; i. Gárdos; r.d. Furst; S.l.a. Sardinha; C.G. martins; a. Bianco “integração em larga escala de recursos renováveis ao Sistema interligado nacional” (XX SnPTee – Seminário nacional de Produção e Transmissão de energia elétrica, recife, Brasil 22-25 november 2009) in Portuguese
[3] integração dos empreendimentos de Geração a Biomassa no estado de São Paulo. (onS – operador nacional do Sistema elétrico nota Técnica 008/2008, january 2008) in Portuguese
[4] j. ludwig; T. martins; l.m. Thomé; r. Chabar “o Planejamento das instalações Compartilhadas de Geração (iCGs)” (XX SnPTee – Seminário nacional de Produção e Transmissão de energia elétrica, recife, Brasil 22-25 november 2009) in Portuguese
[5] P. Gomes; a.C.B. martins; C.r. Zani; S.l.a. Sardinha “Connection requirements and Grid Codes for distributed Generation” (2009 CiGre/ieee PeS joint Symposium - integration of Wide-Scale renewable resources into the Power delivery System, Calgary, 29-31 july 2009)
[6] Procedimentos de rede. (onS – operador nacional do Sistema elétrico, www.ons.org.br) in Portuguese.

36 eleTroeVoluÇão JUNHO 2011
Bienal paris 2010Bienal paris 2010
artigo C2-201 apresentado na Bienal Paris 2010
Brazilian Power System: Criteria, operatingStandard metrics and Performance indicators
SAULO J. N. CISNEIROSPAULO GOMES
DALTON O. C. BRASILSILVIA S. C. BRASIL
ons – operador naCional do sisteMa elÉtriCo
SummARY - The first part of the paper analyses Brazilian system security principles and criteria in terms of the basic severity levels to be used in normal conditions. also analyzed are alternative criteria to be applied in special situations or during specific configurations of power system installations with the objective of increasing power system security, adequacy and reliability.
The second part of the paper describes in detail the operating Standard metrics and Performance indicators of the Brazilian power system. These indicators are established in the Grid Procedures and are approved by the regulator. They represent a global measure of the security and adequacy of the power system as well as a measure of the service provided by the bulk power system at the specific points in terms of the continuity of supplied energy.
The third part of the paper presents some of the experiences and results obtained from the use of these indicators. The procedures, metrics and indicators described in the paper are very important tools for balancing the trade-off between transmission limits versus security and quality levels. They have been used successfully in the Brazilian interconnected system to evaluate and improve power system performance. moreover, they provide conditions for consistent application of the criteria defined, thus minimizing the risk of unequal treatment for different customers.
The final part of the paper presents conclusions and remarks on the role of the criteria, operating standard metrics and performance indicators applied to the Brazilian power system, including the trade-off in the dilemma between how to maximize transmission system limits and keep adequate levels of security, adequacy and reliability.
kEYWORDS - operating standard metrics - performance indicators - criteria - transmission system limits - security - adequacy - reliability.
1. 0 inTroduCTion
in the restructured environment, there are increasing market actor and end consumer demands for better power system performance. in this context, adequate criteria, operating standard metrics and performance indicators applied to power system security, adequacy and reliability play an important role in managing the power system risks for all of the players involved. They contribute to balance the trade-off between transmission limits versus security and quality levels, and they have been used to evaluate and improve Brazilian power system performance. Performance indicators

eleTroeVoluÇão JUNHO 2011 37
Bienal paris 2010
can be characterized in terms of security, adequacy and reliability.
in terms of security, the indicators evaluate the power system performance during abnormal conditions in terms of its capacity to resist contingencies. These performance indicators calculate and present the robustness of the power system to resist disturbances without cut of load, as well as the severity level of each contingency according to defined metrics.
in terms of adequacy, the indicators evaluate the power system voltage and frequency performance according to the principles presented hereafter. regarding voltage indicators, in normal situations and in contingency cases, voltages in the permanent state in the connection points of the Basic Transmission Grid (230kV and above) should observe the rules as defined directly by the regulator according to the adequate, Precarious and Critical classification scheme. Concerning frequency indicators, power system frequency should be placed between the minimum and maximum value interval under normal conditions and in case of power system disturbances. The frequency should return to the minimum and maximum value interval no later than a defined time after exiting this interval.
in terms of reliability, the indicators evaluate the service provided by the Basic Transmission Grid to distribution Companies and Free Consumers. These indicators are calculated monthly and yearly, and may be aggregated by System, Subsystem, region, State or agent (distribution Company or Free Consumer). For every indicator a monthly and yearly reference standard should be established based on both the operational statistical data and the implemented improvements to the power system. These reference standards establish the limits that should be respected for every indicator.
2. 0 PoWer SYSTem SeCuriTY CriTeria
2.1. BASIC SYSTEm SECuRITY CRITERIONThe Brazilian power system is planned to resist
n-1 contingency severity level. n-1 is used as a basic security criterion all over the Brazilian interconnected system. after a n-1 contingency, the following measures are adopted in order to reestablish the
n-1 basic security criterion: insert shunt and series capacitors, remove shunt reactors, change load tap of transformers, redispatch hydro generation, redispatch and start thermal generation, reallocate loads through sub-transmission and distribution systems, open circuits, separate bus bars of power system installations and make islands.
These operational measures are adopted as soon as possible as defined in the Grid Procedures. There is no defined time to reestablish the n-1 severity level in the new situation after the single contingency. Cut off load is not permitted at any time. if the measures adopted are not sufficient to reach this objective, power system defense plans have to be defined in the operation planning studies to prevent blackouts and reduce the impact on the power system to a minimum in case of another n-1 contingency. in this case, cut off load is permitted beyond the measures adopted previously.
Criteria, standards and requests of security and reliability are established in the grid procedures to be considered in the configuration of generation and transmission power plants. The highest level of standards is used in the configuration of main and strategic power system installations.
2.2. ADDITIONAL SYSTEm SECuRITY CRITERIAin the operational planning phase, n-2 severity
level is considered in the following contingencies with the objective of increasing system security: (a) outage of two single overhead lines on the same pylons; (b) outage of two single overhead lines on distinct pylons in the same corridor; (c) outage of two single overhead lines on distinct pylons in the same area where there is occurrence of natural phenomena or bush-fire; or (d) loss of bus bar section; in case of at least one of the following situations: (a) there is high evidence of the possibility of these kinds of contingency, proved by statistical data; (b) there is high loss of load in the region or area affected by the contingencies described above.
in the short term operational planning, with the objective of evaluating and defining conditions for scheduled outages, n-2 severity level is considered in the following contingencies: (a) outage of two single overhead lines on the same pylons; (b) outage of two single overhead lines on distinct pylons or

38 eleTroeVoluÇão JUNHO 2011
Bienal paris 2010Bienal paris 2010
two main equipments, when only one event can cause these double outages; (c) outage of one single overhead line, one main equipment, or bus bar section, followed of circuit breaker failure, which provoke these kinds of n-2 contingency, in case of at least one of the following situations: (a) there is high evidence of the possibility of these kinds of contingency, proved by statistical data; (b) there is a significant loss of load in the region or area affected by the contingencies described above; (c) actuation of special protection schemes.
after a n-2 contingency, the same measures used in case of a n-1 contingency and described in previous item 2.1 are adopted with the objective of reestablishing the normal state of the power system as soon as possible. There is no defined time for this. Cut off load is not permitted at any time. in special situations during short term operational planning, cut off load can be permitted and made by special protection schemes. in this new stage, power system defense plans have to be defined in the operation planning studies to prevent blackouts and reduce the impact on the power system to a minimum in case of a n-1 contingency. in this new case, cut off load is permitted beyond the measures adopted previously.
3.0 oPeraTinG STandard meTriCS and PerFormanCe indiCaTorS
This part describes in detail the operating Standard metrics and Performance indicators of the Brazilian power system. These indicators are established in the Grid Procedures and must be approved by the regulator.
3.1. OBJECTIvES OF PERFORmANCE INDICATORSThey represent a measure of the security,
adequacy and reliability of the power system as well as a measure of the service provided by the interconnected power system at the specific points in terms of continuity and quality of the supplied energy. The main objectives of the performance indicators are:
• Provide clear measurements of security, adequacy and reliability of the power system performance.
• Balance the dilemma: how to maximize transmission system limits with adequate security and quality levels.
• Indicate clear solutions for the management of power system risks.
The service provided by the interconnected power system is evaluated by performance indicators calculated monthly and yearly, and aggregated by System, Subsystem, region, State or agent (distribution Company or Free Consumer) according to the case.
3.2. ThE SECuRITY PERFORmANCE INDICATORS
The security of the interconnected power system is evaluated by performance indicators defined to measure the robustness of the Basic Transmission Grid related to the service provided to distribution Companies and Free Consumers. These indicators are calculated monthly and yearly, and may be aggregated by System, Subsystem or region. For every indicator a monthly and yearly reference standard should be established based on both the operational statistical data and the implemented improvements to the power system. These reference standards establish the limits that should be respected for every indicator. The main security performance indicators are described below.
3.2.1. Robustness of the Interconnected Power System – RSIN
rSin is the proportion between the number of disturbances without loss of load and the total number of disturbances occurred in the interconnected power system in a specific time period (month or year). The main objective of this indicator is to evaluate the robustness of the interconnected power system (basic transmission grid) to resist disturbances without loss of load.
it is calculated by the formula below:
Where: nsccSin = number of disturbances without loss of load;
ntSin = total number of disturbances.

eleTroeVoluÇão JUNHO 2011 39
Bienal paris 2010
as defined by the regulator:• Adequate : 0.95 < V < 1.03 p.u.• Precarious: 0.90 < V < 0.95 p.u. or 1.03 < V < 1.05 p.u.• Critical : V < 0.90 p.u. or V > 1.05 p.u.
Precarious and critical voltages are not accepted during normal conditions; in these cases different penalties shall be applied to those responsible. Precarious voltages are accepted in contingency cases; in case of permanent under voltage below 0.90 p.u., load shedding will be applied by means of system protection schemes. during restoration processes, voltages will be accepted in the 0.90-1.10 p.u. interval in all bus bars of the power system. a voltage variation of 0.05 p.u. is the switching limit for power system equipment such as shunt capacitors, shunt reactors, etc.
3.3.2. Frequency Standardsunder normal conditions, the power system
frequency should be placed between 59.9 and 60.1 Hz. in case of power system disturbances, the frequency should return to the 59.5-60.5 Hz interval no later than 30 seconds after exiting this interval. if generation is not sufficient to restore the load-generation balance, load shedding will be applied in order to observe the following under-frequencies: 57.0 Hz as the minimum limit, with 57.5 Hz and 58.5 Hz for only 5 and 10 seconds, respectively. in case of more severe disturbances, islands with thermal power plants should be formed; the frequency in the islands consisting only of hydro plants may reach the minimum limit of 56.5 Hz.
in case of load loss disturbances, it could become necessary to implement schemes for cutting off generation in order to observe the following over-frequencies: 66.0 Hz as the maximum limit, with 63.5 and 62.0 Hz for only 10 and 30 seconds, respectively.
3.4. ThE RELIABILITY PERFORmANCE INDICATORS
The reliability of the interconnected power system is evaluated by performance indicators defined to measure the service provided by the Basic Transmission Grid to distribution Companies and Free Consumers. These indicators are calculated monthly and yearly, and may be aggregated
3.2.2. Robustness of the Interconnected Power System for N-1 Contingency Severity Level – RmCS
rmCS is the proportion between the number of disturbances caused by n-1 contingency severity level without loss of load and the total number of disturbances caused by n-1 contingency severity level occurred in the basic transmission grid in a specific month. The objective of this indicator is evaluating de robustness of the basic transmission grid to resist n-1 contingency severity level without loss of load of distribution Companies and Free Consumers. The reference standard for this indicator is 100%, because the Brazilian power system is planned to resist n-1 contingency severity level.
it is calculated by the formula below:
Where:nscc
mCS = number of disturbances caused by n-1
contingency severity level without loss of load;nt
mCS = total number of disturbances caused by
n-1 contingency severity level.
3.3. ThE ADEQuACY PERFORmANCE INDICATORSThe adequacy of the service provided by the
power system is evaluated by operating standard metrics defined in order to measure the power system voltage and frequency performance according to the principles and criteria defined below.
3.3.1. voltage Standardsregarding voltage indicators, in normal
situations and in contingency cases, voltages in the permanent state in the connection points of the Basic Transmission Grid (230kV and above) should observe the rules as defined directly by the regulator according to the following classification scheme:
• Adequate : 0.98 < V < 1.03 p.u.• Precarious: 0.95 < V < 0.98 p.u. or 1.03 < V < 1.05 p.u. • Critical : V < 0.95 p.u. or V > 1.05 p.u.
Voltages (V) in the connection points or load points of the Primary distribution Grid (below 230kV and up to 1 kV) should observe the following levels

40 eleTroeVoluÇão JUNHO 2011
Bienal paris 2010Bienal paris 2010
by System, Subsystem, region, State or agent (distribution Company or Free Consumer). For every indicator a monthly and yearly reference standard should be established based on both the operational statistical data and the implemented improvements to the power system. These reference standards establish the limits that should be respected for every indicator. The main reliability performance indicators are described below.
3.4.1. Load Interruption Equivalent Duration – DREQ
dreQ is the equivalent duration of all loads’ interruptions corresponding to the total load of the specific area, where each duration has time equal to or above 1 minute. The objective of this indicator is evaluating the robustness of the interconnected power system in terms of reliability and time of recovering when submitted to a disturbance.
it is expressed in minutes and calculated by the formula below:
Where: Pmax
= maximum load demand occurred in a specific month or year.
Pint
= maximum load demand interrupted in a disturbance “i”.
Tint
= time of interruption of load in a disturbance “i”.
4.4.2. Load Interruption Equivalent Frequency – FREQ
FreQ is the number of times of loads’ interruptions corresponding to the total load of the specific area, where each duration has time equal to or above 1 minute. The objective of this indicator is evaluating the reliability of the interconnected power system.
it is calculated by the formula below:
Where: Pmax
= maximum load demand occurred in a specific month.
Pint
= maximum load demand interrupted in a disturbance “i”.
4. 0 eXPerienCeS and reSulTS oBTained
This part of the paper presents some of the experiences and results obtained from the use of the performance indicators.
4.1. ThE SECuRITY PERFORmANCE INDICATORS The figure below shows the results of the
indicator robustness of the interconnected Power System – rSin from 2002 until 2008.
The figure below shows the results of the indicator robustness of the interconnected Power System for n-1 Contingency Severity level – rmCS from 2002 until 2008.
4.2. ThE RELIABILITY PERFORmANCE INDICATORSThe figure below shows the results of the indicator
load interruption equivalent duration – dreQ from 2000 until 2008.
DREQ – Load Interruption Equivalent Duration (minutes)
RSIN – Robustness of the Interconnected Power System (%)
RMCS – Robustness of the IPS for N-1 Contingency (%)

eleTroeVoluÇão JUNHO 2011 41
Bienal paris 2010
The figure below shows the results of the indicator load interruption equivalent Frequency – FreQ from 2000 until 2008.
4.3. REmARkS ABOuT PEFORmANCE INDICATORSThe results of the security (from 2002 until 2008)
and reliability (from 2000 until 2008) performance indicators of the interconnected power system when submitted to disturbances occurred at the basic transmission grid show the important remarks presented below.
a) The results of the robustness of the interconnected Power System have been higher than 85%, which means less than 15% of the disturbances in the interconnected power system have caused loss of load of the distribution Companies and Free Consumers.
b) The results of the robustness of the interconnected Power System for n-1 Contingency Severity level are very close to 100%, showing by evidence that the interconnected power system can resist single contingency without loss of load, as it is planned.
c) The results of the load interruption equivalent duration are around or less than 20 minutes per year. The exception are the years 2002 and 2005 because the following reasons. in january 2002 occurred a blackout that impacted Southeast, midwest and South regions, what increased hardly the indicators in 2002. in 2005, the South region rivers had a very dry period and the interconnection between Southeast and South regions was operated close to the maximum limits. Consequently, the system security level was reduced in this year.
d) in the same way, the results of the load interruption equivalent Frequency are around or less than 0.5. The exception is the years 2002 and 2005 because the same reasons described above.
e) The Brazilian interconnected system is of
continental magnitude, the generation capacity is prevailingly hydroelectric with big hydroplants far from the load centers, and with several long transmission lines (> 90,000 km). The demand from 2000 until 2008 increased almost 20% and reached 64,000 mW in 2008. The complexity of the power system operation also has increased, but the results of the performance indicators are very good in all the period observed, except in the years 2002 and 2005.
f ) This is why the Brazilian transmission system has had big evolution in the recent past years with the following objectives: reinforce the regional interconnections among the big regions, reinforce all the Brazilian interconnected power system to resist n-1 contingency severity level, and improve the old and existing installations to obey new standards and request defined by the Brazilian Grid Code. The final objectives are increase power system security and reliability and increase power system transmission limits.
5.0 ConCluSionS and remarKS
a) The Brazilian power system is planned to resist n-1 contingency severity levels. n-1 is used as a basic security criterion. in the operational planning phase, n-2 severity level is applied in case of specified contingencies (defined in item 2.2) in order to increase system security.
b) The operating Standard metrics and Performance indicators described in this paper are very important tools for control the security and reliability and management the power system risks. They have been used successfully in the Brazilian interconnected system to evaluate and improve power system performance. moreover, they provide conditions for consistent application of the criteria defined, thus minimizing the risk of unequal treatment for different customers.
c) These Performance indicators are very consistent and simple. in this context simplicity is most important than complexity, as well as to make continuous follow up, analysis and conclusions of the results obtained.
d) The results of the performance indicators are very good in all the period observed, except in the
FREQ – Load Interruption Equivalent Frequency

42 eleTroeVoluÇão JUNHO 2011
Bienal paris 2010Bienal paris 2010
years 2002 and 2005, because the reasons described in item 4.3.
e) The perspectives are maintaining the bases and a permanent improving of the Brazilian operating Standard metrics and Performance indicators, and especially improving the reference standards for each one of the indicators.
6.0 BiBlioGraPHY
[1] Saulo j. n. Cisneiros, Brazilian System operating Standards, (Brazilian System operator, 2003).
[2] CiGré jWG C2/C5-05, electric Power System operating Standards: a Search for justification, (Cigré Paris Session, 2004).
[3] CiGré jWG C2/C5-05, Congestion management: The System operators Challenge to Balance Transmission Transfer Capacity with an acceptable Security level, (Symposium on Congestion management in a market environment, San antonio, Texas, 2005).
[4] Saulo j. n. Cisneiros, Brazilian System Security Standards: How to maximize Transmission System limits with an adequate Security level, (Cigré Paris Session, 2006).
[5] Saulo j. n. Cisneiros, Brazilian System Security and reliability: Criteria, methods and Performance indicators, (Cigré regional meeting, Tallinn, estonia, 2007).
[6] Silvia S. C. Brasil et all, reports about Performance indicators (Brazilian System operator - onS)
[7] Brazilian Grid Procedures - module 25 (Brazilian System operator - onS) - www.ons.org.br.

eleTroeVoluÇão JUNHO 2011 43
Bienal paris 2010
artigo C3-202 apresentado na Bienal Paris 2010
analysis of Socio-environmental Costs in theoperational Phase of Hydropower Projects in Brazil
SummARY - This paper presents some questions related to the consideration of environmental costs at the operation phase of hydropower plants. an exercise was done based on the expenses of CeSP – Companhia energética de São Paulo in 5 hydropower plants during 2008 showing the portion that can be appropriated as investments and what must be included in the company budget, according to the actual Brazilian electrical sector regulation. The authors suggest some points to be developed in future researches on this subject and with external costs. also, emphasizes the necessity of detailed items of environmental costs being considered in the official manual of national agency for electric energy.
kEYWORDS - environmental costs, hydropower plants, operational costs.
1. 0 inTroduCTion
electricity plays a fundamental and strategic role to all societies, especially for developing countries, because energy is a key aspect for social inclusion and for economic development as well to improve population quality of life.
The new Brazilian Power sector model (2004) was designed to increase the level of security of energy supply, improving the reliability of the system and favoring the tariff modicity through the best combination of sources of energy available, which depends on prices offered in regular energy biddings.
These aspects as well the planning of the sector are a signal of the Conceding Power (ministry of mining and energy) to reinforce the regulatory security, by offering adequate opportunities for agents who are interested in participate in the efforts to promote the national energy supply.
Since 2004, in the environmental context, this regulatory framework requires the Preliminary Permit (PP) for each project as a condition to participate in the energy bidding. This is the first of three permits necessary to complete the environmental conformity to the Brazilian licensing process. The other two are the installation Permit (iP) and the operation Permit (oP).
The current regulatory framework divides the costs approach of a project in two large phases. The first covers since the preliminary planning studies until the operation of the hydropower project (HPP). The second is related only to the HPP commercial operation phase. To elaborate budgets there are specific rules to both phases: investment costs (planning phase) and operation and maintenance costs (commercial operation phase). The socio-environmental aspects of these two phases must follow the rules of the
ANDRÉ L. MUSTAFÁMIRIAN R. NUTI
Cesp – Companhia energética de são paulo

44 eleTroeVoluÇão JUNHO 2011
Bienal paris 2010
Brazilian regulatory agency (aneel) normalized by the eletrobras Budget Pattern specific to the planning phase where the environmental and social costs are detailed and by the Power Sector accountability manual for the operation phase.
This situation is even more important when is considered the current discussion focusing the different modalities and alternatives to the concession renovation for the entire hydro generator system, that will occur 2011 on. The possibilities are many varying from costly options to be necessary to proceed the renovation as a new concession process. in any situation it will be necessary to determine the value of the financial asset and the o&m costs, where the adequate actions for the environmental compliance should be considered.
The basic regulation for the concession renovation is being discussed since 2008 and there are a great expectative between the agents for a solid rule due to its importance to the actual regulation of the Brazilian power sector.
This is the context of our reflection and the objective of this paper is to identify and present the major groups of costs arising from the adequate social-environmental measures conducted in the operational phase of a HPP to maintain its environmental compliance. The basis to elaborate the analysis will be the observation of hydropower projects in operation under responsibility of São Paulo energetic Company - CeSP.
The authors are convinced that the subject started to be developed in this Paper can contribute to (i) an eventual change in the current regulation of the social-environmental costs of HPP; (ii) to better consolidate the budgets for the renovation of hydropower generation concession; (iii) to the international debate, it can show the internal costs that come from contemporary demands and reveal some external costs that are not known or considered until now.
2. 0 enVironmenTal CoSTS in THe BraZilian reGulaTorY SCenario
2.1. historyin the 1990, the Brazilian electrical sector has
developed studies to incorporate in their planning
the costs related to social and environmental aspects of the implementation of its projects. These definitions follow the literature and standardization of the orçamento Padrão eletrobrás (eletrobras Budget Standards) and the dnaee / aneel (the national agency for electric energy) Chart of accounts. Following these references we adopted the division between investment costs and operating and maintenance costs for the stages of planning (up to the entry into operation of machines) and operation of hydroelectric plants, the latter including the costs of maintenance and operation. For items of environmental investment costs, spreadsheets with specific guidelines were prepared for the appropriation in the accounts as well as an indication of the unit values of reference. according to the definitions for the social and environmental costs carried out under the ComaSe (Committee of environment of the electrical Sector), the costs of degradation are the ones that suit the needs of budgeting for the sector’s activities. once incorporated into the regulatory procedures all costs able to be monetized, there would remain the social costs or external costs, insusceptible to estimate at this stage.
later, the idea that social and environmental costs are basically cost of investment was also incorporated into the manuals for the production of the inventory, feasibility and basic design. This notion becomes crucial to allow the expenses arising from environmental activities (management, licensing and agreements, among others) were incorporated into the cost of the energy business and recognized as an intrinsic variable composition of its costs. even with the changes in the patterns of regulation in three in the last ten years, this view remained. The use of this concept, however, is not simple, as will be shown the next item.
2.2. The accountability manual (Aneel, 2007)The first Chart of accounts for the electric
utility was established in 1950, and was used until 1978. in 1979 a new document comes into force, completely redesigned and updated to meet the legislation of the time. From this date until 2007 the document has been updated and the most significant updates were the three took place after
eleTroeVoluÇão JUNHO 2011 45
Bienal paris 2010
6.3.14 Environmental Issues1. The concessionaires and permit holders
must maintain additional records to identify any spending on the environment, either in net Profit in Permanent assets or liabilities, and should mention in the notes to the financial statements provide more details involved: investments planned and executed , studies, projects etc.; 2. expenses related to the actions of environmental protection, monitoring, recovery and compensation for environmental and social impacts, as well as spending on reforestation and fish hatcheries to meet the needs of environmental Protection and recovery will be recorded as follows: (a) in hydro plants, while in service, will be allocated in subaccounts 132.01.1.1.03 - Generation – Power Plants – assets in Service - reservoirs, dams and Pipelines, and when under way, will be allocated in subaccount 132.01.1.9.03 - Generation – Power Plants – Works in Progress - reservoirs, dams and Pipelines, as the cost of reservoir;(...) (e) costs of conservation will be recorded in subaccount 615.01.1.1 - Generation – Power Plants- Cost of operation; when transmission in subaccount 615.02.1.1 - Transmission – Basic network - Cost of operation; and, when distribution in subaccount 615.03.1.1 -distribution - lines, networks and Substations - Cost of operation. With respect to contingencies related to the environment, there should be taken notes of aspects related to registration and disclosure provisions mentioned in the accounting instruction 6.3.22. (aneel, 2007:52)
6.3.27 Financial Resultsin addition to the normal expenses of operation
and maintenance, are also considered as cost of operation costs with the operational Support, environment, the reintegration shares (except shares reinstatement of property income) and auxiliary Services and Service and Training. (...)(b) The environment will include the expenses of the implementation of reforestation activities, fish hatcheries and related to the need for protection and restoration, and will count as mentioned in the accounting instruction iC 6.3.14. (aneel, 2007:69)
in item 3, below, the use of this structure to the appropriation of expenditures is commented.
the creation of aneel in 1996. The document that currently regulates the accounting expenses of the electric power sector is the accounting manual for Public Service of electric Power, as of 2007.
in summary, the goals formulated in the document are:
(a) Standardize the accounting procedures adopted by the utilities allowing control and monitoring by aneel; (b) Taking into account the provisions of relevant legislation, (c) authorize the preparation of financial statements, management report and further information that requires disclosure to follow the Brazilian legislation and to meet the needs of investors, shareholders, financial institutions, creditors, consumers, regulatory bodies and the general public; (d) allow adequate verification of the result of the activities of Generation, Transmission, distribution and marketing, (e) contribute to the evaluation of the analysis of economic and financial balance of the concessionaires. (aneel, 2007:13)
There is a concern not only to regulate the procedures but also to contribute to the balance of utilities and, consequently, the services they provide There is also a concern in meeting the information needs, according to the law and the general public, of issues not only related to the regulatory accounting but also in terms of transparency and commitment to sustainable development issues present reports of social responsibility and sustainability, which count toward the corporate image and value of its shares.
of all guidelines and accounting divisions present this important document, it is emphasized to meet the objectives of this article, the passages where environmental issues are mentioned. There are not items specific to the environment, which at first means associated with the premise of the principles of accounting, which does not distinguish the activities for which expenditures were made, but a way of computing them.
Guidelines related to the environment are in chapter 6 and those specific for hydroelectric undertakings are listed below:

46 eleTroeVoluÇão JUNHO 2011
Bienal paris 2010Bienal paris 2010
accounting, considering the number of plants.after the entry into operation of the projects,
the commitments arising from actions necessary to maintain environmental compliance are not fully accounted by current legislation under the group called ‘investment’ (environmental actions that are considered essential and complementary deployment of the enterprise).
Part of the accounting is in the category called ‘expenses’, due to the guidelines established by the regulator, and that in case of reversion of assets to the government, expunge such value from the amount to be reimbursed to the concessionaire.
in the case of CeSP, the total payout in 2008 about 489 million reais, with about 209 million are classified as “investment” and 280 million reais as ‘spent’.
referring only to the set of environmental actions, the release is of the order of 50.6 million reais (10.35% of total), of which 38.5 million are classified as real investment “and 12.1 million reais as ‘spent’
The part classified as ‘investment’ (38.5 million dollars), represents about 76% of total disbursement in the year 2008 with the set of environmental actions and should be sufficient to continue the environmental activities. This value, in case of reversal of the asset to the government, would be reimbursed to the concessionaire.
in the category called ‘spent’ (12.1 million reais), making up about 24% of total disbursement in the year 2008, it encompassed the rest of the resources used in the Company’s environmental activity, with strong predominance of resources for staff and commitments after departure of the operating license, here included the costs with the very renewal of licenses.
The figures show that a significant proportion of the resources needed to maintain adequate environmental compliance of a concessionaire are not fully considered in the current regulatory framework in relation to current chart of accounts.
This affirmation becomes even stronger when we consider that the social and environmental issues of the enterprises are highly dynamic, requiring constant adjustment to society and its stakeholders.
For instance, we considered the renewal of a license to operate a business in the granting of the CFSP. in this case uHe eng Sergio motta (Porto Primavera),
3. 0 enVironmenTal duTieS in THe oPeraTional PHaSe oF HYdro eleCTriCal PoWer PlanT
it is a task of the project owner - considering the PP conditions and all costs before the bidding – to compose the budget in order to participate in the bidding and adequate enough to support all the environmental activities during the studies, the construction and even in the first period after operation start but before the first oP renovation.
in the second phase, the operation and maintenance (o&m) costs, the entrepreneur must consider to prepare the budget, elaborated according to the aneel rules, the necessary funds to the perfect functioning of the HPP. nowadays the aneel regulamentation to prepare the o&m budget does not consider the environmental costs in specific items. it is equivalent to say that after the operation phase starts all the socio-environmental costs not considered as investments and included in the bid price will not be visualized in the official budget of operation phase. Complementary actions originated in the licensing process, civil society demands or Public attorney requests could be considered only as a global cost of the project and not as an ordinary cost of o&m project budget. There is an exception related to the expenses generated with forestation activities, fish hatcheries and those related to environment rehabilitation and protection, as mentioned before (2.2).
The costs of obtaining the operational permit renovation (yearly or every 5 years), the maintenance of conservation units created or adopted by the project under the law, the implementation of other environmental legal requirements, the maintenance of the environmental team itself and any other action to maintain the environmental reliability of the HPP, in legal and social significance, to give some examples, are not part of the o&m accountability of the HPP. Part of them is considered investment costs still remaining in the operational phase. This fact does not contribute to know the real value of the activity in one project and bring difficulties to costs comparison with other projects and in the whole energetic system.
The exercise carried out for this Technical report came from two basic information: the estimated investment for 06 hydroelectric Companhia energetica de Sao Paulo - CeSP and the amounts considered for

eleTroeVoluÇão JUNHO 2011 47
Bienal paris 2010
costs from other incurred during the operation? We begin these final considerations recovering a cornerstone issue for any recommendation for further development of this theme.
The preliminary statements of this Technical report are aligned with the benefits of knowledge of socio-environmental costs. it is important to clarify why this option, but first, there is a different point of view.
The appropriation of environment expenditures in general entries valid for all other expenditures of the enterprise is part of a will to simplify accounting procedures, which largely also means savings in time. Such an assumption makes sense in a regulatory environment where it is not necessary to know the cost break-down entrepreneur.
Where a regulation / measurement of what should be done is determined by other instruments, both inside the companies (such as systems management, security and quality) and because of legal instruments (fees, taxes, contributions that all entrepreneurs should bear ).
Finally, among other arguments, there are those related to the characteristics of the business, where any optimization service can mean an economic and financial advantage. after the privatization of public services this last argument gained strength both in the competitive world and in the regulatory environment.
The non-detailed discrimination of environmental costs can also be defended by those who understand the social and environmental aspects as appointments intrinsic to the activity and as the other items of cost, without special detailing. Following this reasoning opening lines for environmental accounts might not be necessary.
moreover, even if one agrees with the need for optimization and simplification of procedures and the consideration of environmental aspects as intrinsic to the business of energy, there are other important factors to consider, in particular: (1) the consolidation of environmental management (and therefore knowledge of the costs associated with it); (2) transparency of management, including financial, not only to regulators but also for society ; (3) the use of natural resources. Considering that the production and transmission of energy are made with natural resources, which relate to public service concessions and, as a rule, a decision with a social cost associated
to check how would be classified the activities to be undertaken at the request of the government’s environmental agency.
This renewal, in their specific requirements of the license, comprises a set of 29 programs or specific environmental actions, of which 25 (almost all) express the nature of strong demand for specialized personnel and basic materials classified as “spent” in accounting.
not without purpose, this feature can lead to a more conservative stance by the concessionaire in the allocation of resources, trying to reduce them and come to affect the results expected by the environmental agency.
Thus, over time, the relationship that initially was 3 to 1 (three shares appropriated as an investment for one as an expense or 76% vs. 24%) tend to be reversed because the structural demands have already been accounted, leaving only the expenditure on the “continuity” of the activity, as seen in the example above.
in a didactic way, to a farming activity we would have the implementation and maintenance of a station for production of fingerlings. This deployment is recorded in investment and maintenance expenditures. after the initial period, the activity of producing fingerlings (expense) remains, requiring staff and supplies such as food, medicines and consumption materials, boosting the “expense” to the “investment”, this no longer needed as the infrastructure of the station has been built.
one can extend the reasoning to other environmental demands such as “monitoring of limnological characteristics and quality of surface water”, the “mapping of macrophytes in the reservoir,” the “analysis and verification groundwater levels, as result of filling the reservoir at elevation 257/259m “, the” monitoring the fish fauna and eggs and larvae, in addition to “assessing the efficiency of implementation, expressed in the manifestation of the licensing agency.
4.0 Final ConSideraTionS and PreliminarY ProPoSal For THe inTernaliZaTion oF enVironmenTal CoSTS durinG THe oPeraTion oF HYdroeleCTriC PoWer PlanTS
is it really necessary to distinguish environmental
48 eleTroeVoluÇão JUNHO 2011
Bienal paris 2010Bienal paris 2010
recommendation of this iT is aimed at increasing the study and the analysis regarding the explicitation of the items in the cost of operation of the projects, through projects of research and development or consulting works, considering the character of emergency in the national scene.
on the other hand, to have sufficient theoretical scope that object must also consider an additional axis and complementary to that of environmental accounting, which concerns the externalities or external costs. at the international scene, attention to externalities have generated many initiatives with the broad spectrum projects like externe, created in 1991 and developed so far. it is not the objective of this iT to address this issue. it only records that the two fields of technical development are linked and under dynamic reformulation.
5.0 BiBlioGraPHY
[1]manual de ConTaBilidade do SerViÇo PÚBliCo de enerGia eléTriCa. aGÊnCia naCional de enerGia eléTriCa – aneel, 2007.
[2] renoVaÇão da liCenÇa de oPeraÇão nº 121/00. iBama 2002.
with it (displacement, the use of arable land, water resources and minerals, etc.); (4) that companies take actions of responsibility and sustainable development and wish to make public the benefit of their business; (5) that spending on environmental commitments arising from negotiations with the licensing bodies, public ministry and affected groups, may gain in importance in the accounts of a particular asset in operation varying without basis of estimates and significantly affecting the assessment of renewal licenses.
The accounting manual has no current specific budget lines for environmental costs but only indicates that these costs should be allocated in the same sub-account of the buildings, civil construction and improvements and machinery and equipment. it is necessary to improve the accounting procedures of the electricity sector, to show clearly the costs of operating generations and transmission systems. according to the authors, the clarity of the information on the costs of the entrepreneur is crucial to evaluate the performance of the concession. The standardization of accounting for environmental costs related to operation and maintenance of the projects may additionally make able comparisons between projects and the definition of performance indicators.
The lack of transparency in the identification and dissemination of data and information on the projects create a complex situation both for the recognition of environmental management systems, usually required in the licensing process and funding of projects, but also when discussing alternatives and arrangements for the renewal of concessions (such as the generation plants, most of which ends in 2011) or when discussing the transfer by sale. in both cases, we must set the value of the asset and its actual cost of operation & maintenance, where the maintenance of environmental compliance should necessarily be considered.
The identification, quantification and appropriate settlement of the costs involved in the stage of operation of the projects also contributes to the improved management of environmental facilities in operation and, more broadly, an open discussion based on the appropriation of socio-environmental costs in order to complement the actual regulations.
Considering the discussed aspects, the first

eleTroeVoluÇão JUNHO 2011 49
Bienal paris 2010
artigo C3-203 apresentado na Bienal Paris 2010
Procedures to evaluate Socio-environmental Costs during the Planning Phase of Transmission Systems
SummARY - The planning process for transmission lines in Brazil begins with some studies developed to propose a solution to address the need of supplying a given area, including the Ten Year expansion Plan and the development of four studies to prepare a specific project to be tendered in public bidding, denominated as r1, r2, r3 and r4.
The scope and content of each one of these four reports are defined by a document (no comma) issued by ePe in may 2005 - “Guidelines for developing Technical reports related to new Transmission line Projects”. These guidelines state that, for specific environmental characteristics that require a different technical treatment, the environmental analysis should provide the required items for an estimate of the costs of each one of the corridor alternatives that are being compared, allowing the comparison of these alternatives including the environmental costs. However, the social and environmental costs of transmission line projects have not yet been totally identified and quantified during the planning phase of transmission line projects in Brazil.
This paper presents the procedures that are being developed by the environmental team of ePe for the incorporation of the social and environmental costs in the planning phase for transmission lines. These procedures are being included in the early planning phase for the transmission system of the Belo monte Hydropower project and will be included in the development of the r1 report.
The main items already estimated are related to:• requirement of higher towers due to crossing over forested areas;• special structures due to crossing over water courses with a width
greater than the usual extensions between conventional towers; and,• special mitigation measures due to the need for the construction of
new access roads at forested areas.Therefore, the development of procedures that allow the identification
of the socio-environmental cost and its incorporation to the planning phase of transmission systems, particularly for projects to be implemented in the amazon region, is an important tool for decision making.
kEYWORDS - Socio-environmental costs, transmission, planning.
1.0 THe PlanninG ProCeSS oF TranSmiSSion line SYSTemS
The planning process for transmission lines in Brazil begins with the studies developed to propose a solution to address the need of supplying a given area. This first result is included in the Ten Year expansion Plan. This
F.P. SERRANR.C. FURTADOH. M. VIEIRA
K. MATOSINHO empresa de pesquisa
energética - epe

50 eleTroeVoluÇão JUNHO 2011
Bienal paris 2010Bienal paris 2010
analysis is a very broad and general one, and it gives only a first idea of amounts of energy that will be transported and the main regions and ecosystems to be crossed. it is important to highlight that the projects included in the Ten Year expansion Plan can be revised and modified due to modification in foreseen demand and also due to changes in the generation projects.
The next phase of the planning process is the development of four studies to prepare a project to be tendered in public bidding. These studies are developed usually with a three year period in advance of the required operation date and include: (i) the r1 report which analyses the technical and economic feasibility of the project, taking into account the socio-environmental aspects; (ii) the r2 report that presents the technical details of the main alternative; (iii) the social and environmental characterization and analysis of the previously selected transmission line corridor, presented in the r3 report; and, (iv) the r4 report that establishes the requirements of the surrounding system, to ensure a suitable interaction between the new and existing facilities.
despite some initiatives and the existence of guidelines for development of the four planning reports (r1 to r4), the incorporation of socio-environmental costs during the planning phase is not yet a routine for the development of these studies and comparison of alternatives. The socio-environmental costs are mainly identified and included to the transmission lines mainly during the feasibility phase and development of the environmental impact Studies.
one initiative of incorporation of the socio-environmental costs to the r1 report was the studies developed in 2004 for the Tucuruí-macapá-manaus transmission line. This study included the estimate of socio-environmental cost associated with the difficulties related to accessibility to isolated areas and the minimization of socioenvironmental costs of a project to be located in the amazon region.
This study and the guidelines issued by ePe in 2005 - “Guidelines for developing Technical reports related to new Transmission line Projects” – are being considered for incorporating the socio-environmental costs to the study of alternatives for the Belo monte hydropower project transmission system.
according to the Ten Year expansion Plan (2008-2017) there will be an increase of the total amount of transmission line projects in the amazon from the existing 3,800 km to approximately 10,200 km by 2017. it is expected that the implementation of transmission line projects in this ecosystem will bring on the need for special structures or environmental mitigation and compensation measurements in order to minimize the potential impacts, which may lead to different costs from the ones usually incurred by the power sector.
2.0 CaSe STudY
The overall integration of the Belo monte Hydropower Project into the Brazilian interconnected Transmission System – Sin include two main studies. The first one, initiated in march 2009, is currently analyzing three main alternatives including: (i) the integration of the Belo monte transmission system (TS) with the transmission of the hydropower projects of the Tapajós river; (ii) the integration of the Belo monte TS with the hydropower projects of the Teles Pires river; and, (iii) the integration to the Tucuruí-macapá-manaus transmission line. The second one is related to the specific transmission system of the hydropower project to the southeast region. This study was recently being initiated, in november 2009. The case study considered for this paper is the first study, involving the three alternatives described bellow:
• Alternative 1 – Interconnection to the Belo Monte system, from São luiz do Tapajós to Xingu;
• Alternative 2 – Interconnection with the Transmission line Tucuruí-macapá-manaus, from São luiz do Tapajós to oriximiná;
• Alternative 3 – Interconnection with the Transmission line of the Teles Pires river system, from São luiz do Tapajós to Sinop.
The Ten Year expansion Plan indicates that the following operation dates for these hydropower projects – 2015 to 2016 for the Teles Pires river, 2015 to 2019 for the Tapajós river, and 2015 for the Belo monte Hydropower project. The transmission line Tucuruí-macapá-manaus is already being constructed.
Figure 1 depicts a schematic view of the three alternatives. despite the selected alternative, another

eleTroeVoluÇão JUNHO 2011 51
Bienal paris 2010
bases were overlaid in a geographical information system – GiS – to identify areas with growing human settlements, dense forests and seasonally flooded regions.
3.0 SoCioenVironmenTal CoSTS eSTimaTed
The socioenvironmental costs estimated for this case study were related to:
• requirement of higher towers due to crossing of forested areas – in those areas of the corridor located in remote regions and untamed forests, it engineering measures were proposed to minimize the interference over the ecosystem: raising the towers 40 meters to be above the forest canopy avoiding clear-cuts; decreasing the number of road accesses; and, narrowing the right-of-way to 15 m. in those areas with a fragile environment, a tower and cable deployment system using helicopters is being considered as a way to minimize the opening of road accesses.
transmission line should be implemented from the north to the southeast region of Brazil. This part of the transmission system, which started to be studied just in november 2009, was not included in this paper.
The main social and environmental characteristics of each alternative are presented in Table 1. The characteristics have been selected taking into account the aspects that could lead to additional socioenvironmental costs and could provide an additional item for decision making. The values shown below were calculated for a transmission line corridor of 20 km, the usual width used for planning studies in Brazil.
The reference map database from ProBio (Project of Conservation and Sustainable use for the Brazilian Biodiversity) has been used as the thematic background to survey the land cover and vegetation items. other information came from iBGe (Brazilian institute of Geography and Statistics) national basemap and remote sensing sources as Google earth and landsat Tm/CBer-S satellite imagery. all these
Figure 1 – alternatives being studied

52 eleTroeVoluÇão JUNHO 2011
Bienal paris 2010Bienal paris 2010
• special structures due to crossing of water courses with a width greater than the usual extensions between conventional towers – an unofficial survey was made with one of cable main manufacturers for a river crossing of 2,4 km within the amazon river. This survey resulted in a price for the cables of approximately 5,5 million uS dollars plus 3,7 million u$ dollars of taxes. This value includes only the cables. The cost related to the transmission line additional height for this extension of river crossing was not included. For the purpose of this alternative comparison we calculated a price per km based on the total cost with taxes (9,2 million u$ dollars) for 2,4 km. an approximate price of 3,8 million u$ dollars per km was used. However, this value did not include a detailed technical analysis of a river crossing of 6,8 km, regarding safety distance, height of towers, etc. The technical studies may consider this a non-feasible alternative.
• special mitigation measures due to the need for construction of new access roads at forested areas – the existence of roads at a distance of at least 25 km is a significant aspect regarding engineering costs
and also the potential need for deforestation for construction of new access roads.
it is quite difficult to obtain reference values for land prices and other costs. However, as one of the main objectives at this planning phase is to compare alternatives and not to obtain a detailed budget for the project, some simplifications have been made, and values that can contain some level of error were allowed. The reference values for land use were obtained through the research carried by the Getúlio Vargas Foundation (FGV), a well known Brazilian consulting and services institute dedicated to administration and economy issues. another important data source was the agraFnP, a leading private consulting company dealing with information and analysis in agribusiness.
one simplification has been the transformation of the values obtained for the corridor (20 km) to a right-of-way of 200 meters. Therefore, it was assumed that the interference observed in the corridor could not be avoided during the development of the studies and also, that no optimization will be possible. This is a very conservative point of view. However, in order

eleTroeVoluÇão JUNHO 2011 53
Bienal paris 2010
additional costs have been added to the forested areas considering the potential need for higher towers due to the need for preservation. The environmental heritage of the amazon and the preservation of its biodiversity are aspects that should not be neglected, and therefore, will probably incur these kinds of additional costs. The study developed for the Tucuruí-macapá-manuas Transmission line also included also some additional costs for cable laying using helicopters. This estimate was not included in the present analysis due to the level of uncertainty at this early phase of planning.
5.0 Final CommenTS
The cost estimated for this project has been based on a identification of the main sensitive areas along the alternative of corridors proposed considering that these aspects can significantly contribute for
to compare alternatives at this early stage of planning, even prior to the development of the r1 report, it was considered that this is an acceptable simplification.
additionally, the costs related to the environmental management system for the project have not been not included, as these costs would be identified and incorporated to the defined transmission line route during the feasibility phase and the environmental impact Study.
4.0 main reSulTS
due to the availability of values for land use, the main characteristics related to land used of each one of three alternatives analyzed have been grouped in four types: agriculture, cattle raising, forested areas and savanna. an average price for the land was used to estimate the cost of implementation of each alternative.

54 eleTroeVoluÇão JUNHO 2011
Bienal paris 2010Bienal paris 2010
estudo lT Tucuruí-macapá-manaus. 2004[5] ProBio (Projeto de Conservação e uso Sustentável
da diversidade Biológica Brasileira), mapa de uso das terras e Vegetação do Bioma aamzônia, 2003, ministério do meio ambiente.
[6] iBGe (instituto Brasileiro de Geografia e estatística), Base Cim – Base Contínua ao milionésimo, revisão 3.01, 2009, ministério do Planejamento, orçamento e Gestão.
the socioenvironmental costs of a future project and consequently for the decision making regarding the best alternative.
it was observed that considering only the value of the land (Subtotal 1) the most expansive alternative would be alternative 3 - interconnection with the Transmission line of the Teles Pires river system, from São luiz do Tapajós to Sinop, due to extensive agriculture and cattle raising areas located in this region. The price of the land of forested areas is considerably low compared to areas occupied with economic activities.
Considering other aspects such as the importance of biodiversity and, consequently, the need of higher towers in order to minimize or avoid impacts on vegetation (Subtotal 2), alternatives 2 and 3 present values that began to be more similar. additionally, considering the existence of river crossing, alternative 2 - interconnection with the Transmission line Tucuruí-macapá-manaus, from São luiz do Tapajós to oriximiná, which requires the crossing of the Xingu river or the crossing of the amazon river, ends being the most expensive one depending on the alternative of crossing to be selected.
despite the lack of accuracy of these costs and the preliminary characteristics of this approach, we considered that this analysis offer a first estimate and an indication that one of the main issues to be considered.
However, these costs should be more detailed and verified and also compared with all other technical, social and environmental aspects to support the decision making regarding the best alternative to promote the transmission of the Belo monte Hydropower project.
6.0 BiBlioGraPHY
[1] empresa de Pesquisa energética – ePe. diretrizes para a elaboração dos relatórios Técnicos referentes às novas instalações da rede Básica. ePe-dee-re-001/2005, maio 2005
[2] FGCdados – online access in nov, 30th, 2009 – http://fgvdados.fgv.br
[3] instituto FnP – análise do mercado de Terras. relatório Bimestral, no. 3, jan/Fev, 2005
[4] Comitê Técnico de expansão da Transmissão.

eleTroeVoluÇão JUNHO 2011 55
artigo d2-201 apresentado na Bienal Paris 2010
a Telecommunications mobile unit forTransmission lines emergency Scenarios
Bienal paris 2010
SummARY - Great part of the Brazilian territory where FurnaS operates in generation and transmission of electric energy is subject to eventual storms with strong winds, sometimes resulting in towers falls and disconnection of Transmission lines (Tl).
The scenario is usually harsh, requiring complicated logistics. Transportation of staff, material and equipment and the restoration of the Tl can only be well performed with the intensive use of Telecommunications.
This study aims to show such emergency scenarios in Tls and the improvements achieved with the adoption of a new Telecommunications solution.
kEYWORDS - Satellite Communications, Transmission lines, emergency Scenarios.
1.0 inTroduCTion
Great part of the Brazilian territory where FurnaS operates in generation and transmission of electric energy is subject to eventual storms with strong winds, sometimes resulting in towers falls and disconnection of transmission lines (Tl). in crises like these the Company carries through, immediately, a detailed analysis of the event and triggers an emergency plan that, among other actions, dislocates teams of maintenance, engineering and support to the place of the accident.
The scenario is usually harsh, requiring complicated logistics. The transportation and installation of staff, the deployment of an adequate and efficient support camp, the displacement of the material needed to perform the work and to provide infrastructure and the restoration of the Tl can only be well performed with the intensive use of telecommunications.
Between 1970 and 2009 due mainly to strong windy storms, 82 accidents occurred destroying 213 towers, resulting in a mean time to repair of about 7 days and, depending on the magnitude of the event, involving up to 500 professionals. The sites are distributed along all FurnaS operation area (figure 1) and are, tipically, sites of difficult access (Figures 2 and 3) and of hostile environments.
Alexandre Pinhel Soares Ricardo Medeiros
José Antonio Paula MottaFurnas Centrais elétricas s.a.
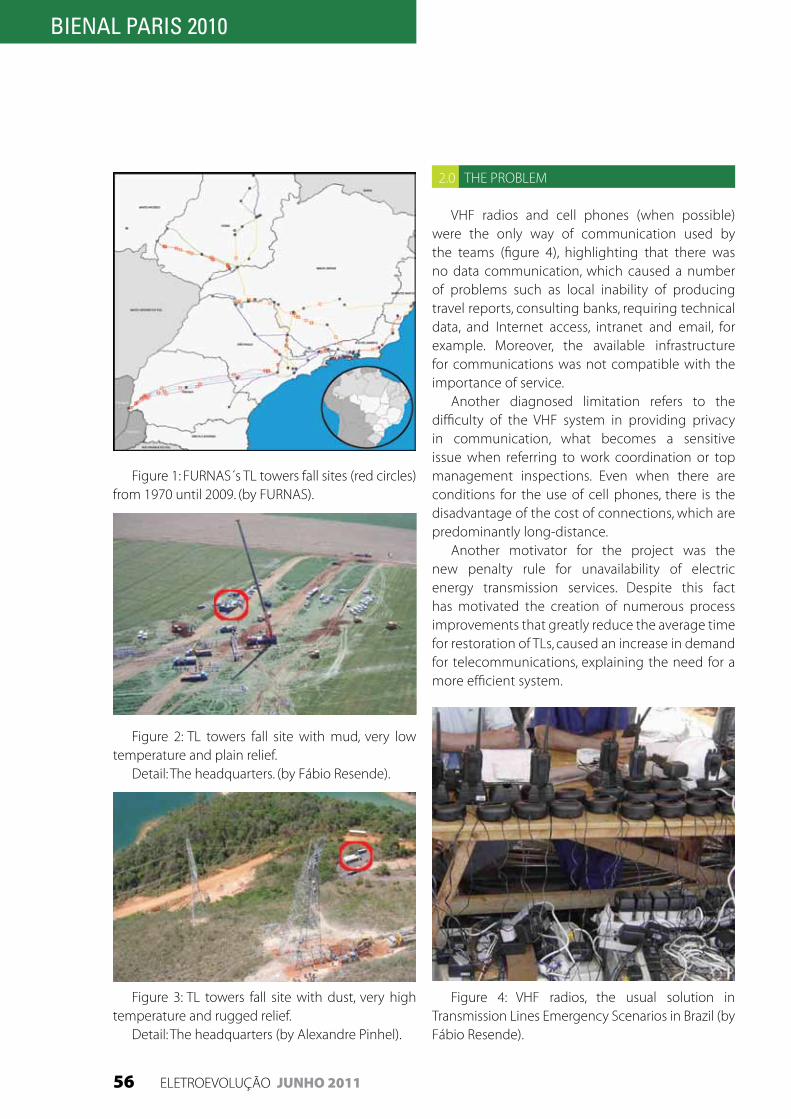
56 eleTroeVoluÇão JUNHO 2011
Bienal paris 2010Bienal paris 2010
Figure 1: FurnaS´s Tl towers fall sites (red circles) from 1970 until 2009. (by FurnaS).
Figure 2: Tl towers fall site with mud, very low temperature and plain relief.
detail: The headquarters. (by Fábio resende).
Figure 3: Tl towers fall site with dust, very high temperature and rugged relief.
detail: The headquarters (by alexandre Pinhel).
2.0 THe ProBlem
VHF radios and cell phones (when possible) were the only way of communication used by the teams (figure 4), highlighting that there was no data communication, which caused a number of problems such as local inability of producing travel reports, consulting banks, requiring technical data, and internet access, intranet and email, for example. moreover, the available infrastructure for communications was not compatible with the importance of service.
another diagnosed limitation refers to the difficulty of the VHF system in providing privacy in communication, what becomes a sensitive issue when referring to work coordination or top management inspections. even when there are conditions for the use of cell phones, there is the disadvantage of the cost of connections, which are predominantly long-distance.
another motivator for the project was the new penalty rule for unavailability of electric energy transmission services. despite this fact has motivated the creation of numerous process improvements that greatly reduce the average time for restoration of Tls, caused an increase in demand for telecommunications, explaining the need for a more efficient system.
Figure 4: VHF radios, the usual solution in Transmission lines emergency Scenarios in Brazil (by Fábio resende).

eleTroeVoluÇão JUNHO 2011 57
Bienal paris 2010
3.0 THe TeleCommuniCaTionS SoluTion
The FurnaS maintenance engineering staff, identifying these severe communication resources limitations during Tl towers fall events, has developed an integrated environment for voice and data with full mobility capacity called Telecommunications mobile unit (Tmu).
The solution consists of a acclimatizer container and reliable infrastructure that can provide energy to the surroundings of the site, ability to access the Public Telephone Switched network (PSTn), the FurnaS internal Telephony System, internet, intranet and Company’s mainframe applicatory, beyond providing telephone communication among local users with a range of up to 5 km, depending on the topography (figures 5 and 6).
Both voice and data services are supplied by equipment with wireless communication, providing full mobility to users. once installed at the emergency site, all communication is transported to the main office in rio de janeiro through a single satellite data link that is defined in a bidding process. This simplification was shown to be feasible from the adoption of the technology of voice “over iP” (VoiP). The system also allows the implementation of communications such as “hot-line”, turning the access to the work status possible for the senior management.
different users like the security and supervision staff may have specific extensions in order to be easily located. important visits that need to be found with ease can also receive this treatment. Furthermore the project is scalable, allowing expansion of resources in case of need.
The energy infrastructure is extremely reliable ensuring high availability of voice, data and transmission equipment and the refrigeration is achieved by common air conditioning. There were no perceived interference among the data equipment, VHF radios and wireless local telephony.
For logistical issues, the Tmu is based in minas Gerais, but it is moved to the accident site immediately after the triggering of an
emergency plan in order to provide the communication services as soon as possible to the field teams.
The Tmu is quite compact and does not present difficulties for transport and positioning, even in installations on irregular ground not needing, within certain limits, a very rigorous leveling of the ground (figures 7 and 8).
equipment for voice and data do not show special features, and can be easily found on the market. But the equipment of transmission, being more specific, are hired together with the satellite link, making the project independent of proprietary technology solutions.
it was also defined that these equipment were supposed to have automatic activation capacity because of the difficulty of local communication, what could hamper the activation of the Tmu in case of needing to contact the hired company to perform the procedures, especially regarding the orientation of the antenna.
Finally, to act as a contingency mechanism for the system’s main Tmu there are two satellite telephony devices.
Figure 5: General characteristics of the Tmu (by alexandre Pinhel).

58 eleTroeVoluÇão JUNHO 2011
Bienal paris 2010Bienal paris 2010
Figure 8: Positioning the Tmu (by alexandre Pinhel).
Figure 6: The Tmu system.
Figure 7: moving the Tmu (by alexandre Pinhel).

eleTroeVoluÇão JUNHO 2011 59
Bienal paris 2010
4.0 THe eConomiCal SoluTion
The Satellite operators didn’t accept the on demand rental modality which supposes payment only for days of utilization citing lack of interest in economic return or lack of technical conditions to ensure the band when this was requested. The sugestion of these companies was the rent for continued use of the link, regardless of use, which hindered the economic viability of the project. at this point the budgeted annual estimated costs totaled between 65 and 100 thousand euros.
after persistent effort in convincing the supplier that the brand FurnaS was highly valuable and that the use of the system would bring a good return to the supplier’s image creating possibilities for new business in the Brazilian electricity Sector, economics feasibility has been reached by means of a franchising operation at pre-fixed rate varying on a daily basis for each exceeding day.
in this model FurnaS pays the contractor for 30 days of use per year, regardless of effective use. This value will be diluted over the pre-set monthly fee. if using more than 30 days per year, extra days will be paid separately and considering the daily value, also pre-set, and used to compose the total contract price. Thus we were able to stipulate the fixed value (30 days per year) with the surplus value (days exceeding the 30 days pre-contracted), avoiding abusive prices.
The final result of this negotiation reached a value of about 15 thousand euros per year.
5.0 ConCluSionS
When opting for the inclusion of transmission equipment in the rental of satellite link, the system became independent of Satellite operators and we were able to choose the service regarding price or quality.
When not in the field, the Tmu could be used as a laboratory for studying the effects of the ionosphere [1] and the Weather in the satellite link and for acquiring knowledge about this type of technology, which is uncommon in company, but that could be frequently used under the demand of new ventures.
The use of commercial equipment that provide voice, data, power and cooling functions ensures easy restoration of services in case of failure. For satellite
transmission equipment, which are more specific, there are contractual guarantee. The adoption of equipment with automatic antenna pointing enables the activation of the system without the presence of very specialized staff.
depending on the magnitude of the event, the media could be interested in moving to the venue. in such cases the umT can serve as a vehicle of propaganda for the Company when providing technological resources that can help in their coverage.
Besides the expansion of resources for effective communication, the project provides increased reliability of the VHF system (which will continue to be used), as the energy infrastructure also include such equipment.
With all the improvements offered to telecommunications services, restoration of transmission lines will be safer and will have their time and their costs reduced, with obvious and direct return to the Company, the employees and the society.
6.0 BiBlioGraPHY
[1] Pinhel Soares, a, “monitoração de disponibilidade em enlaces de comunicação por satélite”, Xi eriaC, Paraguai, 2005.
60 eleTroeVoluÇão JUNHO 2011
artigo apresentado no Xi edao 22 a 26 de novembro de 2010
Sistema de diagnóstico de Perturbaçõesem Tempo real
Xi edao
RESumO - este trabalho apresenta uma proposta de triagem e interpretação de sinalizações de proteção, capaz de auxiliar o operador no entendimento de uma determinada perturbação no sistema de transmissão de energia, em tempo real. o objetivo é fornecer melhores condições (segurança e rapidez) para a equipe durante a tarefa de restabelecimento de equipamentos desligados em decorrência de perturbações no sistema elétrico.
PALAvRAS-ChAvE - diagnóstico de Perturbações, Sistemas especialistas, Tratamento de alarmes, restabelecimento, indisponibilidade.
1.0 inTroduÇão
uma das principais atividades desempenhada pelas equipes de operação de centros de operação é o restabelecimento de instalações e sistemas elétricos após perturbações. eventos desta natureza dão origem nos sistemas de supervisão e controle dos centros de operação a um fenômeno conhecido como “avalanche de alarmes” [1], [3].
Por se tratar de um problema enfrentado por diversas equipes de operação em tempo-real, muitas idéias surgiram com objetivo de tratar, interpretar e agrupar alarmes e sinalizações semelhantes, ou que possuam algum tipo de correlação. a idéia principal é tentar reproduzir, de forma automática e segura, o diagnóstico realizado por especialistas da área, no momento de restabelecer equipamentos desligados em decorrência de uma determinada perturbação [2].
Situações de contingência como blecautes no sistema elétrico, de forma geral, possuem causas aleatórias e imprevisíveis. no momento em que o operador se depara com uma situação de blecaute, sua atenção é direcionada para a identificação de sua causa. isto pressupõe uma avaliação criteriosa, tão dispendiosa quanto maior for a amplitude do blecaute. uma vez consciente da quantidade de equipamentos envolvidos na ocorrência, é necessário identificar quais equipamentos necessitam ser isolados do restante do sistema interligado, e quais os que podem ser imediatamente restabelecidos. Tendo a informação da causa ou origem da perturbação, esta análise pode ser efetuada de maneira ágil e eficaz.
Fábio Augusto da Silva AntunesCemig Geração e transmissão
sa
Paulo Márcio da SilveiraUnifei – Universidade Federal
de itajubá

eleTroeVoluÇão JUNHO 2011 61
Xi edao
triagens iniciais e seleções de alarmes, de tal modo que os mesmos possam ser apresentados de forma mais objetiva e inteligível aos operadores [1], [4], [5].
outros conjuntos de regras identificam a incidência de determinados tipos de proteção, para cada equipamento a ser analisado. Há, portanto, regras para identificação de proteções de transformadores, linhas de transmissão, barramentos, reatores, banco de capacitores, etc. outras regras ainda reconhecem algumas combinações de alarmes de interesse para o operador.
as regras mencionadas compõem o “motor de inferências”. o conhecimento das relações existentes entre os equipamentos e alarmes de interesse está armazenado exclusivamente na base de dados do sistema, de tal modo que não são necessárias intervenções nas estruturas e códigos do sistema computacional (representado neste caso pelo motor de inferências) para fins de atualização da base de conhecimentos.
a metodologia apresentada neste trabalho está baseada não na simples eliminação de alarmes menos importantes, mas sim em um novo conceito de apresentação de alarmes. dá-se maior foco para os alarmes oriundos de sinalizações de proteção relacionados aos equipamentos envolvidos nas perturbações.
FiGura 1 – diagrama representativo de um Sistema especialista
o conteúdo apresentado na seqüência refere-se ao desenvolvimento do protótipo do Sistema de diagnóstico de Perturbações em Tempo real (SdP-Tr), que atualmente opera no CoS – Centro de operação do Sistema – da Cemig G.T. [1].
a questão da agilidade reforça a motivação no desenvolvimento deste trabalho uma vez que a indisponibilidade de equipamentos da transmissão repercute na qualidade da energia elétrica e na diminuição da receita da transmissora.
2.0 TraTamenTo de alarmeS e diaGnÓSTiCo de PerTurBaÇÕeS aTraVéS de SiSTemaS BaSeadoS em ConHeCimenTo
um sistema capaz de reproduzir, de forma plena, toda a habilidade do especialista na identificação da causa de uma perturbação é o desejo de muitas empresas do setor. entende-se, no entanto, que as ferramentas de tratamento de alarmes e diagnóstico de perturbações mais complexas, embora capazes de gerar os melhores resultados (diagnósticos mais completos e objetivos), estarão mais expostas às falhas dos sistemas de aquisição de dados. além disso, demandarão maior capacidade computacional ou ainda sofrerão maior dificuldade com a manutenção de suas bases de dados. Tais elementos passam a ser leitmotiven para que as equipes de desenvolvimento de soluções repensem as metodologias para os usuários dos centros de operação.
nessa linha de raciocínio, surge a proposta deste trabalho, a qual não substitui o conhecimento e experiência das equipes de operação, mas, ao contrário, agrega segurança e precisão em suas análises.
os alarmes e sinalizações de proteção que chegam ao sistema de supervisão e controle do centro de operação são os principais subsídios para o desenvolvimento de uma ferramenta capaz de promover diagnósticos em tempo real.
a existência de padrões nas nomenclaturas de alarmes e sinalizações de proteção sugere o uso de metodologias de inteligência computacional no trato do problema. nesta linha de raciocínio, as propostas existentes na literatura propõem uso de sistemas baseados em conhecimento (SBC) como uma tentativa de agregar, através de ferramentas computacionais, o conhecimento consolidado pela experiência dos operadores dos centros de operação.
a metodologia adotada nesta proposta é conhecida como Sistemas especialistas – Figura 1. através de regras do tipo “Se... então:”, são promovidas

62 eleTroeVoluÇão JUNHO 2011
Xi edao
o padrão de construção destas estruturas de dados aplica-se a todos os equipamentos do sistema operado pela Cemig G.T., e seus respectivos relés de proteção. nota-se, portanto, que a adaptação do SdP-Tr a uma mudança de topologia do sistema elétrico requer somente a adição de um novo registro (para novos equipamentos) ou alteração de um dos registros existentes (quando a alteração limitar-se à configuração da subestação).
2.2 motor de inferênciaso motor de inferências deste sistema concentra
todas as regras de análise necessárias para a elaboração de diagnósticos de perturbações.
dada uma determinada ocorrência no sistema, compreendida dentro de um intervalo temporal de alarmes e sinalizações de proteção, as regras de interpretação deverão reconhecer as seguintes incidências [1]:
• Alarmes que representam equipamento “fora de operação”;
• Sinalizações de proteção associadas ao equipamento “fora de operação”;
• Alarmes de mudança de estado operativo dos disjuntores associados.
estas regras fazem parte da etapa de triagem. outras regras são aplicadas, posteriormente, com a finalidade de interpretar as seqüências de alarmes e sinalizações de proteção recolhidas conforme a triagem.
na seqüência são apresentados os conjuntos de proteção para os diversos tipos de equipamentos a diagnosticar. é importante destacar que os arranjos de proteção variam conforme o nível de tensão de operação. as regras são, de forma geral, aplicáveis para equipamentos que operam em tensão igual ou superior a 138kV.
2.2.1 Transformadores e reatoresSe o equipamento “fora de operação” for um
transformador ou um reator, um determinado conjunto de regras é ativado. a Tabela 2 abaixo ilustra exemplos de proteções associadas a transformadores e reatores, necessárias para a elaboração de diagnósticos [6], [7]:
2.1 Base de dadosa base de conhecimentos deve conter
informações sobre os equipamentos que se desejam diagnosticar. no entanto, deve-se tomar o cuidado de evitar estruturas demasiadamente complexas, que impeçam aos demais usuários promover atualizações referentes às alterações na topologia do sistema elétrico.
no CoS-Cemig, as sinalizações de proteção que chegam ao sistema de supervisão e controle carregam consigo o número de operação do equipamento (para reatores, transformadores, barramentos) ou o número do disjuntor associado (para o caso de linhas de transmissão). além disso, as mudanças de estado operativo destes equipamentos são informadas através de alarmes gerados pelo sistema de configuração de redes.
a Tabela 1 abaixo ilustra um exemplo de registro armazenado na base de conhecimentos do SdP-Tr:
TaBela 1 – exemplo de registro da base de conhecimentos do SdP-Tr.

eleTroeVoluÇão JUNHO 2011 63
Xi edao
TaBela 3 – Principais proteções de linhas de transmissão.
ao constatar o desarme de uma linha de transmissão, o operador busca na tela de alarmes a incidência de proteções que o leve a concluir sobre eventual existência de proteção impeditiva (relé 86), atuação de religamento automático (relé 79), proteções contra curto-circuito (relés 21, 67, 50, 51), etc. São, portanto, estas informações que devem estar imediatamente disponíveis para facilitar a etapa do restabelecimento da lT. outras informações como transferência de disparo (funções 77 e 85) e sobretensão (relé 59) complementam o diagnóstico da ocorrência.
Tão importante quanto saber se houve a atuação destas proteções, é saber quando elas não atuam, da mesma forma como comentado nas regras de exceções para transformadores.
Sabe-se que alguns tipos de disjuntores de linhas de transmissão possuem limitações quanto ao intervalo de tempo entre dois ciclos o.C.o. (open – close – open), ou seja, em uma eventual ocorrência de religamento automático não satisfatório, o operador não deve submeter o disjuntor a um novo comando de fechamento imediatamente. isto justifica a necessidade de se saber, em tempo real, sobre a atuação ou não do relé de religamento automático (79).
TaBela 2 – Principais proteções de transformadores e reatores.
Feita a detecção destes relés no intervalo de alarmes selecionado, outro grupo de regras deve preocupar-se com análises conjuntas. Supondo que um transformador “fora de operação” indique atuação das funções 26, 49, e não indique outras funções da Tabela 2, o sistema poderá informar que “não houve atuação de proteções elétricas” e também “não houve bloqueio”. Pode ainda sugerir que o equipamento foi desligado por “sobrecarga”. de posse dessas informações obtidas em tempo real, o operador tem melhores condições de compreender a causa do desligamento e promover o restabelecimento com maior agilidade.
Tão importante quanto às regras que indicam a atuação de determinado relé, são as regras de exceção, que indicam a não atuação de proteções relevantes para o diagnóstico. as regras de exceção, para ser mais eficazes na elaboração do diagnóstico, devem indicar a não atuação de “proteções elétricas”, “proteções físicas” ou “bloqueio” – para o caso de transformadores.
2.2.2 Linhas de Transmissãode maneira análoga aos transformadores e
reatores, foram levantadas as principais funções de proteção para linhas de transmissão (lT). São estas apresentadas na Tabela 3 a seguir:

64 eleTroeVoluÇão JUNHO 2011
Xi edao
as regras de exceção podem também ajudar o operador a identificar uma situação de desarme indevido de uma linha de transmissão. Supondo que num determinado desarme não ocorra atuação de proteção elétrica (21, 67, 50, 51, etc.), mas ocorra uma transferência de disparo que desliga um ou os dois terminais da linha. um possível diagnóstico seria: “lT 345kV neves 1 - Barreiro 1: Transfer-trip sem sinalização de proteção elétrica”, claro o suficiente para que o operador passe a investigar outra possível causa para o desarme, excluindo a hipótese de curto-circuito.
2.2.3 Barramentosarranjos de proteção para barramentos são
geralmente constituídos por proteções diferenciais, de subtensão, sobretensão e contra falha de disjuntor, tal como indica a Tabela 4 abaixo:
TaBela 4 – Principais proteções de barramentos.
Perturbações em barramentos costumam ser mais raras do que as que envolvem linhas de transmissão. as conseqüências, no entanto, são bastante graves. Barramentos desligados por falha de disjuntor (funções 50BF / 62BF) indicam a ocorrência de uma perturbação múltipla, iniciada em outro elemento do sistema, cujo(s) disjuntor(es) associado(s) não obedeceram ao comando de abertura enviado pelo seu próprio arranjo de proteção. este evento supostamente leva o operador a concluir que a falta não teve origem no barramento, mas sim em equipamento externo. Tendo esta informação em tempo real, o restabelecimento ocorrerá de forma muito mais objetiva.
ao contrário, se o desligamento ocorrer devido atuação de proteção diferencial (relé 87), a indicação mais provável é de defeito interno ao barramento.
as regras de exceção para tratamento de ocorrências em barramentos podem auxiliar o operador na identificação uma atuação indevida dos arranjos de proteção. Supondo um desligamento com incidência de relé de bloqueio (86), sem atuação das demais proteções comentadas, o operador direcionará foco para outra possível causa para o desarme.
2.3 Apresentações dos diagnósticosos diagnósticos devem ser apresentados
ao operador juntamente com todos os alarmes relacionados ao equipamento desligado. uma vez que os alarmes foram devidamente triados na etapa anterior, não haverá excesso de informações que atrapalhe sua compreensão acerca da perturbação. as tabelas 5, 6 e 7 abaixo ilustram exemplos de apresentação destas informações:
TaBela 5 – alarmes de uma ocorrência envolvendo transformador
a tabela 5 destaca os alarmes provenientes de uma perturbação em um transformador de 400mVa, 500/230kV, no qual foi constatada falha interna ao equipamento. o diagnóstico indicou “meSQ T001: relé de gás; válvula alívio pressão; sem sinalização prot.elétrica; BloQueio” corretamente.

eleTroeVoluÇão JUNHO 2011 65
Bienal paris 2010Xi edao
TaBela 6 – alarmes de uma ocorrência envolvendo barramento
a tabela 6 destaca um desligamento em um barramento de 345kV por atuação de proteção diferencial, seguida de bloqueio. a mensagem “Barr1B1S2_345P: diFerenCial de barra; bloqueio; Vm; aZ; Br” indicou corretamente o evento.
TaBela 7 – alarmes de uma ocorrência envolvendo linha de transmissão
a ocorrência em uma lT de 500kV mostrada na tabela 7 relata “BdeSP3_SGPara_u: prot.distância; recepção transfer trip; sem relig.autom;”. a indicação de não ocorrência de religamento automático e das demais proteções foi correta e objetiva.
as mudanças de estado de disjuntores são destacadas em cores (vermelho para abertura e azul para fechamento), de modo a diferenciá-las das sinalizações de proteção, e conseqüentemente
facilitar o entendimento do operador.na primeira linha das Tabelas 5, 6 e 7 estão
dispostos, além dos nomes dos equipamentos, os disjuntores associados. nas linhas abaixo são representados os alarmes (alinhados á respectiva coluna) juntamente com os respectivos horários de atuação. na última linha, segue o diagnóstico resumindo a interpretação dos alarmes triados para aquele determinado equipamento.
3.0 reSulTadoS PrÁTiCoS
Para validar a eficácia da proposta apresentada neste artigo, foram submetidas para análise mais de 160 perturbações, correspondendo todo histórico de ocorrências envolvendo o sistema de Transmissão operado pelo CoS – Cemig, dos anos de 2008 e 2009.
Cada diagnóstico fornecido pelo SdP-Tr foi devidamente comparado com os relatórios de operação e as respectivas análises de ocorrências elaboradas pelo setor de análise (pós-operação) do CoS-Cemig.
os resultados apresentados estiveram bastante alinhados aos insumos de comparação mencionados. das 160 perturbações, um total de 146 (91%) apresentaram diagnóstico condizente com as referências utilizadas.
as poucas falhas encontradas estiveram relacionadas com sinalizações que não chegaram ao sistema de supervisão e controle, e comprometeram as análises na medida de sua importância para a compreensão do evento.
Para contornar este problema, o SdP-Tr passou a utilizar duas fontes distintas de sinalizações de proteção: os alarmes gerados pelo SCada e as Seqüências de eventos (Soe). esta segunda fonte de dados traz consigo a vantagem da “estampa” de tempo com precisão de milissegundos. o SdP-Tr compara as duas fontes e trata de forma especial informações faltantes ou redundantes, de modo a diminuir as conseqüências decorrentes de falhas na recepção de alarmes, e reforçar o diagnóstico quando as informações são convergentes. o percentual de diagnósticos bem sucedidos foi obtido com base nesta estratégia de análise.
é importante ressaltar que em nenhuma das análises o SdP-Tr apontou diagnóstico incorreto,

66 eleTroeVoluÇão JUNHO 2011
Xi edao
dadas as informações disponíveis.Constatou-se durante as análises que o módulo
de alarmes do sistema de supervisão e controle registrou, em média, 370 alarmes e sinalizações de proteção em intervalos de 10 minutos, nos quais estiveram contidos os alarmes referentes aos instantes iniciais da ocorrência, bem como os alarmes relacionados ao restabelecimento dos equipamentos envolvidos na perturbação. Grande parte destes alarmes não tinha relação alguma com a perturbação em questão.
é bastante notória a redução do esforço humano gasto para a diferenciação dos alarmes que têm envolvimento com as perturbações sob análise. a equipe de operação em tempo-real do CoS-Cemig passou a fazer uso do SdP-Tr, ainda em fase de experimentação, com o objetivo de auxiliar a elaboração dos relatórios diários de operação (rdo), nos itens referentes à ocorrências no sistema (levantamento de proteções atuadas e causas). este mesmo sistema, pelo fato de permitir consultas em quaisquer períodos, tem sido utilizado de forma mais intensa pelas equipes de análise (Pós-operação), na tarefa de elaboração dos relatórios de perturbações.
4.0 ConCluSÕeS
o SdP-Tr, conforme já mencionado, refere-se a um protótipo em fase de validação e aprimoramento das regras de interpretação. a meta é implantá-lo no próprio sistema de supervisão e controle do CoS-Cemig.
este trabalho foi desenvolvido com o propósito de auxiliar o entendimento da equipe de operação em Tempo real do CoS-Cemig, sobre perturbações no sistema elétrico. justifica-se a escolha dos insumos utilizados (alarmes e sinalizações de proteção) por se tratar de uma aplicação para uso em tempo-real.
os diagnósticos de pós-operação consideram muitas outras informações além de alarmes, tais como registros de oscilografias, informações locais da subestação, inspeções em equipamentos, etc., que, devido ao elevado nível de detalhamento, estão bastante distantes de fornecer as respostas que os operadores do centro de operação demandam.
é importante ressaltar que as ferramentas computacionais baseadas no processamento de alarmes ainda sofrem prejuízos por falhas oriundas na aquisição de dados que, embora apresentem baixas probabilidades, podem lamentavelmente prejudicar
os resultados destes aplicativos e levá-los a promover diagnósticos equivocados. estas falhas podem originar-se nas uTrs (unidades terminais remotas) instaladas nas estações (usinas e subestações), nas diversas vias de telecomunicação, ou ainda na própria infraestrutura de dados dos centros de controle.
Contudo, os resultados apresentados atenderam ao propósito deste trabalho e comprovaram o grande potencial das metodologias de inteligência computacional para o trato de problemas do cotidiano de centros de operação.
os próximos passos consistem no aprimoramento das regras de diagnóstico, de modo a agregar maior confiabilidade e objetividade nas análises. outro ponto de melhoria é a implementação de análise por terminal de equipamento (especialmente para os casos de perturbações em linhas de transmissão).
5.0 reFerÊnCiaS BiBlioGrÁFiCaS
[1] antunes F. a. S., Silveira P. m., Sistema de Triagem de alarmes e análise de Perturbações, monografia do Curso de especialização em Sistemas elétricos – uniFei universidade Federal de itajubá, 2009.
[2] Cardoso jr G., rolim j. G., Zürn H. H., diagóstico de Faltas em Sistemas de Potência: definição do Problema e abordagens via inteligência artificial. revista Controle & automação/Vol.15 n°.2/abril, maio e junho 2004, 2004.
[3] Batista l., Cunha r., Vasconcelos G., adeodato P., noronha C., Genu j., regueira B., Sistema Híbrido inteligente para Tratamento de alarmes e diagnóstico de Falhas em redes elétricas, XXV Congresso da Sociedade Brasileira de Computação, São leopoldo-rS, 2005.
[4] Falcão d. m., Técnicas inteligentes aplicadas a Sistemas elétricos de Potência, notas de aulas Programa de engenharia elétrica - CoPPe/uFrj, 2002.
[5] mendes r. d., inteligência artificial: Sistemas especialistas no Gerenciamento da informação, Ci. inf. vol. 26 no. 1 Brasilia jan./apr, 1997.
[6] Schweitzer engineering laboratories inc. 2007, Tabela ansi, http://www.selinc.com.br/tab_ansi.htm, 2007.
[7] onS - operador nacional do Sistema - Procedimentos de rede, Submódulo 2.6: requisitos mínimos para os sistemas de proteção e de telecomunicações, 2009

eleTroeVoluÇão JUNHO 2011 67
artigo apresentado no Xi edao 22 a 26 de novembro de 2010
desenvolvimento de método paraaperfeiçoamento de operadores através da imersão
em ambiente de Simulação
RESumO - este artigo apresenta a experiência obtida por Furnas Centrais elétricas, no desenvolvimento e emprego de uma plataforma para Treinamento imersivo, para a formação e aperfeiçoamento de operadores de usinas ou Subestações. além dos baixos custos para o desenvolvimento, implantação e operacionalização, o emprego dos meios e métodos aqui apresentados, favorece a produção e retenção de conhecimentos.
PALAvRAS-ChAvE - aperfeiçoamento, Gestos, operadores, Tridimensional.
1.0 inTroduÇão
no âmbito Furnas Centrais elétricas o processo de formação de um novo operador de usinas ou Subestações, tem início com o Concurso Público. os candidatos aprovados nesta fase possuem formação técnica na área de eletrotécnica ou eletrônica, podendo ter ou não experiência no setor.
em uma segunda fase do processo de admissão, o candidato participa do “CTB” ou “Curso de Treinamento Básico” ministrado no Centro de Treinamento de Furnas, que possui caráter eliminatório, sendo composta por aulas teóricas e práticas. o candidato que concluir mais esta etapa com sucesso é encaminhado para a lotação final em uma das diversas instalações do Sistema Furnas, onde é concluída a sua capacitação.
durante a sua vida profissional, o operador de usinas ou Subestações participa do “Programa de Certificação”, que possui período trienal, e visa garantir que o colaborador reúna condições físicas, mentais e técnicas para atuar na operação de uma determinada instalação.
Considerando as mudanças que o Setor elétrico Brasileiro tem sofrido nos últimos anos, nos aspectos de aumento de complexidade da rede, interfaces de controle, regulação no setor, competitividade e principalmente no impacto que a adoção da Parcela Variável ocasiona às receitas das empresas, é que se tornou evidente que a metodologia até então empregada necessitava de melhorias.
Enéas Macedo Ribeiro JúniorÂngelo Andelnyr Sampaio Alves
eletrobrás Furnasrio de Janeiro/rJ
Xi edao
68 eleTroeVoluÇão JUNHO 2011
Xi edao
2.0 oBjeTiVo
aprimorar processo em uso nas dependências de Furnas Centrais elétricas, para a formação e aperfeiçoamento de operadores de usinas ou Subestações, nos seguintes tópicos:
eficiência: acelerar o processo de melhoria de desempenho através da disseminação de conhecimentos de forma planejada, associada à exposição do Treinando a vivências em situações de crise, com o emprego de técnicas Treinamento imersivo.
Treinamento Humanizado: Todo o processo é gerenciado e conduzido por um funcionário que tem a função de ser o facilitador da atividade. desta forma se pretende potencializar os resultados obtidos com o emprego de equipamentos simuladores para fins de treinamento, uma vez que os conteúdos a serem ministrados são voltados às necessidades imediatas de conhecimentos dos Treinandos.
escalabilidade: os equipamentos simuladores empregados no treinamento podem ser ampliados ou suas configurações podem ser modificadas de acordo com as necessidades da usina ou Subestação que estão representando.
Conectividade: Para permitir o treinamento de situações que envolvam mais de uma instalação, os equipamentos simuladores desenvolvidos podem atuar em uma operação conjunta, reproduzindo o funcionamento de um trecho da rede sob concessão da empresa.
Baixo custo: o emprego de plataforma tecnológica orientada ao “software livre”, participação da força de trabalho local no desenvolvimento dos aplicativos e na tutoria do processo de treinamento como, também a aplicação dos “Turnos de Simulação” no próprio local de atuação do Treinando, são os fatores determinantes para que a solução apresentada necessite de baixos valores de investimento, tanto para o desenvolvimento quanto para a operacionalização.
3.0 PremiSSaS
São raros os momentos onde o operador de uma instalação entra em contato diretamente com o
equipamento a ser manobrado, durante um evento de restabelecimento. Via de regra, as mudanças de estado em chaves seccionadoras e disjuntores se dão através da realização de comandos em algum tipo de interface, que pode ser um painel elétrico, a iHm de um relé digital ou ainda uma estação de trabalho onde está sendo executado algum aplicativo para supervisão e controle. então, a percepção sobre o estado dos equipamentos que estão sob o controle do operador se dá através de meios indiretos. as interfaces de controle e supervisão produzem informações sobre o estado do equipamento comandado, como também a ordem de grandeza dos valores analógicos presentes nos equipamentos de geração ou transmissão.
a partir desta percepção é que as soluções para simulação se baseiam, uma vez que para simular perturbações uma instalação, basta fazer com que as interfaces de controle e supervisão produzam informações que levem a um indivíduo a acreditar que está realmente em meio a uma ocorrência.
Se os estímulos sensoriais produzidos durante a simulação como também o próprio ambiente forem suficientemente realistas, é possível proporcionar ao Treinando a sensação de “transportação” o que é descrito por utiel[1] como “um momento onde há um forte elo entre o indivíduo e o ambiente virtual com o qual está interagindo”.
o efeito que este tipo de interação proporciona ao participante daquela atividade de treinamento é análogo a vivenciar a uma situação de crise na realidade, porém todo o processo ocorre em um ambiente controlado sem conseqüências danosas tanto para o indivíduo quanto para o Sistema elétrico.
então, a base do trabalho aqui apresentado consiste na reprodução realista dos estímulos sensoriais e das situações vivenciadas nas Salas de Controle de usinas ou Subestações, em um ambiente de Simulação. a exposição do Treinando a este “ambiente Virtualizado” de trabalho para o desempenho de atividades com complexidade compatíveis com os seus níveis de conhecimentos naquele momento, permite ao indivíduo desenvolver os comportamentos necessários para atuar de forma adequada em situações de crise ou

eleTroeVoluÇão JUNHO 2011 69
que irá detectar as necessidades de conhecimento da sua equipe e então elencará os Cenários de Simulação com graus de dificuldades adequados ao grupo de operadores.
o Treinando é notificado através de e-mail corporativo sobre a data da realização do Turno de Simulação, qual o tema que será abordado e ainda nesta mesma mensagem, é ofertado a ele um teste para verificação de conhecimentos através do SiCC – “Sistema integrado de Capacitação e Certificação”. o objetivo desta mensagem é assinalar para o participante quais os conhecimentos que ele deverá deter e quais comportamentos ele deverá apresentar para obter sucesso durante a fase de Simulação.
Tem início então o momento da “auto-instrução”, uma vez que o indivíduo deverá buscar por sua iniciativa, os conhecimentos necessários no material técnico disponível ou através de consultas ao operador Chefe de Turno ou ainda ao Tutor. o padrão de rendimento mínimo do teste objetivo de conhecimentos realizado no SiCC é de 75%.
na data previamente agendada, geralmente durante o turno da manhã, o Treinando comparece ao “ambiente de Simulação” para a realização do “Turno de Simulação”, onde o tema sugerido na notificação via e-mail é abordado sob a forma de uma situação de crise na instalação.
espera-se que o operador interaja com as interfaces de comunicação e controle e construa pelo menos uma solução correta para a situação proposta, sob os pontos de vista da técnica e das normas vigentes. o padrão de rendimento mínimo desta etapa é de 100%.
ao término da atividade o Tutor realiza o “feedback” da atuação do Treinando, sendo possível acessar o conteúdo multimídia produzido durante a simulação. Tal recurso permite a correção de posturas inadequadas, vícios na Comunicação operativa ou ainda o reforço de boas práticas.
Caso o Treinando não tenha atingido os objetivos propostos, o Cenário de Simulação é repetido em outra data. Caso o operador tenha obtido êxito, uma nova notificação é enviada, propondo um novo Cenário de Simulação. o ciclo de atividades se repete até a conclusão de todos os Cenários propostos. na figura 1 temos um fluxograma que
restabelecimento. Porém não propomos apenas simulações para situações críticas - preconizamos também o emprego de cenários onde os Treinandos devam executar manobras em regime normal, com complexidades variadas para que possam adquirir perícia.
o aspecto da percepção dos resultados é tratado sob a luz da “avaliação Formativa”, uma vez que esta metodologia, segundo Fernandes[2] “está ligada a atividades de aprendizagem que envolvem os processo mais complexos do pensamento” – justamente aqueles empregados pelo operador por ocasião de um restabelecimento. o objetivo é perceber com precisão se o participante do treinamento detém os conhecimentos indispensáveis para o correto desempenho da sua atividade e ainda, se é capaz de reproduzir os comportamentos necessários durante as situações de crise.
Como ferramenta para reforço positivo de comportamentos, empregamos o “feedback” após a realização das atividades de simulação. o intuito é de proporcionar ao Treinando uma percepção realista da qualidade da sua atuação como também das oportunidades de melhorias.
4.0 o ProCeSSo de TreinamenTo
o aperfeiçoamento de operadores através da imersão em ambiente de Simulação é uma aplicação da modalidade de “Treinamento imersivo” voltada para a formação e o desenvolvimento de competências junto à força de trabalho existente nas Salas de Controle das usinas ou Subestações – o operador de instalações.
o processo de treinamento é coordenado localmente em cada unidade da empresa através da figura do “Tutor”. é importante para o bom andamento do Treinamento, que o funcionário que irá desempenhar esta função, seja detentor de sólidos conhecimentos sobre os aspectos funcionais da instalação além dos procedimentos em uso na Sala de Controle.
Sugerimos que o Tutor seja o “Supervisor de operação” justamente por ser este o funcionário que apresenta a maior bagagem de vivências e conhecimentos relacionados a ocorrências. é ele
Xi edao
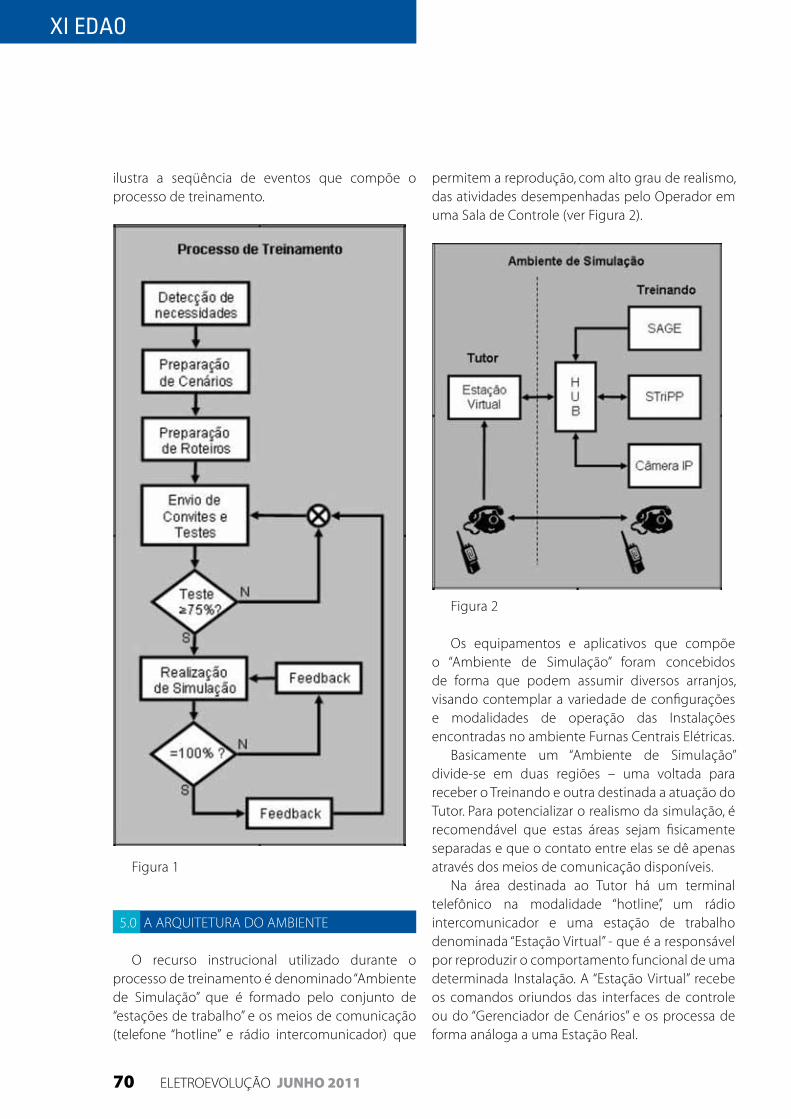
70 eleTroeVoluÇão JUNHO 2011
Xi edao
permitem a reprodução, com alto grau de realismo, das atividades desempenhadas pelo operador em uma Sala de Controle (ver Figura 2).
Figura 2
os equipamentos e aplicativos que compõe o “ambiente de Simulação” foram concebidos de forma que podem assumir diversos arranjos, visando contemplar a variedade de configurações e modalidades de operação das instalações encontradas no ambiente Furnas Centrais elétricas.
Basicamente um “ambiente de Simulação” divide-se em duas regiões – uma voltada para receber o Treinando e outra destinada a atuação do Tutor. Para potencializar o realismo da simulação, é recomendável que estas áreas sejam fisicamente separadas e que o contato entre elas se dê apenas através dos meios de comunicação disponíveis.
na área destinada ao Tutor há um terminal telefônico na modalidade “hotline”, um rádio intercomunicador e uma estação de trabalho denominada “estação Virtual” - que é a responsável por reproduzir o comportamento funcional de uma determinada instalação. a “estação Virtual” recebe os comandos oriundos das interfaces de controle ou do “Gerenciador de Cenários” e os processa de forma análoga a uma estação real.
ilustra a seqüência de eventos que compõe o processo de treinamento.
Figura 1
5.0 a arQuiTeTura do amBienTe
o recurso instrucional utilizado durante o processo de treinamento é denominado “ambiente de Simulação” que é formado pelo conjunto de “estações de trabalho” e os meios de comunicação (telefone “hotline” e rádio intercomunicador) que

eleTroeVoluÇão JUNHO 2011 71
“Simulador Tridimensional em Primeira Pessoa” (STriPP) que podemos ver na figura 4.
Figura 4
esta aplicação permite reproduzir a interação do Treinando com um painel elétrico e representa de forma realista, o ambiente de uma Sala de Controle e seus equipamentos componentes para proporcionar a um indivíduo a experiência de interagir de forma absolutamente segura com os punhos e botões em um “painel elétrico virtualizado”, facilitando a ele adquirir perícia na utilização deste tipo de interface de controle.
a interação do Treinando com o “STriPP” se dá através de um controle sem fios, disponível no mercado sob a marca “nintendo” – é o “Controlador Wii” que podemos ver na figura 5.
Figura 5
o Tutor tem total controle sobre a simulação através da utilização da interface gráfica do “Gerenciador de Cenários” (ver Figura 3).
Figura 3
esta aplicação proporciona um ambiente gráfico para programação de eventos, o que permite criar ou modificar um Cenário de Simulação. através deste aplicativo é possível executar, pausar, reiniciar um determinado Cenário.
na área destinada ao Treinando há um terminal telefônico “hotline”, um rádio intercomunicador e dependendo da configuração da estação a ser virtualizada, podem ser necessárias até duas estações de trabalho.
é realizada a gravação em formato de vídeo, via câmera iP, das atividades dos Treinandos bem como de toda a comunicação via rádio, telefone e sons ambientes.
em instalações mais modernas onde todos os equipamentos do plantel são controlados através de meios computacionais, é necessária uma estação de trabalho para o Sistema aberto de Gerenciamento de energia (SaGe/CePel), que opera na modalidade de treinamento.
em instalações onde os equipamentos do plantel são controlados de forma mista (parte dos equipamentos são controlados através de meios computacionais, parte dos equipamentos são controlados por painéis elétricos), são necessárias duas estações de trabalho – em uma delas está instalado o SaGe na modalidade de treinamento e no equipamento restante está instalado o
Xi edao

72 eleTroeVoluÇão JUNHO 2011
Xi edao
6.1 ESTRATÉGIAS DE DESENvOLvImENTOFoi necessária a utilização de estratégias que
permitissem a realização de atividades descentralizadas para permitir que cada Área Cliente construísse a sua estrutura de treinamento com o apoio e o conhecimento da força de trabalho local. empregamos o “desenvolvimento Colaborativo Compartilhado”, ou seja, parte dos aplicativos utilizados na estação Virtual é desenvolvida pela força de trabalho local da unidade da empresa que está recebendo o equipamento simulador. os demais aplicativos são produzidos pela Coordenação do Projeto já customizados às necessidades da configuração da estação.
Surge então a figura do “desenvolvedor local”, que é um operador ou Técnico de manutenção lotado na unidade da empresa que participará do desenvolvimento da estação Virtual. Para cumprir este papel, o funcionário recebeu treinamento preparatório para programar em Shell Script para posteriormente desenvolver a “Biblioteca de Comandos da estação”. é justamente através do emprego desta biblioteca que se torna possível acionar na “estação Virtual”, equipamentos e alarmes, causar falhas, modificar valores analógicos entre outras tantas possibilidades, uma vez que estes funcionários conhecem em profundidade o funcionamento dos equipamentos daquela instalação.
inicialmente foram selecionadas dez unidades da empresa, e cada uma delas indicou dois funcionários para desempenharem o papel de desenvolvedores – um operador e um Técnico de manutenção.
a plataforma tecnológica utilizada para a concepção dos aplicativos empregados no “ambiente de Simulação” está fortemente orientada ao “Software livre” por questões de compatibilidade com o SaGe – a aplicação utilizada para supervisão e controle no âmbito de Furnas Centrais elétricas.
6.2 ESTRATÉGIAS DE PROGRAmAçãOCom o objetivo de acelerar o desenvolvimento
dos aplicativos necessários ao funcionamento da estação Virtual e ao mesmo tempo potencializar o realismo proporcionado através deste equipamento, optou-se por aproveitar os códigos, diagramas e arranjos já existentes nas instalações referentes à operação dos equipamentos de geração ou transmissão.
este sensor de gestos possui giroscópios e acelerômetros, o que significa que ele pode perceber o movimento, a inclinação e a rotação do equipamento no espaço. Comparado com outros dispositivos de interface, o “Controlador Wii” tem preço acessível, sendo fácil de utilizar.
é através deste dispositivo que se torna possível reproduzir os movimentos necessários para o acionamento do punho de comando de equipamentos.
Para finalizar, em instalações onde todos os equipamentos do plantel são controlados somente através de painéis elétricos, é necessária apenas uma estação de trabalho onde está instalado o “STriPP”
6.0 eSTraTéGiaS emPreGadaS
Para desenvolver, implantar e operar com sucesso, “ambientes de Simulação” no âmbito de uma empresa com as dimensões e heterogeneidade tecnológica como as presentes nas instalações de Furnas Centrais elétricas, é uma tarefa complexa, para dizer o mínimo.
o resultado que estamos obtendo com a implantação do método aqui descrito, é fruto da ação conjunta da operação em Tempo real com a manutenção eletroeletrônica em cada unidade da empresa que está desenvolvendo o seu “ambiente de Simulação”. a coordenação técnica, logística, determinação de perfil e aquisição de equipamentos ficou a cargo da divisão de Sistemas de Controle e automação (dSCa.o). a disseminação e desenvolvimento do método e aplicativos necessários ficaram a cargo dos autores deste artigo.
a implantação piloto de um “ambiente de Simulação” para o emprego do método descrito neste artigo ocorreu no âmbito do departamento de Produção de nova iguaçú (drn.o), na Subestação de São josé, que localiza-se no município de Belford roxo - rio de janeiro.
o “aperfeiçoamento de operadores através da imersão em ambiente de Simulação” atualmente encontra-se em fase de implantação em dez unidades no ambiente Furnas Centrais elétricas (nove Subestações e uma usina Hidroelétrica).

eleTroeVoluÇão JUNHO 2011 73
encontrada para a questão - “como reproduzir de forma mais realista a interação do indivíduo com os punhos de controle?”
a solução adotada faz com que a ação para ligar ou desligar um determinado equipamento durante a atividade de treinamento, se aproxime muito daquela que será realizada na Sala de Controle real.
7.0 aPliCaBilidade do méTodo
o emprego de Treinamento imersivo na forma como propomos neste artigo, pode ser realizada em instalações com as mais diversas configurações, complexidades e interfaces de controle, uma vez que o “ambiente de Simulação” pode ser desenvolvido para reproduzir com alto grau de realismo, as vivências em uma Sala de Controle de usinas ou Subestações.
em instalações onde seja possível ministrar o treinamento próximo a Sala de Controle, não será necessário deslocar o Treinando para outra unidade da empresa para a realização dos “Turnos de Simulação”.
nas estações atendidas até o momento nas dependências de Furnas Centrais elétricas, considerando que a atividade de Treinamento é de curta duração (entre quinze a quarenta minutos por cenário), torna-se viável treinar durante o horário de expediente normal. nestas localidades a simulação ocorre durante o turno da manhã.
8.0 reSulTadoS
até o momento da preparação deste documento foram treinados quinze operadores em cenários de perturbação parcial da Subestação de São josé, durante o horário de trabalho e sem a necessidade de deslocamento do funcionário para um Centro de Treinamento ou outra localidade. desta forma o custo para manter o corpo de operadores atualizado e com o desempenho melhorado é baixo, se comparado a outros métodos.
os registros produzidos durante o transcorrer da atividade de treinamento documentam, entre outras informações, a carga horária da simulação, os conteúdos abordados, as ações do Treinando, a data da realização da simulação e o número de
os mapas das lógicas para intertravamento de equipamentos e os bancos de dados do SaGe foram explorados de forma a conferir ao equipamento Simulador, absoluta fidelidade de comportamento durante as manobras como também durante a produção de alarmes.
a biblioteca de comandos de cada usina ou Subestação é desenvolvida baseada na farta documentação técnica disponível em cada unidade da empresa, como também com o emprego dos conhecimentos tácitos da força de trabalho local. assim o trabalho da equipe fica focado para a tarefa de portar o comportamento já mapeado das atuações de proteções, falhas de equipamentos, esquemas de emergência e etc, imprimindo maior agilidade aos ciclos de desenvolvimento.
durante o desenvolvimento dos aplicativos também houve a preocupação de como os clientes (Tutores e Treinandos) se relacionariam com as interfaces dos aplicativos que controlam o processo de simulação. Para nomear controles e variáveis, empregou-se a fraseologia típica e mnemônica fortemente orientada à Cultura operativa, com o claro objetivo de diminuir a curva de aprendizado no trato com o equipamento Simulador.
a criação do ambiente gráfico para programação de cenários para simulação é fruto desta abordagem. o Tutor em uma instalação possui sólidos conhecimentos sobre as ações em uma Sala de Controle durante perturbações, porém nem todos possuem o mesmo nível de conhecimentos no que se refere à informática e muito menos a produção de programas para computadores.
o “Gerenciador de Cenários” é a resposta ao desafio de produzir um interpretador de comandos que além de controlar a execução dos cenários, permite programar seqüências de eventos em uma simulação. a interface presente no aplicativo compatibiliza as complexidades típicas desta atividade com as capacidades do usuário. ou seja, é indispensável que o Tutor domine profundamente a operação da instalação, porém mesmo que não possua alguma familiaridade com ferramentas de programação, ainda assim será possível para ele criar, editar e gerenciar a execução de Cenários.
no que se refere ao Treinando, a adoção da tecnologia para detecção de gestos foi a resposta
Xi edao
74 eleTroeVoluÇão JUNHO 2011
Bienal paris 2010Xi edao
simplesmente desenvolver equipamento Simulador, não é a garantia de que teremos operadores desempenhando as suas funções de forma compatível com as atuais exigências do mercado. além da questão do ambiente favorável para a realização da atividade, da fidelidade dos Cenários e também do realismo, o desenvolvimento de métodos e normas que regulem a atividade, são fatores preponderantes para que se alcancem os resultados desejados.
Pudemos constatar que a abordagem orientada às necessidades dos Treinandos, produz melhores efeitos. uma vez que ao invés de “sortear” cenários aleatórios a atividade está voltada a atender as necessidades concretas de melhoria de desempenho dos indivíduos, se obtém construção, transmissão e fixação de conhecimentos de forma mais rápida.
a transparência do processo e o emprego do “feedback” imediatamente após a realização das atividades, são também fatores facilitadores da aprendizagem. a adoção destas estratégias facilita a aceitação do processo por parte dos Treinandos.
Concluindo, o trabalho aqui apresentado é a contribuição de Furnas Centrais elétricas para a melhoria da qualidade e confiabilidade no que se refere à operação de instalações, uma vez que torna viável o aperfeiçoamento de operadores de forma contínua, compatibilizando os aspectos de eficiência e custo.
11.0 reFerÊnCiaS BiBlioGrÁFiCaS
[1] utiel, W; Kirner, C.: “realismo Visual em ambientes interativos como Ferramentas
de auxilio à educação”, “novas Tecnologias na educação”, CinTed – uFrGS, julho 2009.
[2]Fernandes. d. (2005).: “avaliação das aprendizagens: desafios às Teorias, Práticas e Políticas”. lisboa: Texto editora.
[3] leiTe, C. r. r; oliVeira, j.j.r; oliVeira, j.G.: “uso de Simuladores no Treinamento de operadores da CHeSF como Ferramenta para disseminação de Conhecimentos na operação do Sistema elétrico”, ii Seminário internacional “reestruturação e regulação do Setor de energia elétrica e Gás natural” – GeSel - uFrj, rio de janeiro – rj, 2007.
repetições de cenários. Tais documentos podem ser utilizados junto aos Órgãos reguladores para fins de comprovação, uma vez que produzem a evidência concreta de que a empresa pratica o aperfeiçoamento de seus colaboradores.
Visando atender a demanda de formação de novos operadores, o CTFu – Centro de Treinamento de Furnas está aquisitando os equipamentos para a montagem de seu ambiente de Simulação e a utilização deste recurso instrucional ocorrerá pela primeira vez em um CTB, durante o mês de março de 2011.
Consideramos também como resultado positivo, o emprego do equipamento Simulador da estação de São josé, durante os testes para a verificação de condições discrepantes do arranjo de intertravamento naquela estação.
9.0 ViSão de FuTuro
Com o objetivo de permitir a aplicação de treinamentos envolvendo trechos do Sistema elétrico sob a concessão de Furnas Centrais elétricas, onde existam mais de uma usina ou Subestação, está prevista a possibilidade de interconexão de “ambientes de Simulação”. desta forma é viável simular ocorrências que envolvam unidades adjacentes da empresa, em um arranjo denominado “drill” que resulta em uma atividade encadeada fortemente orientada a aperfeiçoar a interação entre equipes no desempenho de missões críticas.
não está prevista a imediata aplicação desta facilidade uma vez que o processo de treinamento ainda está em fase de implantação, porém o recurso está disponível para aplicações futuras.
10.0 ConCluSão
Considerando o cenário atual do Setor elétrico Brasileiro, é desafiador operar uma usina ou Subestação sob a regulação vigente. Somente equipes devidamente capacitadas, dotadas de domínio e habilidade, desempenharão o seu papel de forma adequada uma vez que o impacto das ações destes profissionais na confiabilidade, qualidade do suprimento de energia elétrica e no faturamento das empresas, é importante.
Como descrito por leiTe[3] em seu artigo,

GRUPO A – EQUIPAMENTOS
CE-A1 Máquinas RotativasCoordenador: jaCQueS PHiliPPe marCel SanZempresa: eletronorteendereço: av. arthur Bernardes, s/nº - Centro de Tecnologia da eletronorte Cep: 66.115-000 - Belém - Pa Tel: (91) 3257-1966 ramal 8240 - Fax:(91) 3257-4376e-mail: [email protected]
Projeto e construção de turbogeradores, hidrogeradores, máquinas não-convencionais e grandes motores. Aspectos econômicos, testes, comportamentos e materiais.
CE-A2 TransformadoresCoordenador: miGuel CarloS medina Penaempresa: Chesf – Companhia Hidro elétrica do São Francisco.endereço: rua delmiro Gouveia, 333 – Bongi 50760-901 – recife – PeTelefone: (81) 3229-2778 / 2167 - Fax: (81) 3229-3242e-mail: [email protected] /[email protected]
Projeto, construção, fabricação e operação de todos os tipos de transformadores, incluindo transformadores conversores, de uso industrial e os chamados “phase-shifters”, além de todos os tipos de reatores e componen-tes de transformadores (buchas, comutadores, etc).
CE-A3 Equipamentos de Alta TensãoCoordenador: Paulo CeSar FernandeZempresa: eletrobrásendereço: av. Presidente Vargas 409, 15º, ed Herm Stoltz Centro - rio de janeiro - rj - CeP: 20071-003Telefone: (21) 2514-5763 - Fax: (21) 212514-4896e-mail: [email protected] [email protected]
Teoria, projeto, construção e operação para todos os dispositivos de manobra, interruptores e limitadores de corrente, pára-raios, capacitores, seccionadores isoladores de equipamentos e de barramentos e transforma-dores de instrumento.
GRUPO B – SUBSISTEMAS
CE-B1 Cabos IsoladosCoordenador: jÚlio CéSar ramoS loPeSempresa: inovatec Consultoria e engenharia ltdaendereço: rua São Benedito, 2.650 – cj. 102a - 04735-005 – São Paulo - SPTelefone: (11) 5548-8201 - Fax: (11) 5548-8201e-mail: [email protected]
Base teórica, projeto, processos produtivos, instalação, serviços, manutenção e técnicas de diagnóstico para cabos isolados CA e CC e para aplicações terrestres e submarinas.
CE-B2 Linhas Aéreas Coordenador: ruY CarloS ramoS de meneZeSempresa: uFrGS - universidade Federal do rio Grande do Sulendereço: rua osvaldo aranha, 99 - 3º andarTelefone: +51 3308 3592 - Fax:+51 3308 3999e-mail: [email protected]
Projeto, desempenho elétrico e mecânico, construção, vida útil, manutenção e reforma de linhas aéreas e de seus componentes: condutores, cabos pára-raios, isoladores, torres, fundações e sistemas de aterramento.
lista dos Comitês de estudorepresentantes Brasileirosacesse o coordenador da área de seu interesse para participar de nossa entidade:
eleTroeVoluÇão JUNHO 2011 75
CoMitÊs

CE-B3 SubestaçõesCoordenador: riCardo de oliVeira meloempresa: CHeSF – Companhia Hidro elétrica do São Franciscoendereço: rua delmiro Gouveia, 333 – Bongi - 50760-901 – recife – PeTelefone: (81) 3229-2420 / 2421 - Fax: (81) 3229-2687e-mail: [email protected]
Projeto, construção e manutenção de subestações e instalações elétricas de usinas, excluindo os geradores.
CE-B4 Elos de Corrente Contínua e Eletrônica de PotênciaCoordenador: SérGio do eSPÍriTo SanToempresa: FurnaS Centrais elétricas S.a.endereço: rua real Grandeza 219 - Sala 110 - Bloco e - Botafogo 22283-900 rio de janeiro - rjTelefone: (21) 2528-2545 - Fax: (21) 2528-5528e-mail: [email protected]
CCAT: as pec tos eco nô mi cos, apli ca çõ es, as pec tos de pla ne ja men to, pro je to, de sem pe nho, con tro le, pro te ção, con tro le e tes te de es ta çõ es con ver so ras. Ele trô ni ca de po tên cia para trans mis são CA, sis te mas de dis tri bu i ção e me lho ria de qua li da de de ener gia: as pec tos eco nô mi cos, apli ca çõ es, pla ne ja men to, pro je to, de sem pe nho, con tro le, pro te ção, cons tru ção e tes te. Ele trô ni ca de po tên cia ele va da: de sen vol vi men to de no vas tec no lo gias em con ver so res in clu in do con tro les, no vos se mi con du to res, apli ca çõ es des tas tec no lo gias em CCAT, FACTS e qua li da de de ener gia.
CE-B5 Proteção e AutomaçãoCoordenador: raul BalBi Solleroempresa: CePel - Centro de Pesquisas de energia elétricaendereço: avenida Horácio macedo, 354- Cidade universitária - 21941-911 rio de janeiro – rjTelefone: (21) 2598-6386 - Fax: (21) 2598-6386e-mail: [email protected]
Princípios, projeto, aspectos econômicos, aplicação, coordenação, desempenho operacional e manutenção de sistemas de proteção, controle e automação de subestações, sistemas e equipamentos de controle remoto, sistemas e equipamentos de medição.
GRUPO C – SISTEMAS
CE-C1 Desenvolvimento de Sistemas Elétricos e EconomiaCoordenador: maria alZira noli SilVeiraempresa: ePe - empresa de Pesquisa energéticaendereço: avenida rio Branco, nº 1 - 11º andar - Centro - 20090-003 – rio de janeiro – rjTelefone: (21) 3512-3165 - Fax: (21) 3512-3199e-mail: [email protected]
Métodos de análise para o desenvolvimento dos sistemas elétricos de potência e economia, métodos e ferra-mentas para análise estática e dinâmica, aspectos e métodos de planejamento nos vários contextos, estraté-gias de gerenciamento de ativos.
CE-C2 Operação e Controle de SistemasCoordenador: Paulo GomeSempresa: onS – oPerador naCional do SiSTema eléTriCoendereço: rua da Quitanda, 196 – 11º andar – Centro - 20091-005 – rio de janeiro – rjTelefones: (21) 2203-9822e-mail: [email protected]
Estudos e análises das condições técnicas, logísticas e institucionais requeridas para operação segura e econômica de sistemas de potência, contemplando os seguintes aspectos: controle de sistemas e de equipa-mentos; controle geração-carga; planejamento da operação; avaliação de desempenho; centros de controle; treinamento de operadores; requisitos de segurança contra colapso de sistemas, danos em equipamentos e falhas humanas.
76 eleTroeVoluÇão JUNHO 2011
CoMitÊs

eleTroeVoluÇão JUNHO 2011 77
CoMitÊs
CE-C3 Desempenho Ambiental de SistemasCoordenador: eVaniSe neVeS de meSQuiTaempresa: Consultoraendereço: rua mariz e Barros, 54 apto 1401 - icaraí - niterói - rj CeP 24220-121Telefone: (21) 3701-1448e-mail: [email protected]
Identificação e avaliação dos impactos ambientais de equipamentos e dos sistemas elétricos e os métodos usados para gerenciá-los.
CE-C4 Desempenho de Sistemas ElétricosCoordenador: dalTon de oliVeira CamPonÊS do BraSilempresa: onS - operador nacional do Sistema elétricoendereço: rua da Quitanda, 196 - 21º andar - Centro Cep: 20091-005 - rio de janeiro – rjTelefone: (21) 2203-9695 - (21) 2539-3659e-mail: [email protected]
Estudos, desenvolvimentos e recomendações de métodos e instrumentos para análises e medições do desem-penho de sistemas elétricos relacionado com a Qualidade da Energia Elétrica, Compatibilidade Eletromagné-tica, Descargas Atmosféricas e Coordenação de Isolamentos.
CE-C5 Mercados de Eletricidade e RegulaçãoCoordenador: luiZ auGuSTo n. BarroSoempresa: PSrendereço: Praia de Botafogo 228/1701 parte CeP: 22250-906 - rio de janeiro - rjTelefone: (21) 3229-4145e-mail: [email protected]
Estrutura e organização, regulação e estrutura de “funding” e econômico-financeira. Em termos do escopo ofi-cial, esses três aspectos fundamentais estão descritos como: “análise das diferentes abordagens na organiza-ção da Indústria de Suprimento de Energia Elétrica – as diferentes estruturas de mercado e produtos, técnicas e instrumentos associados, aspectos da regulação”.
CE-C6 Sistemas de Distribuição e Geração DistribuídaCoordenador: aílton ricaldoni lobo empresa: Clamper industria e Comercio S.aendereço: rodovia lmG 800 - Km 1, nº 128 - dist. indust.Genesco a. de oliveira 33400-000 - lagoa Santa - mG Telefone: (31) 3689-9500 - Fax: (31) 3689-9501e-mail: [email protected] Avaliação do impacto técnico de novas características de distribuição sobre a estrutura e operação do sistema: desenvolvimento da geração distribuída, dispositivos para armazenamento de energia, gerencia-mento pelo lado da demanda e eletrificação rural.
GRUPO D – TECNOLOGIAS DE APOIO
CE-D1 Materiais e Tecnologias EmergentesCoordenador: orSino oliVeira FilHo empresa: CePel - Centro de Pesquisas de energia elétricaendereço: avenida Horácio macedo, 354- Cidade universitária - ilha do Fundão 21941-911 - rio de janeiro – rjTelefone: (21) 2598-6020 - Fax: (21) 2598-6087e-mail: [email protected]
Acompanhamento e caracterização de materiais novos e já existentes para a tecnologia de energia elétrica, diagnóstico, acervo técnico e conhecimentos correlatos, novas tecnologias com impacto esperado sobre os sistemas a médio e longo prazo.

CoMitÊs
78 eleTroeVoluÇão JUNHO 2011
CE-D2 Sistemas de Informação e Telecomunicação para Sistemas ElétricosCoordenador: elTon Bernardo Bandeira de meloempresa: CHeSF - Companhia Hidro elétrica do São Franciscoendereço: rua delmiro Gouveia, 333, Sala 114, anexo ii, Bongi, recife - Pe - CeP: 50761-901Telefone: (81) 3229 4095e-mail: [email protected] ou [email protected]
Princípios, investigações e estudos, especificações de projeto, engenharia, desempenho durante o comissionamento e aspectos de operação e manutenção nas áreas de telecomunicações e de serviços de informação para o setor elétrico, sistemas de informação para atividades operacionais e de negócios envolvendo serviços, meios de comunicação e redes.
PARTICIPAÇÃO NO CIGRÉ INTERNACIONAL
Treasurer and Steering CommitteeTesoureiro: Paulo CeSar VaZ eSmeraldoempresa: ePe – empresa de Pesquisa energéticaendereço: avenida rio Branco, nº 1 – 11º andar – Centro 20090-003 – rio de janeiro – rjTelefone: (21) 3512-3133Fax: (21) 3512-3199e-mail: [email protected]
Administrative Councilmembro: joSé HenriQue maCHado FernandeSempresa: eletronorte - Centrais elétricas do norte do Brasil S/aendereço: SCn, Q.06 - Conj. “a” - edif. Venânco 3000 70718-900 - Brasília - dFTelefone: (61) 3429-5303/5301Fax: (61) 3328-1552e-mail: [email protected]
SC-A1 Rotating Electrical MachinesCoordenador: erli Ferreira FiGueiredoempresa: universidade do estado do rio de janeiro - uerjendereço: rua São Francisco Xavier, nº 524 – 5º andar – sala 5.029 – Bloco a Cep: 20.559-900 – maracanã – rio de janeiro – rj Telefone: (21) 2205-0569 Fax: (21) 2569-9067e-mail: [email protected]
SC-B5 Protection and Automation Secretário: ionY PaTrioTa de SiQueira empresa: Chesf - Companhia Hidro elétrica do São Francisco endereço: rua 15 de março, 50 sala B 314 Bongi - recife - Pe - 50761-070Telefone: (81) 3229-4145Fax: (81) 3229-4145e-mail: [email protected]

eleTroeVoluÇão JUNHO 2011 79
Critérios para Seleção e Divulgação dos ArtigosTécnicos da Revista EletroEvolução
1. Todos os artigos previamente selecionados e apresentados em eventos de responsabilidade
do CiGré-Brasil poderão se candidatar à sua publicação na revista eletroevolução, devendo
ser encaminhados à Presidência do Conselho editorial, pelos respectivos interessados, no
endereço do CiGré-Brasil: Praia do Flamengo, 66 – Bloco B – sala 408 – Flamengo, rio de
janeiro. CeP: 22.210-903.
1.1 os trabalhos deverão obedecer à formatação e limites de tamanho estabelecidos pelo
respectivo evento, cabendo à revista eletroevolução a sua diagramação e formatação final de
impressão, incluindo a revisão final de sua redação para efeito de publicação.
2. Todos os artigos submetidos e que atendam à condição estabelecida no item 1 serão
encaminhados, para efeito de revisão e comentários, a uma comissão composta por um mínimo
de 3 revisores, a serem designados pelo Coordenador do Comitê de estudo responsável pelo
respectivo tema e/ou pelo Presidente do Conselho editorial da revista eletroevolução. Cada
revisor terá o prazo máximo de um mês para apresentar seu comentário e parecer sobre o
trabalho.
2.1 Será de responsabilidade da Presidência do Conselho editorial da revista o encaminhamento,
ao autor do artigo, da decisão do referido Conselho, a qual poderá ser pela sua não publicação,
aceitação mediante incorporação das revisões solicitadas pelos revisores ou aprovação integral.
Tal resposta deverá ocorrer no prazo máximo de 120 dias a partir da data de recebimento do
artigo.
2.2 os artigos classificados em 1º e 2º lugares nos seus respectivos grupos, em eventos
realizados pelo CiGré-Brasil, serão considerados previamente aptos para sua publicação na
revista eletroevolução, a critério do Conselho editorial, não havendo a necessidade de seu
encaminhamento pelos respectivos autores principais, nem a necessidade de revisão. À época
da publicação dos artigos, a sua versão final para impressão será encaminhada aos autores
para conhecimento e conferência.
3. Também estão aptos para sua publicação, a critério da diretoria do CiGré-Brasil e do Conselho
editorial, os artigos com os resultados e constatações finais dos Grupos de Trabalho dos
Comitês de estudo. esses artigos deverão ser encaminhados à Presidência do Conselho
editorial da revista, não havendo necessidade de revisões, uma vez que já serão os frutos de
trabalho conjunto dos especialistas do Cigré-Brasil no assunto.
4. de forma excepcional e a critério da diretoria do CiGré-Brasil, poderão ser publicados outros
artigos de interesse da entidade, sob a denominação “artigos Convidados”.
Conselho Editorial da Revista EletroEvolução


![REPRESENTACIONES NACIONALES Bienal de Sao... · Web view26ª Bienal de São Paulo. Representações Nacionais [National Representations]. São Paulo: Fundaçao Bienal São Paulo,](https://img.document.onl/doc/110x75/603dae4255b4663c6c274d12/representaciones-bienal-de-sao-web-view-26-bienal-de-so-paulo-representaes.jpg)