Embed Size (px)
Citation preview
B
O
Dei
A
a
b
R
v
h1a
razilian Journal of Otorhinolaryngology 2021;86(6):748---762
www.bjorl.org
Brazilian Journal of
OTORHINOLARYNGOLOGY
RIGINAL ARTICLE
evelopment and validation of the protocol for thevaluation of voice in subjects with hearingmpairment (PEV-SHI)�
na Cristina Coelho a,∗, Alcione Ghedini Brasolotto b, Fayez Bahmad Jr. a
Universidade de Brasília, Programa de Pós-Graduacão em Ciências da Saúde, Brasília, DF, BrazilUniversidade de São Paulo, Faculdade de Odontologia de Bauru, Departamento de Fonoaudiologia, Bauru, SP, Brazil
eceived 21 February 2019; accepted 25 May 2019
KEYWORDSVoice;Voice quality;Hearing disorders;Hearing loss;Validation studies
AbstractIntroduction: The voice of individuals with hearing impairment has been widely described, andcan be compromised in all levels of the phonatory system.Objective: To develop and validate an instrument for evaluating the voice of this population.Methods: The instrument underwent the validation steps suggested by the Scientific AdvisoryCommittee of the Medical Outcomes Trust. The study sample consisted of seventy-eight Brazilianpeople with cochlear implants (experimental group) and 78 individuals with normal hearing(control group), divided in groups by age range ---- children from 3 to 5 years; children from 6to 10 years and adults from 18 to 46 years. The study sample participated in a voice recordingof the sustained vowel /a/, connected speech and spontaneous conversation, in which threevoice specialists rated using the proposed instrument. It consists of visual-analog scales ofsuprasegmental aspects, respiratory-phonatory coordination, resonance, phonation, additionalparameters and general vocal perception.Results: Evaluation by an expert committee and a pilot test established content validity. Relia-bility measures showed excellent test-retest reproducibility for the majority of the parameters.Analysis with the ROC curve showed that perceptual evaluation with the sustained vowel did notstrongly differentiate individuals with cochlear implants from those with normal hearing, andthe parameter ‘‘speech rate’’ did not differentiate the groups at all. For the connected speech
and spontaneous conversation, the majority of the parameters differentiated the experimen-tal group from the control group with an area under the curve ≥0.7. The cutoff values withmaximum specificity and sensitivity were 30.5 for mild, 49.0 for moderate and 69.5 for intensedeviation.� Please cite this article as: Coelho AC, Brasolotto AG, Bahmad Jr F. Development and validation of the protocol for the evaluation ofoice in subjects with hearing impairment (PEV-SHI). Braz J Otorhinolaryngol. 2020;86:748---62.∗ Corresponding author.
E-mail: [email protected] (A.C. Coelho).
Peer Review under the responsibility of Associacão Brasileira de Otorrinolaringologia e Cirurgia Cérvico-Facial.
ttps://doi.org/10.1016/j.bjorl.2019.05.007808-8694/© 2019 Associacao Brasileira de Otorrinolaringologia e Cirurgia Cervico-Facial. Published by Elsevier Editora Ltda. This is an openccess article under the CC BY license (http://creativecommons.org/licenses/by/4.0/).
Protocol for the evaluation of voice in patients with hearing impairment (PEV-SHI) 749
Conclusions: The protocol for the evaluation of voice in subjects with hearing impairment, PEV-SHI, is a reliable and useful tool for assessing the particularities of the voice of individuals withhearing impairment treated with cochlear implants and can be used in research and clinicalsettings to standardize evaluation and facilitate information exchange among services.© 2019 Associacao Brasileira de Otorrinolaringologia e Cirurgia Cervico-Facial. Publishedby Elsevier Editora Ltda. This is an open access article under the CC BY license (http://creativecommons.org/licenses/by/4.0/).
PALAVRAS-CHAVEVoz;Qualidade da voz;Distúrbios auditivos;Perda de audicão;Estudos de validacão
Desenvolvimento e validacão do protocolo de avaliacão da voz do deficiente auditivo(PAV-DA)
ResumoIntroducão: A voz de indivíduos com deficiência auditiva tem sido amplamente descrita e podeestar comprometida em todos os níveis do sistema fonatório.Objetivo: Desenvolver e validar uma ferramenta para avaliar a voz dessa populacão.Método: A ferramenta foi submetida às etapas de validacão sugeridas pelo Scientific AdvisoryCommittee of the Medical Outcomes Trust. A amostra do estudo foi composta por 78 indivíduosbrasileiros com implantes cocleares (grupo experimental) e 78 indivíduos com audicão normal(grupo controle) divididos em grupos por faixa etária - criancas de 3 a 5 anos; criancas de 6 a 10anos e adultos de 18 a 46 anos. Os participantes do estudo realizaram uma gravacão de voz davogal /a/ sustentada, fala encadeada e conversa espontânea, que foi avaliada por três espe-cialistas em voz com o instrumento proposto. Este instrumento consistem em escalas visuaisanalógicas dos aspectos supras segmentares da voz, coordenacão pneumofonoarticulatória,ressoância, fonacão, parâmetro adicional e impressão geral da qualidade vocal.Resultados: A avaliacão por um comitê de especialistas e um teste piloto estabeleceram avalidade de conteúdo. Medidas de confiabilidade mostraram excelente teste-reteste repro-dutibilidade para a maioria dos parâmetros. A análise com a curva ROC mostrou que a avaliacãoperceptivo-auditiva com a vogal sustentada não diferenciou significantemente os indivíduos comimplante coclear daqueles com audicão normal e o parâmetro ‘‘velocidade de fala’’ não difer-enciou os grupos. Para a fala encadeada e conversa espontânea, a maioria dos parâmetrosdiferenciou o grupo experimental do grupo controle, com uma área sob a curva ≥ 0,7. Os val-ores de corte com máxima especificidade e sensibilidade foram 30,5 para desvio discreto, 49,0para desvio moderado e 69,5 para desvio intenso.Conclusões: O protocolo de avaliacão de voz do deficiente auditivo é uma ferramenta confiávele útil para avaliar as particularidades da voz de indivíduos com deficiência auditiva e implantecoclear e pode ser utilizada em pesquisas e contextos clínicos para padronizar a avaliacão efacilitar a troca de informacões entre os servicos.© 2019 Associacao Brasileira de Otorrinolaringologia e Cirurgia Cervico-Facial. Publicadopor Elsevier Editora Ltda. Este e um artigo Open Access sob uma licenca CC BY (http://creativecommons.org/licenses/by/4.0/).
taraaoFsrdp
Introduction
Voice production occurs by the integration of the respiratory,phonatory and articulatory systems,1,2 also involving highlycomplex mechanisms related to the central and periph-eral nervous systems, such as auditory monitoring.3 It canbe described through auditory-perceptual, acoustic, aero-dynamic evaluations and laryngeal imaging.3 The auditoryperceptual evaluation is considered the gold standard invoice assessment and enables characterization and quan-tification of perceptual vocal features.4,5
The voice characteristics of individuals with hearingimpairment can vary according to the type, severity, onsetof the hearing loss, and to the treatment of choice. A listof perceptual attributes used to characterize the voice of
tcis
hese individuals in the last 10 years include: negative over-ll impression of the voice quality6---8; roughness6; strain6,9;esonance disorders7,10,11; high pitch7; instability7,12; andltered suprasegmental features such as intelligibility,rticulation10 and intonation.13 Respiration, phonation, res-nance and suprasegmental features are intimately related.or example, many of the references to nasality in deafpeech may refer not only to the actual feature of nasalesonance, but misarticulation of nasals, lack of oral/nasalistinctions, pitch variation, or any combination of thesearameters.14 These perceived characteristics can be jus-
ified by the lack of auditory monitoring of the voice,ausing difficulty in developing phonatory control and abil-ties to regulate and vary the voice use in differentituations.3,15
7
gditte
auw-a(tohnAam
isaoitdicsoip
M
Tobg
P
TstC5aeCPeaaeces
aitasooa
V
Tmdvsvr
C
Tto(soovncfpotldcsbttccd
-
i
a
b
50
Therefore, in addition to social, educational, and lan-uage limitations, hearing impairment can cause specificeviation of the communication related to speech and voice,nterfering with intelligibility and crucially compromisinghe social integration of the individual,3 so it is importanthat the assessment of voice production cover all of theselements.
The studies that performed auditory-perceptual evalu-tion of the voice of individuals with hearing impairmentsed protocols and scales directed to the global populationith voice problems such as the GRBAS scale (G ---- Grade; R
--- Roughness; B ---- Breathiness; A ---- Asthenia; S ---- Strain)16
nd the Consensus Auditory-Perceptual Evaluation of VoiceCAPE-V).17 These scales, however, focus on voice produc-ion mainly at a glottal level, and therefore do not approachther pertinent features of the voice of the population withearing impairment, such as the different possible reso-ance deviations and suprasegmental features of the voice.lso, the lack of standardization of the evaluation processcross studies, such as which scale to use and the ratingethods, can lead to unreliable and conflicting results.For an adequate evaluation, it is important that the
nstrument consider all the relevant parameters to study apecific population. In addition, the scale should allow reli-ble discrimination between the normal voice and the voicef the target population.18 The validation, therefore, of annstrument that approaches the singular voice characteris-ics of those with hearing impairment can bring importantirections for speech-language pathologists regarding thenvestigation of voice production and rehabilitation of oralommunication of these individuals. The purpose of thistudy was to develop an instrument for evaluating the voicef individuals with hearing impairment who use cochlearmplants, establishing its validity for clinical and scientificurposes.
ethods
he ethics committee of the Brasília University ---- Collegef Health Sciences approved this study under process num-er 16887713.4.0000.0030. All participants, parents or legaluardians signed the informed consent.
articipants
his study involved the participation of 156 individuals,eventy-eight people with cochlear implants (Experimen-al Group ---- EG) and their hearing peers (Control Group ----G) divided in groups by age range: 52 children from 3 to
years (G1), 54 children from 6 to 10 years (G2) and 50dults from 18 to 46 years (G3). Half of the participants ofach group consisted of the EG and half consisted of theG. All participants were native speakers of the Brazilianortuguese language. The EG included individuals with bilat-ral, severe to profound sensorineural hearing loss using
cochlear implant, with absence of associated disorders,ttending a rehabilitation program, and who had experi-
nce of device use of at least one year. This study did notonsider other criteria such as hearing loss onset, unilat-ral or bilateral implant, or use of contralateral hearing aid,ince its purpose was to develop an instrument for the over--
Coelho AC et al.
ll population with cochlear implants. The CG consisted ofndividuals with normal hearing. To verify normal hearing,he participants of the CG underwent pure-tone thresholdudiometry. Exclusion criteria for both groups were profes-ional voice use, stage of menopause for women, currentr previous smoking, regular use of alcoholic drinks, previ-us laryngeal surgery and being ill with pulmonary or upperirway infection on the day of the recording session.
alidation steps
he criteria recommended by the Scientific Advisory Com-ittee of the Medical Outcomes Trust19 directed theevelopment and validation process of the instrument. Thealidation steps include describing the conceptual and mea-urement model, determining reliability measures, contentalidity, construct validity, interpretability and describingespondent and administrative burden.
onceptual and measurement model
he Protocolo de Avaliacão de Voz do Deficiente Audi-ivo (PAV-DA), translated as Protocol for the Evaluationf Voice in Subjects with Hearing Impairment (PEV-SHI)Appendix A) was developed by consensus between threepeech-language and hearing sciences professionals, basedn perceptual features studied in the literature that standut in the voice of individuals with hearing impairment. Theoice tasks selected were the sustained vowel /a/, con-ected speech (numbers from 1 to 10) and spontaneousonversation. A 100 mm or 200 mm Visual-Analog Scale (VAS)ollows each parameter. For the 100 mm line, the leftmostortion reflected the absence of deviation and the right endf the scale reflected the judgment of most intense devia-ion. For the parameters intonation, speech rate, pitch andoudness a 200 mm line was used, since the nature of theeviation can turn to opposite sides. For example, the pitchan be either too low or too high. Therefore, in the 200 mmcale, the midpoint was defined as adequate, with possi-le deviations to the left or right of this midpoint, allowinghe rater to visualize the full range of the deviation inhe VAS. Suprasegmental features and respiratory-phonatoryoordination were to be assessed only for the spontaneousonversation. The selected parameters and their respectiveefinitions were:
Suprasegmental aspects of the voice quality:
Intelligibility: How understandable the speech is;Articulation: The correct production of speech sounds;Intonation: The melodic pattern and frequency variation
n speech;Speech rate: How fast or slow speech in produced within
sentence.Respiratory-phonatory coordination: Coordination
etween breath and speech.
Resonance: The way in which the voice is projected intospace. It may have an isolated or mixed characteristic. Theraters selected more than one item in the protocol in caseof a mixed resonance. The term ‘‘excessively’’ was used
imp
tmd
D
Attipsa
poiiasTsvoEctoeper
FaaTwf
R
IrvCi
RCctp1Se
Protocol for the evaluation of voice in patients with hearing
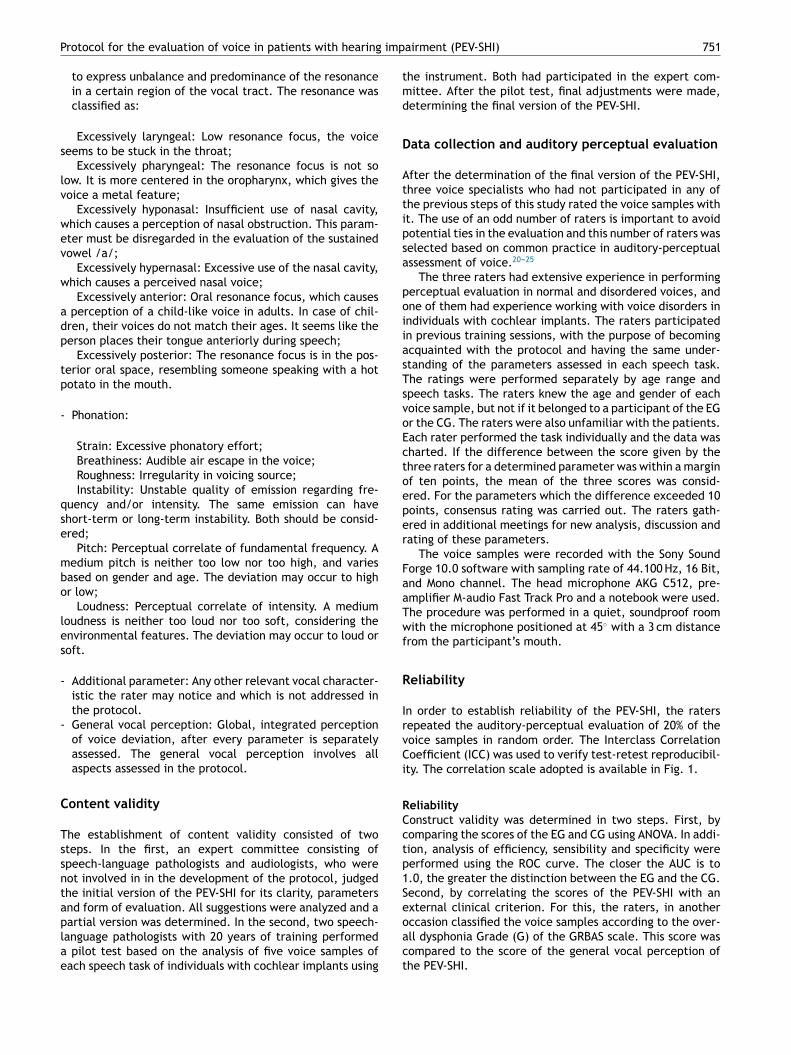
to express unbalance and predominance of the resonancein a certain region of the vocal tract. The resonance wasclassified as:
Excessively laryngeal: Low resonance focus, the voiceseems to be stuck in the throat;
Excessively pharyngeal: The resonance focus is not solow. It is more centered in the oropharynx, which gives thevoice a metal feature;
Excessively hyponasal: Insufficient use of nasal cavity,which causes a perception of nasal obstruction. This param-eter must be disregarded in the evaluation of the sustainedvowel /a/;
Excessively hypernasal: Excessive use of the nasal cavity,which causes a perceived nasal voice;
Excessively anterior: Oral resonance focus, which causesa perception of a child-like voice in adults. In case of chil-dren, their voices do not match their ages. It seems like theperson places their tongue anteriorly during speech;
Excessively posterior: The resonance focus is in the pos-terior oral space, resembling someone speaking with a hotpotato in the mouth.
- Phonation:
Strain: Excessive phonatory effort;Breathiness: Audible air escape in the voice;Roughness: Irregularity in voicing source;Instability: Unstable quality of emission regarding fre-
quency and/or intensity. The same emission can haveshort-term or long-term instability. Both should be consid-ered;
Pitch: Perceptual correlate of fundamental frequency. Amedium pitch is neither too low nor too high, and variesbased on gender and age. The deviation may occur to highor low;
Loudness: Perceptual correlate of intensity. A mediumloudness is neither too loud nor too soft, considering theenvironmental features. The deviation may occur to loud orsoft.
- Additional parameter: Any other relevant vocal character-istic the rater may notice and which is not addressed inthe protocol.
- General vocal perception: Global, integrated perceptionof voice deviation, after every parameter is separatelyassessed. The general vocal perception involves allaspects assessed in the protocol.
Content validity
The establishment of content validity consisted of twosteps. In the first, an expert committee consisting ofspeech-language pathologists and audiologists, who werenot involved in in the development of the protocol, judgedthe initial version of the PEV-SHI for its clarity, parametersand form of evaluation. All suggestions were analyzed and a
partial version was determined. In the second, two speech-language pathologists with 20 years of training performeda pilot test based on the analysis of five voice samples ofeach speech task of individuals with cochlear implants usingoact
airment (PEV-SHI) 751
he instrument. Both had participated in the expert com-ittee. After the pilot test, final adjustments were made,etermining the final version of the PEV-SHI.
ata collection and auditory perceptual evaluation
fter the determination of the final version of the PEV-SHI,hree voice specialists who had not participated in any ofhe previous steps of this study rated the voice samples witht. The use of an odd number of raters is important to avoidotential ties in the evaluation and this number of raters waselected based on common practice in auditory-perceptualssessment of voice.20---25
The three raters had extensive experience in performingerceptual evaluation in normal and disordered voices, andne of them had experience working with voice disorders inndividuals with cochlear implants. The raters participatedn previous training sessions, with the purpose of becomingcquainted with the protocol and having the same under-tanding of the parameters assessed in each speech task.he ratings were performed separately by age range andpeech tasks. The raters knew the age and gender of eachoice sample, but not if it belonged to a participant of the EGr the CG. The raters were also unfamiliar with the patients.ach rater performed the task individually and the data washarted. If the difference between the score given by thehree raters for a determined parameter was within a marginf ten points, the mean of the three scores was consid-red. For the parameters which the difference exceeded 10oints, consensus rating was carried out. The raters gath-red in additional meetings for new analysis, discussion andating of these parameters.
The voice samples were recorded with the Sony Soundorge 10.0 software with sampling rate of 44.100 Hz, 16 Bit,nd Mono channel. The head microphone AKG C512, pre-mplifier M-audio Fast Track Pro and a notebook were used.he procedure was performed in a quiet, soundproof roomith the microphone positioned at 45◦ with a 3 cm distance
rom the participant’s mouth.
eliability
n order to establish reliability of the PEV-SHI, the ratersepeated the auditory-perceptual evaluation of 20% of theoice samples in random order. The Interclass Correlationoefficient (ICC) was used to verify test-retest reproducibil-
ty. The correlation scale adopted is available in Fig. 1.
eliabilityonstruct validity was determined in two steps. First, byomparing the scores of the EG and CG using ANOVA. In addi-ion, analysis of efficiency, sensibility and specificity wereerformed using the ROC curve. The closer the AUC is to.0, the greater the distinction between the EG and the CG.econd, by correlating the scores of the PEV-SHI with anxternal clinical criterion. For this, the raters, in another
ccasion classified the voice samples according to the over-ll dysphonia Grade (G) of the GRBAS scale. This score wasompared to the score of the general vocal perception ofhe PEV-SHI.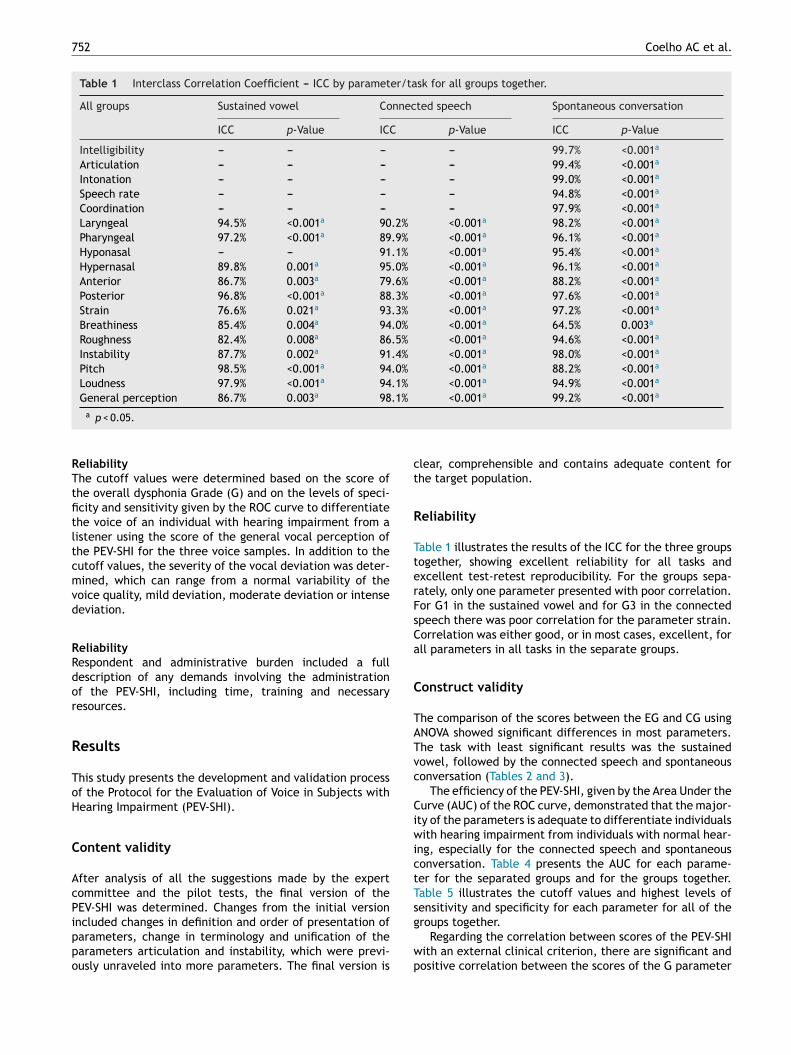
752 Coelho AC et al.
Table 1 Interclass Correlation Coefficient --- ICC by parameter/task for all groups together.
All groups Sustained vowel Connected speech Spontaneous conversation
ICC p-Value ICC p-Value ICC p-Value
Intelligibility --- --- --- --- 99.7% <0.001a
Articulation --- --- --- --- 99.4% <0.001a
Intonation --- --- --- --- 99.0% <0.001a
Speech rate --- --- --- --- 94.8% <0.001a
Coordination --- --- --- --- 97.9% <0.001a
Laryngeal 94.5% <0.001a 90.2% <0.001a 98.2% <0.001a
Pharyngeal 97.2% <0.001a 89.9% <0.001a 96.1% <0.001a
Hyponasal --- --- 91.1% <0.001a 95.4% <0.001a
Hypernasal 89.8% 0.001a 95.0% <0.001a 96.1% <0.001a
Anterior 86.7% 0.003a 79.6% <0.001a 88.2% <0.001a
Posterior 96.8% <0.001a 88.3% <0.001a 97.6% <0.001a
Strain 76.6% 0.021a 93.3% <0.001a 97.2% <0.001a
Breathiness 85.4% 0.004a 94.0% <0.001a 64.5% 0.003a
Roughness 82.4% 0.008a 86.5% <0.001a 94.6% <0.001a
Instability 87.7% 0.002a 91.4% <0.001a 98.0% <0.001a
Pitch 98.5% <0.001a 94.0% <0.001a 88.2% <0.001a
Loudness 97.9% <0.001a 94.1% <0.001a 94.9% <0.001a
General perception 86.7% 0.003a 98.1% <0.001a 99.2% <0.001a
RTtfitltcmvd
RRdor
R
ToH
C
AcPippo
ct
R
TterFsCa
C
TATvc
CiwictTs
a p < 0.05.
eliabilityhe cutoff values were determined based on the score ofhe overall dysphonia Grade (G) and on the levels of speci-city and sensitivity given by the ROC curve to differentiatehe voice of an individual with hearing impairment from aistener using the score of the general vocal perception ofhe PEV-SHI for the three voice samples. In addition to theutoff values, the severity of the vocal deviation was deter-ined, which can range from a normal variability of the
oice quality, mild deviation, moderate deviation or intenseeviation.
eliabilityespondent and administrative burden included a fullescription of any demands involving the administrationf the PEV-SHI, including time, training and necessaryesources.
esults
his study presents the development and validation processf the Protocol for the Evaluation of Voice in Subjects withearing Impairment (PEV-SHI).
ontent validity
fter analysis of all the suggestions made by the expertommittee and the pilot tests, the final version of theEV-SHI was determined. Changes from the initial version
ncluded changes in definition and order of presentation ofarameters, change in terminology and unification of thearameters articulation and instability, which were previ-usly unraveled into more parameters. The final version isg
wp
lear, comprehensible and contains adequate content forhe target population.
eliability
able 1 illustrates the results of the ICC for the three groupsogether, showing excellent reliability for all tasks andxcellent test-retest reproducibility. For the groups sepa-ately, only one parameter presented with poor correlation.or G1 in the sustained vowel and for G3 in the connectedpeech there was poor correlation for the parameter strain.orrelation was either good, or in most cases, excellent, forll parameters in all tasks in the separate groups.
onstruct validity
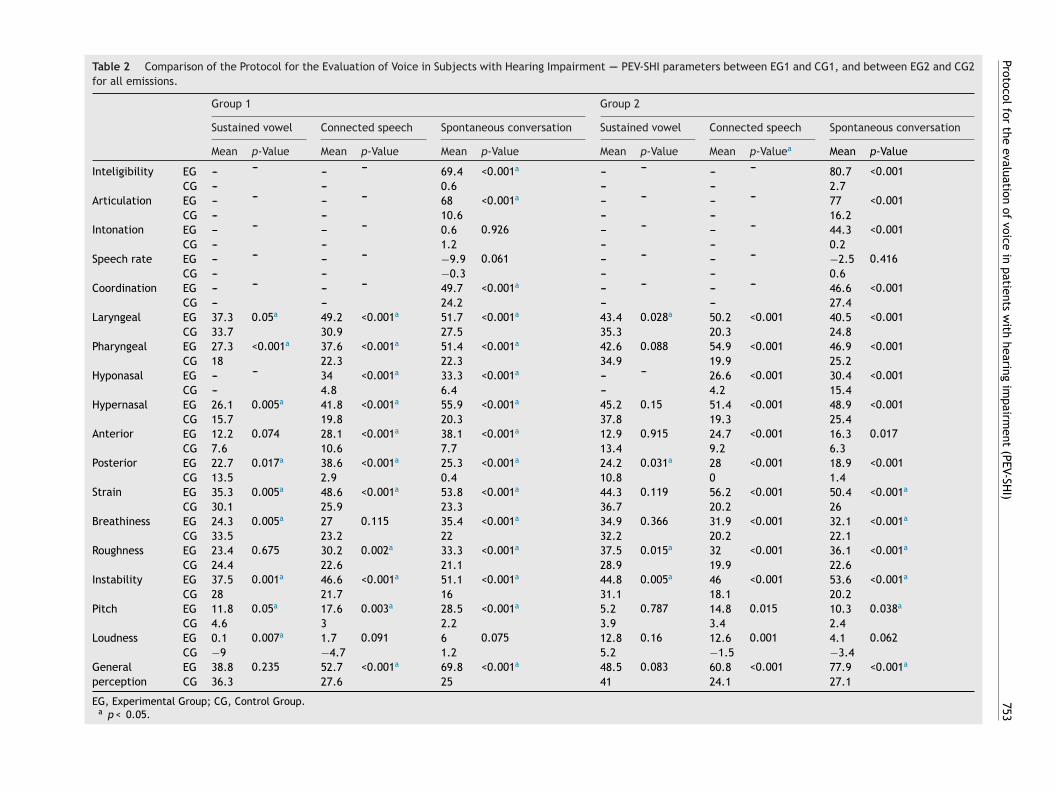
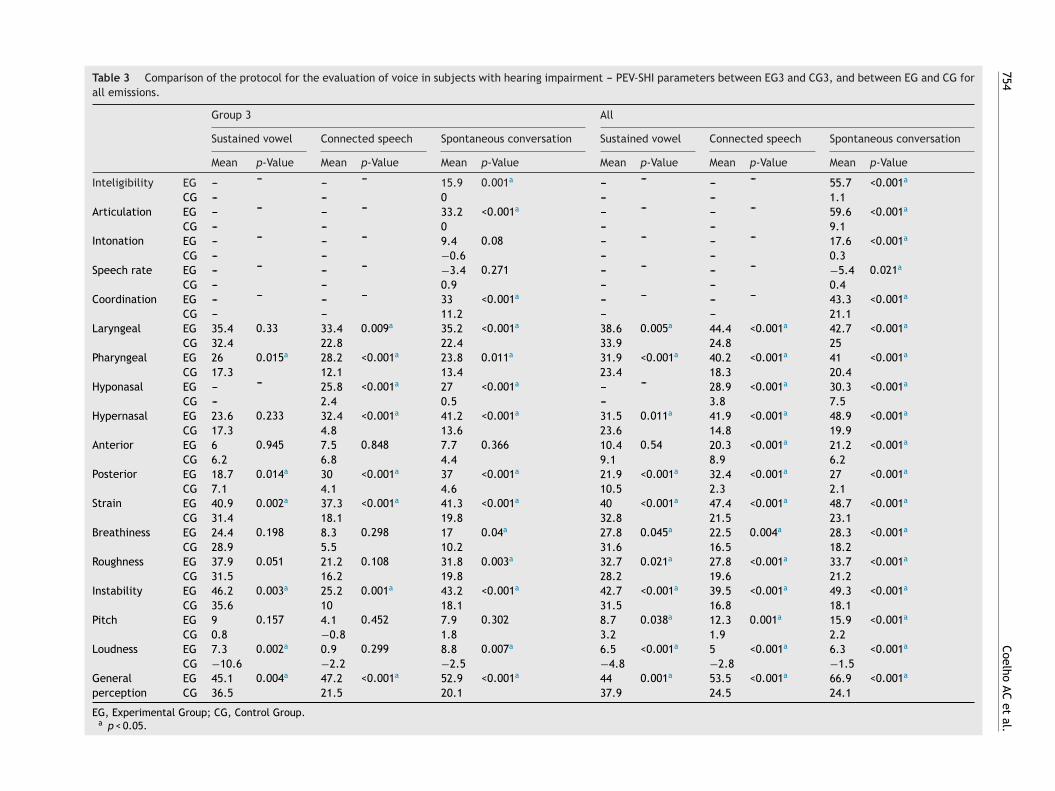
he comparison of the scores between the EG and CG usingNOVA showed significant differences in most parameters.he task with least significant results was the sustainedowel, followed by the connected speech and spontaneousonversation (Tables 2 and 3).
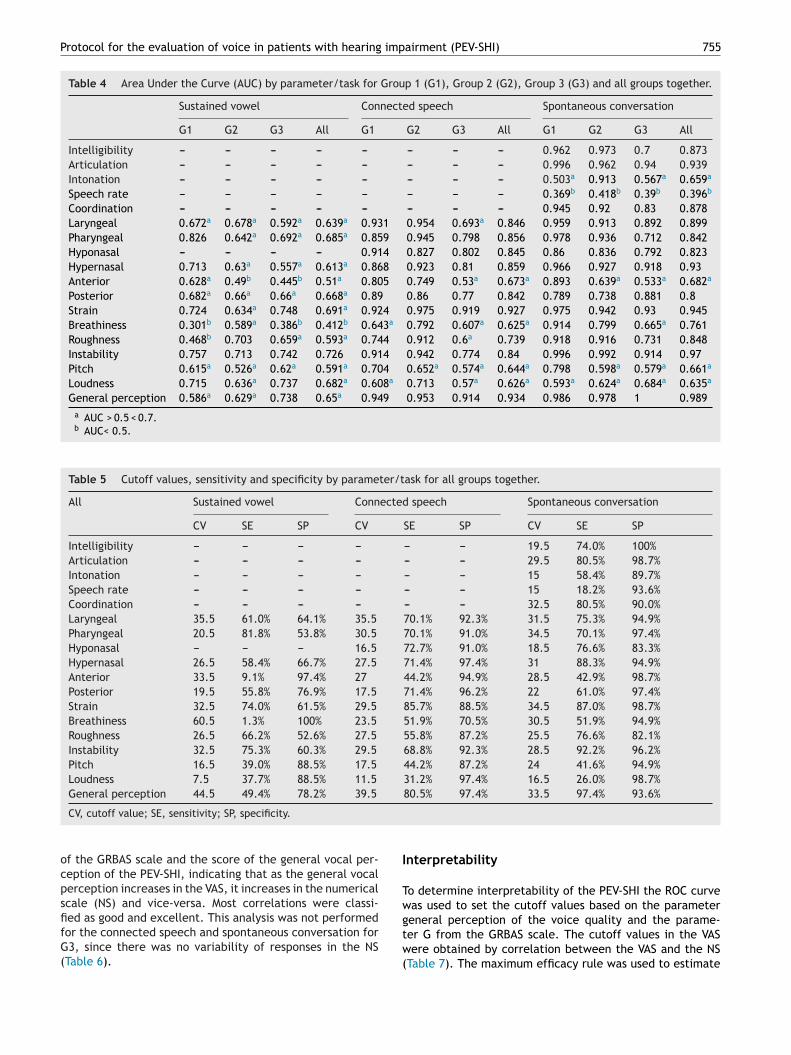
The efficiency of the PEV-SHI, given by the Area Under theurve (AUC) of the ROC curve, demonstrated that the major-
ty of the parameters is adequate to differentiate individualsith hearing impairment from individuals with normal hear-
ng, especially for the connected speech and spontaneousonversation. Table 4 presents the AUC for each parame-er for the separated groups and for the groups together.able 5 illustrates the cutoff values and highest levels ofensitivity and specificity for each parameter for all of the
roups together.Regarding the correlation between scores of the PEV-SHIith an external clinical criterion, there are significant andositive correlation between the scores of the G parameter
Protocol for
the evaluation
of voice
in patients
with
hearing im
pairment
(PEV-SHI)
753
Table 2 Comparison of the Protocol for the Evaluation of Voice in Subjects with Hearing Impairment ---- PEV-SHI parameters between EG1 and CG1, and between EG2 and CG2for all emissions.
Group 1 Group 2
Sustained vowel Connected speech Spontaneous conversation Sustained vowel Connected speech Spontaneous conversation
Mean p-Value Mean p-Value Mean p-Value Mean p-Value Mean p-Valuea Mean p-Value
Inteligibility EG --- --- --- --- 69.4 <0.001a --- --- --- --- 80.7 <0.001CG --- --- 0.6 --- --- 2.7
Articulation EG --- --- --- --- 68 <0.001a --- --- --- --- 77 <0.001CG --- --- 10.6 --- --- 16.2
Intonation EG --- --- --- --- 0.6 0.926 --- --- --- --- 44.3 <0.001CG --- --- 1.2 --- --- 0.2
Speech rate EG --- --- --- --- −9.9 0.061 --- --- --- --- −2.5 0.416CG --- --- −0.3 --- --- 0.6
Coordination EG --- --- --- --- 49.7 <0.001a --- --- --- --- 46.6 <0.001CG --- --- 24.2 --- --- 27.4
Laryngeal EG 37.3 0.05a 49.2 <0.001a 51.7 <0.001a 43.4 0.028a 50.2 <0.001 40.5 <0.001CG 33.7 30.9 27.5 35.3 20.3 24.8
Pharyngeal EG 27.3 <0.001a 37.6 <0.001a 51.4 <0.001a 42.6 0.088 54.9 <0.001 46.9 <0.001CG 18 22.3 22.3 34.9 19.9 25.2
Hyponasal EG --- --- 34 <0.001a 33.3 <0.001a --- --- 26.6 <0.001 30.4 <0.001CG --- 4.8 6.4 --- 4.2 15.4
Hypernasal EG 26.1 0.005a 41.8 <0.001a 55.9 <0.001a 45.2 0.15 51.4 <0.001 48.9 <0.001CG 15.7 19.8 20.3 37.8 19.3 25.4
Anterior EG 12.2 0.074 28.1 <0.001a 38.1 <0.001a 12.9 0.915 24.7 <0.001 16.3 0.017CG 7.6 10.6 7.7 13.4 9.2 6.3
Posterior EG 22.7 0.017a 38.6 <0.001a 25.3 <0.001a 24.2 0.031a 28 <0.001 18.9 <0.001CG 13.5 2.9 0.4 10.8 0 1.4
Strain EG 35.3 0.005a 48.6 <0.001a 53.8 <0.001a 44.3 0.119 56.2 <0.001 50.4 <0.001a
CG 30.1 25.9 23.3 36.7 20.2 26Breathiness EG 24.3 0.005a 27 0.115 35.4 <0.001a 34.9 0.366 31.9 <0.001 32.1 <0.001a
CG 33.5 23.2 22 32.2 20.2 22.1Roughness EG 23.4 0.675 30.2 0.002a 33.3 <0.001a 37.5 0.015a 32 <0.001 36.1 <0.001a
CG 24.4 22.6 21.1 28.9 19.9 22.6Instability EG 37.5 0.001a 46.6 <0.001a 51.1 <0.001a 44.8 0.005a 46 <0.001 53.6 <0.001a
CG 28 21.7 16 31.1 18.1 20.2Pitch EG 11.8 0.05a 17.6 0.003a 28.5 <0.001a 5.2 0.787 14.8 0.015 10.3 0.038a
CG 4.6 3 2.2 3.9 3.4 2.4Loudness EG 0.1 0.007a 1.7 0.091 6 0.075 12.8 0.16 12.6 0.001 4.1 0.062
CG −9 −4.7 1.2 5.2 −1.5 −3.4Generalperception
EG 38.8 0.235 52.7 <0.001a 69.8 <0.001a 48.5 0.083 60.8 <0.001 77.9 <0.001a
CG 36.3 27.6 25 41 24.1 27.1
EG, Experimental Group; CG, Control Group.a p < 0.05.
754
Coelho AC
et al.
Table 3 Comparison of the protocol for the evaluation of voice in subjects with hearing impairment --- PEV-SHI parameters between EG3 and CG3, and between EG and CG forall emissions.
Group 3 All
Sustained vowel Connected speech Spontaneous conversation Sustained vowel Connected speech Spontaneous conversation
Mean p-Value Mean p-Value Mean p-Value Mean p-Value Mean p-Value Mean p-Value
Inteligibility EG --- --- --- --- 15.9 0.001a --- --- --- --- 55.7 <0.001a
CG --- --- 0 --- --- 1.1Articulation EG --- --- --- --- 33.2 <0.001a --- --- --- --- 59.6 <0.001a
CG --- --- 0 --- --- 9.1Intonation EG --- --- --- --- 9.4 0.08 --- --- --- --- 17.6 <0.001a
CG --- --- −0.6 --- --- 0.3Speech rate EG --- --- --- --- −3.4 0.271 --- --- --- --- −5.4 0.021a
CG --- --- 0.9 --- --- 0.4Coordination EG --- --- --- --- 33 <0.001a --- --- --- --- 43.3 <0.001a
CG --- --- 11.2 --- --- 21.1Laryngeal EG 35.4 0.33 33.4 0.009a 35.2 <0.001a 38.6 0.005a 44.4 <0.001a 42.7 <0.001a
CG 32.4 22.8 22.4 33.9 24.8 25Pharyngeal EG 26 0.015a 28.2 <0.001a 23.8 0.011a 31.9 <0.001a 40.2 <0.001a 41 <0.001a
CG 17.3 12.1 13.4 23.4 18.3 20.4Hyponasal EG --- --- 25.8 <0.001a 27 <0.001a --- --- 28.9 <0.001a 30.3 <0.001a
CG --- 2.4 0.5 --- 3.8 7.5Hypernasal EG 23.6 0.233 32.4 <0.001a 41.2 <0.001a 31.5 0.011a 41.9 <0.001a 48.9 <0.001a
CG 17.3 4.8 13.6 23.6 14.8 19.9Anterior EG 6 0.945 7.5 0.848 7.7 0.366 10.4 0.54 20.3 <0.001a 21.2 <0.001a
CG 6.2 6.8 4.4 9.1 8.9 6.2Posterior EG 18.7 0.014a 30 <0.001a 37 <0.001a 21.9 <0.001a 32.4 <0.001a 27 <0.001a
CG 7.1 4.1 4.6 10.5 2.3 2.1Strain EG 40.9 0.002a 37.3 <0.001a 41.3 <0.001a 40 <0.001a 47.4 <0.001a 48.7 <0.001a
CG 31.4 18.1 19.8 32.8 21.5 23.1Breathiness EG 24.4 0.198 8.3 0.298 17 0.04a 27.8 0.045a 22.5 0.004a 28.3 <0.001a
CG 28.9 5.5 10.2 31.6 16.5 18.2Roughness EG 37.9 0.051 21.2 0.108 31.8 0.003a 32.7 0.021a 27.8 <0.001a 33.7 <0.001a
CG 31.5 16.2 19.8 28.2 19.6 21.2Instability EG 46.2 0.003a 25.2 0.001a 43.2 <0.001a 42.7 <0.001a 39.5 <0.001a 49.3 <0.001a
CG 35.6 10 18.1 31.5 16.8 18.1Pitch EG 9 0.157 4.1 0.452 7.9 0.302 8.7 0.038a 12.3 0.001a 15.9 <0.001a
CG 0.8 −0.8 1.8 3.2 1.9 2.2Loudness EG 7.3 0.002a 0.9 0.299 8.8 0.007a 6.5 <0.001a 5 <0.001a 6.3 <0.001a
CG −10.6 −2.2 −2.5 −4.8 −2.8 −1.5Generalperception
EG 45.1 0.004a 47.2 <0.001a 52.9 <0.001a 44 0.001a 53.5 <0.001a 66.9 <0.001a
CG 36.5 21.5 20.1 37.9 24.5 24.1
EG, Experimental Group; CG, Control Group.a p < 0.05.
Protocol for the evaluation of voice in patients with hearing impairment (PEV-SHI) 755
Table 4 Area Under the Curve (AUC) by parameter/task for Group 1 (G1), Group 2 (G2), Group 3 (G3) and all groups together.
Sustained vowel Connected speech Spontaneous conversation
G1 G2 G3 All G1 G2 G3 All G1 G2 G3 All
Intelligibility --- --- --- --- --- --- --- --- 0.962 0.973 0.7 0.873Articulation --- --- --- --- --- --- --- --- 0.996 0.962 0.94 0.939Intonation --- --- --- --- --- --- --- --- 0.503a 0.913 0.567a 0.659a
Speech rate --- --- --- --- --- --- --- --- 0.369b 0.418b 0.39b 0.396b
Coordination --- --- --- --- --- --- --- --- 0.945 0.92 0.83 0.878Laryngeal 0.672a 0.678a 0.592a 0.639a 0.931 0.954 0.693a 0.846 0.959 0.913 0.892 0.899Pharyngeal 0.826 0.642a 0.692a 0.685a 0.859 0.945 0.798 0.856 0.978 0.936 0.712 0.842Hyponasal --- --- --- --- 0.914 0.827 0.802 0.845 0.86 0.836 0.792 0.823Hypernasal 0.713 0.63a 0.557a 0.613a 0.868 0.923 0.81 0.859 0.966 0.927 0.918 0.93Anterior 0.628a 0.49b 0.445b 0.51a 0.805 0.749 0.53a 0.673a 0.893 0.639a 0.533a 0.682a
Posterior 0.682a 0.66a 0.66a 0.668a 0.89 0.86 0.77 0.842 0.789 0.738 0.881 0.8Strain 0.724 0.634a 0.748 0.691a 0.924 0.975 0.919 0.927 0.975 0.942 0.93 0.945Breathiness 0.301b 0.589a 0.386b 0.412b 0.643a 0.792 0.607a 0.625a 0.914 0.799 0.665a 0.761Roughness 0.468b 0.703 0.659a 0.593a 0.744 0.912 0.6a 0.739 0.918 0.916 0.731 0.848Instability 0.757 0.713 0.742 0.726 0.914 0.942 0.774 0.84 0.996 0.992 0.914 0.97Pitch 0.615a 0.526a 0.62a 0.591a 0.704 0.652a 0.574a 0.644a 0.798 0.598a 0.579a 0.661a
Loudness 0.715 0.636a 0.737 0.682a 0.608a 0.713 0.57a 0.626a 0.593a 0.624a 0.684a 0.635a
General perception 0.586a 0.629a 0.738 0.65a 0.949 0.953 0.914 0.934 0.986 0.978 1 0.989a AUC > 0.5 < 0.7.b AUC< 0.5.
Table 5 Cutoff values, sensitivity and specificity by parameter/task for all groups together.
All Sustained vowel Connected speech Spontaneous conversation
CV SE SP CV SE SP CV SE SP
Intelligibility --- --- --- --- --- --- 19.5 74.0% 100%Articulation --- --- --- --- --- --- 29.5 80.5% 98.7%Intonation --- --- --- --- --- --- 15 58.4% 89.7%Speech rate --- --- --- --- --- --- 15 18.2% 93.6%Coordination --- --- --- --- --- --- 32.5 80.5% 90.0%Laryngeal 35.5 61.0% 64.1% 35.5 70.1% 92.3% 31.5 75.3% 94.9%Pharyngeal 20.5 81.8% 53.8% 30.5 70.1% 91.0% 34.5 70.1% 97.4%Hyponasal --- --- --- 16.5 72.7% 91.0% 18.5 76.6% 83.3%Hypernasal 26.5 58.4% 66.7% 27.5 71.4% 97.4% 31 88.3% 94.9%Anterior 33.5 9.1% 97.4% 27 44.2% 94.9% 28.5 42.9% 98.7%Posterior 19.5 55.8% 76.9% 17.5 71.4% 96.2% 22 61.0% 97.4%Strain 32.5 74.0% 61.5% 29.5 85.7% 88.5% 34.5 87.0% 98.7%Breathiness 60.5 1.3% 100% 23.5 51.9% 70.5% 30.5 51.9% 94.9%Roughness 26.5 66.2% 52.6% 27.5 55.8% 87.2% 25.5 76.6% 82.1%Instability 32.5 75.3% 60.3% 29.5 68.8% 92.3% 28.5 92.2% 96.2%Pitch 16.5 39.0% 88.5% 17.5 44.2% 87.2% 24 41.6% 94.9%Loudness 7.5 37.7% 88.5% 11.5 31.2% 97.4% 16.5 26.0% 98.7%General perception 44.5 49.4% 78.2% 39.5 80.5% 97.4% 33.5 97.4% 93.6%
I
Tw
CV, cutoff value; SE, sensitivity; SP, specificity.
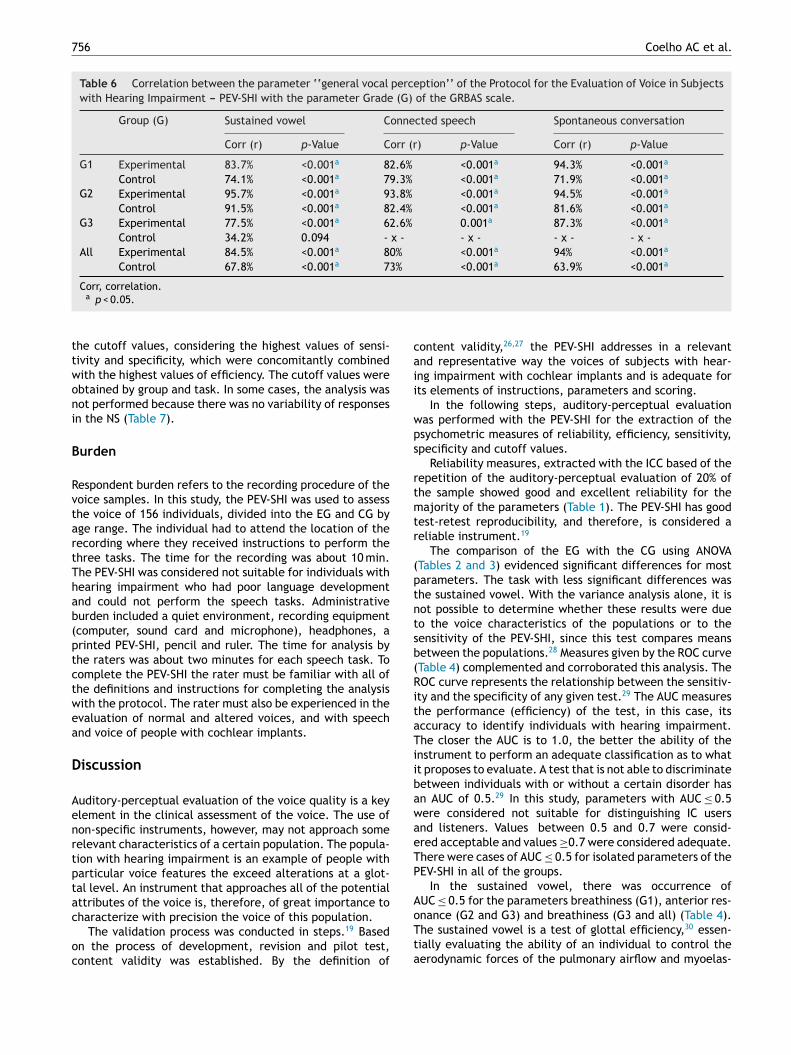
of the GRBAS scale and the score of the general vocal per-ception of the PEV-SHI, indicating that as the general vocalperception increases in the VAS, it increases in the numericalscale (NS) and vice-versa. Most correlations were classi-
fied as good and excellent. This analysis was not performedfor the connected speech and spontaneous conversation forG3, since there was no variability of responses in the NS(Table 6).gtw(
nterpretability
o determine interpretability of the PEV-SHI the ROC curveas used to set the cutoff values based on the parameter
eneral perception of the voice quality and the parame-er G from the GRBAS scale. The cutoff values in the VASere obtained by correlation between the VAS and the NSTable 7). The maximum efficacy rule was used to estimate
756 Coelho AC et al.
Table 6 Correlation between the parameter ‘‘general vocal perception’’ of the Protocol for the Evaluation of Voice in Subjectswith Hearing Impairment --- PEV-SHI with the parameter Grade (G) of the GRBAS scale.
Group (G) Sustained vowel Connected speech Spontaneous conversation
Corr (r) p-Value Corr (r) p-Value Corr (r) p-Value
G1 Experimental 83.7% <0.001a 82.6% <0.001a 94.3% <0.001a
Control 74.1% <0.001a 79.3% <0.001a 71.9% <0.001a
G2 Experimental 95.7% <0.001a 93.8% <0.001a 94.5% <0.001a
Control 91.5% <0.001a 82.4% <0.001a 81.6% <0.001a
G3 Experimental 77.5% <0.001a 62.6% 0.001a 87.3% <0.001a
Control 34.2% 0.094 - x - - x - - x - - x -All Experimental 84.5% <0.001a 80% <0.001a 94% <0.001a
Control 67.8% <0.001a 73% <0.001a 63.9% <0.001a
ttwoni
B
RvtartThab(ptctwea
D
Aenrtptac
oc
caii
wps
rtmtr
(ptntsb(RitaTiibawaeTP
A
Corr, correlation.a p < 0.05.
he cutoff values, considering the highest values of sensi-ivity and specificity, which were concomitantly combinedith the highest values of efficiency. The cutoff values werebtained by group and task. In some cases, the analysis wasot performed because there was no variability of responsesn the NS (Table 7).
urden
espondent burden refers to the recording procedure of theoice samples. In this study, the PEV-SHI was used to assesshe voice of 156 individuals, divided into the EG and CG byge range. The individual had to attend the location of theecording where they received instructions to perform thehree tasks. The time for the recording was about 10 min.he PEV-SHI was considered not suitable for individuals withearing impairment who had poor language developmentnd could not perform the speech tasks. Administrativeurden included a quiet environment, recording equipmentcomputer, sound card and microphone), headphones, arinted PEV-SHI, pencil and ruler. The time for analysis byhe raters was about two minutes for each speech task. Toomplete the PEV-SHI the rater must be familiar with all ofhe definitions and instructions for completing the analysisith the protocol. The rater must also be experienced in thevaluation of normal and altered voices, and with speechnd voice of people with cochlear implants.
iscussion
uditory-perceptual evaluation of the voice quality is a keylement in the clinical assessment of the voice. The use ofon-specific instruments, however, may not approach someelevant characteristics of a certain population. The popula-ion with hearing impairment is an example of people witharticular voice features the exceed alterations at a glot-al level. An instrument that approaches all of the potentialttributes of the voice is, therefore, of great importance to
haracterize with precision the voice of this population.The validation process was conducted in steps.19 Basedn the process of development, revision and pilot test,ontent validity was established. By the definition of
oTta
ontent validity,26,27 the PEV-SHI addresses in a relevantnd representative way the voices of subjects with hear-ng impairment with cochlear implants and is adequate forts elements of instructions, parameters and scoring.
In the following steps, auditory-perceptual evaluationas performed with the PEV-SHI for the extraction of thesychometric measures of reliability, efficiency, sensitivity,pecificity and cutoff values.
Reliability measures, extracted with the ICC based of theepetition of the auditory-perceptual evaluation of 20% ofhe sample showed good and excellent reliability for theajority of the parameters (Table 1). The PEV-SHI has good
est-retest reproducibility, and therefore, is considered aeliable instrument.19
The comparison of the EG with the CG using ANOVATables 2 and 3) evidenced significant differences for mostarameters. The task with less significant differences washe sustained vowel. With the variance analysis alone, it isot possible to determine whether these results were dueo the voice characteristics of the populations or to theensitivity of the PEV-SHI, since this test compares meansetween the populations.28 Measures given by the ROC curveTable 4) complemented and corroborated this analysis. TheOC curve represents the relationship between the sensitiv-
ty and the specificity of any given test.29 The AUC measureshe performance (efficiency) of the test, in this case, itsccuracy to identify individuals with hearing impairment.he closer the AUC is to 1.0, the better the ability of the
nstrument to perform an adequate classification as to whatt proposes to evaluate. A test that is not able to discriminateetween individuals with or without a certain disorder hasn AUC of 0.5.29 In this study, parameters with AUC ≤ 0.5ere considered not suitable for distinguishing IC usersnd listeners. Values between 0.5 and 0.7 were consid-red acceptable and values ≥0.7 were considered adequate.here were cases of AUC ≤ 0.5 for isolated parameters of theEV-SHI in all of the groups.
In the sustained vowel, there was occurrence ofUC ≤ 0.5 for the parameters breathiness (G1), anterior res-
nance (G2 and G3) and breathiness (G3 and all) (Table 4).he sustained vowel is a test of glottal efficiency,30 essen-ially evaluating the ability of an individual to control theerodynamic forces of the pulmonary airflow and myoelas-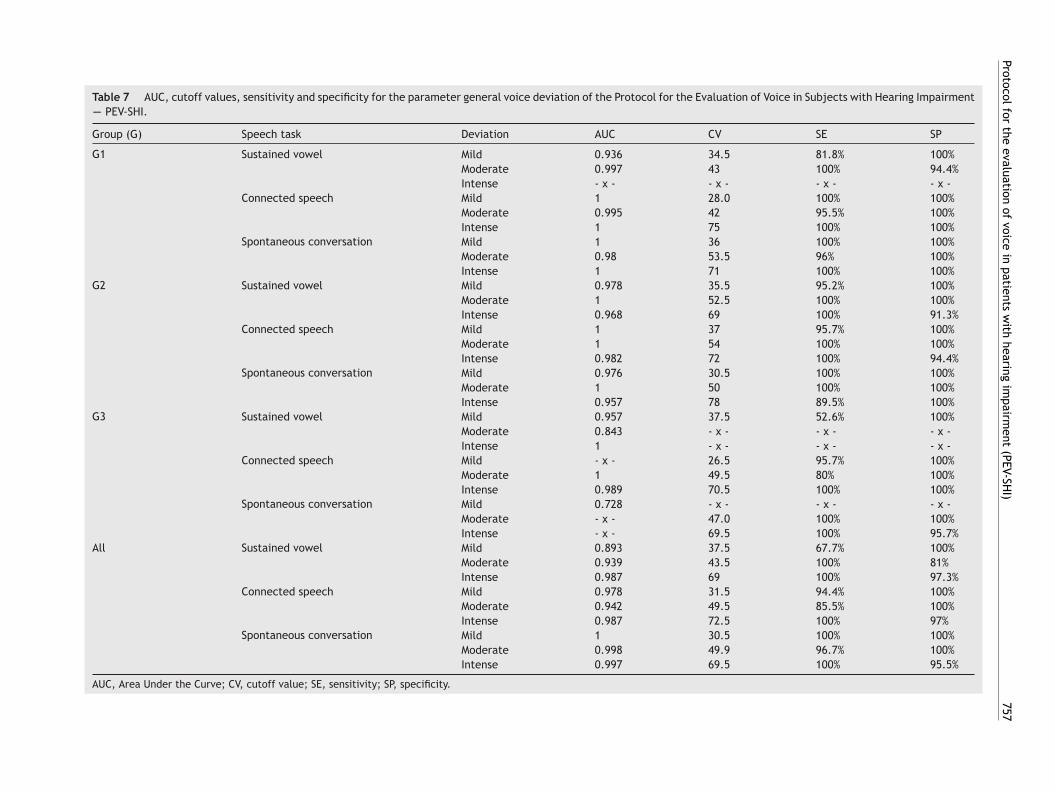
Protocol for
the evaluation
of voice
in patients
with
hearing im
pairment
(PEV-SHI)
757
Table 7 AUC, cutoff values, sensitivity and specificity for the parameter general voice deviation of the Protocol for the Evaluation of Voice in Subjects with Hearing Impairment---- PEV-SHI.
Group (G) Speech task Deviation AUC CV SE SP
G1 Sustained vowel Mild 0.936 34.5 81.8% 100%Moderate 0.997 43 100% 94.4%Intense - x - - x - - x - - x -
Connected speech Mild 1 28.0 100% 100%Moderate 0.995 42 95.5% 100%Intense 1 75 100% 100%
Spontaneous conversation Mild 1 36 100% 100%Moderate 0.98 53.5 96% 100%Intense 1 71 100% 100%
G2 Sustained vowel Mild 0.978 35.5 95.2% 100%Moderate 1 52.5 100% 100%Intense 0.968 69 100% 91.3%
Connected speech Mild 1 37 95.7% 100%Moderate 1 54 100% 100%Intense 0.982 72 100% 94.4%
Spontaneous conversation Mild 0.976 30.5 100% 100%Moderate 1 50 100% 100%Intense 0.957 78 89.5% 100%
G3 Sustained vowel Mild 0.957 37.5 52.6% 100%Moderate 0.843 - x - - x - - x -Intense 1 - x - - x - - x -
Connected speech Mild - x - 26.5 95.7% 100%Moderate 1 49.5 80% 100%Intense 0.989 70.5 100% 100%
Spontaneous conversation Mild 0.728 - x - - x - - x -Moderate - x - 47.0 100% 100%Intense - x - 69.5 100% 95.7%
All Sustained vowel Mild 0.893 37.5 67.7% 100%Moderate 0.939 43.5 100% 81%Intense 0.987 69 100% 97.3%
Connected speech Mild 0.978 31.5 94.4% 100%Moderate 0.942 49.5 85.5% 100%Intense 0.987 72.5 100% 97%
Spontaneous conversation Mild 1 30.5 100% 100%Moderate 0.998 49.9 96.7% 100%Intense 0.997 69.5 100% 95.5%
AUC, Area Under the Curve; CV, cutoff value; SE, sensitivity; SP, specificity.
7 Coelho AC et al.
tstpttnA
ufps(aaaweact
icsrlvaapltfep
iosihi
atpsT(aElsP
tdota
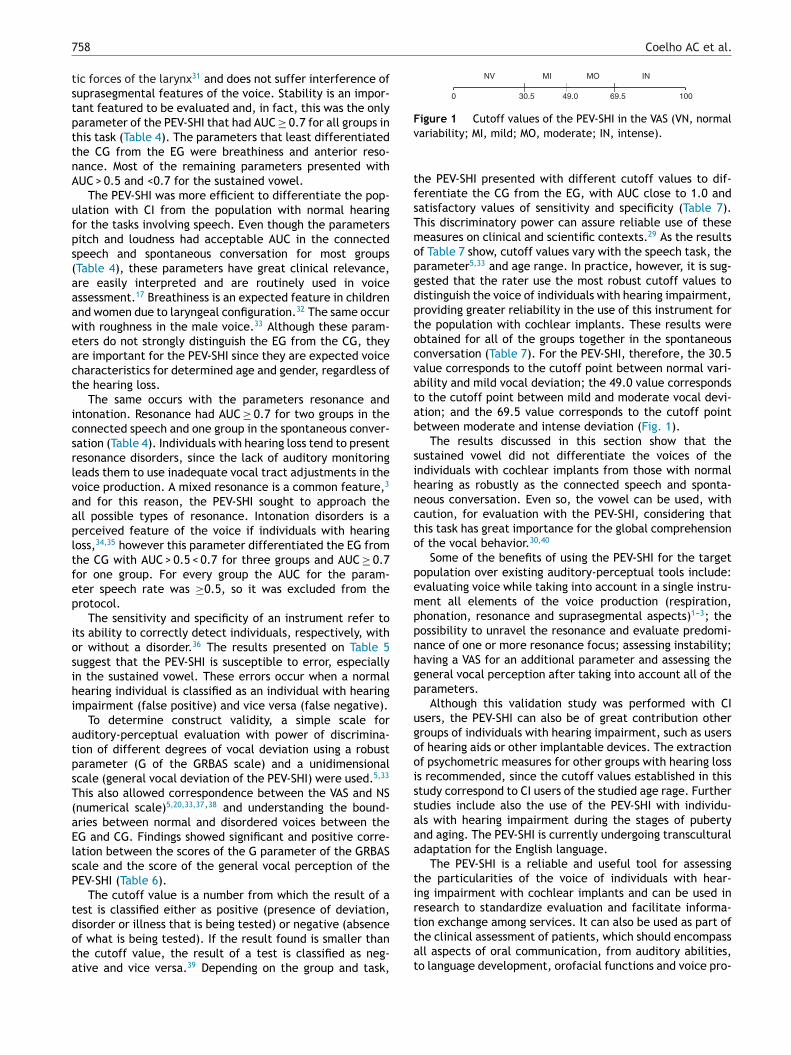
NV
0 30.5 49.0 69.5 100
MI MO IN
Fv
tfsTmopgdptocvatab
sihncto
pemppnhgp
ugooissaaa
tirt
58
ic forces of the larynx31 and does not suffer interference ofuprasegmental features of the voice. Stability is an impor-ant featured to be evaluated and, in fact, this was the onlyarameter of the PEV-SHI that had AUC ≥ 0.7 for all groups inhis task (Table 4). The parameters that least differentiatedhe CG from the EG were breathiness and anterior reso-ance. Most of the remaining parameters presented withUC > 0.5 and <0.7 for the sustained vowel.
The PEV-SHI was more efficient to differentiate the pop-lation with CI from the population with normal hearingor the tasks involving speech. Even though the parametersitch and loudness had acceptable AUC in the connectedpeech and spontaneous conversation for most groupsTable 4), these parameters have great clinical relevance,re easily interpreted and are routinely used in voicessessment.17 Breathiness is an expected feature in childrennd women due to laryngeal configuration.32 The same occurith roughness in the male voice.33 Although these param-ters do not strongly distinguish the EG from the CG, theyre important for the PEV-SHI since they are expected voiceharacteristics for determined age and gender, regardless ofhe hearing loss.
The same occurs with the parameters resonance andntonation. Resonance had AUC ≥ 0.7 for two groups in theonnected speech and one group in the spontaneous conver-ation (Table 4). Individuals with hearing loss tend to presentesonance disorders, since the lack of auditory monitoringeads them to use inadequate vocal tract adjustments in theoice production. A mixed resonance is a common feature,3
nd for this reason, the PEV-SHI sought to approach thell possible types of resonance. Intonation disorders is aerceived feature of the voice if individuals with hearingoss,34,35 however this parameter differentiated the EG fromhe CG with AUC > 0.5 < 0.7 for three groups and AUC ≥ 0.7or one group. For every group the AUC for the param-ter speech rate was ≥0.5, so it was excluded from therotocol.
The sensitivity and specificity of an instrument refer tots ability to correctly detect individuals, respectively, withr without a disorder.36 The results presented on Table 5uggest that the PEV-SHI is susceptible to error, especiallyn the sustained vowel. These errors occur when a normalearing individual is classified as an individual with hearingmpairment (false positive) and vice versa (false negative).
To determine construct validity, a simple scale foruditory-perceptual evaluation with power of discrimina-ion of different degrees of vocal deviation using a robustarameter (G of the GRBAS scale) and a unidimensionalcale (general vocal deviation of the PEV-SHI) were used.5,33
his also allowed correspondence between the VAS and NSnumerical scale)5,20,33,37,38 and understanding the bound-ries between normal and disordered voices between theG and CG. Findings showed significant and positive corre-ation between the scores of the G parameter of the GRBAScale and the score of the general vocal perception of theEV-SHI (Table 6).
The cutoff value is a number from which the result of aest is classified either as positive (presence of deviation,isorder or illness that is being tested) or negative (absence
f what is being tested). If the result found is smaller thanhe cutoff value, the result of a test is classified as neg-tive and vice versa.39 Depending on the group and task,tat
igure 1 Cutoff values of the PEV-SHI in the VAS (VN, normalariability; MI, mild; MO, moderate; IN, intense).
he PEV-SHI presented with different cutoff values to dif-erentiate the CG from the EG, with AUC close to 1.0 andatisfactory values of sensitivity and specificity (Table 7).his discriminatory power can assure reliable use of theseeasures on clinical and scientific contexts.29 As the results
f Table 7 show, cutoff values vary with the speech task, thearameter5,33 and age range. In practice, however, it is sug-ested that the rater use the most robust cutoff values toistinguish the voice of individuals with hearing impairment,roviding greater reliability in the use of this instrument forhe population with cochlear implants. These results werebtained for all of the groups together in the spontaneousonversation (Table 7). For the PEV-SHI, therefore, the 30.5alue corresponds to the cutoff point between normal vari-bility and mild vocal deviation; the 49.0 value correspondso the cutoff point between mild and moderate vocal devi-tion; and the 69.5 value corresponds to the cutoff pointetween moderate and intense deviation (Fig. 1).
The results discussed in this section show that theustained vowel did not differentiate the voices of thendividuals with cochlear implants from those with normalearing as robustly as the connected speech and sponta-eous conversation. Even so, the vowel can be used, withaution, for evaluation with the PEV-SHI, considering thathis task has great importance for the global comprehensionf the vocal behavior.30,40
Some of the benefits of using the PEV-SHI for the targetopulation over existing auditory-perceptual tools include:valuating voice while taking into account in a single instru-ent all elements of the voice production (respiration,honation, resonance and suprasegmental aspects)1---3; theossibility to unravel the resonance and evaluate predomi-ance of one or more resonance focus; assessing instability;aving a VAS for an additional parameter and assessing theeneral vocal perception after taking into account all of thearameters.
Although this validation study was performed with CIsers, the PEV-SHI can also be of great contribution otherroups of individuals with hearing impairment, such as usersf hearing aids or other implantable devices. The extractionf psychometric measures for other groups with hearing losss recommended, since the cutoff values established in thistudy correspond to CI users of the studied age rage. Furthertudies include also the use of the PEV-SHI with individu-ls with hearing impairment during the stages of pubertynd aging. The PEV-SHI is currently undergoing transculturaldaptation for the English language.
The PEV-SHI is a reliable and useful tool for assessinghe particularities of the voice of individuals with hear-ng impairment with cochlear implants and can be used inesearch to standardize evaluation and facilitate informa-ion exchange among services. It can also be used as part of
he clinical assessment of patients, which should encompassll aspects of oral communication, from auditory abilities,o language development, orofacial functions and voice pro-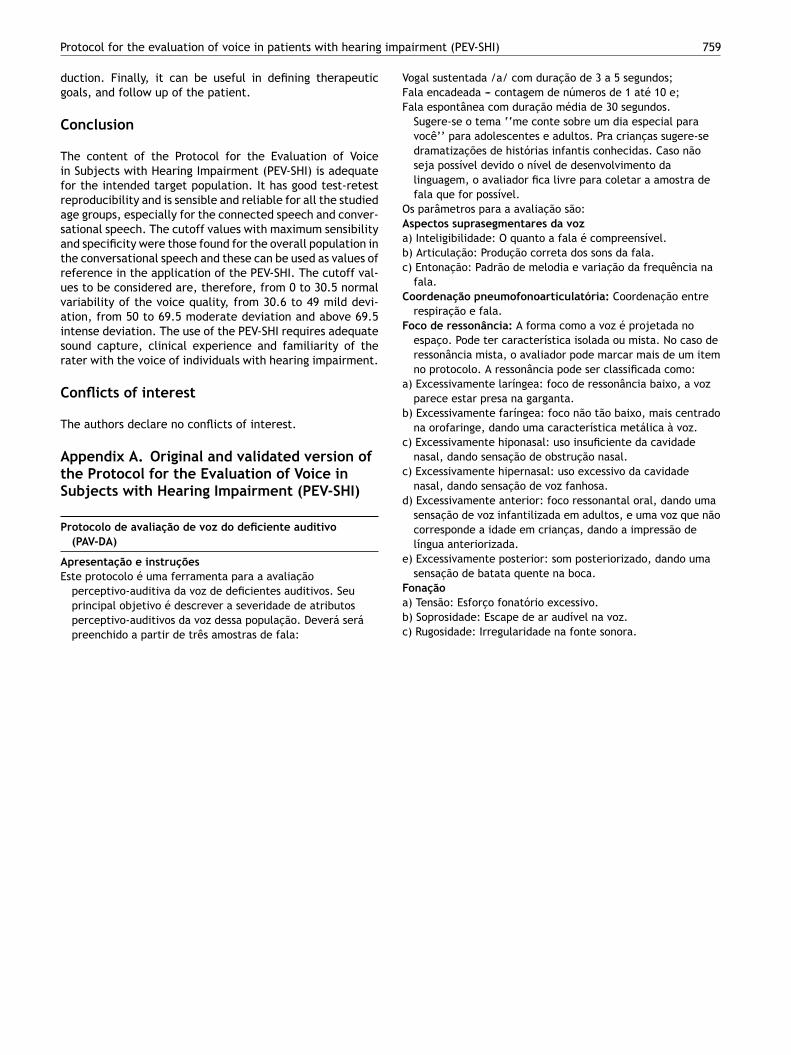
imp
VFF
OAabc
C
F
a
b
c
c
d
e
Protocol for the evaluation of voice in patients with hearing
duction. Finally, it can be useful in defining therapeuticgoals, and follow up of the patient.
Conclusion
The content of the Protocol for the Evaluation of Voicein Subjects with Hearing Impairment (PEV-SHI) is adequatefor the intended target population. It has good test-retestreproducibility and is sensible and reliable for all the studiedage groups, especially for the connected speech and conver-sational speech. The cutoff values with maximum sensibilityand specificity were those found for the overall population inthe conversational speech and these can be used as values ofreference in the application of the PEV-SHI. The cutoff val-ues to be considered are, therefore, from 0 to 30.5 normalvariability of the voice quality, from 30.6 to 49 mild devi-ation, from 50 to 69.5 moderate deviation and above 69.5intense deviation. The use of the PEV-SHI requires adequatesound capture, clinical experience and familiarity of therater with the voice of individuals with hearing impairment.
Conflicts of interest
The authors declare no conflicts of interest.
Appendix A. Original and validated version ofthe Protocol for the Evaluation of Voice inSubjects with Hearing Impairment (PEV-SHI)
Protocolo de avaliacão de voz do deficiente auditivo(PAV-DA)
Apresentacão e instrucõesEste protocolo é uma ferramenta para a avaliacão
perceptivo-auditiva da voz de deficientes auditivos. Seuprincipal objetivo é descrever a severidade de atributosperceptivo-auditivos da voz dessa populacão. Deverá serápreenchido a partir de três amostras de fala:
Fabc
airment (PEV-SHI) 759
ogal sustentada /a/ com duracão de 3 a 5 segundos;ala encadeada --- contagem de números de 1 até 10 e;ala espontânea com duracão média de 30 segundos.Sugere-se o tema ‘‘me conte sobre um dia especial paravocê’’ para adolescentes e adultos. Pra criancas sugere-sedramatizacões de histórias infantis conhecidas. Caso nãoseja possível devido o nível de desenvolvimento dalinguagem, o avaliador fica livre para coletar a amostra defala que for possível.
s parâmetros para a avaliacão são:spectos suprasegmentares da voz) Inteligibilidade: O quanto a fala é compreensível.) Articulacão: Producão correta dos sons da fala.) Entonacão: Padrão de melodia e variacão da frequência nafala.
oordenacão pneumofonoarticulatória: Coordenacão entrerespiracão e fala.
oco de ressonância: A forma como a voz é projetada noespaco. Pode ter característica isolada ou mista. No caso deressonância mista, o avaliador pode marcar mais de um itemno protocolo. A ressonância pode ser classificada como:
) Excessivamente laríngea: foco de ressonância baixo, a vozparece estar presa na garganta.
) Excessivamente faríngea: foco não tão baixo, mais centradona orofaringe, dando uma característica metálica à voz.
) Excessivamente hiponasal: uso insuficiente da cavidadenasal, dando sensacão de obstrucão nasal.
) Excessivamente hipernasal: uso excessivo da cavidadenasal, dando sensacão de voz fanhosa.
) Excessivamente anterior: foco ressonantal oral, dando umasensacão de voz infantilizada em adultos, e uma voz que nãocorresponde a idade em criancas, dando a impressão delíngua anteriorizada.
) Excessivamente posterior: som posteriorizado, dando umasensacão de batata quente na boca.
onacão) Tensão: Esforco fonatório excessivo.) Soprosidade: Escape de ar audível na voz.) Rugosidade: Irregularidade na fonte sonora.
7
d
e
f
P
I
C
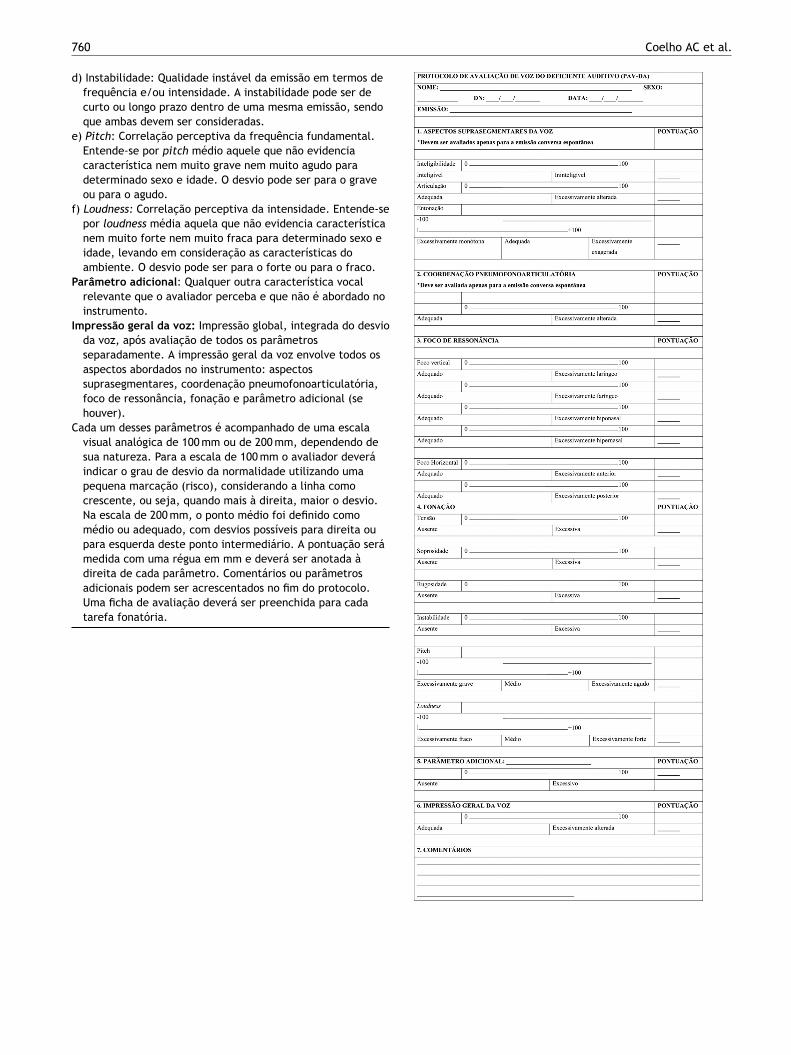
60
) Instabilidade: Qualidade instável da emissão em termos defrequência e/ou intensidade. A instabilidade pode ser decurto ou longo prazo dentro de uma mesma emissão, sendoque ambas devem ser consideradas.
) Pitch: Correlacão perceptiva da frequência fundamental.Entende-se por pitch médio aquele que não evidenciacaracterística nem muito grave nem muito agudo paradeterminado sexo e idade. O desvio pode ser para o graveou para o agudo.
) Loudness: Correlacão perceptiva da intensidade. Entende-sepor loudness média aquela que não evidencia característicanem muito forte nem muito fraca para determinado sexo eidade, levando em consideracão as características doambiente. O desvio pode ser para o forte ou para o fraco.
arâmetro adicional: Qualquer outra característica vocalrelevante que o avaliador perceba e que não é abordado noinstrumento.
mpressão geral da voz: Impressão global, integrada do desvioda voz, após avaliacão de todos os parâmetrosseparadamente. A impressão geral da voz envolve todos osaspectos abordados no instrumento: aspectossuprasegmentares, coordenacão pneumofonoarticulatória,foco de ressonância, fonacão e parâmetro adicional (sehouver).
ada um desses parâmetros é acompanhado de uma escalavisual analógica de 100 mm ou de 200 mm, dependendo desua natureza. Para a escala de 100 mm o avaliador deveráindicar o grau de desvio da normalidade utilizando umapequena marcacão (risco), considerando a linha comocrescente, ou seja, quando mais à direita, maior o desvio.Na escala de 200 mm, o ponto médio foi definido comomédio ou adequado, com desvios possíveis para direita oupara esquerda deste ponto intermediário. A pontuacão serámedida com uma régua em mm e deverá ser anotada àdireita de cada parâmetro. Comentários ou parâmetros
adicionais podem ser acrescentados no fim do protocolo.Uma ficha de avaliacão deverá ser preenchida para cadatarefa fonatória.Coelho AC et al.
imp
2
2
2
2
2
2
2
2
2
2
3
3
3
3
3
3
3
3
Protocol for the evaluation of voice in patients with hearing
References
1. Brown S, Laird AR, Pfordresher PQ, Thelen SM, TurkeltaubP, Liotti M. The somatotopy of speech: phonation and artic-ulation in the human motor cortex. Brain Cogn. 2009;70:31---41.
2. Rodero E, Diaz-Rodriguez C, Larrea O. A training model forimproving journalists’ voice. J Voice. 2018;32:386.e11---9.
3. Coelho AC, Medved DM, Brasolotto AG. Hearing loss and thevoice. In: Bahmad F Jr, editor. Update on hearing loss, vol. 1, 1ed InTech; 2015. p. 103---28.
4. Behlau M, Madazio G, Oliveira G. Functional dysphonia: strate-gies to improve patient outcomes. Patient Relat Outcome Meas.2015;6:243---53.
5. Yamasaki R, Madazio G, Leão SH, Padovani M, Azevedo R,Behlau M. Auditory-perceptual evaluation of normal and dys-phonic voices using the voice deviation scale. J Voice. 2017;31:67---71.
6. Baudonck N, D’haeseleer E, Dhooge I, Van Lierde K. Objectivevocal quality in children using cochlear implants: a multiparam-eter approach. J Voice. 2011;25:683---91.
7. Coelho AC, Brasolotto AG, Bevilacqua MC. An initial study ofvoice characteristics of children using two different sound cod-ing strategies in comparison to normal hearing children. Int JAudiol. 2015;54:417---23.
8. Guerrero Lopez HA, Mondain M, Amy de la Bretèque B, Ser-rafero P, Trottier C, Barkat-Defradas M. Acoustic, aerodynamic,and perceptual analyses of the voice of cochlear-implanted chil-dren. J Voice. 2013:523.e1---17.
9. Baudonck N, Van Lierde K, Dhooge I, Corthals P. A comparison ofvowel productions in prelingually deaf children using cochlearimplants, severe hearing-impaired children using conventionalhearing aids and normal-hearing children. Folia Phoniatr Logop.2011;63:154---60.
10. Selleck MA, Sataloff RT. The impact of the auditory system onphonation: a review. J Voice. 2014;28:688---93.
11. Nguyen LH, Allegro J, Low A, Papsin B, Campisi P. Effect ofcochlear implantation on nasality in children. Ear Nose ThroatJ. 2008;87:140---3.
12. de Souza LB, Bevilacqua MC, Brasolotto AG, Coelho AC.Cochlear implanted children present vocal parameters withinnormal standards. Int J Pediatr Otorhinolaryngol. 2012;76:1180---3.
13. Jafari N, Izadi F, Salehi A, Dabirmoghaddam P, Yade-gari F, Moghadam ST. Objective voice analysis of pedi-atric cochlear implant recipients and comparison withhearing aids users and hearing controls. J Voice. 2017:505.e11---8.
14. Wirz S. The voice of the deaf. In: Singular, editor. Voice disordersand their management. Boston, MA: Springer; 1991. p. 283---303.San Diego.
15. Buder EH, Chorna LB, Oller DK, Robinson RB. Vibratory regimeclassification of infant phonation. J Voice. 2008;22:553---64.
16. Hirano M. Clinical examination of voice. Viena: Spinger-Veriag;1981.
17. Kempster GB, Gerratt BR, Verdolini Abbott K, Barkmeier-Kraemer J, Hillman RE. Consensus auditory-perceptualevaluation of voice: development of a standardizedclinical protocol. Am J Speech Lang Pathol. 2009;18:124---32.
18. Kent R. Hearing and believing: some limits to the auditory-perceptual assessment of speech and voice disorders. Am JSpeech Lang Pathol. 1996;5:7---23.
19. Aaronson N, Alonso J, Burnam A, Lohr KN, Patrick DL, PerrinDL, et al. Assessing health status and quality-of-life instru-ments: attributes and review criteria. Qual Life Res. 2002;11:193---205.
airment (PEV-SHI) 761
0. Kelchner LN, Brehm SB, Weinrich B, Middendorf J, deAlarconA, Levin L, et al. Perceptual evaluation of severe pedi-atric voice disorders: rater reliability using the consensusauditory perceptual evaluation of voice. J Voice. 2010;24:441---9.
1. Ribeiro VV, de Oliveira GA, Vitor JS, Ramos ACP, BrasolottoAG, Silverio KCA. Effectiveness of voice therapy associatedwith electromyographic biofeedback in women with behavioraldysphonia: randomized placebo-controlled double-blind clinicaltrial. J Voice. 2018;33:e11---381.e22.
2. Lee YW, Kim GH, Bae IH, Park HJ, Wang SG, Kwon SB. Thecut-off analysis using visual analogue scale and cepstral assess-ments on severity of voice disorder. Logop Phoniatr Vocol.2018;43:175---80.
3. Dassie-Leite AP, Behlau M, Nesi-Franca S, Lima MN, de LacerdaL. Vocal Evaluation of children with congenital hypothyroidism.J Voice. 2018:770.e11---9.
4. Mozzanica F, Ginocchio D, Borghi E, Bachmann C, Schindler A.Reliability and validity of the Italian version of the ConsensusAuditory-Perceptual Evaluation of Voice (CAPE-V). Folia Phoni-atr Logop. 2013;65:257---65.
5. Nemr K, Simões-Zenari M, Cordeiro GF, Tsuji D, Ogawa AI,Ubrig MT, et al. GRBAS and Cape-V scales: high reliability andconsensus when applied at different times. J Voice. 2012:812.e17---22.
6. Alexandre NMC, CMZO Coluci. Validade de conteúdo nos pro-cessos de construcão e adaptacão de instrumentos e medidas.Ciênc Saúde Coletiva. 2011;6:3061---8.
7. Almeida TM, Cola PC, Pernambuco LA, Magalhães HV, MagnoniCD, Silva RGD. Screening tool for oropharyngeal dysphagia instroke ---- part I: evidence of validity based on the content andresponse processes. Codas. 2017;29:e20170009.
8. De Vet HCW, Terwee CB, Mokkink LB, Knol DL. Measurement inmedicine. New York: Cambridge University Press; 2011.
9. Behlau M, Madazio G, Moreti F, Oliveira G, dos Santos LMA,Paulinelli BR, et al. Efficiency and cutoff values of self-assessment instruments on the impact of a voice problem. JVoice. 2016;30:506.e9---18.
0. Maryn Y, Roy N. Sustained vowels and continuous speech in theauditory-perceptual evaluation of dysphonia severity. J Soc BrasFonoaudiol. 2012;24:107---12.
1. Souza LB, Pereira RM, Santos MM, Godoy CM. Fundamentalfrequency, phonation maximum time and vocal complaints inmorbidly obese women. Arq Bras Cir Dig. 2014;27:43---6.
2. ECMd Melo, Mattioli FM, Brasil OCO, Behlau M, Pitaluga ACA,Melo DMd. Childhood’s disphonia epidemiologic aspects. RevBras Otorrinolaringol. 2001;67:804---7.
3. Baravieira PB, Brasolotto AG, Montagnoli AN, Silvério KC,Yamasaki R, Behlau M. Auditory-perceptual evaluationof rough and breathy voices: correspondence betweenanalogical visual and numerical scale. Codas. 2016;28:163---7.
4. Peng SC, Tomblin JB, Turner CW. Production and perceptionof speech intonation in pediatric cochlear implant recipi-ents and individuals with normal hearing. Ear Hear. 2008;29:336---51.
5. Chin SB, Bergeson TR, Phan J. Speech intelligibility and prosodyproduction in children with cochlear implants. J Commun Dis-ord. 2012;45:355---66.
6. Chesnaye MA, Bell SL, Harte JM, Simpson DM. Objectivemeasures for detecting the auditory brainstem response: com-parisons of specificity, sensitivity and detection time. Int JAudiol. 2018;57:468---78.
7. Zraick RI, Kempster GB, Connor NP, Thibeault S, Klaben BK,
Bursac Z, et al. Establishing validity of the Consensus Auditory-Perceptual Evaluation of Voice (CAPE-V). Am J Speech LangPathol. 2011;20:14---22.
762 Coelho AC et al.
38. Karnell MP, Melton SD, Childes JM, Coleman TC, Dailey SA, Hoff-man HT. Reliability of clinician-based (GRBAS and CAPE-V) andpatient-based (V-RQOL and IPVI) documentation of voice disor-ders. J Voice. 2007;21:576---90.
39. Behlau M, Alves Dos Santos Le M, Oliveira G. Cross-cultural adap-tation and validation of the voice handicap index into BrazilianPortuguese. J Voice. 2011;25:354---9.
40. Coelho AC, Brasolotto AG, Fernandes ACN, de Souza MedvedDM, da Silva EM, Bahmad F Jr. Auditory-perceptual eval-uation of voice quality of cochlear-implanted and normal-hearing individuals: a reliability study. J Voice. 2017;31:774.e1---8.
Erratum on ‘‘Development and validation of the protocol for the evaluation of voice in patients with hearing impairment (PEV-SHI)’’
IIn the article ‘‘Development and validation of the protocol for the evaluation of voice in patients with hearing impairment (PEV-SHI)’’, published in BrazJ Otorhinolaryngol. 2020;86(6):748-62, with DOI number https://doi.org/10.1016/j.bjorl.2019.05.007, in the title of the article, where it reads:
Development and validation of the protocol for the evaluation of voice in patients with hearing impairment (PEV-SHI)It should read:
Development and validation of the protocol for the evalua-tion of voice in subjects with hearing impairment (PEV-SHI)