Embed Size (px)
Citation preview
8/12/2019 Caracterização reológica de pós farmacêuticos
http://slidepdf.com/reader/full/caracterizacao-reologica-de-pos-farmaceuticos 1/13
International Journal of Pharmaceutics 189 (1999) 91–103
Rheological characterization of pharmaceutical powdersusing tap testing, shear cell and mercury porosimeter
E. Guerin a, P. Tchoreloff a, B. Leclerc a, D. Tanguy b, M. Deleuil c,G. Couarraze a,*
a Laboratoire de physique pharmaceutique, UMR 8612 du CNRS , Uni ersite Paris XI , 5 rue J . B . Clement,
92296 Chatenay -Malabry cedex, Franceb Rhodia, Di ision Organique Fine, 24 aenue Jean Jaures, 69153 Decines, France
c Rhone Poulenc Rorer, De eloppement chimique et pharmaceutique, Sciences Pharmaceutiques, 92165 Antony, France
Received 7 January 1999; received in revised form 14 July 1999; accepted 18 July 1999
Abstract
Most of the pharmaceutical processes involved in the manufacturing of solid dosage forms are connected wit
powder flow properties, at least for some of the intermediate steps. Powder flow characteristics are commonl
investigated by various measurements, such as, handling angles, tap testing, shear cell measurements, etc. All thes
approaches allow the calculation of indices characterising powder flowability. Unfortunately, these methodologies ar
highly product consuming, which is a limitation in the first steps of a novel drug development, when only a smal
amount of the product is available. The use of mercury porosimetry to evaluate compressibility and flow propertieof powders could be a new and alternative approach to obtain insight in the rheological properties of granula
medium by the interpretation of the first part of porograms (low pressures). We have developed such an evaluatio
and compared the results obtained with those given by tap testing and shear cell measurements, applied to fou
excipients for direct tabletting and three different drugs. Mercury porosimetry turned out to be a sensitive technique
able to provide quantitative information about powder flow properties, complemented by an evaluation of particle
micro porosity and size distribution, in a single step. These characterisations are obtained with only 250 mg of bul
powder compared to high quantities (100 g) needed for other methods. © 1999 Elsevier Science B.V. All right
reserved.
Keywords: Shear cell; Mercury porosimetry; Tap testing; Powder rheology; Compressibility; Flowability indices
www.elsevier.com/locate/ijpharm
1. Introduction
During a pharmaceutical process, most of th
steps such as sieving, pouring, micronizing, mix
ing, pneumatic conveying, grinding, drying, com
paction, are connected with the powder
* Corresponding author. Tel.: +33-1-46-83-56-16; fax: +
33-1-46-83-58-82.
E -mail address: [email protected] (G.
Couarraze)
0378-5173/99/$ - see front matter © 1999 Elsevier Science B.V. All rights reserved.
PII: S 0 3 7 8 - 5 1 7 3 ( 9 9 ) 0 0 2 4 3 - 4
8/12/2019 Caracterização reológica de pós farmacêuticos
http://slidepdf.com/reader/full/caracterizacao-reologica-de-pos-farmaceuticos 2/13
E . Guerin et al . / International Journal of Pharmaceutics 189 (1999) 91–103 92
flowability (Tan and Newton, 1990). The dosage
and therefore the pharmacological effect of drugs
are totally dependent on, e.g. the capacity of the
powder to be fed into a press die before being
compressed.
Flow properties of powder must be studied in
terms of quality control of raw materials in order
to maintain product uniformity but also to avoidrigid situations in which process breakdown may
occur, with respect to imposed conditions. Conse-
quently, powder flow properties should be mea-
sured and optimized as part of every development
program (Lewis and Simpkin, 1994).
It is obvious that flowing characteristics of
powders are highly dependent on their densifica-
tion (consolidation) states, i.e. powders can be
more or less expanded or contracted when
stressed, thus leading to a large variety of inter
particle forces. Factors associated with the natureof the particles are size (Molerus and Nywlt,
1984), shape, surface morphology, packing ability
should be considered when studying powder flow-
ing properties, but particle forces associated with
these factors should also be taken into consider-
ation. Then, a powder must be considered as a
whole medium that sums up all these interactions
at the particle/particle contacts. Powder flowing
properties are influenced by any factor that can
have an effect on these particle/particle interac-
tions (for a review, see Deleuil et al., 1994).Powder flow characteristics are commonly in-
vestigated under gravity loading conditions. Using
measurements such as the angle of repose and
other handling angles (Train, 1958), standardised
flow rate (Devise et al., 1975), apparent and
‘tapped’ densities and derived indices such as
defined by Carr (1965a) or Hausner (1967). Such
measurements have demonstrated the dependence
of powders flow on particle’s shape and size distri-
bution (Carstensen, 1973), on temperature or rela-
tive humidity, but they have been proved difficultto relate to features at particulate level.
Thus, a more fundamental and physical mea-
surement should be easily achievable using shear
cells (Jenike, 1964; Schwedes and Schulze, 1990;
Kamath et al., 1993). These cells are designed to
condition powders under a known load and to
measure forces needed to shear powder beds
(Chulia, 1984). This measurement is able t
provide useful indications of powder flow
threshold, while the powder bed is being loaded
Then, if the forces applied on a powder are ap
proximately known during a given process, intrin
sic information regarding the frictional an
cohesive natures of granular material can be gath
ered. This information could then be relevanduring real process. It is important to note tha
this methodology is time and product consumin
and that correct and reproducible preparation o
samples is quite difficult to achieve and results ca
be very operator and know-how dependent. Onc
rheological properties of a given powder hav
been identified by shear testing, tap testing can b
profitably used for routine checks or to establis
conformity of different batches because empirica
connections have been found between tap densit
values and shear cell determined flow function(Cohard et al., 1985).
Nevertheless, all these approaches present
major disadvantage being that they are to
product consuming, particularly during the firs
step of a novel drug development when only
very little amount of the product is available.
On the other hand, mercury porosimetry ha
been largely proposed to routinely measure th
pore volume and to calculate pore radii or surfac
area of porous solids (Kloubek, 1994). Other au
thors have also suggested that mercury porosimetry can be used to study the compatibility o
powders in the same fashion as with an isostati
press (Maijling et al., 1994).
As a matter of fact, when the porous solid i
constituted of a bulk powder, totally expanded
the mercury intrusion is preceded by a rearrange
ment procedure of the powder bed at low mercur
pressures. It is then realistic to assume that mea
surements carried out at this level can be relate
to rheological properties of powder beds set i
shear cell measurement.The aim of this work is to try to evaluat
compressibility and flow properties of pharmaceu
tical powders by analysing the initial part of th
curves obtained from mercury porosimeter mea
surements. We have also tried to compare result
given by different powders through tap testing
and shear cell testing with those derived from
8/12/2019 Caracterização reológica de pós farmacêuticos
http://slidepdf.com/reader/full/caracterizacao-reologica-de-pos-farmaceuticos 3/13
E . Guerin et al . / International Journal of Pharmaceutics 189 (1999) 91–103 9
porograms. We will then discuss accuracy of rela-
tionships between these different approaches.
2. Materials and methods
2 .1. Materials
Seven products of varying flow properties and
without critical toxicity were selected. Three of them (group 1) are known to display
free flowing behaviour and are used as excipi-
ents for direct compression: Di Calcium Phos-
phate, Di Tab® (DT) (Rhone Poulenc Rorer,
rue R Aron, Antony, France); Lactose Fast
Flo® (FF) (Foremost McKesson Foods Group,
San Fransisco, CA 94104, USA); and Lactose
Extra Fine Kristal® (EFK) (Hollandsche, B.V.
Melksuikerfabriek, Uitgeest, Netherlands). One can be considered as an intermediate
(group 2): Lactose Fine Kristal® (FK) (Hol-
landsche, B.V. Melksuikerfabriek, Uitgeest,
Netherlands). And three others are well-known drugs (group
3) and renowned for their poor flowing proper-
ties (all are obtained from Rhone Poulenc
Rorer, rue R Aron, Antony, France): Ketopro-
fen® (KETO); Acebutolol Chlorhydrate®
(ACEB); and Celiprolol Chlorhydrate®
(CELI).
All these powders were tested as received (bu
stored under controlled room temperature an
50% of relative humidity) for their apparent parti
cle densities with a Quantachrome Multipycnome
ter (Quantachrome corporation, Boynton Beach
FL 33426, USA) using helium as the inert ga
Apparent particle density is defined here as th
true density, with the fraction corresponding tthe closed pores added and will be noted t. Te
replicate measurements were performed, and th
variability of the results was on the fourth deci
mal. Their size distribution was also determine
(five replicate measurements) using a Sympate
laser particle size analyser equipped with a liqui
(fluid silicone) cell. The use of ultra sounds wa
optimised to obtain the most reproducible results
All results are reported in Table 1.
2 .2 . Methods
2 .2 .1. Tap testing
An Engelsmann powder tester (STAV 2003 En
gelsmann AG Apparatebau, Ludwigshafen, Ger
many) was used to measure tapped densities, thre
replicate measurements were performed for eac
powder under normalised conditions as describ
in the European Pharmacopeia (1997). For eac
determination, the test tube was filled with pow
der sample and the initial volume V o was mea
sured giving access to bulk powder density Powder volume was measured after 10, 50, 100
500 and 1250 taps (1250 taps was always sufficien
to attain the equilibrium tap volume). When th
equilibrium volume was obtained, the final tappe
density tap was determined. Results will be ex
pressed latter in terms of compressible volum
(V o−V n) after n taps, and reported in cm3 pe
gram of bulk material. Actual compressibility in
dices I c of each powder were calculated (variabil
ity 0.1%) as defined by Carr (1965b):
I c(%)=tap−o
tap
×100. (1
2 .2 .2 . Shear cell measurements
All measurements were performed with a Jenik
shear cell (home made model, diameter of 8 cm
and total volume of 125.7 cm3). Under an uniaxia
Table 1
size distributions and apparent particle densities of the pow-
ders studieda
PopulationMedian d 50 t (g/cm3)
(m) peak(s) (m)
1.56398EFK 134
32 13.5/112DT 2.355
FF 11297 1.552
51FK 66 1.575
ACEB 35 33 1.2611.23111/7923CELI
29 33KETO 1.275
a Results are given in median d 50 which represents the
diameter at 50% of the population cumulative curves and in
diameter(s) at the maximum(s) of the population peaks. The
last column gives the apparent particle densities (t) of the
powders studied, obtained by gas pycnometry.
8/12/2019 Caracterização reológica de pós farmacêuticos
http://slidepdf.com/reader/full/caracterizacao-reologica-de-pos-farmaceuticos 4/13
E . Guerin et al . / International Journal of Pharmaceutics 189 (1999) 91–103 94
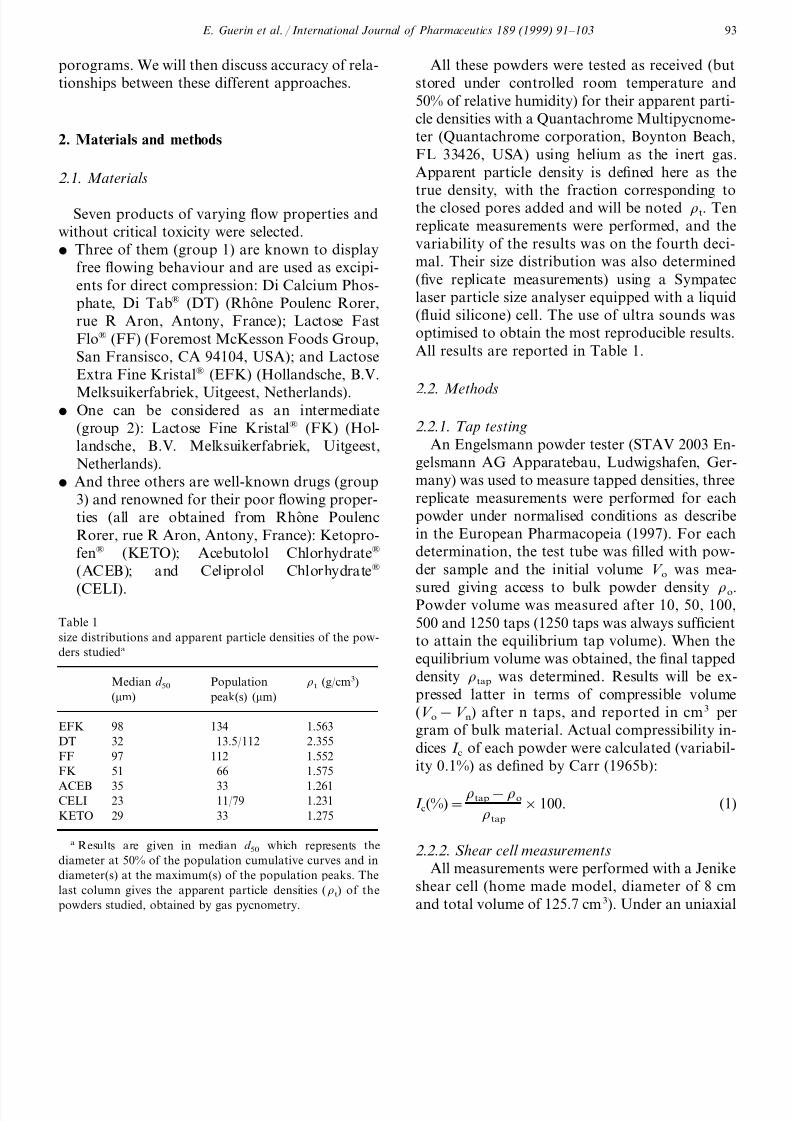
Fig. 1. A classical schematic porogram. We defined different
parameters: V 1, compressible measured volume (cm3/g of pow-
der); V 2, porous interparticular volume (cm3/g of power); P0,
first recorded pressure at the beginning of the powder packing;
and P1, the locking pressure at the end of the powder packing
step, just before the mercury intrusion in the interparticular
pores.
kPa. This value was chosen because it corre
sponds to a maximal stress that can give a
accurate precision (0.2) on the flowing indice
(measurements using higher c give less repro
ducible i values for some of the powders studied)
Then, only four points (repeated three times) ar
performed, under axial loads in the range o
20–80% of c, to draw yield loci. Such a simplification was used to minimize quantities of raw
material needed. As such experiments are highl
moisture dependent (Lloyd and Webb, 1987), a
the experiments were performed under controlle
atmosphere.
2 .2 .3 . Porosimetry measurements
Porosimetry measurements were performe
with a Autopore 9220 porosimete
(Micromeretics, ZATE Saint Maximin, Crei
France). This apparatus presents the advantage ocontinuous data acquisition in a ‘0’ to 4000 bar
pressure range. The cell is disposed horizontall
during the first step corresponding to the low
pressure measurements (from 10−2 to 2 bars) an
prevents mercury column weight influence.
The first recorded pressure (Fig. 1), at the be
ginning of powder packing will be noted P0. Pres
sure P1 which corresponds to the end of th
powder packing step (before mercury intrusion i
the interparticular pores) is determined as th
inflection point of the porogram (porogram corresponds to the plot of the mercury intrusion vo
ume as a function of applied pressure). We hav
taken into account the maximum of the derivativ
curve to obtain a precise determination of P1. Th
compressible volume V 1 that corresponds to th
sample volume reduction during the packing ste
as reported in Fig. 1 is determined for each pow
der. Interparticular porous volume V 2 (mercur
intrusion volume), is also calculated as the differ
ence between total volume of intrusion and evalu
ated compressible volume V 1.
3. Results and discussion
3 .1. Tapped densities
The calculated bulk densities 0, tapped dens
normal stress , a powder bed may develop irre-
versible packing, resulting in densification (con-
solidation) and leading to a tangential force
needed to shear the bed.
The results of shear cell measurements are clas-
sically interpreted as yield loci in the Mohr space
(−). The intercept of the yield loci with axis
gives the cohesion parameter 0 and the slope
gives rise to kinematic angles () of internal
friction (Haaker, 1987; Butters et al., 1991; Pod-czeck and Miah, 1996). Mohr circles tangent to
the yield loci give rise to the major principal
normal stress max and to the effective consolida-
tion stress (or unconfined yield strength) fc.
A plot of fc versus major principal normal
stress max can be obtained and represents the
flow function. In the current case of linear rela-
tion, Jenike and Carson (1985) has also proposed
to define a flow indice i as follows:
i =max
fc . (2)
We have adopted a simplified (Deleuil, unpub-
lished data) measurement procedure. Each pow-
der is firstly passed through a sieve to minimize
powder history (handling, storage, etc.). In all
cases, c (consolidating load) was equal to 13.76
8/12/2019 Caracterização reológica de pós farmacêuticos
http://slidepdf.com/reader/full/caracterizacao-reologica-de-pos-farmaceuticos 5/13
E . Guerin et al . / International Journal of Pharmaceutics 189 (1999) 91–103 9
ties tap and Carr indices I c are reported in Table
2. It is possible to distinguish two powder groups.
The first one is constituted of lactose FF, Di Tab
and to a lesser degree lactose EFK. All these
materials present I c values of 20% or less and
thus a good flowability. In the second group,
other powders exhibit a calculated I c higher than
30% characterizing poor flow properties.
Table 3
Shear cell testing of powders
c (g/cm3)a i c0 (kPa)b
12.90.50.91EFK
0.6DT 9.80.94
0.64FF 0.8 9.3
2.82.8FK 0.92
0.66ACEB 1.6 4.33.5CELI 2.30.59
3.30.63 2.1KETO
a c: the critical density in the steady state.b 0: the cohesion parameter.c i : the Jenike indice.
Table 2
Tap testing of powders
tap (g/cm3)b I c (%)co (g/cm3)a
21.5EFK 0.980.77
0.89 1.04DT 14.0
13.2FF 0.57 0.65
36.7FK 0.890.56
0.570.36ACEB 38.6
0.38 0.57CELI 33.3
0.51KETO 0.31 38.4
a o: the bulk density.b tap: is the tapped density.c I c: the Carr indice (%).
3 .2 . Shear cell measurements
For shear cell measurements, the powder be
should be conditioned in a steady state situatio
in which particles move in a plane without an
volume variation. This is a limit situation a
which shear density equals density before failure
This particular state corresponds to strain unde
flow conditions and is characterised by critica
density c and critical tangential force c mea
sured under an applied consolidation load c.
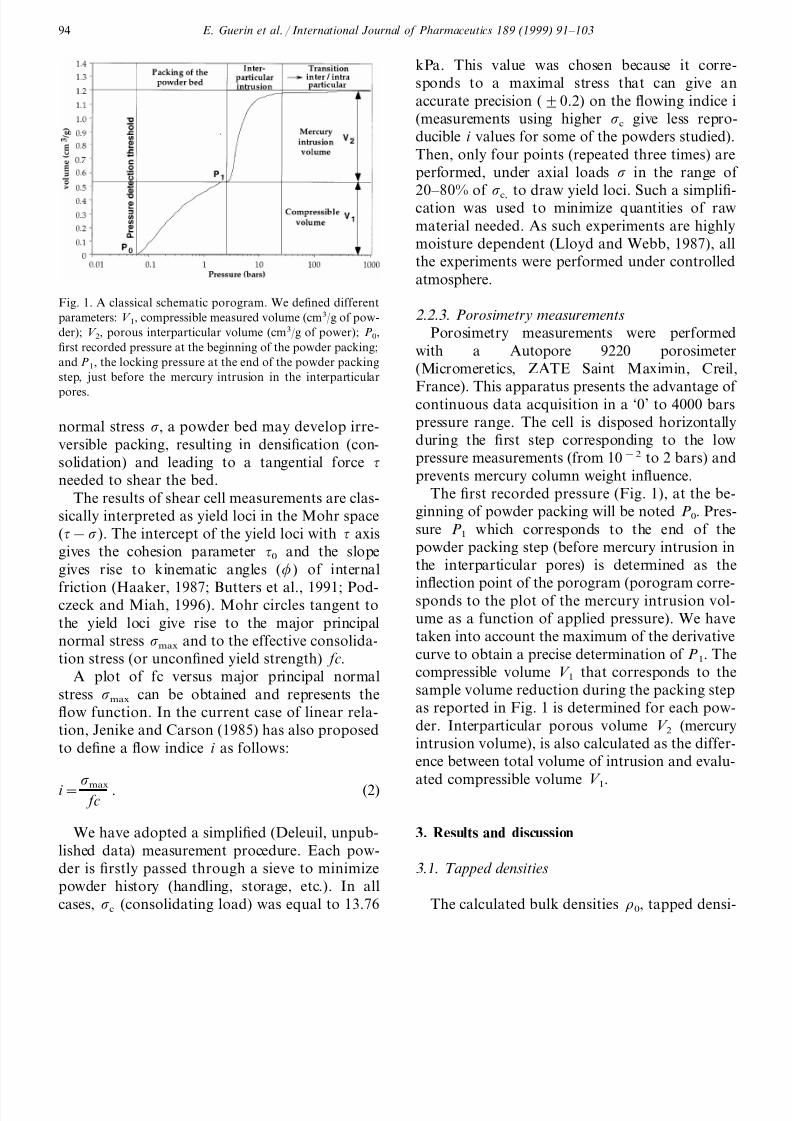
The graphs obtained from = f () plots ar
presented in Fig. 2 for the two most divergenpowders. Critical density c corresponding to th
shear steady state (c is obtained by weighing th
powder and taking into account the shear cell
volume), cohesion 0 and calculated flowabilit
indice i are reported in Table 3 for all powders
These results simplify the classification of th
materials as to their flowability. Three groups ca
be differentiated. Celiprolol, lactose FK and Ketoprofen must b
considered as cohesive powders with an i valu
included between 2 and 4. Acebutolol, Di Tab and lactose FF are inter
mediate flowing powders with 4 i 10; bu
Di Tab and lactose FF exhibit a comportmen
close to free flowing. Lactose EFK presents a calculated i value o
12.9 and must be considered as a free-flowin
powder.Fig. 2. = f () graphs obtained by shear cell measurements
for Lactose EFK and Celiprolol.
8/12/2019 Caracterização reológica de pós farmacêuticos
http://slidepdf.com/reader/full/caracterizacao-reologica-de-pos-farmaceuticos 6/13
E . Guerin et al . / International Journal of Pharmaceutics 189 (1999) 91–103 96
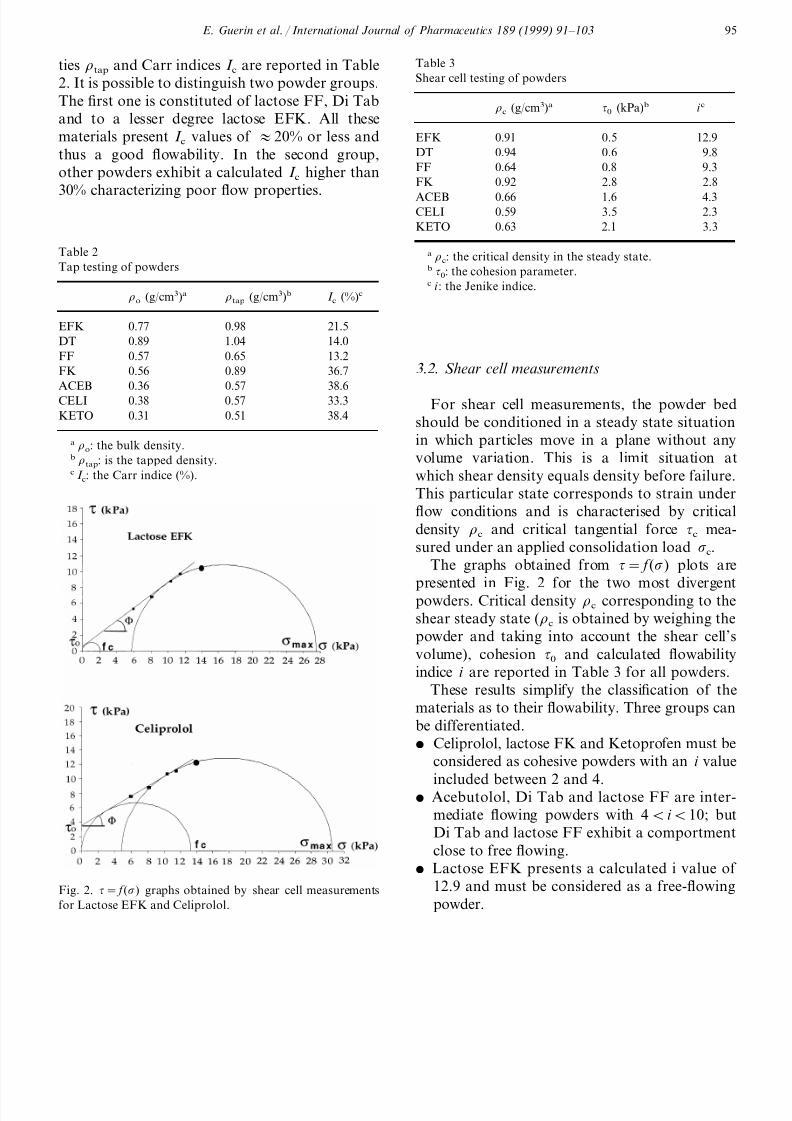
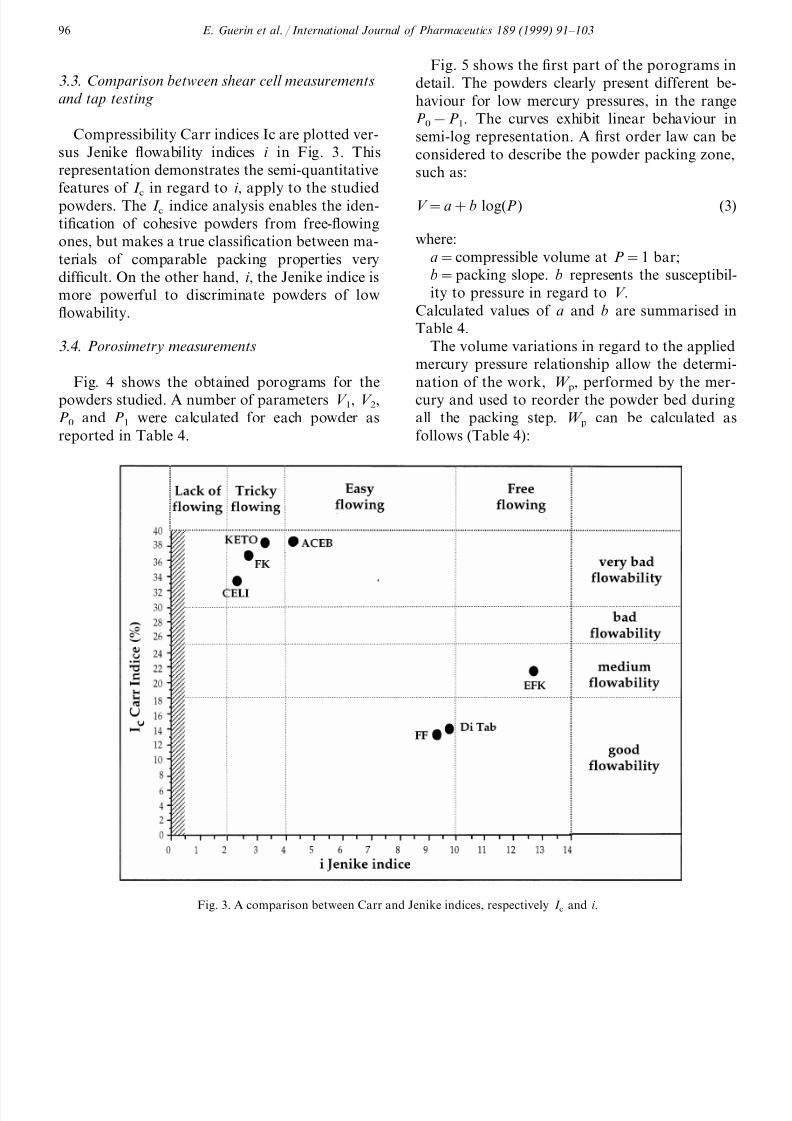
3 .3 . Comparison between shear cell measurements
and tap testing
Compressibility Carr indices Ic are plotted ver-
sus Jenike flowability indices i in Fig. 3. This
representation demonstrates the semi-quantitative
features of I c
in regard to i , apply to the studied
powders. The I c indice analysis enables the iden-
tification of cohesive powders from free-flowing
ones, but makes a true classification between ma-
terials of comparable packing properties very
difficult. On the other hand, i , the Jenike indice is
more powerful to discriminate powders of low
flowability.
3 .4 . Porosimetry measurements
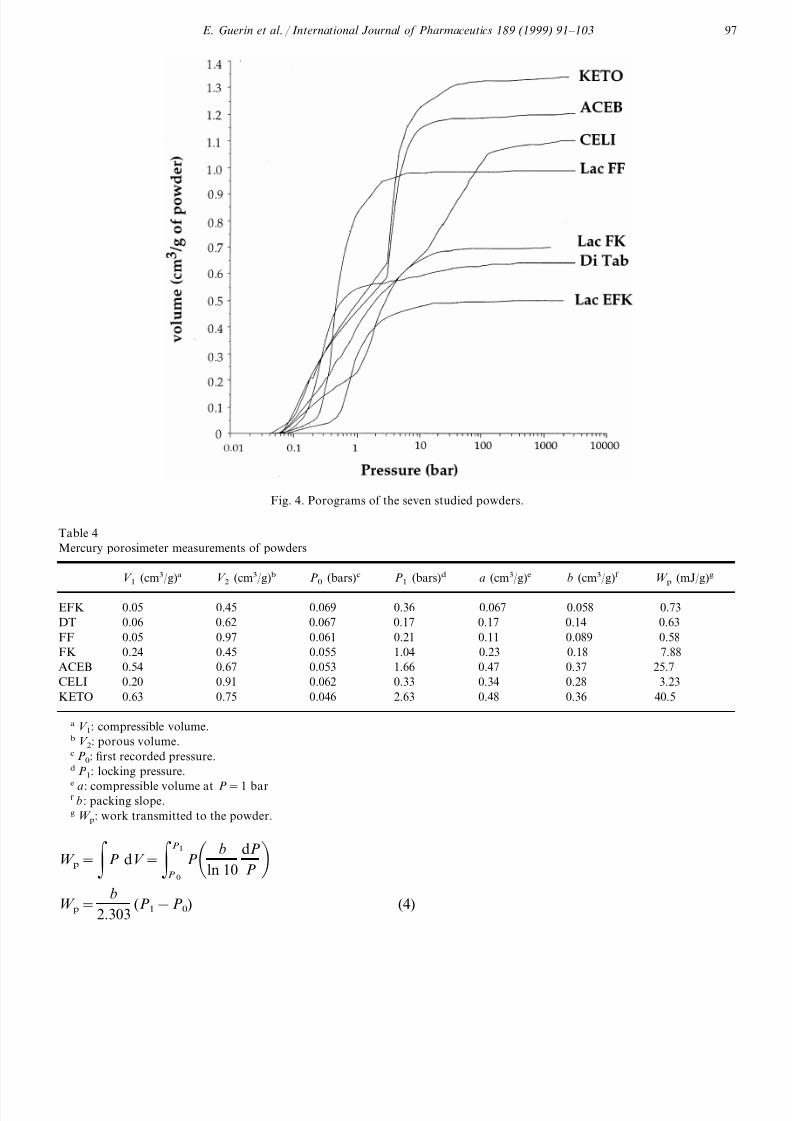
Fig. 4 shows the obtained porograms for the
powders studied. A number of parameters V 1, V 2,
P0 and P1 were calculated for each powder as
reported in Table 4.
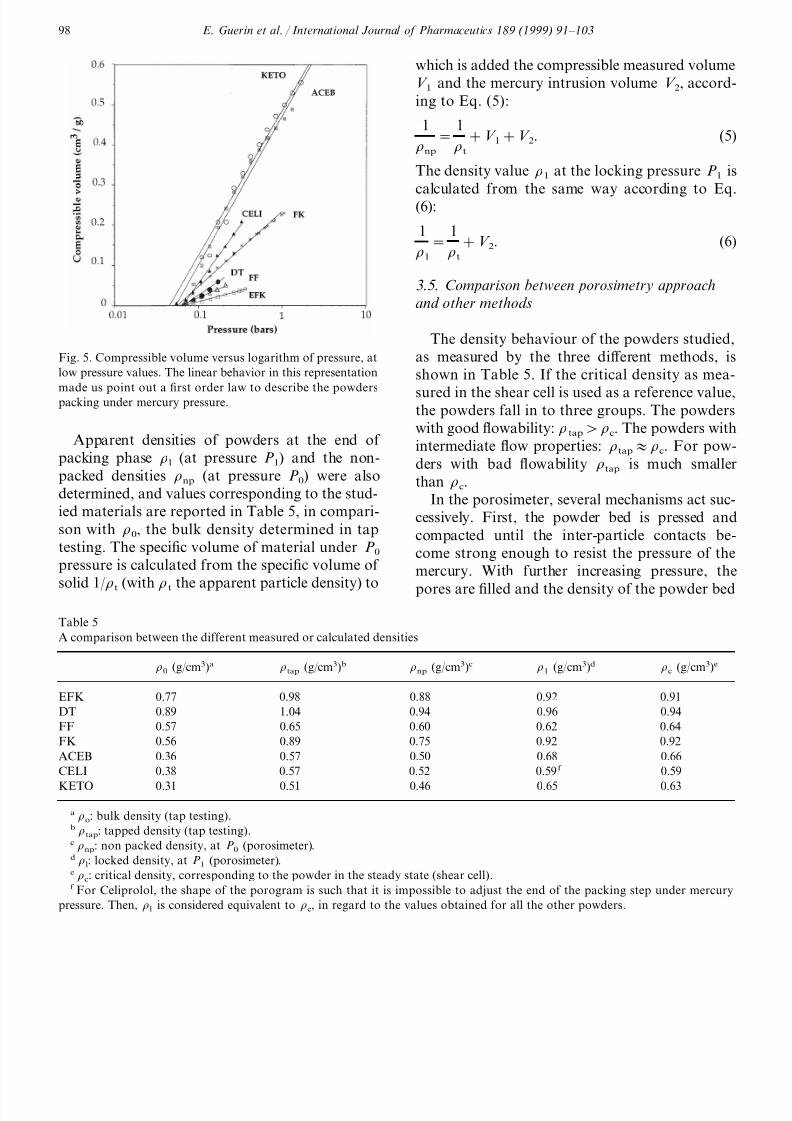
Fig. 5 shows the first part of the porograms i
detail. The powders clearly present different be
haviour for low mercury pressures, in the rang
P0−P1. The curves exhibit linear behaviour i
semi-log representation. A first order law can b
considered to describe the powder packing zone
such as:
V =a+b log(P) (3
where:
a=compressible volume at P=1 bar;
b=packing slope. b represents the susceptibi
ity to pressure in regard to V .
Calculated values of a and b are summarised i
Table 4.
The volume variations in regard to the applie
mercury pressure relationship allow the determ
nation of the work, W p, performed by the mer
cury and used to reorder the powder bed durin
all the packing step. W p can be calculated a
follows (Table 4):
Fig. 3. A comparison between Carr and Jenike indices, respectively I c and i .
8/12/2019 Caracterização reológica de pós farmacêuticos
http://slidepdf.com/reader/full/caracterizacao-reologica-de-pos-farmaceuticos 7/13
E . Guerin et al . / International Journal of Pharmaceutics 189 (1999) 91–103 9
Fig. 4. Porograms of the seven studied powders.
Table 4
Mercury porosimeter measurements of powders
V 2 (cm3/g)b P0 (bars)c P1 (bars)d a (cm3/g)e b (cm3/g)f V 1 (cm3/g)a W p (mJ/g)g
0.45 0.069 0.36EFK 0.0670.05 0.058 0.73
DT 0.06 0.62 0.067 0.17 0.17 0.14 0.63
0.97 0.061 0.21 0.11 0.089 0.58FF 0.05
0.45 0.055 1.040.24 0.23FK 0.18 7.88
0.54ACEB 0.67 0.053 1.66 0.47 0.37 25.7
0.91 0.062 0.33 0.34 0.28 3.23CELI 0.20
0.75 0.046 2.63 0.48 0.360.63 40.5KETO
a V 1: compressible volume.b V 2: porous volume.c P0: first recorded pressure.d P1: locking pressure.
e a: compressible volume at P=1 barf b : packing slope.g W p: work transmitted to the powder.
W p=
P dV = P 1
P 0
P b
ln 10
dP
P
W p= b
2.303 (P1−P0) (4)
8/12/2019 Caracterização reológica de pós farmacêuticos
http://slidepdf.com/reader/full/caracterizacao-reologica-de-pos-farmaceuticos 8/13
E . Guerin et al . / International Journal of Pharmaceutics 189 (1999) 91–103 98
Fig. 5. Compressible volume versus logarithm of pressure, at
low pressure values. The linear behavior in this representation
made us point out a first order law to describe the powderspacking under mercury pressure.
which is added the compressible measured volum
V 1 and the mercury intrusion volume V 2, accord
ing to Eq. (5):
1
np
=1
t
+V 1+V 2. (5
The density value 1 at the locking pressure P1 i
calculated from the same way according to Eq(6):
1
1
=1
t
+V 2. (6
3 .5 . Comparison between porosimetry approach
and other methods
The density behaviour of the powders studied
as measured by the three different methods, i
shown in Table 5. If the critical density as mea
sured in the shear cell is used as a reference valuethe powders fall in to three groups. The powder
with good flowability: tapc. The powders wit
intermediate flow properties: tapc. For pow
ders with bad flowability tap is much smalle
than c.
In the porosimeter, several mechanisms act suc
cessively. First, the powder bed is pressed an
compacted until the inter-particle contacts be
come strong enough to resist the pressure of th
mercury. With further increasing pressure, th
pores are filled and the density of the powder be
Apparent densities of powders at the end of
packing phase l (at pressure P1) and the non-
packed densities np (at pressure P0) were also
determined, and values corresponding to the stud-
ied materials are reported in Table 5, in compari-
son with 0, the bulk density determined in tap
testing. The specific volume of material under P0
pressure is calculated from the specific volume of
solid 1/t (with t the apparent particle density) to
Table 5
A comparison between the different measured or calculated densities
0 (g/cm3)a tap (g/cm3)b np (g/cm3)c 1 (g/cm3)d c (g/cm3)e
0.77 0.98EFK 0.88 0.92 0.91
1.04 0.94DT 0.960.89 0.94
0.57FF 0.65 0.60 0.62 0.64
0.56FK 0.89 0.75 0.92 0.92
0.660.680.50ACEB 0.570.36
CELI 0.38 0.57 0.52 0.59f 0.59
0.31 0.63KETO 0.650.460.51
a o: bulk density (tap testing).b tap: tapped density (tap testing).c np: non packed density, at P0 (porosimeter).d l: locked density, at P1 (porosimeter).e c: critical density, corresponding to the powder in the steady state (shear cell).f For Celiprolol, the shape of the porogram is such that it is impossible to adjust the end of the packing step under mercur
pressure. Then, l is considered equivalent to c, in regard to the values obtained for all the other powders.
8/12/2019 Caracterização reológica de pós farmacêuticos
http://slidepdf.com/reader/full/caracterizacao-reologica-de-pos-farmaceuticos 9/13
E . Guerin et al . / International Journal of Pharmaceutics 189 (1999) 91–103 9
Table 6
A comparison between the measured and corrected compressible volumes obtained from porosimetry measurements
V 1+V 2 (cm3/g)b V 0−V s (cm3/g)cV 1 (cm3/g)a V 1c (cm3/g)d
0.50EFK 0.660.05 0.21
DT 0.06 0.68 0.70 0.08
FF 1.020.05 1.11 0.21
0.69 1.150.24 0.71FK
0.54ACEB 1.21 1.98 1.291.11 1.82CELI 0.940.20
1.38 2.440.63 1.64KETO
a V 1: measured compressible volume per g of powder.b V 1+V 2: porous volume per gram of powder (detected by mercury porosimeter).c V 0−V S: porous volume per gram of powder (obtained from tap testing).d V 1c: corrected compressible volume per g of powder.
no longer increases (1). For all powders, the
measured density l is similar to the critical den-
sity c. This result is interesting because both
techniques are completely different in pressurelevel and method. Apparently, each powder has
an intrinsic critical density (l or c), independent
of the stress situation, but characteristic of the
stochastic optimal arrangement of the particules.
An important point should be discussed here
concerning the assessment of the compressible
volume from the mercury porosimeter analysis.
The total mercury intrusion volume per gram of
powder, detected during the analysis by the
porosimeter, is V 1+V 2. On the other hand, at the
beginning of tap testing, the porous volume calcu-lated by the difference between bulk volume V 0and solid volume V s is systematically greater than
V 1+V 2 (Table 6). This observation shows that a
fraction of the packing period is not taken into
account by the apparatus. The importance of this
unmeasured fraction varies with the powder stud-
ied. For the most sensitive materials, mercury
begins intensive packing of the powder at non-de-
tected pressures, and it should be noted that
unfortunately, the slope of V = f (log P ) has
highest values at this level.Therefore, it is better to take into account the
real compressible volume V 1c, defined as the dif-
ference of the void volume of bulk powder and
the porous interparticular volume V 2:
V 1c=(V 0−V s)−V 2. (7)
Corrected compressible volumes V 1c is calcu
lated in these conditions, for all the powder
studied are reported in Table 6 with regard to th
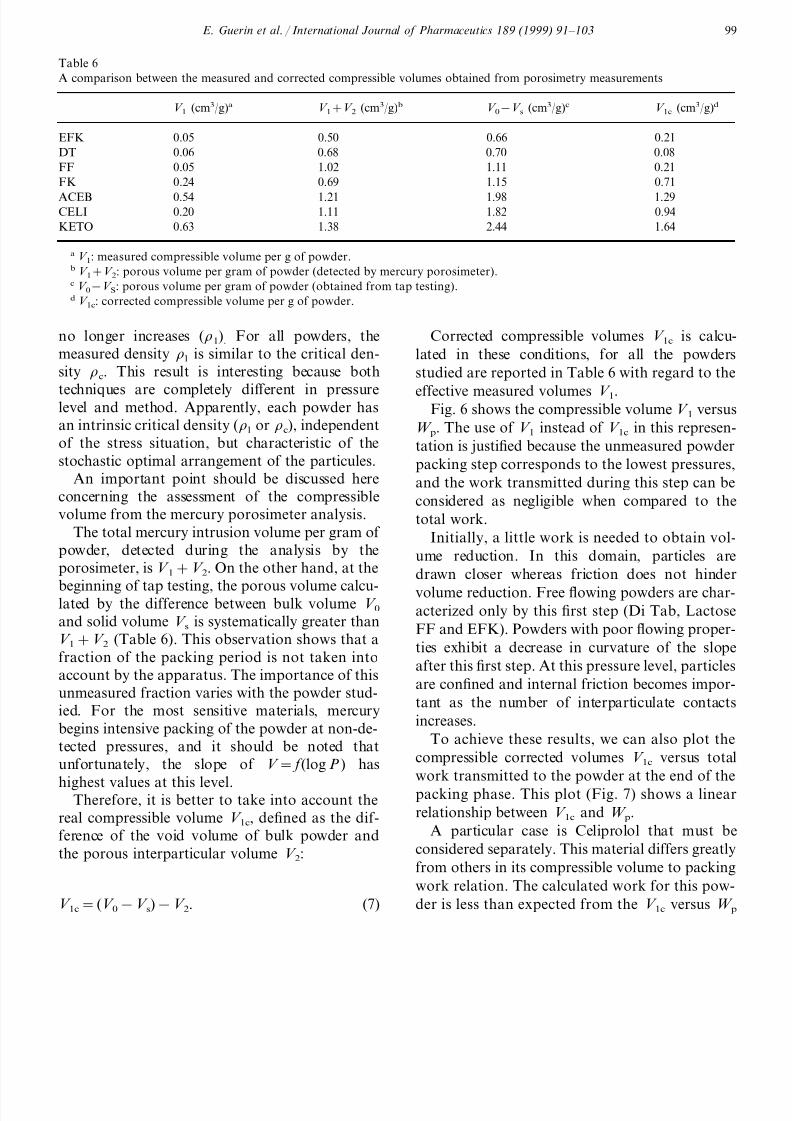
effective measured volumes V 1.Fig. 6 shows the compressible volume V 1 versu
W p. The use of V 1 instead of V 1c in this represen
tation is justified because the unmeasured powde
packing step corresponds to the lowest pressures
and the work transmitted during this step can b
considered as negligible when compared to th
total work.
Initially, a little work is needed to obtain vo
ume reduction. In this domain, particles ar
drawn closer whereas friction does not hinde
volume reduction. Free flowing powders are characterized only by this first step (Di Tab, Lactos
FF and EFK). Powders with poor flowing proper
ties exhibit a decrease in curvature of the slop
after this first step. At this pressure level, particle
are confined and internal friction becomes impor
tant as the number of interparticulate contact
increases.
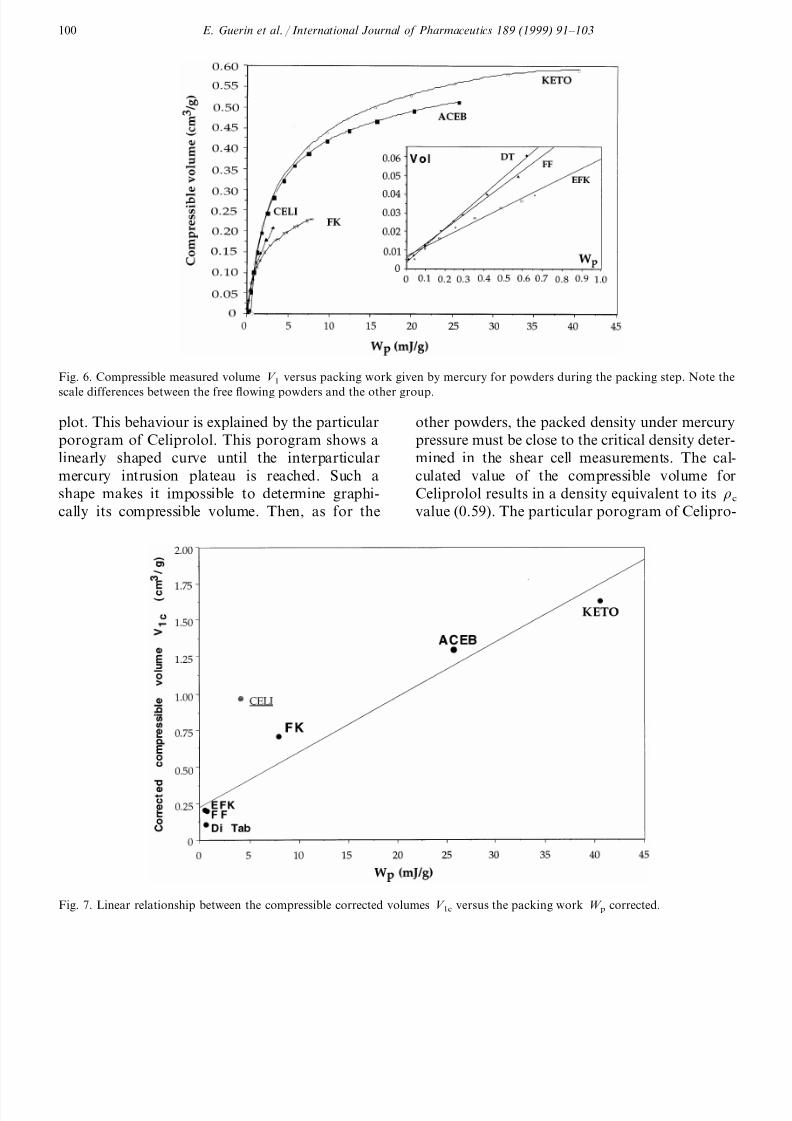
To achieve these results, we can also plot th
compressible corrected volumes V 1c versus tota
work transmitted to the powder at the end of th
packing phase. This plot (Fig. 7) shows a linea
relationship between V 1c and W p.
A particular case is Celiprolol that must b
considered separately. This material differs greatl
from others in its compressible volume to packin
work relation. The calculated work for this pow
der is less than expected from the V 1c versus W
8/12/2019 Caracterização reológica de pós farmacêuticos
http://slidepdf.com/reader/full/caracterizacao-reologica-de-pos-farmaceuticos 10/13
E . Guerin et al . / International Journal of Pharmaceutics 189 (1999) 91–103 100
Fig. 6. Compressible measured volume V 1 versus packing work given by mercury for powders during the packing step. Note th
scale differences between the free flowing powders and the other group.
plot. This behaviour is explained by the particular
porogram of Celiprolol. This porogram shows a
linearly shaped curve until the interparticular
mercury intrusion plateau is reached. Such a
shape makes it impossible to determine graphi-
cally its compressible volume. Then, as for the
other powders, the packed density under mercur
pressure must be close to the critical density deter
mined in the shear cell measurements. The ca
culated value of the compressible volume fo
Celiprolol results in a density equivalent to its
value (0.59). The particular porogram of Celipro
Fig. 7. Linear relationship between the compressible corrected volumes V 1c versus the packing work W p corrected.
8/12/2019 Caracterização reológica de pós farmacêuticos
http://slidepdf.com/reader/full/caracterizacao-reologica-de-pos-farmaceuticos 11/13
E . Guerin et al . / International Journal of Pharmaceutics 189 (1999) 91–103 10
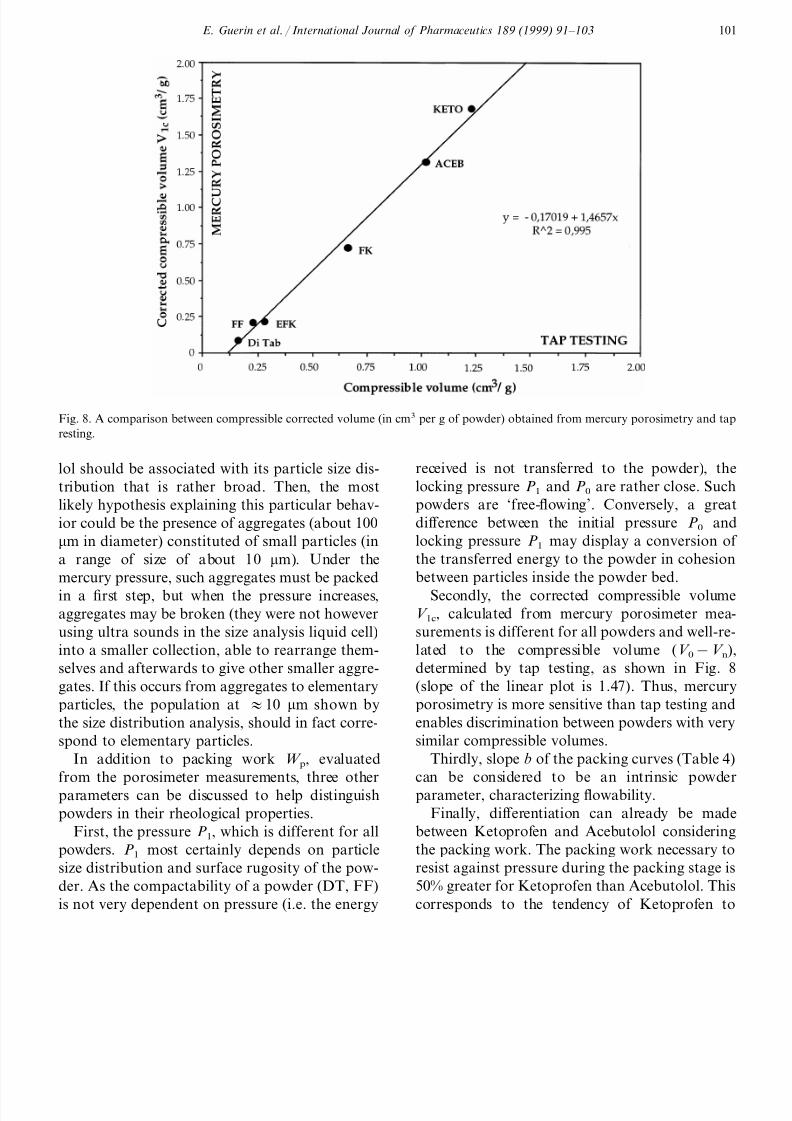
Fig. 8. A comparison between compressible corrected volume (in cm3 per g of powder) obtained from mercury porosimetry and ta
resting.
lol should be associated with its particle size dis-
tribution that is rather broad. Then, the most
likely hypothesis explaining this particular behav-
ior could be the presence of aggregates (about 100
m in diameter) constituted of small particles (in
a range of size of about 10 m). Under the
mercury pressure, such aggregates must be packed
in a first step, but when the pressure increases,
aggregates may be broken (they were not however
using ultra sounds in the size analysis liquid cell)
into a smaller collection, able to rearrange them-
selves and afterwards to give other smaller aggre-
gates. If this occurs from aggregates to elementary
particles, the population at 10 m shown by
the size distribution analysis, should in fact corre-
spond to elementary particles.
In addition to packing work W p, evaluated
from the porosimeter measurements, three other
parameters can be discussed to help distinguish
powders in their rheological properties.
First, the pressure P1, which is different for all
powders. P1 most certainly depends on particle
size distribution and surface rugosity of the pow-
der. As the compactability of a powder (DT, FF)
is not very dependent on pressure (i.e. the energy
received is not transferred to the powder), th
locking pressure P1 and P0 are rather close. Suc
powders are ‘free-flowing’. Conversely, a grea
difference between the initial pressure P0 an
locking pressure P1 may display a conversion o
the transferred energy to the powder in cohesio
between particles inside the powder bed.
Secondly, the corrected compressible volum
V 1c, calculated from mercury porosimeter mea
surements is different for all powders and well-re
lated to the compressible volume (V 0−V ndetermined by tap testing, as shown in Fig.
(slope of the linear plot is 1.47). Thus, mercur
porosimetry is more sensitive than tap testing an
enables discrimination between powders with ver
similar compressible volumes.
Thirdly, slope b of the packing curves (Table 4
can be considered to be an intrinsic powde
parameter, characterizing flowability.
Finally, differentiation can already be mad
between Ketoprofen and Acebutolol considerin
the packing work. The packing work necessary t
resist against pressure during the packing stage i
50% greater for Ketoprofen than Acebutolol. Thi
corresponds to the tendency of Ketoprofen t
8/12/2019 Caracterização reológica de pós farmacêuticos
http://slidepdf.com/reader/full/caracterizacao-reologica-de-pos-farmaceuticos 12/13
E . Guerin et al . / International Journal of Pharmaceutics 189 (1999) 91–103 102
achieve a more cohesive state than acebutolol, in
agreement with shear cell results.
In the same way, Lactose FK is characterized
by higher flowability than Ketoprofen and Acebu-
tolol. Lower locking pressure and compressible
volume for Lactose FK result in smaller packing
work than for Acebutolol and Ketoprofen. We
can then classify Lactose FK in an intermediateposition between free flowing powders and poor
flowing powders. It should be kept in mind that
neither Carr nor Jenike indices account for this
intermediate classification of Lactose FK.
Likewise, classification of free flowing powders
could be corrected depending on the methodology
used. With porosimetry, compressible volume V 1cis very small with regard to V 2. (i.e. no powder
strengthening occurs under mercury pressure). In
the same manner, impulses in tap testing have
poor effects on particle confinement. The lockingpressure, as well as the packing work, registrated
values are higher for Lactose EFK than for Di
Tab and Lactose FF. This is confirmed by Carr
indices but rejected by Jenike indices that set
Lactose EFK in a better flowability zone.
4. Conclusion
In this work, we have tried to perform an
evaluation of flowability parameters by studying anumber of powdered materials with various flow
behaviour by three different methods: tap testing,
shear cell measurement and porosimetry measure-
ments. Major differences can be pointed out be-
tween those three methods.
(a) In porosimetry measurements, the pressure
applied on the powder bed during the packing
step is exerted through mercury in an isotropic
manner. This is a major difference with the other
two methodologies, where stresses are applied
only in one (tap testing) or two (shear cell)directions.
(b) Tap testing is a quick way to evaluate the
flow properties of powders by measuring particle
behaviour under gravitational packing. Results
are only indicative for densified powders even if a
relationship, strictly empirical, exists between the
degree of compaction and flow properties.
(c) Jenike approach gives access to powde
intrinsic parameters. Flowability index, interna
cohesion, friction angle, effective and kinemati
yield locii can be obtained. This should have
great relevance to real process but requires the us
of considerable quantities of bulk powder an
very delicate experiments. These two condition
are very restrictive, particularly in first steps odevelopments programs where only small quant
ties of material are available and often highl
toxicity properties exist for pharmaceutical drugs
Since the porosimetry measurements were no
used in flow analysis, this work has clearly show
that the first part of porograms can be interprete
in term of compressibility and flowability. Th
can be appreciated by compressible volume, lock
ing pressure and slope (dV /d(log P )) during th
packing step. Correlations obtained betwee
porosimetry measurements, tap testing, and particularly shear cell measurements must be confi
rmed on a larger number of powders, but it seem
realistic that mercury porosimetry could possibl
provide quantitative and complete informatio
such as flow properties data, size distribution o
particles and microporosity, in a single step
Moreover, it should be noted that all data ar
obtained with 250 mg of bulk powder and tha
powder sample is confined in a dilatometer
shielding operators from the toxicity drugs. Con
versely however, very small quantities of powdemay induce some problems of sampling.
References
Butters, G., Leng, S., Thomas, A., 1991. A shear cell t
characterise internal friction in high-pressure compacte
powder beds. Powder Technol. 65, 75–79.
Carr, R.L., 1965a. Evaluating flow properties of solids. Chem
Eng. 72, 163–167.
Carr, R.L., 1965b. Classifying flow properties of solids. Chem
Eng. 72, 69–72.
Carstensen, J., 1973. Theory of pharmaceutical systems. InHeterogeneous Systems, vol. 2. Academic Press, New Yor
and London, pp. 163–217 (Chapter 3).
Chulia, D., 1984. Methodes d’evaluation de la rheologie de
poudres. In: Galenica 6, Tec. Doc. Lavoisier, p. 204 (Chap
ter 2).
Cohard, C., Chulia, D., Gonthier, Y., Verain, A., 1985.
correlation between flowability and tapping variation rate
of powders. Int. J. Pharm. Tech. Prod. Mfr. 6, 10–16.
8/12/2019 Caracterização reológica de pós farmacêuticos
http://slidepdf.com/reader/full/caracterizacao-reologica-de-pos-farmaceuticos 13/13
E . Guerin et al . / International Journal of Pharmaceutics 189 (1999) 91–103 10
Deleuil, M., Chulia, D., Pourcelot, Y., 1994. Particle and
powder dynamics. In: Deleuil, M., Chulia, D., Pourcelot,
Y (Eds.), Handbook of Powder Technology and Pharma-
ceutical Processes, vol. 9. Elsevier Science B.V, pp. 115–
163 (Chapter 5).
Devise, B., Delacourte-Thibaut, A., Guyot, J.C., Traisnel, M.,
1975. Mise au point d’une technique d’etude simplifiee de
l’ecoulement des poudres destinees a la compression.
Pharm. Act. Helv. 50, 432–446.
European Pharmacopeia, 1997, 3rd Edition. Methodes depharmacotechnie, volume apparent, pp. 141–142.
Haaker, G., 1987. The influence of consolidation on shear test
results. Powder Technol. 51, 231–236.
Hausner, H.H., 1967. Friction conditions in a mass of metal
powder. Int. J. Powder Metallurgy 3, 7–13.
Jenike, A.W., 1964. Storage and flow of solids. Utah. Eng.
Exp. Stn. Bull. 123, 1–194.
Jenike, A.W., Carson, J., 1985. Measurement principles of the
flowability of powders. Adv. Ceram. 21, 759–766.
Kamath, S., Puri, V., Manbeck, H., Hogg, R., 1993. Flow
properties of powders using four testers- measurement,
comparison and assessement. Powder Technol. 76, 277 –
289.Kloubek, J., 1994. Investigation of porous structures using
mercury reintrusion and retention. J. Cell Interface Sci.
163, 10–18.
Lewis, A., Simpkin, G., 1994. Tabletting — an industri
viewpoint (part 2). In: Deleuil, M., Chulia, D., Pourcelo
Y (Eds.), Handbook of Powder Technology and Pharma
ceutical Processes, vol. 9. Elsevier Science B.V, pp. 473
492 (Chapter 13).
Lloyd, P.J., Webb, P.J., 1987. The flooding of powder — th
importance of particle size distribution. Powder Techno
51, 125–133.
Maijling, J., Znasik, P., Khandl, V., 1994. Porosimeter as
mean to measure the compatibility of powders. J. Am
Ceram. Soc. 77 (5), 1369–1371.
Molerus, O., Nywlt, M., 1984. The influence of the fin
particle content on the flow behavior of bulk material
Powder Technol. 37, 145–154.
Podczeck, F., Miah, Y., 1996. The influence of particle siz
and shape on the angle of internal friction and the flo
factor of unlubricated and lubricated powders. Int.
Pharm. 144, 187–194.
Schwedes, J., Schulze, D., 1990. Measurement of flow proper
ties of bulk solids. Powder Technol. 61, 59–68.
Tan, S.B., Newton, J.M., 1990. Powder flowability as a
indication of capsule filling performance. Int. J. Pharm. 6145–155.
Train, D., 1958. Some aspects of the property of angle o
repose of powders. J. Pharm. Pharmacol. 10, 127–135.
.