Embed Size (px)
Citation preview

Martha Raquel Pereira Santos
Universidade de Aveiro Departamento de Biologia
2017
Comunidade Bacteriana como Ferramenta Complementar à
Diretiva Quadro da Água na Avaliação da Qualidade
Ecológica do Rio Caima
Bacterial Community as a Complementary Tool to the Water
Directive Framework in Ecological Quality Assessment of
Caima River

Declaração
Declaro que este relatório é integralmente da minha autoria, estando devidamente
referenciadas as fontes e obras consultadas, bem como identificadas de modo claro as
citações dessas obras. Não contém, por isso, qualquer tipo de plágio quer de textos
publicados, qualquer que seja o meio dessa publicação, incluindo meios eletrónicos, quer
de trabalhos académicos.
Martha Raquel Pereira Santos
Dissertação apresentada à Universidade de Aveiro para cumprimento dos requisitos necessários à obtenção do grau de Mestre em Microbiologia, realizada sob a orientação científica da Doutora Tânia Silva Vidal e co-orientação da Doutora Helena Correia de Oliveira, Investigadoras em Pós-Doutoramento do Departamento de Biologia e CESAM, e co-orientação científica do Professor Doutor Mário Verde Pereira, Professor Auxiliar do Departamento de Biologia da Universidade de Aveiro.
Universidade de Aveiro Departamento de Biologia
2017
Comunidade Bacteriana como Ferramenta Complementar à
Diretiva Quadro da Água na Avaliação da Qualidade
Ecológica do Rio Caima
Bacterial Community as a Complementary Tool to the Water
Directive Framework in Ecological Quality Assessment of
Caima River

Aos meus pais e irmão

Júri
Presidente Doutora Isabel da Silva Henriques Investigadora auxiliar do CESAM e Depto. de Biologia da Universidade de Aveiro
Tânia Daniela da Silva Vidal (orientadora) Bolseira de Pós-Doutoramento do CESAM e Depto. de Biologia da Universidade de Aveiro
Doutora Ana Teresa Lopes Ferreira Luís Bolseira de Pós-Doutoramento do CESAM e GeoBioTec da Universidade de Aveiro

Quero agradecer a todos os que de alguma forma me ajudaram e incentivaram neste meu percurso académico e na realização deste trabalho.
Ao Professor Doutor Fernando Gonçalves, por me ter acolhido no seu grupo de investigação, pela sua preocupação em integrar-me no grupo e por facultar as condições necessárias à realização do meu trabalho.
À minha orientadora, Doutora Tânia Vidal, por me ter acompanhado sempre desde o inicio, pela disponibilidade e dedicação, pela constante preocupação ao longo do trabalho, para que nada ficasse por esclarecer, pela confiança e pela amizade.
À minha co-orientadora, Doutora Helena Oliveira, pela sua disponibilidade e preciosa ajuda na execução e análise dos resultados de citometria.
Ao meu co-orientador, Prof. Doutor Mário Verde, por me ter possibilitado a entrada neste grupo e pela sua contribuição na análise das diatomáceas.
Aos colegas do grupo LEADER, pelo bom ambiente e pela disponibilidade em esclarecer e solucionar os contratempos que fossem surgindo. À Joana por me ter ensinado e auxiliado na triagem e identificação dos macroinvertebrados e à Inês, por me ter ensinado e acompanhado nas várias metodologias de biologia molecular.
Aos meus amigos, pelo apoio, pelos desabafos, pelos momentos de descontração e principalmente pela vossa amizade.
Por fim, um especial obrigado aos meus pais e família, por todo o amor, pelo apoio incondicional, por acreditarem nas minhas capacidades e por me terem ajudado a alcançar todos os meus objetivos.
Agradecimentos

Palavras-chave Diretiva Quadro da Água, estado ecológico de ecossistemas de água doce, parâmetros físico-químicos, metais, macroinvertebrados, perifiton, comunidade bacteriana, citometria de fluxo

Resumo Os sistemas aquáticos de água doce têm vindo a sofrer uma severa degradação e perda de biodiversidade, derivado de atividades humanas como a agricultura, indústria, atividades mineiras desenvolvimento urbano e alterações climáticas. Assim, a União Europeia implementou a Diretiva Quadro da Água (DQA), com o principal objetivo de atingir o bom estado ecológico em todas as massas de água. No entanto, a DQA revelou ser bastante complexa, com metodologias muito morosas e dispendiosas. Com este estudo, pretende-se desenvolver uma metodologia rápida e económica, estudando a composição da comunidade bacteriana por citometria de fluxo, como ferramenta complementar à DQA. Para a concretização deste trabalho, foram estudados 3 locais do rio Caima com diferentes tipos de impactos: a nascente – local de referência; Bustelo - a jusante de uma estação de tratamento de águas residuais e o Palhal - com escorrências provenientes de uma mina desativada, no inverno, primavera e verão aplicando a metodologia estabelecidas pela DQA usando os macroinvertebrados e perifiton como comunidades biológicas estudadas. Adicionalmente foi aplicada a análise multivariada aos dados recolhidos por citometria de fluxo à comunidade de bactérias da coluna de água e dos elutriados dos sedimentos e aos resultados das comunidades de macroinvertebrados e perifiton obtidos da DQA. No geral, os parâmetros físico-químicos, e as quantificações de metais mostraram valores mais elevados nos elutriados dos sedimentos do rio, do que na coluna de água mostrando a importância da análise desta matriz que não está contemplada na DQA. Resultados sensu DQA mostraram que nem sempre as comunidades de macroinvertebrados e perifiton foram concordantes na resposta aos diferentes tipos de impactos e que a qualidade ecológica dos locais avaliados foi melhor do que era expectável. Por outro lado, a análise multivariada das comunidades de macroinvertebrados e perifiton foi bastante discriminatória, associando elevados níveis de nutrientes e metais com organismos mais tolerantes, que se encontram em locais mais impactados, e organismos sensíveis com altos níveis de oxigénio dissolvido em locais mais pristinos. A análise da comunidade bacteriana revelou uma distinta separação entre bactérias LNA e HNA nos sedimentos, de acordo com os diferentes stresses ambientais, sendo HNA, nos sedimentos, um ótimo indicador de contaminação. Estes resultados revelam que a comunidade bacteriana oferece uma boa resolução de locais contaminados usando a citometria de fluxo como metodologia rápida de avaliação complementar à avaliação do estado ecológico sensu DQA sendo, no entanto, necessárias mais estudos aplicados a outras tipologias de rios e outros tipos de impactos para confirmar a validade desta nova metodologia.

Keywords
Abstract
Water Framework Directive, ecological status of freshwater ecosystems, physicochemical parameters, metals, macroinvertebrates, periphyton, bacterial community, flow cytometry
Freshwater ecosystems have been suffering severe degradation and loss of biodiversity, caused by human disturbances such as agriculture, industry, mining, urban development and climate changes. Therefore, the European Union reached an agreement and implemented the Water Framework Directive (WFD), with the main goal of reach a good ecological status in all water bodies. However, WFD is very complex, methodologies are time-consuming and costly. Thus, the main objective of this study is to develop a rapid and cost-effective approach, by studying the bacterial community composition by flow cytometry, as a complementary methodology to WFD. To achieve this, we study 3 sampling sites at Caima River along the seasons (winter, spring and summer), with different levels of environmental impacts (Nascente- river source- with little impact, Bustelo- downstream
WWTP and Palhal- exposed to mine drainage), applying first the WFD criteria and then multivariate analysis for macroinvertebrate, periphyton and bacteria communities. Physico-chemical, metals and bacteria samples were collected from the water column and sediment river bottom, showing that in all the parameters (with some exceptions) and metals the concentrations were higher in sediments. Results showed that not always the macroinvertebrate and periphyton communities were sensitive to an increased nutrient input, resulting in an ecological status higher than expected. On the other hand, community structure analysis for macroinvertebrates and periphyton was very discriminatory, associating high levels of nutrients and metals with more tolerant organisms in impacted sites, and sensitive organisms with high levels of dissolved oxygen corresponding to pristine environments. Bacteria community analysis revealed a clear separation of LNA and HNA bacteria in sediment according to the different environmental stress, being possible to dissociate the majority of the impacted sites from the clean sites, being HNA a good indicator of contamination. These results revealed that bacteria community in sediments has more reliable data about the impacts that a freshwater ecosystem can suffer. The discriminating power of bacteria community analyzed by FCM provided good responses, although, further investigations are needed to confirm the feasibility of this new method, as a complementary tool in the water quality assessment.

1
INDEX
Chapter 1 - General introduction and objectives ............................................................................. 3
1.1.Hydric resources: importance and monitoring ...................................................................... 3
1.2.Water Framework Directive .................................................................................................... 4
1.2.1.Assessment of water quality in rivers ............................................................................. 4
1.2.2.Criticism to the WFD methodology ................................................................................. 8
1.3.Bacterial communities in freshwater ecosystems as potential bioindicator? .................... 10
1.4.Study of bacterial communities by Flow Cytometry ............................................................ 12
1.5.Study of bacterial communities by Denaturing Gradient Gel Electrophoresis (DGGE) of 16S
rRNA gene .................................................................................................................................... 15
1.6.Objectives and structure of the dissertation ........................................................................ 17
1.7.References ............................................................................................................................. 19
Chapter 2 – Spatio-temporal variation of bacteria content using flow cytometry as a comple-
mentary tool to Water Framework Directive assessment of Caima River .................................... 29
2.1.Introduction ........................................................................................................................... 29
2.2.Material and methods ........................................................................................................... 31
2.2.1.Study area and collection of samples ............................................................................ 31
2.2.2.Laboratory analysis ........................................................................................................ 34
2.2.2.1.Sediment analysis and elutriate production .............................................................. 34
2.2.2.2.Quantifications in water column and elutriate samples ........................................... 34
2.2.2.3.Biological communities sensu WFD approach ........................................................... 35
2.2.2.4.Bacteria community analysis by FCM and DNA extraction for DGGE analysis as rapid
bioassessment tool to complement the WFD methodology ................................................. 37
2.2.2.4.1.DNA extraction and PCR amplification of bacterial 16S rRNA fragments .............. 38
2.2.2.4.2.Denaturing gradient gel electrophoresis (DGGE) .................................................... 39
2.2.2.5.Data analysis: multivariate approach ......................................................................... 40
2.3.Results .................................................................................................................................... 41
2.3.1.Sampling sites water and sediment elutriate quantifications performed – abiotic fra-
mework……………………………………………………………………………………………………………………………….41
2.3.2.Biological communities sensu WFD approach .............................................................. 42
2.3.3.Bacteria community analysis by FCM ............................................................................ 53
2.3.4.Data analysis – multivariate approach .......................................................................... 59
2.4.Discussion .............................................................................................................................. 68
2.5.References ............................................................................................................................. 75
Chapter 3 - Final remarks ................................................................................................................ 87

2

3
Chapter 1 - General introduction and objectives
1.1. Hydric resources: importance and monitoring
Water is acknowledged as the basis for all existing life on the planet, acting as the
cornerstone of human society’s existence and development. Although 2/3 of our planet is
composed of water, its major part is found in oceans, and only 1% is found in rivers and
lakes. Curiously, rivers and lakes are more diversified and contain 12% of animal species
while oceans contain only 7%. Many freshwater habitats and their biota are being rapidly
destroyed without the possibility of being studied and protected (Gleick, 1993).
The global population growth and the increasing of the industrialization level have
been creating an enormous pressure on the aquatic resources, since these are increasingly
used by humans, for both industrial, agricultural and energy purposes and navigation
(Maksimovic et al., 1996). These practices require an overexploitation of this resource,
resulting in long-term consequences, such as freshwater systems degradation and
contamination, affecting both its quantity and quality (WHO, 1992). The runoff of
agricultural fertilizers and industrial waste that result in nitrates and toxic chemicals
contamination, mine drainage that generate contamination by metal and discharges of
urban effluents that originate contamination by organic matter are the main factors for the
insufficient quality and quantity of freshwater (Maksimovic et al., 1996; Gleick, 1993;
Biswas & Tortajada, 2016). Nowadays, the climate changes are an alarming issue, since they
have a negative impact in the ecosystems and biodiversity, affecting them directly by
temperature and flow patterns variations, and indirectly in many aspects of the lotic
systems functioning (Allan & Castillo, 2007). Thus, is essential to plan and to manage the
water resources in order to ensure a good ecological quality, as well as the habitats
conservation as defended by the implementation of Water Framework Directive (WFD
Directive 2000/60/CE) in 2000 in Europe (Altenburger et al., 2015). Until the early 1990s,
the freshwater monitoring was based mostly on physical and chemical parameters and
classified accordingly as fit or not for human consumption. WFD requires both chemical
and biological analysis for an improved assessment and holistic integration on the

4
ecological status of freshwater ecosystems (Chaves et al., 2006; Hering et al., 2003).
Therefore, the monitoring of bioindicator freshwater communities is a sensitive tool to
detect stress and contamination that may occur during a period of time and to detect
differences from one place to another in rivers and small catchments (Li et al., 2010).
1.2. Water Framework Directive
1.2.1. Assessment of water quality in rivers
The Water Framework Directive (WFD) is the main legislation regarding the protection
and sustainable utilization of European hydric resources, and it established that Member-
States must protect, improve and recover all the water bodies, in order to reach good water
quality by 2027 (Arle et al., 2016; Poikane et al., 2014). The criteria for their classification
plays a key role in the WFD implementation process, defining the ecological state of a water
body from the following elements of water quality that presents worse classification:
Biological quality elements (macroinvertebrates and periphyton);
Bioindicators are organisms, chemical markers or biological processes that when
altered, indicate environmental changes. These changes allow us to evaluate the influence
of environmental stress on the composition and functioning of ecosystems and to study
trends, by monitoring them with repeated measurements over time (Markert et al., 2003).
Macroinvertebrates are used since the creation of the Saprobiensystem in 1908 (for
organic pollution detection) as a bioindicator community. This methodology created for
water quality evaluation developed the first biotic indices, specially designed for organic
contamination, making use of indicator organism concept, in which an organism can
indicate clean or polluted conditions. Macroinvertebrates have been used worldwide by
environmental agencies in bioassessment and were modified and improved especially
within the AQUEM and STAR project developing alternative approaches to assess different
types of stressors by defining type-specific multimetric indices. The advantages of
macroinvertebrates use are the sensitivity to pollution and rapid response to external
disturbances, relatively long lifes, having the capacity to integrate the effects of the

5
environmental variations in the short-term, providing information to understand the
cumulative effects (Cummings, 1996; Sharma & Rawat, 2009). Another community widely
used for freshwater environments monitoring is periphyton, and especially diatoms, which
are considered the best bioindicators for having a fast response to environmental changes
and for integrating environmental conditions better than any other organism. Because they
have short life cycles and high reproduction rates, they reflect short-term impacts and
sudden variations in the environment. As organisms that usually cling to the substrate, their
growth and development can directly respond to physical, chemical and biological
variations (INAG, 2009; Giorgio et al., 2016; Li et al., 2010). In spite of not being present in
the Portuguese WFD, other types of bioindicator communities like fishes and macrophytes
were proposed for water quality assessment in the European WFD. But unfortunately,
European states members did not reach a consensus yet about their use and the major
obstacles like fish mobile behavior towards contamination scenarios and species-poor
plant standards, besides the high number of metrics (Birk et al., 2012).
Chemical and physico-chemical elements supporting the biological elements in-
cluding general physico-chemical quality elements, and specific pollutants;
According to the WFD, these parameters are essential for the ecosystem balance and
water quality maintenance. These parameters ensure the water quality for human
consumption, industrial and irrigation, but also represent an important role in life support,
creating an integral part of the metabolic processes involved in the development of
biological activities. Abiotic chemical and physico-chemical elements are used to define the
stream types which were an essential basis for the development of assessing systems.
Stream types might serve as units which shows a certain biotic and abiotic discontinuity in
comparison to neighboring entities. The most important abiotic factors are stream
morphology, geochemistry, altitude, stream size and hydrology that are used to define
stream typology which in turn are used to define more than 100 stream types across
Europe. Regarding the values of specific pollutants and priority substances (metals,
pesticides), they are published in European Commission chemical status documents. In the
case of priority substances whenever the values quantified were above threshold

6
recommended it was immediately considered as bad quality (European Commission, 2000;
Patil et al., 2012).
Hydromorphological elements supporting the biological elements;
This criteria is evaluated by the hydrological regime, which is defined by variation of the
seasonal distributions of the watercourses and reflect the regional climatic patterns, river
continuity and morphological conditions, which are related to the variation of river depth
and width, riverbed structure and substrate as well as the composition and structure of the
riparian zone.
All these parameters are important to assure an abiotic support essential for the
establishment of numerous species. Dramatic changes of these features can cause
significant losses in stability and diversity of biological communities, as well as the
depletion of the structure and functionality of these ecosystems (INAG, 2009; Quercus,
2016). The River Habitat Survey was the method chosen for Europe-wide application and
support the collection of a large amount of qualitative and quantitative geomorphological
data on 500 meters alongside the river sample unit surveyed. Summarizing complex
information, the Habitat Quality Assessment (HQA) and Habitat Modification Scores (HQS)
indices quantify physical habitat quality and richness and the degree of morphological
degradation (Szoszkiewicz et al., 2006).

7
After the evaluation of the biological, chemical and hydromorphological, the lowest
classed elements overlap higher class maximizing the protection of the most sensitive
community of freshwater environment (one out all out) (Fig 1). Generally, the site being
evaluated is compared against the reference status (for the same water mass typology)
based on the Ecological Quality Ratio, which is a ratio between reference conditions and
the measured status of the biological quality elements and are given in five classes: high
status (no difference to reference conditions), good status (slight differences), moderate
status (moderate differences); poor and bad status (major differences from reference
conditions). Good ecological status are the target value that all surface water bodies have
to achieve in the near future. The establishment of the reference conditions for each
typology is essential for the ecological status evaluation. Reference conditions must reflect
totally or nearly undisturbed conditions for hydromorphological elements, general physical
Figure 1-Scheme of the classification system under Water Framework Directive/Water law
(Devlin et al., 2013).

8
and chemical elements and biological quality elements; concentrations of specific synthetic
pollutants should be close to zero or below the detection limit of most advanced analytical
techniques in general use and concentration of specific non-pollutants, should remain
within the range normally associated with background levels. In many rivers and streams,
a true reference condition cannot be found. It was suggested modeling, find historical data
on old archives, near sites with the same typology to complete the information about the
sampling sites (Nijboer et al., 2004).
Finally, the WFD is mandatory for all water bodies, rivers, lakes, transitional waters
and coastal waters. WFD and the ecological status evaluation are, nowadays, challenged to
deal with new sources of pollution that becomes more widespread and complex due to the
effects of combined climate change and stressors (Lücke & Johnson, 2009).
1.2.2. Criticism to the WFD methodology
The WFD has been a huge change in the paradigm in the biomonitoring of European
aquatic ecosystems. It has changed the management objectives from merely pollution
control to ensure a more holistic perspective of protection of ecosystem integrity.
Deterioration and improvement of ecological status are defined by the response of the
biota, rather than by changes in environmental parameters. However, the methods has
been more complex, Member States have spent resources and considerable time to
develop tools to prepare river basin management plans (Hering et al., 2010). As an
obligatory measure to WFD, biological communities has been widely studied, being its
identification/classification both difficult and time consuming, while requires also very
specialized work to sample (macroinvertebrates and diatoms communities) (Bertrand et
al., 2006).
In Europe, bioassessment methods differ geographically, from region to region,
different species may occur; relevant stressors may differ and applicable taxonomic
resolution also may vary according to the knowledge of the regional fauna and flora.
Additionally, each EU-member preferred developing country-specific methods, either to
continue using existing times series by adapting their national methods to the WFD or to

9
regard for specific ecoregional and biogeographic situation; therefore a multitude of
methods result instead of a handful of methods applicable Europe-wide (Birk et al., 2012).
Moreover, not all assessment methods have been harmonized yet, since the information
gathered could be done in countless ways: sampling can be performed with different
equipment, data can be collected with different methods, identification of organisms can
be to different taxonomic levels and based on different keys and comparison of methods
hampered by completely different metrics and/or assessment concepts, making difficult
the procedures for class boundary setting. In Europe, the bioassessment methods also
differ geographically, as organism response to stress may vary by region and ecosystem
type, different species may occur, relevant stressors may differ and applicable taxonomic
resolution may vary (Poikane et al., 2014). The free access to chemicals products and
licensing of new chemical products with multiple usages and little knowledge of impacts in
terms of chemicals mixtures to the biological communities, was another important criticism
to WFD (Altenburger et al., 2015). The current regulation of environmental quality is mostly
based on a limited number of single chemicals leaving unprotected the ecosystems of
interactions among chemicals lowering significantly the safety threshold values known and
threatening water systems and the biological communities. As an example, more than
100 000 chemicals are registered in EU, where 30 000 to 70 000 are in daily use (Loos et al.,
2008) not to mention the transformation products and the products that will enlarge the
number chemicals products. It’s expected that a fraction of those will be found in the
environment and water systems. Therefore, to safeguard the environment protection and
biodiversity the exposure to chemicals and chemicals mixtures must be minimized and
efforts must be engaged in assessment and management of risky mixtures. Risk assessment
approaches based on bioassays, biomarkers are integrative techniques for response
assessment that allow diagnosis of the degree of impact of toxic chemicals. The bioassay
integration in regulatory water quality monitoring is recommended and supported by the
fact that many of these methods were published as harmonized standard protocols as
OECD guidelines and ISO standards. In vitro and in vivo bioassays and biomarkers have been
successfully used in monitoring programs by OSPAR (Oslo-Paris Commission) for marine
and estuarine environments (Brack et al., 2017). The use of ecotoxicological tools in toxicity

10
profiling is a first tier approach for screening the hazards of complex environmental
mixtures knowing or without knowing the active constituents. The toxicity profiles can be
used for prioritization of sampling locations and for establishing cause-effect relationships
by identifying the pollutants responsible for the observed toxicity closing the gap between
ecology and chemistry (Brack et al., 2017; Martinez-Haro et al., 2015). This was the major
criticism towards the WFD, not knowing exactly what caused the changes translated into
the biological communities response. Several authors in literature, already suggest other
types of bioassays to evaluate: the function of ecosystems (leaf litter bioassays e.g. Pascoal
et al., 2003; Young & Collier, 2009); daphnia in situ bioassays and biomarkers (Damasio et
al., 2008); biomarkers with macroinvertebrates caddisfly Hydropsyche exocellata (Prat et
al., 2013).
In Portugal, the main difficulties are caused by the absence of simultaneous
monitoring for biological elements and physicochemical parameters, the lack of long-term
monitoring data that allow distinguishing natural changes from anthropogenic changes, the
scarcity of standardized and systematized data for biological elements and the
nonexistence of qualitative and quantitative monitoring networks with adequate spatial
representativeness (Mendes & Ribeiro, 2014).
1.3. Bacterial communities in freshwater ecosystems as potential bioindi-
cator?
The biogeochemical importance of bacteria in freshwater ecosystems was first
recognized in the 1940s by Lindeman (1942). Since this early acknowledgment of the critical
role of bacteria in regenerating and mobilizing nutrients in freshwater food webs, it has
become clear that aquatic bacteria drive transformations and the cycling of most
biologically active elements in these ecosystems (Newton et al., 2011). Furthermore,
bacterial communities play an important role as principal degraders and remineralizers of
organic compounds to their inorganic constituents; they contribute to the
breakdown/transformation of organic material, the recycling of several key elements as
nitrogen, phosphorous, and sulphur and they are also responsible for breakdown and
detoxification of a variety of pollutants (Sigee, 2004; Allan & Castillo, 2007). These

11
transformations form a crucial relation within ecosystems as they serve as an important
food source for higher trophic level organisms (e.g. aquatic invertebrates) (Pernthaler &
Amann, 2005; Findlay, 2010).
In pursuit for an alternative biological community for WFD ecological quality
assessment and rapid methodology to analyze its results, this Thesis is devoted in trying to
use bacterioplankton and bacteria biofilm, in sediment of river bottom, as bioindicator of
changes in water quality using a rapid screening methodology. As already mentioned
bioindicators used to assess the biodiversity of freshwater ecosystems have been mostly
confined to macro-organisms such as benthic macroinvertebrates (Klemm et al., 2002),
algae (Omar, 2010), fishes, amphibians and periphyton (Li et al., 2010). The majority of
microbial studies in aquatic ecosystems have focused on indicator bacteria related to fecal
and organic pollution but is essential a profound understanding of microbial community
composition, seasonal dynamics and the influence of environmental factors to support the
restoration and conservation of water quality and ecosystem health (Wang et al., 2016;
Zhang et al., 2012).
Bacteria have short life cycles and are very sensitive to changes in the environment
and so they have the potential to offer an early indication of shifts in the ecosystem before
macro-organisms respond (Peter et al., 2011; Pernthaler, 2013). Factors such as
temperature (Adamczuk et al., 2015), nutrient concentrations (Wakelin et al., 2008),
salinity (Dai et al., 2013) and heavy metals (Yang et al., 2013) have been found to modify
bacterial communities in river water.
Recent advances in molecular biology and the development of new tools and
techniques allowed the improvement of new insights through the application of
fingerprinting methods as DNA based methods, using molecular 16S rRNA-based
cultivation-independent approaches e.g. denaturing gradient gel electrophoresis (DGGE)
(De Figueiredo et al., 2012a), sequencing (Xie et al., 2016), pyrosequencing (Kaevska et al.,
2016) and other techniques such as fluorescent in situ hybridization (FISH) (Lupini et al.,
2011) and flow cytometry (FCM) (Elhadidy et al., 2016), that today are crucial to study
bacterial communities composition in riverine water.

12
Despite the recent efforts to study these communities, the specific factors that drive
temporal and spatial variations in bacterial community structure are poorly understood
because different influencing factors are observed in different studies.
In Europe, most of the published work focuses on identifying the bacterial
community composition (BCC) and its relationship to physico-chemical and spatial
variables. For example, (Boi et al., 2016) studied the BCC along a river impacted by different
sources of pollutants concluding that although bacterioplankton abundance varies among
the seasons, the differences along the flow path have shown to be more effective to explain
the abiotic and biotic variability of the riverine water quality. Another study conducted by
Read et al., (2015) aimed to understand how BCC responds to anthropogenic pressures
across a major river basin. Their results revealed that BCC was more related to spatial
parameters than physical and chemical variables since they were unable to identify a
physico-chemical parameter that suggests that the most polluted rivers shared relatively
similar communities. Other studies address the question of how wastewater treatment
plants (WWTP) affects the bacterial communities, suggesting that microbial diversity may
be affected by nutrients, ammonium and phosphorus concentrations, organic matter
content and by the degree of pollution (Haller et al., 2011; Perujo et al., 2016; García-
Armisen et al., 2014).
In Portugal, to the best of our knowledge, only two published works report the study
of bacterial community composition relative to water quality. According to de Figueiredo
et al., (2012a), the spatial variation of BCC along the Cértima River (a small Portuguese river
markedly impacted by agriculture) depends mostly on parameters such as total suspended
solids (TSS), total organic carbon, organic matter, electrical conductivity and HCO3¯.
Another work aimed to discover if there was a biogeographical pattern for BCC of 20
Portuguese water bodies under a severe summer drought. They found bacterial phylotypes
common to several water bodies, suggesting a transversal persistence over the country,
under severe drought conditions (De Figueiredo et al., 2012).
Since there is very little knowledge about the bacterial communities composition in
Portuguese rivers, we decided to make a generalist approach to study the composition and
distribution of bacterial communities in river bottom sediment biofilms and water column

13
by FCM and DGGE. These techniques were chosen for being relatively inexpensive, sensitive
and simple to study bacterial communities in the water column and sediment biofilm. Both
water and sediments microorganisms perform key ecological functions, however,
microorganisms suspended in currents are only an instantaneous indicator of water quality
whereas biofilm communities are relatively sessile and therefore are more likely to be an
efficient indicative of local conditions (Ibekwe et al., 2016; Beier et al., 2008).
1.4. Study of bacterial communities by Flow Cytometry
Flow Cytometry (FCM) was developed in the 1960s and was first applied to mammalian
cell counting and analysis. It was only in the late 1970s that this technique began to be used
by microbiologists (Bailey et al., 1977), being limited due to the non-specific binding of
fluorescent dyes and low instrumental sensitivity. The development of molecular
techniques such as PCR and DNA sequencing has led to the use of independent culture
methods for the evaluation of microbial communities as well as the FCM which provides
detection and analysis of uncultured cells with high precision (Wang et al., 2010; Hammes
& Egli, 2010).
FCM is a technique that allows counting, examining and classifying microscopic
particles suspended in a liquid medium, which aligned will intersect a light beam, usually a
laser, that will allow the particles (cells) to be analyzed according to the light scattering in
different angles (Figure 2) (Paul, 2001).

14
When the cell suspension is injected, it crosses the flow sheath, cell by cell through the
beam that is perpendicular to the flow. The single passage of the cells is obtained by
hydrodynamic focusing of the sample stream and is injected into a buffer solution which,
by encountering different pressure and velocity of the sample allows the flow to proceed
under a laminar regime. When intercepting the cell, the light beam can undergo forward
scattering (FSC), side scattering (SSC) and excitation of the fluorochromes. The FSC
corresponds to the particle size and is detected by a set of photomultiplier tubes or
photodiodes when the light is deviated up to 20˚ from the laser axis. Typically, the larger
the cell, more light will be forward scattered. The side dispersion of light is obtained when
the radiation is diverted to 90˚ by lenses, dichroic mirrors and optical filters and sent to
photomultipliers. The SSC provides information on complexity, such as granularity and
internal structures of cells. The photon flux from the photomultipliers is converted into an
electrical signal and then analyzed with appropriate software (Paul, 2001; Hammes & Egli,
2010; Koch et al., 2014).
Figure 2- The basic components of a flow cytometer. Retrieved from https://www.sem-
rock.com/flow-cytometry.aspx

15
When the objective is the detection of specific target cells it is necessary to use
fluorescent dyes that are excited by the light beam emitting fluorescent light (Givan, 2001;
Wang et al., 2010). FCM is able to measure thousands of particles per second, while
producing multi-parametric data related to light dispersion properties and fluorescence.
Some fluorescent stains such as SYBR® Green I and SYTO 9, 13 binds preferentially to
nucleic acids (Vives-Rego, 2000; Zipper et al., 2004; Falcioni et al., 2006), making it possible
for FCM to measure bacterial concentrations. Moreover, the fluorescence intensity of such
stain is directly related to the amount of nucleic acids present in the treated sample, i.e,
fluorescence intensity recorded for one labeled bacterial cell should be directly related to
its nucleic acid content, which is dependent on both the type of bacteria as well as its
physiological state (Günther et al., 2008; Prest et al., 2013; Liu et al., 2016). Based on the
clearly different fluorescence intensity and SSC signals detected by FCM in combination
with nucleic acid stains, bacteria have been broadly classified into two groups: low nucleic
acid content (LNA) bacteria and high nucleic acid content (HNA) bacteria, thus creating a
bacterial community “fingerprint” (Liu et al., 2013; De Roy et al., 2012; Liu et al., 2016;
Romdhane et al., 2014). Thereby, FCM fingerprints provide information on the bacterial
community characteristics and are a sensitive method for detecting small changes and
shifts within the bacterial community, that are not reflected in cell concentration measures
(Van Nevel et al., 2017; Prest et al., 2014).
FCM has been shown to be a potential tool for monitoring and rapid assessment of
water quality due to their numerous advantages and applications. The main advantages of
FCM are fast analysis (50000 cell/s), high accuracy (<5% instrumentation error), no DNA
extraction needed, sensitivity (detection as low as 100 cells per milliliter), multi-parameter
analysis and compatibility with a diversity of staining and labelling methods providing broad
information at the single-cell level (Wang et al., 2010; Chantzoura & Kaji, 2017; Hammes &
Egli, 2010; Prest et al., 2013). However, FCM also has limitations such as being restricted to
liquid sample analysis, while soil and sediment samples require special pretreatment (e.g.
suspension in the liquid phase, sonication and permeabilization), sophisticated data
analysis and relatively high detection limit for certain bacteria (Wang et al., 2010; Hammes
& Egli, 2010).

16
In this work, we used a Bacterial Counting Kit (Molecular ProbesTM, Invitrogen) which
includes an SYTO® BC dye, a high-affinity nucleic acid stain that easily penetrates both gram-
positive and gram-negative bacteria as well as a calibrated suspension of polystyrene
microspheres that serve as a reference standard to indicate sample volume. The collected
samples were then subjected to a bacterial DNA extraction procedure analyzed by
denaturing gradient gel electrophoresis (DGGE).
1.5. Study of bacterial communities by Denaturing Gradient Gel Electro-
phoresis (DGGE) of 16S rRNA gene
DGGE tool was used to compare and complement the bacterial community analysis
obtained by flow cytometry. Denaturing gel electrophoresis applied to Microbiology is
studied since the publications of the pioneering works of (Muyzer et al., 1993).
The development and application of molecular techniques based on PCR, such as the
establishment of clone libraries and DGGE of 16S rRNA gene sequences, revealed that the
bacterioplankton community is constituted of many bacteria that had not been detected
by culture-based techniques (Muyzer et al., 1993; Muyzer, 2000). This fingerprinting
method has been applied to environmental samples over the last decades, (Araya et al.,
2003; Selje et al., 2005; de Figueiredo et al., 2012; Ke et al., 2015) being now widely
adopted in the field of bacterial ecology, enabling the simultaneous analysis of numerous
samples and to compare temporal and spatial patterns (Wang et al., 2016; de Figueiredo
et al., 2012).
DGGE allows the separation of small polymerase chain reaction products, up to 400-
500 bp. This technique is based on the extraction of total genomic DNA directly from the
sample and amplification by PCR of a variable zone of the gene encoding the RNA of the
subunit bacterial ribosome (16S rRNA), using universal primers for conserved areas of this
gene (Muyzer, 1999; Fromin et al., 2002). Because these products all have the same size,
they are separated according to their melting temperatures that can be achieved in
polyacrylamide gels containing a gradient of DNA denaturants, typically a mixture of urea
and formamide. PCR products enter the gel as a double-stranded molecule, as they proceed
through the gel, the denaturing conditions progressively become stronger. PCR products

17
with different sequences, therefore, start melting at different positions in the gel due to
their G + C content and distribution in the DNA sequences (e.g. GC-rich domains melt at
higher temperatures). Melting proceeds in so-called melting domains. Once a domain with
the lowest melting temperature reaches its melting temperature at a particular position, a
transition from a double-stranded to a partially melted/dissociated molecule occurs and
migration of the molecule will practically halt. However, the presence of a high melting
domain (a GC clamp added to one primer) prevents the complete strand separation (Top,
1992). The final result is a gel with a pattern of bands which is a visual profile of the most
abundant species in the studied microbial community. These communities profiles can be
further analyzed with statistical methods. This approach permits the monitoring of changes
in microbial communities over time and/or in response to changes in environmental
conditions and it can be used also as a semi-quantitative method to estimate species
abundance and richness (Paul, 2001; Fromin et al., 2002; Marzorati et al., 2008).
The major advantages of DGGE over other profiling techniques is that it is possible to
excise band from gel for amplification and sequencing and also analyze a large number of
samples simultaneously. On the other hand, it is difficult to compare between gels, it is
time-consuming, does not allow direct taxonomic identification and different DNA
sequences of different bacteria can display the same separation as a result of the same GC
contents (El Sheikha et al., 2012; Douterelo et al., 2014; Tabit, 2016).
1.6. Objectives and structure of the dissertation
The present work intends to test if the bacterioplankton and the river bottom sediment
bacteria of lotic freshwater environments could be used in bioassessment of ecological
status within the WFD using flow cytometry and DDGE analysis. In order to achieve that
several other goals, more specific, related with the work were developed:
i. To search for 3 sampling sites that combine the conditions requested to perform
the study.
ii. To sample and analyze the macroinvertebrate and periphyton communities on 3
sampling sites selected from Caima River during winter, spring and summer follow-
ing WFD analysis.

18
iii. To compare the results obtained from the river water and bottom river sediment
bacteria community by flow cytometry and DDGE analysis, on 3 sampling sites of
Caima River.
iv. To compare all information from macroinvertebrate, periphyton and bacterial in-
formation to infer the suitability of the last as bioindicator of ecological status.
The first mentioned objective was related to the careful search of the sampling site in
order to full address the purpose of the study. Some literature and field work were
requested to search for the ideal combination of sampling sites that provide the gradient
of increase of bacteria community that will allow validating our theory. After the choice of
the 3 sampling sites, sampling started (ii) at winter season following the Portuguese WFD
methodology and the macroinvertebrates and periphyton communities were sampled. The
same procedure was repeated in spring and summer (autumn was collected but there was
no time to process all the samples and having the data available on time to compare with
the other seasons). The WFD analysis allowed the classification of the ecological status of
sampling sites chosen. The objective iii) was related with the novelty of this work by
applying flow cytometry to study of bacterial community present in the river water column
(bacterioplankton) and also bacteria in the river sediments. Furthermore, the results were
compared with the DGGE analysis of the same communities from the 3 sampling site during
the 3 seasons. This study will enable to understand if the bacterial community will be
influenced by seasonality and exactly how it affected the bacterial communities. Regarding
the last objective iv) all the information gathered will be analyzed by multivariate analysis
(CANOCO 4.5 software – Scientia Software) in order to extract relationship among the
environmental variables and the biological communities (macroinvertebrates, periphyton
and bacterioplankton) along the sampling sites.
In order to address the objectives described, the dissertation was divided into three
chapters:
The present chapter (chapter 1) is essentially a literature review covering all the requested
information to understand the purpose of the work developed. It started with the
presentation of the importance of the WFD, in Europe, and the need in protect and

19
maintain the good ecological status of all lotic, lenthic and transitional environments. It
explains generally how the evaluation was done and the biotic communities employed and
some criticism pointed as all the detailed information on the two techniques used to study
the bacterial community as a bioindicator of ecological status. Chapter 2 present the
integrated results of the WFD and bacteria community analysis by multivariate analysis of
the data obtained. This chapter was built following the specific layout usually used in
journal articles, with the purpose of submitting this work to a specialized international
journal. At last, chapter 3 consists of the final remarks and integrative discussion of all the
results.

20
1.7. References
Adamczuk, M., Mieczan, T., Nawrot, D., & Rechulicz, J. (2015). Indirect effect of environmental factors on interactions between microbial and classical food webs in freshwater ecosystems. Annales de Limnologie - International Journal of Limnology, 51, 49–58. http://doi.org/10.1051/limn/2014032
Allan, J. D., Castillo, M. M. (2007). Stream Ecology - Structure and function of running waters (2nd ed.). Springer Netherlands. http://doi.org/10.1007/978-1-4020-5583-6
Altenburger, R., Ait-Aissa, S., Antczak, P., Backhaus, T., Barceló, D., Seiler, T. B., … Brack, W. (2015). Future water quality monitoring - Adapting tools to deal with mixtures of pollutants in water resource management. Science of the Total Environment, 512–513, 540–551. http://doi.org/10.1016/j.scitotenv.2014.12.057
Araya, R., Tani, K., Takagi, T., Yamaguchi, N., & Nasu, M. (2003). Bacterial activity and community composition in stream water and biofilm from an urban river determined by fluorescent in situ hybridization and DGGE analysis. FEMS Microbiology Ecology, 43(1), 111–119. http://doi.org/10.1111/j.1574-6941.2003.tb01050.x
Arle, J., Mohaupt, V., & Kirst, I. (2016). Monitoring of Surface Waters in Germany under the Water Framework Directive—A Review of Approaches, Methods and Results. Water, 8(6), 217k. http://doi.org/10.3390/w8060217
Bailey, J. E., Fazel-Makjlessi, J., McQuitty, D. N., Lee, Y. N., Allred, J. C., & Oro, J. A. (1977). Characterization of bacterial growth by means of flow microfluorometry. Science, 198(4322), 1175 LP-1176. http://doi.org/10.1126/science.412254
Beier, S., Witzel, K.-P., & Marxsen, J. (2008). Bacterial community composition in Central European running waters examined by temperature gradient gel electrophoresis and sequence analysis of 16S rRNA genes. Applied and Environmental Microbiology, 74(1), 188–199. http://doi.org/10.1128/AEM.00327-07
Birk, S., Bonne, W., Borja, A., Brucet, S., Courrat, A., Poikane, S., … Hering, D. (2012). Three hundred ways to assess Europe’s surface waters: An almost complete overview of biological methods to implement the Water Framework Directive. Ecological Indicators, 18, 31–41. http://doi.org/10.1016/j.ecolind.2011.10.009
Biswas, A. K., Tortajada, C. (2016). Water security, climate change and sustainable development. Singapore: Springer. http://doi.org/https://doi.org/10.1007/978-981-287-976-9_1
Boi, P., Amalfitano, S., Manti, A., Semprucci, F., Sisti, D., Rocchi, M. B., … Papa, S. (2016). Strategies for Water Quality Assessment: A Multiparametric Analysis of Microbiological Changes in River Waters. River Research and Applications, 32(3), 490–500. http://doi.org/10.1002/rra.2872
Brack, W., Dulio, V., Ågerstrand, M., Allan, I., Altenburger, R., Brinkmann, M., … Vrana, B.

21
(2017). Towards the review of the European Union Water Framework Directive: Recommendations for more efficient assessment and management of chemical contamination in European surface water resources. Science of The Total Environment, 576, 720–737. http://doi.org/10.1016/j.scitotenv.2016.10.104
Chantzoura, E., & Kaji, K. (2017). Chapter 10 – Flow Cytometry. In A. Press (Ed.), Basic Science Methods for Clinical Researchers (pp. 173–189). http://doi.org/10.1016/B978-0-12-803077-6.00010-2
Chaves, M. L., Costa, J. L., Chainho, P., Costa, M. J., & Prat, N. (2006). Selection and validation of reference sites in small river basins. Hydrobiologia, 573(1), 133–154. http://doi.org/10.1007/s10750-006-0270-5
Commission, E. (2000). Directive 2000/60/EC, Establishing a framework for community action in the field of water policy. Official Journal of the European Communities, 327, 1–72.
Cummings, K. (1996). Invertebrates. In CalowP, Petts GE (eds.): The rivers handbook - Volume 1. Blackwell Science. Oxford Pp.
Dahl Lücke, J., & Johnson, R. (2009). Detection of ecological change in stream macroinvertebrate assemblages using single metric, multimetric or multivariate approaches. Ecological Indicators, 9, 659–669. http://doi.org/10.1016/j.ecolind.2008.08.005
Dai, J., Tang, X., Gao, G., Chen, D., Shao, K., Cai, X., & Zhang, L. (2013). Effects of salinity and nutrients on sedimentary bacterial communities in oligosaline Lake Bosten, northwestern China. Aquatic Microbial Ecology, 69, 123–134. http://doi.org/10.3354/ame01627
Damasio, J., Tauler, R., Teixido, E., Rieradevall, M., Prat, N., Riva, M. C., … Barata, C. (2008). Combined use of Daphnia magna in situ bioassays, biomarkers and biological indices to diagnose and identify environmental pressures on invertebrate communities in two Mediterranean urbanized and industrialized rivers (NE Spain). Aquatic Toxicology (Amsterdam, Netherlands), 87(4), 310–320. http://doi.org/10.1016/j.aquatox.2008.02.016
De Figueiredo, D., B.B, C., M.J, P., & Correia, A. (2012). Bacterioplankton community composition in Portuguese water bodies under a severe summer drought. Community Ecology, 13(2), 185–193. http://doi.org/10.1556/ComEc.13.2012.2.8
de Figueiredo, D. R., Ferreira, R. V, Cerqueira, M., de Melo, T. C., Pereira, M. J., Castro, B. B., & Correia, A. (2012). Impact of water quality on bacterioplankton assemblage along Certima River Basin (central western Portugal) assessed by PCR-DGGE and multivariate analysis. Environmental Monitoring and Assessment, 184(1), 471–485. http://doi.org/10.1007/s10661-011-1981-2
De Roy, K., Clement, L., Thas, O., Wang, Y., & Boon, N. (2012). Flow cytometry for fast microbial community fingerprinting. Water Research, 46(3), 907–919. http://doi.org/10.1016/j.watres.2011.11.076
22
Devlin, M., Best, M., Bresnan, E., Scnalan, C., Baptie, M. (2013). Water Framework Directive: The development and status of phytoplankton tools for ecological assessment of coastal and transitional waters. United Kingdom. Update Report to UK Technical Advisory Group for the Environment Agency.
Douterelo, I., Boxall, J. B., Deines, P., Sekar, R., Fish, K. E., & Biggs, C. A. (2014). Methodological approaches for studying the microbial ecology of drinking water distribution systems. Water Research, 65, 134–156. http://doi.org/10.1016/j.watres.2014.07.008
Drury, B., Rosi-Marshall, E., & Kelly, J. J. (2013). Wastewater treatment effluent reduces the abundance and diversity of benthic bacterial communities in urban and suburban rivers. Applied and Environmental Microbiology, 79(6), 1897–1905. http://doi.org/10.1128/AEM.03527-12
El Sheikha, A. F., Durand, N., Sarter, S., Okullo, J. B. L., & Montet, D. (2012). Study of the microbial discrimination of fruits by PCR-DGGE: Application to the determination of the geographical origin of Physalis fruits from Colombia, Egypt, Uganda and Madagascar. Food Control, 24(1–2), 57–63. http://doi.org/10.1016/j.foodcont.2011.09.003
Elhadidy, A. M., Van Dyke, M. I., Peldszus, S., & Huck, P. M. (2016). Application of flow cytometry to monitor assimilable organic carbon (AOC) and microbial community changes in water. Journal of Microbiological Methods, 130, 154–163. http://doi.org/10.1016/j.mimet.2016.09.009
Falcioni, T., Manti, A., Boi, P., Canonico, B., Balsamo, M., & Papa, S. (2006). Comparison of disruption procedures for enumeration of activated sludge floc bacteria by flow cytometry. Cytometry. Part B, Clinical Cytometry, 70(3), 149–153. http://doi.org/10.1002/cyto.b.20097
Findlay, S. (2010). Stream microbial ecology. Journal of the North American Benthological Society, 29(1), 170–181. http://doi.org/10.1899/09-023.1
Fromin, N., Hamelin, J., Tarnawski, S., Roesti, D., Jourdain-Miserez, K., Forestier, N., … Rossi, P. (2002). Statistical analysis of denaturing gel electrophoresis (DGE) fingerprinting patterns. Environmental Microbiology, 4(11), 634–643.
García-Armisen, T., Inceoǧlu, Ö., Ouattara, N. K., Anzil, A., Verbanck, M. A., Brion, N., & Servais, P. (2014). Seasonal variations and resilience of bacterial communities in a sewage polluted urban river. PLoS ONE, 9(3). http://doi.org/10.1371/journal.pone.0092579
Giorgio, A., De Bonis, S., & Guida, M. (2016). Macroinvertebrate and diatom communities as indicators for the biological assessment of river Picentino (Campania, Italy). Ecological Indicators, 64, 85–91. http://doi.org/10.1016/j.ecolind.2015.12.001
Givan, A. L. (2001). Flow Cytometry: First Principles (2nd ed.). Wiley-Liss, Inc. http://doi.org/10.1002/0471223948

23
Gleick, P. H. (1993). Water in crisis - A guide to the world’s fresh water resources. New York, Oxford: Oxford University Press.
Günther, S., Hübschmann, T., Rudolf, M., Eschenhagen, M., Röske, I., Harms, H., & Müller, S. (2008). Fixation procedures for flow cytometric analysis of environmental bacteria. Journal of Microbiological Methods, 75(1), 127–134. http://doi.org/10.1016/j.mimet.2008.05.017
Haller, L., Tonolla, M., Zopfi, J., Peduzzi, R., Wildi, W., & Poté, J. (2011). Composition of bacterial and archaeal communities in freshwater sediments with different contamination levels (Lake Geneva, Switzerland). Water Research, 45(3), 1213–1228. http://doi.org/10.1016/j.watres.2010.11.018
Hammes, F., Egli, T. (2010). Cytometric methods for measuring bacteria in water: advantages, pitfalls and applications. Analytical and Bioanalytical Chemistry, 397(3), 1083–1095. http://doi.org/10.1007/s00216-010-3646-3
Hering, D., Buffagni, A., Moog, O., Sandin, L., Sommerhäuser, M., Stubauer, I., … Zahrádková, S. (2003). The Development of a System to Assess the Ecological Quality of Streams Based on Macroinvertebrates – Design of the Sampling Programme within the AQEM Project. International Review of Hydrobiology, 88(34), 345–361. http://doi.org/10.1002/iroh.200390030
Ibekwe, A. M., Ma, J., & Murinda, S. E. (2016). Bacterial community composition and structure in an Urban River impacted by different pollutant sources. Science of the Total Environment, 566–567, 1176–1185. http://doi.org/10.1016/j.scitotenv.2016.05.168
INAG. (2009). Critérios para a classificação do estado das massas de água superficiais - rios e albufeiras. Ministério do Ambiente, do Ordenamento do Território e do Desenvolvimento Regional. Instituto da água I.Pl.
Kaevska, M., Videnska, P., Sedlar, K., & Slana, I. (2016). Seasonal changes in microbial community composition in river water studied using 454-pyrosequencing. SpringerPlus, 5, 409. http://doi.org/10.1186/s40064-016-2043-6
Ke, X., Wang, C., Jing, D., Zhang, Y., & Zhang, H. (2015). Assessing water quality by ratio of the number of dominant bacterium species between surface/subsurface sediments in Haihe River Basin. Marine Pollution Bulletin, 98(1–2), 267–273. http://doi.org/10.1016/j.marpolbul.2015.06.003
Klemm, D. J., Blocksom, K. A., Thoeny, W. T., Fulk, F. A., Herlihy, A. T., Kaufmann, P. R., & Cormier, S. M. (2002). Methods Development and use of Macroinvertebrates as Indicators of Ecological Conditions for Streams in the Mid-Atlantic Highlands Region. Environmental Monitoring and Assessment, 78(2), 169–212. http://doi.org/10.1023/A:1016363718037
Koch, C., Harnisch, F., Schroder, U., & Muller, S. (2014). Cytometric fingerprints: evaluation of new tools for analyzing microbial community dynamics. Frontiers in Microbiology, 5(273). http://doi.org/10.3389/fmicb.2014.00273

24
Li, L., Zheng, B., & Liu, L. (2010). Biomonitoring and bioindicators used for river ecosystems: Definitions, approaches and trends. Procedia Environmental Sciences, 2, 1510–1524. http://doi.org/10.1016/j.proenv.2010.10.164
Lindeman, R. L. (2010). The Trophic-Dynamic Aspect of Ecology Author ( s ): Raymond L . Lindeman Published by : Ecological Society of America Stable URL : http://www.jstor.org/stable/1930126. America, 23(4), 399–417. http://doi.org/10.2307/1930126
Liu, G., Van der Mark, E. J., Verberk, J. Q. J. C., & Van Dijk, J. C. (2013). Flow cytometry total cell counts: a field study assessing microbiological water quality and growth in unchlorinated drinking water distribution systems. BioMed Research International, 2013, 595872. http://doi.org/10.1155/2013/595872
Liu, T., Kong, W., Chen, N., Zhu, J., Wang, J., He, X., & Jin, Y. (2016). Bacterial characterization of Beijing drinking water by flow cytometry and MiSeq sequencing of the 16S rRNA gene. Ecology and Evolution, 6(4), 923–934. http://doi.org/10.1002/ece3.1955
Loos, R., Gawlik, B., Locoro, G., Rimaviciute, E., Contini, S., & Bidoglio, G. (2008). EU-Wide Survey of Polar Organic Persistent Pollutants in European River Waters. Environmental Pollution (Barking, Essex : 1987), 157, 561–568. http://doi.org/10.1016/j.envpol.2008.09.020
Lupini, G., Proia, L., Di Maio, M., Amalfitano, S., & Fazi, S. (2011). CARD-FISH and confocal laser scanner microscopy to assess successional changes of the bacterial community in freshwater biofilms. Journal of Microbiological Methods, 86(2), 248–251. http://doi.org/10.1016/j.mimet.2011.05.011
Maksimovic, C., Calomino, F., Snoxell, J. (1996). Water supply systems: New Technologies. Berlin, Germany: Springer-Verlag.
Markert, B. A., Breure, A. M., & Zechmeister, H. G. (2003). Bioindicators & Biomonitors: Principles and concepts. Trace Metals and other Contaminants in the Environment. Oxford, UK: Gulf Professional Publishing.
Martinez-Haro, M., Beiras, R., Bellas, J., Capela, R., Coelho, J., Lopes, I., … Marques, J. (2015). A review on the ecological quality status assessment in aquatic systems using community based indicators and ecotoxicological tools: What might be the added value of their combination? Ecological Indicators, 48, 8–16. http://doi.org/10.1016/j.ecolind.2014.07.024
Marzorati, M., Wittebolle, L., Boon, N., Daffonchio, D., & Verstraete, W. (2008). How to get more out of molecular fingerprints: Practical tools for microbial ecology. Environmental Microbiology, 10(6), 1571–1581. http://doi.org/10.1111/j.1462-2920.2008.01572.x
Mendes, M. P., & Ribeiro, L. (2014). The importance of groundwater for the delimitation of Portuguese National Ecological Reserve. Environmental Earth Sciences, 72(4), 1201–1211. http://doi.org/10.1007/s12665-013-3039-y

25
Muyzer, G. (1999). DGGE/TGGE a method for identifying genes from natural ecosystems. Current Opinion in Microbiology, 2(3), 317–322. http://doi.org/10.1016/S1369-5274(99)80055-1
Muyzer, G. (2000). Genetic fingerprinting of microbial communities- present status and future perspectives. In Microbial Biosystems: New Frontiers. Proceedings of the 8th International Sympasium on Microbial Ecology (C.R. Bell, M. Brylinski and P. Johnson-Green, Eds) (pp. 503–572). Atlantic Canada Society for Microbial Ecology, Halifax, in press.
Muyzer, G., de Waal, E. C., & Uitterlinden, A. G. (1993). Profiling of complex microbial populations by denaturing gradient gel electrophoresis analysis of polymerase chain reaction-amplified genes coding for 16S rRNA. Applied and Environmental Microbiology, 59(3), 695–700. Retrieved from http://www.ncbi.nlm.nih.gov/pmc/articles/PMC202176/
Newton, R. J., Jones, S. E., Eiler, A., McMahon, K. D., & Bertilsson, S. (2011). A guide to the natural history of freshwater lake bacteria. Microbiology and Molecular Biology Reviews : MMBR, 75(1), 14–49. http://doi.org/10.1128/MMBR.00028-10
Nijboer, R. C., Verdonschot, P. F. M., Johnson, R. K., Sommerhäuser, M., & Buffagni, A. (2004). Establishing Reference Conditions for European Streams. Integrated Assessment of Running Waters in Europe, 91–105. http://doi.org/10.1007/978-94-007-0993-5_6
Nunes, M. L., Ferreira Da Silva, E., & De Almeida, S. F. P. (2003). Assessment of Water Quality in the Caima and Mau River Basins (Portugal) using Geochemical and Biological Indices. Water, Air, and Soil Pollution, 149(1), 227–250. http://doi.org/10.1023/A:1025636106890
Omar, W. M. W. (2010). Perspectives on the Use of Algae as Biological Indicators for Monitoring and Protecting Aquatic Environments, with Special Reference to Malaysian Freshwater Ecosystems. Tropical Life Sciences Research, 21(2), 51–67. Retrieved from http://www.ncbi.nlm.nih.gov/pmc/articles/PMC3819078/
Pascoal, C., Pinho, M., Cássio, F., & Gomes, P. (2003). Assessing structural and functional ecosystem condition using leaf breakdown: studies on a polluted river. Freshwater Biology, 48(11), 2033–2044. http://doi.org/10.1046/j.1365-2427.2003.01130.x
Patil, P. N., Sawant, D. V, & Deshmukh, R. N. (2012). Physico-chemical parameters for testing of water - a review. International Journal of Environmental Sciences, 3(3), 1194–1207. http://doi.org/10.6088/ijes.2012030133028
Paul, J. H. (2001). Methods in Microbiology: Marine Microbiology (1st ed.). USA: Academic Press.
Pernthaler, J. (2013). Freshwater Microbial Communities. In E. Rosenberg, E. F. DeLong, S. Lory, E. Stackebrandt, & F. Thompson (Eds.), The Prokaryotes: Prokaryotic Communities and Ecophysiology (pp. 97–112). Berlin, Heidelberg: Springer Berlin Heidelberg. http://doi.org/10.1007/978-3-642-30123-0_40
26
Pernthaler, J., & Amann, R. (2005). Fate of Heterotrophic Microbes in Pelagic Habitats: Focus on Populations. Microbiology and Molecular Biology Reviews, 69(3), 440–461. http://doi.org/10.1128/MMBR.69.3.440-461.2005
Perujo, N., Freixa, A., Vivas, Z., Gallegos, A. M., Butturini, A., & Romaní, A. M. (2016). Fluvial biofilms from upper and lower river reaches respond differently to wastewater treatment plant inputs. Hydrobiologia, 765(1), 169–183. http://doi.org/10.1007/s10750-015-2411-1
Peter, H., Beier, S., Bertilsson, S., Lindström, E. S., Langenheder, S., & Tranvik, L. J. (2011). Function-specific response to depletion of microbial diversity. The ISME Journal, 5(2), 351–361. http://doi.org/10.1038/ismej.2010.119
Poikane, S., Zampoukas, N., Borja, A., Davies, S. P., van de Bund, W., & Birk, S. (2014). Intercalibration of aquatic ecological assessment methods in the European Union: Lessons learned and way forward. Environmental Science and Policy, 44, 237–246. http://doi.org/10.1016/j.envsci.2014.08.006
Prat, N., Rieradevall, M., Barata, C., & Munné, A. (2013). The combined use of metrics of biological quality and biomarkers to detect the effects of reclaimed water on macroinvertebrate assemblages in the lower part of a polluted Mediterranean river (Llobregat River, NE Spain). Ecological Indicators, 24, 167–176. http://doi.org/10.1016/j.ecolind.2012.06.010
Prest, E. I., El-Chakhtoura, J., Hammes, F., Saikaly, P. E., van Loosdrecht, M. C. M., & Vrouwenvelder, J. S. (2014). Combining flow cytometry and 16S rRNA gene pyrosequencing: A promising approach for drinking water monitoring and characterization. Water Research, 63, 179–189. http://doi.org/10.1016/j.watres.2014.06.020
Prest, E. I., Hammes, F., Kötzsch, S., van Loosdrecht, M. C. M., & Vrouwenvelder, J. S. (2013). Monitoring microbiological changes in drinking water systems using a fast and reproducible flow cytometric method. Water Research, 47(19), 7131–7142. http://doi.org/10.1016/j.watres.2013.07.051
Quercus - Associação nacional de conservação da natureza. (2016). Monitorização e avaliação da qualidade das águas superficiais.
Read, D. S., Gweon, H. S., Bowes, M. J., Newbold, L. K., Field, D., Bailey, M. J., & Griffiths, R. I. (2015). Catchment-scale biogeography of riverine bacterioplankton. ISME J, 9(2), 516–526. Retrieved from http://dx.doi.org/10.1038/ismej.2014.166
Romdhane, S. Ben, Bour, M. El, Hamza, A., Akrout, F., Kraiem, M. M., & Jacquet, S. (2014). Seasonal patterns of viral, microbial and planktonic communities in Sidi Salem: a freshwater reservoir (North of Tunisia). Ann. Limnol. - Int. J. Lim., 50(4), 299–314. Retrieved from https://doi.org/10.1051/limn/2014023
Selje, N., & Brinkhoff, T. (2005). Detection of abundant bacteria in the Weser estuary using culture-dependent and culture-independent approaches . Aquatic Microbial Ecology, 39(1), 17–34. Retrieved from http://www.int-res.com/abstracts/ame/v39/n1/p17-

27
34/
Sharma, R. C., & Rawat, J. S. (2009). Monitoring of aquatic macroinvertebrates as bioindicator for assessing the health of wetlands: A case study in the Central Himalayas, India. Ecological Indicators, 9(1), 118–128. http://doi.org/10.1016/j.ecolind.2008.02.004
Sigee, D. C. (2004). Bacteria: The Main Heterotrophic Microorganisms in Freshwater Systems. In Freshwater Microbiology (pp. 287–338). John Wiley & Sons, Ltd. http://doi.org/10.1002/0470011254.ch6
Szoszkiewicz, K., Buffagni, A., Davy-Bowker, J., Lesny, J., Chojnicki, B. H., Zbierska, J., … Zgola, T. (2006). Occurrence and variability of River Habitat Survey features across Europe and the consequences for data collection and evaluation. Hydrobiologia, 566(1), 267–280. http://doi.org/10.1007/s10750-006-0090-7
Tabit, F. T. (2016). Advantages and limitations of potential methods for the analysis of bacteria in milk: a review. Journal of Food Science and Technology, 53(1), 42–49. http://doi.org/10.1007/s13197-015-1993-y
Top, B. (1992). A simple method to attach a universal 50-bp GC-clamp to PCR fragments used for mutation analysis by DGGE. PCR Methods and Applications, 2(1), 83–85.
Van Nevel, S., Koetzsch, S., Proctor, C. R., Besmer, M. D., Prest, E. I., Vrouwenvelder, J. S., … Hammes, F. (2017). Flow cytometric bacterial cell counts challenge conventional heterotrophic plate counts for routine microbiological drinking water monitoring. Water Research, 113, 191–206. http://doi.org/10.1016/j.watres.2017.01.065
Vidal, T., Pereira, J. L., Abrantes, N., Soares, A. M. V. M., & Gonçalves, F. (2012). Ecotoxicological Assessment of Contaminated River Sites as a Proxy for the Water Framework Directive: an Acid Mine Drainage Case Study. Water, Air, & Soil Pollution, 223(9), 6009–6023. http://doi.org/10.1007/s11270-012-1335-x
Vives-Rego, J., Lebaron, P., & Nebe-Von Caron, G. (2000). Current and future applications of flow cytometry in aquatic microbiology. FEMS Microbiology Reviews, 24(4), 429–448. http://doi.org/10.1016/S0168-6445(00)00033-4
Wakelin, S. A., Colloff, M. J., & Kookana, R. S. (2008). Effect of Wastewater Treatment Plant Effluent on Microbial Function and Community Structure in the Sediment of a Freshwater Stream with Variable Seasonal Flow . Applied and Environmental Microbiology, 74(9), 2659–2668. http://doi.org/10.1128/AEM.02348-07
Wang, Y., Hammes, F., De Roy, K., Verstraete, W., Boon, N. (2010). Past, present and future applications of flow cytometry in aquatic microbiology. Trends in Biotechnology, 28(8), 416–424. http://doi.org/http://dx.doi.org/10.1016/j.tibtech.2010.04.006
Wang, Z., Su, Y., Zhang, Y., Guo, H., Meng, D., & Wang, Y. (2016). Ecology-types determine physicochemical properties and microbial communities of sediments obtained along the Songhua River. Biochemical Systematics and Ecology, 66, 312–318. http://doi.org/10.1016/j.bse.2016.04.008

28
WHO. (1992). Our planet, our health - report of the WHO commission on health and environment. Geneva.
Xie, Y., Wang, J., Wu, Y., Ren, C., Song, C., Yang, J., … Zhang, X. (2016). Using in situ bacterial communities to monitor contaminants in river sediments. Environmental Pollution, 212, 348–357. http://doi.org/10.1016/j.envpol.2016.01.031
Yang, X., Huang, S., Wu, Q., Zhang, R., & Liu, G. (2013). Diversity and vertical distributions of sediment bacteria in an urban river contaminated by nutrients and heavy metals. Frontiers of Environmental Science & Engineering, 7(6), 851–859. http://doi.org/10.1007/s11783-013-0569-1
Young, R. G., & Collier, K. J. (2009). Contrasting responses to catchment modification among a range of functional and structural indicators of river ecosystem health. Freshwater Biology, 54(10), 2155–2170. http://doi.org/10.1111/j.1365-2427.2009.02239.x
Zhang, M., Yu, N., Chen, L., Jiang, C., Tao, Y., Zhang, T., … Xue, D. (2012). Structure and seasonal dynamics of bacterial communities in three urban rivers in China. Aquatic Sciences, 74(1), 113–120. http://doi.org/10.1007/s00027-011-0201-z
Zipper, H., Brunner, H., Bernhagen, J., & Vitzthum, F. (2004). Investigations on DNA intercalation and surface binding by SYBR Green I, its structure determination and methodological implications. Nucleic Acids Research, 32(12), 103–103. http://doi.org/10.1093/nar/gnh101
29
Chapter 2 – Spatio-temporal variation of bacteria content using
flow cytometry as a complementary tool to Water Framework Di-
rective assessment of Caima River
2.1. Introduction
Freshwater environments are hotspots of biodiversity, containing 6-10% of all
species and one-third of all invertebrates species worldwide. Freshwater ecosystems have
been suffering severe degradation and loss of biodiversity due to the overexploitation of
this resource, caused by human disturbances such as agriculture, industry, mining, urban
development and climate changes making them prone to degradation (Maksimovic et al.,
1996; Allan & Castillo, 2007). Freshwater resources are essential for sustaining human
existence and the alterations of river, lakes and wetlands have defined the economic
development for centuries (Pander & Geist, 2013). The European Union reacted to the
predicted loss of biodiversity and decreasing of human well-being by approving the Water
Framework Directive (WFD) in 2000. WFD was probably one of most significant and
ambitious legislative instrument in the water field on an international basis for all European
countries. Its main goal was to achieve sustainable water resources management and
development across national and regional borders and achieve the “good ecological status”
for all water bodies (watercourses, lakes, coastal waters, groundwater) (Albrecht, 2013) by
integrating both chemical, biological and hydromorphological quality elements. A key
component of WFD legislation was the definition of “good ecological status” that has to be
reached by 2015 by all water bodies, except “heavily modified” (Erba et al., 2009). However
by the end of 2015 47% of EU surface waters did not reach “good ecological status” (Birk
et al., 2012) and Member states availed themselves to extend beyond 2015 to achieve all
WFD environmental objectives by the end of 2027 (Voulvoukis et al., 2017). This has led to
the WFD effectiveness questioning as a policy tool with many reviews highlighting
drawback and weaknesses (Birk et al., 2012; Altenburger et al., 2015; Brack et al., 2017).
The major criticism was related to the multitude of methods used instead of a handful of
methods used Europe-wide. The lack of cause-effect relationship in ecological quality
assessment within the WFD improving the capacity of ascertaining the causes that

30
produced the unwanted changes in the biological communities closing the gap between
ecology and chemistry (Martinéz-haro et al., 2015). WFD would benefit from the
multidisciplinary approaches integrating multiple lines of evidence, as an example of
ecotoxicological line of evidence, in biological approach (Vidal et al., 2012; Birk et al., 2012;
Martinéz-Haro et al., 2015). Another criticism to the WFD was the requirement of highly
specialized technicians, elevated costs, time-consuming methodologies and historical data
of freshwater environments. In Portugal, like in many other Mediterranean countries, the
lack of historical data to describe the reference conditions which are fundamental for WFD,
in ecological status evaluation, since Ecological Quality Ratios (EQR) are used to compare
the results obtained with pristine/reference conditions for the river typology, in evaluation.
The human impacts are so intense and widespread that reference sites satisfying the
criteria for minimal disturbance do not exist (Chaves et al., 2006). In order to overcome
some difficulties of WFD concerned with time-consuming and elevated costs, we propose
a rapid evaluation of bacteriological community in the water column and river bottom
sediment, using complementary methodologies based on flow cytometry (FCM) and
denaturing gradient gel electrophoresis (DGGE) analysis. Bacterioplankton plays a critical
role in the ecological function regulating a broad array of chemical transformations (e.g.
decomposition of organic matter) which sustain the balance in aquatic ecosystems.
Bacterioplankton are highly dynamic in composition and structure and respond quickly to
different environmental gradients across ecosystems which can influence the water quality
(Sun et al., 2017). This approach used a rapid and fast response technique that will allow
starting the characterization of the bacteria communities samples from Portuguese rivers,
posteriorly complemented with DGGE analysis and its potential biological indicator value
and compare it with the commonly sampled macroinvertebrate and periphyton
communities. If this methodology were successfully validated and a correspondence
between bacterial communities present and ecological status were established, it will allow
a first general picture of the ecological status of the studied water bodies, in about one or
two days, from the sampling moment. FCM and DGGE are becoming more and more
affordable and frequent in use, for rapid characterization of water bacterial assemblages,

31
requiring equally specialized technicians to operate those equipments but require less time
and money.
Caima River was chosen as case study because it is recipient of point source and
diffuse contamination by organic compounds and metals (Nunes et al., 2003; Vidal et al.,
2012) being an important tributary of the Vouga River in Vouga River basin (central western
Portugal) which is an important source of drinking water and irrigation in the region (Nunes,
2007). Specifically, Caima River passes through urban and agricultural areas being affected
by diffuse and organic pollution in its upper section and wastewater from WWTP and
metal-rich run-off from deactivated Palhal mine in the lower section. The main metals
founded in this mine was copper and lead (Nunes et al., 2003; Vidal et al., 2012). Vidal et
al., (2012) showed that sediment elutriates obtained from the sediments river bottom of
Palhal sampling site are rich in lead, cadmium, zinc and copper and affect standard
organisms in ecotoxicological tests. The present study intends to evaluate the ecological
status of three Caima River sampling sites by using the WFD approach based on
macroinvertebrates, periphyton and additionally bacteria communities. Bacterioplankton
and bacteria from river sediments were collected simultaneously and were analyzed by
FCM and DGGE analysis to evaluate the possibility of bacteria community being a rapid
bioassessment tool to complement the WFD methodology working as a bioindicator of
ecological status and to compare the information generated. Samples were collected
seasonally (winter, spring, summer) to evaluate not only the capability to respond to
different stressors but also to evaluate how bacterial communities changes with seasons
and different physico-chemical characteristics of the sampling sites.
2.2. Material and methods
2.2.1. Study area and collection of samples
Caima River is a tributary of Vouga River with approximately 50 km long. The river
source is at Serra da Freita (Northern Portugal), located in Albergaria da Serra at 900 m of
altitude, and flows to the right riverside of Vouga River, located in Albergaria-a-Velha.
Caima River has some sections of unmodified margins in forested paths and

32
modified/heavily modified when the river crosses the villages. The riverbed at the source
was composed mainly of very large rocks and hence more different than the other two
sampling sites being mostly composed of boulders, cobble, pebble and some gravel. Site 1
was located near the river source-Albergaria da Serra (40˚52ˈ3.734ˈˈN, 8˚16ˈ22.199ˈˈW)
and has minimum human disturbance. Between the time that the sampling start to be
visited and the start of sampling, strong raining events dragged ashes from summer fires
into the river course. Site 2 was located strategically after the effluent from a WWTP – in
Bustelo do Caima where domestic and industrial waste (40˚48ˈ21.258ˈˈN, 8˚26ˈ44.581ˈˈW)
were dumped into the river. Site 3 was located bordering a deactivated mine- Mina do
Palhal (40˚44ˈ31.132ˈˈN, 8˚27ˈ16.222ˈˈW - inactive since the 1920s) that still drains-metal
rich effluent into the river in raining season. Sampling was carried out in January (winter);
April (spring); September (summer) of 2017. Their codes and location are shown in Fig 3.
General chemical and physical characterization was carried out in situ for each
sampling site: pH, temperature (˚C), conductivity (µS cm-1) and dissolved oxygen (% and mg
L-1) using multiparameter water quality probe Aquaprobe AP-2000 (Aquaread®). Six L were
collected from surface water, 3L of them were used for further characterization (see
Laboratory analysis) and the other 3L were collected in specific pre-treated water bottles
for DGGE analysis. Additionally, 3 sterilized urine containers (60ml) were used to collect the
water samples, in triplicate, for FCM analysis. Sediments were collected, from each river
site, constituting composed samples whenever as possible from sediments of the river bed.
The sediments were collected from the upper layers of river bed into plastic (about 3 kg)
airtight bag after collection and used for elutriate production (see Elutriates production)
and posterior physico-chemical characterization and metal analysis. Both water and
sediment samples were transported to the laboratory in the dark at 4˚C.
Macroinvertebrates sampling was done as recommended by Portuguese Water
Institute (INAG, 2008) according to the presence of microhabitats. Benthic
macroinvertebrates were obtained using a hand net (500 µm pore size; square frame 0,30
× 0,30 m), by kick-sampling small transect covering similar area and sampling effort across
sites the substrate so that the macroinvertebrates detached and entered the net by the

33
action of the stream water. Collected samples were placed into plastic containers and
preserved with 96% of ethanol (Hauer & Resh, 1996).
Periphyton sampling was done as recommended by INAG (2008a). Small-sized rocks
were scraped with a hard toothbrush for removal of the top diatoms biofilm. They must be
sampled at least 5 stones to represent an area of approximately 100 cm2. The samples were
preserved with Lugol solution and transported to the laboratory at 4˚C.
Complementary hydromorphological parameters (Raven et al., 1998) were
recorded: depth, channel and water width, flow velocity, presence of macrophytes and
filamentous algae, continuity of riparian vegetation on both banks, shading cover of the
channel.
N
B
P
Caima river
Figure 3- Location of sampling sites along the Caima River, Site 1- N (Nascente) river source; site 2- B (Bustelo) downstream WWTP and site 3- P (Palhal) Palhal mine.

34
2.2.2. Laboratory analysis
2.2.2.1. Sediment analysis and elutriate production
A small portion of the sediment was sorted to remove debris and oven-dried (70ºC
for 24h) before determining organic content by loss-on-ignition (450ºC for 6h; Kirstensen
& Anderson, 1987) (represented in the scheme of Fig 4).
The original sediment was readily used upon arrival to laboratory for preparation of
elutriates. Sediment was mixed 1:4 (v/v) with ultrapure water and shaken in an orbital
shaker at 200 rpm during 2 hours at 20ºC and left overnight. The overlying layer was cen-
trifuged at 2,500 x g for 15 min at 4˚C and transferred to a clean Erlenmeyer ready to use.
pH, conductivity and dissolved oxygen were recorded of the elutriates produced using the
same multiparameter water quality probe Aquaprobe AP-2000 (Aquaread®).
2.2.2.2. Quantifications in water column and elutriate samples
Both water samples collected and elutriates were used for quantifying biochemical
oxygen demand (BOD), dissolved organic carbon (DOC), turbidity, total phosphorus (TP),
total nitrogen (TN), total suspended solids (TSS), ammonia parameters according to APHA
(1995) following the scheme in Fig 4.
Both water samples and elutriates were vacuum filtered through VWR® glass
microfiber filters (1.2 µm pore and 47 mm Ø). The residue was used to quantify total
suspended solids (TSS) (APHA, 1995). The filtrate was used to quantify colored dissolved
organic carbon (CDOC). Unfiltered water and elutriates samples were used for total
phosphorus (APHA, 1989) and nitrogen content (Lind, 1979) (organic forms) after
mineralization of samples with potassium persulphate (Ebina et al., 1983). Turbidity was
indirectly measured according to the absorption coefficient at 450nm of unfiltered water
samples and elutriates as well as the Ammonia (NH4+ and NH3) and (Biological Oxygen
Demand- BOD5) following APHA (1995) procedures.

35
For metal analysis (Al, Mn, Fe, Cu, Zn, Cd, Ba, Pb, As and Cr) and total S, water and
elutriate samples were acidified to pH < 2 with nitric acid PA 65% and analyze by Atomic
Absorption Spectrometry (AAS).
2.2.2.3. Biological communities sensu WFD approach
Macroinvertebrate community
Macroinvertebrates were kept preserved in alcohol 80-90% until sorting. Preserved
samples were washed over 2mm and 0,5mm mesh-size sieves, respectively. These two
sieves allow separating the major fraction of the smallest fraction, making it easier and
more accurate the sorting process. Organisms were then counted and identified to the
lowest practicable taxonomic level, generally family and stored in plastic vials with 70%
ethanol (Edington & Hildrew, 2005; Elliott & Humpesch, 2010; Hynes, 1993; Pawley,
Dobson, & Fletcher, 2011; Sundermann et al., 2007; Tachet, 2000; Wallace et al., 2003).
The following macroinvertebrate community metrics were calculated based on family level
identification: richness (S), diversity (Shanno’s H’), and equitability (Pielou’s J’). Three biotic
indices were also calculated: EPT- the number of Ephemeroptera, Trichoptera and
Plecoptera taxa; IBMWP- the sum of pre-defined tolerance (to pollution) scores for each
taxon (Alba‐Tercedor & Sánchez‐Ortega, 1988; Jaímez‐Cuéllar et al., 2002) and IASPT- the
average score taxon, derived from IBMWP.
Caima's River Samples
Non filtered water/elutriates/sediments
Ammonia BOD5 Turbidity TP/TN FCM DGGE OM
Filtered water/elutriates
Filter (residue)
TSS
CDOC
Figure 4- Simplified scheme of quantifications carried out for water, elutriates and sediment samples.

36
The ecological quality of each sample was determined as an Ecological Quality Ratio
(EQR) according to the criteria designed to conform to the WFD. For this watershed, EQRs
were derived from the multimetric index IPtIN (North Invertebrate Portuguese Index; INAG,
2009):
IPtIN = 0,25 × S + EPT × 0,15 + Evenness × 0,1 + (IASPT – 2) × 0,3 + Log (sel. ETD + 1)
× 0,2, where S, EPT, Evenness, IASPT and Log (sel. ETD + 1), where sel. ETD is the sum of
family abundances of Heptageniidae, Ephemeridae, Brachycentridae, Goeridae,
Odontoceridae, Limnephilidae, Polycentropodidae, Athericidae, Dixidae, Dolichopodidae,
Empididae and Stratiomyidae. The IPtIN index is calculated as the weighted sum of all
metrics, each normalized as the ratio between the obtained value and the corresponding
reference value. Reference values for all metrics were obtained from official guidance
documents (INAG; 2009), for Northern rivers medium/large dimension due to the Caima
river basin has over 100km2 catchment. The IPtIN index itself was normalized for the river
typology to obtain the EQR and the ecological status are categorized by the following
intervals: High, if EQR > 0.87; Good, if 0.87 > EQR > 0.65; Moderate, if 0.65 > EQR > 0.44;
Poor, if 0.44 > EQR > 0.22; and Bad, if EQR < 0.22 (INAG, 2009).
Periphyton community
In the laboratory, the preserved periphyton samples were oxidized with HCl (37%,
Merck), several times until the organic material being totally removed. During the
oxidization, the glass tubes were gentle warmed using alcohol lamp for 2-3 min helping to
speed the process. A small amount of each sample was placed on the top of one coverslip
and left to dry out at room temperature. The coverslip was used to prepare permanent
slides using Naphrax (Brunel Microscopes Ltd, UK) gentle heated to evaporate the toluene.
From each sample, approximately 400 valves were counted and identified to species or
infra-specific level under a light microscope (Olympus CX 31) equipped with 100x
immersion objective of 1.25 NA, mostly according to (Krammer and Lange-Bertalot, 1986,
1988; 1991a, 1991b; Levkov, 2009; Werum and Lange-Bertalot, 2004). The IPS diatom index
(Cemagref, 1982) is based on Zelinka and Marvan’s (1961) equation with differences in
indicator and sensitivity values. Species are grouped in 5 classes from 1 (tolerant species)

37
to 5 (intolerant species). The CEE index is based on a two-way entry table, which includes
208 taxa. In this table, taxa are horizontally placed in eight groups arranged in descending
order to sensitivity to pollution (group 1 most sensitive and group 8 most tolerant).
Vertically, there are four subgroups of taxa (9 to 12) with restricted geographical
distribution based on alkalinity and mineralization. For this catchment, the ecological status
are categorized by the following intervals: High, if EQR > 0.98; Good, if 0.98 > EQR > 0.74;
Moderate, if 0.74 > EQR > 0.49; Poor, if 0.49 > EQR > 0.25; and Bad, if EQR < 0.25 (INAG,
2009). The diatom indices were calculated with software OMNIDIA (v 6.0 - Lecointe et al.,
1993).
Surface water Ecological status evaluation: integration of WFD data
All the data related to biological (macroinvertebrates and periphyton),
physicochemical elements, including specific pollutants and hydromorphological elements,
which are within the ecological status, and priority substances, referring to the chemical
status, were collected and evaluated as required by INAG (2009). After the integration of
all these elements, the worst classification overlaps and dictates the classification of the
site in a given season (Table 5).
2.2.2.4. Bacteria community analysis by FCM and DNA extraction for DGGE analysis
as rapid bioassessment tool to complement the WFD methodology
FCM analysis was performed on unfiltered water and elutriate samples using a
commercial kit (Bacteria Counting Kit, Molecular ProbesTM, Invitrogen) for accurate
enumeration of bacteria, following the manufacturer’s protocol.
Briefly, 1 mL of both water and elutriate samples were transferred to Eppendorf
tubes together with 1 µL of SYTO® BC and the mixture was then incubated at 37˚C for 5
min. Ten µL of the suspension of microsphere standard with 6 µm were added to the
previous mixture after resuspension by sonication in a water bath for about 5 min. Samples
were then briefly vortexed and analyzed in an Attune® Acoustic Focusing Cytometer
(TermoFisher Scientific) equipped with a 488 nm laser.

38
The SYTO BC was excited at 488 nm and fluorescence measured with 530/30
bandpass filter (BL1). Light FSC and SSC were also recorded. For statistical significance, at
least 105 cells were analyzed in each sample and bacteria populations were selected based
on BL1 and FSC profiles using the FlowJo software (Tree Star Inc., Ashland, OR, USA). In BL1
vs SSC cytogram, a polygonal region was defined to include only bacteria populations and
the concentration of cells in this region was recorded. A marker for separation of LNA and
HNA bacterial was defined in the BL1 vs SSC cytogram and the concentrations were counted
separately.
2.2.2.4.1. DNA extraction and PCR amplification of bacterial 16S rRNA fragments
For the bacteria DNA extraction of sediment samples, a commercial kit was applied
(PowerSoil® DNA Isolation Kit, MO BIO Laboratories Inc.) following the manufacturer’s
protocol. In brief, 0.25g of sediment sample was added to a PowerBead tube and 60 µL of
solution C1 (SDS and other disruption agents for cell lysis) was added, tubes were inverted
several times and then they were positioned horizontally on a vortex at maximum speed
for 20 min. Tubes were centrifuged at 10000 g for 30 s at room temperature. The
supernatant was transferred to a clean tube and 250 µL of solution C2 (reagent to
precipitate non-DNA organic and inorganic material) was added, followed by vortex for 5 s
and incubation at 4˚C for 5 min. Next, the tubes were centrifuged at 10000 g for 1 min and
600 µL of supernatant was moved to a clean tube. 200 L of solution C3 (reagent to
precipitate non-DNA organic and inorganic material) was added, briefly stirred and
incubated under the above conditions. Centrifugation was performed as previously
mentioned. 750 µL of supernatant was transferred to a clean tube and 1200 µL of solution
C4 (high concentration salt solution for a stronger bond of DNA to silica) was added to the
supernatant and briefly stirred. Six hundred seventy-five µl were moved to a spin filter
(tube with a silica membrane) and then centrifuged under the same conditions. The flow-
through was discarded and this step was repeated with the remaining supernatant. Next
was added 500 µL of solution C5 (ethanol based wash solution) and centrifuged. The spin
filter was placed in a clean tube and was added 100 µL of solution C6 (elution buffer). After
another centrifugation, the spin filter was discarded and the DNA was stored at -20˚C until
further applications.

39
Total DNA from environmental water samples was extracted by filtering 2 bottles of
1.5L of water samples through 0.22 µm polycarbonate sterile filters, 47 mm Ø (Whatman,
Kent), each bottle works as 1 replicate. When it was not possible to filter 1.5L of water due
to filter clogging the volume of water filtered were recorded for further calculations. The
filters were frozen -20˚C in sterilized petri dish covered with parafilm M® until further
extractions were done. The bacteria DNA extraction kit applied for water column samples
were the same used for sediment extraction (PowerSoil® DNA Isolation Kit, MO BIO
Laboratories Inc.) following the manufacturer’s protocol (see above Bacteria community
analysis by FCM and DNA extraction for DGGE analysis). The bacteria DNA extraction from
the filter starts by cutting each filter into pieces with a sterile scalpel and transferring each
sample it to one PowerBead tube in laminar flow chamber conditions.
The highly variable V3 region of the 16S rRNA gene fragments was PCR amplified using
universal primers 338F-GC (5′-CGCCCGCCGCGCGCGGCGGGCGGGGCGGGGGCACGGGGG-
ACTCCTACGGGAGGCAGCAG-3’), and 518R (5′-ATTACCGCGGCTGCTGG-3’) (Muyzer et al.,
1993). For amplification, the 25 µL reaction mixture contained 14,7 µL of sterilized water,
2 µL of 25 mM MgCl2, 5 µL of Flexi buffer 5× colorless, 0,5 µL of 10 nM dNTP mixture, 0,2
µL of dream Taq DNA polymerase and 0,3 µL of each primer (100 uM). The samples were
amplified in an IQTM5 thermocycler PCR system (by a Touchdown PCR protocol: 5 min at
94˚C to denature, 1 min at 65˚C to anneal. The annealing temperature was decreased 1˚C
every second cycle until touchdown at 55˚C, at which temperature five additional cycles
were carried out. This procedure reduces nonspecific sequences amplification. A final
extension was conducted at 72˚C for 3 min. A negative control reaction without any
template DNA was performed simultaneously. The PCR amplicons were electrophoresed
on a 1,5% agarose gel and compared with a molecular weight marker (GeneRuler™ 1 kb
DNA ladder). Electrophoresis was performed at 95V for 40 min. The gel was then visualized
by greensafe premium (Nzytech) staining on a UV transilluminator (Syngene G:BOX)
2.2.2.4.2. Denaturing gradient gel electrophoresis (DGGE)
DGGE was performed in a DCodeTM universal mutation detection system (Bio-Rad
Laboratories, Hercules, California, USA) using 0.5x TAE buffer containing 20 mM Tris, 10mM
acetic acid and 0.5 mM EDTA (pH 8.0). Amplification products were separated in a 1 mm
40
vertical polyacrylamide gels (8% [wt/vol] acrylamide in 0.5x TAE buffer) using a 35%-60%
denaturing gradient (100% denaturing gradient is 7 M urea and 40% deionized formamide).
Electrophoresis was executed at 60˚C during 16h at 75V. The gel was then stained for 5 min
in an ethidium bromide solution (5%), rinsed for 5 min with distilled water and scanned
with a Molecular Imager FX™ system (Bio-Rad Laboratories, Hercules, California, USA).
2.2.2.5. Data analysis: multivariate approach
Each community of macroinvertebrate, periphyton and bacteria abundance data
were analyzed individually by Detrended Correspondence Analysis (DCA, unconstrained
ordination technique) on biotic data matrix, which analyzes gradients in community
structure, including spatial and temporal patterns. DCA is an improved eigenvector
ordination technique based on reciprocal (weighted) averaging and is commonly used in
community ecology, as it assumes an underlying unimodal mathematical model (ter Braak,
1995, Gauch, 1982). In the case of macroinvertebrate and periphyton communities, manual
downweighting of rare families was used, and species with less than 0.048% and 0.015%,
respectively, of the total abundance in each sample, were discarded.
The distribution of each sample according to environmental parameters was
assessed through a multivariate redundancy analysis (RDA) and canonical correspondence
analysis (CCA) for periphyton community, after standardization of environmental data (by
subtracting the mean from each observation and dividing to the corresponding standard
deviation). RDA was the choice to explore seasonal and spatial gradients in the biotic data
communities individually for macroinvertebrates and bacteria and CCA were performed for
periphyton (ter Braak, 1995) according the theory on gradient analysis (ter Braak and
Prentice 1988). In spite of species abundances tend to follow a unimodal response (CCA)
to environmental gradients, RDA was best suited to deal with species abundance data when
the length of gradient is small (usually below 3-4 s.d. units) thus approaching a linear
response. CCA analysis were performed to the periphyton community due to the length of
gradient be above 4, following a unimodal response pattern. Both RDA and CCA constrains
the biotic matrix to the environmental gradients, which makes it direct gradient analysis
technique (ter Braak 1995). The length of the arrow refers to the importance of the

41
explanatory variable in the ordination, and arrow direction indicates positive and negative
correlations. The data were centered and standardized before redundancy analysis, and
the Monte Carlo permutation test (p<0.1) was used to examine the significance of the RDA
method, i.e., a selection procedure was performed a priori on the environmental data sets,
including only significant explanatory variables in the model using symmetric scaling
(Gabriel, 2013). All multivariate analysis were performed using CANOCO 4.5 software.
2.3. Results
2.3.1. Sampling sites water and sediment elutriate quantifications performed – abiotic
framework
The variation of the physicochemical parameters in the Caima River is shown in
Table 1. The temperature values varied between 6.3˚C in winter and 19.3˚C in summer,
with minimum values registered at Nascente in all stations due to its altitude. The pH values
in water did not demonstrate significant alterations in winter and spring, with values
between 9.14 and 7.52. In summer all the stations decreased their pH to low than 7.
However, the pH measured in sediment samples had higher values only in winter, being
spring and summer very similar to each other.
Caima River was very heterogeneous among sampling seasons. Parameters such as
ammonium (NH4), ammonia (NH3), total nitrogen (TN), phosphate (PO4), total phosphorus
(TP) and nitrate (NO3) registered the higher values at Bustelo in the 3 seasons, in water
samples (with the exception of four sediment samples: TP, PO4 with higher values at
Nascente in spring and NH4, NH3 with higher values at Nascente summer). Besides that, in
these parameters, the water samples always had higher values than sediment samples. The
minimum value was observed for NH4 and NH3 at Nascente for water samples and at Palhal
for sediment samples, both in summer. The conductivity (cond) in water was significantly
greater at Bustelo and Palhal in all the seasons, unlike sediment samples, that the minimum
values corresponded to Bustelo in winter and spring. The dissolved oxygen (O2) was
relatively homogeneous among the sites and seasons, with a slight decrease at Bustelo
sites. This parameter was always higher in water samples than sediment samples as well.

42
Dissolved organic carbon (CDOC) in water had its maximum value at Palhal in spring (24.38
mg/L) and its minimum value at Nascente in summer (1.61 mg/L), while in sediment the
maximum value was registered at Nascente in winter (34.96 mg/L) and the minimum value
was registered at Palhal in summer (0.92 mg/L). The values of biochemical oxygen demand
(BOD5) were similar among sampling sites, for the same season, but different between
seasons, being strangely the maximum values in winter and the minimum values in spring
and summer, for both water and sediment samples. These two last parameters had values
of sediment samples higher than water samples in all seasons. Total suspended solids (TSS)
in water had its maximum value (62.52 mg/L) at Palhal and its minimum value (0.133 mg/L)
at Nascente, both in winter. Organic matter (OM) values, in sediments, were higher at
Nascente and lower at Palhal in all seasons. No consistent pattern was found among all
these parameters, although most of the nutrients had higher concentrations at Bustelo
throughout the year, followed by Palhal and Nascente.
Low levels of zinc (Zn), cadmium (Cd) and barium (Ba) were found in water and
sediment samples. It was observed that in all metals, the concentration was always higher
in sediments than in water along the seasons (Table 2). The opposite was detected for the
sulphur element, which had higher values in water. All the metal quantifications performed
in water samples collected were below the thresholds values considered as safe in WFD
legislation (INAG, 2009). Curiously, some elements such as arsenic (As), copper (Cu) and
aluminum (Al) were found to be at higher concentrations in sediments at Nascente in
winter (see Discussion). These metals were decreasing gradually throughout the seasons,
reaching the lowest values in summer. Also, the maximum values of Al and Cu in water
samples were found at river source in spring. Concentrations of manganese (Mn), lead (Pb)
and total S were found to vary among seasons, although it seems that in spring the values
are lower compared to the other seasons. The most worrying concentrations of iron (Fe)
and chromium (Cr) in sediments were recorded at Nascente, summer and spring
respectively, where the values are much higher than the rest of the sampling sites and the
water measurement.
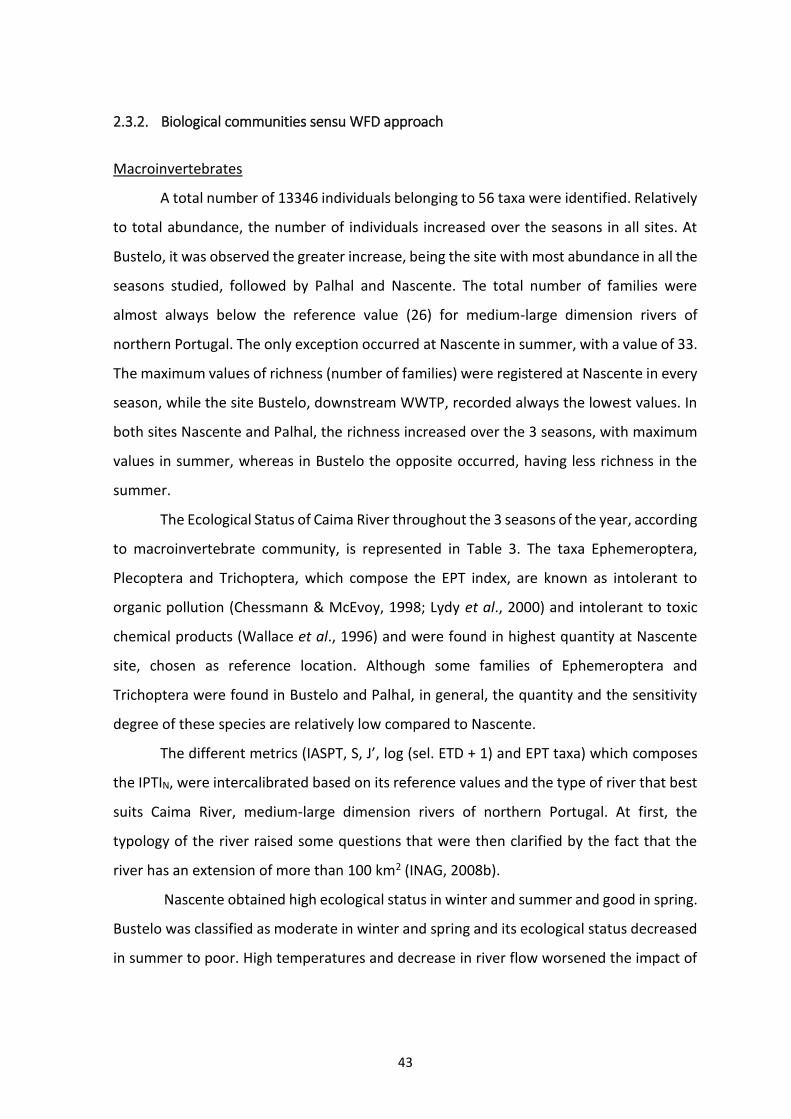
43
2.3.2. Biological communities sensu WFD approach
Macroinvertebrates
A total number of 13346 individuals belonging to 56 taxa were identified. Relatively
to total abundance, the number of individuals increased over the seasons in all sites. At
Bustelo, it was observed the greater increase, being the site with most abundance in all the
seasons studied, followed by Palhal and Nascente. The total number of families were
almost always below the reference value (26) for medium-large dimension rivers of
northern Portugal. The only exception occurred at Nascente in summer, with a value of 33.
The maximum values of richness (number of families) were registered at Nascente in every
season, while the site Bustelo, downstream WWTP, recorded always the lowest values. In
both sites Nascente and Palhal, the richness increased over the 3 seasons, with maximum
values in summer, whereas in Bustelo the opposite occurred, having less richness in the
summer.
The Ecological Status of Caima River throughout the 3 seasons of the year, according
to macroinvertebrate community, is represented in Table 3. The taxa Ephemeroptera,
Plecoptera and Trichoptera, which compose the EPT index, are known as intolerant to
organic pollution (Chessmann & McEvoy, 1998; Lydy et al., 2000) and intolerant to toxic
chemical products (Wallace et al., 1996) and were found in highest quantity at Nascente
site, chosen as reference location. Although some families of Ephemeroptera and
Trichoptera were found in Bustelo and Palhal, in general, the quantity and the sensitivity
degree of these species are relatively low compared to Nascente.
The different metrics (IASPT, S, J’, log (sel. ETD + 1) and EPT taxa) which composes
the IPTIN, were intercalibrated based on its reference values and the type of river that best
suits Caima River, medium-large dimension rivers of northern Portugal. At first, the
typology of the river raised some questions that were then clarified by the fact that the
river has an extension of more than 100 km2 (INAG, 2008b).
Nascente obtained high ecological status in winter and summer and good in spring.
Bustelo was classified as moderate in winter and spring and its ecological status decreased
in summer to poor. High temperatures and decrease in river flow worsened the impact of

44
WWTP on macroinvertebrate communities, making Bustelo the most impacted site. Palhal
ecological status remained good along the 3 seasons sampled (Table 3).
Periphyton
A total of 44 species belonging to 26 genus were identified. The composition,
abundance and ecological status of periphyton communities in the 3 seasons of the year
are represented in Table 4. Navicula e Gomphonema were the genus more frequently
represented, with 6 and 5 taxa, respectively. The lowest values of richness occurred at
Nascente in every seasons, with minimum value in spring (5), while Bustelo registered the
highest values. Nascente and Palhal share the same fluctuation, with decreasing values of
taxa richness from winter to spring and an increase in summer, while Bustelo increased
over the seasons. Some taxa were found exclusively in one station over the 3 seasons, for
example, Peronia fibula (PERF), Surirella angusta (SANG) and Anomoeoneis serians (ANON)
at Nascente, Psammothidium subatomoides (PSAT), Navicula gregaria (NGRE) and Neidium
dubium (NEDU) at Bustelo, Achnanthes minutissima (AMIN), Planothidium
frequentissimum (PLFR), Gomphonema parvulum (GPAR) and Cocconeis placentula (CPLA)
at Bustelo and Palhal. Some species of the genera Gomphonema, Nitzschia and Navicula
are known to be tolerant to organic and metal pollution (Kwandrans et al., 1998; Bere &
Mangadze, 2014), being concordant with their distribution at Bustelo and Palhal sites.
Moreover, in general, Navicula and Gomphonema genus occurred manly at pH <7,
preferentially in meso-eutrophic environments and oxygen saturation about 70-85% (van
Dam, 1994).
Ecological Status according to periphyton communities were calculated taking into
account the typology of the river for the values of IPS and respective RQE (Table 4). In
winter and spring the river water quality was good in all sites and in summer it was good at
Nascente, high at Bustelo and moderate at Palhal.

45
N_winter B_winter P_winter N_spring B_spring P_spring N_summer B_summer P_summer
Temp(ºC)_water 6.3 6.9 7.3 9.1 12.7 12.9 17.6 19.3 18.2
pH_water 9.14 7.52 7.8 8.5 7.71 7.93 6.93 6.5 6.86
pH_elutriate 8.07 7.5 7.71 5.39 5.6 5.53 5.88 6.14 5.88
cond (µS/cm)_w 14 82 80 14 61 67 10 94 91
cond (µS/cm)_e 43 11 50 43 11 50 19 21 17
O2 (%)_w 98.6 94 99.8 100.2 95 101.9 103.9 91.1 99.1
O2 (%)_e 92.7 89.5 95.8 75.8 69.5 92.5 79.6 64.3 84.7
O2 mg/L_w 11.07 11.4 12.05 10.44 10.05 10.79 8.89 8.29 9.26
O2 mg/L_e 8.88 8.79 9.15 9.72 9.26 9.82 8.6 7.69 8.89
CDOC (m-1)_w 6.9 2.99 2.53 23.92 23.46 24.38 1.61 4.14 3.22
CDOC (m-1)_e 34.96 13.11 9.66 29.44 26.68 30.13 23.92 5.29 0.92
BOD5 (mg/L)_w 5.1 5.1 6.25 0.68 0.62 0.65 0.31 1.1 0.5
BOD5 (mg/L)_e 8.17 7.39 6.72 1.09 2.72 1.35 1.59 2.94 1.19
Turbidity (m-1)_w 6.44 1.38 0 0 0 0 0.92 2.76 2.76
NH4 (mg/L)_w 0.1161 1.5996 0.1419 0.129 0.8256 0.1419 0.0774 0.9288 0.129
NH4 (mg/L)_e 0.1161 0.8256 0.1548 0.2322 0.3612 0.1419 0.5031 0.4644 0.0516
NH3 (mg/L)_w 0.1098 1.5128 0.1342 0.122 0.7808 0.1342 0.0732 0.8784 0.122
NH3 (mg/L)_e 0.1098 0.7808 0.1464 0.2196 0.3416 0.1342 0.4758 0.4392 0.0488
Table 1- Environmental characteristics of the water and sediment samples: Nasc- river source; Bust- downstream WWTP; Palh- palhal mine in 3 seasons (winter, spring and summer) (maximum values are in bold)

46
TP (mg/L)_w 0 0.159 0.0204 0 0.2425 0.0062 0 0.1696 0.0719
TP (mg/L)_e 0.3331 0.16254 0.05062 0.389942 0.219891 0.107467 0.11635 0.372176 0.04884
PO4 (mg/L)_w 0 0.4865 0.06247 0 0.742008 0.018981 0 0.51912 0.220124
PO4 (mg/L)_e 1.01926 0.49738 0.154888 1.193221 0.671336 0.32885 0.356031 1.138858 0.149452
TN (mg/L)_w 0 1.518822 0.872886 0 0 0 0 1.14017 0.895159
TN (mg/L)_e 1.296085 1.296085 0 0 0 0 0.29377 0.627875 0
NO3 (mg/L)_w 0 6.728381 3.866883 0 0 0 0 5.050951 3.965556
NO3 (mg/L)_e 5.741658 5.741658 0 0 0 0 1.301403 2.781488 0
TSS (mg/L)_w 0.13333 2.466667 62.52 0.653333 1.306667 0.206667 1.366667 1.46 1.926667
OM(%) 1.694246 0.418908 0.383996 3.589699 0.566382 0.278018 14.93949 0.598511 0.516087
N_winter B_winter P_winter N_spring B_spring P_Spring N_summer B_summer P_summer
Table 1- Environmental characteristics of the water and sediment samples: Nasc- river source; Bust- downstream WWTP; Palh- palhal mine in 3 seasons (winter, spring and summer) (maximum values are in bold) (cont.)

47
Table 2- Metal concentrations (µg/L) found in both water and elutriate samples Nascente (N), Bustelo (B) and Palhal (P) in 3 seasons throughout the year (maximum values are in bold).
(µg/L) N_winter B_winter P_winter N_spring B_spring P_spring N_summer B_summer P_summer Al_w 45 29 19 59 58 25 39 39 54
Al_e 3680 410 350 400 63 430 86 18 49
Mn_w 13,2 21,8 5,4 9,9 8,5 4,2 4,7 15,6 2,3
Mn_e 10,4 30,3 30,5 10,9 16,7 23 17,8 570 17,2
Fe_w <500 <500 <500 <500 <500 <500 <500 <500 <500
Fe_e <500 <500 <500 <500 <500 <500 2200 720 <500
Cu_w <2 3,5 7,6 22 <2 <2 <2 <2 2,3
Cu_e 9,1 4,7 8,6 7,9 2,3 7,6 2,1 3,4 3
Zn_w <50 <50 <50 <50 <50 <50 <50 <50 <50
Zn_e <50 <50 <50 <50 <50 <50 <50 <50 <50
Cd_w <1 <1 <1 <1 <1 <1 <1 <1 <1
Cd_e <1 <1 <1 <1 <1 <1 <1 <1 <1
Ba_w <10 10 <10 <10 <10 <10 <10 <10 <10
Ba_e <10 <10 <10 <10 <10 <10 <10 <10 <10
Pb_w <3 <3 <3 <3 <3 <3 <3 <3 3,1
Pb _e <3 <3 9 <3 <3 <3 4 5 5,7
Total S_w 276 1750 2140 289 1450 1660 172 2050 2030
Total S_e 266 728 949 317 382 1880 2260 728 1100
As_w <3 <3 <3 <3 <3 <3 <3 <3 3
As_e 33 3,4 26 <3 <3 16 5 <3 12
Cr_w <5 <5 <5 <5 <5 <5 <5 <5 <5
Cr_e <5 <5 <5 170 <5 <5 <5 <5 <5

48
Table 3 - Composition of macroinvertebrate communites and ecological status of each sampling site (Nascente (Nasc), Bustelo (Bust) and-
Palhal (Palh)) in the 3 seasons (winter, spring and summer), using IPTIN and respective RQE, according the Portuguese WFD.
Dryo Dytis Elmid Gyri Hydra Hydr p Scirt Athr Cert Chiro Dixd Dolc Empd Limn Musc Psyh Rhai Siml Tipu Baeti Caen
Nasc_w 0 0 4 3 3 0 38 0 0 19 0 0 3 0 0 0 0 4 0 70 0
Bust_w 0 0 3 1 0 0 0 0 0 88 0 0 0 0 0 0 0 1 0 192 242
Palh_w 1 0 46 0 0 0 0 6 1 77 0 0 3 0 0 1 0 2 0 85 291
Nasc_sp 0 0 32 0 4 1 103 0 0 277 0 0 2 0 0 0 0 1 0 48 1
Bust_sp 0 0 5 0 0 0 0 1 1 819 0 0 6 0 0 0 0 8 0 228 399
Palh_sp 0 0 24 0 0 0 0 6 13 139 0 0 8 1 0 0 0 0 1 544 285
Nasc_s 0 0 51 0 2 0 4 0 0 270 3 1 1 1 0 0 1 18 0 207 0
Bust_s 0 0 3 0 0 0 0 0 0 3320 0 0 0 0 4 0 0 59 1 210 300
Palh_s 0 4 13 0 0 0 0 0 3 1421 0 0 3 0 0 0 0 0 0 104 705
Nasc_w
Bust_w
Palh_W
Nasc_sp
Bust_sp
Palh_sp
Nasc_s
Bust_s
Palh_s
EPH Hept Lept Ancy Phys Aphel Corix Gerr Hydrom Aesh Calo Cord Gomph Hydrac Oligo Duge Plana Tricl Chlo Leuct Nemou
0 29 20 0 0 0 0 0 0 2 0 0 2 2 0 0 1 0 1 4 15
0 0 0 3 18 0 0 0 0 1 0 0 3 1 84 3 0 0 0 0 0
0 0 0 9 0 0 0 0 0 1 1 0 2 28 38 1 0 0 0 0 0
5 1 19 0 0 0 0 0 0 0 1 0 2 35 0 0 0 0 0 21 46
0 0 0 1 0 0 0 0 0 0 0 0 5 9 10 0 0 5 0 0 0
0 0 0 6 0 2 0 0 0 1 0 0 6 40 1 1 0 0 0 0 0
66 13 109 0 0 0 2 0 1 15 2 5 14 87 2 0 2 1 0 392 21
0 0 0 3 19 0 0 0 0 0 0 0 0 48 16 0 0 0 0 0 0
0 0 0 4 0 6 1 1 0 2 1 0 6 550 0 4 0 0 0 0 0

49
RQE RQE ref. Ecological
status
Nasc_w 0.9829 0.87-0.65 High
Bust_w 0.499 0.44-0.22 Moderate
Palh_w 0.787 0.87-0.65 Good
Nasc_sp 0.8298 0.87-0.65 Good
Bust_sp 0.557 0.65-0.44 Moderate
Palh_sp 0.784 0.87-0.65 Good
Nasc_s 1.065 > 0.87 High
Bust_s 0.349 0.44-0.22 Poor
Palh_s 0.809 0.87-0.65 Good
Perli PLEC Erpo Ecnom Gloss Hydrop Hydrot Lept Philo Polyc Psyc Rhyac Seri Trich IASPT IBMWP IPTIN
Nasc_w 1 0 0 0 0 33 0 1 2 0 0 0 113 0 1.1679 146 0.982926
Bust_w 0 0 8 0 0 3 0 0 0 0 0 0 1 0 0.6927 76 0.498767
Palh_w 0 0 0 0 0 12 0 1 3 2 0 1 0 0 0.916 124 0.786632
Nasc_sp 0 8 2 0 0 5 7 0 0 0 0 13 214 0 0.9847 130 0.829836
Bust_sp 0 0 5 0 0 9 0 0 0 0 0 0 0 0 0.6657 65 0.556583
Palh_sp 0 0 0 0 0 10 1 1 3 0 5 0 0 0 0.9476 121 0.783999
Nasc_s 0 1 0 0 0 23 0 15 0 29 5 7 2 0 0.9832 183 1.064985
Bust_s 0 0 12 0 0 2 0 0 0 0 0 0 0 0 0.4844 51 0.3487
Palh_s 0 0 1 2 1 27 3 16 1 5 0 0 0 1 0.9131 135 0.809411
Table 3- Composition of macroinvertebrate communites and ecological status of each sampling site Nascente (Nasc), Bustelo (Bust)
and Palhal (Palh) in the 3 seasons (winter, spring and summer), using IPTIN and respective RQE, according the Portuguese WFD (cont.).

50
Table 4- Composition of periphyton communities and ecological status of each sampling site (Nascente (Nasc), Bustelo (Bust) and Palhal (Palh)) in the 3 seasons (winter, spring and summer), using IPS and respective RQE, according the Portuguese WFD.
ACON AMIN ANON CER CPLA CMEN CTUM DMES ENMI EBIL EEXI EMIN FBCP FCVA FULN FVUL GACO GGRA GPAR GPUM MVAR MCIR
Nasc_w 0 0 8 0 0 0 0 0 2 26 5 12 0 0 0 0 0 0 0 0 0 0
Bust_w 40 0 0 0 18 2 0 0 2 0 4 6 0 0 0 6 0 0 10 0 0 2
Palh_w 4 283 0 1 44 0 3 1 0 0 0 1 2 1 6 13 1 1 0 0 17 2
Nasc_sp 0 0 0 0 0 0 0 0 0 0 2 19 0 0 0 0 0 0 0 0 0 0
Bust_sp 15 130 0 8 2 3 0 7 0 0 0 17 0 0 13 3 0 0 53 6 0 0
Palh_sp 0 310 0 0 67 0 0 0 0 0 0 5 0 0 0 3 0 0 1 0 0 0
Nasc_s 2 0 2 0 1 0 0 0 0 0 8 79 0 0 0 0 0 0 0 0 0 0
Bust_s 0 8 0 0 4 3 0 2 7 0 0 1 0 2 1 1 1 20 9 2 1 0
Palh_s 3 100 0 0 126 168 4 1 6 0 0 0 0 0 2 0 0 0 4 0 14 0
NCRY NCTE NGRE NLAN NRHY NEDU NDIS PERF PGIB PMIC PSCA PCLT PLFR PSAT RSIN SPUP SPHO SANG SLIN IPS RQE RQE ref. Ecological
Status
0 0 0 0 0 0 0 53 0 0 0 0 0 0 0 0 0 305 0 17.2 0.90052 0.98-0.74 Good
8 0 6 0 0 2 0 0 0 0 18 0 4 300 6 0 0 0 0 18.4 0.96335 0.98-0.74 Good
0 4 0 4 1 0 0 0 4 0 4 2 1 0 0 1 0 0 8 18.1 0.94764 0.98-0.74 Good
0 0 0 0 0 0 0 10 1 0 0 0 0 0 0 0 0 390 0 15.8 0.82723 0.98-0.74 Good
0 0 0 0 0 7 1 0 0 8 21 8 49 120 70 5 1 3 14 16.9 0.88482 0.98-0.74 Good
0 0 0 2 0 0 0 0 0 2 0 2 5 0 0 0 0 0 3 18.8 0.98429 > 0.98 Good
0 0 0 0 0 0 0 8 2 0 2 0 0 0 0 2 6 312 0 16.4 0.85864 0.98-0.74 Good
0 0 6 0 1 1 1 0 1 1 1 1 6 390 0 0 0 1 1 18.9 0.98953 > 0.98 High
0 0 0 0 0 0 0 0 0 0 0 1 84 0 0 0 0 0 1 12.6 0.65969 0.74-0.49 Moderate

51
Surface water Ecological evaluation: integration of WFD data
According to INAG (2009), some physicochemical parameters have limit reference
values for the establishment of good ecological status in medium-large dimension rivers of
northern Portugal. Parameters such as O2 (≥5 mg/L), O2% (60%-120%), BOD5 (≤6 mg/L), pH
(6-9), NH4 (≤1 mg/L), NO3 (≤25 mg/L) and TP (≤0.10 mg/L) have already defined their limit
values. These values were taken into account in the final water quality assessment of Caima
River (Table 5), existing only a border between good and moderate class, where a value
above the limit requires the decreasing to good for moderate quality.
Bustelo obtained moderate along the three seasons, with high values of TP in all
seasons (0.159, 0.2425 and 0.1696, respectively) and high levels of NH4 (1.5996) in winter.
Also in winter, Palhal and Nascente obtained moderate due to an elevated value of BOD5
(6.25) and a high value of pH (9.14), respectively (Table 1).
Relatively to hydromorphological quality elements (Table 5), specific pollutants and
chemical status, all the sampled sites were qualified with good ecological status. The
specific pollutants evaluated in water of the sampling sites were never above threshold
values considered as safe for the ecosystems, published in WFD guidance document and
therefore were classified as good for all sampling site. The final ecological status was
defined by the elements that present worse classification.
The application of WFD to the river sampling sites and comparing the discriminatory
power given by the two biological communities, it was observed that they did not agreed
with each other several times evidencing that macroinvertebrates were more sensitive to
organic matter contamination after the WWTP than the periphyton, and periphyton
communities were more sensitive to ashes runoff at Nascente or other conditions, never
reaching high ecological status, according to those bioindicator communities. Meanwhile,
the same community showed not to be sensitive to the WWTP effluent discharge in river
at Bustelo and classifying the sampling site as high ecological status.

52
Table 5- Summarized data of the final water quality assessment of the different Caima River sites for winter, spring and summer.
Ecological Status Chemical Status Final Water
Status
Biological Quality Elements Hidromorphological
Quality Elements Specific
Pollutants
Chemical and Physicochemical Quality Elements
Periphyton Macroinvertebrate
winter
Nascente Good High Good or less Good Moderate Moderate Good Moderate
Bustelo Good Moderate Good or less Good Moderate Moderate Good Moderate
Palhal Good Good Good or less Good Moderate Moderate Good Moderate
spring
Nascente Good Good Good or less Good Good Good Good Good
Bustelo Good Moderate Good or less Good Moderate Moderate Good Moderate
Palhal Good Good Good or less Good Good Good Good Good
summer
Nascente Good High Good or less Good Good Good Good Good
Bustelo High Poor Good or less Good Moderate Poor Good Poor
Palhal Moderate Good Good or less Good Good Moderate Good Moderate

53
2.3.3. Bacteria community analysis by FCM
The data obtained from the flow cytometry are shown in Figure 6 and 7, respectively
from water samples and elutriates. As an example of the gatings that were applied in all
the samples, Figure 5 corresponds to a cytogram and a histogram of the sediment sample
at Nascente in spring. On the histogram, it’s possible to see two peaks, corresponding to
two different populations, with different nucleic acid content, one with low DNA content
(LNA) and the other with high DNA content (HNA). All the water and sediment samples
were subjected to the same gates for comparable results.
As shown in the flow cytograms (Fig 6 and 7), LNA and HNA bacteria in water and
sediment samples of the Caima River were discriminated by their DNA content and
fluorescence intensity in all the 3 seasons for Nascente, Bustelo and Palhal. The increasing
of bacteria abundance is proportional to the fluorescence intensity, being the greater
abundance marked by the green color.
In general, the LNA bacteria tends to decrease throughout the seasons, with
maximum values in winter and lower values in summer, suggesting a tendency to be higher
Figura 5- Example of HNA and LNA bacteria gatings applied at all the samples studied. On the left,
the cytogram and its corresponding histogram (on the right), illustrates the differentiation of two
populations based on the nucleic acid content.
HNA LNA
LNA HNA

54
with lower temperatures and vice versa. The opposite occurred with HNA bacteria that had
its maximum concentrations in summer and minimum in winter (except Bustelo in
sediment samples). By analyzing the cytograms from Figure 6, referring to water samples,
it´s clear that the greatest abundance happened at Bustelo in all seasons, with superior
abundance in winter and summer, followed by Palhal and Nascente. For both Nascente and
Palhal, there was a significant decrease of HNA bacteria from winter to spring and then an
increase to summer, reaching higher concentrations in summer. The same occurred for LNA
bacteria, but with higher values in winter. At Bustelo, there was a slight decrease of HNA
from winter to spring and an increase to summer, reaching the highest value in summer.
Relatively to sediment samples, HNA bacteria concentration reached lower values
at Nascente and Palhal in winter and then increased along the seasons. The opposite
happened with LNA bacteria at Nascente and Bustelo, where the maximum value was
registered in winter and decrease over the seasons reaching lower values in the warmer
season. At Bustelo, the higher value of HNA bacteria occurred in winter, decreasing in
spring and increasing again in summer (Figure 7). The same happened to Palhal but with
high values of LNA bacteria.

55
Figure 6- Flow cytogram are represented in dot-plots of total cell counts, and LNA (left side) and
HNA (right side) bacteria water samples are indicated by solid lines. Samples were discriminated
based of their side scatter (SSC) and fluorescence intensity (BL1). All the seasons are represented,
being the first line the winter, spring and summer, respectively.
Nascente Bustelo Palhal
w
sp
s

56
Figure 7- Flow cytogram are represented in dot-plots of total cell counts, and LNA (left side) and
HNA (right side) bacteria sediment samples are indicated by solid lines. Samples were discriminated
based of their side scatter (SSC) and fluorescence intensity (BL1). All the seasons are represented,
being the first line the winter, spring and summer, respectively.
Nascente Bustelo Palhal
w
sp
s

57
Bacteria communities densities from FCM analysis are shown in Table 6. Total cells,
HNA and LNA bacteria were analyzed for each sampling site in all seasons, both for water
and sediment samples. In general, there was always a higher concentration (total cells/mL)
of bacteria in sediments than in water. Maximum values recorded for Bustelo sediment
samples, in summer (1344998 cell/mL) and for Bustelo water samples, in winter (347480
cell/mL). Relatively to water samples, there was a similarity in bacterial density between
Nascente and Palhal in all seasons. Bustelo was the sampling site with higher density in all
seasons, wherein spring and summer had practically even and winter was the highest (see
Fig A.1 in the Annex).
Table 6- Bacteria community densities obtained by Flow Cytometry using a commercial kit (Bacteria
Counting Kit, Molecular ProbesTM, Invitrogen) for both water (w) and sediment samples (e) (maxi-
mum values of HNA and LNA for each site are in bold) of 3 sampling sites Nascente (Nasc), Bustelo
(Bust) and Palhal (Palh) for winter, spring and summer.
Total
(cells/ml) HNA
(cells/ml) LNA
(cells/ml) Nasc_w 36389 13037 24946
winter Bust_w 347480 175547 61173 Palh_w 42235 13148 22122
Nasc_w 43190 15743 19517 spring Bust_w 100402 47993 27418
Palh_w 41840 17838 15097
Nasc_w 35244 17834 5878 summer Bust_w 99940 54498 15715 Palh_w 47965 19767 18812
Nasc_e 1034357 337674 479408 winter Bust_e 1030062 456455 285698 Palh_e 679280 352413 143520
Nasc_e 247183 118538 64467 spring Bust_e 832612 430897 130576 Palh_e 40006 17893 11135
Nasc_e 1021044 565647 200015 summer Bust_e 1344998 814534 113930 Palh_e 537986 354632 66319
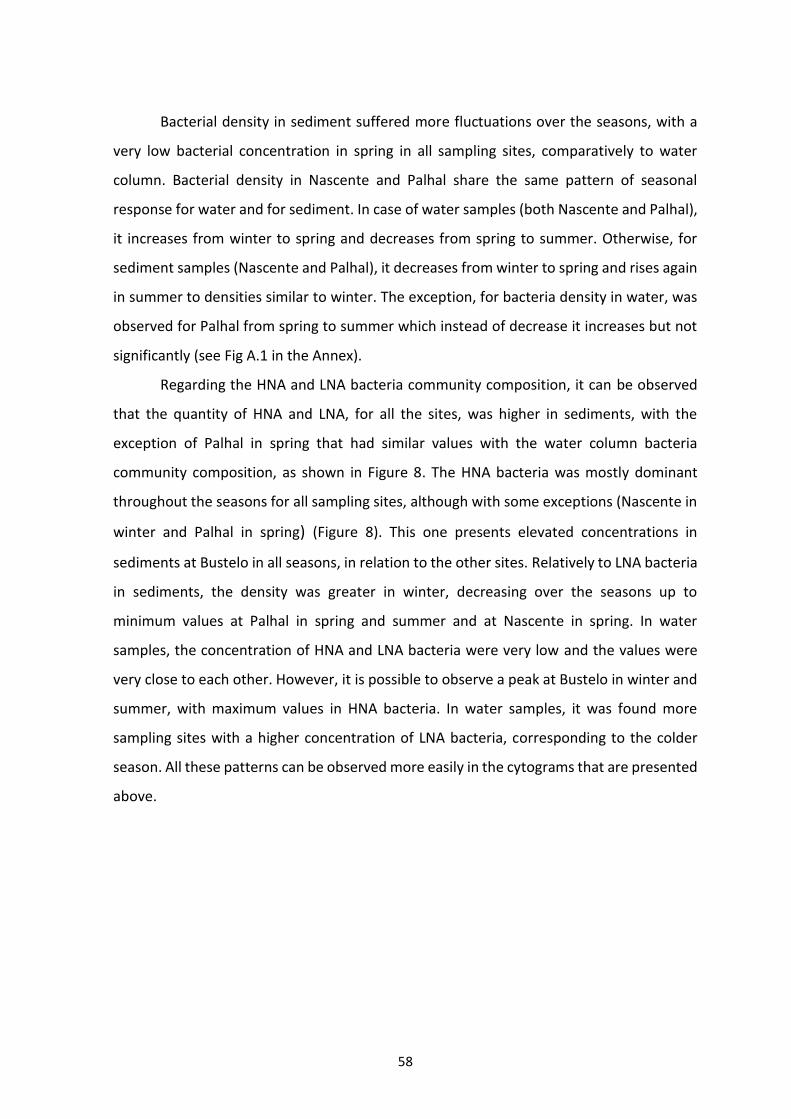
58
Bacterial density in sediment suffered more fluctuations over the seasons, with a
very low bacterial concentration in spring in all sampling sites, comparatively to water
column. Bacterial density in Nascente and Palhal share the same pattern of seasonal
response for water and for sediment. In case of water samples (both Nascente and Palhal),
it increases from winter to spring and decreases from spring to summer. Otherwise, for
sediment samples (Nascente and Palhal), it decreases from winter to spring and rises again
in summer to densities similar to winter. The exception, for bacteria density in water, was
observed for Palhal from spring to summer which instead of decrease it increases but not
significantly (see Fig A.1 in the Annex).
Regarding the HNA and LNA bacteria community composition, it can be observed
that the quantity of HNA and LNA, for all the sites, was higher in sediments, with the
exception of Palhal in spring that had similar values with the water column bacteria
community composition, as shown in Figure 8. The HNA bacteria was mostly dominant
throughout the seasons for all sampling sites, although with some exceptions (Nascente in
winter and Palhal in spring) (Figure 8). This one presents elevated concentrations in
sediments at Bustelo in all seasons, in relation to the other sites. Relatively to LNA bacteria
in sediments, the density was greater in winter, decreasing over the seasons up to
minimum values at Palhal in spring and summer and at Nascente in spring. In water
samples, the concentration of HNA and LNA bacteria were very low and the values were
very close to each other. However, it is possible to observe a peak at Bustelo in winter and
summer, with maximum values in HNA bacteria. In water samples, it was found more
sampling sites with a higher concentration of LNA bacteria, corresponding to the colder
season. All these patterns can be observed more easily in the cytograms that are presented
above.

59
2.3.4. Data analysis – multivariate approach
Macroinvertebrates
The DCA performed on macroinvertebrate communities matrix obtained a low
length of gradient of the first axis (2.022) (Figure 9). Different macroinvertebrate
community composition and abundances are responsible for the separation of clusters.
Meanwhile, DCA provides some interesting discrimination based on the community
composition only, between sampling sites, separating river source (Nascente sites) from
the other sampling sites that are grouped together. Exception made for Palhal in spring
season and Nascente in summer, which show some intermediate position between the two
major groups indicating that community composition, in that seasons, were different from
the other groups.
0
100000
200000
300000
400000
500000
600000
700000
800000
900000
HNA_w HNA_e LNA_w LNA_e
Figure 8- Variation of HNA and LNA bacteria concentrations along the 3 seasons (winter, spring and summer) for both water and sediment samples.

60
The RDA model selects the following parameters: O2(%)_w, OM(%) and S_w as the
most important explaining the macroinvertebrate variation (Figure 10 and 11). This RDA
model has a percentage variance of 50.4% for species-environment relation. The diagram
from Fig 11 suggests a separation of samples in three main groups: one of the groups is
constituted by more tolerant taxa to contamination, with a lower sensitivity degree (solid
line circle), consistent with the distribution of Palhal and Bustelo (Figure 10). The two
remaining groups (dotted) are related to river source communities, with high taxa score
(IBMWP) and high sensitivity to contamination, which were differentiated between them.
In summer the increase in dissolved oxygen (%) organic matter and total sulfur, both in
sediments, provide conditions for the development of highly diversified macroinvertebrate
community with different taxa that were not observed on the other seasons, for the same
sampling site, being characterized by a higher abundance of Leptophlebiidae, Leucridae,
Leptoceridae, Elmidae, Calopterygidae, Cordulegastridae, Polycentropodidae,
Ephemerellidae, Dixidae and Aeshnidae (dashed line circle –top right quadrant. The third
group is characterized by Ephemeroptera (Heptageniidae), Plecoptera (Nemouridae),
Trichoptera (Sericostomatidae, Hydroptilidae, Hydropsychidae and Rhyacophilidae) and
Figura 9- Sample scores of DCA on macroinvertebrate community abundances for 3 sampling sites
Nascente (Nasc), Bustelo (Bust) and Palhal (Palh) in winter spring and summer. Eigenvalues are
0.520 and 0.307 for axes 1 and 2, respectively.

61
Coleoptera (Gyrinidae and Hydraenidae) taxa, corresponding to sensitive organisms,
founded mostly at Nascente in winter and spring (Figure 10).
Figure 10- RDA biplot sample score and environmental gradients (represented by arrows) of ma-
croinvertebrate data matrix. S_w stands for total sulfur in sediment, O2 (%)_w stands for percent-
age of dissolved oxygen in water and OM (%) stands for percentage of organic matter in sediment.
Eigenvalues are 0.304 and 0.162 for axes 1 and 2, respectively.

62
Periphyton
The DCA performed on periphyton communities matrix obtained a length of
gradient of the first axis of 6.742. Bustelo and Palhal have very similar periphyton
communities and therefore, both sampling sites were positioned together for all seasons.
On the other side of the DCA, it can be observed Nascente sampling sites all together
evidencing their similar biotic community composition and very different from the other
sampling sites (Figure 12).
Figure 11- RDA biplot species scores (represented by grey arrows) and environmental gradients
(represented by red arrows) of macroinvertebrate data matrix. S_w stands for total sulfur in sedi-
ment, O2 (%)_w stands for percentage of dissolved oxygen in water and OM (%) stands for percent-
age of organic matter in sediment. Eigenvalues are 0.304 and 0.162 for axes 1 and 2, respectively.

63
The CCA diagram integrated the periphyton data with selected significant
physicochemical and metal concentrations: NH3_w, NH4_w, S_w and Pb_w, which
explained 48.6% of species-environment relation (Figure 13 and 14). The resulting diagram
proposes a separation of samples in three groups: one of the groups is constituted by
species that are more intolerant to pollution (dashed line circle), with no nutrients or
metals associated; the two other groups corresponded to species tolerant to nutrients,
thus more abundant in impacted environments. Even so, these two groups were very
differentiated by the type of pollutant sources and its abundance. Black solid circle
associated all the Bustelo sites (Figure 14), which were influenced by the presence of NH3
and NH4 in water column, characterized by high abundances of Gomphonema parvulum,
Gomphonema pumilum, Neidium dubium, Nitzschia dissipata and Psammothidium
subatomoides. Grey solid line group is associated to higher values of sulfur (S_w) and lead
(Pb_w) in water and incorporated all the Palhal sites that were characterized by the diatom
community of Cyclotella meneghiniana, Achnanthes minutissima, Cocconeis placentula,
Melosira varians, Cymbella tumida, Navicula cryptotenella, Navicula lanceolata, Navicula
rhynchocephala, Gomphonema acuminatum, Planothidium frequentissimum, Fragilaria
biceps, Encyonema minutum, Pinnularia gibba and Surirella linearis. The dashed line circle,
in the opposite direction were negatively related with nutrient input and metals and were
observed at Nascente in all seasons sampled (Figure 13), characterized by Eunotia exigua,
Eunotia minor, Eunotia bilunaris, Anomoeoneis serians, Peronia fibula, Stauroneis
Figura 12- Sample scores of DCA on periphyton community abundances for 3 sampling sites Nas-
cente (Nasc), Bustelo (Bust) and Palhal (Palh) in winter spring and summer. Eigenvalues are 0.954
and 0.407 for axes 1 and 2, respectively.
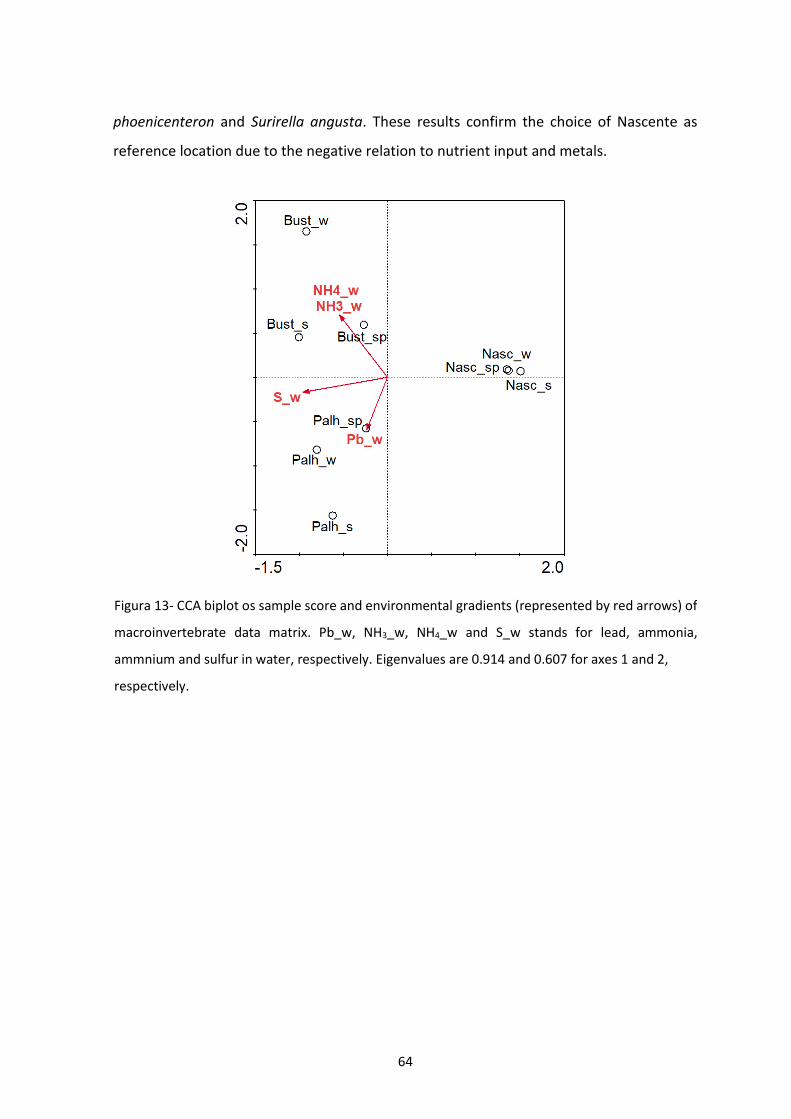
64
phoenicenteron and Surirella angusta. These results confirm the choice of Nascente as
reference location due to the negative relation to nutrient input and metals.
Figura 13- CCA biplot os sample score and environmental gradients (represented by red arrows) of
macroinvertebrate data matrix. Pb_w, NH3_w, NH4_w and S_w stands for lead, ammonia,
ammnium and sulfur in water, respectively. Eigenvalues are 0.914 and 0.607 for axes 1 and 2,
respectively.

65
Bacteria
The DCA for bacteria community was made with total density and LNA/HNA
bacteria abundances, both in water and sediment, and it was obtained a length of gradient
for the first axis of 1.029. Apparently, Palhal in spring and Nascente in winter were the two
sites that were less related to the other sites, being more distanced in the graphic (Figure
15). It was not possible to see a clear pattern in the sampling sites related to bacteria
community.
Figura 14- CCA biplot of species (represented by triangles) and environmental gradients (repre-
sented by red arrows) of periphyton data matrix. Pb_w, NH3_w, NH4_w and S_w stands for lead,
ammonia, ammonium and sulfur in water, respectively. Eigenvalues are 0.914 and 0.607 for axes 1
and 2, respectively.

66
The RDA model included the bacteria data with extracted gradients from significant
physical and chemical and metal concentrations parameters: BOD5_w, TP_w, PO4_w,
Mn_e, cond_w and CDOC_w, which explained 90.7% of the data variability (Figure 16 and
17). As shown in Figure 17, the graphic was separated in two groups: one group is
constituted by HNA bacteria in sediment, influenced by high levels of total phosphorus,
phosphates and conductivity in water and manganese in sediment (solid line circle), which
were related to polluted sites, Bustelo in summer and spring; another group were
composed by HNA, LNA bacteria, total density in water and LNA bacteria in sediment, being
the last one highly influenced by BOD5_w (dashed line circle). While LNA, HNA and density
in water samples were very similar to each other, sediments were discriminated apart from
the water on the graphic. Total density in sediment was associated with low values of CDOC
in water.
Figura 15- Sample scores of DCA on bacteria community abundances for 3 sampling sites Nascente
(Nasc), Bustelo (Bust) and Palhal (Palh) in winter spring and summer. Eigenvalues are 0.081 and
0.038 for axes 1 and 2, respectively.
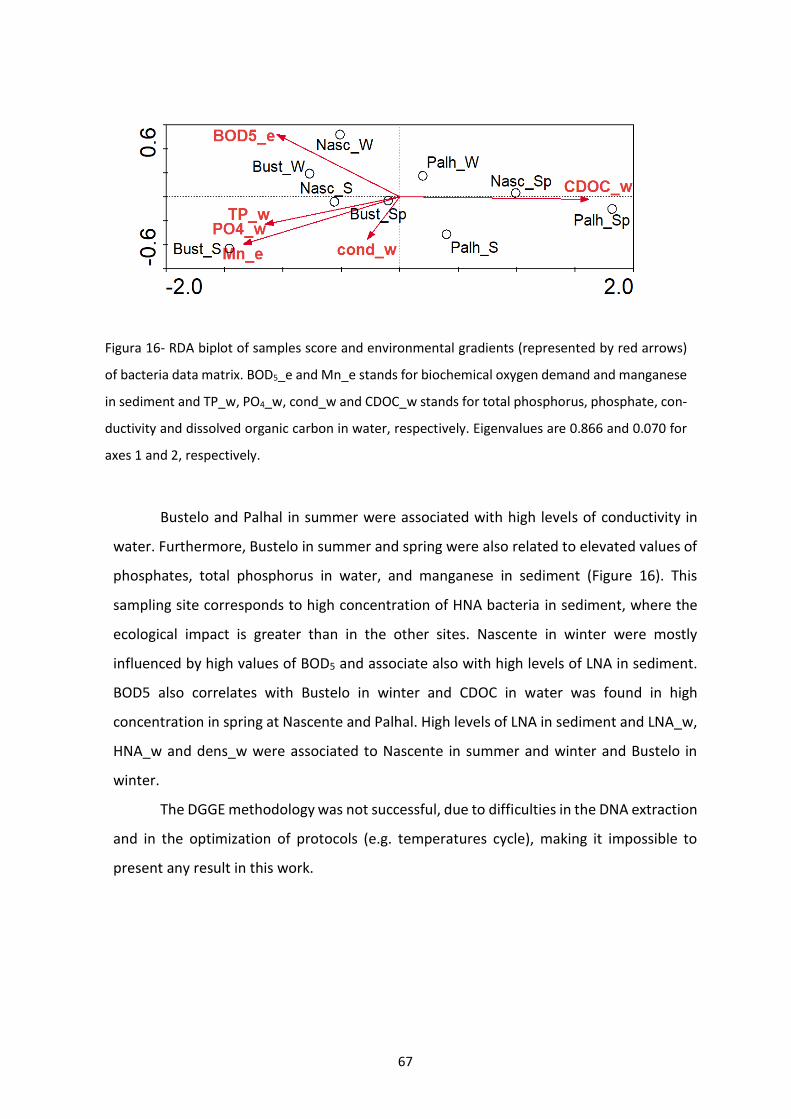
67
Bustelo and Palhal in summer were associated with high levels of conductivity in
water. Furthermore, Bustelo in summer and spring were also related to elevated values of
phosphates, total phosphorus in water, and manganese in sediment (Figure 16). This
sampling site corresponds to high concentration of HNA bacteria in sediment, where the
ecological impact is greater than in the other sites. Nascente in winter were mostly
influenced by high values of BOD5 and associate also with high levels of LNA in sediment.
BOD5 also correlates with Bustelo in winter and CDOC in water was found in high
concentration in spring at Nascente and Palhal. High levels of LNA in sediment and LNA_w,
HNA_w and dens_w were associated to Nascente in summer and winter and Bustelo in
winter.
The DGGE methodology was not successful, due to difficulties in the DNA extraction
and in the optimization of protocols (e.g. temperatures cycle), making it impossible to
present any result in this work.
Figura 16- RDA biplot of samples score and environmental gradients (represented by red arrows)
of bacteria data matrix. BOD5_e and Mn_e stands for biochemical oxygen demand and manganese
in sediment and TP_w, PO4_w, cond_w and CDOC_w stands for total phosphorus, phosphate, con-
ductivity and dissolved organic carbon in water, respectively. Eigenvalues are 0.866 and 0.070 for
axes 1 and 2, respectively.

68
2.4. Discussion
Caima River was chosen for this study as a model for the appliance of the
Portuguese WFD (using macroinvertebrates and periphyton communities) and in addition,
to evaluate the bacterial communities present in river water and sediment, as biological
indicator using a rapid screening method of FCM for different effects of multiple stressors
along its course (abandoned mine drainage, domestic and industrial waste), comparatively
to a possible unpolluted site, the river source (Nascente). Although Nascente proved to be
a good reference point, the summer wildfires followed by winter rainfall events promote
the ashes runoff into the river course diffusing the contamination by chemical elements in
the aquatic ecosystem (Pereira et al., 2013). Some metals such as S, Al, Cu, As, Cr and Fe
Figura 17- RDA biplot of species (represented by grey arrows) and environmental gradients (repre-
sented by red arrows) of bacteria data matrix. BOD5_e and Mn_e stands for biochemical oxygen
demand and manganese in sediment and TP_w, PO4_w, cond_w and CDOC_w stands for total phos-
phorus, phosphate, conductivity and dissolved organic carbon in water, respectively. Eigenvalues
are 0.866 and 0.070 for axes 1 and 2, respectively.

69
(Campos et al., 2012; Silva et al., 2014) and nutrients, especially phosphate, nitrate and
ammonium (Spencer et al., 2003; Earl & Blinn, 2003; Hosseini et al., 2017), were found to
be attached to ashes and subsequently transported to different environmental
ecosystems. At Nascente, the higher concentrations of these metals and nutrients occurred
mainly in sediment samples, while in water samples, metals like Cu and As were found at
minimum concentrations and the phosphates and nitrates weren’t even detected (Table 1
and 2). CODC and BOD5 were also found very high in winter, probably due to the recent
transport of organic matter into the river, by the rainfall. In general, all these
concentrations were significant in the first season of sampling (winter) and decreased over
the year. Hoissini et al., (2017) found the highest value of N and P exports in runoff and
sediment loss in the second year after the fire but several nutrient peaks were found in
autumn and winter after the fire has occurred and first raining events happened. The same
authors pointed the high concentration of suspended solids and nutrients on runoff
capable of affecting the water quality of downstream aquatic systems and the same
authors also stress about the repeated fire frequency on Mediterranean ecosystems and
land management possibly returning to prefire conditions. High values of pH recorded in
winter at Nascente can be also related to the ashes runoff into the river course as
documented by the authors (Earl & Blinn, 2003). It’s worth to mention the high amount of
organic matter (%) in sediment, dissolved organic carbon and BOD5 obtained in Nascente
elutriates can also being overestimated by the effect of composed sample which, in case of
Nascente, the sediment collection takes also into consideration a downstream dam, that
due to the retention effect, presented higher amounts of organic matter. Likewise, in all
sampling sites, a composed sample of sediments collected reflect the river microhabitats.
Regarding the application of WFD to the river sampling sites, macroinvertebrate and
periphyton communities didn’t show to be affected by wildfires since these communities
classified the Nascente as high in winter just after the runoff of ashes from the summer
fires in spite off in contrary, Rugenski et al (2014) observed a community structure change
in macroinvertebrate assemblage increasing taxa disturbance adapted like chironomid
midges and Baetis mayflies. We hypothesize that ashes runoff occurred soon before the
sampling collection and the community changes have not been felt, yet or the
70
characteristics and duration of the ash flow produces minimal reductions in density of
macroinvertebrate community (Earl and Blinn 2003). The periphyton community was
classified in Nascente as good, in all seasons, opening the possibility for some degree of
sensitivity to that particular event (ashes runoff). Earl & Blinn (2003), found small changes
in periphyton community mostly change in community assemblage to smaller more adnate
taxa not considering the total periphyton biomass being significantly affected by wildfires.
Previous studies on WWTP (Waiser et al., 2010; Drury et al., 2013; Perujo et al.,
2016) reports an increase in nutrients concentration (PO4, NH4, NH3, TP and TN)
downstream the effluent, as observed in this study at Bustelo sites, where the highest
values occurred for all samples seasons, both in water and sediment samples. Curiously, all
these parameters were found to be in higher quantity in water samples, than on sediments,
probably due to the high flow of the discharge that does not allow to settle down in
sediments. Contrary to what was expected, there were no significant differences in BOD5
and CDOC concentrations relatively to the other 2 sites, showing that the WWTP was
working properly and not dumping dangerous amounts of organic matter and dissolved
carbon into the river. The literature related to European WFD (STAR project) monitoring of
running water has been using phytobenthos for decades and benefit from existing
information on the sensitivity of indicator taxa to various impairments. They are
incorporated in the methodological approaches, standard and practice of water
management due to their known sensitivity to eutrophication/organic pollution, acidity,
salinity and current velocity (Brabec and Sczoszkiewick, 2006; Besse-Lototskaya et al.,
2006). Several studies performed to different river typologies, in Europe, have compared
the discriminant power of different biological communities to detect change and conclude
that benthic diatoms and macroinvertebrate assemblages were reliable indicators of
changes in nutrient status, eutrophication and acidification (Johnson et al., 2016a).
Furthermore Johnson et al., (2016b) regarding the organism-response relations to
environmental gradients, advanced that diatoms would respond strongly when the sites
became more impacted with nutrient enriched and that diatoms would be an early warning
indicator in detection of early changes in nutrients levels. Having all these in consideration,
in our study, the periphyton community did not show any early warning capacity in

71
discriminating the presence of nutrient enrichment even in small amounts (our case) and
still classified Bustelo as good in winter and spring and high in summer.
Palhal was expected to be impacted by runoff rich in metals from the deactivated
mine as already been confirmed by Vidal et al., (2012) and Nunes et al., (2003).
Comparatively to previous studies (Vidal et al., 2012; Nunes et al., 2003) Cd and Zn were
below detection level, but Pb, S, Cu and Al were quantified in higher quantities than in
previous studies. Metal were consistently observed at higher concentrations in sediment
than in water samples, supporting the idea that some are strongly bound to the sediments
(Morillo et al., 2004) and can persist for centuries (historic contamination) after the mine
closure (Byrne et al., 2013) and, still, the actual contamination resulting from deactivated
mine without a recovery plan to mitigate the effects on river communities (Vidal et al.,
2012).
From the ecological status evaluation point of view, in Palhal in summer, an
inversion of response pattern towards Bustelo can be observed, being the
macroinvertebrate community less discriminatory than benthic diatoms. Several studies
have shown that some of the metrics used in WFD approach (richness and EPT taxa) are
sensitive to metal contamination (Hickey and Clements, 1998; Mebane, 2001; Beasley and
Kneale, 2003), particularly in mining areas (Hoiland et al., 1994; Maret et al., 2003; Iwasaki
et al., 2009). However natural factors such elevation (Clements and Kiffney, 1995) or fine
sediment accumulation (Mebane, 2001), also change the response of such metrics.
Therefore the use of generic metrics will always produce confounding factors, and may
either over-or underestimate environmental quality, especially in multiple stress scenarios.
The solution to this problem could be the inclusion of stress-specific biotic indices as
suggested by Extence et al., (1999; 2013) or use fine-resolution community tools like
multivariate analysis.
In contrast to WFD approach, community structure analysis (multivariate analysis)
enables the extraction of gradients that explain much better the proximity or separation
among groups of samples and their relationship with abiotic parameters, one of the most
criticism presented to the WFD approach that does not establish a cause-effect
relationship. In general, when comparing both approaches (WFD and multivariate analysis)
72
for macroinvertebrates and periphyton can be concluded easily that multivariate analysis
were able to separate clearly the sampling sites, except for Nascente in winter where the
ecological status was superimposed by the physico-chemical parameters (Table 5) and not
by the biological communities itself due to WFD rule, one out - all out, and both
methodologies agree with the final results obtained. Seasonality were important for WFD
approach (since the ecological status varies according with the season sampled) but not in
multivariate analysis, being the most important the sampling site and the communities
associated with it (Figs. 10,11,12,13) disregarding the sampling season. Multivariate
analysis discriminate unanimously Bustelo and Palhal as impacted sites independent from
the biological community used (macroinvertebrate and periphyton). Looking further into
the macroinvertebrate community assemblage composition, some pollution-sensitive taxa
associated with Nascente sites were identified. The EPT richness was very high in the river
source along the seasons, reached the maximum value in summer. EPT species richness are
significantly higher in undisturbed sites (Compin & Céréghino, 2003), being the Plecoptera
order one of the most sensitive to water pollution (Lazaridou-Dimitriadou, 2002),
supporting the Nascente site as a reference zone with little human impact. At Bustelo and
Palhal the values were stable but very low, as expected since the community is influenced
by stressed and low oxygenated sites (Pastuchová, 2006). In Bustelo and Palhal were found
a variety of organisms tolerants to pollution such us Chironomidae, among others Diptera,
Oligochaeta and Gastropoda. Species of Oligochaeta are frequently associated with
organically polluted sites as well as Chironomidae that are in environments with low
concentrations of dissolved oxygen (high organic matter) (Rosa et al., 2014) (Oliveira et al.,
2010). Concerning the same approach to periphyton, different taxa founded in polluted
sites, as Gomphonema, Nitzschia and Navicula, are known to be tolerant to organic and
metal pollution (Almeida, 2001; Kwandrans et al., 1998; Bere & Mangadze, 2014) preferring
eutrophic environments and relatively low oxygen saturation (Van Dam at al., 1994; Dalu
et al., 2017). Palhal in spring and summer was associated with CPLA, CMEN, FBCP and
MVAR that, according to Van Dam (1994), are classified as facultatively nitrogen-
heterotrophic taxa, needing periodically elevated concentrations of bound nitrogen and
normally founded in eutrophic places. The periphyton community at Nascente was mostly
73
composed by species known to be indicators of oligotrophic and mesotrophic waters (Van
Dam, 1994) and intolerants to nutrient contamination.
Analyzing the multivariate community structure analysis among biological
communities (macroinvertebrates, periphyton and Bacteria) studied using this
methodology and its comparison in order to stress about the bacterial community response
as biological indicator using fast screening methodology like FCM. Both the
macroinvertebrates and periphyton community individualized the river source (Nascente),
in all sampling seasons, as clean and on the other hand associated, also for all seasons,
Palhal and Bustelo with metals and anthropogenic variables measured in water, lead (Pb)
plus total sulfur and ammonia and ammonium, respectively. Bacteria also associate
Nascente as clean sampling site in all seasons but include also Bustelo and Palhal, in winter
as free of impacts. The multivariate periphyton community analysis considers both Palhal
and Bustelo, in winter, as contaminated as Palhal and Bustelo in any other season.
Meanwhile, macroinvertebrates place Palhal_w and Bustelo_w very near the reference
position (Fig. 10) showing that its relationship with contamination is weak, but present
(WFD classified Bust_w as moderate signaling the contamination presence). Multivariate
analysis on Bacteria (Fig. 16) allows to clear identify Bustelo and Palhal as contaminated in
spring and summer associated HNA bacteria (high nucleic acid content bacteria), in this
case, measured on sediment elutriate. Zhao et al., (2010) and Ke et al., (2015) already
suggest that microorganisms in water column or in sediments in aquatic environments can
functioning as an instantaneous indicator of water quality respond positively and strongly
to total phosphorus, total nitrogen and ammonium-nitrogen contents and can be also
strongly associated with metals (Cao et al., 2006). Futhermore, Córdova-Kreylos et al.,
(2006) found that sediment microbial total biomass is positively correlated with organic
carbon or total nitrogen in sediments. Sediment microorganisms can work also as efficient
indicators of long-term impact of impact in the overlying water column (US EPA 2002,
Goodrich et al., 2005). The data found in this work fully confirms the literature and found
positive correlation between the HNA, in sediments, and total phosphorous, phosphates,
increase in conductivity, all in water, and the manganese, in elutriates. HNA bacteria as
representative of the most active part and contribute to most of the total microbial

74
production (Gasol et al., 1999; Lebaron et al., 2001). From the point of view of using FCM
for fast screening of bacterial communities changes in water quality evaluation, LNA
bacteria was previously considered as not being active or even dead, but thereafter were
shown to be viable and active in low nutrient environment by several authors (Prest et al.,
2013; Servais et al., 2003; Longnecker et al., 2005; Bouvier et al., 2007 and Wang et al.,
2009) and is confirmed by data obtained, being LNA both in water and sediment associated
with Nascente where the contamination was shown to be minimum in comparison with
other sampling sites. On the other hand, HNA is considered to be more dynamic and
sensitive to changes than LNA, what was completely corroborated by the results presented
and as shown, highly related with increased of nutrients especially phosphates,
conductivity and manganese (see Fig.17).
Therefore the discriminant power of the Bacteria community analyzed by FCM was
not perfect but provides responses good enough to continue the search and invest more
time and energy in refinement of this fast screening methodology as a tool to complement
and prioritize sampling sites requiring further intervention and WFD appliance. It would be
quite interesting also to compare the results obtained and the results from DGGE analysis
and more efforts would also be put on in order to refine the methodology and solve the
problems raised so far. A trial approach of performing multivariate analysis merging all the
biological communities surveyed (macroinvertebrates, periphyton and bacteria) does not
allow to understand the relationships between the communities and environmental
variables selected by forward selection in canonical analysis as clearly as performing them
individually.
In rivers, the contamination of water column is very variable depending on the river
flow, turbulence and dilution factor and hence assessment of ecological status should
consider the sediment matrix. Sediment can contain several amounts of organic and
inorganic material bounded to particles, but when disturbed by stormnwater runoff, they
can turn bioavailable as an important pollution source for both benthic and planktonic
organisms communities (Burton, 2002) Elutriate sediment toxicity test are widespread
useful tools to address toxicity of complex environmental samples (USEPA 2001; Vidal et

75
al., 2012). Therefore this study comprises sediment elutriate quantifications and analysis
in addition to the analysis on running water requested by WFD.

76
2.5. References
Alba‐Tercedor, J., & Sánchez‐Ortega, A. (1988). Un método rápido y simple para evaluar la
calidad biológica de las aguas corrientes basado en el de Hellawell (1978). A simple
and quick method to evaluate biological quality of running freshwater based on
Hellawell (1978). Limnética, 4, 51–56
Albrecht, J. (2013). The Europeanization of water law by the Water Framework Directive: A
second chance for water planning in Germany. Land Use Policy, 30(1), 381–391.
http://doi.org/10.1016/j.landusepol.2012.04.009
Allan, J. D., Castillo, M. M. (2007). Stream Ecology - Structure and function of running waters
(2nd ed.). Springer Netherlands. http://doi.org/10.1007/978-1-4020-5583-6
Almeida, S. F. P. (2001). Use of diatoms for freshwater quality evaluation in Portugal.
Limnetica, 20(2), 205–213.
Altenburger, R., Ait-Aissa, S., Antczak, P., Backhaus, T., Barceló, D., Seiler, T. B., … Brack, W.
(2015). Future water quality monitoring - Adapting tools to deal with mixtures of
pollutants in water resource management. Science of the Total Environment, 512–513,
540–551. http://doi.org/10.1016/j.scitotenv.2014.12.057
APHA. (1995). Standard methods for the examination of water and wastewater.
Washington, DC: American Public Health Association
APHA. (1989). Standard methods for the examination of water and wastewater. (A. P. H.
Association, Ed.) (17 edition). Washington, DC, USA.
Bere, T., & Mangadze, T. (2014). Diatom communities in streams draining urban areas:
Community structure in relation to environmental variables. Tropical Ecology, 55, 271-
281. Beasley, G., & Kneale, P. E. (2003). Investigating the influence of heavy metals on
macro-invertebrate assemblages using Partial Cononical Correspondence Analysis
(pCCA). Hydrology and Earth System Sciences, 7, 221–233.
http://doi.org/10.5194/hess-7-221-2003
Besse-Lototskaya, A., P. F. M. Verdonschot & J. A. Sinkeldam, (2006). Uncertainty in diatom
assessment: Sampling, identification and counting variation. Hydrobiologia 566: 247–
260. http://doi.org/10.1007/s10750-006-0092-5

77
Birk, S., Bonne, W., Borja, A., Brucet, S., Courrat, A., Poikane, S., … Hering, D. (2012). Three
hundred ways to assess Europe’s surface waters: An almost complete overview of
biological methods to implement the Water Framework Directive. Ecological
Indicators, 18, 31–41. http://doi.org/10.1016/j.ecolind.2011.10.009
Bouvier, T., Del Giorgio, P.A., Gasol, J.M. (2007). A comparative study of the cytometric
characteristics of high and low nucleic-acid bacterioplankton cells from different
aquatic ecosystems. Environ. Microbiol. 9 (8), 2050-2066. http://doi.org/
10.1111/j.1462-2920.2007.01321.x
Brabec, K., & Szoszkiewicz, K. (2006). Macrophytes and diatoms - Major results and
conclusions from the STAR project. In M. T. Furse, D. Hering, K. Brabec, A. Buffagni, L.
Sandin, & P. F. M. Verdonschot (Eds.), Hydrobiologia, 566, 175–178. Dordrecht:
Springer Netherlands. http://doi.org/10.1007/s10750-006-0097-0
Brack, W., Dulio, V., Ågerstrand, M., Allan, I., Altenburger, R., Brinkmann, M., … Vrana, B.
(2017). Towards the review of the European Union Water Framework Directive:
Recommendations for more efficient assessment and management of chemical
contamination in European surface water resources. Science of The Total
Environment, 576, 720–737. http://doi.org/10.1016/j.scitotenv.2016.10.104
Beasley, G., and Kneale, P. E. (2003). Investigating the influence of heavy metals on macro-
invertebrate assemblages using partial canonical correspondence analysis
(pCCA). Hydrology and Earth System Sciences 7, 221–233.
Burton J, G.A. 2002. Sediment quality criteria in use around the world. Limnology 3(2):65-
76. https://doi.org/10.1007/s102010200008
Byrne, P., Reid, I., & Wood, P. J. (2013). Stormflow hydrochemistry of a river draining an
abandoned metal mine: The Afon Twymyn, central Wales. Environmental Monitoring
and Assessment, 185(3), 2817–2832. http://doi.org/10.1007/s10661-012-2751-5
Campos, I., Abrantes, N., Vidal, T., Bastos, A. C., Gonçalves, F., & Keizer, J. J. (2012).
Assessment of the toxicity of ash-loaded runoff from a recently burnt eucalypt
plantation. European Journal of Forest Research, 131(6), 1889–1903.
http://doi.org/10.1007/s10342-012-0640-7
Chaves, M. L., Costa, J. L., Chainho, P., Costa, M. J., & Prat, N. (2006). Selection and

78
validation of reference sites in small river basins. Hydrobiologia, 573(1), 133–154.
http://doi.org/10.1007/s10750-006-0270-5
Cao, Y., Cherr, G.N., Cordova-Kreylos, A.L., Fan, T.M., Green, P.G., Higashi, R.M., et al.,
(2006). Relationships between sediment microbial communities and pollutants in two
California salt marshes. Microb. Ecol. 52 (4), 619–633. http://doi.org/10.1007/s00248-
006-9093-1
Cemagref (1982). “Etude dês méthodes biologiques d’appréciation quantitative de la
qualité des eaux“. Rapport Q. E. Lyon. Agence de l’Eau Rhone-Mediterranee-Corse-
Cemagref. Lyon. France.
Chessmann, B. C., & McEvoy, P. K. (1998). Towards diagnostic biotic indices for river
macroinvertebrates. Hydrobiologia. 354(2), 169-182. http://doi.org/
10.1023/A:1003142819625
Clements, W. H., and Kiffney, P. M. (1995). The influence of elevation on benthic
community responses to heavy metals in Rocky Mountain streams. Canadian Journal
of Fisheries and Aquatic Sciences 52, 1966–1977. http://doi.org/10.2307/2641120
Compin A, Céréghino R. 2003. Sensitivity of aquatic insects species richness to disturbance
in the Adour-Garonne stream system (France). Ecol Indic. 3:135–142.
https://doi.org/10.1016/S1470-160X(03)00016-5
Córdova-Kreylos, A.L., Cao, Y.P., Green, P.G., Hwang, H.M., Kuivila, K.M., LaMontagne,
M.G., et al., (2006). Diversity, composition, and geographical distribution of microbial
communities in California salt marsh sediments. Appl. Environ. Microbiol. 72 (5), 3357
3366. http://doi.org/10.1128/AEM.72.5.3357–3366.2006
Dalu, T., Wasserman, R. J., Magoro, M. L., Mwedzi, T., Froneman, P. W., & Weyl, O. L. F.
(2017). Variation partitioning of benthic diatom community matrices: Effects of
multiple variables on benthic diatom communities in an Austral temperate river
system. Science of the Total Environment, 601–602, 73–82.
http://doi.org/10.1016/j.scitotenv.2017.05.162
Drury, B., Rosi-Marshall, E., & Kelly, J. J. (2013). Wastewater treatment effluent reduces the
abundance and diversity of benthic bacterial communities in urban and suburban
rivers. Applied and Environmental Microbiology, 79(6), 1897–1905.

79
http://doi.org/10.1128/AEM.03527-12
Earl, S. R., & Blinn, D. W. (2003). Effects of wildfire ash on water chemistry and biota in
south-western U.S.A. streams. Freshwater Biology, 48(6), 1015–1030.
http://doi.org/10.1046/j.1365-2427.2003.01066.x
Ebina, J., Tsutsui, T. and Shirai, T. (1983) Simultaneous Determination of Total Nitrogen and
Total Phosphorus in Water Using Peroxodisulfate Oxidation. Water Research, 17,
1721-1726. http://dx.doi.org/10.1016/0043-1354(83)90192-6
Edington, J. M., & Hildrew, A. G. (2005). A revised key to the caseless caddis larvae of the
British Isles. Cumbria, UK: Freshwater Biological Association
Elliott, J. M., & Humpesch, U. H. (2010). Mayfly larvae (Ephemeroptera) of Britain and
Ireland: Keys and a review of their Ecology. Scientific Publication No. 66. Ambleside,
UK: Freshwater Biological Association
Erba, S., Furse, M. T., Balestrini, R., Christodoulides, A., Ofenböck, T., van de Bund, W., …
Buffagni, A. (2009). The validation of common European class boundaries for river
benthic macroinvertebrates to facilitate the intercalibration process of the Water
Framework Directive. Hydrobiologia, 633(1), 17–31. http://doi.org/10.1007/s10750-
009-9873-y
Extence, C. A., Balbi, D. M., and Chadd, R. P. (1999). River flow indexing using British benthic
macroinvertebrates: a framework for setting hydroecological objectives. Regulated
Rivers: Research and Management 15, 545–574 http://doi.org/10.1002/(SICI)1099-
1646(199911/12)15:6<545::AID-RRR561>3.0.CO;2-W
Extence, C. A., Chadd, R. P., England, J., Dunbar, M. J., Wood, P. J., and Taylor, E. D. (2013).
The assement of fine sediment accumulation in rivers using macro-invertebrate
community response. River Research and Applications 29, 17–55
http://doi.org/10.1002/rra.1569
Gabriel, K. R. (2013). Biometrika Trust Goodness of Fit of Biplots and Correspondence
Analysis. Biometrika, 89(2), 423–436. http://www.jstor.org/stable/4140587
Gasol JM, Zweifel UL, Peters F, Fuhrman JA, Hagstrom A. (1999). Significance of size and
nucleic acid content heterogeneity as measured by flow cytometry in natural
planktonic bacteria. Appl Environ Microbiol. 65: 4475–4483.

80
Gauch, H. G. (1982). Multivariate analysis in community ecology, New York, Cambridge
University Press.
Goodrich, C., Huggins, D.G., Everhart, R.C., Smith, E.F. (2005). Summary of state and
national biological and physical habitat assessment methods with a focus on USEPA
region 7 states. CPCBA (Central Plains Center for Bio-assessment) Report No. 135 of
the Kansas Biological Survey. pp. 1–2.
Hauer, F. R. ; Resh, V. H. (1996). Benthic macroinvertebrates. In Methods in Stream Ecology
(pp. 339–369). San Diego: Academic Press.
Hickey, C. W., & Clements, W. H. (1998). Effects of Heavy Metals on Benthic
Macroinvertebrate Communities in New Zealand Streams. Environmental Toxicology
and Chemistry, 17(11), 2338. http://doi.org/10.1897/1551-
5028(1998)017<2338:EOHMOB>2.3.CO;2
Hoiland, W. K., Rabe, F. W., and Biggam, R. C. (1994). Recovery of macroinvertebrate
communities from metal pollution in the South Fork and mainstem of the Coeur
d’Alene River, Idaho. Water Environment Research 66, 84–88.
https://doi.org/10.2175/WER.66.1.11
Hosseini, M., Geissen, V., González-Pelayo, O., Serpa, D., Machado, A. I., Ritsema, C., &
Keizer, J. J. (2017). Effects of fire occurrence and recurrence on nitrogen and
phosphorus losses by overland flow in maritime pine plantations in north-central
Portugal. Geoderma, 289(Supplement C), 97–106. http://doi.org/10.1016/j.geoderma
.2016.11.033
Hynes, H. B. N. (1993). A key to the adults and nymphs of the British stoneflies (Plecoptera)
with notes on their ecology and distribution. Scientific Publication No. 17. Ambleside,
UK: Freshwater Biological Association.
INAG IP (2008). Manual para a avaliação biológica da qualidade da água em sistemas fluviais
segundo a Diretiva Quadro da Água – Protocolo de amostragem e análise para os
macroinvertebrados. Ministério do Ambiente, Ordenamento do Território e do
Desenvolvimento Regional. Instituto da Água, I.P.
INAG IP (2008a). Manual para a avaliação biológica da qualidade da água em sistemas
fluviais segundo a Diretiva Quadro da Agua - Protocolo de amostragem e análise para

81
o Fitobentos - Diatomáceas. Ministério do Ambiente, Ordenamento do Território e do
Desenvolvimento Regional. Instituto da Água, I.P.
INAG, I.P. (2008b). Tipologia de Rios em Portugal Continental no âmbito da implementação
da Directiva Quadro da Água. I - Caracterização abiótica. Ministério do Ambiente, do
Ordenamento do Território e do Desenvolvimento Regional. Instituto da Água, I.P.
INAG. (2009). Critérios para a classificação do estado das massas de água superficiais - rios
e albufeiras. Ministério do Ambiente, do Ordenamento do Território e do
Desenvolvimento Regional. Instituto da água I.Pl.
Iwasaki, Y., Kagaya, T., Miyamoto, K.-I., & Matsuda, H. (2009). Effects of heavy metals on
riverine benthic macroinvertebrate assemblages with reference to potential food
availability for drift-feeding fishes. Environmental Toxicology and Chemistry, 28(2),
354–363. http://doi.org/10.1897/08-200.1
Jaímez-Cuéllar, P., Vivas, S., Bonada, N., Robles, S., Mellado, A., Aĺvarez, M., … Alba-
Tercedor, J. (2002). Protocolo GUADALMED (PRECE). Limnetica, 21(3–4), 187–204.
http://doi.org/10.1007/s00203-006-0174-9
Johnson, R. K., D. Hering, M. T. Furse & R. T. Clarke, 2006a. Detection of ecological change
using multiple organism groups: metrics and uncertainty. Hydrobiologia 566: 115–137.
http://doi.org/10.1007/s10750-006-0101-8
Johnson, R. K., D. Hering, M. T. Furse & P. F. M. Verdonschot, 2006b. Indicators of ecological
change: comparison of the early response of four organism groups to stress gradients.
Hydrobiologia 566: 139–152. http://doi.org/10.1007/s10750-006-0100-9
Ke, X., Wang, C., Jing, D., Zhang, Y., & Zhang, H. (2015). Assessing water quality by ratio of
the number of dominant bacterium species between surface/subsurface sediments in
Haihe River Basin. Marine Pollution Bulletin, 98(1–2), 267–273.
http://doi.org/10.1016/j.marpolbul.2015.06.003
Krammer, K., and Lange-Bertalot, H. (1986). ‘Su¨ßwasserflora von Mitteleuropa.
Baccillariophyceae 1 Teil: Naviculaceae’ (Gustav Fischer Verlag: Stuttgart.)
Krammer, K., and Lange-Bertalot, H. (1988). ‘Su¨ßwasserflora von Mitteleuropa.
Baccillariophyceae 2 Teil: Bacillariaceae, Epithemiaceae, Surirellaceae’. (Gustav Fischer
Verlag: Stuttgart.)

82
Krammer, K., and Lange-Bertalot, H. (1991a). ‘Su¨ßwasserflora von Mitteleuropa.
Baccillariophyceae 3 Teil: Centrales, Fragilariaceae, Eunotiaceae’. (Gustav Fischer
Verlag: Stuttgart.)
Krammer, K., and Lange-Bertalot, H. (1991b). ‘Su¨ßwasserflora von Mitteleuropa.
Baccillariophyceae 4 Teil: Achnanthaceae, Kritische Erga¨nzungen zu Navicula
(Lineolatae) und Gomphonema’. (Gustav Fischer Verlag: Stuttgart.)
Kristensen, E., & Andersen, F. (1987). Determination of organic carbon in marine
sediments: a comparison of two CHN-analyzer methods. Journal of Experimental
Marine Biology and Ecology, 109(1), 15–23. http://doi.org/10.1016/0022-
0981(87)90182-1
Kwandrans, J., Eloranta, P., Kawecka, B., Wojtan, K. (1998). Use of benthic diatom
communities to evaluate water quality in rivers of southern Poland. Journal of Applied
Phycology, 10(2), 193-201. https://doi.org/10.1023/A:1008087114256
Lazaridou-Dimitriadou M. (2002). Seasonal variation of the water quality of rivers and
streams of eastern Mediterranean. Web Ecology. ; 3:20–32. https://doi.org/10.5194
Lebaron P, Servais P, Agogue H, Courties C, Joux F. (2001). Does the high nucleic acid
content of individual bacterial cells allow us to discriminate between active cells and
inactive cells in aquatic systems? Appl Environ Microbiol 67: 1775–1782.
http://doi.org/10.1128/AEM.67.4.1775-1782.2001
Lecointe, C., Coste, M., and Prygiel, J. (1993). ‘‘Omnidia’’: software for taxonomy,
calculation of diatom indices and inventories management. Hydrobiologia 269-270,
509–513. doi:10.1007/BF00028048
Levkov, Z. (2009). Diatoms of Europe: Diatoms of the European Inland Waters and
Comparable Habitats. (A.R.G. Gantner Verlag K.G: Ruggell, Liechtenstein.)
Lind, O. T. (1979). Handbook of common methods in Limnology. The C.V. Mosby Company,
St. Louis, USA.
Longnecker, K., Sherr, B.F., Sherr, E.B. (2005). Activity and phylogenetic diversity of
bacterial cells with high and low nucleic acid content and electron transport system
activity in an upwelling ecosystem. Appl. Environ. Microbiol. 71 (12), 7737-7749.
http://doi.org/10.1128/AEM.71.12.7737

83
Lydy, M. J., Crawford, C. G., & Frey, J. W. (2000). A comparasion of selected diversity,
similarity and biotic indices for detecting changes in benthic-invertebrate community
structure and stream quality. Archives of Environmental Contamination and
Toxicology,39, 469-479. https://doi.org/10.1007/s002440010129
M.G., et al., (2006). Diversity, composition, and geographical distribution of microbial
communities in California salt marsh sediments. Appl. Environ. Microbiol. 72 (5), 3357
3366. http://doi.org/10.1128/AEM.72.5.3357–3366.2006
Maksimovic, C., Calomino, F., Snoxell, J. (1996). Water supply systems: New Technologies.
Berlin, Germany: Springer-Verlag.
Maret, T. R., Cain, D. J., MacCoy, D. E., & Short, T. M. (2003). Response of benthic
invertebrate assemblages to metal exposure and bioaccumulation associated with
hard-rock mining in northwestern streams, USA. Journal of the North American
Benthological Society, 22(4), 598–620. http://doi.org/10.2307/1468356
Martinez-Haro, M., Beiras, R., Bellas, J., Capela, R., Coelho, J., Lopes, I., … Marques, J.
(2015). A review on the ecological quality status assessment in aquatic systems using
community based indicators and ecotoxicological tools: What might be the added
value of their combination? Ecological Indicators, 48, 8–16.
http://doi.org/10.1016/j.ecolind.2014.07.024
Mebane, C. A. (2001). Testing bioassessment metrics: macroinvertebrate, sculpin, and
salmonid responses to stream habitat, sediment, and metals. Environmental
Monitoring and Assessment 67, 293–322.
Morillo, J., Usero, J., & Gracia, I. (2004). Heavy metal distribution in marine sediments from
the southwest coast of Spain. Chemosphere, 55(3), 431–442.
http://doi.org/10.1016/J.CHEMOSPHERE.2003.10.047
Muyzer, G., de Waal, E. C., & Uitterlinden, A. G. (1993). Profiling of complex microbial
populations by denaturing gradient gel electrophoresis analysis of polymerase chain
reaction-amplified genes coding for 16S rRNA. Applied and Environmental
Microbiology, 59(3), 695–700. Retrieved from
http://www.ncbi.nlm.nih.gov/pmc/articles/PMC202176/
Nunes, M. L., Ferreira Da Silva, E., & De Almeida, S. F. P. (2003). Assessment of Water

84
Quality in the Caima and Mau River Basins (Portugal) using Geochemical and Biological
Indices. Water, Air, and Soil Pollution, 149(1), 227–250.
http://doi.org/10.1023/A:1025636106890
Nunes, M. P. (2007). Diagnóstico da qualidade ambiental das bacias do rio Mau e Caima.
Estudo da dinâmica dos processos naturais e antrópicos e definição de zonas
vulneráveis. Universidade de Aveiro.
Oliveira, V., Martins, R., Alves, R. (2010). Evaluation of water quality of an urban stream in
southeastern Brazil using Chironomidae larvae (Insecta: Diptera). Neotropical
Entomology, 39(6), 873-878. https://dx.doi.org/10.1590/S1519-566X2010000600004
Pander, J., & Geist, J. (2013). Ecological indicators for stream restoration success. Ecological
Indicators. Elsevier. http://doi.org/10.1016/j.ecolind.2013.01.039
Pastuchová, Z. (2006). Macroinvertebrate assemblages in conditions of low-discharge
streams of the Cerová vrchovina highland in Slovakia. Limnologica, 36(4), 241–250.
http://doi.org/10.1016/j.limno.2006.07.002
Pawley, S., Dobson, M., & Fletcher, M. (2011). Guide to the British freshwater
macroinvertebrates for biotic assessment. Cumbria, UK: Freshwater Biological
Association
Pereira, P., Cerdà, A., Úbeda, X., Mataix-Solera, J., Martin, D., Jordán, A., & Burguet, M.
(2013). Spatial models for monitoring the spatio-temporal evolution of ashes after fire
– a case study of a burnt grassland in Lithuania. Solid Earth, 4(1), 153–165.
http://doi.org/10.5194/se-4-153-2013
Perujo, N., Freixa, A., Vivas, Z., Gallegos, A. M., Butturini, A., & Romaní, A. M. (2016). Fluvial
biofilms from upper and lower river reaches respond differently to wastewater
treatment plant inputs. Hydrobiologia, 765(1), 169–183.
http://doi.org/10.1007/s10750-015-2411-1
Prest, E. I., Hammes, F., Kötzsch, S., van Loosdrecht, M. C. M., & Vrouwenvelder, J. S. (2013).
Monitoring microbiological changes in drinking water systems using a fast and
reproducible flow cytometric method. Water Research, 47(19), 7131–7142.
http://doi.org/10.1016/j.watres.2013.07.051
Rashed, M. N. (2001). Monitoring of environmental heavy metals in fish from nasser lake.

85
Environment International, 27(1), 27–33. http://doi.org/10.1016/S0160-
4120(01)00050-2
Raven, P. J., Holmes, N. T. H., Dawson, F. H., & Everard, M. (1998). Quality assessment using
River Habitat Survey data. Aquatic Conservation: Marine and Freshwater Ecosystems,
8(4), 477–499. http://doi.org/10.1002/(SICI)1099-0755(199807/08)8:4<477::AID-
AQC299>3.0.CO;2-KResearch 18:271-317.
Rosa, B. J., Rodrigues, F.V., de Oliveira, L., da Gama Alves, R. (2014). Chironomidae and
Oligochaeta for water quality evaluation in an urban river in southeastern Brazil.
Environmental monitoring and assessment, 186(11), 7771-7779.
http://doi.org/10.1007/s10661-014-3965-5
Rugenski, A. T., & Minshall, G. W. (2014). Climate-moderated responses to wildfire by
macroinvertebrates and basal food resources in montane wilderness streams.
Ecosphere, 5(3), 25. http://doi.org/10.1890/ES13-00236.1
segundo a Diretiva Quadro da Agua Protocolo de amostragem e análise para os
macroinvertebrados bentónicos. Ministério do Ambiente, Ordenamento do Território
e do Desenvolvimento Regional. Instituto da Agua, I.P.
Servais, P., Casamayor, E.O., Courties, C., Catala, P., Parthuisot, N., Lebaron, P. (2003).
Activity and diversity of bacterial cells with high and low nucleic acid content. Aquat.
Microb. Ecol. 33, 41-51. http://doi.org/10.3354/ame033041
Silva, V., Pereira, J. L., Campos, I., Keizer, J. J., Gonçalves, F., & Abrantes, N. (2015). Toxicity
assessment of aqueous extracts of ash from forest fires. Catena, 135(Supplement C),
401–408. http://doi.org/10.1016/j.catena.2014.06.021
Spencer, C. N., Gabel, K. O., & Hauer, F. R. (2003). Wildfire effects on stream food webs and
nutrient dynamics in Glacier National Park, USA. Forest Ecology and Management,
178(1–2), 141–153. http://doi.org/10.1016/S0378-1127(03)00058-6
Sun, W., Xia, C., Xu, M., Guo, J., & Sun, G. (2017). Seasonality Affects the Diversity and
Composition of Bacterioplankton Communities in Dongjiang River, a Drinking Water
Source of Hong Kong. Frontiers in Microbiology, 8, 1644.
http://doi.org/10.3389/fmicb.2017.01644
86
Sundermann, A., Lohse, S., Beck, L., & Haase, P. (2007). Key to the larval stages of aquatic
true flies (Diptera), based on the operational taxa list for running waters in Germany.
Annales de Limnologie ‐ International Journal of Limnology, 43, 61–74
Tachet, H. (2000). Invértebrés d'eau douce: Systématique, biologie, écologie. Paris, France:
CNRS Editions
ter Braak CJF, Prentice IC. (1988). A theory of gradient analysis. Advances in Ecological
Research. 18, 271-317. https://doi.org/10.1016/S0065-2504(08)60183-X
ter Braak CJF. (1995). Data analysis in community and landscape ecology. In: Jongman RHG,
ter Braak CJF, Tongeren OFR, editors. Ordination. Cambridge: Cambridge University
Press. p 91-173.
USEPA. (2001). Methods for Collection, Storage and Manipulation of Sediments for
Chemical and Toxicological Analyses: Technical Manual. EPA 823-B-01-002. U.S.
Environmental Protection Agency, Office of Water, Washington D.C.
USEPA (United States Environmental Protection Agency) (2002). Summary of biological
assessment programs and biocriteria development for states, tribes, territories, and
interstate commissions: streams and Wadeable rivers, EPA report 822-R-02-048.
Van Dam, H., Mertens, A., & Sinkeldam, J. (1994). A coded checklist and ecological indicator
values of freshwater diatoms from The Netherlands. Netherland Journal of Aquatic
Ecology, 28(1), 117–133. http://doi.org/10.1007/BF02334251
Vidal, T., Pereira, J. L., Abrantes, N., Soares, A. M. V. M., & Gonçalves, F. (2012).
Ecotoxicological Assessment of Contaminated River Sites as a Proxy for the Water
Framework Directive: an Acid Mine Drainage Case Study. Water, Air, & Soil Pollution,
223(9), 6009–6023. http://doi.org/10.1007/s11270-012-1335-x
Voulvoulis, N., Arpon, K. D., & Giakoumis, T. (2017). The EU Water Framework Directive:
From great expectations to problems with implementation. The Science of the Total
Environment, 575, 358–366. http://doi.org/10.1016/j.scitotenv.2016.09.228
Waiser, M. J., Tumber, V., & Holm, J. (2011). Effluent-dominated streams. Part 1: Presence
and effects of excess nitrogen and phosphorus in Wascana Creek, Saskatchewan,
Canada. Environmental Toxicology and Chemistry, 30(2), 496–507.
http://doi.org/10.1002/etc.399
87
Wallace, I. D., Wallace, B., & Philipson, G. N. (2003). Keys to the case‐bearing caddis larvae
of Britain and Ireland. Freshwater Biological Association.
Wallace, J. B., Grubaugh, J. W., & Whiles, M. R. (1996). Biotic indices and stream ecosystem
processes: results from an experimental study. Ecological Applications, 6(1), 140-151.
Wang, Y., Hammes, F., Boon, N., Chami, M., & Egli, T. (2009). Isolation and characterization
of low nucleic acid (LNA)-content bacteria. The ISME Journal, 8, 889–902.
http://doi.org/10.1038/ismej.2009.46
Werum, M., and Lange-Bertalot, H. (2004). ‘Iconographia Diatomologica: Annotated
Diatom Micrographs.’ (A.R.G. Gantner Verlag K.G: Ruggell, Liechtenstein.)
Zelinka, M. & P. Marvan, 1961. Zur Pra¨zisierung der biologischen Klassifikation der
Reinheit fließender Gewa¨sser. Archiv Fur Hydrobiologie 57: 389–407
Zhao, L.D., Zhu, L., Liu, G. (2010). Relationships between sedimentary microbial
communities and nutrient factors in Luoma Lake. In: The 4th International Conference
on Bioinformatics and Biomedical Engineering (iCBBE 2010). Chengdu, China. pp. 1–4.

88

89
Chapter 3 - Final remarks
Since the rise of industrialization has occurred that freshwater ecosystems have been
threatened. The overexploitation of this resource for all types of human activities had
devastating consequences for the biodiversity that lives in it (Maksimovic et al., 1996; Allan
& Castillo, 2007). For that reason, the European Union reached an agreement and
implemented the Water Framework Directive (WFD) in 2000, to stimulate water quality
improvement and contribute to the management of all surface waters and groundwaters
(van Puilenbroek et al., 2015). As an aim of WFD to reach good ecological status by 2015 or
2027 at the latest (Voulvoukis et al., 2017), the Member States have dedicated a lot of work
in the optimization and harmonization of techniques and methodologies. However, WFD is
very complex, methodologies are time-consuming and costly, and barely provide a clear
view of cause-effects relationships. Thus, it is important to find new complementary
methodologies to simplify the technical complexity of WFD methodologies.
In order to develop a rapid and cost-effective methodology, we proposed the study of
bacteria community by flow cytometry, as a possible bioindicator for water quality
assessment. By choosing sites with different environmental impacts, and studying them
throughout the seasons, we were able to better understand how the bacterial abundance
differ from place to place. One of the aims of this work was to study the bacterial
abundance also by DGGE, and compare the two techniques. This part was not possible to
present, due to difficulties in protocols appliance (DNA extraction protocol and
temperature cycles) and reagent contaminations.
The use of multivariate analysis in the addition to the methodology WFD application
to Caima river allowed to conclude that the river has good ecological status in river source,
and not so good in impacted sites (Bustelo and Palhal), as expected due to the different
sources of pollutants along the river WWTP, agricultural runoffs and mine drainage,
respectively. On the other hand, community structure analysis was more discriminatory,
allowing the study of spatial and temporal patterns with the factors that best explain the
species-environmental relation and identifying clearly the pollution sources in each
sampling site. Bacteria community analysis was also able to distinguish the majority of
impacted sites from clean sites, being clear the separation of LNA and HNA bacteria

90
community in sediment according to the different environmental stress. These results
showed that bacteria in sediment has more reliable information about the possible effects
that may arise, being a good indicator of long-term environmental impacts. Despite that,
further studies needed to recognize the applicability of this method, possibly
complemented with DGGE methodology.

91
Annex
Table A.1- Abbreviation (Abbr) list of macroinvertebrate taxa collected in Caima River for 3
sampling sites during the study period.
Abbr. Class/Order Family Nasc_w Bust_w Palh_w Nas_sp Bust_sp Palh_sp Nasc_s Bust_s Palh_s
Dytis Coleoptera Dytiscidae 4
Elmid Coleoptera Elmidae 4 3 46 32 5 24 51 3 13
Gyri Coleoptera Gyrinidae 3 1
Hydra Coleoptera Hydraenidae 3 4 2
Scirt Coleoptera Scirtidae 38 103 4
Athr Diptera Athericidae 6 1 6
Cert Diptera Ceratopogonidae 1 1 13 3
Chiro Diptera Chironomidae 19 88 77 277 819 139 270 3320 1421
Dixd Diptera Dixidae 3
Empd Diptera Empididae 3 3 2 6 8 1 3
Limn Diptera Limoniidae 1 1
Musc Diptera Anthomyiidae 4
Siml Diptera Simuliidae 4 1 2 1 8 18 59
Tipu Diptera Tipulidae 1 1
Baeti Ephemeroptera Baetidae 70 192 85 48 228 544 207 210 104
Caen Ephemeroptera Caenidae 242 291 1 399 285 300 705
EPH Ephemeroptera Ephemerellidae 5 66
Hept Ephemeroptera Heptageniidae 29 1 13
Lept Ephemeroptera Leptophlebiidae 20 19 109
Ancy Gastropoda Planorbidae 3 9 1 6 3 4
Phys Gastropoda Physidae 18 19
Aphel Heteroptera Aphelocheridae 2 6
Corix Heteroptera Corixidae 2 1
Aesh Odonata Aeshnidae 2 1 1 1 15 2
Calo Odonata Calopterygidae 1 1 2 1
Cord Odonata Cordulegastridae 5
Gomph Odonata Gomphidae 2 3 2 2 5 6 14 6
Hydrac Acari Hydracarina 2 1 28 35 9 40 87 48 550
Oligo Oligochaeta Oligochaeta 84 38 10 1 2 16
Duge Turbellaria Dugesiidae 3 1 1 4
Plana Turbellaria Planariidae 1 2
Tricl Turbellaria Tricladida n.i. 5 1
Leuct Plecoptera Leuctridae 4 21 392

92
Table A.1- Abbreviation (Abbr) list of macroinvertebrate taxa collected in Caima River for 3
sampling sites during the study period (cont).
Abbr. Class/Order Family Nasc_w Bust_w Palh_w Nas_sp Bust_sp Palh_sp Nasc_s Bust_s Palh_s
Nemou Plecoptera Nemouridae 15 46 21
PLEC Plecoptera Plecoptera n.i. 8 1
Erpo Hirudinea Erpobdellidae 8 2 5 12 1
Ecnom Trichoptera Ecnomidae 2
Hydrop Trichoptera Hydropsychidae 33 3 12 5 9 10 23 2 27
Hydrot Trichoptera Hydroptilidae 7 1 3
Lept Trichoptera Leptoceridae 1 1 1 15 16
Philo Trichoptera Philopotamidae 2 3 3 1
Polyc Trichoptera Polycentropodidae 2 29 5
Psyc Trichoptera Psychomyiidae 5 5
Rhyac Trichoptera Rhyacophilidae 1 13 7
Seri Trichoptera Sericostomatidae 113 1 214 2

93
Table A.2- Abbreviation (Abbr) list of periphyton taxa collected in Caima River for 3 sampling sites during the study period (continues next page)
Species Abbr. Nasc_w Bustelo_w Palhal_w Nas_Sp Bustelo_Sp Palhal_Sp Nascente_S Bustelo_S Palhal_S
Achnanthes conspícua A.Mayer ACON 40 4 15 2 3
Achnanthes minutissima Kützing var. minutíssima
AMIN 283 130 310 8 100
Anomoeoneis serians (de Breb.) Cleve var. brachysira (de Breb.) Kützing
ANON 8 2
Ceratoneis arcus Kützing CER 1 8
Cocconeis placentula Ehrenberg var. placentula
CPLA 18 44 2 67 1 4 126
Cyclotella meneghiniana Kützing CMEN 2 3 3 168
Cymbella tumida (Brebisson) Van Heurck CTUM 3 4
Diatoma mesodon (Ehr.) Kützing DMES 1 7 2 1
Encyonema minutum (Hilse in Rabh.) D. G. Mann
ENMI 2 2 7 6
Eunotia bilunaris ((Ehr.) Mills EBIL 26
Eunotia exigua (Breb.) Rabenhorst EEXI 5 4 2 8
Eunotia minor (Kützing) Grunow in Van Heurck
EMIN 12 6 1 19 17 5 79 1
Fragilaria biceps (Kützing) Lange- Bertalot FBCP 2
Fragilaria capucina Desmazieres var. vaucheriae (Kützing) Lange-Bertalot
FCVA 1 2
Fragilaria ulna (Nitzsch.) Lange-Bertalot var. ulna
FULN 6 13 1 2
Frustulia vulgaris (Thwaites) De Toni FVUL 6 13 3 3 1
Gomphonema acuminatum Ehr. var. coronata (Ehr.) W.Smith
GACO 1 1
Gomphonema gracile Ehr. GGRA 1 20

94
Species Abbr. Nasc_w Bustelo_w Palhal_w Nas_Sp Bustelo_Sp Palhal_Sp Nascente_S Bustelo_S Palhal_S Gomphonema parvulum (Kützing) Kützing var. parvulum f. parvulum
GPAR 10 53 1 9 4
Gomphonema pumilum (Grunow) Reichardt & Lange-Bertalot
GPUM 6 2
Melosira varians Agardh MVAR 17 1 14
Meridion circulare (Greville) C.A.Agardh var. circulare
MCIR 2 2
Navicula cryptocephala Kützing NCRY 8
Navicula cryptotenella Lange-Bertalot NCTE 4
Navicula gregaria Donkin NGRE 6 6
Navicula lanceolata (Agardh) Ehr. NLAN 4 2
Navicula rhynchocephala Kützing NRHY 1 1
Neidium dubium (Ehr.) Cleve NEDU 2 7 1
Nitzschia dissipata (Kützing) Grunow NDIS 1 1
Peronia fibula (de Brebisson et Arnott) Ross.
PERF 53 10 8
Pinnularia gibba Ehr. PGIB 4 1 2 1
Pinnularia microstauron (Ehr.) Cleve PMIC 8 2 1
Pinnularia subcapitata Gregory PSCA 18 4 21 2 1

95
Species Abbr. Nasc_w Bustelo_w Palhal_w Nas_Sp Bustelo_Sp Palhal_Sp Nascente_S Bustelo_S Palhal_S Planothidium frequentissimum (Lange-Bertalot) Lange-Bertalot
PLFR 4 1 49 5 6 84
Psammothidium subatomoides (Hustedt) Bukht. Et Round
PSAT 300 120 390
Reimeria sinuata (Gregory) Kociolek & Stoermer
RSIN 6 70
Sellaphora pupula (Kützing) Mereschkowsky
SPUP 1 5 2
Stauroneis phoenicenteron (Nitzsch.) Ehr. SPHO 1 6
Surirella angusta Kützing SANG 305 390 3 312 1
Surirella linearis W.M.Smith SLIN 8 14 3 1 1

96
Figure A.1- Total bacterial density in both water (left side) and sediment (right side) samples,
throughout the seasons, for Nascente, Bustelo and Palhal sites.
Nasc Bust Palh
0
100000
200000
300000
400000
Bacterial density in water
Winter Spring Summer
Nasc Bust Palh
0
500000
1000000
1500000
Bacterial density in sediment
Winter Spring Summer