Embed Size (px)
Citation preview
8
Crude Oil by EPR
Marilene Turini Piccinato, Carmen Luisa Barbosa Guedes and Eduardo Di Mauro
Universidade Estadual de Londrina (UEL) /Laboratório de Fluorescência e Ressonância Paramagnética Eletrônica (LAFLURPE)
Brazil
1. Introduction
Our goal was based on environment questions. Environmental accidents involving crude and by-product oils have motivated laboratory research to evaluate photodegradation in monitored environments, as well as the characterization of crude and by-product oils. EPR was the spectroscopic technique used as analysis tool.
2. What is EPR?
Electron paramagnetic resonance (EPR) or Electron spin resonance (ESR) is a high resolution spectroscopy that consists in energy absorption of microwave, for electron spin, in the presence of a magnetic field (Ikeya, 1993). As the name itself suggests, EPR is applied in samples containing some paramagnetic species or used as an investigative method, to verify the presence of some paramagnetic species. Paramagnetism is characteristic of species with a total magnetic moment different from zero.
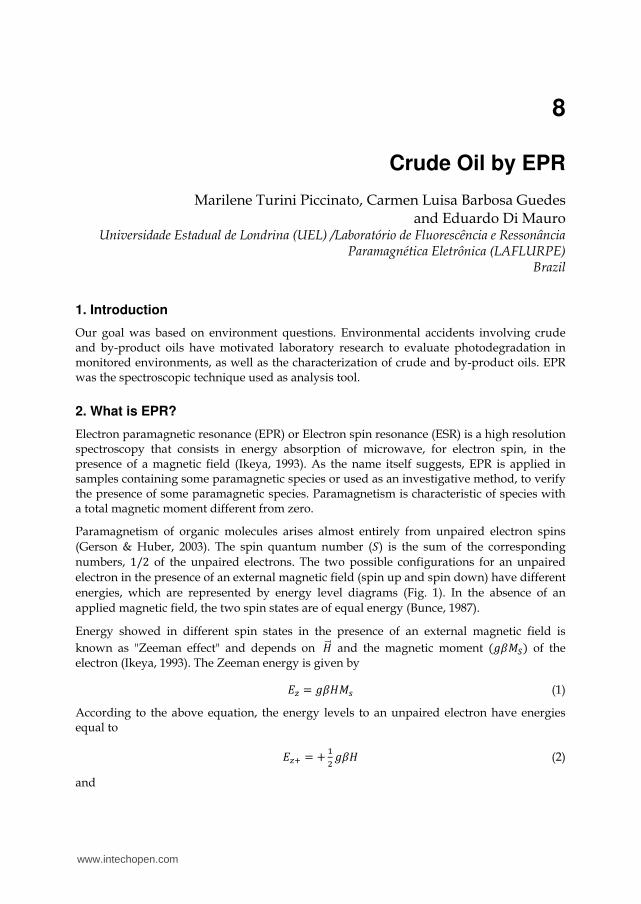
Paramagnetism of organic molecules arises almost entirely from unpaired electron spins (Gerson & Huber, 2003). The spin quantum number (鯨) is the sum of the corresponding numbers, な/に of the unpaired electrons. The two possible configurations for an unpaired electron in the presence of an external magnetic field (spin up and spin down) have different energies, which are represented by energy level diagrams (Fig. 1). In the absence of an applied magnetic field, the two spin states are of equal energy (Bunce, 1987).
Energy showed in different spin states in the presence of an external magnetic field is known as "Zeeman effect" and depends on 茎屎屎王 and the magnetic moment 岫訣紅警聴岻 of the electron (Ikeya, 1993). The Zeeman energy is given by
継佃 = 訣紅茎警鎚 (1)
According to the above equation, the energy levels to an unpaired electron have energies equal to
継佃袋 = + 怠態 訣紅茎 (2)
and
www.intechopen.com
Crude Oil Emulsions – Composition Stability and Characterization 148
継佃貸 = − 怠態 訣紅茎 (3)
corresponding to spin up (警鎚 = + 怠態) and spin down (警鎚 = − 怠態) respectively.
Fig. 1. Energy levels of a single electron in presence of an external magnetic field.
If an oscillating field of radiation in the microwave range acts on an unpaired electron in the presence of a magnetic field, transitions between two energy states are possible. The transition between energy levels will only occur when the following resonance condition is satisfied:
ℎ荒 = 訣紅茎 (4)
This happens when the incident radiation is equal to the separation between the Zeeman energy levels. ℎ荒 is the energy of the absorbed photon, 紅 is a constant for the electron, the Bohr magneton, 茎 is the external magnetic field, and 訣 (g-factor) is a constant characteristic of spin system (approximately 2.0 for organic free radicals) (Janzen, 1969). The g-factor is sensitive to the chemical neighborhood of the unpaired electron.
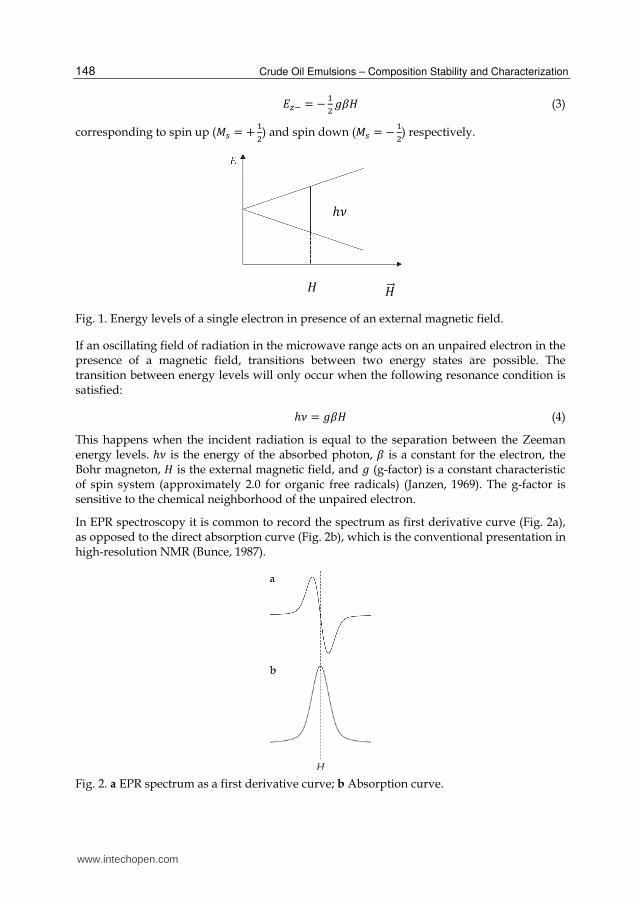
In EPR spectroscopy it is common to record the spectrum as first derivative curve (Fig. 2a), as opposed to the direct absorption curve (Fig. 2b), which is the conventional presentation in high-resolution NMR (Bunce, 1987).
Fig. 2. a EPR spectrum as a first derivative curve; b Absorption curve.
ℎ荒
茎屎屎王 茎
www.intechopen.com
Crude Oil by EPR 149
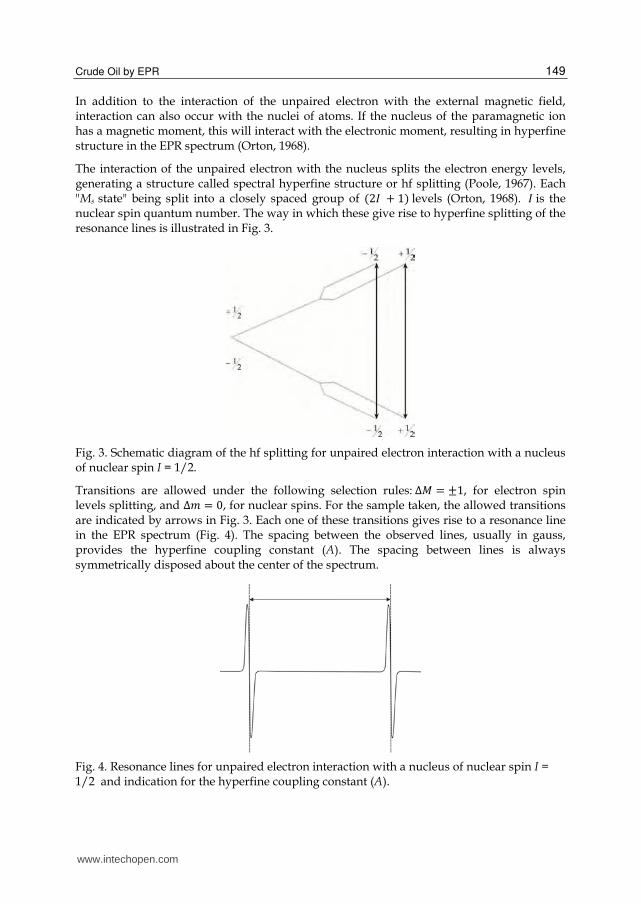
In addition to the interaction of the unpaired electron with the external magnetic field, interaction can also occur with the nuclei of atoms. If the nucleus of the paramagnetic ion has a magnetic moment, this will interact with the electronic moment, resulting in hyperfine structure in the EPR spectrum (Orton, 1968).
The interaction of the unpaired electron with the nucleus splits the electron energy levels, generating a structure called spectral hyperfine structure or hf splitting (Poole, 1967). Each "Ms state" being split into a closely spaced group of 岫に荊 + な岻levels (Orton, 1968). 荊is the nuclear spin quantum number. The way in which these give rise to hyperfine splitting of the resonance lines is illustrated in Fig. 3.
Fig. 3. Schematic diagram of the hf splitting for unpaired electron interaction with a nucleus of nuclear spin I = 1/2.
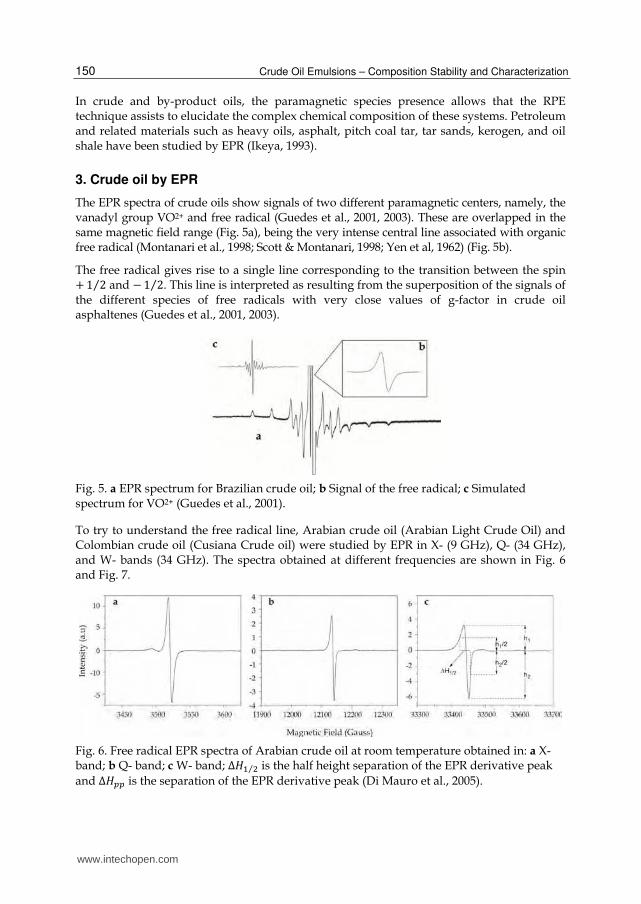
Transitions are allowed under the following selection rules:∆警 = ±な, for electron spin levels splitting, and ∆兼 = ど, for nuclear spins. For the sample taken, the allowed transitions are indicated by arrows in Fig. 3. Each one of these transitions gives rise to a resonance line in the EPR spectrum (Fig. 4). The spacing between the observed lines, usually in gauss, provides the hyperfine coupling constant (A). The spacing between lines is always symmetrically disposed about the center of the spectrum.
Fig. 4. Resonance lines for unpaired electron interaction with a nucleus of nuclear spin I = 1/2 and indication for the hyperfine coupling constant (A).
www.intechopen.com
Crude Oil Emulsions – Composition Stability and Characterization 150
In crude and by-product oils, the paramagnetic species presence allows that the RPE technique assists to elucidate the complex chemical composition of these systems. Petroleum and related materials such as heavy oils, asphalt, pitch coal tar, tar sands, kerogen, and oil shale have been studied by EPR (Ikeya, 1993).
3. Crude oil by EPR
The EPR spectra of crude oils show signals of two different paramagnetic centers, namely, the vanadyl group VO2+ and free radical (Guedes et al., 2001, 2003). These are overlapped in the same magnetic field range (Fig. 5a), being the very intense central line associated with organic free radical (Montanari et al., 1998; Scott & Montanari, 1998; Yen et al, 1962) (Fig. 5b).
The free radical gives rise to a single line corresponding to the transition between the spin + な に⁄ and − な に⁄ . This line is interpreted as resulting from the superposition of the signals of the different species of free radicals with very close values of g-factor in crude oil asphaltenes (Guedes et al., 2001, 2003).
Fig. 5. a EPR spectrum for Brazilian crude oil; b Signal of the free radical; c Simulated spectrum for VO2+ (Guedes et al., 2001).
To try to understand the free radical line, Arabian crude oil (Arabian Light Crude Oil) and Colombian crude oil (Cusiana Crude oil) were studied by EPR in X- (9 GHz), Q- (34 GHz), and W- bands (34 GHz). The spectra obtained at different frequencies are shown in Fig. 6 and Fig. 7.
Fig. 6. Free radical EPR spectra of Arabian crude oil at room temperature obtained in: a X- band; b Q- band; c W- band; Δ茎怠 態⁄ is the half height separation of the EPR derivative peak and ∆茎椎椎 is the separation of the EPR derivative peak (Di Mauro et al., 2005).
www.intechopen.com
Crude Oil by EPR 151
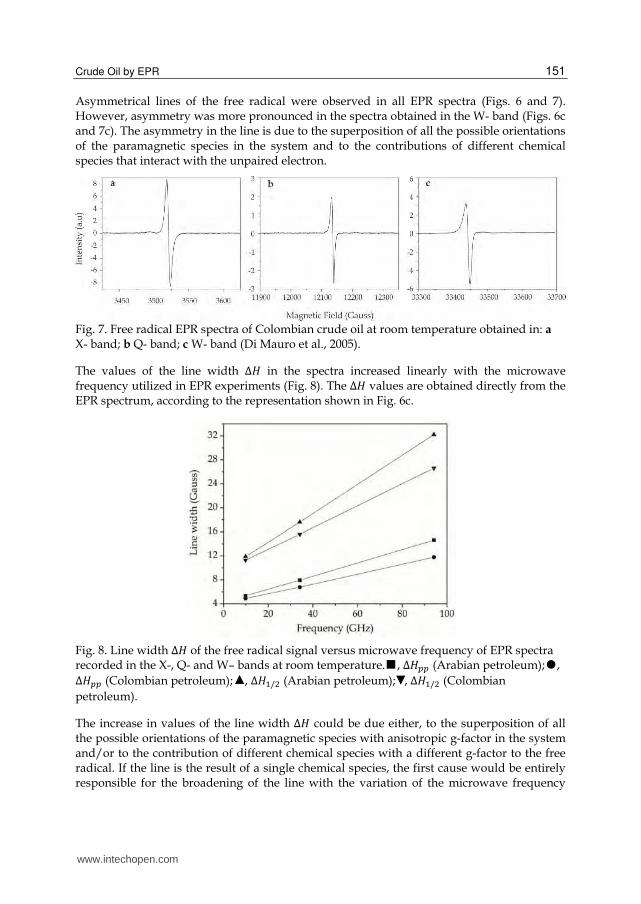
Asymmetrical lines of the free radical were observed in all EPR spectra (Figs. 6 and 7). However, asymmetry was more pronounced in the spectra obtained in the W- band (Figs. 6c and 7c). The asymmetry in the line is due to the superposition of all the possible orientations of the paramagnetic species in the system and to the contributions of different chemical species that interact with the unpaired electron.
Fig. 7. Free radical EPR spectra of Colombian crude oil at room temperature obtained in: a X- band; b Q- band; c W- band (Di Mauro et al., 2005).
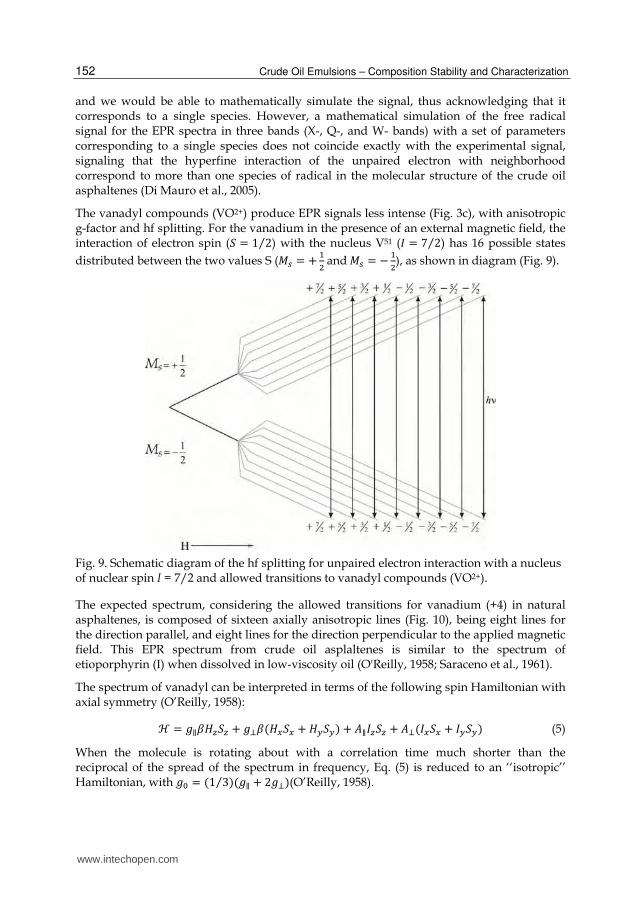
The values of the line width ∆茎 in the spectra increased linearly with the microwave frequency utilized in EPR experiments (Fig. 8). The ∆茎 values are obtained directly from the EPR spectrum, according to the representation shown in Fig. 6c.
Fig. 8. Line width ∆茎 of the free radical signal versus microwave frequency of EPR spectra recorded in the X-, Q- and W– bands at room temperature. , ∆茎椎椎 (Arabian petroleum); , ∆茎椎椎 (Colombian petroleum); , ∆茎怠/態 (Arabian petroleum); , ∆茎怠/態 (Colombian petroleum).
The increase in values of the line width ∆茎 could be due either, to the superposition of all the possible orientations of the paramagnetic species with anisotropic g-factor in the system and/or to the contribution of different chemical species with a different g-factor to the free radical. If the line is the result of a single chemical species, the first cause would be entirely responsible for the broadening of the line with the variation of the microwave frequency
www.intechopen.com
Crude Oil Emulsions – Composition Stability and Characterization 152
and we would be able to mathematically simulate the signal, thus acknowledging that it corresponds to a single species. However, a mathematical simulation of the free radical signal for the EPR spectra in three bands (X-, Q-, and W- bands) with a set of parameters corresponding to a single species does not coincide exactly with the experimental signal, signaling that the hyperfine interaction of the unpaired electron with neighborhood correspond to more than one species of radical in the molecular structure of the crude oil asphaltenes (Di Mauro et al., 2005).
The vanadyl compounds (VO2+) produce EPR signals less intense (Fig. 3c), with anisotropic g-factor and hf splitting. For the vanadium in the presence of an external magnetic field, the interaction of electron spin (鯨 = な に⁄ ) with the nucleus V51 (荊 = ば に⁄ ) has 16 possible states distributed between the two values S (警鎚 = + 怠態and警鎚 = − 怠態), as shown in diagram (Fig. 9).
Fig. 9. Schematic diagram of the hf splitting for unpaired electron interaction with a nucleus of nuclear spin I = 7/2 and allowed transitions to vanadyl compounds (VO2+).
The expected spectrum, considering the allowed transitions for vanadium (+4) in natural asphaltenes, is composed of sixteen axially anisotropic lines (Fig. 10), being eight lines for the direction parallel, and eight lines for the direction perpendicular to the applied magnetic field. This EPR spectrum from crude oil asplaltenes is similar to the spectrum of etioporphyrin (I) when dissolved in low-viscosity oil (O'Reilly, 1958; Saraceno et al., 1961).
The spectrum of vanadyl can be interpreted in terms of the following spin Hamiltonian with axial symmetry (O’Reilly, 1958):
ℋ = 訣∥紅茎佃鯨佃 + 訣鯛紅岫茎掴鯨掴 + 茎槻鯨槻岻 + 畦∥荊佃鯨佃 + 畦鯛岫荊掴鯨掴 + 荊槻鯨槻岻 (5)
When the molecule is rotating about with a correlation time much shorter than the reciprocal of the spread of the spectrum in frequency, Eq. (5) is reduced to an ‘‘isotropic’’ Hamiltonian, with 訣待 = 岫な ぬ岻岫訣∥ + に訣鯛岻⁄ (O’Reilly, 1958).
www.intechopen.com
Crude Oil by EPR 153
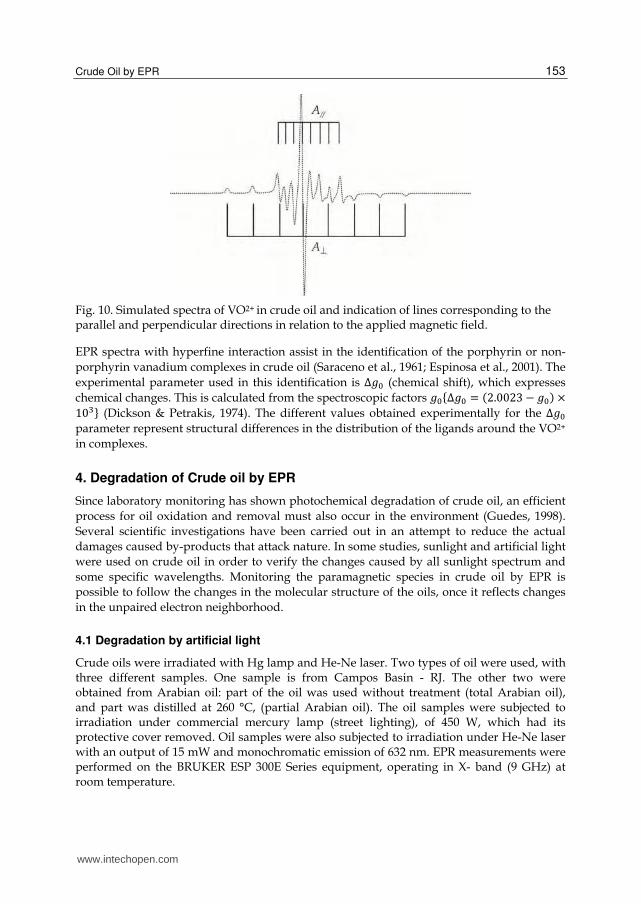
Fig. 10. Simulated spectra of VO2+ in crude oil and indication of lines corresponding to the parallel and perpendicular directions in relation to the applied magnetic field.
EPR spectra with hyperfine interaction assist in the identification of the porphyrin or non-porphyrin vanadium complexes in crude oil (Saraceno et al., 1961; Espinosa et al., 2001). The experimental parameter used in this identification is ∆訣待 (chemical shift), which expresses chemical changes. This is calculated from the spectroscopic factors 訣待岶∆訣待 = 岫に.どどにぬ − 訣待岻 ×など戴岼 (Dickson & Petrakis, 1974). The different values obtained experimentally for the ∆訣待 parameter represent structural differences in the distribution of the ligands around the VO2+
in complexes.
4. Degradation of Crude oil by EPR
Since laboratory monitoring has shown photochemical degradation of crude oil, an efficient process for oil oxidation and removal must also occur in the environment (Guedes, 1998). Several scientific investigations have been carried out in an attempt to reduce the actual damages caused by-products that attack nature. In some studies, sunlight and artificial light were used on crude oil in order to verify the changes caused by all sunlight spectrum and some specific wavelengths. Monitoring the paramagnetic species in crude oil by EPR is possible to follow the changes in the molecular structure of the oils, once it reflects changes in the unpaired electron neighborhood.
4.1 Degradation by artificial light
Crude oils were irradiated with Hg lamp and He-Ne laser. Two types of oil were used, with three different samples. One sample is from Campos Basin - RJ. The other two were obtained from Arabian oil: part of the oil was used without treatment (total Arabian oil), and part was distilled at 260 °C, (partial Arabian oil). The oil samples were subjected to irradiation under commercial mercury lamp (street lighting), of 450 W, which had its protective cover removed. Oil samples were also subjected to irradiation under He-Ne laser with an output of 15 mW and monochromatic emission of 632 nm. EPR measurements were performed on the BRUKER ESP 300E Series equipment, operating in X- band (9 GHz) at room temperature.
www.intechopen.com
Crude Oil Emulsions – Composition Stability and Characterization 154
Hg lamp He-Ne laser
Brazilian crude oil
Time 冊鯛 層宋貸想
cm-1
冊∥ 層宋貸想 cm-1
賛宋 ∆賛宋 Time 冊鯛 層宋貸想
cm-1
冊∥ 層宋貸想 cm-1
賛宋 ∆賛宋
0 h 54.0 156.0 1.980 22.8 0 h 54.0 156.0 1.979 22.8 2 h 54.0 156.0 1.986 17.0 8.5 h 53.5 155.5 1.963 39.0 9 h 54.0 157.0 1.990 12.6
Arabian crude oil
0 h 54.0 156.0 1.980 22.8 0 h 54.0 156.0 1.979 22.8 2 h 54.0 156.0 1.985 17.0 8.5 h 53.5 155.0 1.963 39.0 9 h 54.0 156.0 1.990 12.6
Partial Arabian oil
0 h 54.0 157.0 1.980 22.8 0 h 54.0 157.0 1.979 22.8 2 h 53.5 157.0 1.986 17.0 8.5 h 53.5 155.5 1.963 39.0 9 h 54.0 157.5 1.990 12.6
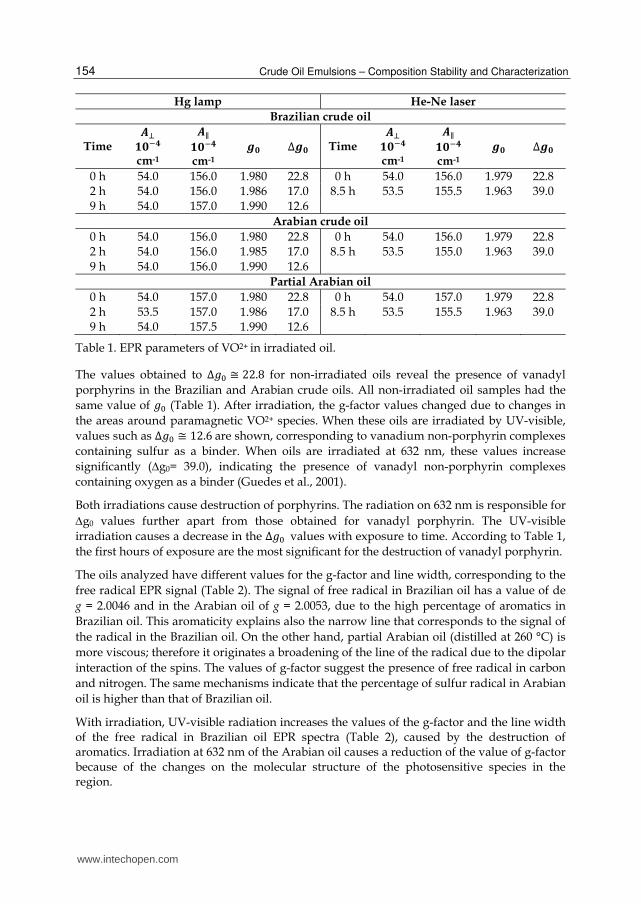
Table 1. EPR parameters of VO2+ in irradiated oil.
The values obtained to ∆訣待 ≅ にに.ぱ for non-irradiated oils reveal the presence of vanadyl porphyrins in the Brazilian and Arabian crude oils. All non-irradiated oil samples had the same value of 訣待 (Table 1). After irradiation, the g-factor values changed due to changes in the areas around paramagnetic VO2+ species. When these oils are irradiated by UV-visible, values such as ∆訣待 ≅ なに.はare shown, corresponding to vanadium non-porphyrin complexes containing sulfur as a binder. When oils are irradiated at 632 nm, these values increase significantly (∆g0= 39.0), indicating the presence of vanadyl non-porphyrin complexes containing oxygen as a binder (Guedes et al., 2001).
Both irradiations cause destruction of porphyrins. The radiation on 632 nm is responsible for g0 values further apart from those obtained for vanadyl porphyrin. The UV-visible irradiation causes a decrease in the ∆訣待 values with exposure to time. According to Table 1, the first hours of exposure are the most significant for the destruction of vanadyl porphyrin.
The oils analyzed have different values for the g-factor and line width, corresponding to the free radical EPR signal (Table 2). The signal of free radical in Brazilian oil has a value of de g = 2.0046 and in the Arabian oil of g = 2.0053, due to the high percentage of aromatics in Brazilian oil. This aromaticity explains also the narrow line that corresponds to the signal of the radical in the Brazilian oil. On the other hand, partial Arabian oil (distilled at 260 °C) is more viscous; therefore it originates a broadening of the line of the radical due to the dipolar interaction of the spins. The values of g-factor suggest the presence of free radical in carbon and nitrogen. The same mechanisms indicate that the percentage of sulfur radical in Arabian oil is higher than that of Brazilian oil.
With irradiation, UV-visible radiation increases the values of the g-factor and the line width of the free radical in Brazilian oil EPR spectra (Table 2), caused by the destruction of aromatics. Irradiation at 632 nm of the Arabian oil causes a reduction of the value of g-factor because of the changes on the molecular structure of the photosensitive species in the region.
www.intechopen.com
Crude Oil by EPR 155
Hg lamp He-Ne laser
Brazilian crude oil
Time ∆殺使使
(Gauss) g-factor Time
∆殺使使
(Gauss) g-factor
0 h 5.04 2.0045 0 h 5.04 2.0046 2 h 5.04 2.0047 8.5 h 5.85 2.0044 9 h 5.80 2.0053
Arabian crude oil
0 h 5.70 2.0053 0 h 5.70 2.0053 2 h 5.70 2.0053 8.5 h 6.62 2.0047 9 h 5.91 2.0055
Partial Arabian oil
0 h 6.78 2.0053 0 h 6.78 2.0052 2 h 7.38 2.0052 8.5 h 6.75 2.0043 9 h 7.34 2.0055
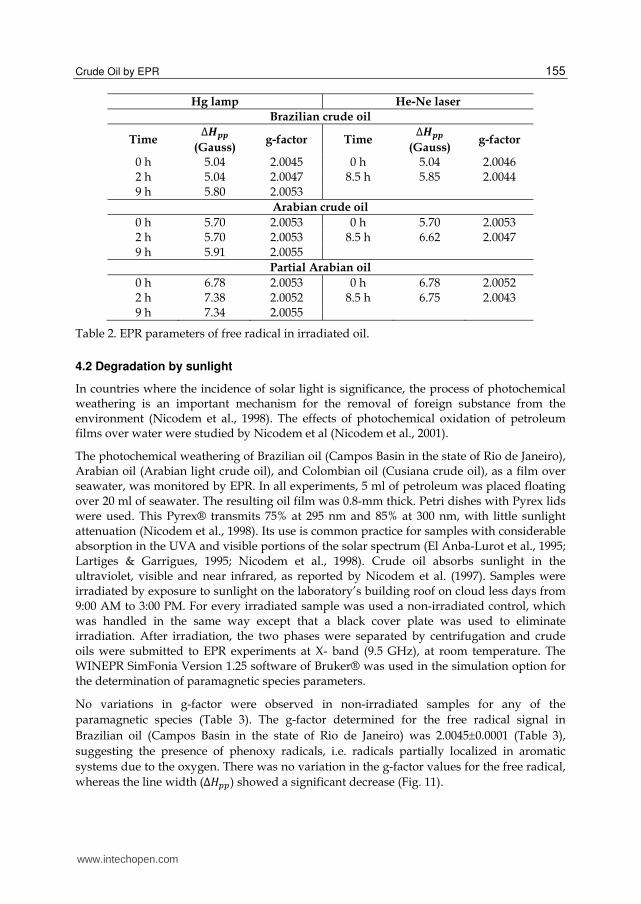
Table 2. EPR parameters of free radical in irradiated oil.
4.2 Degradation by sunlight
In countries where the incidence of solar light is significance, the process of photochemical weathering is an important mechanism for the removal of foreign substance from the environment (Nicodem et al., 1998). The effects of photochemical oxidation of petroleum films over water were studied by Nicodem et al (Nicodem et al., 2001).
The photochemical weathering of Brazilian oil (Campos Basin in the state of Rio de Janeiro), Arabian oil (Arabian light crude oil), and Colombian oil (Cusiana crude oil), as a film over seawater, was monitored by EPR. In all experiments, 5 ml of petroleum was placed floating over 20 ml of seawater. The resulting oil film was 0.8-mm thick. Petri dishes with Pyrex lids were used. This Pyrex® transmits 75% at 295 nm and 85% at 300 nm, with little sunlight attenuation (Nicodem et al., 1998). Its use is common practice for samples with considerable absorption in the UVA and visible portions of the solar spectrum (El Anba-Lurot et al., 1995; Lartiges & Garrigues, 1995; Nicodem et al., 1998). Crude oil absorbs sunlight in the ultraviolet, visible and near infrared, as reported by Nicodem et al. (1997). Samples were irradiated by exposure to sunlight on the laboratory’s building roof on cloud less days from 9:00 AM to 3:00 PM. For every irradiated sample was used a non-irradiated control, which was handled in the same way except that a black cover plate was used to eliminate irradiation. After irradiation, the two phases were separated by centrifugation and crude oils were submitted to EPR experiments at X- band (9.5 GHz), at room temperature. The WINEPR SimFonia Version 1.25 software of Bruker® was used in the simulation option for the determination of paramagnetic species parameters.
No variations in g-factor were observed in non-irradiated samples for any of the paramagnetic species (Table 3). The g-factor determined for the free radical signal in Brazilian oil (Campos Basin in the state of Rio de Janeiro) was 2.00450.0001 (Table 3), suggesting the presence of phenoxy radicals, i.e. radicals partially localized in aromatic systems due to the oxygen. There was no variation in the g-factor values for the free radical, whereas the line width (∆茎椎椎) showed a significant decrease (Fig. 11).
www.intechopen.com
Crude Oil Emulsions – Composition Stability and Characterization 156
Specimen g-factor Sample 0 h 2 h 5 h 20 h 40 h 60 h 100 h
VO2+ 訣∥ NIa 1.9675 1.9682 1.9685 1.9685 1.9685 1.9685 1.9685 訣∥ Ib 1.9675 1.9690 1.9690 1.9690 1.9700 1.9700 1.9705 訣鯛 NI 1.9873 1.9870 1.9870 1.9872 1.9875 1.9875 1.9875 訣鯛 I 1.9873 1.9873 1.9877 1.9880 1.9885 1.9889 1.9889 訣待 NI 1.9807 1.9807 1.9808 1.9810 1.9812 1.9812 1.9812 訣待 I 1.9807 1.9812 1.9815 1.9817 1.9823 1.9826 1.9828
Free radical
訣 NI 2.0045 2.0045 2.0045 2.0045 2.0045 2.0045 2.0045
訣 I 2.0045 2.0045 2.0045 2.0045 2.0045 2.0045 2.0045 aNon-irradiated. bIrradiated.
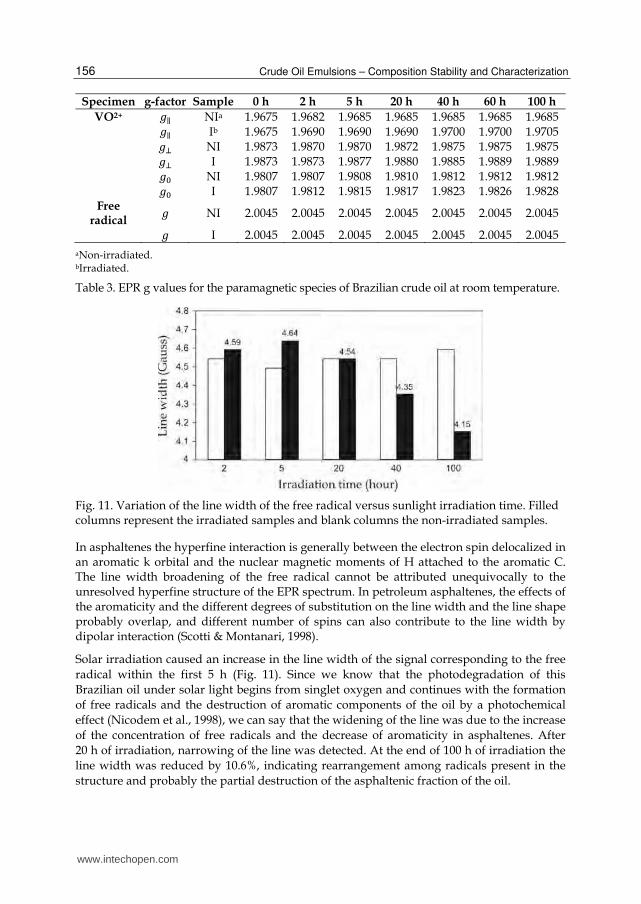
Table 3. EPR g values for the paramagnetic species of Brazilian crude oil at room temperature.
Fig. 11. Variation of the line width of the free radical versus sunlight irradiation time. Filled columns represent the irradiated samples and blank columns the non-irradiated samples.
In asphaltenes the hyperfine interaction is generally between the electron spin delocalized in an aromatic k orbital and the nuclear magnetic moments of H attached to the aromatic C. The line width broadening of the free radical cannot be attributed unequivocally to the unresolved hyperfine structure of the EPR spectrum. In petroleum asphaltenes, the effects of the aromaticity and the different degrees of substitution on the line width and the line shape probably overlap, and different number of spins can also contribute to the line width by dipolar interaction (Scotti & Montanari, 1998).
Solar irradiation caused an increase in the line width of the signal corresponding to the free radical within the first 5 h (Fig. 11). Since we know that the photodegradation of this Brazilian oil under solar light begins from singlet oxygen and continues with the formation of free radicals and the destruction of aromatic components of the oil by a photochemical effect (Nicodem et al., 1998), we can say that the widening of the line was due to the increase of the concentration of free radicals and the decrease of aromaticity in asphaltenes. After 20 h of irradiation, narrowing of the line was detected. At the end of 100 h of irradiation the line width was reduced by 10.6%, indicating rearrangement among radicals present in the structure and probably the partial destruction of the asphaltenic fraction of the oil.
www.intechopen.com
Crude Oil by EPR 157
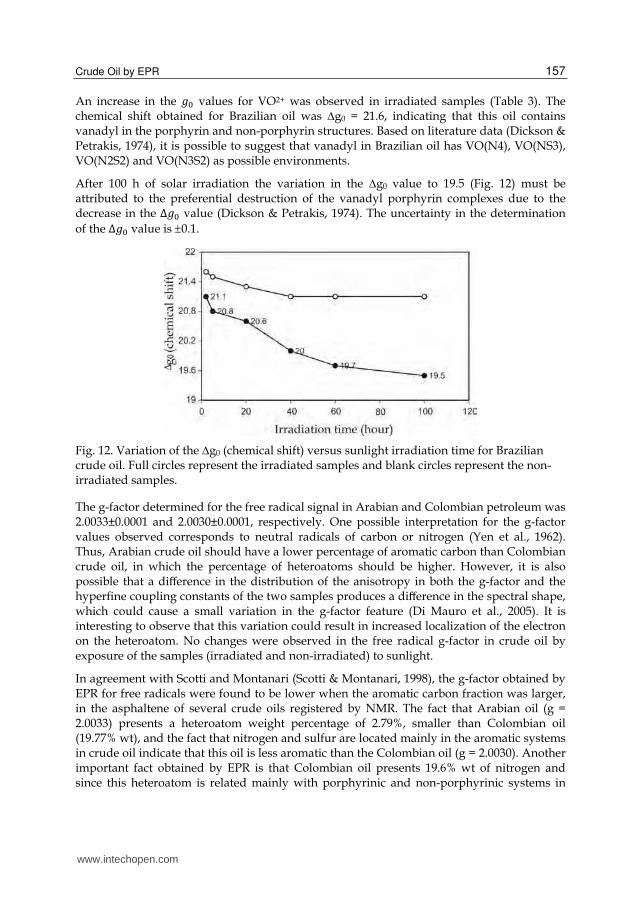
An increase in the 訣待 values for VO2+ was observed in irradiated samples (Table 3). The chemical shift obtained for Brazilian oil was ∆g0 = 21.6, indicating that this oil contains vanadyl in the porphyrin and non-porphyrin structures. Based on literature data (Dickson & Petrakis, 1974), it is possible to suggest that vanadyl in Brazilian oil has VO(N4), VO(NS3), VO(N2S2) and VO(N3S2) as possible environments.
After 100 h of solar irradiation the variation in the ∆g0 value to 19.5 (Fig. 12) must be attributed to the preferential destruction of the vanadyl porphyrin complexes due to the decrease in the ∆訣待 value (Dickson & Petrakis, 1974). The uncertainty in the determination of the ∆訣待 value is 0.1.
Fig. 12. Variation of the ∆g0 (chemical shift) versus sunlight irradiation time for Brazilian crude oil. Full circles represent the irradiated samples and blank circles represent the non-irradiated samples.
The g-factor determined for the free radical signal in Arabian and Colombian petroleum was 2.0033±0.0001 and 2.0030±0.0001, respectively. One possible interpretation for the g-factor values observed corresponds to neutral radicals of carbon or nitrogen (Yen et al., 1962). Thus, Arabian crude oil should have a lower percentage of aromatic carbon than Colombian crude oil, in which the percentage of heteroatoms should be higher. However, it is also possible that a difference in the distribution of the anisotropy in both the g-factor and the hyperfine coupling constants of the two samples produces a difference in the spectral shape, which could cause a small variation in the g-factor feature (Di Mauro et al., 2005). It is interesting to observe that this variation could result in increased localization of the electron on the heteroatom. No changes were observed in the free radical g-factor in crude oil by exposure of the samples (irradiated and non-irradiated) to sunlight.
In agreement with Scotti and Montanari (Scotti & Montanari, 1998), the g-factor obtained by EPR for free radicals were found to be lower when the aromatic carbon fraction was larger, in the asphaltene of several crude oils registered by NMR. The fact that Arabian oil (g = 2.0033) presents a heteroatom weight percentage of 2.79%, smaller than Colombian oil (19.77% wt), and the fact that nitrogen and sulfur are located mainly in the aromatic systems in crude oil indicate that this oil is less aromatic than the Colombian oil (g = 2.0030). Another important fact obtained by EPR is that Colombian oil presents 19.6% wt of nitrogen and since this heteroatom is related mainly with porphyrinic and non-porphyrinic systems in
www.intechopen.com
Crude Oil Emulsions – Composition Stability and Characterization 158
petroleum asphaltenes, it is possible to affirm that the oil of Colombian origin has a larger asphaltene fraction than Arabian oil.
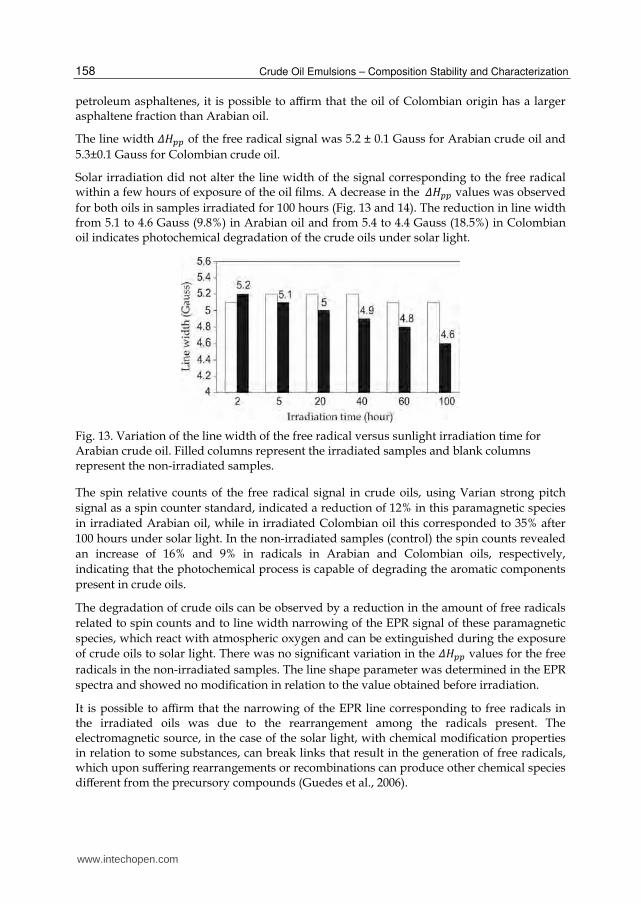
The line width 弘茎椎椎 of the free radical signal was 5.2 ± 0.1 Gauss for Arabian crude oil and 5.3±0.1 Gauss for Colombian crude oil.
Solar irradiation did not alter the line width of the signal corresponding to the free radical within a few hours of exposure of the oil films. A decrease in the 弘茎椎椎 values was observed for both oils in samples irradiated for 100 hours (Fig. 13 and 14). The reduction in line width from 5.1 to 4.6 Gauss (9.8%) in Arabian oil and from 5.4 to 4.4 Gauss (18.5%) in Colombian oil indicates photochemical degradation of the crude oils under solar light.
Fig. 13. Variation of the line width of the free radical versus sunlight irradiation time for Arabian crude oil. Filled columns represent the irradiated samples and blank columns represent the non-irradiated samples.
The spin relative counts of the free radical signal in crude oils, using Varian strong pitch signal as a spin counter standard, indicated a reduction of 12% in this paramagnetic species in irradiated Arabian oil, while in irradiated Colombian oil this corresponded to 35% after 100 hours under solar light. In the non-irradiated samples (control) the spin counts revealed an increase of 16% and 9% in radicals in Arabian and Colombian oils, respectively, indicating that the photochemical process is capable of degrading the aromatic components present in crude oils.
The degradation of crude oils can be observed by a reduction in the amount of free radicals related to spin counts and to line width narrowing of the EPR signal of these paramagnetic species, which react with atmospheric oxygen and can be extinguished during the exposure of crude oils to solar light. There was no significant variation in the 弘茎椎椎 values for the free radicals in the non-irradiated samples. The line shape parameter was determined in the EPR spectra and showed no modification in relation to the value obtained before irradiation.
It is possible to affirm that the narrowing of the EPR line corresponding to free radicals in the irradiated oils was due to the rearrangement among the radicals present. The electromagnetic source, in the case of the solar light, with chemical modification properties in relation to some substances, can break links that result in the generation of free radicals, which upon suffering rearrangements or recombinations can produce other chemical species different from the precursory compounds (Guedes et al., 2006).
www.intechopen.com

Crude Oil by EPR 159
Fig. 14. Variation of the line width of the free radical versus sunlight irradiation time for Colombian crude oil. Filled columns represent the irradiated samples and blank columns represent the non-irradiated samples.
The oils studied in the present investigation were significantly affected by the action of sunlight under tropical conditions. Observations revealed that solar irradiation reduces the aromaticity of crude oil, degrading porphyrin complexes and at least partially destroying asphaltene fraction of oil. The EPR technique proved to be useful in the characterization of the molecular structure of asphalttenes in crude oil and also revealed changes of the photochemical nature in the oil under the effect of sunlight.
5. By-product oil by EPR
The interest in studying by-product oil is due to the fact this low-viscosity, when compared to the crude oil, allows high mobility of free radical in its environment. The by-product oil investigated by EPR was Marine diesel (fluid catalytic diesel, bunker, ship fuel). The marine diesel spectrum (Fig. 15) consist of signal from radicals with a typical hf splitting of protons, exhibiting a septet of lines with intensities proportional to 1, 6, 15, 20, 15, 6, 1. These correspond to different ways of form spins +ぬ, +に, +な, ど, −な, −に, −ぬ due to the interaction of six equivalent and strong coupled protons [A(1H)]. Each of seven hfs lines is split into four lines (quartet) due the three weakly coupled protons [A´(1H)] with intensities proportional to な, ぬ, ぬ, な, and corresponding to the different ways of form spins + ぬ に⁄ , + な に⁄ , − な に⁄ , − ぬ に⁄ .
Fig. 15. RPE spectrum of marine diesel (Di Mauro et al., 2007).
www.intechopen.com
Crude Oil Emulsions – Composition Stability and Characterization 160
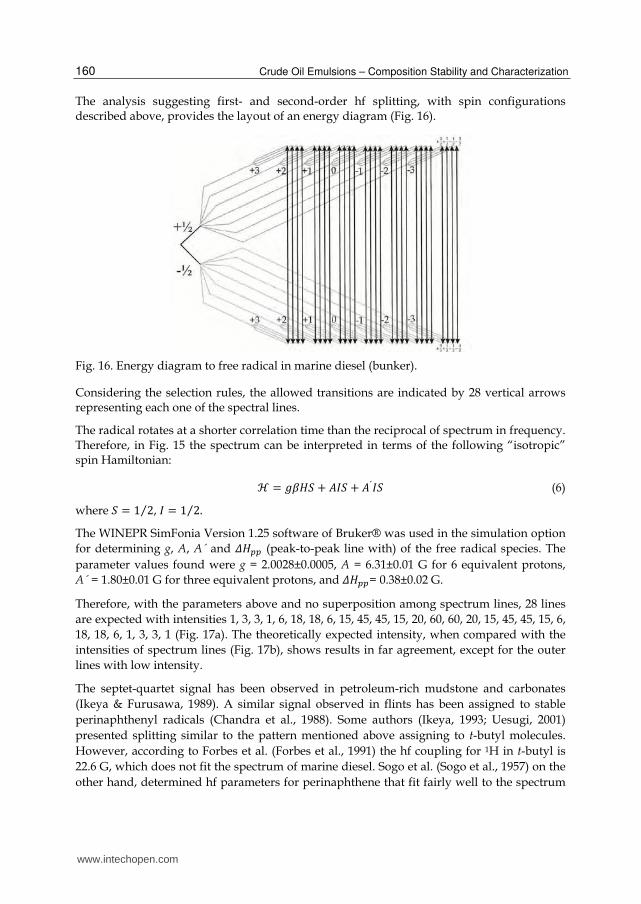
The analysis suggesting first- and second-order hf splitting, with spin configurations described above, provides the layout of an energy diagram (Fig. 16).
Fig. 16. Energy diagram to free radical in marine diesel (bunker).
Considering the selection rules, the allowed transitions are indicated by 28 vertical arrows representing each one of the spectral lines.
The radical rotates at a shorter correlation time than the reciprocal of spectrum in frequency. Therefore, in Fig. 15 the spectrum can be interpreted in terms of the following “isotropic” spin Hamiltonian:
ℋ = 訣紅茎鯨 + 畦荊鯨 + 畦´荊鯨 (6)
where 鯨 = な に⁄ , 荊 = な に⁄ . The WINEPR SimFonia Version 1.25 software of Bruker® was used in the simulation option for determining g, A, A´ and 弘茎椎椎 (peak-to-peak line with) of the free radical species. The parameter values found were g = 2.0028±0.0005, A = 6.31±0.01 G for 6 equivalent protons, A´ = 1.80±0.01 G for three equivalent protons, and 弘茎椎椎= 0.38±0.02 G.
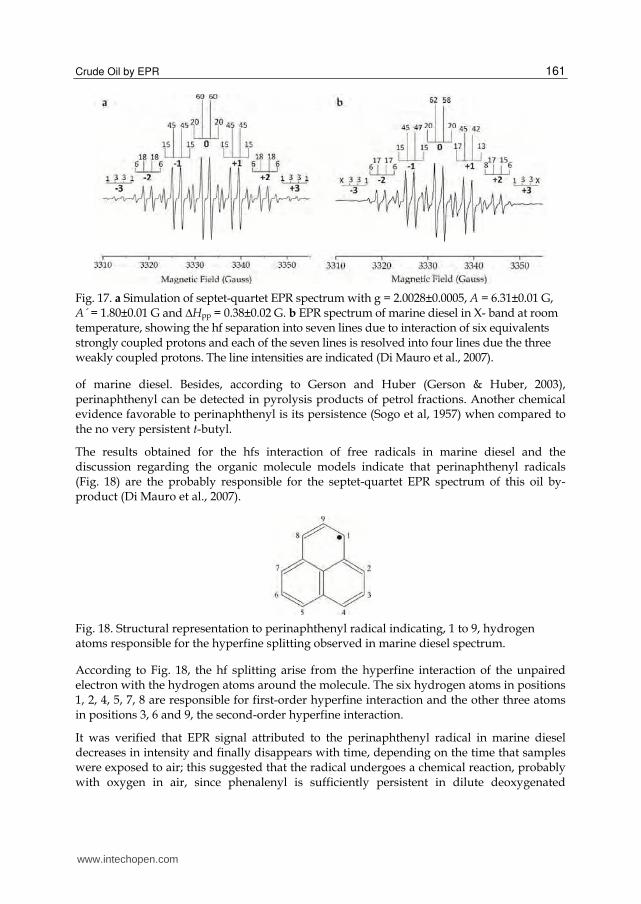
Therefore, with the parameters above and no superposition among spectrum lines, 28 lines are expected with intensities 1, 3, 3, 1, 6, 18, 18, 6, 15, 45, 45, 15, 20, 60, 60, 20, 15, 45, 45, 15, 6, 18, 18, 6, 1, 3, 3, 1 (Fig. 17a). The theoretically expected intensity, when compared with the intensities of spectrum lines (Fig. 17b), shows results in far agreement, except for the outer lines with low intensity.
The septet-quartet signal has been observed in petroleum-rich mudstone and carbonates (Ikeya & Furusawa, 1989). A similar signal observed in flints has been assigned to stable perinaphthenyl radicals (Chandra et al., 1988). Some authors (Ikeya, 1993; Uesugi, 2001) presented splitting similar to the pattern mentioned above assigning to t-butyl molecules. However, according to Forbes et al. (Forbes et al., 1991) the hf coupling for 1H in t-butyl is 22.6 G, which does not fit the spectrum of marine diesel. Sogo et al. (Sogo et al., 1957) on the other hand, determined hf parameters for perinaphthene that fit fairly well to the spectrum
www.intechopen.com
Crude Oil by EPR 161
Fig. 17. a Simulation of septet-quartet EPR spectrum with g = 2.0028±0.0005, A = 6.31±0.01 G, A´ = 1.80±0.01 G and ∆Hpp = 0.38±0.02 G. b EPR spectrum of marine diesel in X- band at room temperature, showing the hf separation into seven lines due to interaction of six equivalents strongly coupled protons and each of the seven lines is resolved into four lines due the three weakly coupled protons. The line intensities are indicated (Di Mauro et al., 2007).
of marine diesel. Besides, according to Gerson and Huber (Gerson & Huber, 2003), perinaphthenyl can be detected in pyrolysis products of petrol fractions. Another chemical evidence favorable to perinaphthenyl is its persistence (Sogo et al, 1957) when compared to the no very persistent t-butyl.
The results obtained for the hfs interaction of free radicals in marine diesel and the discussion regarding the organic molecule models indicate that perinaphthenyl radicals (Fig. 18) are the probably responsible for the septet-quartet EPR spectrum of this oil by-product (Di Mauro et al., 2007).
Fig. 18. Structural representation to perinaphthenyl radical indicating, 1 to 9, hydrogen atoms responsible for the hyperfine splitting observed in marine diesel spectrum.
According to Fig. 18, the hf splitting arise from the hyperfine interaction of the unpaired electron with the hydrogen atoms around the molecule. The six hydrogen atoms in positions 1, 2, 4, 5, 7, 8 are responsible for first-order hyperfine interaction and the other three atoms in positions 3, 6 and 9, the second-order hyperfine interaction.
It was verified that EPR signal attributed to the perinaphthenyl radical in marine diesel decreases in intensity and finally disappears with time, depending on the time that samples were exposed to air; this suggested that the radical undergoes a chemical reaction, probably with oxygen in air, since phenalenyl is sufficiently persistent in dilute deoxygenated
www.intechopen.com
Crude Oil Emulsions – Composition Stability and Characterization 162
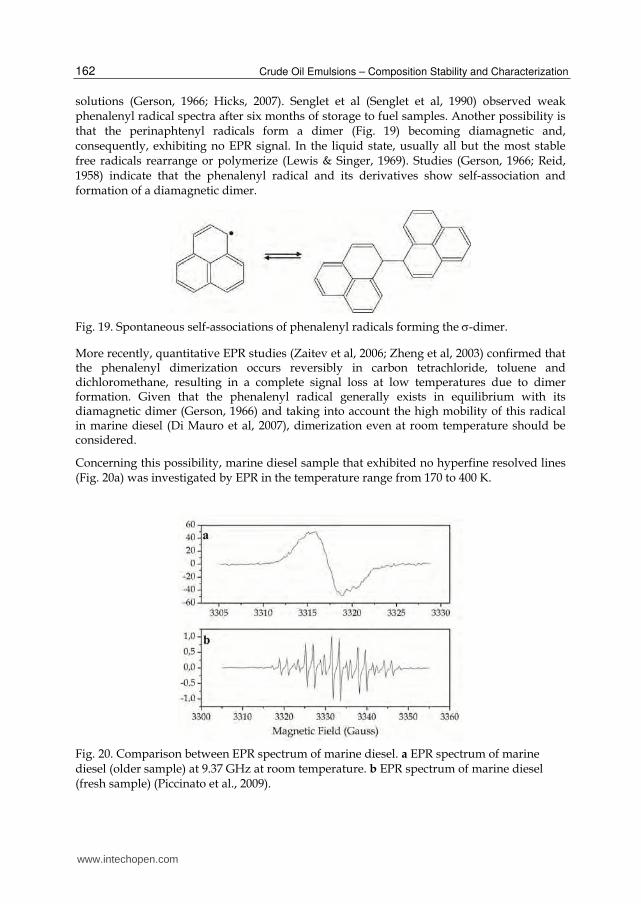
solutions (Gerson, 1966; Hicks, 2007). Senglet et al (Senglet et al, 1990) observed weak phenalenyl radical spectra after six months of storage to fuel samples. Another possibility is that the perinaphtenyl radicals form a dimer (Fig. 19) becoming diamagnetic and, consequently, exhibiting no EPR signal. In the liquid state, usually all but the most stable free radicals rearrange or polymerize (Lewis & Singer, 1969). Studies (Gerson, 1966; Reid, 1958) indicate that the phenalenyl radical and its derivatives show self-association and formation of a diamagnetic dimer.
Fig. 19. Spontaneous self-associations of phenalenyl radicals forming the -dimer.
More recently, quantitative EPR studies (Zaitev et al, 2006; Zheng et al, 2003) confirmed that the phenalenyl dimerization occurs reversibly in carbon tetrachloride, toluene and dichloromethane, resulting in a complete signal loss at low temperatures due to dimer formation. Given that the phenalenyl radical generally exists in equilibrium with its diamagnetic dimer (Gerson, 1966) and taking into account the high mobility of this radical in marine diesel (Di Mauro et al, 2007), dimerization even at room temperature should be considered.
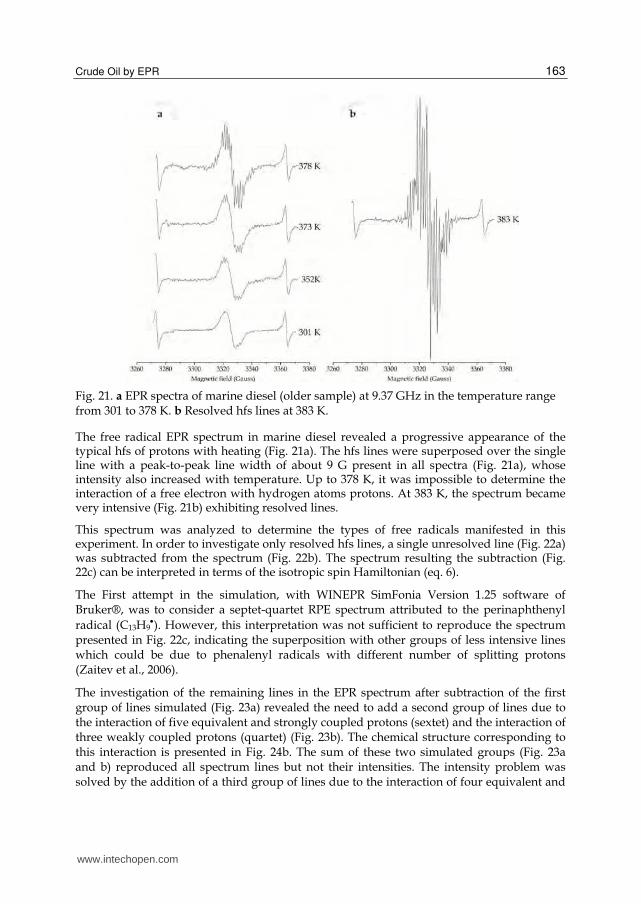
Concerning this possibility, marine diesel sample that exhibited no hyperfine resolved lines (Fig. 20a) was investigated by EPR in the temperature range from 170 to 400 K.
Fig. 20. Comparison between EPR spectrum of marine diesel. a EPR spectrum of marine diesel (older sample) at 9.37 GHz at room temperature. b EPR spectrum of marine diesel (fresh sample) (Piccinato et al., 2009).
www.intechopen.com
Crude Oil by EPR 163
Fig. 21. a EPR spectra of marine diesel (older sample) at 9.37 GHz in the temperature range from 301 to 378 K. b Resolved hfs lines at 383 K.
The free radical EPR spectrum in marine diesel revealed a progressive appearance of the typical hfs of protons with heating (Fig. 21a). The hfs lines were superposed over the single line with a peak-to-peak line width of about 9 G present in all spectra (Fig. 21a), whose intensity also increased with temperature. Up to 378 K, it was impossible to determine the interaction of a free electron with hydrogen atoms protons. At 383 K, the spectrum became very intensive (Fig. 21b) exhibiting resolved lines.
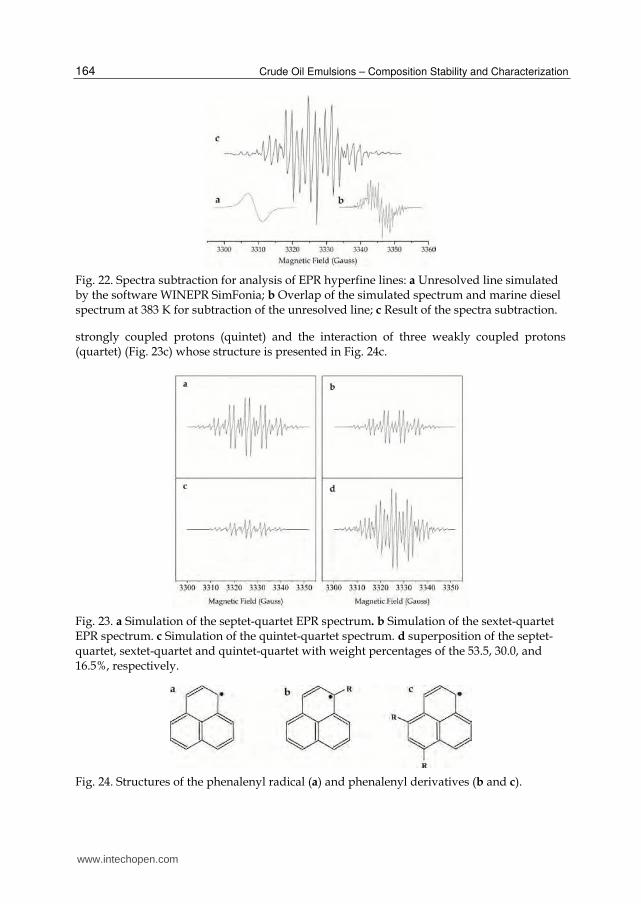
This spectrum was analyzed to determine the types of free radicals manifested in this experiment. In order to investigate only resolved hfs lines, a single unresolved line (Fig. 22a) was subtracted from the spectrum (Fig. 22b). The spectrum resulting the subtraction (Fig. 22c) can be interpreted in terms of the isotropic spin Hamiltonian (eq. 6).
The First attempt in the simulation, with WINEPR SimFonia Version 1.25 software of Bruker®, was to consider a septet-quartet RPE spectrum attributed to the perinaphthenyl radical (C13H9
). However, this interpretation was not sufficient to reproduce the spectrum presented in Fig. 22c, indicating the superposition with other groups of less intensive lines which could be due to phenalenyl radicals with different number of splitting protons (Zaitev et al., 2006).
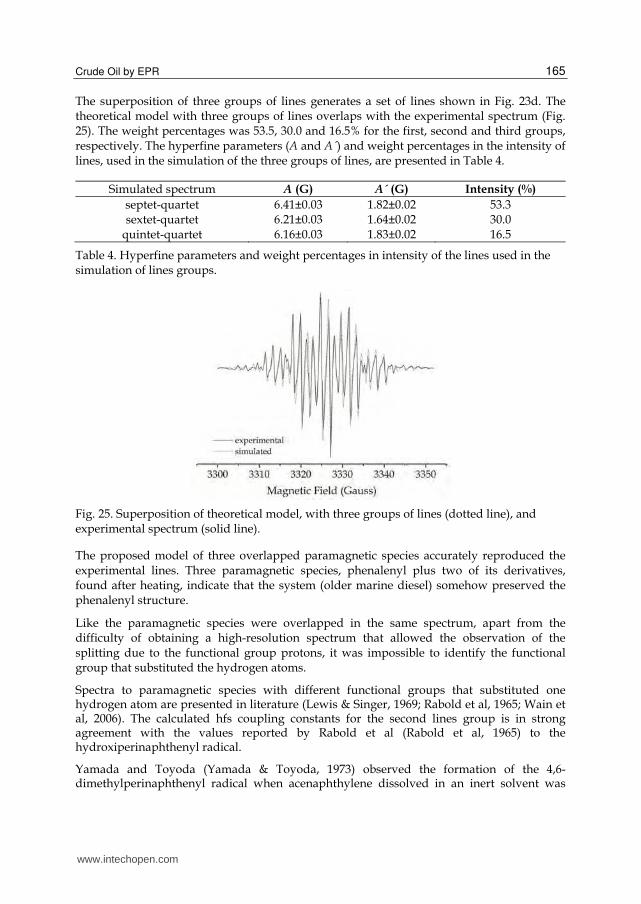
The investigation of the remaining lines in the EPR spectrum after subtraction of the first group of lines simulated (Fig. 23a) revealed the need to add a second group of lines due to the interaction of five equivalent and strongly coupled protons (sextet) and the interaction of three weakly coupled protons (quartet) (Fig. 23b). The chemical structure corresponding to this interaction is presented in Fig. 24b. The sum of these two simulated groups (Fig. 23a and b) reproduced all spectrum lines but not their intensities. The intensity problem was solved by the addition of a third group of lines due to the interaction of four equivalent and
www.intechopen.com
Crude Oil Emulsions – Composition Stability and Characterization 164
Fig. 22. Spectra subtraction for analysis of EPR hyperfine lines: a Unresolved line simulated by the software WINEPR SimFonia; b Overlap of the simulated spectrum and marine diesel spectrum at 383 K for subtraction of the unresolved line; c Result of the spectra subtraction.
strongly coupled protons (quintet) and the interaction of three weakly coupled protons (quartet) (Fig. 23c) whose structure is presented in Fig. 24c.
Fig. 23. a Simulation of the septet-quartet EPR spectrum. b Simulation of the sextet-quartet EPR spectrum. c Simulation of the quintet-quartet spectrum. d superposition of the septet-quartet, sextet-quartet and quintet-quartet with weight percentages of the 53.5, 30.0, and 16.5%, respectively.
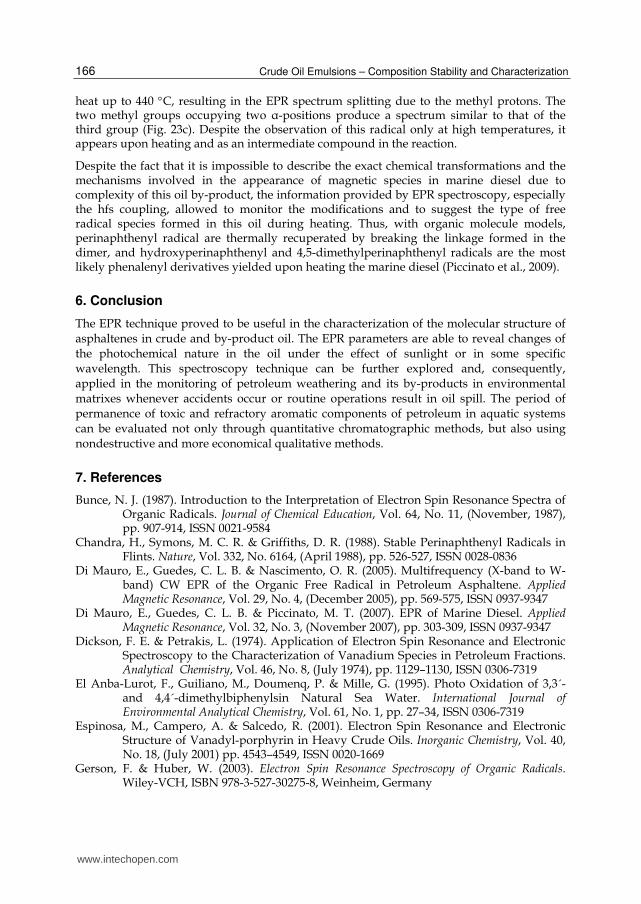
Fig. 24. Structures of the phenalenyl radical (a) and phenalenyl derivatives (b and c).
www.intechopen.com
Crude Oil by EPR 165
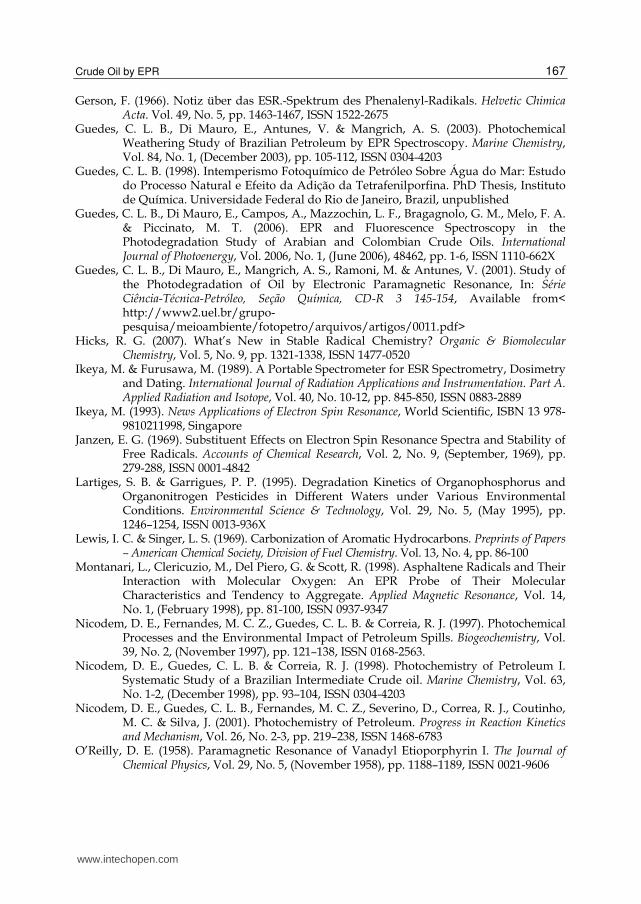
The superposition of three groups of lines generates a set of lines shown in Fig. 23d. The theoretical model with three groups of lines overlaps with the experimental spectrum (Fig. 25). The weight percentages was 53.5, 30.0 and 16.5% for the first, second and third groups, respectively. The hyperfine parameters (A and A´) and weight percentages in the intensity of lines, used in the simulation of the three groups of lines, are presented in Table 4.
Simulated spectrum A (G) A´ (G) Intensity (%)
septet-quartet 6.41±0.03 1.82±0.02 53.3 sextet-quartet 6.21±0.03 1.64±0.02 30.0
quintet-quartet 6.16±0.03 1.83±0.02 16.5
Table 4. Hyperfine parameters and weight percentages in intensity of the lines used in the simulation of lines groups.
Fig. 25. Superposition of theoretical model, with three groups of lines (dotted line), and experimental spectrum (solid line).
The proposed model of three overlapped paramagnetic species accurately reproduced the experimental lines. Three paramagnetic species, phenalenyl plus two of its derivatives, found after heating, indicate that the system (older marine diesel) somehow preserved the phenalenyl structure.
Like the paramagnetic species were overlapped in the same spectrum, apart from the difficulty of obtaining a high-resolution spectrum that allowed the observation of the splitting due to the functional group protons, it was impossible to identify the functional group that substituted the hydrogen atoms.
Spectra to paramagnetic species with different functional groups that substituted one hydrogen atom are presented in literature (Lewis & Singer, 1969; Rabold et al, 1965; Wain et al, 2006). The calculated hfs coupling constants for the second lines group is in strong agreement with the values reported by Rabold et al (Rabold et al, 1965) to the hydroxiperinaphthenyl radical.
Yamada and Toyoda (Yamada & Toyoda, 1973) observed the formation of the 4,6- dimethylperinaphthenyl radical when acenaphthylene dissolved in an inert solvent was
www.intechopen.com
Crude Oil Emulsions – Composition Stability and Characterization 166
heat up to 440 C, resulting in the EPR spectrum splitting due to the methyl protons. The two methyl groups occupying two α-positions produce a spectrum similar to that of the third group (Fig. 23c). Despite the observation of this radical only at high temperatures, it appears upon heating and as an intermediate compound in the reaction.
Despite the fact that it is impossible to describe the exact chemical transformations and the mechanisms involved in the appearance of magnetic species in marine diesel due to complexity of this oil by-product, the information provided by EPR spectroscopy, especially the hfs coupling, allowed to monitor the modifications and to suggest the type of free radical species formed in this oil during heating. Thus, with organic molecule models, perinaphthenyl radical are thermally recuperated by breaking the linkage formed in the dimer, and hydroxyperinaphthenyl and 4,5-dimethylperinaphthenyl radicals are the most likely phenalenyl derivatives yielded upon heating the marine diesel (Piccinato et al., 2009).
6. Conclusion
The EPR technique proved to be useful in the characterization of the molecular structure of asphaltenes in crude and by-product oil. The EPR parameters are able to reveal changes of the photochemical nature in the oil under the effect of sunlight or in some specific wavelength. This spectroscopy technique can be further explored and, consequently, applied in the monitoring of petroleum weathering and its by-products in environmental matrixes whenever accidents occur or routine operations result in oil spill. The period of permanence of toxic and refractory aromatic components of petroleum in aquatic systems can be evaluated not only through quantitative chromatographic methods, but also using nondestructive and more economical qualitative methods.
7. References
Bunce, N. J. (1987). Introduction to the Interpretation of Electron Spin Resonance Spectra of Organic Radicals. Journal of Chemical Education, Vol. 64, No. 11, (November, 1987), pp. 907-914, ISSN 0021-9584
Chandra, H., Symons, M. C. R. & Griffiths, D. R. (1988). Stable Perinaphthenyl Radicals in Flints. Nature, Vol. 332, No. 6164, (April 1988), pp. 526-527, ISSN 0028-0836
Di Mauro, E., Guedes, C. L. B. & Nascimento, O. R. (2005). Multifrequency (X-band to W-band) CW EPR of the Organic Free Radical in Petroleum Asphaltene. Applied Magnetic Resonance, Vol. 29, No. 4, (December 2005), pp. 569-575, ISSN 0937-9347
Di Mauro, E., Guedes, C. L. B. & Piccinato, M. T. (2007). EPR of Marine Diesel. Applied Magnetic Resonance, Vol. 32, No. 3, (November 2007), pp. 303-309, ISSN 0937-9347
Dickson, F. E. & Petrakis, L. (1974). Application of Electron Spin Resonance and Electronic Spectroscopy to the Characterization of Vanadium Species in Petroleum Fractions. Analytical Chemistry, Vol. 46, No. 8, (July 1974), pp. 1129–1130, ISSN 0306-7319
El Anba-Lurot, F., Guiliano, M., Doumenq, P. & Mille, G. (1995). Photo Oxidation of 3,3´- and 4,4´-dimethylbiphenylsin Natural Sea Water. International Journal of Environmental Analytical Chemistry, Vol. 61, No. 1, pp. 27–34, ISSN 0306-7319
Espinosa, M., Campero, A. & Salcedo, R. (2001). Electron Spin Resonance and Electronic Structure of Vanadyl-porphyrin in Heavy Crude Oils. Inorganic Chemistry, Vol. 40, No. 18, (July 2001) pp. 4543–4549, ISSN 0020-1669
Gerson, F. & Huber, W. (2003). Electron Spin Resonance Spectroscopy of Organic Radicals. Wiley-VCH, ISBN 978-3-527-30275-8, Weinheim, Germany
www.intechopen.com
Crude Oil by EPR 167
Gerson, F. (1966). Notiz über das ESR.-Spektrum des Phenalenyl-Radikals. Helvetic Chimica Acta. Vol. 49, No. 5, pp. 1463-1467, ISSN 1522-2675
Guedes, C. L. B., Di Mauro, E., Antunes, V. & Mangrich, A. S. (2003). Photochemical Weathering Study of Brazilian Petroleum by EPR Spectroscopy. Marine Chemistry, Vol. 84, No. 1, (December 2003), pp. 105-112, ISSN 0304-4203
Guedes, C. L. B. (1998). Intemperismo Fotoquímico de Petróleo Sobre Água do Mar: Estudo do Processo Natural e Efeito da Adição da Tetrafenilporfina. PhD Thesis, Instituto de Química. Universidade Federal do Rio de Janeiro, Brazil, unpublished
Guedes, C. L. B., Di Mauro, E., Campos, A., Mazzochin, L. F., Bragagnolo, G. M., Melo, F. A. & Piccinato, M. T. (2006). EPR and Fluorescence Spectroscopy in the Photodegradation Study of Arabian and Colombian Crude Oils. International Journal of Photoenergy, Vol. 2006, No. 1, (June 2006), 48462, pp. 1-6, ISSN 1110-662X
Guedes, C. L. B., Di Mauro, E., Mangrich, A. S., Ramoni, M. & Antunes, V. (2001). Study of the Photodegradation of Oil by Electronic Paramagnetic Resonance, In: Série Ciência-Técnica-Petróleo, Seção Química, CD-R 3 145-154, Available from< http://www2.uel.br/grupo-pesquisa/meioambiente/fotopetro/arquivos/artigos/0011.pdf>
Hicks, R. G. (2007). What’s New in Stable Radical Chemistry? Organic & Biomolecular Chemistry, Vol. 5, No. 9, pp. 1321-1338, ISSN 1477-0520
Ikeya, M. & Furusawa, M. (1989). A Portable Spectrometer for ESR Spectrometry, Dosimetry and Dating. International Journal of Radiation Applications and Instrumentation. Part A. Applied Radiation and Isotope, Vol. 40, No. 10-12, pp. 845-850, ISSN 0883-2889
Ikeya, M. (1993). News Applications of Electron Spin Resonance, World Scientific, ISBN 13 978-9810211998, Singapore
Janzen, E. G. (1969). Substituent Effects on Electron Spin Resonance Spectra and Stability of Free Radicals. Accounts of Chemical Research, Vol. 2, No. 9, (September, 1969), pp. 279-288, ISSN 0001-4842
Lartiges, S. B. & Garrigues, P. P. (1995). Degradation Kinetics of Organophosphorus and Organonitrogen Pesticides in Different Waters under Various Environmental Conditions. Environmental Science & Technology, Vol. 29, No. 5, (May 1995), pp. 1246–1254, ISSN 0013-936X
Lewis, I. C. & Singer, L. S. (1969). Carbonization of Aromatic Hydrocarbons. Preprints of Papers – American Chemical Society, Division of Fuel Chemistry. Vol. 13, No. 4, pp. 86-100
Montanari, L., Clericuzio, M., Del Piero, G. & Scott, R. (1998). Asphaltene Radicals and Their Interaction with Molecular Oxygen: An EPR Probe of Their Molecular Characteristics and Tendency to Aggregate. Applied Magnetic Resonance, Vol. 14, No. 1, (February 1998), pp. 81-100, ISSN 0937-9347
Nicodem, D. E., Fernandes, M. C. Z., Guedes, C. L. B. & Correia, R. J. (1997). Photochemical Processes and the Environmental Impact of Petroleum Spills. Biogeochemistry, Vol. 39, No. 2, (November 1997), pp. 121–138, ISSN 0168-2563.
Nicodem, D. E., Guedes, C. L. B. & Correia, R. J. (1998). Photochemistry of Petroleum I. Systematic Study of a Brazilian Intermediate Crude oil. Marine Chemistry, Vol. 63, No. 1-2, (December 1998), pp. 93–104, ISSN 0304-4203
Nicodem, D. E., Guedes, C. L. B., Fernandes, M. C. Z., Severino, D., Correa, R. J., Coutinho, M. C. & Silva, J. (2001). Photochemistry of Petroleum. Progress in Reaction Kinetics and Mechanism, Vol. 26, No. 2-3, pp. 219–238, ISSN 1468-6783
O’Reilly, D. E. (1958). Paramagnetic Resonance of Vanadyl Etioporphyrin I. The Journal of Chemical Physics, Vol. 29, No. 5, (November 1958), pp. 1188–1189, ISSN 0021-9606
www.intechopen.com
Crude Oil Emulsions – Composition Stability and Characterization 168
Orton, J. W. (1968). Electron Paramagnetic Resonance, IIiffe Books Ltd, ISBN 13 9780592050416, London, United Kingdom
Piccinato, M. T., Guedes, C. L. B. & Di Mauro, E. (2009). EPR Characterization of Organic Free Radicals in Marine Diesel. Applied Magnetic Resonance, Vol. 35, No. 3, (April 2009), pp. 379-388, ISSN 0937-9347
Poole, C. P. (1967). Electron Spin Resonance – A Comprehensive Treatise on Experimental Techniques, John Wiley & Sons Inc, ISBN 13 978-0470693865, New York, United State of America
Reid D. H. (1958). Stable -Electron Systems and New Aromatic Structures. Tetrahedron, Vol. 3, No. 3, pp. 339-352, ISSN 0040-4020
Saraceno A. J., Fanale D. T. & Coggeshall, N. D. (1961). An Electron Paramagnetic Resonance Investigation of Vanadium in Petroleum Oils. Analytical Chemistry, Vol. 33, No 4, (April 1961), pp. 500-505, ISSN 0003-2700
Scott, R. & Montanari L. (1998). Molecular Structure and Intermolecular Interaction of Asphaltenes by FI-IR, NMR, EPR, In: Structures and Dynamics of Asphaltenes, Oliver C. Mullins and Eric Y. Sheu, pp. 79–113, Plenum Press, ISBN 0306459302, New York, United State of America
Senglet, N., Faure, D., Des Courières, T., Bernasconi, C. & Guilard, R. (1990). E.S.R. Characterization of Phenalenyl Radicals in Various Fuel Samples. Fuel, Vol. 69, No. 2, (February 1990), pp. 203-206, ISSN 0016-2361
Sogo, P. B., Nakazaki, M. & Calvin, M. (1957). Free Radical from Perinaphthene. Journal of Chemical Physics, Vol. 26, No. 5, (May, 1957) pp. 1343-1345, ISSN 0021-9606
Uesugi, A. & Ikeya, M. (2001). Electron Spin Resonance Measurement of Organic Radicals in Petroleum Source Rock Containing Transition Metal Ions. Japanese Journal of Applied Physics Part 1-Regular Papers Short Notes & Review Papers. Vol. 40, No. 4A, (April 2001), p. 2251-2254, ISSN 0021-4922
Yen, T. F., Erdman, J. G. & Saraceno, A. J. (1962). Investigation of the Nature of Free Radicals in Petroleum Asphaltenes and Related Substances by Electron Spin Resonance. Analytical Chemistry, Vol. 34, No. 6, (May 1962), pp. 694–700, ISSN 0003-2700
Zaitev, V., Rosokha, S. V., Head-Gordon, M. & Kochi, J. K. (2006). Steric Modulations in the Reversible Dimerizations of Phenalenyl Radicals via Unusually Weak Carbon-Centered - and -Bods. Journal of Organic Chemistry, Vol. 71, No. 2, pp. 520-526, ISSN 0022-3263
Zheng, S., Lan, J., Khan, S. I. & Rubin, Y. (2003). Synthesis, Characterization, and Coordination Chemistry of the 2-Azaphenalenyl Radical. Journal of American Chemical Society, Vol. 125, No. 19, (April 2003), pp. 5786-5791, ISSN 0002-7863
Rabold, G. P., Bar-Eli, K. H., Reid, E. & Weiss, K. (1965). Photochemically Generated Free Radicals. I. The Perinaphthenone System. The Journal of Chemical Physics, Vol. 42, No. 7, (April 1965), pp. 2438-2447, ISSN 0021-9606
Wain, A. J., Drouin, L. & Compton, R. G. (2006). Voltammetric Reduction of Perinaphthenone in Aqueous and Non-Aqueous Media: An Electrochemical ESR Investigation. Journal of Electroanalytical Chemistry, Vol. 589, No. 1, (April 2006), pp. 128-138, ISSN 1572-6657
Yamada, Y. & Toyoda, S. (1973). An Electron Spin Resonance Study of the Carbonization of Acenaphthylene. Bulletin of the Chemical Society of Japan, Vol. 46, No. 11, pp. 3571-3573, ISSN 1348 0634
www.intechopen.com
Crude Oil Emulsions- Composition Stability and CharacterizationEdited by Prof. Manar El-Sayed Abdul-Raouf
ISBN 978-953-51-0220-5Hard cover, 230 pagesPublisher InTechPublished online 02, March, 2012Published in print edition March, 2012
InTech EuropeUniversity Campus STeP Ri Slavka Krautzeka 83/A 51000 Rijeka, Croatia Phone: +385 (51) 770 447 Fax: +385 (51) 686 166www.intechopen.com
InTech ChinaUnit 405, Office Block, Hotel Equatorial Shanghai No.65, Yan An Road (West), Shanghai, 200040, China
Phone: +86-21-62489820 Fax: +86-21-62489821
Petroleum "black gold" is the most important nonrenewable source of energy. It is a complex mixture ofdifferent phases and components. Refining it provides a vast number of organic compounds, all of them ofwhich are used to produce petroleum based products for numerous applications, from industry to medicine,from clothing to food industries. We can find petroleum based products all around us. This book deals withsome important topics related to petroleum such as its chemical composition and stability. It is well-known thatthe chemical composition of crude oil differs according to the site of production, and its grade varies from waxyto asphaltenic crude. Both of them are refined to produce different products. The stability of crude oil on agingand transportation is governed by several factors and these factors are included within this book. Some newtechnologies for petroleum characterization are also introduced. This book is aimed at researchers, chemicalengineers and people working within the petroleum industry.
How to referenceIn order to correctly reference this scholarly work, feel free to copy and paste the following:
Marilene Turini Piccinato, Carmen Luisa Barbosa Guedes and Eduardo Di Mauro (2012). Crude Oil by EPR,Crude Oil Emulsions- Composition Stability and Characterization, Prof. Manar El-Sayed Abdul-Raouf (Ed.),ISBN: 978-953-51-0220-5, InTech, Available from: http://www.intechopen.com/books/crude-oil-emulsions-composition-stability-and-characterization/crude-and-by-product-oils-by-epr

© 2012 The Author(s). Licensee IntechOpen. This is an open access articledistributed under the terms of the Creative Commons Attribution 3.0License, which permits unrestricted use, distribution, and reproduction inany medium, provided the original work is properly cited.