Embed Size (px)
Citation preview
Duarte Miguel Garcia Raposo
MONITORING INDUSTRIAL WIRELESS SENSOR
NETWORKS: A MODEL TO ENHANCE SECURITY AND RELIABILITY
VOLUME 1
Tese no âmbito do Programa de Doutoramento em Ciências e Tecnologias da Informação, orientada pelo Professor Doutor Jorge Sá Silva, pelo Professor Doutor André Rodrigues, e pelo Professor Doutor Fernando Boavida, e apresentada ao Departamento de Engenharia Informática da Faculdade de Ciências e Tecnologia da Universidade de
Coimbra.
julho de 2019

Faculdade de Ciências e Tecnologia
da Universidade de Coimbra
Monitoring Industrial Wireless Sensor
Networks: A model to enhance Security
and Reliability
Duarte Miguel Garcia Raposo
VOLUME 1
Tese no âmbito do Programa de Doutoramento em Ciências e Tecnologias da Informação,
orientada pelo Professor Doutor Jorge Sá Silva, pelo Professor Doutor André Rodrigues, e pelo
Professor Doutor Fernando Boavida, e apresentada ao Departamento de Engenharia Informática
da Faculdade de Ciências e Tecnologia da Universidade de Coimbra.
julho de 2019


This work was partially supported by the projects I-LOCATOR and e-STEAM,Portuguese QREN IDT projects Nr. 2482/2012 and 38650/2013 (COMPETE,European Union); and by the SOCIALITE (PTDC/EEI-SCR/2072/2014) andthe MOBIWISE (P2020 SAICTPAC/0011/2015) projects, both co-financed byPortuguese COMPETE 2020.


”When I was a newspaper man, I remember I hated having to write an articlewhile there were still questions that I wanted to ask...”
Robert A. Caro


Acknowledgements
S aying thank you to everyone that help me in these last years is special,and can only be done in my native language. For me, it’s importantto choose the right words in this moment, to acknowledge the time and
dedication that my kind and gentle advisers, colleagues, friends and family spentduring this journey.
A todos/as, o meu obrigado. Não foi muito fácil chegar até aqui. Como emtudo existiram “algumas” dificuldades, mas penso que o balanço final é bastantepositivo. Refiro-me, particularmente, às pessoas que fizeram parte desta fase daminha vida – as de sempre e as que foram chegando. De algum modo, adicionamnotoriedade à tese aqui apresentada.
Em primeiro lugar, quero agradecer ao Professor Jorge, ao Professor Boavida, eao André, de igual modo – pelo incentivo, rigor e disponibilidade demonstradadurante este longo, longo percurso. De modo particular, agradecer ao ProfessorJorge a iniciativa de me propor fazer este Doutoramento, e de não ter desistidonos períodos mais difíceis. Ao Professor Boavida um agradecimento muito es-pecial pelo rigor nas múltiplas revisões de textos (nem sempre entregues com aantecedência necessária). Ao André, agradeço a partilha de toda esta jornada.Agradeço todas as nossas conversas, que me ajudaram a superar muitos desafios,a persistência, o interesse e a amizade.
Em segundo lugar, agradeço a todos/as os/as meus/minhas colegas dos labor-atórios do G6.1, G6.2 e no geral à família do LCT. Foram bons parceiros aolongo destes anos. Agradeço ao David Nunes e ao Dien que estiveram presentesnuma primeira etapa. Ao Marcelo, à Soraya, ao Ngombo, ao Oswaldo e à Inêspor toda a ajuda ao longo destes últimos 3 anos no projeto Socialite. Marcelo,Soraya e Ngombo o quadro do laboratório não vai ter a mesma graça/piada semos nossos diagramas. Jorge Proença, Tiago Cruz, David e Karima obrigado pelavossa presença.
Em terceiro lugar, mostrar a minha gratidão aos meus ex-colegas da eneida,ao Flávio, ao José e ao Luís. Ao Flávio, por ser um amigo que esteve sempredisponível, pelas longas conversas sobre os mais variados tópicos, e por todo oconhecimento que sempre partilha. Ao José, por ter tentado, desde o início,encontrar um caminho. Ao Luís pela ajuda na construção da testbed.
E sim, a ti Andreia. Que neste momento estás a corrigir este texto, adescomplicá-lo como sempre fazes. Como sempre consigo-te roubar um sor-riso. Obrigado pela tua dedicação, entrega e ajuda em momentos difíceis. Porestares em todos os momentos especiais, desde a primeira apresentação, até àúltima. Pelo conforto quando a situação mostrava o contrário. Pela tua alegria.Adorei partilhar esta etapa contigo.
Com um especial e enorme carinho a toda a nossa família, aos meus pais, à

minha avó, e aos que já não estão presentes e que gostariam de hoje estar aqui.Obrigado pelo que têm feito ao longo da vossa vida.
Gostaria de agradecer também à Cristina, por mostrar mais do mundo, e pordesde muito cedo me ter incentivado a fazer este percurso. Por fim, gostariatambém de agradecer à professora, pelos conselhos que me deu e não segui, e àsua contagiante boa disposição.
Abstract
A new generation of industrial systems are growing, in a new industrialevolution that connects wireless technologies with powerful devices,capable to make their own decisions. In the Industry 4.0 paradigm,
industrial systems are becoming more powerful and complex in order to keepwith the requirements needed to build Cyber Physical Systems (CPSs). Toachieve such paradigm, Industrial Wireless Sensor Networks (IWSNs) are a key-technology capable to achieve micro-intelligence, with low-cost, and mobility,reducing even further today’s already short production cycles, and at the sametime allowing new industrial applications. Specifically, in the last decade, morereliable and deterministic standards were proposed, all of them sharing the samebase technology, the IEEE802.15.4 standard. At the same time, until now, In-dustrial Control Systems (ICSs) have remained disconnected from the Inter-net, relying in the airgap principle to ensure security. Nevertheless, there is alack of post-deployment tools to monitor technologies like the WirelessHART,ISA100.11a, WIA-PA and the ZigBee standards, contrary to what happens withmost common wired technologies. The lack of these tools can be explained byseveral characteristics present in current Internet of Things (IoT) devices like thefragmentation of the operating systems, the need to develop specific firmwarefor each application, different hardware architectures; etc.
Thus, in this thesis, and looking for the current challenges of Industrial IoT(IIoT) technologies, a monitoring model is proposed, capable not only to mon-itor current industrial networks based on the IEEE802.15.4 standard, but alsothe in-node components of sensor nodes, in several hardware and firmware ar-chitectures. The proposed architecture explores several techniques to obtainfree monitoring metrics; agents in charge of processing these metrics; and reliesin management standards to share all the monitoring information. To provethe performance of this proposal, a WirelessHART testbed was built, as wellas the different components presented in the architectural model. Additionally,using representative anomalies, injected in a WirelessHART testbed, an Anom-aly Detection system capable to detect network anomalies and security attackswas built, proving the effectiveness of the presented model in the network per-spective. In the same way, in order to prove the effectiveness in the detectionof firmware and hardware anomalies, an Anomaly Detection system for in-nodecomponents was also built. The two Anomaly Detection systems were able todetect with high recall and low false positive ratio the anomalies inserted in thesystems, proving that the proposed model can be used as a post-deploymenttool in real industrial scenarios.
Keywords: Monitoring; Industrial IoT; Wireless Sensor Networks; AnomalyDetection; WirelessHART; ISA100.11a; WIA-PA; ZigBee; Industry 4.0; FaultTaxonomy; Attack tools; Anomaly Injection.

Resumo
A tualmente assiste-se a uma nova geração de sistemas industriais, numaevolução que junta tecnologias sem fios com dispositivos embebidos,cada vez mais inteligentes e capazes. No âmbito da Indústria 4.0, os
sistemas industriais tornaram-se mais potentes e complexos, em resposta aosrequisitos impostos pelos novos Sistemas Ciber-Físicos. No panorama atual,as Redes de Sensores Sem Fios Industriais são uma tecnologia-chave, capaz defornecer micro-inteligência, e mobilidade, a um baixo-custo, reduzindo cada vezmais os ciclos de produção industrial, e permitindo novos tipos de aplicações.Por esta razão, durante a última década, várias tecnologias baseadas na normaIEEE802.15.4 foram desenvolvidas e propostas, oferecendo técnicas de transmis-são mais fiáveis e determinísticas. Ainda, no domínio da segurança, assistimostambém a uma mudança de paradigma neste tipo de sistemas. O paradigmautilizado até então, regia-se através de políticas de segurança que privilegiavamo isolamento. Porém, a conexão destes sistemas à Internet origina um novoconjunto de ameaças externas, que tem crescido progressivamente. De modo amanter a fiabilidade, as ferramentas de monitorização em ambiente de produçãopermitem uma constante monitorização dos sistemas, prevenindo eventuais fal-has. Contudo, existe uma ausência de ferramentas para normas como o Wire-lessHART, ISA100.11a, WIA-PA e ZigBee, ao contrário do que acontece no casodas tecnologias legadas. Esta lacuna pode ser explicada pelas diferentes carac-terísticas presentes nos dispositivos IoT, como por exemplo, a fragmentação dossistemas operativos, a necessidade de desenvolver firmware específico para cadaaplicação, e os diferentes tipos de arquitecturas de hardware existentes.
O trabalho desenvolvido nesta tese, apresenta um novo modelo de arquitetura demonitorização, não só capaz de monitorizar as tecnologias industriais baseadasna norma IEEE802.15.4, como também os próprios componentes internos dosnós-sensores (em diferentes arquiteturas de firmware e hardware). O modelo dearquitetura proposto apresenta técnicas que permitem obter métricas de estadosem custos, partilhadas através de protocolos de gestão, por agentes responsá-veis pela respetiva aquisição. Para confirmar o baixo impacto da arquiteturaproposta foi criada uma testbed utilizando a norma WirelessHART, com todosos agentes. Adicionalmente, para provar a eficácia e utilidade da arquiteturaforam desenvolvidos dois sistemas de deteção de anomalias: o primeiro permitea deteção de anomalias de rede; e o segundo possibilita a deteção de anomaliasno firmware e hardware nos nós-sensores. Estes sistemas foram avaliados, at-ravés da injeção de anomalias de rede, firmware e hardware. Os dois sistemasde deteção propostos conseguiram identificar os comportamentos anómalos comalto recall e baixo false positive ratio, provando assim, que o modelo propostopoderá ser utilizado como ferramenta de diagnóstico em redes de sensores semfios industriais.
Palavras-chave: Monitorização; IoT Industrial; Redes de Sensores Sem

Fios; Detecção de Anomalias; WirelessHART; ISA100.11a; WIA-PA; ZigBee;Indústria 4.0; Taxonomia de Falhas; Ferramentas de Ataque; Injeção de Anom-alias.
Foreword
D uring this PhD program, the practical knowledge acquired working inindustrial projects, and the theoretical and deep concepts acquired inthe academic projects, contributed to the development of this work.
Working in the industrial field, in a company like eneida® Wireless & Sensors,helped me to have a clear and broader vision in the development of industrialproducts, starting with the first phases (requirements and hardware design), tothe deployment of the products in fields like oil&gas, mines and electric. At thesame time, working as a researcher in different projects of the Communicationand Telematics (CT) group of the Centre for Informatics and Systems of theUniversity of Coimbra (CISUC) helped me to explore in deep new technologies,tools and concepts presented by the academic community, giving me a clearvision of the future of these technologies. Thus, in this section some of theacademic and industrial projects are presented, as well as the contribution ofeach of the topics addressed in this thesis.
I-LOCATOR Project : Eneida Precise Real-Time Industrial Location (I-LOCATOR), co-financed by QREN (24842/2012). The aim of this R&Dproject was the development of a real time location system of goods andpeople in highly demanding industrial environments, like refineries andmines, using WSN and industrial wired networks. The activities per-formed in the scope of this project was the study of the maximum the-oretical throughput of the networks, in order to guide the deployment ofthe network in industrial environments. To this thesis, the project con-tributed by being the first contact with wired base standards like CAN,and the study of the different MAC layer approaches in wired and wirelessstandards, presented in the section 2. The results of the project were twonational patents, and a co-author publication in the IECON conference.
iCIS Project : Intelligent Computing in the Internet of Services (iCIS) project(CENTRO-07-ST24-FEDER-002003), co-financed by QREN, in the scopeof the “Mais Centro” Program. The goal of this project was the study ofthe current state of the art in WSN faults. In this project a new taxonomyof faults for WSN was proposed and developed. It is presented in section3. The achieved results were published in the Journal of Network andSystems Management (JNSM).
e-STEAM Project : Eneida Sensing Transmitters With Energy Harvesting ForAssets Monitoring (E-STEAM), co-financed by QREN (38650/2013). Theaim of this R&D project was the development of two smart sensors thatmonitor the condition of steam valves and steam traps, using a low-powermesh wireless network standard, the WirelessHART. The activities per-formed in this project were the development of the firmware to interactwith the WirelessHART radio, as well as all the network configurations
needed to the scenario. The testbed developed in this project was usedto test and evaluate the architectural model proposed in this thesis. Thework performed in this project contributed to section 4, 5 and 6, and tothe publications in the LCN, NCA and WoWMoM conferences, and in theMDPI Sensor journal.
Socialite Project : Social-Oriented IoT Architecture, Solutions and Environ-ment project (PTDC/EEI-SCR/2072/2014), co-financed by COMPETE2020 Program. The aim of this project was to explore the developed mid-dleware and services in people-centric contexts, with the aim of demon-strating their use in enhancing the autonomy and quality of life of citizens.The activities performed in the context of this project were the develop-ment and configuration of all middleware services responsible to: repres-ent and store the data context, secure and make data anonymous; andinteract with IoT devices like smartphones, smartwatches and WSN. Thework performed in this project contributed to this thesis in the manage-ment and data representation domain, presented in section 2 and 4, and insome co-author publications in SOCIALSENS, INFOCOM, RecPad, IEEESENSORS, WoWMoM and PAMS conferences.
This work was funded by the following grants:
Project grant Intelligent Computing in the Internet of Services (iCIS) project(CENTRO-07-ST24-FEDER-002003), from September 2014 to June 2015.
Project grant Social-Oriented Internet of Things Architecture, Solutions andEnvironment (SOCIALITE), June 2016 to June 2019.
The outcome of the design, experiments, and assessments of several mechanismson the course of this thesis resulted in the following publications:
Journal papers:
• D. Raposo, A. Rodrigues, S. Sinche, J. Sá Silva, and F. Boavida, “Indus-trial IoT Monitoring: Technologies and Architecture Proposal”Sensors, vol. 18, no. 10, 2018. Impact factor: 2.475
• D. Raposo, A. Rodrigues, J. S. Silva, and F. Boavida, “A Taxonomyof Faults for Wireless Sensor Networks”, Journal of Network andSystems Management, pp. 1-21, 2017. Impact factor: 1.75
Conference papers:
• D. Raposo, A. Rodrigues, S. Sinche, J. S. Silva, and F. Boavida, “Securityand Fault Detection in In-node Components of IIoT ConstrainedDevices” in 2019 IEEE 44th Conference on Local Computer Networks(LCN), 2019.
• D. Raposo, A. Rodrigues, S. Sinche, J. S. Silva, and F. Boavida, “Secur-ing WirelessHART: Monitoring, Exploring and Detecting New
Vulnerabilities” in 2018 IEEE 17th International Symposium on Net-work Computing and Applications (NCA), 2018, pp. 1–9.
• D. Raposo, A. Rodrigues, J. S. Silva, F. Boavida, J. Oliveira, and C.Herrera, “An autonomous diagnostic tool for the WirelessHARTindustrial standard”, in 2016 IEEE 17th International Symposium onA World of Wireless, Mobile and Multimedia Networks (WoWMoM), 2016
Cooperation papers:
• J. Fernandes, D. Raposo, S. Sinche, N. Armando, J. S. Silva, A.Rodrigues, L. Macedo, H. Oliveira, and F. Boavida, “A Human-in-the-Loop Cyber-Physical Approach for Students’ Performance As-sessment”, in SOCIALSENS 2019, the Fourth International Workshopon Social Sensing, Montreal, QC, Canada 15th April, 2019
• J. Fernandes, D. Raposo, N. Armando, S. Sinche, J. S. Silva, A.Rodrigues, V. Pereira, F. Boavida, “An Integrated Approach toHuman-in-the-Loop Systems and Online Social Sensing”, in IEEECAOS19,The First IEEE INFOCOM Workshop on the Communicationsand Networking Aspects of Online Social Networks, Paris, France 29thApril, 2019
• R. Sharma, B. Ribeiro, A. M. Pinto, A. Cardoso, D. Raposo, A.Ngombo, A. Rodrigues, J. S. Silva, H. Oliveira, L. Macedo and F.Boavida,“Unveiling Markers of Stress Via Smartphone Usage”,in Pattern Recognition (RecPad), 2018
• S. Sinche, J. S. Silva, D. Raposo, A. Rodrigues, V. Pereira and F.Boavida, “Towards Effective IoT Management”, in IEEE Sensors2018 international conference, New Delhi, India, 28-31 October 2018., 2018
• S. Sinche, O. Polo, D. Raposo, M. Fernandes, F. Boavida, A. Rodrigues,V. Pereira, and J.S. Silva, “Assessing Redundancy Models for IoTReliability”. In IEEE 19th International Symposium on A World ofWireless, Mobile and Multimedia Networks (WoWMoM), 2018.
• N. Armando, D. Raposo, M. Fernandes, A. Rodrigues, J. S. Silva, F.Boavida, “WSNs in FIWARE – Towards the Development ofPeople-centric Applications”, Proceedings of PAAMS 2017 - 15th In-ternational Conference on Practical Appl”, in PAAMS 2017 - 15th Inter-national Conference on Practical Applications of Agents and Multi-AgentSystems, 2017 [10.1007/978-3-319-60285-1_38]
• A. Reis, D. S. Nunes, H. M. Aguiar, H.B.P.D. Dias, R. Barbosa, A.Figueira, S. Sinche, D. Raposo, V. Pereira, J. S. Silva, F. Boavida, A.Rodrigues and C. Herrera, “Tech4SocialChange: crowd-sourcing tobring migrants experiences to the academics”, in Global Humanit-arian Technology Conference (GHTC), 2016
• A. Figueira, D.S. Nunes, R. Barbosa, A. Reis, H.M. Aguiar, S. Synche, A.Rodrigues, V. Pereira, H.B.P.D. Dias, C. Herrera, D. Raposo, J.S. Silva,
F. Boavida, “WeDoCare: A Humanitarian People-centric Cyber-Physical System for the benefit of Refugees”, in Global Humanit-arian Technology Conference (GHTC), 2016
• A. Reis, D.S. Nunes, H.M. Aguiar, H.B.P.D. Dias, R. Barbosa, A. Figueira,A. Rodrigues, S. Synche, D. Raposo, V. Pereira, J.S. Silva, F. Boavida,C. Herrera and C. Egas, “Tech4SocialChange - Technology for All”,in International Conference on Innovations for Community Services, 2016
• D.S. Nunes, D. Raposo, D. Silva, P. Carmona, and J.S. Silva, “Achiev-ing Human-Aware Seamless Handoff”, in 7th International Workshopon Performance Control in Wireless Sensor Networks (PWSN15). Work-shop of DCOSS 2015, 2015
• P. Carmona, D.S. Nunes, D. Raposo, D. Silva, C. Herrera, and J.S.Silva , “Happy Hour - Improving Mood With An EmotionallyAware Application”, in 15th International Conference on Innovationsfor Community Services (I4CS), 2015
• J. Oliveira, S. Semedo, D. Raposo and F. Cardoso, “Place&Play in-dustrial router addressing potential explosive atmospheres”, inIECON 2014 - 40th Annual Conference of the IEEE Industrial ElectronicsSociety, 2014
• D. Nunes, T.-D. Tran, D. Raposo, A. Pinto, A. Gomes, and J. S. Silva,“A web service-based framework model for people-centric sens-ing applications applied to social networking,” Sensors, vol. 12, no.2, 2012.
Patents:
• J. Oliveira, F. Cordeiro, N. Sousa, T. Dien, D. Raposo; PT 108763 A– “System and Method for Energy Saving in Wireless SensorsNetworks”; patent filled in 2015, August 10
• J. Oliveira, F. Cordeiro, N. Sousa, T. Dien, D. Raposo; PT 107579 A –“System and Method for Real-time, Three-dimensional AccurateLocation”; patent filled in 2014, April 10.
Contents
Acknowledgements ix
Abstract xi
Resumo xiii
Foreword xv
List of Figures xxiii
List of Tables xxv
Acronyms xxvii
1 Introduction 11.1 Motivation and Problem Statement . . . . . . . . . . . . . . . . 21.2 Objectives and Contributions . . . . . . . . . . . . . . . . . . . 41.3 Outline of the Thesis . . . . . . . . . . . . . . . . . . . . . . . . 6
2 General Background 92.1 IWSN Applications and Requirements . . . . . . . . . . . . . . 102.2 Technologies for Industrial IoT . . . . . . . . . . . . . . . . . . 13
2.2.1 Industrial Wired Standards . . . . . . . . . . . . . . . . 142.2.2 IWSN Standards . . . . . . . . . . . . . . . . . . . . . . 152.2.3 IWSN Reports . . . . . . . . . . . . . . . . . . . . . . . 18
2.3 Management of Constrained Devices . . . . . . . . . . . . . . . 212.4 Survey of Current Diagnostic Tools . . . . . . . . . . . . . . . . 24
2.4.1 Network Tools . . . . . . . . . . . . . . . . . . . . . . . 242.4.2 Firmware Tools . . . . . . . . . . . . . . . . . . . . . . . 252.4.3 Hardware Tools . . . . . . . . . . . . . . . . . . . . . . . 26
2.5 Solutions and Approaches: Security and Reliability . . . . . . . 272.6 Summary of the Chapter . . . . . . . . . . . . . . . . . . . . . . 28
3 WSN Faults 313.1 Introduction . . . . . . . . . . . . . . . . . . . . . . . . . . . . . 323.2 Motivation . . . . . . . . . . . . . . . . . . . . . . . . . . . . . . 333.3 Concepts and Techniques . . . . . . . . . . . . . . . . . . . . . . 34
3.3.1 Systems, Components and Services in WSN . . . . . . . 343.3.2 Faults, Errors, Failures and Anomalies . . . . . . . . . . 353.3.3 Fault Management Techniques . . . . . . . . . . . . . . 37
xix
Contents
3.4 WSN Fault Taxonomy . . . . . . . . . . . . . . . . . . . . . . . 393.4.1 Phase of Creation or Occurrence . . . . . . . . . . . . . 393.4.2 System Boundary . . . . . . . . . . . . . . . . . . . . . . 413.4.3 Phenomenological Cause . . . . . . . . . . . . . . . . . . 423.4.4 Dimension . . . . . . . . . . . . . . . . . . . . . . . . . . 433.4.5 Objective . . . . . . . . . . . . . . . . . . . . . . . . . . 433.4.6 Intent . . . . . . . . . . . . . . . . . . . . . . . . . . . . 453.4.7 Capability . . . . . . . . . . . . . . . . . . . . . . . . . . 453.4.8 Persistence . . . . . . . . . . . . . . . . . . . . . . . . . 463.4.9 State . . . . . . . . . . . . . . . . . . . . . . . . . . . . . 473.4.10 Reproducibility . . . . . . . . . . . . . . . . . . . . . . . 483.4.11 Source System . . . . . . . . . . . . . . . . . . . . . . . 48
3.5 Related Work . . . . . . . . . . . . . . . . . . . . . . . . . . . . 503.6 Summary of the Chapter . . . . . . . . . . . . . . . . . . . . . . 51
4 The Proposed Monitoring Architecture 534.1 Architecture Overview . . . . . . . . . . . . . . . . . . . . . . . 554.2 Sensor Node Monitoring Agent Overview . . . . . . . . . . . . . 56
4.2.1 Hardware Metrics Collection . . . . . . . . . . . . . . . . 574.2.2 Firmware Metrics Collection . . . . . . . . . . . . . . . . 584.2.3 Transport of Collected Data . . . . . . . . . . . . . . . . 59
4.3 Gateway Monitoring Agent . . . . . . . . . . . . . . . . . . . . 634.4 Monitoring Logger . . . . . . . . . . . . . . . . . . . . . . . . . 634.5 Management Agents and Management System . . . . . . . . . . 644.6 Building a Proof-of-Concept . . . . . . . . . . . . . . . . . . . . 65
4.6.1 Test Scenario . . . . . . . . . . . . . . . . . . . . . . . . 664.6.2 Collected Metrics . . . . . . . . . . . . . . . . . . . . . . 684.6.3 Sensor Node Instrumentation and Monitoring Informa-
tion Processing . . . . . . . . . . . . . . . . . . . . . . . 694.6.4 Results . . . . . . . . . . . . . . . . . . . . . . . . . . . 70
4.7 Related Work . . . . . . . . . . . . . . . . . . . . . . . . . . . . 734.8 Summary of the Chapter . . . . . . . . . . . . . . . . . . . . . . 75
5 Attack, detect and explore new vulnerabilities in WirelessHART 775.1 Introduction . . . . . . . . . . . . . . . . . . . . . . . . . . . . . 785.2 WirelessHART from a Security Perspective . . . . . . . . . . . . 79
5.2.1 WirelessHART Security . . . . . . . . . . . . . . . . . . 805.2.2 Threat Analysis . . . . . . . . . . . . . . . . . . . . . . . 81
5.3 Attack Tools . . . . . . . . . . . . . . . . . . . . . . . . . . . . 835.4 Attacking an WirelessHART Network . . . . . . . . . . . . . . . 84
5.4.1 Jamming . . . . . . . . . . . . . . . . . . . . . . . . . . 845.4.2 Advertisement Based Attack . . . . . . . . . . . . . . . . 85
5.5 Detecting the Threats . . . . . . . . . . . . . . . . . . . . . . . 865.6 Summary of the Chapter . . . . . . . . . . . . . . . . . . . . . . 89
6 Security and Fault Detection in In-node components of IIoT Con-strained Devices 916.1 Introduction . . . . . . . . . . . . . . . . . . . . . . . . . . . . . 92
xx
Contents
6.2 Injecting Anomalies . . . . . . . . . . . . . . . . . . . . . . . . . 936.2.1 Firmware: Stack-Based Buffer Overflow . . . . . . . . . 936.2.2 Hardware: Low-voltage Faults Analysis . . . . . . . . . . 966.2.3 Hardware: SPI Faults . . . . . . . . . . . . . . . . . . . 976.2.4 Hardware: High Temperature Faults . . . . . . . . . . . 99
6.3 Detecting Anomalies And Security Threats . . . . . . . . . . . . 1006.3.1 Data Splitting Strategy and Classifiers . . . . . . . . . . 1006.3.2 Results . . . . . . . . . . . . . . . . . . . . . . . . . . . 103
6.4 Summary of the Chapter . . . . . . . . . . . . . . . . . . . . . . 104
7 Conclusions and Future Work 1057.1 Synthesis of the Thesis . . . . . . . . . . . . . . . . . . . . . . . 1067.2 Future Work . . . . . . . . . . . . . . . . . . . . . . . . . . . . 108
Bibliography 111
xxi

List of Figures
3.1 Systems, services and environment . . . . . . . . . . . . . . . . 353.2 System components . . . . . . . . . . . . . . . . . . . . . . . . . 363.3 WSN system, components and services . . . . . . . . . . . . . . 363.4 Sensor node system anomaly example . . . . . . . . . . . . . . 373.5 Taxonomy of faults in WSNs . . . . . . . . . . . . . . . . . . . 40
4.1 Proposed monitoring architecture . . . . . . . . . . . . . . . . . 564.2 Validation of the monitoring architecture using a WirelessHART
testbed . . . . . . . . . . . . . . . . . . . . . . . . . . . . . . . . 664.3 On the left, (a) the application architecture and the sensor node
monitoring agent acquiring the state information. On the right,(b) the request of the WirelessHART publish service . . . . . . 69
4.4 Obtained results . . . . . . . . . . . . . . . . . . . . . . . . . . 71
5.1 On the left (a) the timeslot structure in time and frequency. Onthe right, (b) the DLL frame and the NWK packet structures . 80
5.2 Attack tools . . . . . . . . . . . . . . . . . . . . . . . . . . . . . 835.3 WirelessHART attacks overview . . . . . . . . . . . . . . . . . . 87
6.1 Buffer Overflow stack-based attack on MSP430F5 family . . . . 956.2 Firmware anomaly: stack-based buffer overflow attack . . . . . 966.3 Hardware based anomaly: undervolting anomaly . . . . . . . . . 976.4 Hardware based anomaly: SPI VCC and Clock anomaly . . . . 986.5 Hardware based anomaly: Temperature anomaly . . . . . . . . 996.6 Machine Learning strategy and process . . . . . . . . . . . . . . 1016.7 OCSVM TPR/FPR with different parameters . . . . . . . . . . 103
xxiii

List of Tables
2.1 Industrial applications defined by ISA . . . . . . . . . . . . . . 102.2 Summary of main features, adapted from [Wang and Jiang, 2016;
Zand et al., 2012a] . . . . . . . . . . . . . . . . . . . . . . . . . 162.3 IWSN Network metrics . . . . . . . . . . . . . . . . . . . . . . . 192.4 Network management protocols revision . . . . . . . . . . . . . 23
3.1 Phase of creation or occurrence fault examples . . . . . . . . . . 413.2 Fault examples from the system boundary point of view . . . . 423.3 Fault examples from the phenomenological cause point of view . 433.4 Software and hardware dimension fault examples . . . . . . . . 443.5 Fault examples from the objective point of view . . . . . . . . . 453.6 Fault examples from the intent point of view . . . . . . . . . . . 453.7 Fault examples from the capability point of view . . . . . . . . 463.8 Fault examples from the persistence point of view . . . . . . . . 473.9 Fault examples from the state perspective . . . . . . . . . . . . 483.10 Fault examples from the reproducibility perspective . . . . . . . 483.11 Fault examples from the source system perspective . . . . . . . 50
4.1 Network transport revision . . . . . . . . . . . . . . . . . . . . . 624.2 Evaluation results overview . . . . . . . . . . . . . . . . . . . . 73
5.1 Network diagnostic using the health packets . . . . . . . . . . . 885.2 OCSVM classifier results . . . . . . . . . . . . . . . . . . . . . . 88
6.1 Splitting strategy in training, validation, and test phases . . . . 1016.2 Classifier results for hardware and firmware anomalies . . . . . . 103
xxv

Acronyms
ACLK Auxiliary Clock
AES Advanced Encryption Standard
AIC Availability, Integrity and Confidentiality
AODV Ad hoc On-Demand Distance Vector
APP Application
APS Application Sub-Layer
ARM Advanced RISC Machine
ASN Absolut Slot Number
BK Broadcast Key
BSP Board Support Package
CAP Contention Access Period
CAPEX Capital Expenditure
CBC-MAC Chipher Block Chaining Message Authentication Code
CCA Clear Channel Assessment
CCS Code Composer Studio
CFP Contention Free Period
CIL C Intermediate Language
CLK Clock
COAP Constrained Application Protocol
COMI CoAP Management Interface
CPS Cyber Physical System
CRC Cyclic Redundancy Check
CSMA Carrier Sense Multiple Access
CT Communication and Telematics
DLL Data Link Layer
DLPDU Data Link Layer Protocol Data Unit
DWT Data Watch Point
xxvii

Acronyms
DoS Denial of Service
ECU Electronic Control Unit
ENISA European Network and Information Security Agency
ETM Embedded Trace Macrocell
FF Foundation Fieldbus
FIFO First In First Out
HIL Hardware in Loop
HTTP Hypertext Transfer Protocol
ICS Industrial Control Systems
ICT Information Communication Technologies
IDE Integrated Development Environments
IDS Intrusion Detection System
IEC International Electrotechnical Commission
IETF Internet Engineering Task Force
IIOT Industrial Internet of Things
IOT Internet of Things
IP Internet Protocol
ISA International Society of Automation
ISM Industrial, Scientific and Medical
IWSN Industrial Wireless Sensor Network
IoT Internet of Things
JK Join Key
JTAG Joint Test Action Group
LNMP LoWPAN Network Management Protocol
LPM Low Power Mode
LwM2M Lightweight M2M
M2M Machine-to-Machine
MAC Media Access Control
MCLK Master Clock
MCU Microcontroller Unit
MIB Management Information Base
MIC Message Integrity Check
xxviii
Acronyms
MISO Master Input Slave Output
MOSI Master Output Slave Input
MQTT Message Queuing Telemetry Transport
MTTR Mean Time to Repair
MTU Maximum Transmission Unit
NETCONF Network Configuration Protocol
NK Network Key
NLPDU Network Layer Protocol Data Unit
NM Network Manager
NWK Network
OCSVM One Class Support Vector Machine
OEM Original Equipment Manufacturer
OID Object Identifier
OPEX Operational Expenditure
OS Operating System
OSI Open System Interconnection
PAN Personal Area Network
PDR Packet Delivery Ratio
PHY Physical
PL Packet Loss
PLC Programmable Logic Controller
QoS Quality of Service
RAM Random Access Memory
RFC Request for Comments
RSL Receive Signal Level
SA Security Administrator
SCADA Supervisory Control and Data Acquisition
SK Session Key
SMCLK Sub-main Clock
SMI Structure of Management Information
SNMP Simple Network Management Protocol
SPI Serial Peripheral Interface
xxix
Acronyms
SRA Safety, Reliability and Availability
TAI International Atomic Time
TDMA Time Division Multiple Access
TP Transport
TSCH Time Synchronized Channel Hopping
UAO User Application Object
UART Universal Asynchronous Receiver-Transmitter
UK Unicast Key
UTC Universal Time Coordinated
VCR Virtual Communication Relationship
WDP Watch Dog Processor
WK Well-known Key
WSN Wireless Sensor Network
XML Extensible Markup Language
YANG Yet Another Next Generation
kNN k Nearest Neighbours
xxx
Chapter 1Introduction
”Success consists of goingfrom failure to failure withoutloss of enthusiasm”
(Winston Churchill)
Contents1.1 Motivation and Problem Statement . . . . . . . . . . 21.2 Objectives and Contributions . . . . . . . . . . . . . 41.3 Outline of the Thesis . . . . . . . . . . . . . . . . . . 6
— 1 —
CHAPTER 1. INTRODUCTION
I oT wireless based solutions are growing and being deployed in the indus-trial field. However, at the same time, there is a lack of post-deploymenttools to monitor these technologies. Such tools are needed as an answer to
the security challenges bought by the connection of the industry to the Internet,and by the increase of hardware and firmware complexity. The work presentedin this thesis aims the proposing of a monitoring architecture that can be usedto improve the reliability and security of current industrial IEEE802.15.4 basedtechnologies by supporting monitoring at all domains (network itself, node firm-ware, and node hardware). The proposed solution proves that it is possible tobuild new post-deployment tools that monitor the network and the in-node com-ponents of sensor nodes, with low impact on sensor nodes resources and withoutthe need of extra hardware. The motivation and problem statement of this thesisare presented below, followed by the main objectives and contributions. At theend of the chapter the outline of this thesis is presented.
1.1 Motivation and Problem Statement
The Internet of Things (IoT) currently makes it possible to have a world sensedby and connected to all kinds of devices. Wireless Sensor Network (WSN) tech-nology is the key for connecting physical and virtual environments. This tech-nology is growing up so rapidly that in 2011 Cisco-IBSG estimated that globallythere would be 50 billion interconnected “things” by 2020 [Evans, 2011]. TheIoT paradigm leads to an extremely large number of new opportunities andtechnical challenges in several fields, and in the industrial field in particular.In industry, wired technologies continue to be prevalent [Chang et al., 2016;Petersen and Carlsen, 2011]. Digital technologies like ModBus, ProfiBus, Can-Bus, HART [Nobre et al., 2015], and even analogue technologies like 4-20mA[Kim et al., 2008], are used to monitor and control most processes. Despitethe high reliability of such technologies, proven over many years, wired tech-nologies are expensive, difficult to install, time consuming, and unable to copewith the requirements of Cyber Physical Systems (CPSs) and Industry 4.0. InIndustry 4.0, CPSs will confer micro intelligence (namely processing and net-working capabilities) to industrial objects, reducing even further today’s alreadyshort production cycles [Trappey et al., 2016]. Thus, WSNs or, more specifically,Industrial Wireless Sensor Networks (IWSNs), are fundamental for meeting therequirements of Industry 4.0.
IWSNs characteristics like low operating costs, self-organization, self-configuration, flexibility, rapid-deployment, and easy upgrading, make themideal to industrial scenarios. However, despite all of these favourable character-istics, the adoption of WSNs in industry requires standards, dependability, easeof use, network security, extended battery lifetime, low cost, and IP connectivity[Wang and Jiang, 2016]. In recent years, considerable effort was made in order todesign technologies that meet these requirements, and to standardize IWSN solu-tions. Standards like IEEE 802.15.4[IEEE, 2006] and IEEE 802.15.1[IEEE, 2002]are the technology foundation of many industrial applications for process and
— 2 —
CHAPTER 1. INTRODUCTION
factory automation. IEEE 802.15.4 is the base technology for standards such asZigBee[Alliance, 2015], WirelessHART[IEC, 2010], ISA100.11a[ISA, 2009], andWIA-PA[IEC, 2015]. These are widely used in process automation applicationsin the areas of chemical manufacturing, pulp & paper, oil & gas, and glass &mineral. On the other hand, IEEE 802.15.1 is the base technology for stand-ards such as WISA[Scheible et al., 2007] and WSAN-FA[Wang and Jiang, 2016],widely used in factory automation applications in the areas of assembly processfor automotive, consumer products and electronics [Zand et al., 2012a].
Nevertheless, although standards compliance is necessary, it is not enough toguarantee IWSN reliability per se. Sensor node components, either at hardwareor firmware levels, and the network itself, can be at the root of a variety offaults (see chapter 3). Sensor nodes are inherently resource-constrained devicesin terms of energy, processing power and memory capacity. In this respect, theInternet Engineering Task Force (IETF) recently defined three classes of devices[Bormann et al., 2014]: Class 0 for devices with less than 10KB of RAM and100KB of flash memory; Class 1 for devices with around 10KB of RAM and100KB of flash; and Class 2 for devices that have more resources but are stillquite constrained when compared to high-end devices. In addition to the men-tioned device constraints, sensor, network, and application heterogeneity lead toextremely complex IWSN solutions and, consequently, to fault-proneness. Thesecharacteristics impose adequate, carefully-designed strategies in the developmentof sensor nodes firmware, hardware architectures, and operating systems (OSs)kernel (e.g., choosing between exokernel, microkernel, monolithic approach orhybrid approach) [Hahm et al., 2016]. As an way of example, OEM manu-facturers can build their products based on a single chip (comprising wirelesscommunications and processing capabilities) [Instruments, 2017a], or using amicrocontroller and a separate radio (connected by Serial Peripheral Interface(SPI) or Universal Asynchronous Receiver-Transmitter (UART)) [Instruments,2017b]. Furthermore, applications may be developed on “bare metal” (whichmakes them very hardware-specific), or using one of the available OSs (e.g., Con-tiki[Dunkels et al., 2004], RIOT[Baccelli et al., 2013], FreeRTOS[Barry, 2018]).Another important component is the network. For instance, despite the inclusionof security mechanisms in all of the referred standards, there are known attackson WirelessHART, ZigBee ISA100.11a, and WIA-PA [Alcaraz and Lopez, 2010;Raza et al., 2009; Islam et al., 2012; Qi et al., 2014]. Additionally, some of thesetechnologies, namely WirelessHART, ZigBee, and WIA-PA, are not immuneto interference from equipment complying with other standards, such as IEEE802.11, when operating in the ISM 2.4GHz frequency band. Such problemsmay lead to early sensor node energy depletion, and subsequent replacement,increasing the costs of network operation.
Vulnerabilities in industrial systems have also been explored by attackers in cy-berwar. Examples of attacks to wired-based technologies are the Stuxnet and theSlammer worms [Do et al., 2017], each one infecting the Supervisory Control andData Acquisition (SCADA) software and causing significant damage in indus-trial assets and, consequently, economic losses. Furthermore, with the additionof micro-intelligence to these systems, the hardware and software components
— 3 —
CHAPTER 1. INTRODUCTION
are becoming more complex. Thus, is inevitable that such systems contain moresoftware vulnerabilities and, at the same time, become vulnerable to hardwarefailures [Chaturvedi, 2016]. The Taum Sauk incident in 2005 is an example ofsuch failure. The incident report showed that sensors failed to indicate that thereservoir was full, and, consequently, the water overflowed, resulting in the col-lapse of the reservoir. In the cyber-security topic, IWSNs have been neglectedby the scientific and industrial community in the last years, by proposing solu-tions that only address wired-based technologies. As a consequence of IWSNfaulty nature, post-deployment tools are needed in order to adequately monitorIWSNs, thus contributing to the global system reliability and security.
In the last decade, a wide range of WSN post-deployment tools [Rodrigues et al.,2013] were developed. Some of them can improve the reliability of WSNs bydetecting network, firmware, and/or hardware problems. These tools help de-velopers in both deployment and post-deployment environments by making sev-eral firmware- and hardware-related metrics accessible, and by detecting prob-lems, using for instance, sniffers or sink nodes. However, despite the effort tobuild such tools, most of them were designed for specific applications, requirespecific or dedicated hardware, consume non-negligible amounts of energy, donot implement security mechanisms, are complex to configure and/or to use,and do not allow the centralized management of multiple industrial standardslike ZigBee, WirelessHART, ISA100.11a, and WIA-PA.
1.2 Objectives and Contributions
The aim of this thesis is to improve the security and reliability of IWSNs us-ing monitoring techniques that continuously monitor the condition of currentIWSN systems in post-deployment environments. This is done by a new archi-tecture capable to monitor the condition of the sensor nodes components andthe network of IEEE802.15.4 based technologies. To perform such tasks, thearchitecture relies in free-metrics already available in the technologies used inthis field.
In order to be successfully adopted in real-deployments, the architecture is de-signed in order to: 1) have low impact on the sensor node resources; 2) havelow impact on the network traffic; 3) introduce minimal delay in the firmwareof the sensor nodes; and 4) not have a major impact on the development phase.Furthermore, the architecture is designed to be modular and compatible withdifferent hardware and firmware architectures, and to be supported by the Zig-Bee, WirelessHART, ISA100.11a, and WIA-PA standards.
The development of such architecture brings attention to more specific activities,in order to design all the components and evaluate them in terms of perform-ance and effectiveness. Specifically, an extensive review of the state-of-the-art interms of current diagnostic tools approaches, network metrics, industrial stand-ards techniques, and management protocols is presented, and current open issuesand opportunities identified. To measure the performance and effectiveness of
— 4 —
CHAPTER 1. INTRODUCTION
the architecture a WirelessHART testbed was developed. The proposed monit-oring components were also developed and tested in this testbed, by measuringtheir impact on the system. Lastly, to measure the effectiveness of the pro-posed solution, several anomalies were injected in the network, hardware andfirmware of the WirelessHART testbed. The data was collected by the monit-oring system and then anomaly detection algorithms were used to identify theanomalies.
As result of all this work, this thesis has succeeded in producing the followcontributions:
Contribution 1, A Review of the Network Metrics and Management Pro-tocols for IWSN
By reviewing current diagnostic tools, an opportunity was identi-fied. Most of the proposed network tools rely on extra hardware tocollect metrics. These types of solutions are expensive, when used inlarge IWSN deployments. Thus, a review of free available metrics in theZigBee, WirelessHART, ISA100.11a and WIA-PA standards was made,and several metrics described in section 2. These metrics were identifiedin a deep analysis made to each standard. Additionally, another gap inthe state of the art of management protocols was identified. Thus, section2 also presents a review of the current management protocols in the IoTfield.
Contribution 2, A Review of Hardware and Firmware Monitoring TechniquesTo propose a broad architecture capable of monitoring so different aspectsof the IWSN systems, a review of current monitoring techniques used tomonitor the condition of hardware and the firmware of sensor nodes wasdone. This review presents in my point-of-view a contribution that cannotbe found in current state of the art and gives important contributions tothe definition of future architectures in the field (see section 2.4).
Contribution 3, A Taxonomy of Faults for WSNMonitoring systems are intrinsically related with fault identification, faultdetection, fault recover and fault prevention mechanisms. Additionally, tomeasure the effectiveness of anomaly detection mechanisms in the field,a comprehensive fault characterization is needed, in order to identify thecharacteristics, behaviour, and the impact of faults in the WSN systems.Thus, the third contribution of this thesis is a taxonomy of faults inWSNs presented in section 3. The taxonomy extends and complementsexisting taxonomies, but with the specifics of WSNs.
Contribution 4, A Monitoring Architecture for IEEE802.15.4 IWSN basedstandards
As the main contribution, section 4 presents the monitoring archi-tecture proposed in this thesis. Relying in free metrics already availableon the network standards and hardware platforms, this architecture isunique in such approach. To support the integration of the architecture inthe different firmware, network and hardware architectures, an extensiveanalysis to the standards and technologies is made, and solutions are
— 5 —
CHAPTER 1. INTRODUCTION
presented to the different layers (e.g., network transport, security, timesynchronization). For instance, as a monitoring tool that sends monitoringdata over networks that rely on low bandwidth, the appropriate transportservices available in each standard (WirelessHART, ISA100.11a, WIA-PA,ZigBee) are selected.
Contribution 5, A new Advertisement based attack to the WirelessHARTStandard
To show the effectiveness of the proposed architecture, a deep ana-lysis to the WirelessHART security scheme was made in order to generaterepresentative network attacks. By monitoring the network with theproposed architecture, a new attack vector was identified and presented.This new attack allows network outsiders to perform an exhaustion attackto nodes that pretend to join to the network, by forging advertisementpackets. The attack is described in section 5.
Contribution 6, An Anomaly Detection System for Network AnomaliesThe effectiveness of the monitoring architecture was proved in the threemonitoring domains. In the network domain, several attacks wereconducted over the WirelessHART testbed, and the monitoring datacollected using the monitoring architecture. Here, it was proved thatusing the in-node metrics and the network metrics available in theWirelessHART testbed it was possible to detect the injected anomalies,using outlier classifiers like One Class Support Vector Machine (OCSVM).This contribution is presented in section 5.
Contribution 7, An Anomaly Detection System for Hardware and FirmwareAnomalies
In the same way as the last contribution, the firmware and thehardware domains of the architecture were also tested, by the injectionof different anomalies in these two domains. Here, a representativefirmware attack was conducted, and several hardware anomalies injectedin the testbed. The monitoring data collected was used to compare threedifferent types of anomaly classifier approaches: a linear model based, aproximity based, and a neural network based. The results show that theproposed architecture can also be used with good results, in the detectionof firmware and hardware anomalies.
1.3 Outline of the Thesis
The remainder of this thesis is organized in 7 chapters. Chapter 2 presents thestate of the art on industrial technologies, metrics and current diagnostic toolsapproaches from the hardware, firmware and network perspectives. Chapter 3presents a novel taxonomy of faults for WSNs, that allows a fault characteriza-tion using 11 viewpoints. Chapter 4 presents the monitoring architecture withall the proposed components, and the recommended approaches to be used inthe different standards(ZigBee, WirelessHART, ISA100.11a and WIA-PA). At
— 6 —
CHAPTER 1. INTRODUCTION
the end of this chapter, a testbed using the WirelessHART standard is presented,and the impact of the monitoring architecture evaluated. Chapter 5 evaluatesthe effectiveness of the architecture in the detection of attacks made to the Wire-lessHART network. This chapter also presents a novel exhaustion attack thatcan be directed to systems complying with this standard. Chapter 6 presentsseveral attacks and anomalies conducted to the firmware and hardware of theWirelessHART testbed. This chapter presents the effectiveness of the architec-ture in the detection of new and unknown attacks to three different anomalydetection classifiers. Lastly, Chapter 7 sums up this thesis and its contribu-tions, and provide some insights on future work that can be conducted in themonitoring field.
— 7 —

Chapter 2General Background
”The greater our knowledgeincreases, the greater ourignorance unfolds.”
(John F. Kennedy)
Contents2.1 IWSN Applications and Requirements . . . . . . . . 102.2 Technologies for Industrial IoT . . . . . . . . . . . . . 13
2.2.1 Industrial Wired Standards . . . . . . . . . . . . . 142.2.2 IWSN Standards . . . . . . . . . . . . . . . . . . 152.2.3 IWSN Reports . . . . . . . . . . . . . . . . . . . . 18
2.3 Management of Constrained Devices . . . . . . . . . 212.4 Survey of Current Diagnostic Tools . . . . . . . . . . 24
2.4.1 Network Tools . . . . . . . . . . . . . . . . . . . . 242.4.2 Firmware Tools . . . . . . . . . . . . . . . . . . . 252.4.3 Hardware Tools . . . . . . . . . . . . . . . . . . . 26
2.5 Solutions and Approaches: Security and Reliability 272.6 Summary of the Chapter . . . . . . . . . . . . . . . . 28
— 9 —
CHAPTER 2. GENERAL BACKGROUND
I ndustrial sensor networks are evolving every day, in an industry now open tothe Internet, where technology is accessible everywhere. The new industrialrevolution, the Industry 4.0 along with CPSs, bring new challenges for
these technologies, in terms of security (the ability of the system to protect itselfagainst accidental or deliberate intrusion), availability (the ability of the systemto deliver services when requested) and reliability (the ability of the system todeliver services as specified) [Sommerville, 2010]. In this chapter, the state of theart is presented concerning the technologies and techniques used in the industrialfield. This chapter starts by presenting the industrial application requirementsand categories, followed by a deep analysis of the current industrial wired andwireless standards. To propose a monitoring architecture that can be supportedby the four main industrial standards (ZigBee, WirelessHART, ISA100.11a andWIA-PA), hardware, firmware and network monitoring techniques are revised inorder to present current approaches, and identify open issues and opportunities.Furthermore, recent management protocols are also presented and discussed.At the end of the chapter, current efforts made by the industry and academiccommunity in the fields of security and reliability are presented in a broaderperspective, identifying the lack of solutions for wireless based technologies.This chapter sets up the foundation for the monitoring architecture proposed inthe next chapter.
2.1 IWSN Applications and Requirements
Over the past years, computing systems kept increasing their processing cap-ability according to the Moore’s law (either by reducing basic components sizeor by adding complex multi-core approaches to parallel processing). In a dif-ferent path, WSN focus on the creation of smaller, more efficient and cheaperdevices due to its application-dependent nature. Contrary to computer net-works, WSNs follow a more single-purpose design that usually serves only onespecific application-domain. So, in the design of WSN it is important the identi-fication of the application domain and requirements in order to choose the besttechnology and standards.
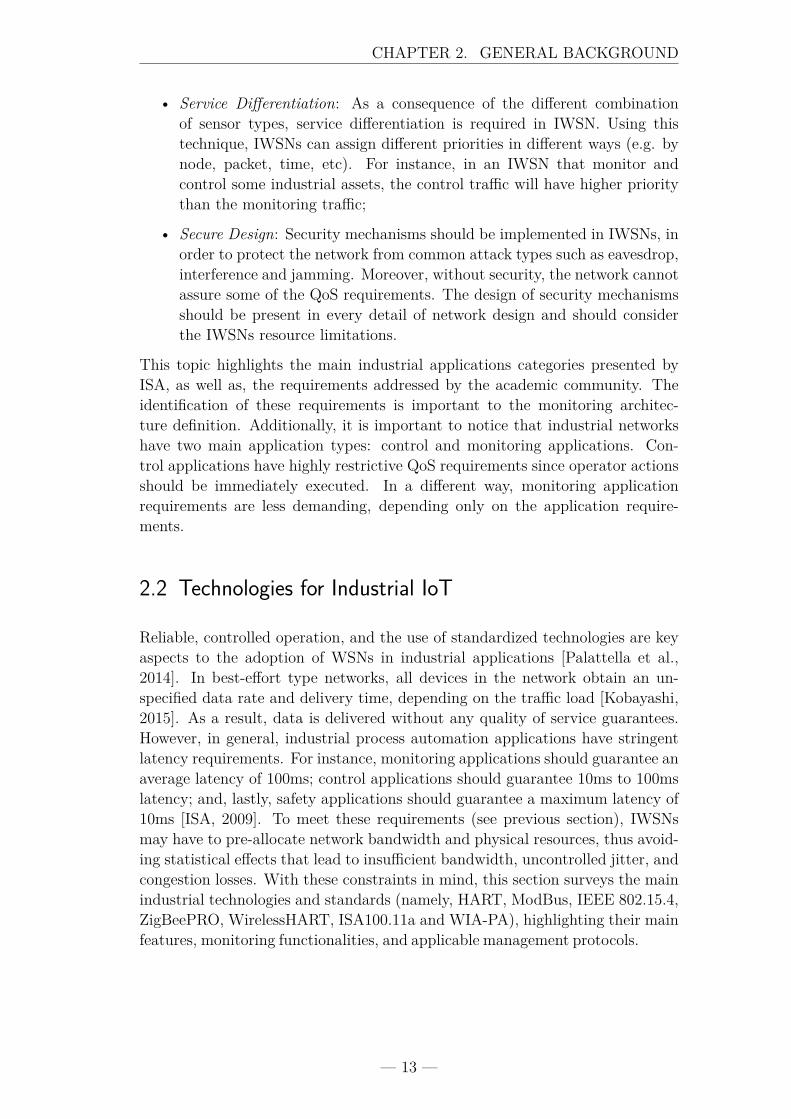
IWSN applications have distinct requirements in comparison with common WSNapplications. To identify the specific requirements for each application type, theInternet Society of Automation (ISA) created six classes [Kumar S. et al., 2014],
Table 2.1: Industrial applications defined by ISA
— 10 —
CHAPTER 2. GENERAL BACKGROUND
based on the criticality and the importance of the applications (table 2.1). Eachclass is classified according the message response time, the Quality of Service(QoS) requirements, and belongs to a specific industrial category such as monit-oring, control and safety. The first type, the safety systems, represent all systemswhere actions and events are required in order of ms or s (e.g., fire alarms andsafeguard systems). The second one, the closed loop regulatory control systemsrepresent control systems where the information acquired by IWSN is used tocontrol the industrial systems, using sometimes time requirements stricter thanthe safety systems. Thirdly, closed loop supervisory systems represent controlsystems where a reaction only occurs when a certain trend is observed. On theother hand, the open loop control represents control systems where an operatoris inside the control loop. In these systems an operator analyses the data andundertakes the control of the system if a trend is observed. The alerting systemsgroup represents monitoring systems based on regular/event-based alerts (e.g.a system that monitors the water temperature). Lastly but not least, the lessstrict system in time constraints is the information gathering systems. Thesesystems are only used for data collecting and forwarding.
ISA defines industrial applications based on time and QoS requirements. How-ever, there are other important requirements, that should also be mentioned,and taking into account when working with IWSNs. The authors of the follow-ing papers [Kumar S. et al., 2014; Zand et al., 2012a; Gungor and Hancke, 2009;Islam et al., 2012] identify some of these requirements and design goals:
• Data Aggregation: Different applications require different levels of dataaccuracy. To cope with the overhead and redundant data being forwardin the network some applications require that the network support dataaggregation of the sensed data in each node or in cluster-heads;
• Energy Consumption: In IWSN it is essential the proper management ofthe energy consumed by each node, in order to maximize the node/networklifetime and reduce the cost of the system (e.g. node lifetime can beimproved with the minimization of radio duty cycle; network lifetime canbe improved by using load balancing techniques);
• Interoperability: In this domain, it is essential the compatibility with exist-ing legacy systems and others wireless solutions. For instance, some IWSNstandards like WirelessHART and ISA100.11a (see section 2.2.2) alreadysupport old legacy systems like HART, but a more flexible solutions isrequired (e.g. by using Lightweight M2M (LwM2M) protocol);
• Fault Tolerance, Reliability and Robustness: In industrial critical applica-tions, IWSNs need to be fault-tolerant and robust against failures. Usingrobust routing protocols, IWSNs can support topology changes and pre-vent network failure due to faulty nodes. Moreover, the delivery of thedata between nodes must use data verification and correction methods, toprevent wireless communication errors;
— 11 —
CHAPTER 2. GENERAL BACKGROUND
• Low-Delay: The response time of safety systems and closed loop regu-latory control systems use latencies that rounds the ms or s. In theseapplications, IWSNs have to insure real-time guarantees, similar to ana-logue wired communications (e.g. ISA50 technology);
• Minimal Cost and Compactness: IWSNs intend to reduce CAPEX andOPEX with the utilization of wireless communications instead of wiredcommunications. Furthermore, sensor nodes must be small to make iteasier to deploy them in large industrial networks (e.g. in some industrialapplications like oil&gas, refineries and smart grid the installation timeand cost can be higher because of safety and health requirements [Kelavaet al., 2008]);
• Predictable Behaviour : In large networks, it is crucial the prediction ofthe network behaviour. Complex solutions tend to be more difficult toanalyse, more favourable to faults and involve high costs in implement-ation, testing and deployment. IWSN solutions need to be simple withpredictable behaviour, and proper monitoring and management systemsshould be used in post-deployment scenarios;
• Quality of Service (QoS): To guarantee low latency in industrial systemsit is essential that IWSNs have QoS mechanisms to prevent outdated datain control systems. QoS requirements can be divided in application spe-cific QoS and network specific QoS. Application specific requirements arerepresented with a higher level of abstraction (e.g. the coverage of the net-work, the maximum number of nodes, etc). On the other hand, networkspecific requirements are represented with lower level of abstraction, con-sequently with much more detail (e.g. latency, reliability and availabilityrequirements). As presented in the ISA industrial application classific-ation, safety and control applications have more demanding Quality ofService (QoS) requirements;
• Resistance to Noise and Co-Existence: Industrial environments have manynoise sources like machinery, engine vibrations, metallic frictions, humid-ity, temperature fluctuation and other wireless networks that communicatein ISM radio bands [Islam et al., 2012]. Moreover, IWSNs communicatewith low-power signals that are more susceptible to noise. IWSNs musthave specific radio techniques that prevent the disruption of the commu-nication and guarantee the co-existence of several networks operating inthe same radio band;
• Scalability and Self Organization: Scalability can be supported in differentways in IWSNs. Protocols and standards should be modular to allow theintegration of new applications and network requirements, before and afterthe network deployment. Furthermore, to support large networks with alot of nodes, IWSNs must support automatic mechanisms that configurethe network keeping their QoS requirements;
— 12 —
CHAPTER 2. GENERAL BACKGROUND
• Service Differentiation: As a consequence of the different combinationof sensor types, service differentiation is required in IWSN. Using thistechnique, IWSNs can assign different priorities in different ways (e.g. bynode, packet, time, etc). For instance, in an IWSN that monitor andcontrol some industrial assets, the control traffic will have higher prioritythan the monitoring traffic;
• Secure Design: Security mechanisms should be implemented in IWSNs, inorder to protect the network from common attack types such as eavesdrop,interference and jamming. Moreover, without security, the network cannotassure some of the QoS requirements. The design of security mechanismsshould be present in every detail of network design and should considerthe IWSNs resource limitations.
This topic highlights the main industrial applications categories presented byISA, as well as, the requirements addressed by the academic community. Theidentification of these requirements is important to the monitoring architec-ture definition. Additionally, it is important to notice that industrial networkshave two main application types: control and monitoring applications. Con-trol applications have highly restrictive QoS requirements since operator actionsshould be immediately executed. In a different way, monitoring applicationrequirements are less demanding, depending only on the application require-ments.
2.2 Technologies for Industrial IoT
Reliable, controlled operation, and the use of standardized technologies are keyaspects to the adoption of WSNs in industrial applications [Palattella et al.,2014]. In best-effort type networks, all devices in the network obtain an un-specified data rate and delivery time, depending on the traffic load [Kobayashi,2015]. As a result, data is delivered without any quality of service guarantees.However, in general, industrial process automation applications have stringentlatency requirements. For instance, monitoring applications should guarantee anaverage latency of 100ms; control applications should guarantee 10ms to 100mslatency; and, lastly, safety applications should guarantee a maximum latency of10ms [ISA, 2009]. To meet these requirements (see previous section), IWSNsmay have to pre-allocate network bandwidth and physical resources, thus avoid-ing statistical effects that lead to insufficient bandwidth, uncontrolled jitter, andcongestion losses. With these constraints in mind, this section surveys the mainindustrial technologies and standards (namely, HART, ModBus, IEEE 802.15.4,ZigBeePRO, WirelessHART, ISA100.11a and WIA-PA), highlighting their mainfeatures, monitoring functionalities, and applicable management protocols.
— 13 —
CHAPTER 2. GENERAL BACKGROUND
2.2.1 Industrial Wired Standards
In order to overcome the need for an industrial-level network standard, theISA50 was proposed in 1972 [ISA, 1972] as an analogue communication standard.Despite having been replaced by more recent digital protocols (e.g., FoundationFieldbus), it is still found in many instrumentation systems due to its use bythe HART protocol. The fundamental principle of the protocol is related to theminimum current of the measuring device. A sensor that measures temperaturebetween 0ºC and 20ºC converts this signal to an electrical current ranging from4 to 20mA, where 20mA corresponds to a 20ºC, and the 0ºC to 4mA. By stayingabove a minimal level of electrical current, the system can distinguish betweena zero value measurement (4mA) and a network failure corresponding to a lackof energy. The first 4mA is used to power the measurement device, while theremaining 16mA is used for control. The advantage of using 4-20mA, comparedto other approaches such as 0-20mA is the capability of detecting open circuits(in which the current is zero) and the possibility of powering devices throughthe communication cable.
To cope with the great diversity of equipment that uses ISA50 standard, theHART protocol was created in order to enable analogue circuits to support di-gital communications. Developed in 1980 by Rosenmount, the HART protocolallows for an analog-to-digital signal conversion for devices that abide to the 4-20mA standard. Later on, the protocol was opened and it is now maintained bythe HART Communication Foundation [FieldComm, 2014]. Sending messageson a 4-20mA network is made possible by making use of FSK modulation tech-nique. Thus, the “1” bit is represented by a frequency of 1200Hz and the “0” bitby a 2200Hz one. This modulation does not affect the analogue communicationssince these are done on the 10Hz range. Regarding the transmission rate, theHART protocol communicates at 1200bps, which is quite slow by today’s stand-ards. The communication paradigm in HART adopts a Master-Slave philosophy.Communication is always initiated by the master, which sends a command mes-sage and waits for a response. On their side, the slave waits for this commandand sends a response in return. Commands may belong to three types: uni-versal, common and proprietary. The first two types of commands are specifiedin the protocol while the latter may be modified depending on the application.The most used network topology in HART is point-to-point. Message size mayvary between 10 and 30 bytes and is composed by the following fields: preamble,start byte, address, command, number of data bytes, status, data, and check-sum. Thanks to a popularity that remains even in today’s world, the HARTprotocol is still widely used and actually has been bestowed with a wireless ver-sion known as WirelessHART (see section 2.2.2), which can be integrated withtraditional HART in industrial networks.
Modbus was developed by Modicon [Fovino et al., 2009] in 1979 as a protocolindependent of the link and physical layers. The protocol can operate overdifferent physical layers, such as Ethernet and Serial. While being initially con-
— 14 —
CHAPTER 2. GENERAL BACKGROUND
ceived to work with point-to-point topology, the protocol can be easily appliedto multi-drop and peer-to-peer networks, as well as work with TCP/IP. Simil-arly to HART, Modbus applies a Master-Slave philosophy which allows a masterdevice to command up to 247 slave devices. Master devices are usually com-puters or Programmable Logic Controllers(PLCs) while slaves tend to be simpleunits scattered through the terrain that acquire sensory data. Communicationbegins with the master device querying the PLCs about the desired data andwaiting for a response. A message in the Modbus protocol is composed by thedevice address, function code, data bytes and error check fields. Commandssent by the master contain different function codes, which identify the operationto be executed by the slave and terminate with an error check for insuring theintegrity of the transmitted data.
Lastly, the CAN protocol is a synchronous protocol introduced in 1986 by RobertBosch GmbH [Bosch, 1991], and is the main protocol of the automotive industry.As many other network protocols, the CAN protocol follows the OSI layer modelbut restricts it to only three layers: Physical (PHY) layer, Media Access Control(MAC) layer and Application (APP) layer. On the PHY layer, the protocol usesNRZ-5 modulation and synchronizes the communication between the differentElectronic Control Unit(ECUs) through two different types of synchronizationmechanisms: hard synchronization and soft synchronization. At the MAC layer,the protocol uses the CSMA in order to avoid collisions. Every CAN message isidentified by a unique ID which defines the priority of the message on the bus.In this way, when an ECU wants to transmit a message, it has to wait untilto the other ECUs with minor IDs. Since these units are capable of hearingevery message on the bus, the application layer includes a filter which blocksall messages except those with a specific ID. In CAN, the network maximumthroughput is influenced by the length of the bus, which also determines thesignal propagation time.
2.2.2 IWSN Standards
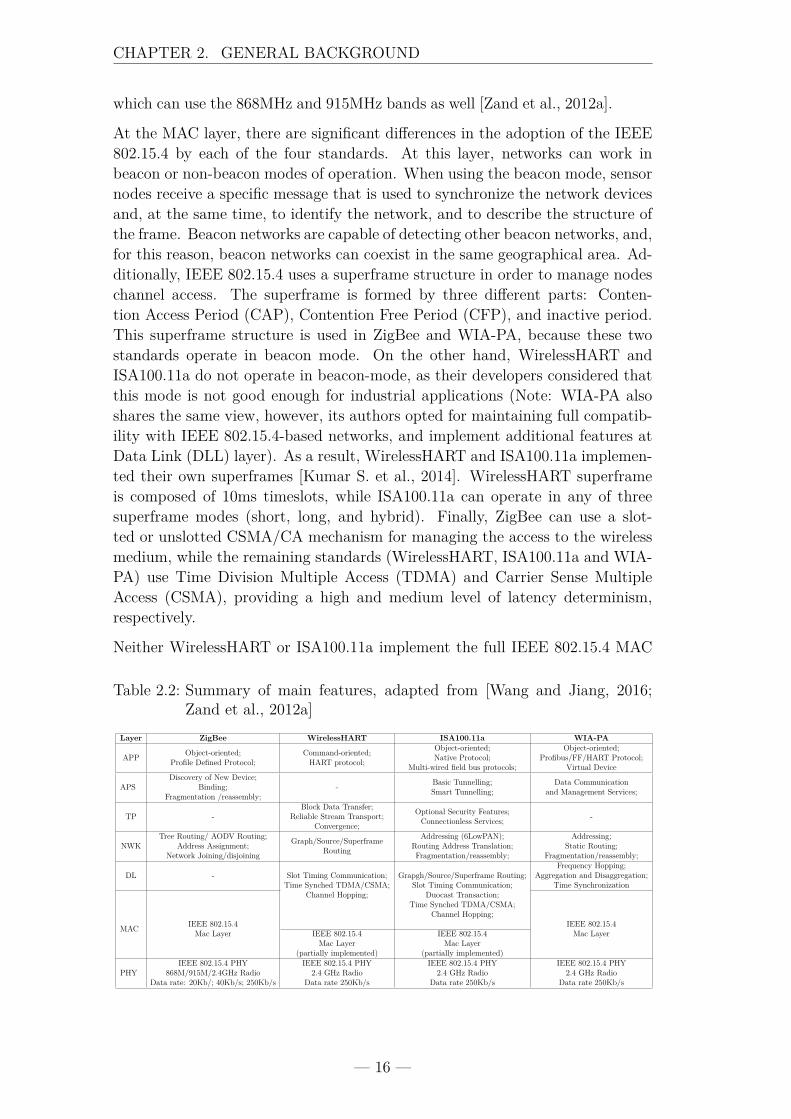
This subsection analyses the characteristic features of each of the main IWSNstandards, namely ZigBee, WirelessHART, ISA100.11a, and WIA-PA. The ana-lysis is done on a per-OSI-layer basis, starting with the physical layer and work-ing up to the application layer. Table 2.2, below, presents a summary of thereferred features, and may be used as guidance by the reader.
IEEE 802.15.4 [IEEE, 2006] is a standard for low-rate wireless personal area net-works (LR-WPANs) that specifies the PHY and MAC layers. This layers designwas optimized for very low-power consumption, high reliability (using mesh net-works), low-data rates, and low-cost. ZigBee, WirelessHART, ISA100.11a, andWIA-PA have, all of them, adopted IEEE 802.15.4 at the PHY layer. However,because WirelessHART, ISA100.11a, and WIA-PA target worldwide adoption,they have chosen to use the 2.4 GHz frequency band only, as opposed to ZigBee,
— 15 —
CHAPTER 2. GENERAL BACKGROUND
which can use the 868MHz and 915MHz bands as well [Zand et al., 2012a].
At the MAC layer, there are significant differences in the adoption of the IEEE802.15.4 by each of the four standards. At this layer, networks can work inbeacon or non-beacon modes of operation. When using the beacon mode, sensornodes receive a specific message that is used to synchronize the network devicesand, at the same time, to identify the network, and to describe the structure ofthe frame. Beacon networks are capable of detecting other beacon networks, and,for this reason, beacon networks can coexist in the same geographical area. Ad-ditionally, IEEE 802.15.4 uses a superframe structure in order to manage nodeschannel access. The superframe is formed by three different parts: Conten-tion Access Period (CAP), Contention Free Period (CFP), and inactive period.This superframe structure is used in ZigBee and WIA-PA, because these twostandards operate in beacon mode. On the other hand, WirelessHART andISA100.11a do not operate in beacon-mode, as their developers considered thatthis mode is not good enough for industrial applications (Note: WIA-PA alsoshares the same view, however, its authors opted for maintaining full compatib-ility with IEEE 802.15.4-based networks, and implement additional features atData Link (DLL) layer). As a result, WirelessHART and ISA100.11a implemen-ted their own superframes [Kumar S. et al., 2014]. WirelessHART superframeis composed of 10ms timeslots, while ISA100.11a can operate in any of threesuperframe modes (short, long, and hybrid). Finally, ZigBee can use a slot-ted or unslotted CSMA/CA mechanism for managing the access to the wirelessmedium, while the remaining standards (WirelessHART, ISA100.11a and WIA-PA) use Time Division Multiple Access (TDMA) and Carrier Sense MultipleAccess (CSMA), providing a high and medium level of latency determinism,respectively.
Neither WirelessHART or ISA100.11a implement the full IEEE 802.15.4 MAC
Table 2.2: Summary of main features, adapted from [Wang and Jiang, 2016;Zand et al., 2012a]
Layer ZigBee WirelessHART ISA100.11a WIA-PA
APP Object-oriented;Profile Defined Protocol;
Command-oriented;HART protocol;
Object-oriented;Native Protocol;
Multi-wired field bus protocols;
Object-oriented;Profibus/FF/HART Protocol;
Virtual Device
APSDiscovery of New Device;
Binding;Fragmentation /reassembly;
- Basic Tunnelling;Smart Tunnelling;
Data Communicationand Management Services;
TP -Block Data Transfer;
Reliable Stream Transport;Convergence;
Optional Security Features;Connectionless Services; -
NWKTree Routing/ AODV Routing;
Address Assignment;Network Joining/disjoining
Graph/Source/SuperframeRouting
Addressing (6LowPAN);Routing Address Translation;Fragmentation/reassembly;
Addressing;Static Routing;
Fragmentation/reassembly;
DL - Slot Timing Communication;Time Synched TDMA/CSMA;
Channel Hopping;
Grapgh/Source/Superframe Routing;Slot Timing Communication;
Duocast Transaction;Time Synched TDMA/CSMA;
Channel Hopping;
Frequency Hopping;Aggregation and Disaggregation;
Time Synchronization
MAC IEEE 802.15.4Mac Layer
IEEE 802.15.4Mac LayerIEEE 802.15.4
Mac Layer(partially implemented)
IEEE 802.15.4Mac Layer
(partially implemented)
PHYIEEE 802.15.4 PHY
868M/915M/2.4GHz RadioData rate: 20Kb/; 40Kb/s; 250Kb/s
IEEE 802.15.4 PHY2.4 GHz Radio
Data rate 250Kb/s
IEEE 802.15.4 PHY2.4 GHz Radio
Data rate 250Kb/s
IEEE 802.15.4 PHY2.4 GHz Radio
Data rate 250Kb/s
— 16 —

CHAPTER 2. GENERAL BACKGROUND
layer, as they consider that the MAC layer of IEEE 802.15.4 is not capable ofdelivering the deterministic latency needed by industrial applications. As such,these standards extend and complement medium access mechanisms with func-tionality at the DLL [Wang and Jiang, 2016], namely, Time Synchronized Chan-nel Hopping (TSCH), which then evolved to the new IEEE 802.15.4.e stand-ard. The TSCH mechanism offers two significant improvements: the possibil-ity to have deterministic latency (communication resources are pre-allocated);and a mechanism of channel hopping that minimizes interference with nearbydevices that operate in the same frequency, such as IEEE 802.11 devices. Onthe other hand, the WIA-PA follows the IEEE 802.15.4 standard at the DLL,including functionalities like time synchronization and frequency hopping tech-niques. Lastly, ZigBee does not implement any mechanism at this layer. It isalso worthwhile mentioning that, in addition to extending/complementing MAClayer functionality, the DLL is also used by ISA100.11a for implementing somenetwork-related functions, specifically in what concerns routing. In fact, thisstandard implements two types of routing: one at the DL layer, that handles allthe IEEE 802.15.4 traffic, and another one at Network (NWK) layer, responsiblefor handling the IPv6 backbone traffic, as we will see below.
At the NWK layer, the choice of supported functionality and routing protocolsis often influenced by the network architectures [Zand et al., 2012a]. For in-stance, ZigBee offers the possibility of having star, tree, and mesh topologies,and defines several field devices: coordinator, routers, and end-devices. Treerouting and Z-AODV protocols are used when the network operates in tree ormesh topology, respectively. Despite the fact that mesh networks can be con-sidered more reliable, in ZigBee the utilization of this topology is not suitablefor industrial applications, due to the overhead and non-deterministic latency ofon-demand protocols like Z-AODV [Wang and Jiang, 2016]. In the case of Wire-lessHART, the basic network devices are: field devices, gateway, access points,and network and security manager. Typically, WirelessHART gateways supportthe role of security and network manager, and access point.
WirelessHART networks may operate in star or mesh topologies. However, themesh topology is the most used one, due to its flexibility, inherent fault-tolerance,and ease of deployment and configuration. With this topology, routing can bedone by using graph routing or source routing. When graph routing is used,the network manager needs to compute all graphs in the network and sharethem with sensor nodes. All communications using graph routing always con-sider two different paths to ensure reliability. In contrast, when source rout-ing is used, network packets are forward between intermediate devices withoutthe need for prior route information (the path of the packet is specified in thepacket itself)[Petersen and Carlsen, 2011]. Differently from the other standards,ISA100.11a specifies two types of networks: the IEEE802.15.4 based network,and backbone network. In the WSN, ISA100.11a defines three device types:routing devices, field devices and handheld devices. The routing mechanismsavailable in this network are the same as the ones in WirelessHART. Addition-
— 17 —
CHAPTER 2. GENERAL BACKGROUND
ally, in the infrastructure (i.e., backbone) side, ISA100.11a uses 6LowPAN, thusallowing for direct communication between external IP devices and ISA100.11adevices. Lastly, WIA-PA supports a hierarchical topology that uses star andmesh, or star-only topology. In the case of the mesh topology, the networkoperates using routers and gateways, while in the star topology the networkis composed of routers and field/handheld devices. At this level, field devicesare cluster members that acquire sensor information and send it to the clusterheads (routers). Then, the cluster-heads form the mesh network. Each routingdevice in the network shares its neighbour information with the network man-ager, and then the network manager computes and shares the static routes. Foreach pair of devices that want to communicate, at least two routing paths areassigned.
The Transport (TP) layer is responsible for providing host-to-host communic-ation services between applications. As can be seen in table 2.2, only Wire-lessHART and ISA100.11a implement data transport functions at this layer,supporting different service level agreements. Optionally, ISA100.11a offers end-to-end security at this layer. In contrast to ISA100.11a and WirelessHART,WIA-PA provides different service level agreements at the Application Sub-Layer(APS), and not at the transport layer. The service-level agreements available ineach standard are presented in section IV, sub-section B. Last but not least, Zig-Bee does not support any transport layer functionality nor does it support trafficdifferentiation at the APS. Moreover, in ZigBee, fragmentation, reassembly, anddevice discovery are implemented at the APS.
The application (APP) layer is the layer at which the connection between leg-acy systems and IEEE 802.15.4-based systems takes place [Zand et al., 2012a;Wang and Jiang, 2016]. At this layer, there are two important options thatcan be identified. WirelessHART uses a command-oriented approach; altern-atively, ISA100.11a, ZigBee, and WIA-PA use a more flexible object-orientedapproach. Object-oriented approaches are more flexible than command-orientedapproaches because they allow for protocol translation by mapping attributesfrom one protocol to the other. As for native applications, ZigBee supports theZigBee profiles; WirelessHART supports the HART protocol; WIA-PA supportsnative protocols like Profibus, Foundation Fieldbus(FF), and HART; last butnot least, ISA100.11a supports the ISA100.11 application protocol.
2.2.3 IWSN Reports
IWSN standard technologies make device and network state information avail-able to a variety of entities, e.g., network neighbours or a central managementdevice. In general, this information is shared between nodes to compute routes,allocate bandwidth, calculate link costs between network devices, or generatealarms when critical events occur (e.g., link failure, route failure, low batterylevel, etc). This subsection presents the network and data link layer reports
— 18 —
CHAPTER 2. GENERAL BACKGROUND
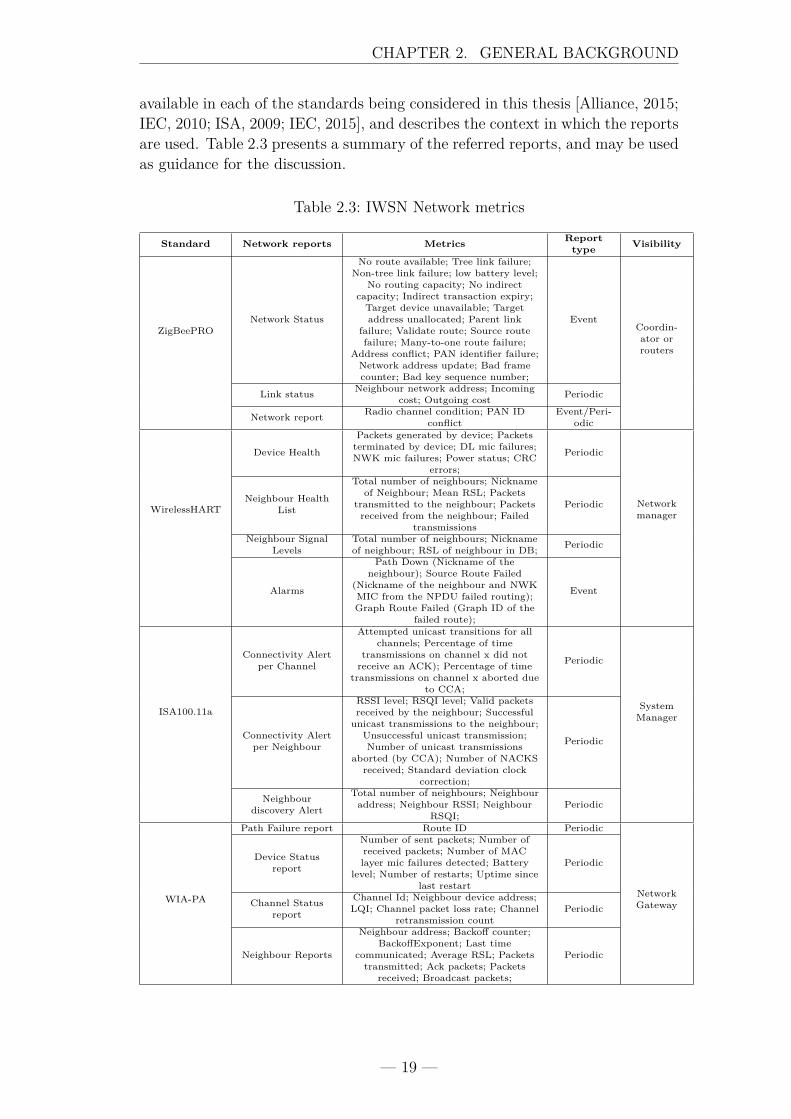
available in each of the standards being considered in this thesis [Alliance, 2015;IEC, 2010; ISA, 2009; IEC, 2015], and describes the context in which the reportsare used. Table 2.3 presents a summary of the referred reports, and may be usedas guidance for the discussion.
Table 2.3: IWSN Network metrics
Standard Network reports Metrics Reporttype Visibility
ZigBeePRONetwork Status
No route available; Tree link failure;Non-tree link failure; low battery level;
No routing capacity; No indirectcapacity; Indirect transaction expiry;Target device unavailable; Targetaddress unallocated; Parent link
failure; Validate route; Source routefailure; Many-to-one route failure;
Address conflict; PAN identifier failure;Network address update; Bad framecounter; Bad key sequence number;
EventCoordin-ator orrouters
Link status Neighbour network address; Incomingcost; Outgoing cost Periodic
Network report Radio channel condition; PAN IDconflict
Event/Peri-odic
WirelessHART
Device Health
Packets generated by device; Packetsterminated by device; DL mic failures;NWK mic failures; Power status; CRC
errors;
Periodic
Networkmanager
Neighbour HealthList
Total number of neighbours; Nicknameof Neighbour; Mean RSL; Packets
transmitted to the neighbour; Packetsreceived from the neighbour; Failed
transmissions
Periodic
Neighbour SignalLevels
Total number of neighbours; Nicknameof neighbour; RSL of neighbour in DB; Periodic
Alarms
Path Down (Nickname of theneighbour); Source Route Failed
(Nickname of the neighbour and NWKMIC from the NPDU failed routing);Graph Route Failed (Graph ID of the
failed route);
Event
ISA100.11a
Connectivity Alertper Channel
Attempted unicast transitions for allchannels; Percentage of time
transmissions on channel x did notreceive an ACK); Percentage of time
transmissions on channel x aborted dueto CCA;
Periodic
SystemManager
Connectivity Alertper Neighbour
RSSI level; RSQI level; Valid packetsreceived by the neighbour; Successfulunicast transmissions to the neighbour;
Unsuccessful unicast transmission;Number of unicast transmissions
aborted (by CCA); Number of NACKSreceived; Standard deviation clock
correction;
Periodic
Neighbourdiscovery Alert
Total number of neighbours; Neighbouraddress; Neighbour RSSI; Neighbour
RSQI;Periodic
WIA-PA
Path Failure report Route ID Periodic
NetworkGateway
Device Statusreport
Number of sent packets; Number ofreceived packets; Number of MAClayer mic failures detected; Battery
level; Number of restarts; Uptime sincelast restart
Periodic
Channel Statusreport
Channel Id; Neighbour device address;LQI; Channel packet loss rate; Channel
retransmission countPeriodic
Neighbour Reports
Neighbour address; Backoff counter;BackoffExponent; Last time
communicated; Average RSL; Packetstransmitted; Ack packets; Packets
received; Broadcast packets;
Periodic
— 19 —
CHAPTER 2. GENERAL BACKGROUND
The ZigBee standard comprises three report types that are used for sharingnetwork- and node-related information: 1) link status report; 2) network statusreport, and 3) network report. Link status reports share sensor node’s neigh-bours incoming and outgoing link costs. The report is broadcasted by ZigBeecoordinators and routers in one-hop fashion. This report is useful during networkdiscovery, to find neighbour devices, and in the operation phase for updating thedevices’ neighbour table. Network status reports are sent by devices in order toreport errors and other events that arise at the network layer. The report canbe sent in unicast or broadcast modes over the network, and can only pertain toan event at a time. The list of the possible reported events is presented in theTable 2.3. Lastly, network reports allow a device to report network events, likePersonal Area Network (PAN) conflict, or the radio channel condition to thecoordinator. As limitation, in the tree topology, some of these packets may notbe received by the ZigBee coordinator, due to the presence of routing devices,that make their own routing decisions. On the other hand, when using a startopology, all the packets will be received by the ZigBee coordinator.
Contrary to what happens in ZigBee, in WirelessHART the network managercontrols all communication in the network, and only authorizes new services ifresources are available. Consequently, field devices (here with full network cap-abilities) must share node state and network based information with the networkmanager. In WirelessHART, all network reports are sent to the network man-ager by using the maintenance service. WirelessHART specifies four types ofreports: 1) device health; 2) neighbour health list; 3) neighbour signal levels;and 4) alarm report. Device health reports summarize all the communicationstatistics of a unique field device and are periodically sent to the network man-ager. The statistics include generated packets by device, terminated packets bydevice, power status, and others.
Neighbour health list reports include statistics about the communication withall neighbours linked to a field device. These reports include the total number oflinked neighbours, the mean Received Signal Level (RSL) to the neighbour, andpackets and errors statistics. Neighbour signal level reports include statistics ofdiscovered but not linked neighbour devices detected by a field device. Whena device wants to connect to the network it usually sends a join request and aneighbour signal level report. Lastly, WirelessHART defines several alarm types:path down alarm; source route failed alarm; and graph route failed alarm.
Similarly to what happens in WirelessHART, in ISA100.11a networks, the sys-tem manager controls all communication in the network. However, in this stand-ard, WSN routing takes place at the DLL, due to the use of 6LoWPAN at theNWK layer. Network metrics in ISA100.11a are shared at the MAC layer, in-stead of being shared at the NWK layer. ISA100.11a defines two groups ofnetwork reports: 1) connectivity alerts, and 2) neighbour discovery alert. Con-nectivity alerts comprise two types of reports: per-neighbour report, and per-channel report. Per-neighbour reports contain neighbours’ connection statist-ics. On the other hand, per-channel reports contain per-channel all-neighbours
— 20 —
CHAPTER 2. GENERAL BACKGROUND
statistics, and convey them to the system manager. Finally, neighbour discov-ery alerts are sent periodically to the system manager with a list of overheardneighbours. The system manager makes new routing decisions based on thesereports. Per-neighbour reports, per-channel reports, and neighbour discoveryalert, are similar to WirelessHART’s neighbour health list, device health, andneighbour signal level, respectively.
In WIA-PA, route computation is also performed by the network gateway, sim-ilarly to WirelessHART and ISA100.11a. WIA-PA defines four types of reports:1) device status report; 2) channel condition report, 3) neighbour report, and4) path failure report. Device status reports include statistics about the condi-tion of field devices and routers, such as the number of packets exchanged withneighbours, number of restarts, and uptime. Channel condition reports sendstatistics grouped by channel and neighbour to the network gateway. These stat-istics include link quality, packet loss rate, and number of transmission retries.Neighbour reports, also received by the network gateway, group neighbours stat-istics and neighbours scheduling details, such as backoff counter and exponent,transmitted and received packets, and number of acknowledgments. Lastly, pathfailure reports are generated when a route path failure occurs. These reports aresent by a routing device to the network gateway, whenever the retransmissioncounter of a specific path exceeds a given threshold.
2.3 Management of Constrained Devices
Network management emerged in traditional networks with the need to con-trol and monitor networks as they grew up in size and complexity. ISO/IEC7498-4 [ISO/IEC 7498-4, 1989] was one of the first initiatives to establish amanagement framework, by defining a set of functional areas, namely: fault,configuration, accounting, performance, and security management. Further-more, ISO/IEC 7498-4 proposed the use of managed objects as abstractions fornetwork resources, which, in turn, contain several attributes. In current proto-cols, managed objects can be defined using several syntaxes, like Structure ofManagement Information (SMI)v2 [McCloghrie et al., 1999], Yet Another NextGeneration(YANG) [Bjorklund, 2010], and Extensible Markup Language(XML)[OMA, 2017]. Managed objects data are stored in management databases andaccessed by management protocols. In this sub-section, we identify two typesof management protocols: 1) protocols designed for traditional networks; and2) protocols designed for networks of resource-constrained devices, that can alsobe used in some traditional networks.
As one of most used protocols for the management of IP devices, Simple Net-work Management Protocol(SNMP)[Case et al., 1990] provides most of the basicfunctionality defined in ISO/IEC 7498-4. The standard specifies an architecturebased on agents and managers. Devices being monitored run SNMP agents thatshare the device state information with an SNMP manager, by using query/re-
— 21 —
CHAPTER 2. GENERAL BACKGROUND
sponse interactions and trap notifications. Each SNMP agent has a collection ofmanaged objects whose data is stored in a Management Information Base (MIB).Each object is identified using a specific Object Identifier (OID). Despite the suc-cess of SNMP for monitoring purposes, the protocol failed to provide an effectiveand reliable way to configure devices. Thus, IETF started a working group thatwrote an informational RFC [Schoenwaelder, 2003] with several requirementsthat coming network management standards should implemented. This workwas the basis for the NETCONF [Enns et al., 2011] protocol. Differently fromSNMP’s manager-agent architecture, Network Configuration (NETCONF) usesa client-server architecture. The server runs on a management device (SNMPagent) and shares the monitoring information (also by query/response and noti-fication messages) with the client (SNMP manager). Additionally, when devicesneed to be configured, the client may send several configuration commands inone or several transactions. The transactions supported in NETCONF giveoperators the capability of sending out-of-order commands, and of performingrollback and commit operations.
The management protocols mentioned up to now were designed for traditionalnetworks. In [Sehgal et al., 2012], the authors implemented traditional networkmanagement protocols in networks of constrained devices, and concluded thatSNMP and NETCONF are not suitable for this type of networks. For instance,the use of TLS encryption in NETCONF adds significant overhead in terms ofsession time (i.e. in the order of seconds). In later years, with the growth ofIoT, new solutions that address resource-constrained devices and 6LowPAN net-works were proposed. These solutions also take advantage of transport protocolsspecially designed for resource-constrained devices, like Constrained ApplicationProtocol (CoAP) [Shelby et al., 2014].
One of the first solutions developed with a focus on the management of 6LowPANnetworks was the LoWPAN Network Management (LNMP) protocol [Mukhtaret al., 2008]. The LNMP protocol implements a solution based on SNMP thattargets 6LowPAN networks. In this solution, 6LowPAN gateways convert theinformation from 6LowPAN networks to SNMP MIBs and make it available overIP. On the other hand, other management architectures were evaluated, and newresearch directions that take advantage of new technologies like HTTP appeared.In [Marotta et al., 2014], the authors evaluated the use of different architectureslike SNMP, Resource-Oriented Architecture (ROA), and Service-Oriented Ar-chitecture (SOA), and concluded that ROA architectures are more suitable forresource-constrained devices in terms of response time and power consumption,and are less sensitive to changes in timeout. As a result, a RESTful version ofNETCONF was created, named RESTCONF [Bierman et al., 2017]. Distinctfrom NETCONF, that uses SSH and TCP, RESTCONF allows the communic-ation between server and client using HTTP operations. Using HTTP at theapplication layer enables clients to receive notifications without maintaining apermanent connection with the server, as it is the case of NETCONF (one ofits major drawbacks). The syntax used in RESTCONF is YANG, the same
— 22 —
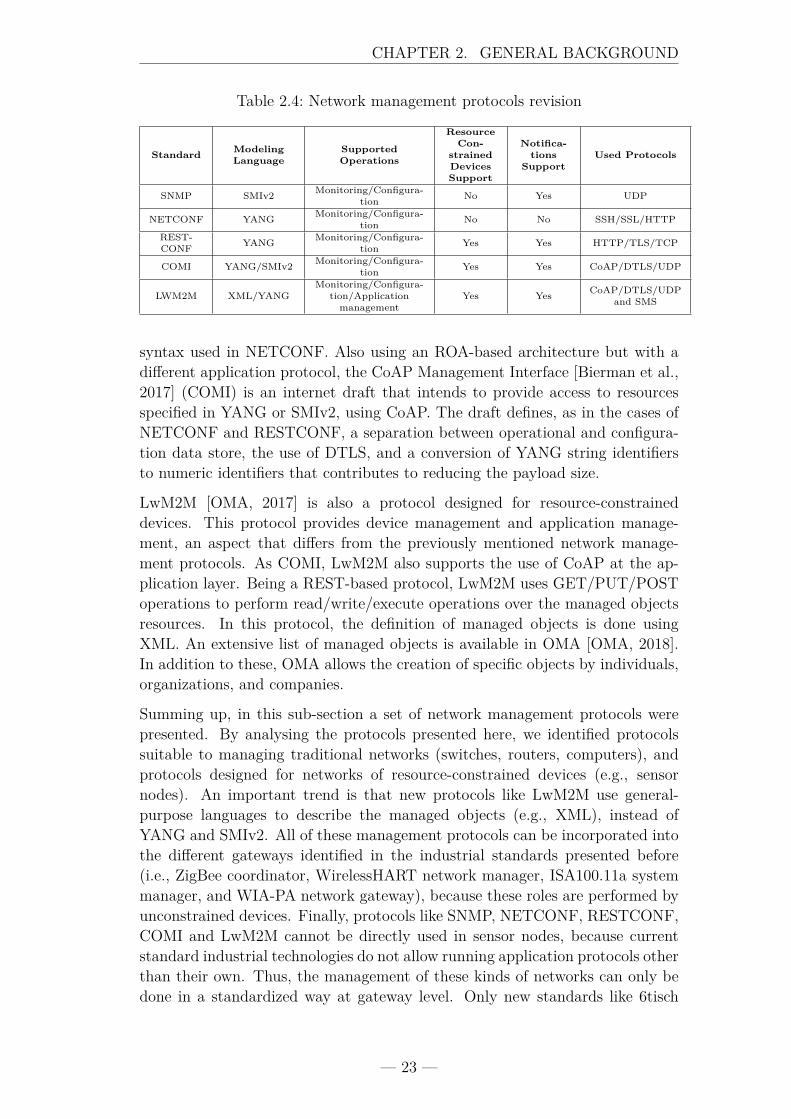
CHAPTER 2. GENERAL BACKGROUND
Table 2.4: Network management protocols revision
Standard ModelingLanguage
SupportedOperations
ResourceCon-
strainedDevicesSupport
Notifica-tions
SupportUsed Protocols
SNMP SMIv2 Monitoring/Configura-tion No Yes UDP
NETCONF YANG Monitoring/Configura-tion No No SSH/SSL/HTTP
REST-CONF YANG Monitoring/Configura-
tion Yes Yes HTTP/TLS/TCP
COMI YANG/SMIv2 Monitoring/Configura-tion Yes Yes CoAP/DTLS/UDP
LWM2M XML/YANGMonitoring/Configura-
tion/Applicationmanagement
Yes Yes CoAP/DTLS/UDPand SMS
syntax used in NETCONF. Also using an ROA-based architecture but with adifferent application protocol, the CoAP Management Interface [Bierman et al.,2017] (COMI) is an internet draft that intends to provide access to resourcesspecified in YANG or SMIv2, using CoAP. The draft defines, as in the cases ofNETCONF and RESTCONF, a separation between operational and configura-tion data store, the use of DTLS, and a conversion of YANG string identifiersto numeric identifiers that contributes to reducing the payload size.
LwM2M [OMA, 2017] is also a protocol designed for resource-constraineddevices. This protocol provides device management and application manage-ment, an aspect that differs from the previously mentioned network manage-ment protocols. As COMI, LwM2M also supports the use of CoAP at the ap-plication layer. Being a REST-based protocol, LwM2M uses GET/PUT/POSToperations to perform read/write/execute operations over the managed objectsresources. In this protocol, the definition of managed objects is done usingXML. An extensive list of managed objects is available in OMA [OMA, 2018].In addition to these, OMA allows the creation of specific objects by individuals,organizations, and companies.
Summing up, in this sub-section a set of network management protocols werepresented. By analysing the protocols presented here, we identified protocolssuitable to managing traditional networks (switches, routers, computers), andprotocols designed for networks of resource-constrained devices (e.g., sensornodes). An important trend is that new protocols like LwM2M use general-purpose languages to describe the managed objects (e.g., XML), instead ofYANG and SMIv2. All of these management protocols can be incorporated intothe different gateways identified in the industrial standards presented before(i.e., ZigBee coordinator, WirelessHART network manager, ISA100.11a systemmanager, and WIA-PA network gateway), because these roles are performed byunconstrained devices. Finally, protocols like SNMP, NETCONF, RESTCONF,COMI and LwM2M cannot be directly used in sensor nodes, because currentstandard industrial technologies do not allow running application protocols otherthan their own. Thus, the management of these kinds of networks can only bedone in a standardized way at gateway level. Only new standards like 6tisch
— 23 —
CHAPTER 2. GENERAL BACKGROUND
[Thubert et al., 2016] support the management of sensor node devices usingCOMI or LwM2M, because 6tisch uses the CoAP protocol at the applicationlevel. Nevertheless, due to the fact that no 6tisch-based products are availableand, consequently, it is not yet used in industrial settings, 6tisch will not beaddressed in this thesis.
2.4 Survey of Current Diagnostic Tools
The design of a diagnostic tool applicable to low-end IoT devices, like WSNnodes, is a tough task due to their characteristics and diversity. WSN nodeshave limited resources, support a variety of application architectures, and relyon complex network mechanisms. In addition, WSN applications can be de-veloped for a specific operating system, or even almost from scratch. Thesecharacteristics make it difficult, or even impossible, to develop a common dia-gnostic tool for all kinds of scenarios, and, at the same time, compatible withseveral operating systems. Despite this, in the last decade several diagnostictools were proposed in order to provide inside views on WSNs’ and nodes’ be-haviour. In [Rodrigues et al., 2013], the authors analyse an extensive set ofdiagnostic tools. In this section, some of the tools described in [Rodrigues et al.,2013], as well as more recent tools like [Bhadriraju et al., 2012; Dong et al.,2014; Schuster et al., 2014; Dong et al., 2013; Rodenas-Herráiz et al., 2017], willbe presented from a diagnostic target perspective, organizing their presentationinto network-based, firmware-based, and hardware-based tools.
2.4.1 Network Tools
The nature of wireless communications makes this technology unreliable andfailure-prone. In this context, diagnostic tools that are able to collect networkmetrics and evaluate the state of the network are essential. Three types ofapproaches can be used to collect network information: 1) passive, using extrahardware to collect network information without interference; 2) active, usingon-node available resources; and 3) hybrid, using a mix of active and passiveapproaches.
When passive approaches are used, the acquisition of network-related informa-tion is made by installing extra sniffer nodes or sniffer capabilities in the existingsink nodes. These diagnostic tools may differ in the type of sniffer nodes, in thestorage approach, and in the way the gathered information is transmitted. Spe-cifically, some of the existing solutions use sink sniffer nodes to collect trafficdata from the network; others use extra networks of sniffers deployed with themain WSN; others use sniffer nodes that collect data and store it in memory;and lastly, the most expensive in terms of network installation, send network-related information by wired technologies (e.g. SNIF[Ringwald et al., 2006],
— 24 —
CHAPTER 2. GENERAL BACKGROUND
SNTS[Khan et al., 2007], PDA[Romer and Ma, 2009], LiveNet[Chen et al., 2008]and L-SNMS[Yuan et al., 2015]).
Differently from passive tools that rely on extra hardware to monitor the net-work, active approaches use on-node metrics already available in sensors nodes.Active tools are easy to install, do not need extra hardware and, consequently,are less expensive when compared to passive approaches. However, active toolsmay have impact on node resources, as memory, energy, processing, and networkthroughput are needed to collect, store, and transport network-related inform-ation. Some of the tools gather traffic metrics from the sensor nodes’ operatingsystem, others from the network layer, and others directly from sink nodes. Also,there is a specific set of tools that use software scripts deployed in sensor nodesto collect statistics about the network traffic seen by the node. Subsequentlyto data acquisition, the transport of network-related information can be madeusing the main application channel or a secondary channel. To minimize the im-pact of data transport, some tools use compression and aggregation techniquesso as to reduce the traffic overhead. Examples of this type of tools are Mari-onete [Whitehouse et al., 2006], Megs [Lodder et al., 2008], Memento[Rost andBalakrishnan, 2006], Wringer[Tavakoli et al., 2008], 6PANview[Bhadriraju et al.,2012], and D2[Dong et al., 2013].
Lastly, hybrid approaches use a mix of methods described in the cases of theactive and passive approaches. Examples of this type of tools are Sympathy[Ramanathan et al., 2005] and Dustminer[Khan et al., 2008].
2.4.2 Firmware Tools
Another source of faults commonly addressed by diagnostic tools is the sensornodes’ firmware. After firmware development, sensor nodes are deployed inthe field and, in some cases, faults may stay in a dormant state until an inputactivates them. If the error is not properly handled, a firmware failure may occurand sensor node data may not be delivered or may be corrupted. In an extremealthough not uncommon situation, a firmware fault may even prevent a sensornode from entering sleep mode and, eventually, lead to battery exhaustion. Withthe aim of promptly detecting firmware faults, there are diagnostic tools thathelp developers in either the development phase, or in the WSN deploymentphase.
Tools that are used during the development phase usually require debugginginterfaces, specific hardware implemented in the microcontrollers architecture,and Integrated Development Environments (IDEs) that allow accessing the avail-able functionality. Examples of these technologies are: the old Joint Test ActionGroup (JTAG) interface used to program microcontrollers and to have accessto special internal registers (e.g., hardware and software breakpoints); UARTports used for outputting log messages that are useful for debugging purposes;the EnergyTrace[Instruments, 2017d] technology, from Texas, that allows de-
— 25 —
CHAPTER 2. GENERAL BACKGROUND
velopers to measure the impact of firmware on nodes energy consumption; andthe CoreSight[Arm, 2017] technology, implemented by Advanced Risc Machine(ARM) in their microcontrollers, which allows performance profiling, memoryaccess, real-time tracing, and software debugging through a new type of inter-faces, namely the Serial Wire Debug and the Serial Wire Output Pin (examplesof variables that can be access using this type of technology are cycles per instruc-tions, sleep cycles, and exceptions). On top of that, IDEs like Code ComposeStudio (CCS)[Instruments, 2017c], among others, enable access to these toolsand help developers to detect code faults.
None of the development phase diagnostic technologies are suitable for post-deployment, because they require a wired connection between nodes and thetool’s hardware. Consequently, in the last decade, several deployment phasetools were proposed that are able to provide monitoring information, althoughwith considerable limitations when compared to the functionality delivered bydevelopment phase tools. Some examples are [Schuster et al., 2014], Nuc-leos[Tolle and Culler, 2005], Enverilog[Luo et al., 2006], Marionete[Whitehouseet al., 2006], Clairvoyant[Yang et al., 2007], NodeMD[Krunic et al., 2007],L-SNMS[Yuan et al., 2008], LIS[Shea et al., 2009], Memento[Rost and Bal-akrishnan, 2006], Dustminer[Khan et al., 2008], DT[Cao et al., 2008], Tracea-lyzer[Holenderski et al., 2010], and Dylog[Dong et al., 2014]. Despite their limit-ations, these tools allow WSN operators/managers to collect operating systemsvariables (e.g., task queue state, number of reboots), main application variables,and application events and states (like function call traces). This informationis usually stored in flash, RAM, or sent via the application main channel usinglogs. In order to deliver all of these without requiring an extra effort during themain application development, code instrumentation techniques are used, whichmake it possible to automate the process of adding firmware metrics collectionand transmission functionality. Firmware data is usually sent using one of twoparadigms: event-driven or query-driven. Additionally, some of the tools im-plement extra functionality, such as: source-level debugging, offering commandssimilar to hardware debugging (break, stop, watch, backtrace, etc); remote callspecific functions; remote reprogramming; and specification of trace log eventstriggering conditions. Tools that usually read and write large amounts of datafrom/to flash memory (e.g., Tracealyzer) are not, in general, appropriated forindustrial WSN technologies due to the energy wasted in the process.
2.4.3 Hardware Tools
Finally, a source of faults that diagnostic tools also commonly address is hard-ware faults. Hardware faults may occur before and/or after WSN deployment,and are due to one or more of several reasons, such as: bad hardware design,external environment phenomena, aging, and extreme temperatures. Hardwarediagnostic tools can be divided in two groups: 1) external-physical-tools thatare used by developers and operators; and 2) on-node-tools that infer hardware
— 26 —
CHAPTER 2. GENERAL BACKGROUND
faults using available hardware resources.
The first group of tools consists of physical tools/equipment that operators anddevelopers use to check hardware condition and the occurrence of faults. Toolslike oscilloscopes, multimeters, and logic analysers are connected to the targetsystem in order to check the condition of the electronics and the existence offaults. These tools are frequently used during the development phase, where de-velopers search for electronics defects and for communication problems betweenhardware modules (e.g., using logic analysers [Saleae, 2018]).
On-node-tools use a different approach. This type of tools is designed during thehardware and/or firmware development phase, with the specific purpose of col-lecting state information from the different modules using on-node components.In [Scherer and Horváth, 2012], the authors use the ARM CoreSight technologyto create a WDP (Watch Dog Processor), by polling the main processor memoryvariables and setting conditions on these variables. Also using the same tech-nology, in [Scherer and Horvath, 2014] the authors extend Hardware in Loop(HIL) tests, by incorporating some metrics provided by the CoreSight techno-logy. Moreover, in [Dutta et al., 2008] the authors propose a technique to readthe energy wasted in boards that use switching regulators. By collecting thesemetrics, operators and developers are able to detect hardware faults that occurduring the deployment phase without using external tools.
2.5 Solutions and Approaches: Security and Reliability
Information Communication Technologies (ICTs) are changing the industrialmindset. Nevertheless, Industrial Control Systems(ICSs) significantly differ fromcommon ICT systems, when system requirements and priorities are considered.In ICS, availability is one of the most important requirements, followed by in-tegrity and confidentiality (AIC). Nevertheless, the European Network and In-formation Security Agency (ENISA) [Knowles et al., 2015] are providing a newalternative definition for the field. According to them, current ICSs should priv-ilege safety, reliability and availability (SRA), instead of AIC. Moreover, SRAis recognised as being intrinsically related with security.
Regarding the increase of cyber security attacks to ICSs, the security of ICSshave been scrutinized from different perspectives. Governments, industry, andstandardization bodies have been proposing new standards, guidelines, and bestpractices for the various industrial domains (e.g., oil & gas, chemical, nuclear)[Knowles et al., 2015]. At the same time, in the academic research community, adeluge of different solutions that focus on ICS technologies and standards havebeen proposed. In general, some of these solutions try to incorporate alreadyknown techniques used in ICT systems. Examples of such solutions are: softwarelayer solutions; firewalls that prevent specific attacks to industrial protocols likeDNP3; Intrusion Detection Systems (IDSs), using open-source technologies like
— 27 —
CHAPTER 2. GENERAL BACKGROUND
Snort; honeypots, that try to prevent attacks to real systems and, at the sametime, collect attack vectors; hardware monitoring solutions (Shadow SecurityUnits), that are directly attached to control devices for monitoring their beha-viour [Graveto et al., 2019]; and, lastly, machine-learning-based IDSs. Never-theless, part of these efforts only address problems related with the introductionof ICT networking technologies, such as Ethernet and IP in industrial systems,and/or with network components, and do not address critical security issues thatcan also be found in hardware and firmware components, as well [Robertson andRiley, 2018].
Despite the fact that ICT-based solutions are increasingly being used in criticalinfrastructures and application areas, of which the nuclear field [Kim et al., 2018]is an example, little effort is being done in order to develop efficient and effectivepost-deployment monitoring solutions with emphasis on security and reliability.Some architectural proposals, nevertheless, target specific standards, like [Kimet al., 2019]. However, these solutions usually address the network part only,and do not propose solutions for hardware and firmware security.
On the other hand, reliability is usually achieved with fault-tolerance techniquesand diagnostic tools. In the WSN domain, fault-tolerance techniques are a well-known field of research. There are several proposals that address network faults,as well as several works that try to prevent faults in sensor readings [Chouikhiet al., 2015]. The next chapter presents some of these techniques and tools,that can be used in WSN-based solutions and applied to industrial wirelessstandards.
2.6 Summary of the Chapter
Security and reliability are, nowadays, two important requirements in industrialsystems, that keep evolving in order to deal with some of the challenges presentedby the Industry 4.0. In terms of security, a special attention has been devotedto the development of new monitoring systems, that rely on techniques andsolutions used on the ICT field. However, part of this effort is only made forlegacy systems, based on wired standards and technologies.
As presented in section 2.1, IWSN differ from other technologies, providing greatbenefits for industrial applications but with some constrains. At the same time,the technology is fragmented. There are several hardware architectures, severalfirmware approaches, and different network protocols, hampering the develop-ment of monitoring systems like the ones that exist for wired technologies. Atthe same time, in the research and industry communities there are some propos-als of monitoring techniques, specific for each field. Some of these techniques canbe used for free to monitor IWSN systems, and at the same time, increase theirreliability and security. For instance, current industrial network standards sharenetwork metrics to perform routing operations, however, the use of these metrics
— 28 —

CHAPTER 2. GENERAL BACKGROUND
in monitoring systems could not be found in any similar proposal. Lastly, withthe increase of IoT solutions, and the increase of Machine-to-Machine (M2M)communications, new management protocols appeared in the last years, im-proving the interoperability between different solutions. All these technologiestogether allow the proposal of a new monitoring architecture, that is presentedin chapter 4.
— 29 —

Chapter 3WSN Faults
”Simplicity is prerequisite forreliability.”
(Edsger Dijkstra)
Contents3.1 Introduction . . . . . . . . . . . . . . . . . . . . . . . . 323.2 Motivation . . . . . . . . . . . . . . . . . . . . . . . . 333.3 Concepts and Techniques . . . . . . . . . . . . . . . . 34
3.3.1 Systems, Components and Services in WSN . . . . . 343.3.2 Faults, Errors, Failures and Anomalies . . . . . . . 353.3.3 Fault Management Techniques . . . . . . . . . . . 37
3.4 WSN Fault Taxonomy . . . . . . . . . . . . . . . . . . 393.4.1 Phase of Creation or Occurrence . . . . . . . . . . 393.4.2 System Boundary . . . . . . . . . . . . . . . . . . 413.4.3 Phenomenological Cause . . . . . . . . . . . . . . 423.4.4 Dimension . . . . . . . . . . . . . . . . . . . . . . 433.4.5 Objective . . . . . . . . . . . . . . . . . . . . . . 433.4.6 Intent . . . . . . . . . . . . . . . . . . . . . . . . 453.4.7 Capability . . . . . . . . . . . . . . . . . . . . . . 453.4.8 Persistence . . . . . . . . . . . . . . . . . . . . . . 463.4.9 State . . . . . . . . . . . . . . . . . . . . . . . . . 473.4.10 Reproducibility . . . . . . . . . . . . . . . . . . . 483.4.11 Source System . . . . . . . . . . . . . . . . . . . . 48
3.5 Related Work . . . . . . . . . . . . . . . . . . . . . . . 503.6 Summary of the Chapter . . . . . . . . . . . . . . . . 51
— 31 —
CHAPTER 3. WSN FAULTS
O ver the last decade, WSNs went from being a promising technology tothe main enabler of countless IoT applications in all types of areas.In industry, WSNs are now used for monitoring and controlling in-
dustrial processes, with the benefits of low installation costs, self-organization,self-configuration, and added functionality. Nevertheless, despite the fact thatbase WSN technologies are quite stable and subject to standardization, theyhave kept one of their main characteristics: fault-proneness. As presented insection 2.4, in recent years considerable effort has been made in order to providemechanisms that increase the availability, reliability and maintainability of thistype of networks. In this context, a whole range of techniques such as faultdetection, fault identification and fault diagnosis used in other research fieldsare now being applied to WSNs. Unfortunately, this has not led to a consistent,comprehensive WSN fault taxonomy that can be used to characterize and/orclassify faults. Neglecting the importance of WSN fault characterization (e.g.,when using supervised and semi-supervised algorithms for anomaly detection)may lead to bad classifiers and, consequently, bad fault handling proceduresand/or tools. In this chapter, we start by reviewing base fault management con-cepts and techniques that can be applied to WSN. We then proceed to proposeand present a comprehensive WSN fault taxonomy that can be used not onlyin general purpose WSNs but also in IWSN. Finally, the proposed taxonomy isvalidated by applying it to an extensive set of faults described in the literature.Additionally, it will be used in chapters 5 and 6 that focus on injecting network,hardware, and firmware anomalies in a WirelessHART testbed.
3.1 Introduction
Despite the benefits of using WSN in industrial applications, there are also somedrawbacks that are delaying the deployment of IWSNs, specifically their fault-prone nature, as proved by many deployment experiences [Warriach et al., 2012].In general, sensor nodes are resource-constrained and fragile, sensor readingscan be incorrect, network links are failure prone, network congestion is common,packets may be corrupted or lost [Paradis and Han, 2007] and, lastly, sensor nodecomponents may also fail [Mahapatro and Khilar, 2013]. This faulty nature ofWSNs not only make the maintenance of sensor nodes and networks difficult,but may also result in severe consequences for human lives, the environment, andthe economy, when used in critical WSN applications. Moreover, WSNs mayserve different types of applications with distinct requirements, as potentiatedby the widespread use of WSN technology in daily life, making fault detectionextremely difficult. In this IoT scenario, sensor nodes must have mechanismsthat monitor and detect their own faults as well as neighbors’ faults. Addition-ally, mechanisms for detecting network faults and global application faults mustbe also in place.
Increasing the quality of hardware and software in production and developmentprocesses may be one possible solution for decreasing fault occurrence in WSNs.
— 32 —

CHAPTER 3. WSN FAULTS
However, this alone will not prevent the occurrence of faults and it will increasethe cost of WSNs. Thus, in recent years, significant attention has been givento using several techniques such as fault detection, fault identification, faulttolerance, fault diagnosis, fault injection and anomaly detection. Using thesetechniques, some authors proposed solutions that: detect faults in sensors, thusincreasing the quality of sensor data [Warriach et al., 2012]; detect faults inthe routing layer, using a fault tolerant routing mechanism [Ma et al., 2006];inject faults at assembly level, thus detecting hardware and software faults atdesign phase [Cinque et al., 2009]; and increase the performance of the network,detecting network and global faults.
Despite the growing concern with WSN fault management and the existenceof several surveys on fault tolerance applied to WSN [Mahapatro and Khilar,2013; de Souza et al., 2007], there is no full, comprehensive, consistent, generallyadopted WSN fault taxonomy, as existing work either concentrates on describingfault causes or on presenting techniques and algorithms for dealing with specificfaults, without trying to characterize and understand the nature of faults inWSN. In our view, this partial analysis of WSN faults has considerable impacton existing fault handling techniques and tools and is the main reason for thenon-adoption of these techniques in real scenarios, as shown in [Rodrigues et al.,2013], which also demonstrates that current WSN diagnostic tools have lowmaturity, stability and support, and most of them are not available for realworld deployments.
In this context, the contributions of this chapter are the following: i) a reviewof fault management concepts and techniques and their application to wirelesssensor networks; ii) a proposal for a comprehensive, consistent WSN/IWSN faulttaxonomy that can be used as reference by WSN researchers, developers, integ-rators and users, as well as by developers and users of tools for fault detection,fault diagnosis and fault handling; iii) validation of the proposed taxonomy usingan extensive set of faults described in the literature.
The remainder of this chapter is organized as follows. The motivation for thiswork is presented in section 3.2. Base concepts and techniques, especially thosepertaining to fault tolerance, are presented in section 3.3. The proposed WSNfault taxonomy is presented in 3.4. This section also includes the application ofthe proposed taxonomy to an extensive set of faults described in the literature.In section 3.5 we compare our work with related work. Finally, section 3.6 sumsup this chapter with some conclusions and guidelines for future research.
3.2 Motivation
As the number of WSN deployments increases, researchers and practitionersare now realizing the need for post-deployment diagnostic tools, like the onepresented in this thesis. The fragile, complex and failure-prone nature of WSN
— 33 —
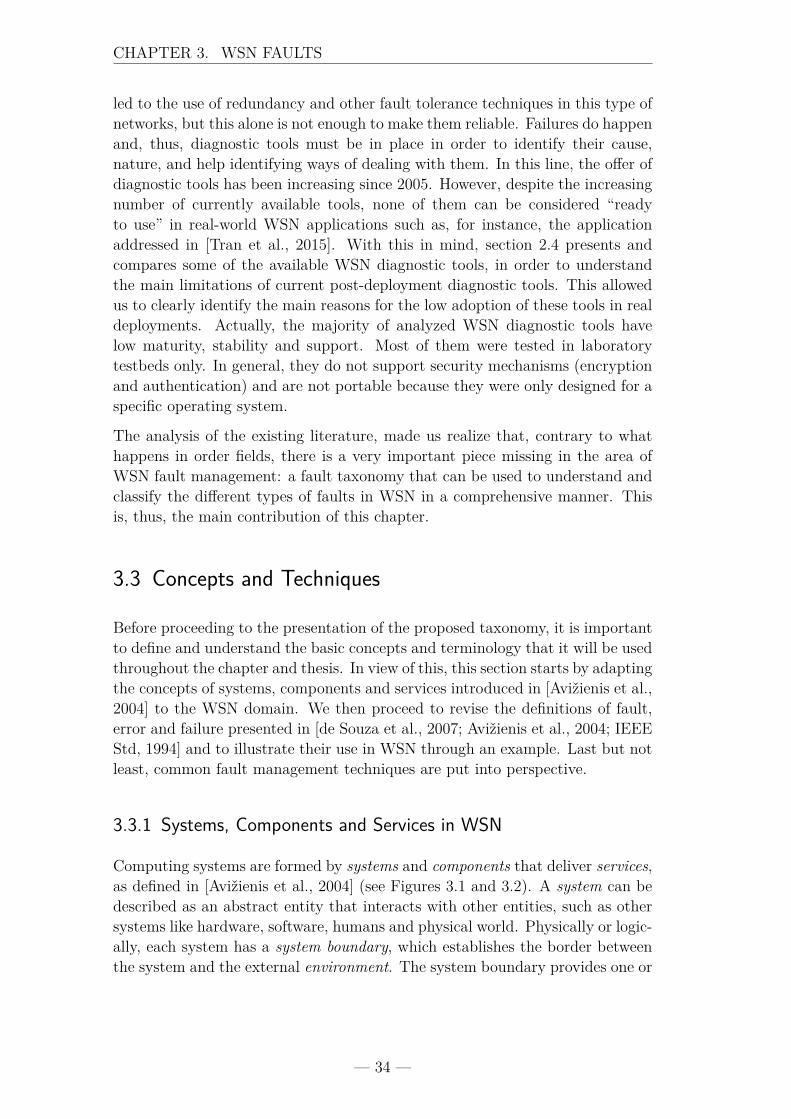
CHAPTER 3. WSN FAULTS
led to the use of redundancy and other fault tolerance techniques in this type ofnetworks, but this alone is not enough to make them reliable. Failures do happenand, thus, diagnostic tools must be in place in order to identify their cause,nature, and help identifying ways of dealing with them. In this line, the offer ofdiagnostic tools has been increasing since 2005. However, despite the increasingnumber of currently available tools, none of them can be considered “readyto use” in real-world WSN applications such as, for instance, the applicationaddressed in [Tran et al., 2015]. With this in mind, section 2.4 presents andcompares some of the available WSN diagnostic tools, in order to understandthe main limitations of current post-deployment diagnostic tools. This allowedus to clearly identify the main reasons for the low adoption of these tools in realdeployments. Actually, the majority of analyzed WSN diagnostic tools havelow maturity, stability and support. Most of them were tested in laboratorytestbeds only. In general, they do not support security mechanisms (encryptionand authentication) and are not portable because they were only designed for aspecific operating system.
The analysis of the existing literature, made us realize that, contrary to whathappens in order fields, there is a very important piece missing in the area ofWSN fault management: a fault taxonomy that can be used to understand andclassify the different types of faults in WSN in a comprehensive manner. Thisis, thus, the main contribution of this chapter.
3.3 Concepts and Techniques
Before proceeding to the presentation of the proposed taxonomy, it is importantto define and understand the basic concepts and terminology that it will be usedthroughout the chapter and thesis. In view of this, this section starts by adaptingthe concepts of systems, components and services introduced in [Avižienis et al.,2004] to the WSN domain. We then proceed to revise the definitions of fault,error and failure presented in [de Souza et al., 2007; Avižienis et al., 2004; IEEEStd, 1994] and to illustrate their use in WSN through an example. Last but notleast, common fault management techniques are put into perspective.
3.3.1 Systems, Components and Services in WSN
Computing systems are formed by systems and components that deliver services,as defined in [Avižienis et al., 2004] (see Figures 3.1 and 3.2). A system can bedescribed as an abstract entity that interacts with other entities, such as othersystems like hardware, software, humans and physical world. Physically or logic-ally, each system has a system boundary, which establishes the border betweenthe system and the external environment. The system boundary provides one or
— 34 —

CHAPTER 3. WSN FAULTS
more service access points that collectively form the service interface, throughwhich services are delivered according to a specified system behavior.
The system behavior is determined by an internal sequence of states, as specifiedin the requirements specification, where functional and non-functional require-ments are described. Furthermore, each system generates its own behavior usingits structure, which determines how its set of components are organized and in-teract with each other (see Figure 3.2). On the other hand, each component canbe regarded as another system recursively, until a component is considered anatomic component. Using this terminology, a WSN can be described as a systemwith its components and structure that delivers services to other systems (seeFigure 3.3). The components of the WSN system are the sensor nodes, which, inturn, are made up of other systems, recursively, according to a given structure.Specifically, each sensor node system has its own components (other systems)that can be logical, such as processing, communications and data acquisition, orphysical, such as radio, sensors and batteries. All of these components/systemscooperate in a sensor node system in order to deliver sensor nodes services. Ina broader perspective, all sensor nodes in a WSN cooperate in order to deliverWSN services to other external systems.
3.3.2 Faults, Errors, Failures and Anomalies
As seen in the previous subsection, systems deliver services to external systems,according to a given behavior. In the service lifecycle, any state in which thesystem behavior is in accordance with the system specification is called correctservice state. Faults or errors may happen while the system is in a correct servicestate. If they are properly handled, these faults or errors will not have impact
Figure 3.1: Systems, services and environment
— 35 —
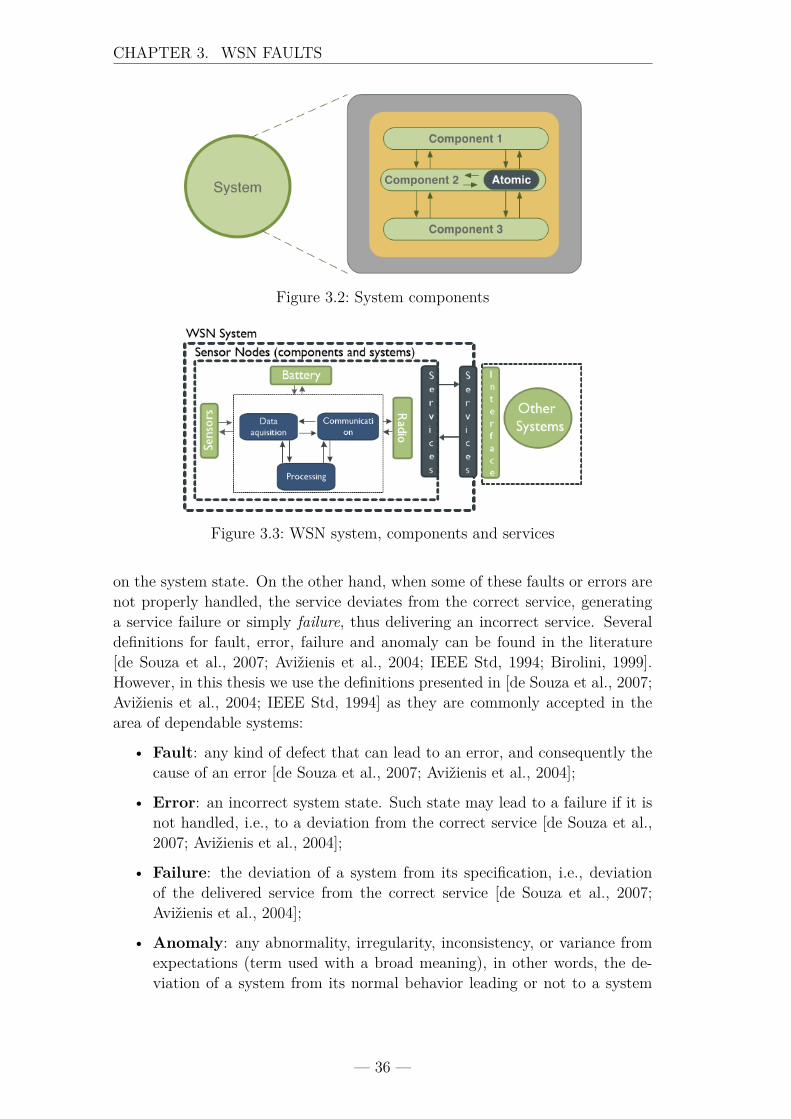
CHAPTER 3. WSN FAULTS
Figure 3.2: System components
Figure 3.3: WSN system, components and services
on the system state. On the other hand, when some of these faults or errors arenot properly handled, the service deviates from the correct service, generatinga service failure or simply failure, thus delivering an incorrect service. Severaldefinitions for fault, error, failure and anomaly can be found in the literature[de Souza et al., 2007; Avižienis et al., 2004; IEEE Std, 1994; Birolini, 1999].However, in this thesis we use the definitions presented in [de Souza et al., 2007;Avižienis et al., 2004; IEEE Std, 1994] as they are commonly accepted in thearea of dependable systems:
• Fault: any kind of defect that can lead to an error, and consequently thecause of an error [de Souza et al., 2007; Avižienis et al., 2004];
• Error: an incorrect system state. Such state may lead to a failure if it isnot handled, i.e., to a deviation from the correct service [de Souza et al.,2007; Avižienis et al., 2004];
• Failure: the deviation of a system from its specification, i.e., deviationof the delivered service from the correct service [de Souza et al., 2007;Avižienis et al., 2004];
• Anomaly: any abnormality, irregularity, inconsistency, or variance fromexpectations (term used with a broad meaning), in other words, the de-viation of a system from its normal behavior leading or not to a system
— 36 —
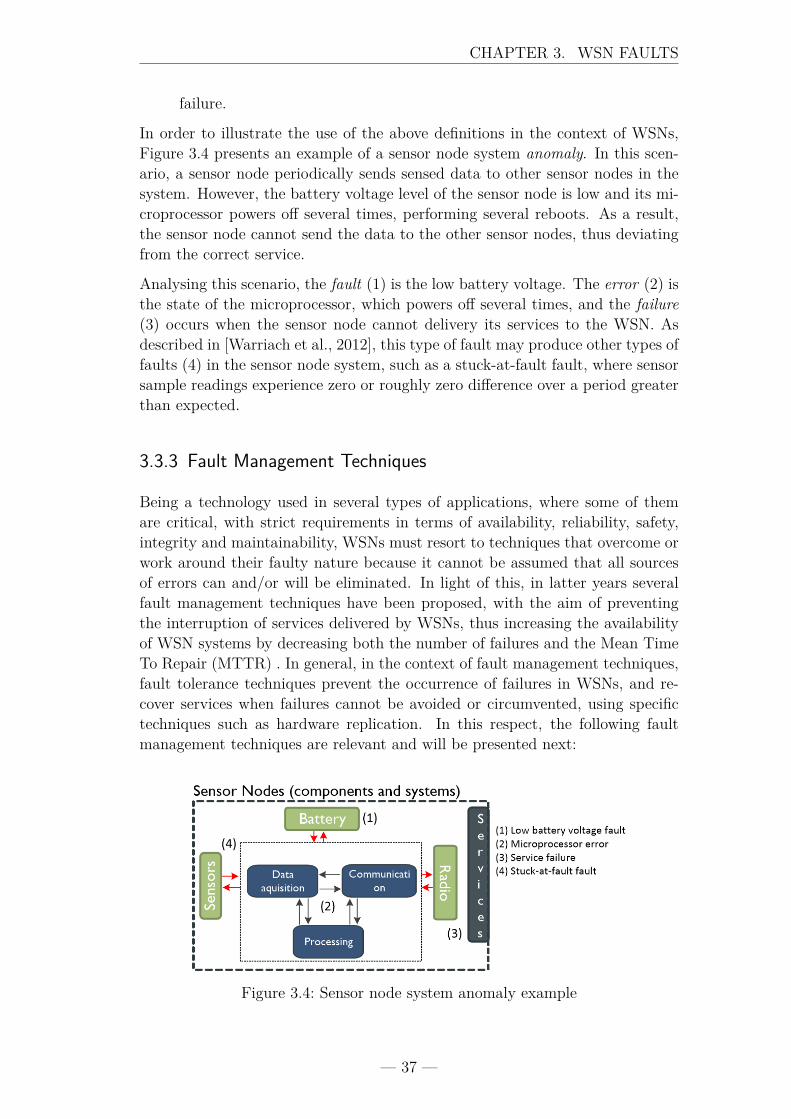
CHAPTER 3. WSN FAULTS
failure.
In order to illustrate the use of the above definitions in the context of WSNs,Figure 3.4 presents an example of a sensor node system anomaly. In this scen-ario, a sensor node periodically sends sensed data to other sensor nodes in thesystem. However, the battery voltage level of the sensor node is low and its mi-croprocessor powers off several times, performing several reboots. As a result,the sensor node cannot send the data to the other sensor nodes, thus deviatingfrom the correct service.
Analysing this scenario, the fault (1) is the low battery voltage. The error (2) isthe state of the microprocessor, which powers off several times, and the failure(3) occurs when the sensor node cannot delivery its services to the WSN. Asdescribed in [Warriach et al., 2012], this type of fault may produce other types offaults (4) in the sensor node system, such as a stuck-at-fault fault, where sensorsample readings experience zero or roughly zero difference over a period greaterthan expected.
3.3.3 Fault Management Techniques
Being a technology used in several types of applications, where some of themare critical, with strict requirements in terms of availability, reliability, safety,integrity and maintainability, WSNs must resort to techniques that overcome orwork around their faulty nature because it cannot be assumed that all sourcesof errors can and/or will be eliminated. In light of this, in latter years severalfault management techniques have been proposed, with the aim of preventingthe interruption of services delivered by WSNs, thus increasing the availabilityof WSN systems by decreasing both the number of failures and the Mean TimeTo Repair (MTTR) . In general, in the context of fault management techniques,fault tolerance techniques prevent the occurrence of failures in WSNs, and re-cover services when failures cannot be avoided or circumvented, using specifictechniques such as hardware replication. In this respect, the following faultmanagement techniques are relevant and will be presented next:
Figure 3.4: Sensor node system anomaly example
— 37 —
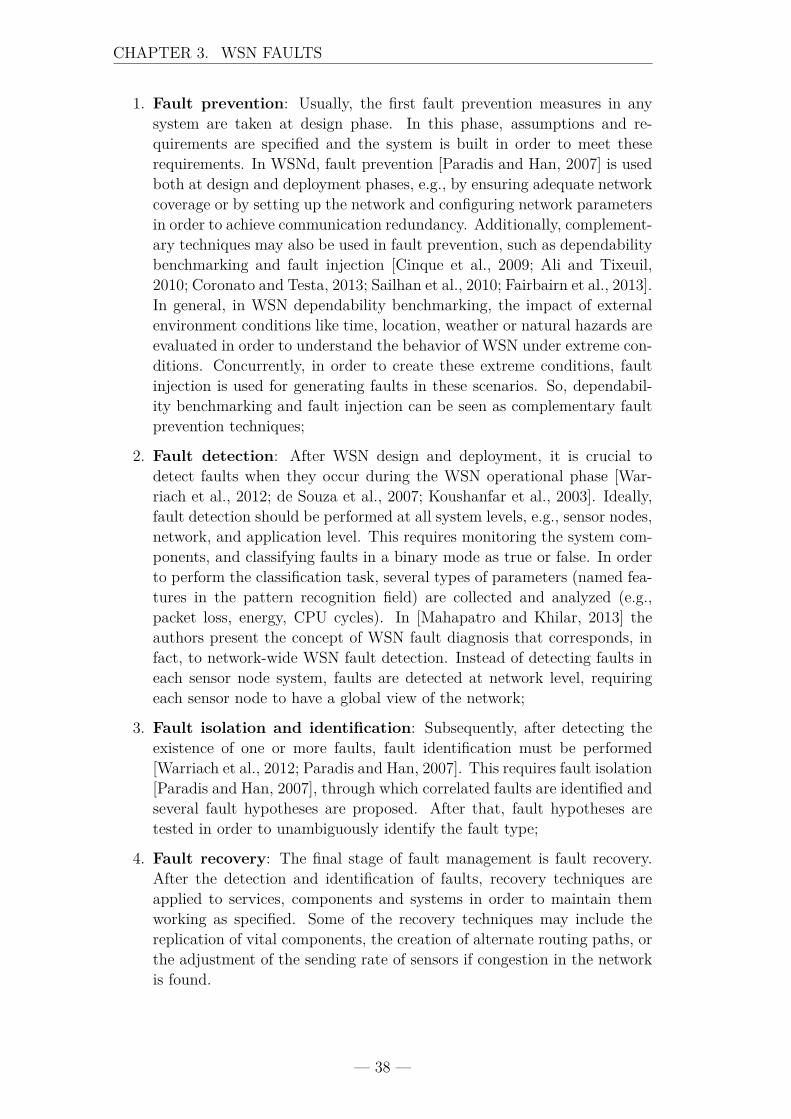
CHAPTER 3. WSN FAULTS
1. Fault prevention: Usually, the first fault prevention measures in anysystem are taken at design phase. In this phase, assumptions and re-quirements are specified and the system is built in order to meet theserequirements. In WSNd, fault prevention [Paradis and Han, 2007] is usedboth at design and deployment phases, e.g., by ensuring adequate networkcoverage or by setting up the network and configuring network parametersin order to achieve communication redundancy. Additionally, complement-ary techniques may also be used in fault prevention, such as dependabilitybenchmarking and fault injection [Cinque et al., 2009; Ali and Tixeuil,2010; Coronato and Testa, 2013; Sailhan et al., 2010; Fairbairn et al., 2013].In general, in WSN dependability benchmarking, the impact of externalenvironment conditions like time, location, weather or natural hazards areevaluated in order to understand the behavior of WSN under extreme con-ditions. Concurrently, in order to create these extreme conditions, faultinjection is used for generating faults in these scenarios. So, dependabil-ity benchmarking and fault injection can be seen as complementary faultprevention techniques;
2. Fault detection: After WSN design and deployment, it is crucial todetect faults when they occur during the WSN operational phase [War-riach et al., 2012; de Souza et al., 2007; Koushanfar et al., 2003]. Ideally,fault detection should be performed at all system levels, e.g., sensor nodes,network, and application level. This requires monitoring the system com-ponents, and classifying faults in a binary mode as true or false. In orderto perform the classification task, several types of parameters (named fea-tures in the pattern recognition field) are collected and analyzed (e.g.,packet loss, energy, CPU cycles). In [Mahapatro and Khilar, 2013] theauthors present the concept of WSN fault diagnosis that corresponds, infact, to network-wide WSN fault detection. Instead of detecting faults ineach sensor node system, faults are detected at network level, requiringeach sensor node to have a global view of the network;
3. Fault isolation and identification: Subsequently, after detecting theexistence of one or more faults, fault identification must be performed[Warriach et al., 2012; Paradis and Han, 2007]. This requires fault isolation[Paradis and Han, 2007], through which correlated faults are identified andseveral fault hypotheses are proposed. After that, fault hypotheses aretested in order to unambiguously identify the fault type;
4. Fault recovery: The final stage of fault management is fault recovery.After the detection and identification of faults, recovery techniques areapplied to services, components and systems in order to maintain themworking as specified. Some of the recovery techniques may include thereplication of vital components, the creation of alternate routing paths, orthe adjustment of the sending rate of sensors if congestion in the networkis found.
— 38 —

CHAPTER 3. WSN FAULTS
3.4 WSN Fault Taxonomy
This section presents the proposed WSN fault taxonomy. The purpose of thistaxonomy is for it to be used as reference by researchers, developers, integratorsand users, eliminating ambiguity and, ultimately, enabling the use of a commonand coherent perception of WSN faults.
One outstanding paper on basic concepts and taxonomy in dependable andsecure computing is presented in [Avižienis et al., 2004] and, in fact, it servedas the main basis for the taxonomy presented in the current report. It shouldbe noted that the authors of [Avižienis et al., 2004] explicitly mention that theirproposed taxonomy is not closed and should be completed as new technologicalfields arise. This is the case with the current thesis, that extends this taxonomyto the WSN field.
The taxonomy proposed in the current chapter was developed as the result ofan extensive analysis of the literature and state of art on WSN faults, faulttolerance, dependability and secure computing. Through this analysis, we wereable to identify a comprehensive set of WSN faults, which were subsequentlyorganized into different viewpoints and types, as presented in Figure 3.5
In this section, in addition to presenting and explaining each of the WSN faulttypes, we will provide examples of each fault type and their respective refer-ences, for further reading. The description of the various faults will be doneaccording to the identified viewpoints (Figure 3.5), namely, phase of creation oroccurrence, system boundaries, phenomenological cause, dimension, objective,intent, capability, persistence, state, reproducibility and source system.
3.4.1 Phase of Creation or Occurrence
WSNs go through different stages in their lifecycle and consequently differenttypes of faults can occur in these stages. In the taxonomy proposed in [Aviži-enis et al., 2004] the authors only consider two phases, namely the developmentphase and the operational phase. Nevertheless, our experience in WSN deploy-ment [Tran et al., 2015] in industrial environments clearly showed us that thecharacteristics of WSNs justify the need for two more fault types: requirementsphase faults, and deployment phase faults. Thus, from the viewpoint of phase ofcreation or occurrence, the following four fault types should be considered:
1. Requirement faults: WSN design starts with the requirements stagewhere functional and non-functional requirements are specified. In thisstage, some requirements may be ambiguous and specification errors mayoccur, leading to requirement faults. For instance, routing protocols mayhave been chosen on the assumption of a specific deployment scenario orspecific sensor node mobility patterns. Thus, if some of these assumptionsare not met, the used routing protocol may not be able to cope with
— 39 —
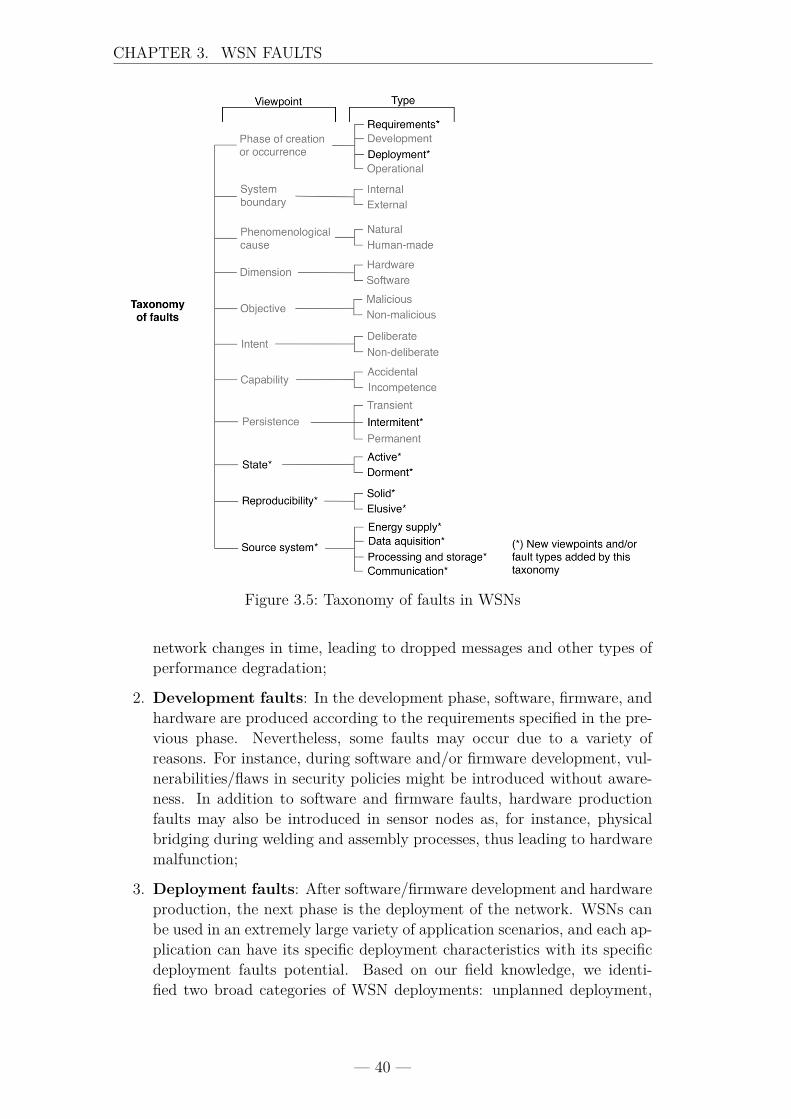
CHAPTER 3. WSN FAULTS
Figure 3.5: Taxonomy of faults in WSNs
network changes in time, leading to dropped messages and other types ofperformance degradation;
2. Development faults: In the development phase, software, firmware, andhardware are produced according to the requirements specified in the pre-vious phase. Nevertheless, some faults may occur due to a variety ofreasons. For instance, during software and/or firmware development, vul-nerabilities/flaws in security policies might be introduced without aware-ness. In addition to software and firmware faults, hardware productionfaults may also be introduced in sensor nodes as, for instance, physicalbridging during welding and assembly processes, thus leading to hardwaremalfunction;
3. Deployment faults: After software/firmware development and hardwareproduction, the next phase is the deployment of the network. WSNs canbe used in an extremely large variety of application scenarios, and each ap-plication can have its specific deployment characteristics with its specificdeployment faults potential. Based on our field knowledge, we identi-fied two broad categories of WSN deployments: unplanned deployment,
— 40 —
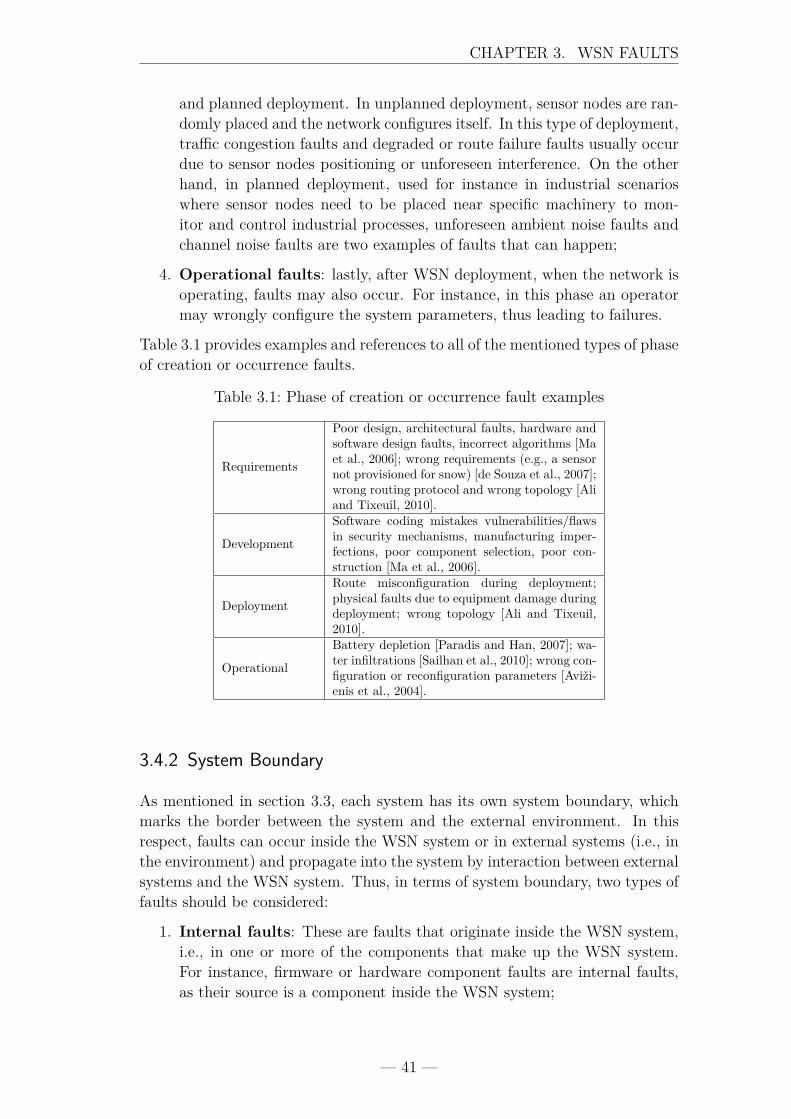
CHAPTER 3. WSN FAULTS
and planned deployment. In unplanned deployment, sensor nodes are ran-domly placed and the network configures itself. In this type of deployment,traffic congestion faults and degraded or route failure faults usually occurdue to sensor nodes positioning or unforeseen interference. On the otherhand, in planned deployment, used for instance in industrial scenarioswhere sensor nodes need to be placed near specific machinery to mon-itor and control industrial processes, unforeseen ambient noise faults andchannel noise faults are two examples of faults that can happen;
4. Operational faults: lastly, after WSN deployment, when the network isoperating, faults may also occur. For instance, in this phase an operatormay wrongly configure the system parameters, thus leading to failures.
Table 3.1 provides examples and references to all of the mentioned types of phaseof creation or occurrence faults.
Table 3.1: Phase of creation or occurrence fault examples
Requirements
Poor design, architectural faults, hardware andsoftware design faults, incorrect algorithms [Maet al., 2006]; wrong requirements (e.g., a sensornot provisioned for snow) [de Souza et al., 2007];wrong routing protocol and wrong topology [Aliand Tixeuil, 2010].
Development
Software coding mistakes vulnerabilities/flawsin security mechanisms, manufacturing imper-fections, poor component selection, poor con-struction [Ma et al., 2006].
Deployment
Route misconfiguration during deployment;physical faults due to equipment damage duringdeployment; wrong topology [Ali and Tixeuil,2010].
Operational
Battery depletion [Paradis and Han, 2007]; wa-ter infiltrations [Sailhan et al., 2010]; wrong con-figuration or reconfiguration parameters [Aviži-enis et al., 2004].
3.4.2 System Boundary
As mentioned in section 3.3, each system has its own system boundary, whichmarks the border between the system and the external environment. In thisrespect, faults can occur inside the WSN system or in external systems (i.e., inthe environment) and propagate into the system by interaction between externalsystems and the WSN system. Thus, in terms of system boundary, two types offaults should be considered:
1. Internal faults: These are faults that originate inside the WSN system,i.e., in one or more of the components that make up the WSN system.For instance, firmware or hardware component faults are internal faults,as their source is a component inside the WSN system;
— 41 —
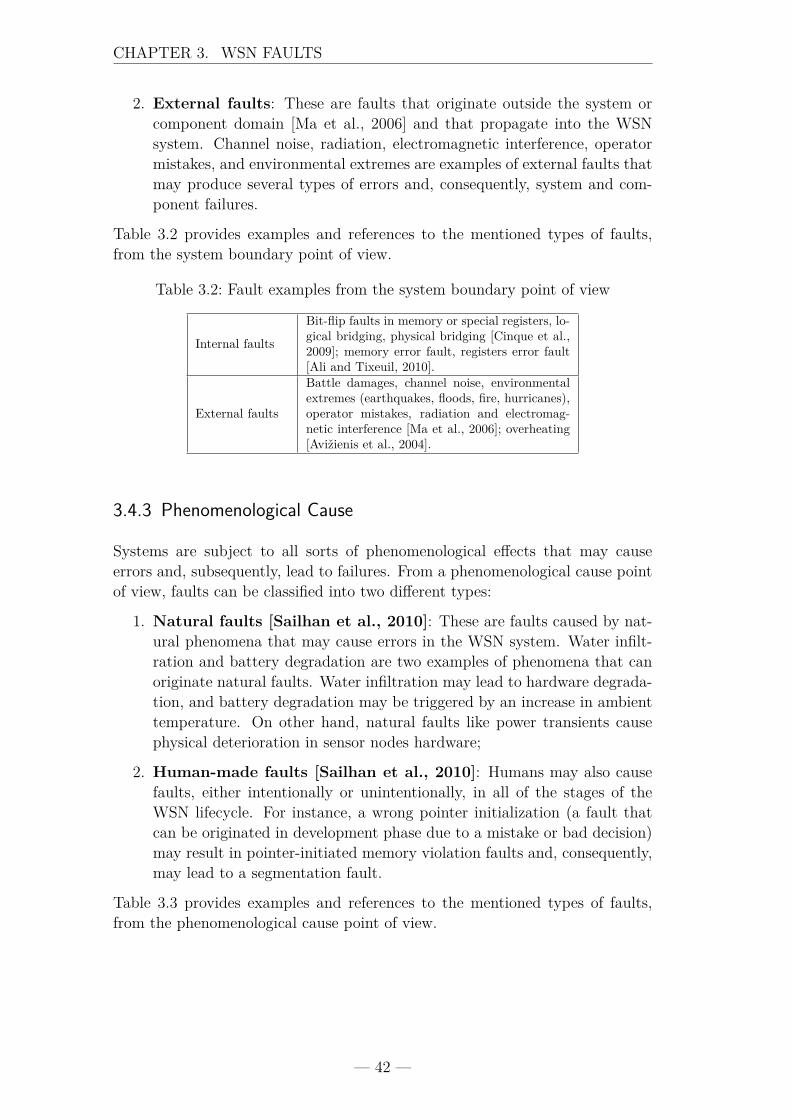
CHAPTER 3. WSN FAULTS
2. External faults: These are faults that originate outside the system orcomponent domain [Ma et al., 2006] and that propagate into the WSNsystem. Channel noise, radiation, electromagnetic interference, operatormistakes, and environmental extremes are examples of external faults thatmay produce several types of errors and, consequently, system and com-ponent failures.
Table 3.2 provides examples and references to the mentioned types of faults,from the system boundary point of view.
Table 3.2: Fault examples from the system boundary point of view
Internal faults
Bit-flip faults in memory or special registers, lo-gical bridging, physical bridging [Cinque et al.,2009]; memory error fault, registers error fault[Ali and Tixeuil, 2010].
External faults
Battle damages, channel noise, environmentalextremes (earthquakes, floods, fire, hurricanes),operator mistakes, radiation and electromag-netic interference [Ma et al., 2006]; overheating[Avižienis et al., 2004].
3.4.3 Phenomenological Cause
Systems are subject to all sorts of phenomenological effects that may causeerrors and, subsequently, lead to failures. From a phenomenological cause pointof view, faults can be classified into two different types:
1. Natural faults [Sailhan et al., 2010]: These are faults caused by nat-ural phenomena that may cause errors in the WSN system. Water infilt-ration and battery degradation are two examples of phenomena that canoriginate natural faults. Water infiltration may lead to hardware degrada-tion, and battery degradation may be triggered by an increase in ambienttemperature. On other hand, natural faults like power transients causephysical deterioration in sensor nodes hardware;
2. Human-made faults [Sailhan et al., 2010]: Humans may also causefaults, either intentionally or unintentionally, in all of the stages of theWSN lifecycle. For instance, a wrong pointer initialization (a fault thatcan be originated in development phase due to a mistake or bad decision)may result in pointer-initiated memory violation faults and, consequently,may lead to a segmentation fault.
Table 3.3 provides examples and references to the mentioned types of faults,from the phenomenological cause point of view.
— 42 —
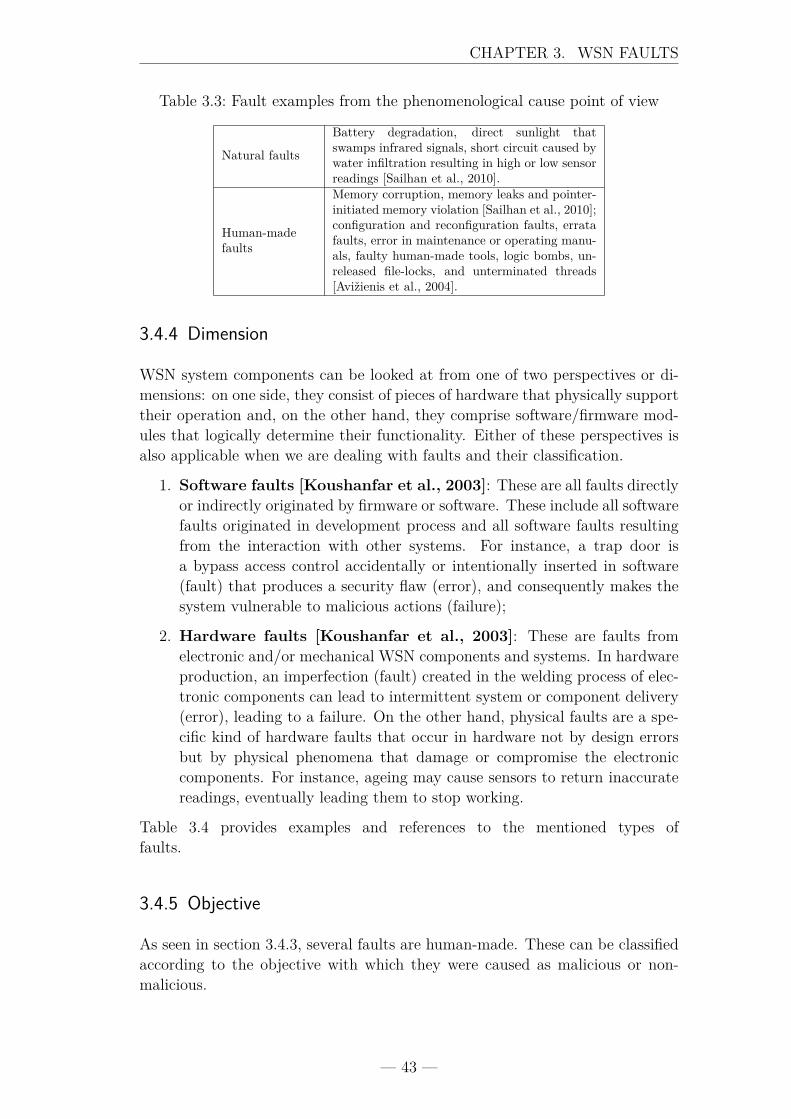
CHAPTER 3. WSN FAULTS
Table 3.3: Fault examples from the phenomenological cause point of view
Natural faults
Battery degradation, direct sunlight thatswamps infrared signals, short circuit caused bywater infiltration resulting in high or low sensorreadings [Sailhan et al., 2010].
Human-madefaults
Memory corruption, memory leaks and pointer-initiated memory violation [Sailhan et al., 2010];configuration and reconfiguration faults, erratafaults, error in maintenance or operating manu-als, faulty human-made tools, logic bombs, un-released file-locks, and unterminated threads[Avižienis et al., 2004].
3.4.4 Dimension
WSN system components can be looked at from one of two perspectives or di-mensions: on one side, they consist of pieces of hardware that physically supporttheir operation and, on the other hand, they comprise software/firmware mod-ules that logically determine their functionality. Either of these perspectives isalso applicable when we are dealing with faults and their classification.
1. Software faults [Koushanfar et al., 2003]: These are all faults directlyor indirectly originated by firmware or software. These include all softwarefaults originated in development process and all software faults resultingfrom the interaction with other systems. For instance, a trap door isa bypass access control accidentally or intentionally inserted in software(fault) that produces a security flaw (error), and consequently makes thesystem vulnerable to malicious actions (failure);
2. Hardware faults [Koushanfar et al., 2003]: These are faults fromelectronic and/or mechanical WSN components and systems. In hardwareproduction, an imperfection (fault) created in the welding process of elec-tronic components can lead to intermittent system or component delivery(error), leading to a failure. On the other hand, physical faults are a spe-cific kind of hardware faults that occur in hardware not by design errorsbut by physical phenomena that damage or compromise the electroniccomponents. For instance, ageing may cause sensors to return inaccuratereadings, eventually leading them to stop working.
Table 3.4 provides examples and references to the mentioned types offaults.
3.4.5 Objective
As seen in section 3.4.3, several faults are human-made. These can be classifiedaccording to the objective with which they were caused as malicious or non-malicious.
— 43 —
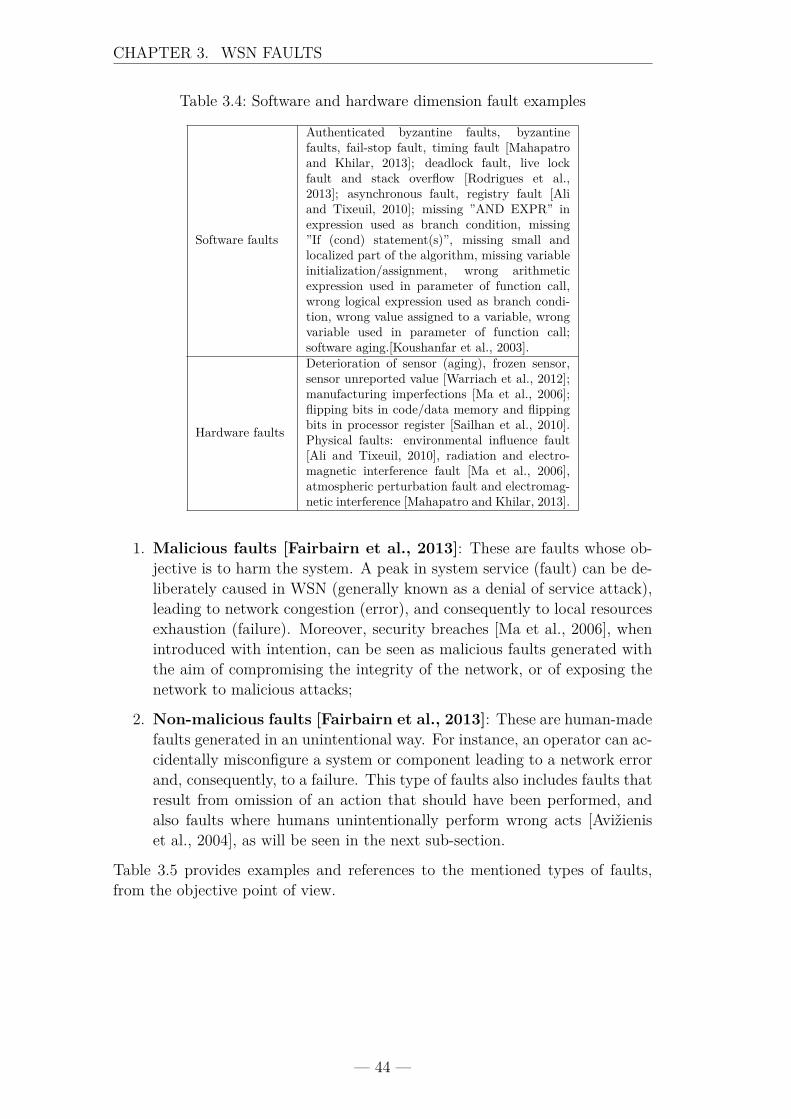
CHAPTER 3. WSN FAULTS
Table 3.4: Software and hardware dimension fault examples
Software faults
Authenticated byzantine faults, byzantinefaults, fail-stop fault, timing fault [Mahapatroand Khilar, 2013]; deadlock fault, live lockfault and stack overflow [Rodrigues et al.,2013]; asynchronous fault, registry fault [Aliand Tixeuil, 2010]; missing ”AND EXPR” inexpression used as branch condition, missing”If (cond) statement(s)”, missing small andlocalized part of the algorithm, missing variableinitialization/assignment, wrong arithmeticexpression used in parameter of function call,wrong logical expression used as branch condi-tion, wrong value assigned to a variable, wrongvariable used in parameter of function call;software aging.[Koushanfar et al., 2003].
Hardware faults
Deterioration of sensor (aging), frozen sensor,sensor unreported value [Warriach et al., 2012];manufacturing imperfections [Ma et al., 2006];flipping bits in code/data memory and flippingbits in processor register [Sailhan et al., 2010].Physical faults: environmental influence fault[Ali and Tixeuil, 2010], radiation and electro-magnetic interference fault [Ma et al., 2006],atmospheric perturbation fault and electromag-netic interference [Mahapatro and Khilar, 2013].
1. Malicious faults [Fairbairn et al., 2013]: These are faults whose ob-jective is to harm the system. A peak in system service (fault) can be de-liberately caused in WSN (generally known as a denial of service attack),leading to network congestion (error), and consequently to local resourcesexhaustion (failure). Moreover, security breaches [Ma et al., 2006], whenintroduced with intention, can be seen as malicious faults generated withthe aim of compromising the integrity of the network, or of exposing thenetwork to malicious attacks;
2. Non-malicious faults [Fairbairn et al., 2013]: These are human-madefaults generated in an unintentional way. For instance, an operator can ac-cidentally misconfigure a system or component leading to a network errorand, consequently, to a failure. This type of faults also includes faults thatresult from omission of an action that should have been performed, andalso faults where humans unintentionally perform wrong acts [Avižieniset al., 2004], as will be seen in the next sub-section.
Table 3.5 provides examples and references to the mentioned types of faults,from the objective point of view.
— 44 —
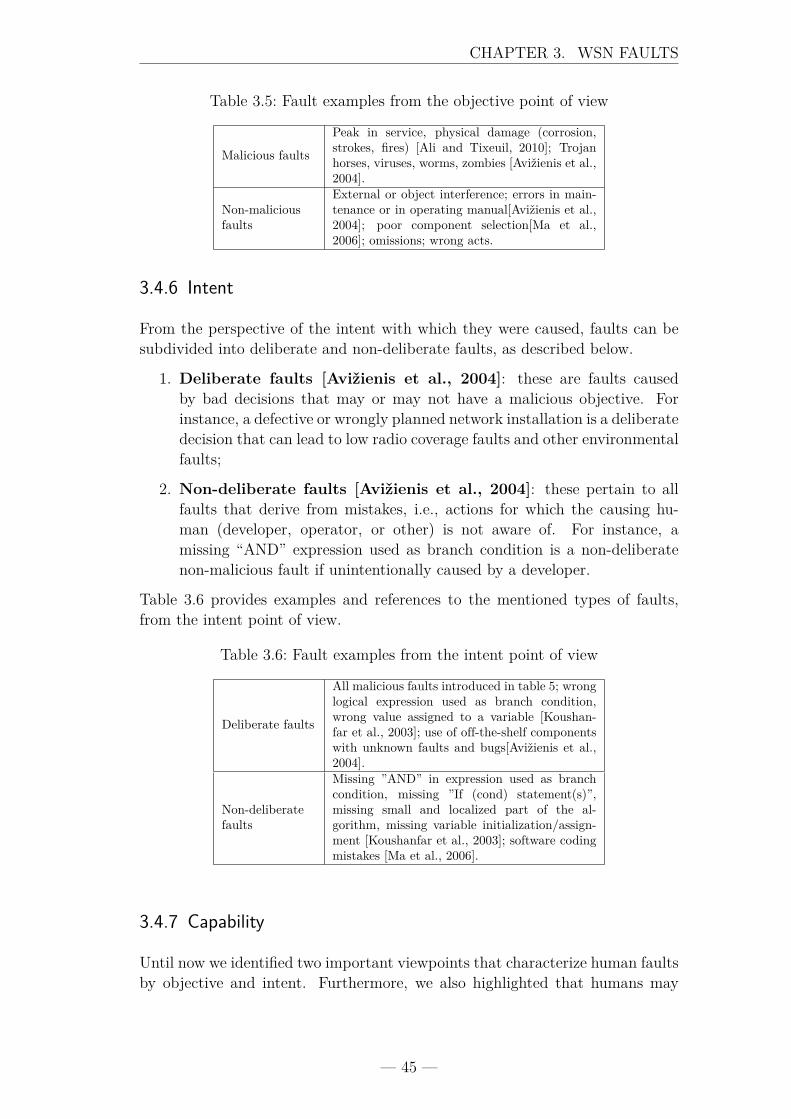
CHAPTER 3. WSN FAULTS
Table 3.5: Fault examples from the objective point of view
Malicious faults
Peak in service, physical damage (corrosion,strokes, fires) [Ali and Tixeuil, 2010]; Trojanhorses, viruses, worms, zombies [Avižienis et al.,2004].
Non-maliciousfaults
External or object interference; errors in main-tenance or in operating manual[Avižienis et al.,2004]; poor component selection[Ma et al.,2006]; omissions; wrong acts.
3.4.6 Intent
From the perspective of the intent with which they were caused, faults can besubdivided into deliberate and non-deliberate faults, as described below.
1. Deliberate faults [Avižienis et al., 2004]: these are faults causedby bad decisions that may or may not have a malicious objective. Forinstance, a defective or wrongly planned network installation is a deliberatedecision that can lead to low radio coverage faults and other environmentalfaults;
2. Non-deliberate faults [Avižienis et al., 2004]: these pertain to allfaults that derive from mistakes, i.e., actions for which the causing hu-man (developer, operator, or other) is not aware of. For instance, amissing “AND” expression used as branch condition is a non-deliberatenon-malicious fault if unintentionally caused by a developer.
Table 3.6 provides examples and references to the mentioned types of faults,from the intent point of view.
Table 3.6: Fault examples from the intent point of view
Deliberate faults
All malicious faults introduced in table 5; wronglogical expression used as branch condition,wrong value assigned to a variable [Koushan-far et al., 2003]; use of off-the-shelf componentswith unknown faults and bugs[Avižienis et al.,2004].
Non-deliberatefaults
Missing ”AND” in expression used as branchcondition, missing ”If (cond) statement(s)”,missing small and localized part of the al-gorithm, missing variable initialization/assign-ment [Koushanfar et al., 2003]; software codingmistakes [Ma et al., 2006].
3.4.7 Capability
Until now we identified two important viewpoints that characterize human faultsby objective and intent. Furthermore, we also highlighted that humans may
— 45 —
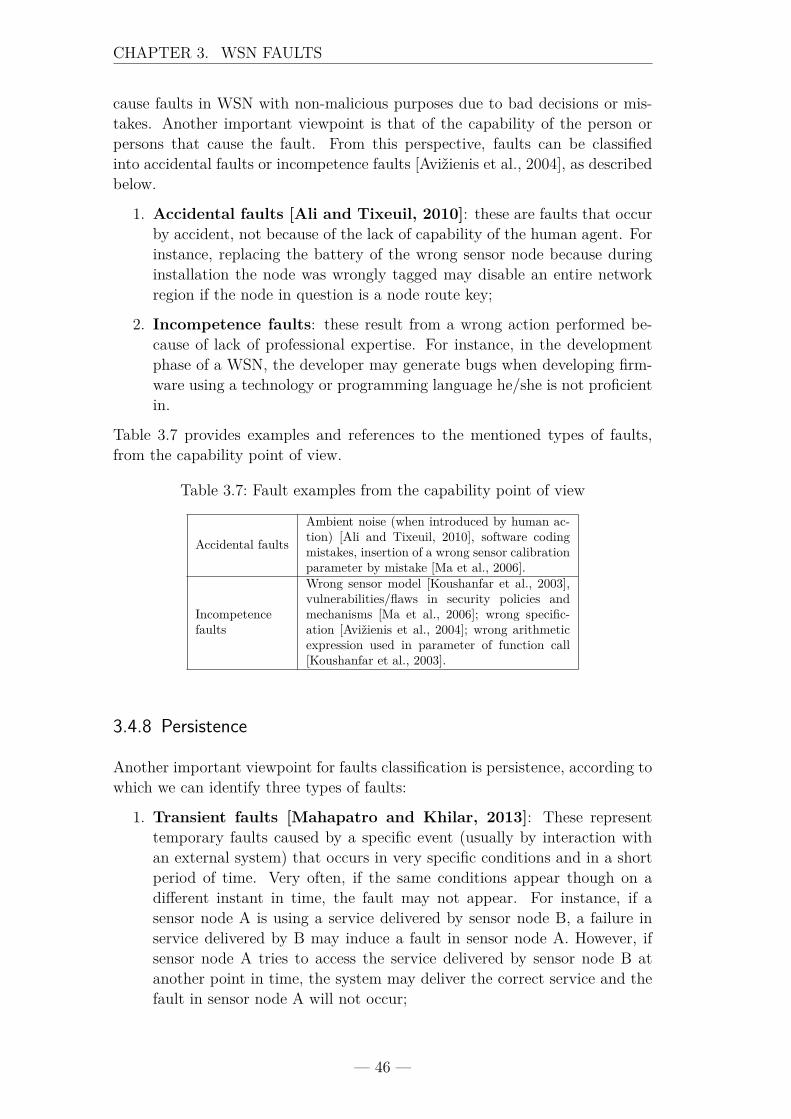
CHAPTER 3. WSN FAULTS
cause faults in WSN with non-malicious purposes due to bad decisions or mis-takes. Another important viewpoint is that of the capability of the person orpersons that cause the fault. From this perspective, faults can be classifiedinto accidental faults or incompetence faults [Avižienis et al., 2004], as describedbelow.
1. Accidental faults [Ali and Tixeuil, 2010]: these are faults that occurby accident, not because of the lack of capability of the human agent. Forinstance, replacing the battery of the wrong sensor node because duringinstallation the node was wrongly tagged may disable an entire networkregion if the node in question is a node route key;
2. Incompetence faults: these result from a wrong action performed be-cause of lack of professional expertise. For instance, in the developmentphase of a WSN, the developer may generate bugs when developing firm-ware using a technology or programming language he/she is not proficientin.
Table 3.7 provides examples and references to the mentioned types of faults,from the capability point of view.
Table 3.7: Fault examples from the capability point of view
Accidental faults
Ambient noise (when introduced by human ac-tion) [Ali and Tixeuil, 2010], software codingmistakes, insertion of a wrong sensor calibrationparameter by mistake [Ma et al., 2006].
Incompetencefaults
Wrong sensor model [Koushanfar et al., 2003],vulnerabilities/flaws in security policies andmechanisms [Ma et al., 2006]; wrong specific-ation [Avižienis et al., 2004]; wrong arithmeticexpression used in parameter of function call[Koushanfar et al., 2003].
3.4.8 Persistence
Another important viewpoint for faults classification is persistence, according towhich we can identify three types of faults:
1. Transient faults [Mahapatro and Khilar, 2013]: These representtemporary faults caused by a specific event (usually by interaction withan external system) that occurs in very specific conditions and in a shortperiod of time. Very often, if the same conditions appear though on adifferent instant in time, the fault may not appear. For instance, if asensor node A is using a service delivered by sensor node B, a failure inservice delivered by B may induce a fault in sensor node A. However, ifsensor node A tries to access the service delivered by sensor node B atanother point in time, the system may deliver the correct service and thefault in sensor node A will not occur;
— 46 —
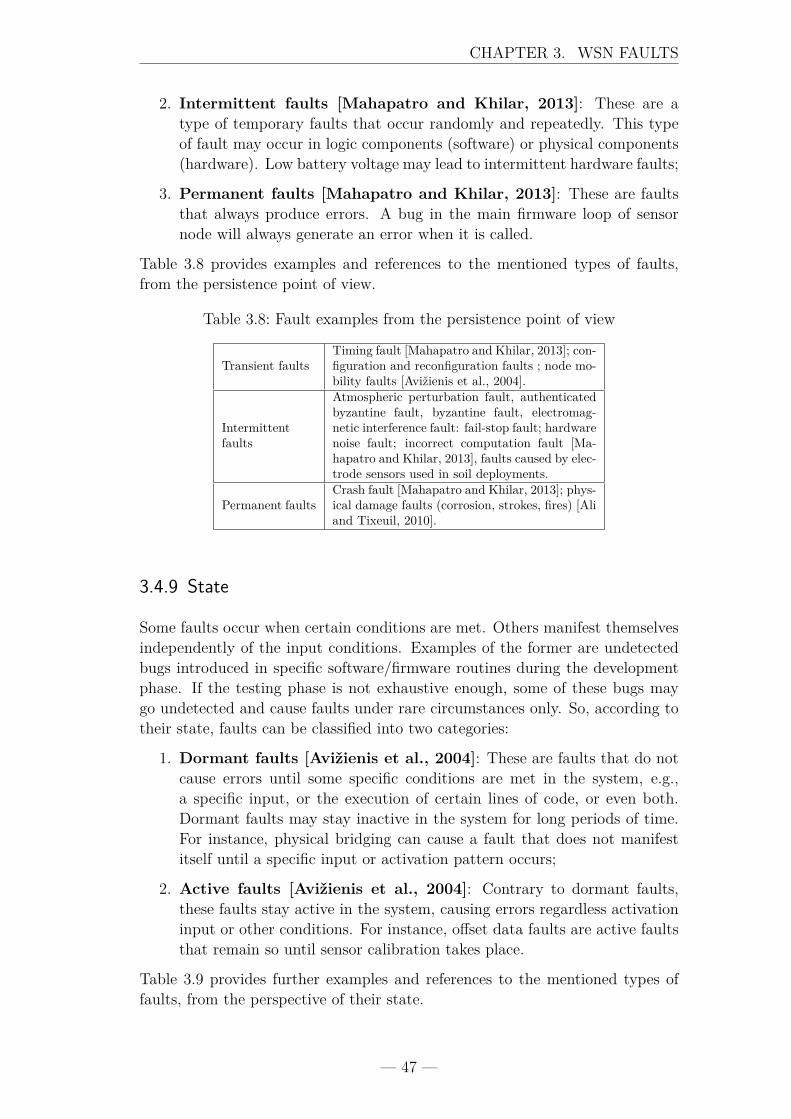
CHAPTER 3. WSN FAULTS
2. Intermittent faults [Mahapatro and Khilar, 2013]: These are atype of temporary faults that occur randomly and repeatedly. This typeof fault may occur in logic components (software) or physical components(hardware). Low battery voltage may lead to intermittent hardware faults;
3. Permanent faults [Mahapatro and Khilar, 2013]: These are faultsthat always produce errors. A bug in the main firmware loop of sensornode will always generate an error when it is called.
Table 3.8 provides examples and references to the mentioned types of faults,from the persistence point of view.
Table 3.8: Fault examples from the persistence point of view
Transient faultsTiming fault [Mahapatro and Khilar, 2013]; con-figuration and reconfiguration faults ; node mo-bility faults [Avižienis et al., 2004].
Intermittentfaults
Atmospheric perturbation fault, authenticatedbyzantine fault, byzantine fault, electromag-netic interference fault: fail-stop fault; hardwarenoise fault; incorrect computation fault [Ma-hapatro and Khilar, 2013], faults caused by elec-trode sensors used in soil deployments.
Permanent faultsCrash fault [Mahapatro and Khilar, 2013]; phys-ical damage faults (corrosion, strokes, fires) [Aliand Tixeuil, 2010].
3.4.9 State
Some faults occur when certain conditions are met. Others manifest themselvesindependently of the input conditions. Examples of the former are undetectedbugs introduced in specific software/firmware routines during the developmentphase. If the testing phase is not exhaustive enough, some of these bugs maygo undetected and cause faults under rare circumstances only. So, according totheir state, faults can be classified into two categories:
1. Dormant faults [Avižienis et al., 2004]: These are faults that do notcause errors until some specific conditions are met in the system, e.g.,a specific input, or the execution of certain lines of code, or even both.Dormant faults may stay inactive in the system for long periods of time.For instance, physical bridging can cause a fault that does not manifestitself until a specific input or activation pattern occurs;
2. Active faults [Avižienis et al., 2004]: Contrary to dormant faults,these faults stay active in the system, causing errors regardless activationinput or other conditions. For instance, offset data faults are active faultsthat remain so until sensor calibration takes place.
Table 3.9 provides further examples and references to the mentioned types offaults, from the perspective of their state.
— 47 —
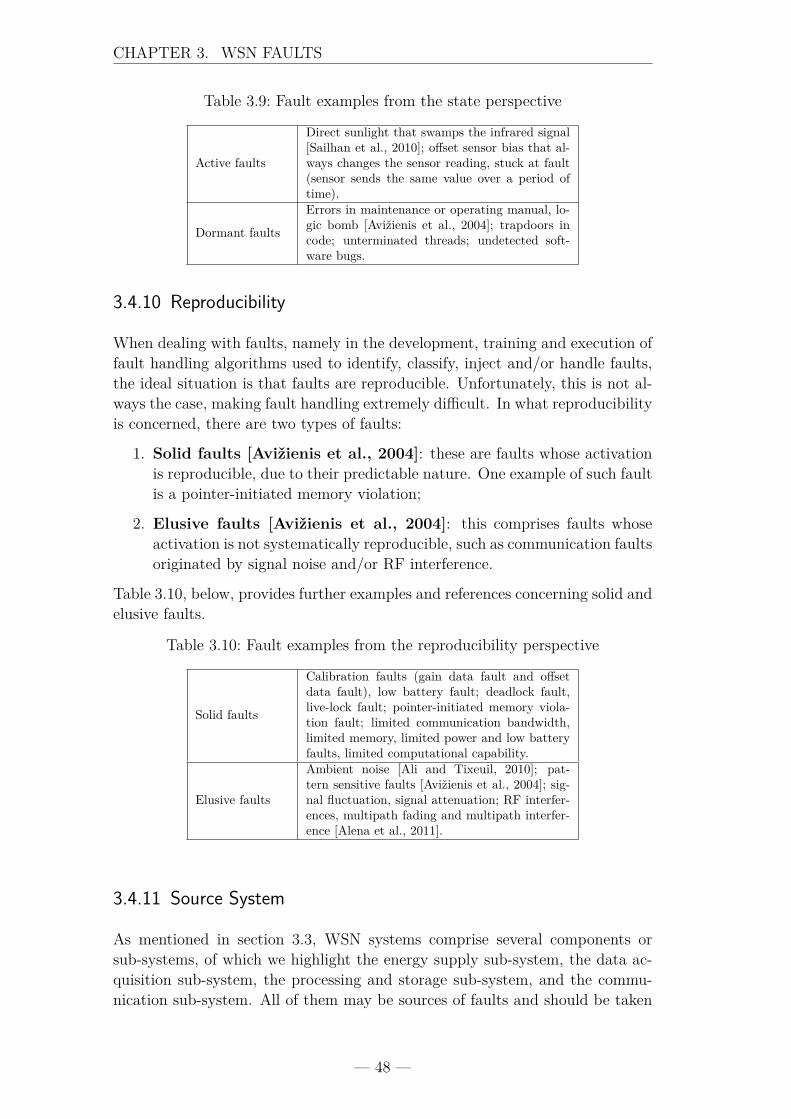
CHAPTER 3. WSN FAULTS
Table 3.9: Fault examples from the state perspective
Active faults
Direct sunlight that swamps the infrared signal[Sailhan et al., 2010]; offset sensor bias that al-ways changes the sensor reading, stuck at fault(sensor sends the same value over a period oftime).
Dormant faults
Errors in maintenance or operating manual, lo-gic bomb [Avižienis et al., 2004]; trapdoors incode; unterminated threads; undetected soft-ware bugs.
3.4.10 Reproducibility
When dealing with faults, namely in the development, training and execution offault handling algorithms used to identify, classify, inject and/or handle faults,the ideal situation is that faults are reproducible. Unfortunately, this is not al-ways the case, making fault handling extremely difficult. In what reproducibilityis concerned, there are two types of faults:
1. Solid faults [Avižienis et al., 2004]: these are faults whose activationis reproducible, due to their predictable nature. One example of such faultis a pointer-initiated memory violation;
2. Elusive faults [Avižienis et al., 2004]: this comprises faults whoseactivation is not systematically reproducible, such as communication faultsoriginated by signal noise and/or RF interference.
Table 3.10, below, provides further examples and references concerning solid andelusive faults.
Table 3.10: Fault examples from the reproducibility perspective
Solid faults
Calibration faults (gain data fault and offsetdata fault), low battery fault; deadlock fault,live-lock fault; pointer-initiated memory viola-tion fault; limited communication bandwidth,limited memory, limited power and low batteryfaults, limited computational capability.
Elusive faults
Ambient noise [Ali and Tixeuil, 2010]; pat-tern sensitive faults [Avižienis et al., 2004]; sig-nal fluctuation, signal attenuation; RF interfer-ences, multipath fading and multipath interfer-ence [Alena et al., 2011].
3.4.11 Source System
As mentioned in section 3.3, WSN systems comprise several components orsub-systems, of which we highlight the energy supply sub-system, the data ac-quisition sub-system, the processing and storage sub-system, and the commu-nication sub-system. All of them may be sources of faults and should be taken
— 48 —
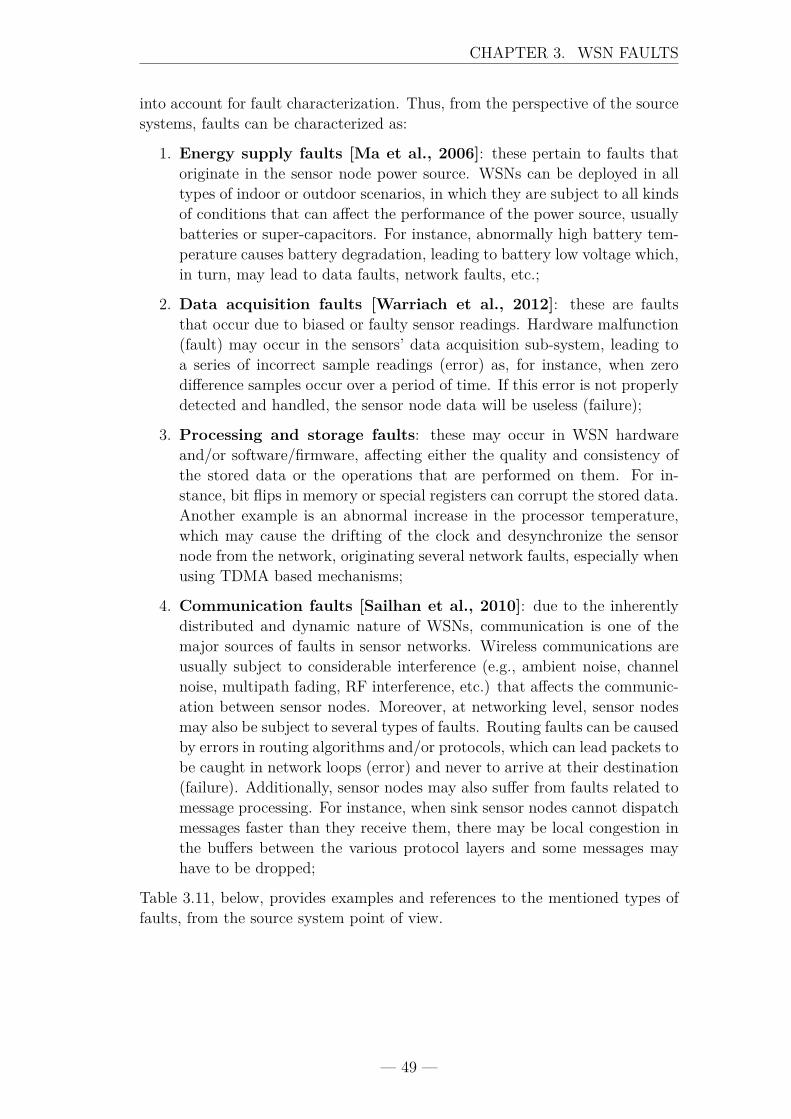
CHAPTER 3. WSN FAULTS
into account for fault characterization. Thus, from the perspective of the sourcesystems, faults can be characterized as:
1. Energy supply faults [Ma et al., 2006]: these pertain to faults thatoriginate in the sensor node power source. WSNs can be deployed in alltypes of indoor or outdoor scenarios, in which they are subject to all kindsof conditions that can affect the performance of the power source, usuallybatteries or super-capacitors. For instance, abnormally high battery tem-perature causes battery degradation, leading to battery low voltage which,in turn, may lead to data faults, network faults, etc.;
2. Data acquisition faults [Warriach et al., 2012]: these are faultsthat occur due to biased or faulty sensor readings. Hardware malfunction(fault) may occur in the sensors’ data acquisition sub-system, leading toa series of incorrect sample readings (error) as, for instance, when zerodifference samples occur over a period of time. If this error is not properlydetected and handled, the sensor node data will be useless (failure);
3. Processing and storage faults: these may occur in WSN hardwareand/or software/firmware, affecting either the quality and consistency ofthe stored data or the operations that are performed on them. For in-stance, bit flips in memory or special registers can corrupt the stored data.Another example is an abnormal increase in the processor temperature,which may cause the drifting of the clock and desynchronize the sensornode from the network, originating several network faults, especially whenusing TDMA based mechanisms;
4. Communication faults [Sailhan et al., 2010]: due to the inherentlydistributed and dynamic nature of WSNs, communication is one of themajor sources of faults in sensor networks. Wireless communications areusually subject to considerable interference (e.g., ambient noise, channelnoise, multipath fading, RF interference, etc.) that affects the communic-ation between sensor nodes. Moreover, at networking level, sensor nodesmay also be subject to several types of faults. Routing faults can be causedby errors in routing algorithms and/or protocols, which can lead packets tobe caught in network loops (error) and never to arrive at their destination(failure). Additionally, sensor nodes may also suffer from faults related tomessage processing. For instance, when sink sensor nodes cannot dispatchmessages faster than they receive them, there may be local congestion inthe buffers between the various protocol layers and some messages mayhave to be dropped;
Table 3.11, below, provides examples and references to the mentioned types offaults, from the source system point of view.
— 49 —
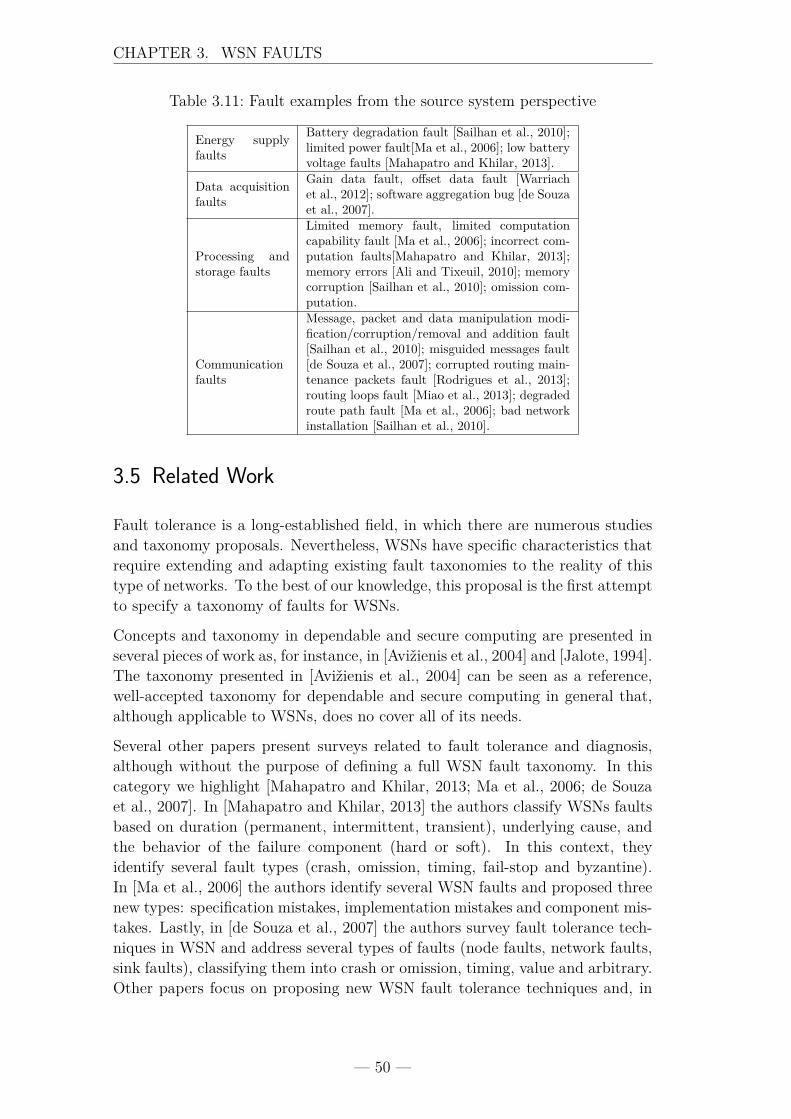
CHAPTER 3. WSN FAULTS
Table 3.11: Fault examples from the source system perspective
Energy supplyfaults
Battery degradation fault [Sailhan et al., 2010];limited power fault[Ma et al., 2006]; low batteryvoltage faults [Mahapatro and Khilar, 2013].
Data acquisitionfaults
Gain data fault, offset data fault [Warriachet al., 2012]; software aggregation bug [de Souzaet al., 2007].
Processing andstorage faults
Limited memory fault, limited computationcapability fault [Ma et al., 2006]; incorrect com-putation faults[Mahapatro and Khilar, 2013];memory errors [Ali and Tixeuil, 2010]; memorycorruption [Sailhan et al., 2010]; omission com-putation.
Communicationfaults
Message, packet and data manipulation modi-fication/corruption/removal and addition fault[Sailhan et al., 2010]; misguided messages fault[de Souza et al., 2007]; corrupted routing main-tenance packets fault [Rodrigues et al., 2013];routing loops fault [Miao et al., 2013]; degradedroute path fault [Ma et al., 2006]; bad networkinstallation [Sailhan et al., 2010].
3.5 Related Work
Fault tolerance is a long-established field, in which there are numerous studiesand taxonomy proposals. Nevertheless, WSNs have specific characteristics thatrequire extending and adapting existing fault taxonomies to the reality of thistype of networks. To the best of our knowledge, this proposal is the first attemptto specify a taxonomy of faults for WSNs.
Concepts and taxonomy in dependable and secure computing are presented inseveral pieces of work as, for instance, in [Avižienis et al., 2004] and [Jalote, 1994].The taxonomy presented in [Avižienis et al., 2004] can be seen as a reference,well-accepted taxonomy for dependable and secure computing in general that,although applicable to WSNs, does no cover all of its needs.
Several other papers present surveys related to fault tolerance and diagnosis,although without the purpose of defining a full WSN fault taxonomy. In thiscategory we highlight [Mahapatro and Khilar, 2013; Ma et al., 2006; de Souzaet al., 2007]. In [Mahapatro and Khilar, 2013] the authors classify WSNs faultsbased on duration (permanent, intermittent, transient), underlying cause, andthe behavior of the failure component (hard or soft). In this context, theyidentify several fault types (crash, omission, timing, fail-stop and byzantine).In [Ma et al., 2006] the authors identify several WSN faults and proposed threenew types: specification mistakes, implementation mistakes and component mis-takes. Lastly, in [de Souza et al., 2007] the authors survey fault tolerance tech-niques in WSN and address several types of faults (node faults, network faults,sink faults), classifying them into crash or omission, timing, value and arbitrary.Other papers focus on proposing new WSN fault tolerance techniques and, in
— 50 —
CHAPTER 3. WSN FAULTS
doing so, describe several fault types addressed by their proposed technique, thusconstituting an alternate source of fault classification. In this category we high-light the papers in [Warriach et al., 2012; Cinque et al., 2009; Ali and Tixeuil,2010; Sailhan et al., 2010; Koushanfar et al., 2003], as they provide relevant con-tributions to WSN faults classification. In [Warriach et al., 2012] the authorspresent two types of faults that affect the performance of WSN: system faultsand data faults. In [Cinque et al., 2009] the authors address a hardware faultinjection tool and, based on this tool, present several examples of fault types,such as transient and permanent faults, arbitrary faults, hardware faults anddata faults. In [Ali and Tixeuil, 2010] the authors describe faults using the timeperspective (transient, intermittent and permanent) and using a hybrid model.In [Sailhan et al., 2010] the authors also present several examples of WSN faultsand fault types, including active faults, dormant faults, data faults, exclusivefaults and elusive faults. Lastly, in [Koushanfar et al., 2003] the authors addressfaults that are directly related to sensors and sensing, such as offset faults, frozensensor faults, sensor aging faults and sensor function faults.
The analysis of the existing literature on WSN faults clearly shows that relatedwork focuses the attention in specific fault tolerance algorithms and methods,rather than on proposing a comprehensive WSN fault taxonomy. This, in ourview, leads to fault and diagnostic tools that are partial and/or too specific, withlimited applicability in real world scenarios, as highlighted in our previous work[Rodrigues et al., 2013]. Moreover, most studies address faults based on a singledimension, e.g., the cause/origin dimension, which does not provide enoughinformation for fault classification. By proposing a comprehensive WSN faulttaxonomy, the current proposal addresses the shortcomings of existing relatedwork.
3.6 Summary of the Chapter
A WSN fault taxonomy is needed to better understand and classify the varioustypes of faults that can occur in WSN systems and, thus, helping in the develop-ment of fault management tools. In this chapter a review of fault managementconcepts and techniques and their application to wireless sensor networks waspresented, as well as a proposal for a comprehensive, consistent WSN faulttaxonomy. This taxonomy can be used by WSN researchers, tool developers, in-tegrators and users. While presenting the taxonomy, examples of a large varietyof faults were given and references to existing literature were provided. In thescope of this thesis, this chapter contributed to a better identification of faultcharacteristics, which is of key importance to the following chapters.
— 51 —


Chapter 4The Proposed MonitoringArchitecture
”The important thing inscience is not so much toobtain new facts as todiscover new ways of thinkingabout them.”
(Sir William Bragg)
Contents4.1 Architecture Overview . . . . . . . . . . . . . . . . . 554.2 Sensor Node Monitoring Agent Overview . . . . . . 56
4.2.1 Hardware Metrics Collection . . . . . . . . . . . . 574.2.2 Firmware Metrics Collection . . . . . . . . . . . . 584.2.3 Transport of Collected Data . . . . . . . . . . . . . 59
4.3 Gateway Monitoring Agent . . . . . . . . . . . . . . . 634.4 Monitoring Logger . . . . . . . . . . . . . . . . . . . . 634.5 Management Agents and Management System . . . 644.6 Building a Proof-of-Concept . . . . . . . . . . . . . . 65
4.6.1 Test Scenario . . . . . . . . . . . . . . . . . . . . 664.6.2 Collected Metrics . . . . . . . . . . . . . . . . . . 684.6.3 Sensor Node Instrumentation and Monitoring Inform-
ation Processing . . . . . . . . . . . . . . . . . . . 694.6.4 Results . . . . . . . . . . . . . . . . . . . . . . . 70
4.7 Related Work . . . . . . . . . . . . . . . . . . . . . . . 734.8 Summary of the Chapter . . . . . . . . . . . . . . . . 75
— 53 —
CHAPTER 4. THE PROPOSED MONITORING ARCHITECTURE
C urrent WSN diagnostic tools have several drawbacks, as already poin-ted in section 2.4. In our opinion, some of these drawbacks are ham-pering the use of WSNs in industry because nowadays, to the best
of our knowledge, there aren’t multi-network, standard-compliant monitoringtools that support the IWSN technologies addressed in this proposal (ZigBee,ISA100.11a, WirelessHART, WIA-PA). In order to make this clear, in sections2.2, 2.3, and 2.4, a review of the state-of-the-art in what concerns the mainIndustrial IoT standards, network management, and diagnostic tools was made.As a result, some questions arose: How can multiple networks, possibly compris-ing equipment compliant with different standards, be monitored in an integratedway? How to add management functionality at gateway level? How can firm-ware and hardware be monitored without extra costs in hardware, firmware, andnetwork?
In what concerns network monitoring, three important aspects were identifiedin sections 2.2 and 2.4: the set of techniques used by current diagnostic toolsto monitor the network; the available metrics, provided by almost all industrialstandards, that can be collected and shared at gateway level; and the currentmanagement standards. In what concerns hardware and firmware monitoring,several approaches and technologies were also presented, as well as log techniquesthat can be used to convey hardware and firmware metrics inside the network.Thus, the review made in these sections identified several crucial points andresearch directions that led us to the proposal of this architecture and relatedproperties. Implementations of the proposed architecture will lead to diagnostictools that are totally compatible with industrial standards. In this respect, aproof-of-concept implementation will be presented in section 4.6.4, which alsodiscusses evaluation results.
It should be highlighted that the current architectural proposal goes well beyondidentifying components and respective abstract relations. More than defining therequirements, interactions, and roles to be performed by each architecture com-ponent, this section defines technologies, approaches, and protocols to be usedin realistic, practical industrial scenarios. For instance, this section addressesthe techniques and technologies for collecting hardware, firmware, and networkmetrics; defines the services used in each standard for conveying the monitor-ing information; and identifies the management protocols and technologies fordealing with the monitoring information.
The remainder of this chapter is organized as follows: initially, the proposedmonitoring architecture is presented, providing the reader with a global view ofits components and their main roles; subsequently, each component is describedin detail, by specifying their role and requirements. Moreover, the technologiesapplicable to each component will be identified.
— 54 —
CHAPTER 4. THE PROPOSED MONITORING ARCHITECTURE
4.1 Architecture Overview
With the emergence of several IWSN standards and the increase in the numberof IWSN deployments, it is crucial to define an architecture able to monitormultiple-network, standard-compliant technologies. The proposed architecture,presented in Figure 4.1, pretends to be flexible, scalable, energy-efficient, low-cost, and multi-standard solution in order to cover hardware, firmware, andnetwork monitoring. In order to ease the adoption by IWSN vendors, OEMproducers, and developers, the architecture was designed according to six mainguidelines: i) it should support the monitoring of multiple IWSNs; ii) it shouldsupport multiple IWSN standards; iii) it should not lead to a significant increasein energy expenditure; iv) the collection of hardware metrics should not increasethe cost of manufacturing the devices; v) the acquisition of metrics should nothave a significant impact on the main application size and delay, nor should itlead to a large traffic overhead; vi) the network metrics defined by each IWSNstandard should be used; and lastly, vii) the collection of sensor-node metrics(hardware/firmware) and network metrics should be independent. The pro-posed architecture has five base modules: 1) sensor node monitoring agent; 2)gateway monitoring agent; 3) monitoring logger; 4) management agents; 5) andmanagement system.
The sensor node monitoring agent is responsible for the collection of node mon-itoring data (hardware and firmware metrics), and the sending of these metricsto the network gateway. The latter will forward the metrics to the monitoringlogger, where they will be parsed and stored. The monitoring agent will use themost appropriate service in each industrial standard for forwarding the metrics.These metrics are encapsulated in a specific application format. During its op-eration (either when collecting information or when sending it), the monitoringagent should minimize the impact on the available resources.
Each industrial gateway has a pair of agents (one monitoring agent and onemanagement agent). The gateway monitoring agent is the component that col-lects the network metrics and the gateway state (globally called managementobjects) and stores them in a local database (the datastore). These are thenaccessed in a standardized way by management systems, through the servicesdelivered by the gateway management agent. In order to support the interoper-ability with management systems, the gateway also stores the representation ofthe management objects (i.e., IWSN standard metrics, and gateway state).
On the other hand, the handling of the collected sensor node monitoring datais carried out by a monitoring logger component, which parses the log messagesand stores them in its datastore. The monitoring logger is a software compon-ent with two main sub-components: log parser and management agent. Thelog parser is the component that receives the log messages from the gateway,parses them, and stores them in the local datastore. Like the gateway, the mon-itoring logger locally stores a representation of the management objects. This
— 55 —
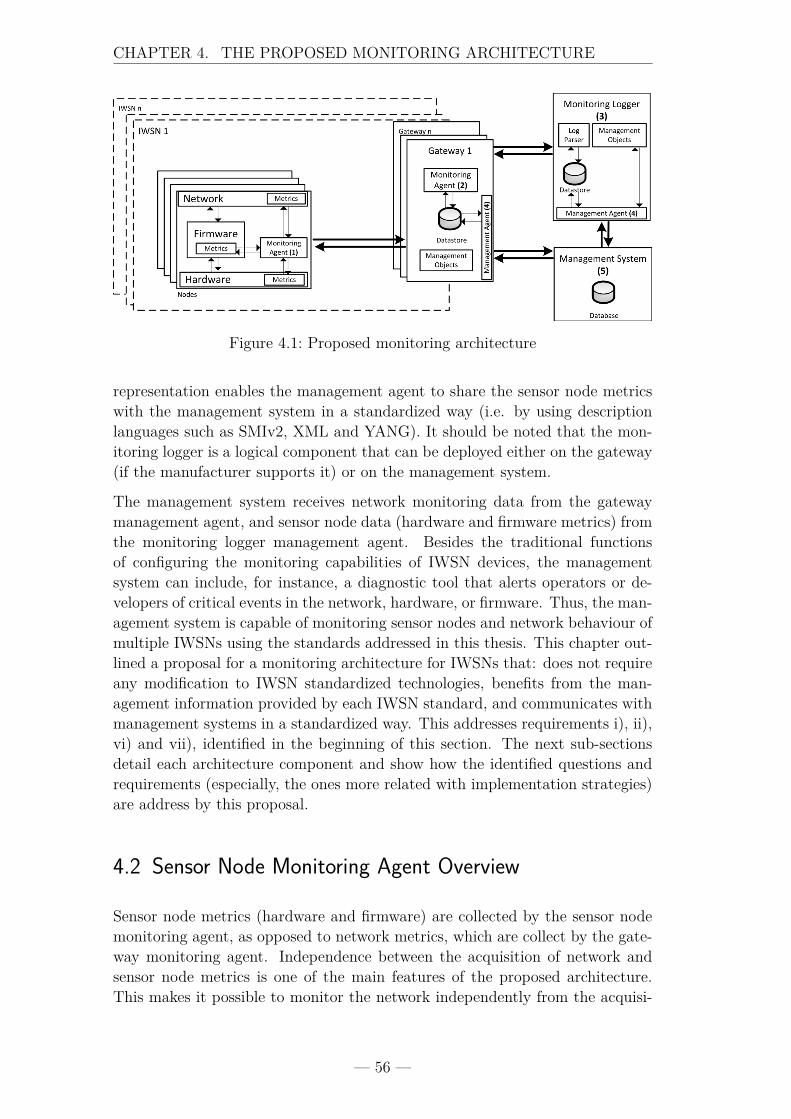
CHAPTER 4. THE PROPOSED MONITORING ARCHITECTURE
Figure 4.1: Proposed monitoring architecture
representation enables the management agent to share the sensor node metricswith the management system in a standardized way (i.e. by using descriptionlanguages such as SMIv2, XML and YANG). It should be noted that the mon-itoring logger is a logical component that can be deployed either on the gateway(if the manufacturer supports it) or on the management system.
The management system receives network monitoring data from the gatewaymanagement agent, and sensor node data (hardware and firmware metrics) fromthe monitoring logger management agent. Besides the traditional functionsof configuring the monitoring capabilities of IWSN devices, the managementsystem can include, for instance, a diagnostic tool that alerts operators or de-velopers of critical events in the network, hardware, or firmware. Thus, the man-agement system is capable of monitoring sensor nodes and network behaviour ofmultiple IWSNs using the standards addressed in this thesis. This chapter out-lined a proposal for a monitoring architecture for IWSNs that: does not requireany modification to IWSN standardized technologies, benefits from the man-agement information provided by each IWSN standard, and communicates withmanagement systems in a standardized way. This addresses requirements i), ii),vi) and vii), identified in the beginning of this section. The next sub-sectionsdetail each architecture component and show how the identified questions andrequirements (especially, the ones more related with implementation strategies)are address by this proposal.
4.2 Sensor Node Monitoring Agent Overview
Sensor node metrics (hardware and firmware) are collected by the sensor nodemonitoring agent, as opposed to network metrics, which are collect by the gate-way monitoring agent. Independence between the acquisition of network andsensor node metrics is one of the main features of the proposed architecture.This makes it possible to monitor the network independently from the acquisi-
— 56 —
CHAPTER 4. THE PROPOSED MONITORING ARCHITECTURE
tion of sensor node metrics. This separation also allows having closed modulesin IWSN gateways (provided by IWSN vendors) and a more open monitoringlogger module (that can be extended by developers if needed).
This section presents and discusses the main requirements for hardware andfirmware metrics acquisition in the sensor node monitoring agent, and providesguidelines as to the technologies that can be used in this scope. Additionally,the approaches used in the transport of the logged data over the IWSN will bealso presented.
4.2.1 Hardware Metrics Collection
In order to persuade IWSN vendors and OEM producers to incorporate real-timemonitoring in sensor nodes’ hardware, the monitoring techniques used by thesensor node monitoring agent should meet the following requirements: the addedhardware components should not significantly increase the cost of sensor nodemanufacturing; the board space required by monitoring components should beminimal; the energy consumed by the hardware monitoring components shouldhave a negligible impact on the battery life; processing and memory overheadshould be minimum; and lastly, access to the hardware metrics should be seam-less across all hardware platforms.
Regarding the latter requirement, considering the techniques presented in section2.4, those who enable direct access to microcontroller metrics (by using internalhardware registers and hardware counters) have a higher level of portabilitywhen compared to external physical tools. From the sensor node monitoringagent perspective, seamless access to hardware metrics, regardless the underly-ing technology, is extremely important. By using different Board Support Pack-ages (BSPs) developed by hardware manufactures (e.g., Drivelib [Instruments,2019]), or by using interfaces available in the sensor nodes operating systems(e.g., Contiki, RIOT), it is possible for sensor node monitoring agents to gatherhardware metrics directly from each hardware platform. Hardware monitoringtechniques that collect vast quantities of data to infer the hardware conditionsare not appropriate for IWSN application scenarios.
The work performed in [Scherer and Horváth, 2012; Scherer and Horvath, 2014;Dutta et al., 2008; Rodrigues et al., 2014] presents a set of metrics that canbe collected with little cost and extra value to assess the health of hardwarecomponents. Specifically, in [Dutta et al., 2008] the authors present a low-costtechnique that, using an extra wire connected to an Microcontroller Unit (MCU)hardware counter, enables the measurement of sensor nodes energy consumption.This technique was used in [Rodrigues et al., 2014], in an anomaly detectionsystem, with good results, and proved its low footprint in terms of memory, cost,and processing load. Using the same MCU technology (the MSP430 family),in [Rodrigues et al., 2014] the authors present a technique that enables dataacquisition on microcontroller cycles and execution time. In 16-bit architectures,
— 57 —
CHAPTER 4. THE PROPOSED MONITORING ARCHITECTURE
the MSP430 family is one of the most used microcontrollers in WSN hardwaredue to its low power consumption. On the other hand, in 32-bit architectures,ARM microcontrollers are the most used ones. For these platforms, the workpresented in [Scherer and Horváth, 2012; Scherer and Horvath, 2014] describesa set of metrics that can be collected from the CoreSight technology available inthe ARM architecture. The Data Watch Point (DWT) block can provide severalmeasurement statistics, such as interrupt overhead, and sleep cycles. Anotherblock, the Embedded Trace Macrocell (ETM), can provide statistics concerningthe number of executed or skipped instructions.
Summing up, the monitoring of hardware condition can be performed at hard-ware level in compliance with the defined requirements. Furthermore, the pro-posed methods allow data acquisition for different types of microcontroller ar-chitectures and technologies. A set of techniques already addressed and provenby the scientific community were presented, and are recommended for use in theproposed architecture
4.2.2 Firmware Metrics Collection
Development of firmware for sensor nodes can be made using one of two typesof approaches: the “bare metal” approach or the OS-based approach. When the“bare metal” approach is used, the application is usually developed in C or C++,and access to the hardware is made by the BSP supplied by the manufacturer,resulting in a very hardware-dependent development. This type of developmentis less portable than OS-based development, in which hardware operations aremanaged by the OS. Developers only have to call OS generic functions that will,in turn, be translated into hardware-specific calls.
Firmware monitoring techniques used by the sensor node monitoring agentshould support the monitoring of applications developed either using bare metalor OS-based approaches. Thus, as main requirements, firmware monitoringtechniques should: be application independent; support, at least, C and C++(according to [Hahm et al., 2016] most OSs use these languages); be OS-independent; when enabled, have a negligible impact on the execution of themain application (i.e. a minimal increase in the microcontroller’s load); min-imize the use of RAM, program memory, and external memory; be easy tointegrate into the developers work flow; and not depend on physical access tothe hardware. Similar to hardware monitoring techniques, firmware techniquesthat collect vast quantities of data and need physical access are not appropriateto this architecture.
From the set of techniques used in the tools presented in section 2.4, instru-mentation techniques are the only ones that fulfil the mentioned requirements.Tools that use instrumentation techniques with scripting languages allow de-velopers to easily integrate them in their daily workflow and, at the same time,provide code tracing, debugging, profiling, and performance counters. Support-
— 58 —
CHAPTER 4. THE PROPOSED MONITORING ARCHITECTURE
ing instrumentation in C and C++ languages allows the use of instrumentationtechniques in almost all OSs. In the proposed architecture, the sensor node mon-itoring tool collects firmware metrics by using instrumentation techniques.
In [Dong et al., 2014; Schuster et al., 2014; Dong et al., 2013; Shea et al., 2009]the authors present some technologies, techniques, and metrics that use codeinstrumentation. For instance, in [Shea et al., 2009] the authors use the C Inter-mediate Language (CIL) to instrument the C source code. The instrumentationcode is inserted by a parser before building the binary file. Using a similarapproach, in [Schuster et al., 2014] the authors use the PYCParser tool to in-strument the code to support logging. On the other hand, in [Dong et al., 2014;Bhadriraju et al., 2012] the authors use binary instrumentation to inject themonitoring code using the trampoline technique. Differently from the other in-strumentation techniques, in binary instrumentation, developers do not need tohave access to the source code to change the program flow. Using trampolinetechniques, the displaced instructions are executed and then another jump ismade back to the actual code. This method allows the use of instrumentationin running code. These techniques allow the collection of several firmware stateand identification metrics like: function header, control flow (if, else, switch),function footer, function calls, variables values, and number of variable assign-ments.
In conclusion, from all the techniques presented in section 2.4, solutions thatneed physical access to hardware interfaces (e.g. JTAG) to collect firmwaremonitoring metrics cannot be used in real industrial deployments. For thisreason, the sensor node monitoring agent proposed in the current architecturecollects firmware metrics using techniques deployed in the firmware by codeinstrumentation.
4.2.3 Transport of Collected Data
IWSN standards were engineered to optimize four important sensor node re-sources: node battery, reliability, latency and network bandwidth. In this typeof networks, sensor nodes should operate during several years, and network re-sources should be optimized for conveying the collected data with a variety ofQoS requirements. Typically, the transport of sensor node monitoring informa-tion has lower priority than the main application traffic because the collection ofthis information cannot compromise the sensor node main application (nor itsoperating lifetime). Thus, the transport of sensor node monitoring data madeby the sensor node monitoring agent should fulfil the following requirements: themonitoring information should be sent using appropriate network services andwithout compromising the main sensor application; the monitoring informationstorage should have a minor impact on the sensor node resources (for instanceusing a First In First Out (FIFO) buffer in RAM, and dropping data when thebuffer is full); when available, data should have a network timestamp to make
— 59 —
CHAPTER 4. THE PROPOSED MONITORING ARCHITECTURE
it possible to correlate several events in the network; when security is enabledfor the main application, the monitoring data should also be secured; when logpackets exceed the maximum payload size and no fragmentation and reassemblymechanisms are available in the underlying layers, the sensor node monitoringagent should support fragmentation and reassembly mechanisms; lastly, the im-pact of such operations on battery life should be minimal.
Regarding the timestamp requirement, from the set of the four analysed stand-ards ZigBee is the only one that does not define a time standard in its specifica-tion. On the other hand, WirelessHART, ISA100.11a, and WIA-PA define theirown time standard as Universal Time Coordinated (UTC), International AtomicTime (TAI), and UTC, respectively, and provide services to synchronize sensornodes [Wang and Jiang, 2016]. Consequently, in ZigBee, sensor node monitoringdata cannot be correlated without implementing additional mechanisms in thesensor nodes that enable to synchronize the network time between nodes.
As already mentioned, the Maximum Transmission Unit (MTU) in IEEE802.15.4is 127 bytes. Thus, all of the four standards use fragmentation and reassemblymechanisms to overcome this limitation. WIA-PA and ISA100.11a implementthis mechanism at the network layer, unlike ZigBee that implements it at theapplication support sub-layer. WirelessHART also supports the transport oflarge packets but, in this case, sensor nodes need to allocate a special typeof transport service - the block data transfer. This service only allows theexistence of a unique block transfer service for the whole network [Wang andJiang, 2016; Alliance, 2015]. Thus, in WirelessHART, the transport of blocks ofdata that exceed the maximum MTU size requires fragmentation and reassemblyto be implemented at application level, if the block data transfer service is notused.
Another important aspect is the security of sensor node monitoring data. Allof the industrial standards within the scope of this architecture offer end-to-endencryption. In the cases of ZigBee, WirelessHART, and ISA100.11a, securityis managed using a centralized approach. On the other hand, WIA-PA usesa distributed approach, where the security manager together with the routingdevices configure the security measures and forward the keys to field devices.All the standards under consideration provide encryption using symmetric keys,although ISA100.11a can also use asymmetric encryption in device joining pro-cesses. Last but not least, the highest level of IEEE 802.15.4 security policyis AES-128-CCM. Consequently, most IEEE802.15.4 radio chips support AES-128-CCM operations at hardware level [Wang and Jiang, 2016].
In order to minimize the impact on the main application traffic, the approach totransporting sensor nodes monitoring data should be carefully selected for eachstandard, as presented below.
In WirelessHART, data transport can be done using one out of four types ofservices: block transfer service, maintenance service, periodic service, and eventservice. The block transfer service can only be used by one sensor node at a
— 60 —
CHAPTER 4. THE PROPOSED MONITORING ARCHITECTURE
time. Thus, this service is not appropriate to transport sensor node monitoringdata. The maintenance service provides the network with a minimal bandwidthfor basic sensor nodes control and management operations. Because this is alow bandwidth service, it cannot handle the transport of sensor node monitor-ing data. The event service is used by applications to send data packets duringunexpected events, such as alarms and warnings (when this service is reques-ted, the radio needs to define the latency associated to the service)[Technology,2017]. Finally, the publish service is used to periodically send data, like sensorreadings (when this service is requested, the radio needs to define the interval forsending the data)[Zand et al., 2012b]. Taking into consideration the character-istics of each service, we conclude that the most appropriate service to transportthe data is the publish service, since the event service is a service used by ap-plications with latency constraints, and the monitoring data does not have suchrequirement.
ZigBee does not specify services for data transport, leaving this to the applic-ation layer. According to the ZigBee specification [Alliance, 2015], in order toguarantee compatibility among different manufactures, ZigBee devices need toimplement application profiles (also called endpoints). An endpoint is a ZigBeeapplication for a specific domain with a set of clusters (or application messages)that can be mandatory or not. In turn, clusters are composed by attributesthat represent the exchanged data. ZigBee sensor nodes that implement thesame ZigBee profile (endpoint) are able to communicate with each other. In thecontext of this architecture, the sensor node monitoring agent is an endpointand a set of cluster messages that can be sent to the ZigBee coordinator (thatmust also support the same endpoint).
Compared to the other standards, ISA100.11a is by far the most complexand customizable standard. Instead of using the term services, used in Wire-lessHART, in ISA100.11a contracts establish the resources allocated by the sys-tem manager to devices. Before a device can send data to another device, acontract needs to be created. Contracts are identified by an ID, unique withinthe scope of the device (but not necessarily so in the scope of the network), andare unidirectional. The system manager is the device that has the authorityto assign, modify and revoke contracts. Like WirelessHART services, there areseveral types of contracts and attributes that can be used for establishing servicelevels. Firstly, contracts may be of two types: periodic, that schedule networkresources for the periodic sending of data; or, otherwise, non-periodic. Secondly,contracts can also be negotiable. The system manager may change or revokethe contract to make resources available to other high priority contracts. Lastly,contracts can have several levels of priorities: best effort queued, used in client-server communications; real time sequential, used in voice and video applica-tions; real time buffer, used for periodic communications; and network control,used for managing network devices by the system manager. Message retransmis-sion can, additionally, be enabled or disabled inside the contract. Thus, sensornode monitoring agents that run inside an ISA100.11a network should request
— 61 —
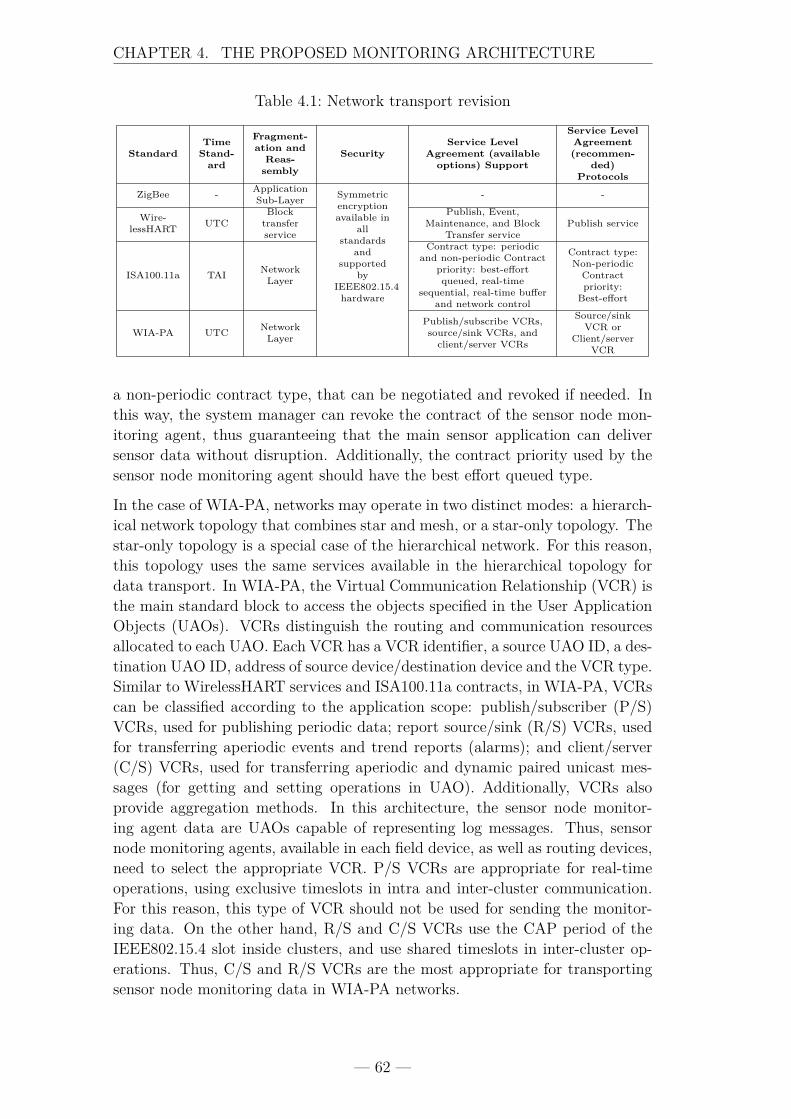
CHAPTER 4. THE PROPOSED MONITORING ARCHITECTURE
Table 4.1: Network transport revision
StandardTime
Stand-ard
Fragment-ation and
Reas-sembly
SecurityService Level
Agreement (availableoptions) Support
Service LevelAgreement(recommen-
ded)Protocols
ZigBee - ApplicationSub-Layer Symmetric
encryptionavailable in
allstandards
andsupported
byIEEE802.15.4hardware
- -
Wire-lessHART UTC
Blocktransferservice
Publish, Event,Maintenance, and Block
Transfer servicePublish service
ISA100.11a TAI NetworkLayer
Contract type: periodicand non-periodic Contract
priority: best-effortqueued, real-time
sequential, real-time bufferand network control
Contract type:Non-periodicContractpriority:
Best-effort
WIA-PA UTC NetworkLayer
Publish/subscribe VCRs,source/sink VCRs, andclient/server VCRs
Source/sinkVCR or
Client/serverVCR
a non-periodic contract type, that can be negotiated and revoked if needed. Inthis way, the system manager can revoke the contract of the sensor node mon-itoring agent, thus guaranteeing that the main sensor application can deliversensor data without disruption. Additionally, the contract priority used by thesensor node monitoring agent should have the best effort queued type.
In the case of WIA-PA, networks may operate in two distinct modes: a hierarch-ical network topology that combines star and mesh, or a star-only topology. Thestar-only topology is a special case of the hierarchical network. For this reason,this topology uses the same services available in the hierarchical topology fordata transport. In WIA-PA, the Virtual Communication Relationship (VCR) isthe main standard block to access the objects specified in the User ApplicationObjects (UAOs). VCRs distinguish the routing and communication resourcesallocated to each UAO. Each VCR has a VCR identifier, a source UAO ID, a des-tination UAO ID, address of source device/destination device and the VCR type.Similar to WirelessHART services and ISA100.11a contracts, in WIA-PA, VCRscan be classified according to the application scope: publish/subscriber (P/S)VCRs, used for publishing periodic data; report source/sink (R/S) VCRs, usedfor transferring aperiodic events and trend reports (alarms); and client/server(C/S) VCRs, used for transferring aperiodic and dynamic paired unicast mes-sages (for getting and setting operations in UAO). Additionally, VCRs alsoprovide aggregation methods. In this architecture, the sensor node monitor-ing agent data are UAOs capable of representing log messages. Thus, sensornode monitoring agents, available in each field device, as well as routing devices,need to select the appropriate VCR. P/S VCRs are appropriate for real-timeoperations, using exclusive timeslots in intra and inter-cluster communication.For this reason, this type of VCR should not be used for sending the monitor-ing data. On the other hand, R/S and C/S VCRs use the CAP period of theIEEE802.15.4 slot inside clusters, and use shared timeslots in inter-cluster op-erations. Thus, C/S and R/S VCRs are the most appropriate for transportingsensor node monitoring data in WIA-PA networks.
— 62 —
CHAPTER 4. THE PROPOSED MONITORING ARCHITECTURE
4.3 Gateway Monitoring Agent
The gateway monitoring agent is the component in charge of representing man-agement objects data in a standardised way, and of sending network monitoringdata to the management systems. This agent also deals with data from multiplestandards. The gateway monitoring agent is independent from the sensor nodemonitoring agent, thus allowing the separation of sensor node data collectionfrom network monitoring data coleection. In this context, gateway monitoringagents must meet the follow requirements: network monitoring should not sig-nificantly increase the cost of equipment nor the cost of installation; collectingnetwork metrics should add low overhead to the gateway; monitoring should beenergy-efficient; the monitoring solution should be easy to install and should beextensible; and, lastly, gateway monitoring agents should support widely usedindustrial standards, namely the ones addressed in this thesis.
Considering the three types of techniques identified in section 2.4.1 (active, pass-ive, and hybrid), active type techniques are the only ones that are easy to installand do not rely on extra hardware to perform monitoring tasks. However, thistype of techniques usually consumes sensor node resources, as pointed in section2.4. On the other hand, in section 2.2.3, the revision made to the metrics sharedbetween nodes showed us that the standards under consideration can supportthe sharing of critical information related to network and sensor node state,which can be used for resource allocation and routing tasks. Thus, by usingthese metrics, active tools will be capable of fulfilling the identified require-ments without spending significant sensor node resources. Furthermore, somecurrent industrial solutions available on the market already provide these met-rics at the gateway, using proprietary libraries. The only disadvantage of activetype techniques is the partial coverage in ZigBee networks because some metricscannot be gathered by the coordinator. This arises from the fact that, in ZigBee,route computation is done in a distributed fashion for some topologies.
4.4 Monitoring Logger
As shown in table 2.2, the standards under consideration use different applicationapproaches. Specifically, ZigBee, ISA100.11a, and WIA-PA use object-orientedrepresentation, whereas WirelessHART uses a command-oriented representa-tion. Sensor node monitoring data needs to comply with the representationdefined in each standard, which leads to different representations for the samesensor node data. To solve this issue, the monitoring logger is the componentthat parses distinct standard representations into the same representation.
The monitoring logger should fulfil the following requirements: support the con-nection to the different standards “gateways”; support the parsing of the distinctapplication protocols using a sub-component (the log parser); support the rep-
— 63 —
CHAPTER 4. THE PROPOSED MONITORING ARCHITECTURE
resentation of sensor node monitoring data in the languages supported by themanagement protocols; allow access to the monitoring data by managementsystems, using the management agent; and, lastly, store the sensor node monit-oring data in a datastore. As a software component, the monitoring logger canbe installed as an extra software module in industrial gateways or in anothercompatible equipment.
4.5 Management Agents and Management System
Management systems are one of the building blocks of current IP-based net-works. By monitoring the networks and their equipment, operators and manu-factures can maximize the network uptime, improving the delivered quality ofservice. When applied to IWSNs, network and sensor node monitoring can alsoprovide similar benefits. It is unthinkable to have a large IWSN that uses oneor more standards without a central management system to perform predictivemaintenance of sensor nodes. As presented in the previous sections, hardware,firmware and network monitoring data can be delivered by the sensor node mon-itoring agent and by the gateway monitoring agent, respectively. However, a keyto the puzzle of this architecture is missing. To improve interoperability betweenthese agents, different manufactures, and diagnostic tools, appropriate manage-ment protocols and syntax languages are needed. In this context, managementagents should fulfill the following requirements: agents should allow the repres-entation of sensor node and network data as managed objects; when needed,managed objects should be able to be extended, supporting additional monit-oring metrics; management agents should be able to share management objectinformation with management systems, updating the model used in managementsystems when needed; the management protocol should be able to support se-curity mechanisms; management agents should run in IWSN gateways, for whichthe minimum hardware requirements should be set to IETF Class 2 [Bormannet al., 2014] (e.g., gateways that can support, for instance, a simplified versionof Linux-based operating system); management protocols should support noti-fication messages (query-based architectures can be heavy for IWSN gatewaysand are not scalable); lastly, the management agent must operate in IP networks(IWSN gateways must be able to be connected to an IP network).
When network management technologies were previously analyzed in section2.3, some protocols, syntaxes, and key features were identified. Current net-work management protocols can be divided into protocols designed for resource-constrained devices, and protocols for traditional networks. While traditionalnetwork management protocols are more mature and widespread, resource-constrained management protocols use more advanced, simpler, and moderntechnologies for representing management objects (e.g., YANG), and for datatransport (e.g., CoAP, HTTP). Here, we highlight that protocols designed forresource-constrained devices can also be used in more powerful devices, like
— 64 —
CHAPTER 4. THE PROPOSED MONITORING ARCHITECTURE
IWSN gateways. However, there are other aspects that need to be addressedregarding the requirements defined in this section. From the set of syntaxes forrepresenting management models, XML and YANG are the most flexible andmost simple languages. The learning curve to describe management objects us-ing SMIv2 is longer than using languages like YANG and XML. Thus, SMIv2is not recommended in the scope of this architecture. Consequently, SNMPis also not recommended for this architecture. Moreover, when working withdata models, one important requirement is the sharing of the model with man-agement systems. From the remaining protocols proposed in the scope of thisarchitecture, NETCONF [Enns et al., 2011], COMI[der Stok et al., 2017], REST-CONF[Bierman et al., 2017], and LwM2M[OMA, 2017] allow the discovery ofthe models and of the resources available in each management node, by usingdiscovery commands or specific URIs that enable to retrieve the used models.Additionally, other important requirement is the use of notification messages.By creating subscriptions to different management topics, diagnostic tools willbe able to have the monitoring information in real time and without extra effort,contrary to what happens in query-based protocols that need to actively lookfor the monitoring information. Considering the set of analysed managementprotocols, the only one that does not support notifications is the NETCONFprotocol. Before a client and a server can exchange management messages,NETCONF has to establish a permanent connection using SSH and TCP. Thus,it is impossible to notify management clients in the case of a connection loss.RESTCONF, LWM2M, and COMI have support for notification messages.
Lastly, one of the main characteristics of protocols for resource-constraineddevices is the capability to use the protocols in the node itself (something theywere developed for). However, in IWSNs, for which application protocols arestatically specified by the standard, it is not possible to use other protocols insensor nodes, such as the management protocols we have been addressing. Theonly option is to represent managed objects in the gateway of each standard.The authors of [Chang and Lin, 2016] present a solution to monitor and man-age legacy systems with LWM2M protocol, by using several LWM2M clients torepresent each legacy device behind the gateway. Additionally, as presented in[Raposo, 2017], using the YANG language it is possible to represent the net-work metrics shared with a gateway in a WirelessHART network. In this way,COMI and RESTCONF can also be used in the gateway to represent legacydevices.
4.6 Building a Proof-of-Concept
In the previous section, the monitoring architecture was presented as well as itscomponents, requirements, and available solutions for each component in lightof the existing standards and protocols. Being a general monitoring architecturethat integrates several network standards, hardware technologies, and firmware
— 65 —
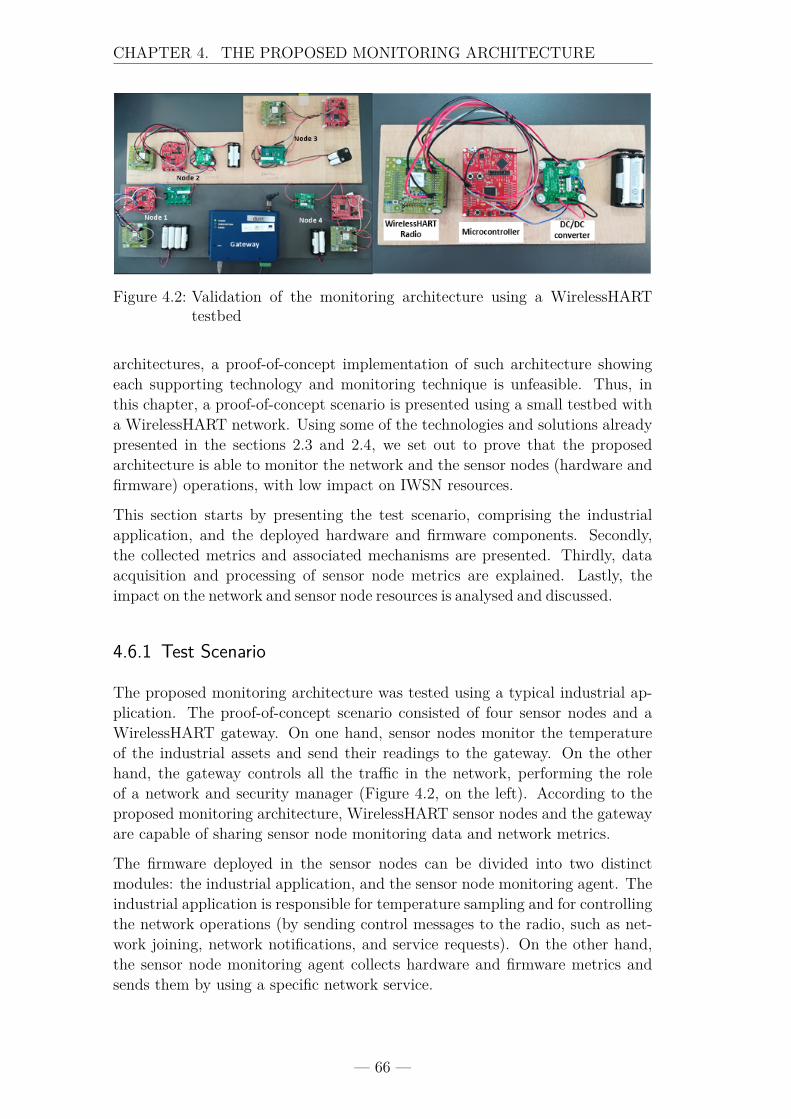
CHAPTER 4. THE PROPOSED MONITORING ARCHITECTURE
Figure 4.2: Validation of the monitoring architecture using a WirelessHARTtestbed
architectures, a proof-of-concept implementation of such architecture showingeach supporting technology and monitoring technique is unfeasible. Thus, inthis chapter, a proof-of-concept scenario is presented using a small testbed witha WirelessHART network. Using some of the technologies and solutions alreadypresented in the sections 2.3 and 2.4, we set out to prove that the proposedarchitecture is able to monitor the network and the sensor nodes (hardware andfirmware) operations, with low impact on IWSN resources.
This section starts by presenting the test scenario, comprising the industrialapplication, and the deployed hardware and firmware components. Secondly,the collected metrics and associated mechanisms are presented. Thirdly, dataacquisition and processing of sensor node metrics are explained. Lastly, theimpact on the network and sensor node resources is analysed and discussed.
4.6.1 Test Scenario
The proposed monitoring architecture was tested using a typical industrial ap-plication. The proof-of-concept scenario consisted of four sensor nodes and aWirelessHART gateway. On one hand, sensor nodes monitor the temperatureof the industrial assets and send their readings to the gateway. On the otherhand, the gateway controls all the traffic in the network, performing the roleof a network and security manager (Figure 4.2, on the left). According to theproposed monitoring architecture, WirelessHART sensor nodes and the gatewayare capable of sharing sensor node monitoring data and network metrics.
The firmware deployed in the sensor nodes can be divided into two distinctmodules: the industrial application, and the sensor node monitoring agent. Theindustrial application is responsible for temperature sampling and for controllingthe network operations (by sending control messages to the radio, such as net-work joining, network notifications, and service requests). On the other hand,the sensor node monitoring agent collects hardware and firmware metrics andsends them by using a specific network service.
— 66 —
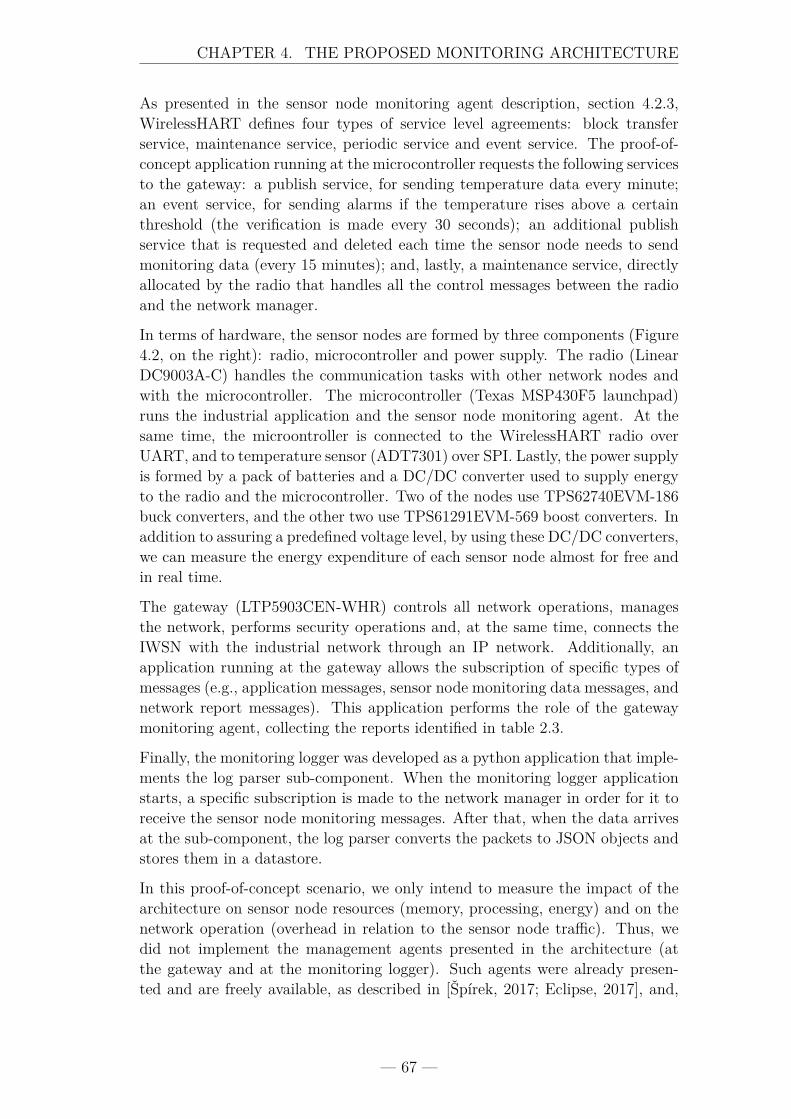
CHAPTER 4. THE PROPOSED MONITORING ARCHITECTURE
As presented in the sensor node monitoring agent description, section 4.2.3,WirelessHART defines four types of service level agreements: block transferservice, maintenance service, periodic service and event service. The proof-of-concept application running at the microcontroller requests the following servicesto the gateway: a publish service, for sending temperature data every minute;an event service, for sending alarms if the temperature rises above a certainthreshold (the verification is made every 30 seconds); an additional publishservice that is requested and deleted each time the sensor node needs to sendmonitoring data (every 15 minutes); and, lastly, a maintenance service, directlyallocated by the radio that handles all the control messages between the radioand the network manager.
In terms of hardware, the sensor nodes are formed by three components (Figure4.2, on the right): radio, microcontroller and power supply. The radio (LinearDC9003A-C) handles the communication tasks with other network nodes andwith the microcontroller. The microcontroller (Texas MSP430F5 launchpad)runs the industrial application and the sensor node monitoring agent. At thesame time, the microontroller is connected to the WirelessHART radio overUART, and to temperature sensor (ADT7301) over SPI. Lastly, the power supplyis formed by a pack of batteries and a DC/DC converter used to supply energyto the radio and the microcontroller. Two of the nodes use TPS62740EVM-186buck converters, and the other two use TPS61291EVM-569 boost converters. Inaddition to assuring a predefined voltage level, by using these DC/DC converters,we can measure the energy expenditure of each sensor node almost for free andin real time.
The gateway (LTP5903CEN-WHR) controls all network operations, managesthe network, performs security operations and, at the same time, connects theIWSN with the industrial network through an IP network. Additionally, anapplication running at the gateway allows the subscription of specific types ofmessages (e.g., application messages, sensor node monitoring data messages, andnetwork report messages). This application performs the role of the gatewaymonitoring agent, collecting the reports identified in table 2.3.
Finally, the monitoring logger was developed as a python application that imple-ments the log parser sub-component. When the monitoring logger applicationstarts, a specific subscription is made to the network manager in order for it toreceive the sensor node monitoring messages. After that, when the data arrivesat the sub-component, the log parser converts the packets to JSON objects andstores them in a datastore.
In this proof-of-concept scenario, we only intend to measure the impact of thearchitecture on sensor node resources (memory, processing, energy) and on thenetwork operation (overhead in relation to the sensor node traffic). Thus, wedid not implement the management agents presented in the architecture (atthe gateway and at the monitoring logger). Such agents were already presen-ted and are freely available, as described in [Špírek, 2017; Eclipse, 2017], and,
— 67 —

CHAPTER 4. THE PROPOSED MONITORING ARCHITECTURE
thus, their implementation in this proof-of-concept scenario would not providerelevant added-value. However, we should emphasize that the WirelessHARTnetwork metrics management models that would be required for such imple-mentation were already created by us and are available for download in [Raposo,2017].
4.6.2 Collected Metrics
The architecture proposed in this thesis allows the collection of hardware, firm-ware, and network metrics using agents deployed in sensor nodes and networkgateways. In this chapter, some of the requirements were presented, as wellas some monitoring techniques already explored by other researchers. Thus, toprove that this architecture has low impact on sensor nodes resources, our testscenario implements some of these techniques, enabling the collection of met-rics from the hardware of the Texas MSP430F5 launchpad, from the industrialapplication, and from the WirelessHART network.
Collecting hardware metrics was done using techniques that directly access theregisters and counters of the Texas MSP430F5 launchpad. As this is a 16-bitmicrocontroller, the implemented techniques were the ones presented in [Duttaet al., 2008; Rodrigues et al., 2014], comprising a processing metric, an energymetric, and a time metric. The processing metric gives the number of instruc-tions executed by the microcontroller. Using switching regulators in combinationwith the technique presented in [Dutta et al., 2008], it was possible to have anenergy metric that provides the energy spent by sensor nodes. Lastly, the timemetric gives a time measurement in milliseconds.
Specifically, the metrics were implemented in the following way. Firstly, thereare two possible approaches to implement the processing metric in the TexasMSP430F5529 launchpad: 1) by configuring pin P7.7 to output the MCLK clockand connecting it to a hardware counter; or 2) by using the same clock sourceand same frequency of the MCLK clock in SMCLK, and configuring a counter tocount it. As the Texas MSP430F5 launchpad does not give us access to pin P7.7,the second approach was used, and TimerA2 was configured to be sourced by theSMCLK. Secondly, the energy metric was obtained by connecting the output ofthe inductor used in the switching regulator (used as a DC/DC converter, eitherthe TPS62740EVM-186 or the TPS61291EVM-569) to the TimerA1 clock signalinput (P1.6) of the microcontroller. Lastly, the time metric was obtained usingthe TimerB, configured to be sourced by the Auxiliary Clock (ACLK) (beingsourced by ACLK allows to count time even during sleep periods such as LowPower Mode 3 (LPM-3)).
Apart from hardware metrics, the architecture also enables firmware monitoringby using instrumentation techniques applied to the main application code. Inorder to prove that it is possible to collect some metrics with low impact onthe sensor node resources, manual instrumentation of the code was performed,
— 68 —
CHAPTER 4. THE PROPOSED MONITORING ARCHITECTURE
Figure 4.3: On the left, (a) the application architecture and the sensor nodemonitoring agent acquiring the state information. On the right, (b)the request of the WirelessHART publish service
with the objective of obtaining a trace of function calls. Specifically, the func-tion calls trace was obtained by assigning a specific ID to each function in thecode. Additionally, the instrumentation code enabled each executed function tocollect the function identifier, the function duration, the spent energy, and theprocessing load (by using the metrics collected from the hardware). The detailsof the data processing and transport over the network will be presented in thefollowing sub-section. Lastly, after collecting the metrics concerning the sensornode state (hardware and firmware), the gateway monitoring agent collects thereports identified in table 2.3, namely device health report, neighbour health listreport, neighbour signal levels, and network alarms.
4.6.3 Sensor Node Instrumentation and Monitoring Information Pro-cessing
The proof-of-concept implementation presented here aims at demonstrating theapplicability of the proposed architecture to several software development scen-arios. Specifically, the architecture should support OS-based applications aswell as “bare metal” applications, as in the current case. With this in mind, theapplication was developed based on a function-queue-scheduling architecture.Similar to what happens in OS-based approaches, the functions are added toa queue of function pointers, and called when appropriate. The scheduler isresponsible for getting the next function in the queue, which will then be ex-ecuted. On completion, the microcontroller is put in low power mode (LPM) tosave energy.
The main topic of this section is, nevertheless, the sensor node monitoring agentand its interactions with the BSP, the main application, and the network (figure4.3). The sensor node monitoring agent is a library developed in C/C++ thatcollects the sensor node state data, stores it, and triggers a periodic event tosend the monitoring data over the network. By manually inserting a simple callto the sensor node monitoring agent at the beginning of each function to be
— 69 —
CHAPTER 4. THE PROPOSED MONITORING ARCHITECTURE
monitored (see figure 4.3(a)(1)), it is possible to record the state of the sensornode’s firmware and hardware. The monitoring information is then stored in aring buffer (figure 4.3(a)(2)), until it is sent over the network. In addition, thehardware state data is collected directly by the sensor node monitoring agentlibrary from the BSP (figure 4.3(a)(3)).
Last but not least, as illustrated in the figure 4.3 (b), when there is sufficientdata to fill an IEEE 802.15.4 data packet payload, the sensor node monitoringagent requests a publish service to send the data available in the ring buffer(4). If the network has enough resources to send the data at the requested rate,an authorization is received (5), and the sending process starts (6-7). In casethe network does not have enough resources, the microcontroller will receive aservice denial, and the sending of the log will be postponed. When no moredata is available in the ring buffer, the sensor node monitoring agent requeststhe deletion of the service in order to free the network resources (8).
4.6.4 Results
In order to show that the proposed architecture can be implemented in industrialscenarios with efficiency and low impact on resource consumption, some exper-iments were conducted, whose results are described in this sub-section.
The performed tests can be divided in two groups: tests that measure the im-pact on the sensor node resources, and tests that measure the network operationoverhead introduced by the sensor node monitoring agent. It should be notedthat, as presented in section 2.2.3, the industrial standards addressed in this pa-per already share network metrics to perform routing and other network relatedoperations and, thus, these metrics do not add extra overhead to the networkoperation. Hence, the only network overhead is the one caused by sensor nodemonitoring agents.
For the first group of tests, the used hardware and software were, respectively,the Texas Instrument MSP-FET (with EnergyTrace technology support) and theCode Composer Studio (CCS) connected directly to the launchpad debug pinsand bypassing the board debugger. In the second group of tests, the gatewaymonitoring agent was used to collect the impact of the traffic generated by thesensor node monitoring agent on the network and by collecting device healthreports. The results presented in figure 4.4 show (a) the impact of the hardwaretechniques on the sensor node battery lifetime; (b) the overall impact of thesensor node monitoring agent on the sensor node lifetime; (c)(d) the impact ofthe sensor node monitoring agent on the microcontroller processing and memory,respectively; and (e) the overhead caused by the transport of the sensor nodemonitoring data over the network.
In order to measure the impact of the hardware monitoring metrics on sensornode resources, a simplified version of the industrial application was developed
— 70 —
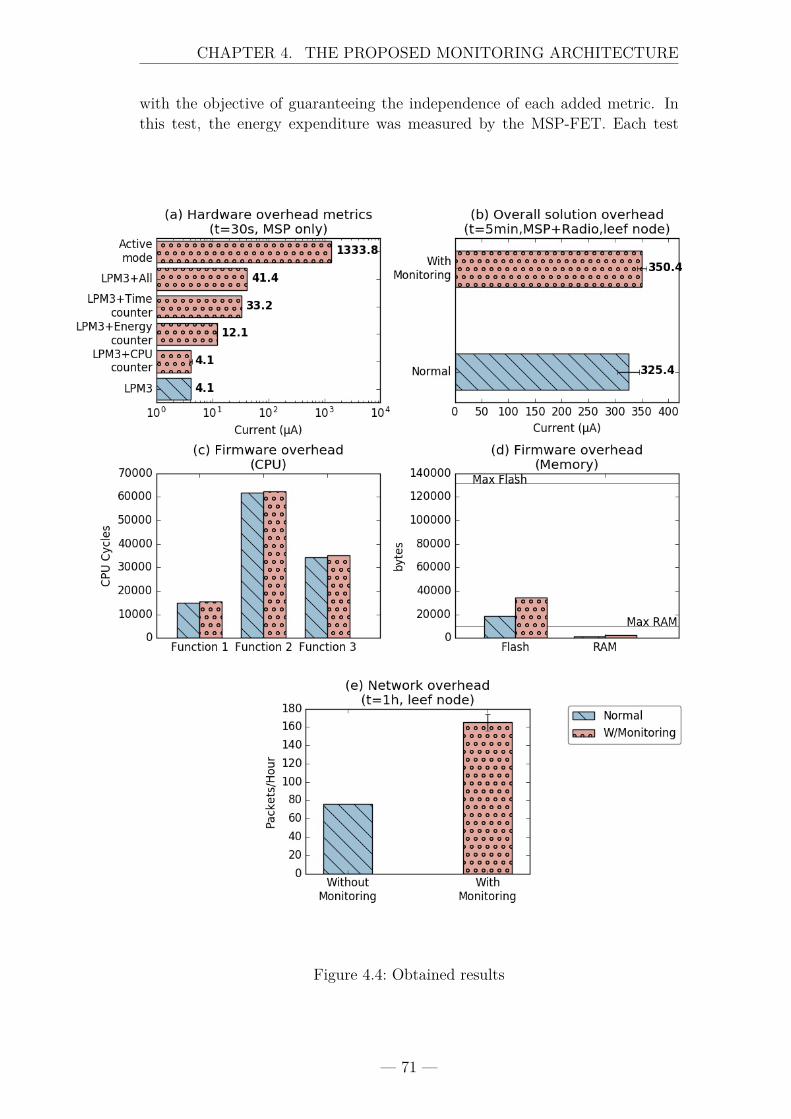
CHAPTER 4. THE PROPOSED MONITORING ARCHITECTURE
with the objective of guaranteeing the independence of each added metric. Inthis test, the energy expenditure was measured by the MSP-FET. Each test
Figure 4.4: Obtained results
— 71 —
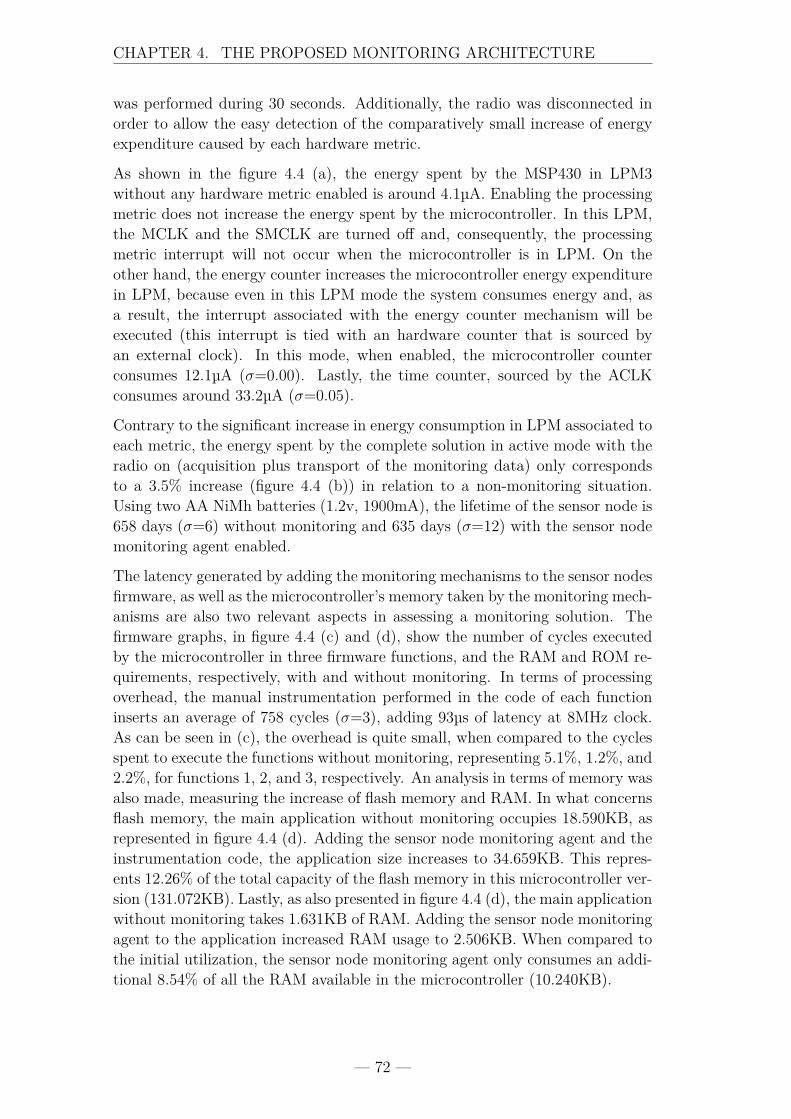
CHAPTER 4. THE PROPOSED MONITORING ARCHITECTURE
was performed during 30 seconds. Additionally, the radio was disconnected inorder to allow the easy detection of the comparatively small increase of energyexpenditure caused by each hardware metric.
As shown in the figure 4.4 (a), the energy spent by the MSP430 in LPM3without any hardware metric enabled is around 4.1µA. Enabling the processingmetric does not increase the energy spent by the microcontroller. In this LPM,the MCLK and the SMCLK are turned off and, consequently, the processingmetric interrupt will not occur when the microcontroller is in LPM. On theother hand, the energy counter increases the microcontroller energy expenditurein LPM, because even in this LPM mode the system consumes energy and, asa result, the interrupt associated with the energy counter mechanism will beexecuted (this interrupt is tied with an hardware counter that is sourced byan external clock). In this mode, when enabled, the microcontroller counterconsumes 12.1µA (σ=0.00). Lastly, the time counter, sourced by the ACLKconsumes around 33.2µA (σ=0.05).
Contrary to the significant increase in energy consumption in LPM associated toeach metric, the energy spent by the complete solution in active mode with theradio on (acquisition plus transport of the monitoring data) only correspondsto a 3.5% increase (figure 4.4 (b)) in relation to a non-monitoring situation.Using two AA NiMh batteries (1.2v, 1900mA), the lifetime of the sensor node is658 days (σ=6) without monitoring and 635 days (σ=12) with the sensor nodemonitoring agent enabled.
The latency generated by adding the monitoring mechanisms to the sensor nodesfirmware, as well as the microcontroller’s memory taken by the monitoring mech-anisms are also two relevant aspects in assessing a monitoring solution. Thefirmware graphs, in figure 4.4 (c) and (d), show the number of cycles executedby the microcontroller in three firmware functions, and the RAM and ROM re-quirements, respectively, with and without monitoring. In terms of processingoverhead, the manual instrumentation performed in the code of each functioninserts an average of 758 cycles (σ=3), adding 93µs of latency at 8MHz clock.As can be seen in (c), the overhead is quite small, when compared to the cyclesspent to execute the functions without monitoring, representing 5.1%, 1.2%, and2.2%, for functions 1, 2, and 3, respectively. An analysis in terms of memory wasalso made, measuring the increase of flash memory and RAM. In what concernsflash memory, the main application without monitoring occupies 18.590KB, asrepresented in figure 4.4 (d). Adding the sensor node monitoring agent and theinstrumentation code, the application size increases to 34.659KB. This repres-ents 12.26% of the total capacity of the flash memory in this microcontroller ver-sion (131.072KB). Lastly, as also presented in figure 4.4 (d), the main applicationwithout monitoring takes 1.631KB of RAM. Adding the sensor node monitoringagent to the application increased RAM usage to 2.506KB. When compared tothe initial utilization, the sensor node monitoring agent only consumes an addi-tional 8.54% of all the RAM available in the microcontroller (10.240KB).
— 72 —
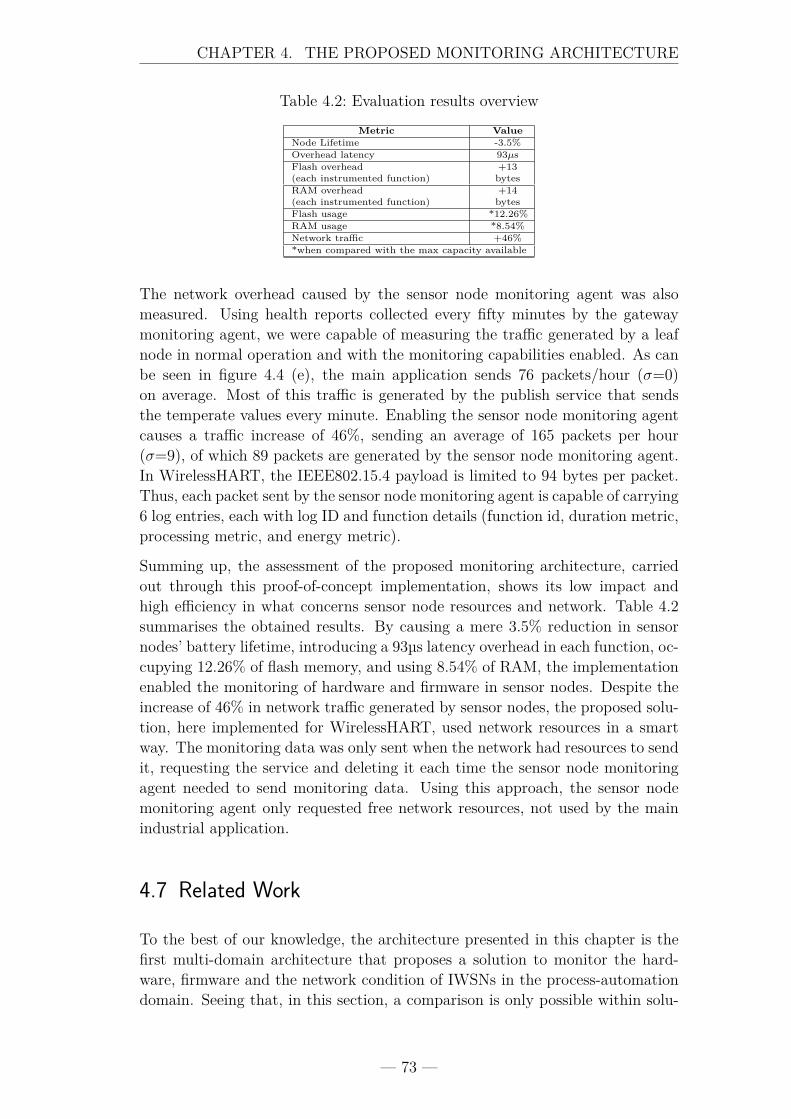
CHAPTER 4. THE PROPOSED MONITORING ARCHITECTURE
Table 4.2: Evaluation results overview
Metric ValueNode Lifetime -3.5%Overhead latency 93µsFlash overhead(each instrumented function)
+13bytes
RAM overhead(each instrumented function)
+14bytes
Flash usage *12.26%RAM usage *8.54%Network traffic +46%*when compared with the max capacity available
The network overhead caused by the sensor node monitoring agent was alsomeasured. Using health reports collected every fifty minutes by the gatewaymonitoring agent, we were capable of measuring the traffic generated by a leafnode in normal operation and with the monitoring capabilities enabled. As canbe seen in figure 4.4 (e), the main application sends 76 packets/hour (σ=0)on average. Most of this traffic is generated by the publish service that sendsthe temperate values every minute. Enabling the sensor node monitoring agentcauses a traffic increase of 46%, sending an average of 165 packets per hour(σ=9), of which 89 packets are generated by the sensor node monitoring agent.In WirelessHART, the IEEE802.15.4 payload is limited to 94 bytes per packet.Thus, each packet sent by the sensor node monitoring agent is capable of carrying6 log entries, each with log ID and function details (function id, duration metric,processing metric, and energy metric).
Summing up, the assessment of the proposed monitoring architecture, carriedout through this proof-of-concept implementation, shows its low impact andhigh efficiency in what concerns sensor node resources and network. Table 4.2summarises the obtained results. By causing a mere 3.5% reduction in sensornodes’ battery lifetime, introducing a 93µs latency overhead in each function, oc-cupying 12.26% of flash memory, and using 8.54% of RAM, the implementationenabled the monitoring of hardware and firmware in sensor nodes. Despite theincrease of 46% in network traffic generated by sensor nodes, the proposed solu-tion, here implemented for WirelessHART, used network resources in a smartway. The monitoring data was only sent when the network had resources to sendit, requesting the service and deleting it each time the sensor node monitoringagent needed to send monitoring data. Using this approach, the sensor nodemonitoring agent only requested free network resources, not used by the mainindustrial application.
4.7 Related Work
To the best of our knowledge, the architecture presented in this chapter is thefirst multi-domain architecture that proposes a solution to monitor the hard-ware, firmware and the network condition of IWSNs in the process-automationdomain. Seeing that, in this section, a comparison is only possible within solu-
— 73 —
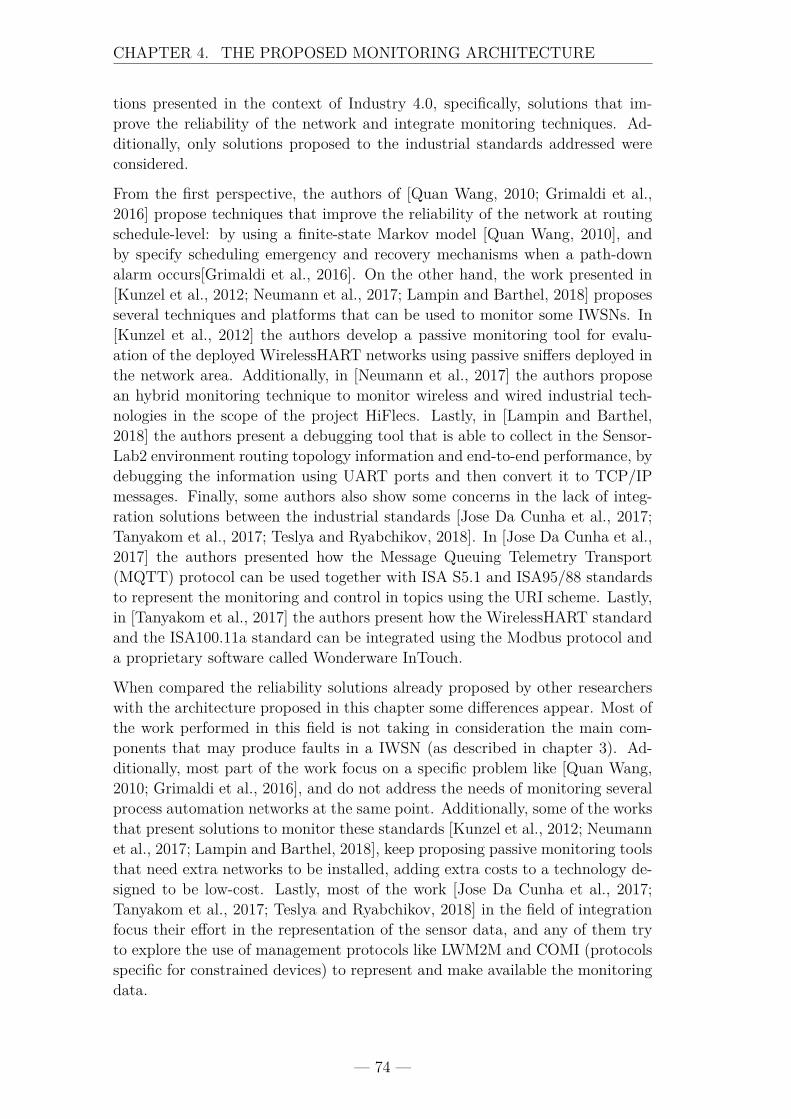
CHAPTER 4. THE PROPOSED MONITORING ARCHITECTURE
tions presented in the context of Industry 4.0, specifically, solutions that im-prove the reliability of the network and integrate monitoring techniques. Ad-ditionally, only solutions proposed to the industrial standards addressed wereconsidered.
From the first perspective, the authors of [Quan Wang, 2010; Grimaldi et al.,2016] propose techniques that improve the reliability of the network at routingschedule-level: by using a finite-state Markov model [Quan Wang, 2010], andby specify scheduling emergency and recovery mechanisms when a path-downalarm occurs[Grimaldi et al., 2016]. On the other hand, the work presented in[Kunzel et al., 2012; Neumann et al., 2017; Lampin and Barthel, 2018] proposesseveral techniques and platforms that can be used to monitor some IWSNs. In[Kunzel et al., 2012] the authors develop a passive monitoring tool for evalu-ation of the deployed WirelessHART networks using passive sniffers deployed inthe network area. Additionally, in [Neumann et al., 2017] the authors proposean hybrid monitoring technique to monitor wireless and wired industrial tech-nologies in the scope of the project HiFlecs. Lastly, in [Lampin and Barthel,2018] the authors present a debugging tool that is able to collect in the Sensor-Lab2 environment routing topology information and end-to-end performance, bydebugging the information using UART ports and then convert it to TCP/IPmessages. Finally, some authors also show some concerns in the lack of integ-ration solutions between the industrial standards [Jose Da Cunha et al., 2017;Tanyakom et al., 2017; Teslya and Ryabchikov, 2018]. In [Jose Da Cunha et al.,2017] the authors presented how the Message Queuing Telemetry Transport(MQTT) protocol can be used together with ISA S5.1 and ISA95/88 standardsto represent the monitoring and control in topics using the URI scheme. Lastly,in [Tanyakom et al., 2017] the authors present how the WirelessHART standardand the ISA100.11a standard can be integrated using the Modbus protocol anda proprietary software called Wonderware InTouch.
When compared the reliability solutions already proposed by other researcherswith the architecture proposed in this chapter some differences appear. Most ofthe work performed in this field is not taking in consideration the main com-ponents that may produce faults in a IWSN (as described in chapter 3). Ad-ditionally, most part of the work focus on a specific problem like [Quan Wang,2010; Grimaldi et al., 2016], and do not address the needs of monitoring severalprocess automation networks at the same point. Additionally, some of the worksthat present solutions to monitor these standards [Kunzel et al., 2012; Neumannet al., 2017; Lampin and Barthel, 2018], keep proposing passive monitoring toolsthat need extra networks to be installed, adding extra costs to a technology de-signed to be low-cost. Lastly, most of the work [Jose Da Cunha et al., 2017;Tanyakom et al., 2017; Teslya and Ryabchikov, 2018] in the field of integrationfocus their effort in the representation of the sensor data, and any of them tryto explore the use of management protocols like LWM2M and COMI (protocolsspecific for constrained devices) to represent and make available the monitoringdata.
— 74 —

CHAPTER 4. THE PROPOSED MONITORING ARCHITECTURE
4.8 Summary of the Chapter
As a starting point for new management models and diagnostic tools, we stronglybelieve that the architecture presented in this chapter will open new researchdirections and proposals that will lead to better diagnostic tools for IWSN stand-ards (ZigBee, WirelessHART, ISA100.11a, and WIA-PA). Specifically, the pro-posed architecture offers the possibility of having IWSN management systemsable to monitor individual sensor nodes and the network as a whole, in both thedevelopment and deployments phases.
Being a comprehensive architecture that addresses the most important indus-trial standards in the process-automation domain, addressing several hardwaretechnologies, and several firmware architectures, it was not practical to build aprototype that demonstrate all the technologies and models that can be suppor-ted. Thus, in this chapter, when the architectural components were described,some possible solutions were presented in order to provide some guidelines forfurther implementation. Nevertheless, as shown by our proof-of-concept imple-mentation, the architecture can be used to perform the monitoring of a variety ofsensor and network-wide parameters in a way that does not increase the cost ofnode manufacturing, does not have significant impact on sensor node resources,and does not steal network bandwidth from the main application.
In the next chapter, the proposed architecture will be explored in the threeproposed dimensions (hardware, firmware and the network) in order to show itseffectiveness.
— 75 —

Chapter 5Attack, detect and explore newvulnerabilities in WirelessHART
”When Wireless is fullyapplied the earth will beconverted into a huge brain,capable of response in everyone of its parts.”
(Nikola Tesla)
Contents5.1 Introduction . . . . . . . . . . . . . . . . . . . . . . . . 785.2 WirelessHART from a Security Perspective . . . . . 79
5.2.1 WirelessHART Security . . . . . . . . . . . . . . . 805.2.2 Threat Analysis . . . . . . . . . . . . . . . . . . . 81
5.3 Attack Tools . . . . . . . . . . . . . . . . . . . . . . . 835.4 Attacking an WirelessHART Network . . . . . . . . 84
5.4.1 Jamming . . . . . . . . . . . . . . . . . . . . . . 845.4.2 Advertisement Based Attack . . . . . . . . . . . . 85
5.5 Detecting the Threats . . . . . . . . . . . . . . . . . . 865.6 Summary of the Chapter . . . . . . . . . . . . . . . . 89
— 77 —
CHAPTER 5. ATTACK, DETECT AND EXPLORE NEWVULNERABILITIES IN WIRELESSHART
I ndustrial Control Systems are now exploring the use of Internet of Thingstechnologies not only to make them fitter to their job but also to explorethe advantages that come from connecting them to the Internet. Neverthe-
less, with this paradigm shift, new threats appear, of which the stuxnet wormis just an example, and Intrusion Detection Systems architectures and solutionswere and still are being considered. However, most existing projects concentrateon high level system aspects and thus neglect security aspects at wireless com-munication standards level, such as WirelessHART (the standard with largestmarket share), choosing not to address security solutions to common, knownattacks identified by the community. In this chapter, using the monitoring ar-chitecture proposed, we will monitor the WirelessHART testbed, and at thesame time, conduct network attacks from an outsider perspective. As maincontributions this chapter presents a new exhaustion attack for WirelessHARTthat, until now, to the best of our knowledge, has not been yet described. Addi-tionally, the presented work proves that using classifiers like One Class SupportVector Machines (OCSVM), and our monitoring architecture we are capable todetect the new exhaustion attack and more common attacks like jamming andcollision.
5.1 Introduction
ICS networks differ from networks in other common IT fields. Here, requirementslike reliability, availability and security must take precedence over all the others.Standards like WirelessHART take into consideration these requirements in theirdesign. Through a combination of techniques at the Data Link Layer (DLL), likeTDMA and channel hopping (for more detail, see section 2.2.2), the standardenables deterministic communications and enhanced immunity to interferences.At the same time, by using the IEEE802.15.4 Physical (PHY) layer and partof its MAC layer, the standard is able to achieve low power consumption andlow cost (namely, by using IEEE802.15.4-based radios). Additionally, at theapplication layer, the use of HART [Nobre et al., 2015] commands makes thetechnology backward compatible with existing Supervisory Control and DataAcquisition (SCADA) systems.
However, the introduction of new IoT technologies in ICS networks is shiftingthe connection paradigm of the critical infrastructures. Until now, critical infra-structures have been operating as separate networks, disconnected from publicInternet infrastructures, but this paradigm is changing, exposing these systemsto a new set of threats (e.g., stuxnet, slammer, mariposa [Pasqualetti et al.,2015]). In the case of stuxnet, the worm was used to launch cyber-attacks onimportant critical infrastructures, specifically against Iran’s nuclear program.Consequently, in later years, several projects have emerged in this field propos-ing several architectural models to monitor these networks and to detect thistype of threats [Maglaras et al., 2018]. However, most of these projects designtheir IDS for existing wired technologies like Modbus, CanBus and Profibus,neglecting the fact that wireless technologies like WirelessHART (as well as,
— 78 —
CHAPTER 5. ATTACK, DETECT AND EXPLORE NEWVULNERABILITIES IN WIRELESSHART
ISA100.11, ZigBee, WIA-PA and the new 6TiSCH) are increasingly being usedand present new and distinct risks, given their wireless nature and resourceconstrained characteristics. As a result, in this chapter, we will explore thisperspective, in what concerns the WirelessHART standard, presenting the ef-fectiveness of the presented architecture to detect such attacks.
So far, to the best of our knowledge, work performed on this topic has been madein a more theoretical perspective or/and by using simulators. In their research,the authors of [Raza et al., 2009; Alcaraz and Lopez, 2010; Bayou et al., 2016]present a set of threats to the WirelessHART standard but we were not able toidentify papers that explore these threats either in real scenarios or in testbeds.Additionally, most of the proposed solutions focus on the ZigBee standard [Wangand Jiang, 2016]. Consequently, there is also a lack of solutions, specifically forthe WirelessHART, as well as a more general approach to monitor the network ofthe four main standards (WirelessHART, ISA100.11a, ZigBee, WIA-PA). In thischapter, the monitoring architecture will be used to monitor and detect someof the network threats identified in [Raza et al., 2009; Alcaraz and Lopez, 2010;Bayou et al., 2016]. As main contributions of this chapter: 1) we prove that it ispossible (by using the network metrics available in the standard) to identify anddetect threats like jamming, exhaustion, and collision attacks conducted froman outsider prespective; 2) additionally, a new exhausting attack is presented,that explores vulnerabilities of the join phase of WirelessHART-based networks.To detect this new attack vector, we use not only the standard network metricsbut also the in-node metrics related with the hardware and firmware (proposedin the architecture). Using a OCSVM, we show that it is possible to detect thistype of attacks with good precision and recall. Lastly, this chapter also presentshow these attacks were made and describes the tools and the low-cost hardwareused to conduct them.
The remainder of this chapter is organized as follows, Section 5.2 presents theWirelessHART standard from a security perspective, and identifies some designflaws that can be explored. In section 5.3, the hardware tools used to conductthe attacks are presented. Section 5.4 details the conducted attacks and thebest metrics that can be used for their identification. Section 5.5 presents theattacks detection results using the OCSVM classifier. Lastly, section 5.6 sumsup the chapter.
5.2 WirelessHART from a Security Perspective
This section addresses two main topics. In the first topic a brief description ofthe security characteristics of the WirelessHART is made, complementing partof the discussion already started in section 2.2.2. In the second topic, an analysisto the already recognized security threats will be presented, using the threatsidentified in [Raza et al., 2009; Alcaraz and Lopez, 2010; Bayou et al., 2016].The analysis will be conducted from an outside attacker perspective.
— 79 —
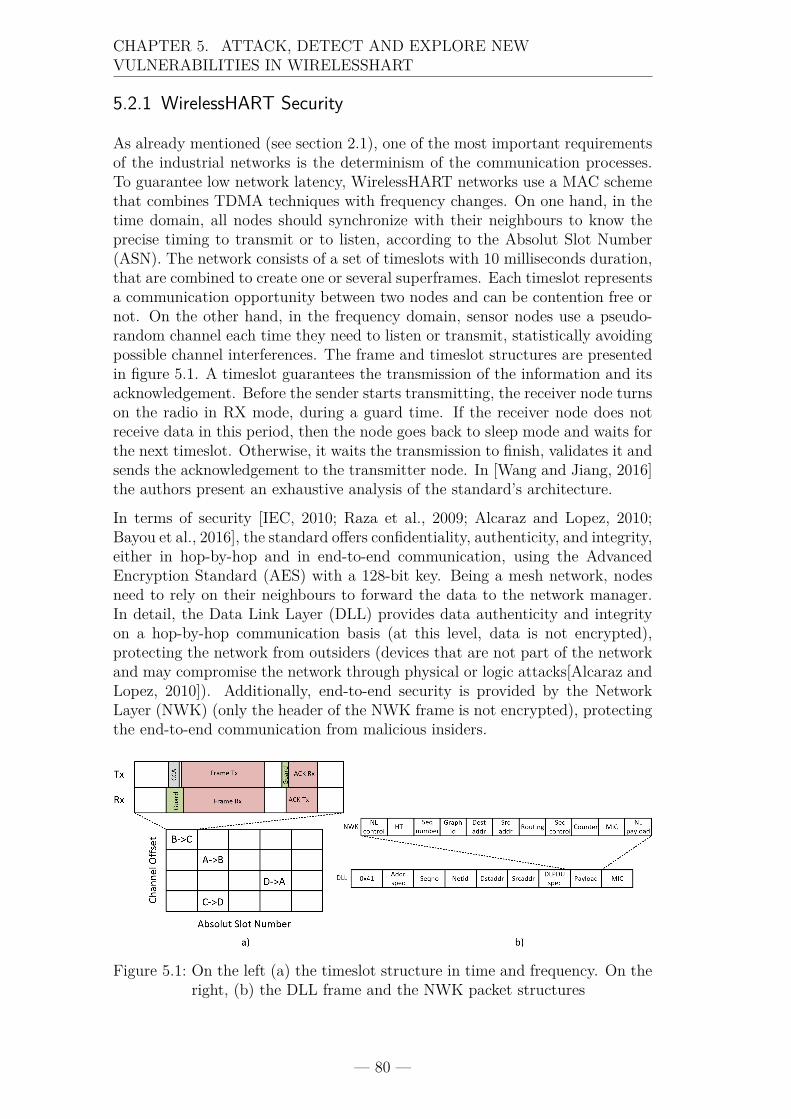
CHAPTER 5. ATTACK, DETECT AND EXPLORE NEWVULNERABILITIES IN WIRELESSHART
5.2.1 WirelessHART Security
As already mentioned (see section 2.1), one of the most important requirementsof the industrial networks is the determinism of the communication processes.To guarantee low network latency, WirelessHART networks use a MAC schemethat combines TDMA techniques with frequency changes. On one hand, in thetime domain, all nodes should synchronize with their neighbours to know theprecise timing to transmit or to listen, according to the Absolut Slot Number(ASN). The network consists of a set of timeslots with 10 milliseconds duration,that are combined to create one or several superframes. Each timeslot representsa communication opportunity between two nodes and can be contention free ornot. On the other hand, in the frequency domain, sensor nodes use a pseudo-random channel each time they need to listen or transmit, statistically avoidingpossible channel interferences. The frame and timeslot structures are presentedin figure 5.1. A timeslot guarantees the transmission of the information and itsacknowledgement. Before the sender starts transmitting, the receiver node turnson the radio in RX mode, during a guard time. If the receiver node does notreceive data in this period, then the node goes back to sleep mode and waits forthe next timeslot. Otherwise, it waits the transmission to finish, validates it andsends the acknowledgement to the transmitter node. In [Wang and Jiang, 2016]the authors present an exhaustive analysis of the standard’s architecture.
In terms of security [IEC, 2010; Raza et al., 2009; Alcaraz and Lopez, 2010;Bayou et al., 2016], the standard offers confidentiality, authenticity, and integrity,either in hop-by-hop and in end-to-end communication, using the AdvancedEncryption Standard (AES) with a 128-bit key. Being a mesh network, nodesneed to rely on their neighbours to forward the data to the network manager.In detail, the Data Link Layer (DLL) provides data authenticity and integrityon a hop-by-hop communication basis (at this level, data is not encrypted),protecting the network from outsiders (devices that are not part of the networkand may compromise the network through physical or logic attacks[Alcaraz andLopez, 2010]). Additionally, end-to-end security is provided by the NetworkLayer (NWK) (only the header of the NWK frame is not encrypted), protectingthe end-to-end communication from malicious insiders.
Figure 5.1: On the left (a) the timeslot structure in time and frequency. On theright, (b) the DLL frame and the NWK packet structures
— 80 —
CHAPTER 5. ATTACK, DETECT AND EXPLORE NEWVULNERABILITIES IN WIRELESSHART
As presented in figure 5.1 (b), the DLL and NWK layers have a Message IntegrityCode (MIC). This field provides source integrity, by authenticating the sendingdevice as a valid neighbour. The MIC is calculated using the AES-CCM modewith the following parameters: a 128-bit network key, a 13 byte-string that con-tains the ASN concatenated with the source address, and the Data Link LayerPDU (DLPDU) to be encrypted. On the other hand, the MIC of NWK layer iscalculated over the entire Network Layer Protocol Data Unit (NLPDU) using:the NLPDU header, the NLPDU payload, a 13-byte nonce, and the 128-bit ses-sion key (SK), used in communications between devices and the gateway.
To achieve different levels of security, the standard defines a set of securitykeys that allow to secure the exchange of messages between the network devicesand/or with the Network Manager (NM) hop-by-hop and end-to-end. The keysspecified in the standard are: 1) the well-known key (WK), 2) the join key (JK),3) the network key(NK), 4) the broadcast session key (BK) and a 5) unicastsession key (UK). Firstly, the WK (1) is a special key that is already definedin the standard specification and used in the transmission of the advertisementmessages between the joining device and the devices already connected to thenetwork. Secondly, the JK (2) is manually distributed by the Security Admin-istrator (SA) in the deployment phase. This key acts as a password that thedevice uses to authenticate with the NM in the join procedure. The key is usedto receive the remaining keys (NK, UK and BK) in the security handshake.Thirdly, the NK (3) is distributed by the NM to the joining devices, in the se-curity handshake, and used to compute the MIC of the DLPDUs to authenticatethe communication between two neighbour devices. Lastly, the BK (4) and theUKs (5) are used to send unicast and broadcast data end-to-end between thenetwork manager and the network devices.
After the analysis performed in this section is easy to understand that the se-curity of the WirelessHART protocol depends of the secrecy of the JK. If anattacker was able to obtain this key, the attacker can initiate join procedures byitself and connect to the network in order to obtain all the remaining keys insecurity handshake (NK, UK and BK). Having access to this information, theattacker will be able to compute the MIC of messages, and as a result exchangevalid messages with the neighbours and with the NM. Thus, the attacks made toa WirelessHART network can be divided in two types: outsider attacks, attacksmade by nodes that do not have access to the join key; and insider attacks,nodes that have access to the JK and, consequently, to all the other keys.
5.2.2 Threat Analysis
Despite the specification of several security measures in wireless network stand-ards, these networks are still the target of several attacks. WirelessHART isnot an exception. In [Raza et al., 2009; Alcaraz and Lopez, 2010] the authorspresent a security analysis of the standard, describing some of the threats thatcan be explored by malicious attackers. In this analysis we will focus on theterminology and on the concepts used in [Alcaraz and Lopez, 2010], and, as
— 81 —
CHAPTER 5. ATTACK, DETECT AND EXPLORE NEWVULNERABILITIES IN WIRELESSHART
already mentioned, from an outsider perspective. Only the relevant attacks andsecurity concepts for this topic will be analysed.
In [Alcaraz and Lopez, 2010] the authors split their threat model into three maingroups: confidentiality, integrity and availability attacks. Attacks on confidenti-ality are related with the capability of an attacker to obtain unauthorized accessto any information exchanged in the network. On the other hand, integrityattacks are related to the capability of an attacker to manipulate informationin exchanged messages (e.g., routing messages), and use it to change the be-haviour of the network. Lastly, availability attacks try to disrupt the network,preventing it from providing its services. This type of attack in WSNs is usuallyperformed with the aim of exhausting the sensor nodes resources, such as theirenergy.
In what concerns availability attacks, a WirelessHART network may be exposedto attacks like: jamming, interference, collision, exhaustion and network isol-ation. Using the Time Slotted Channel Hopping (TSCH), and its frequencyhopping method, a WirelessHART network may prevent attacks like jamming,interference and collision, by blacklisting the channels where the attacks occurs.However, an attacker with sufficient resources may launch the attack in all the16 channels. An attacker may also send data in these channels to generate col-lisions. The collisions can be detected by the Cyclic Redundancy Check (CRC)field available in the DLL frame. These attacks can also be a DoS attack [Razaet al., 2009]. The authors of [Raza et al., 2009] also defend that any device thatsupports WirelessHART and has knowledge of network parameters like networkid, device id, and the well-known key can send a “valid” JK requests to neigh-bouring devices authenticated with the WK. The idea of faking a message likethis is to force the neighbour nodes to consume resources in the transport of thepacket and its analysis. At the end, the message will be discarded by the net-work manager because it contains an invalid JK. On the other hand, attackersthat want access to network parameters like the network id, and the ASN usedat the attack moment, need only to sniff the advertisement messages sent by thenetwork manager and perform traffic analysis. As mentioned before, only theNLPDU payload is encrypted. Moreover, the authors of [Alcaraz and Lopez,2010] also present a form of isolating a network by overloading the gatewaywith multiple TCP/Modbus commands and alarms. In the current chapter, adifferent type of isolation attack will be described in section 5.4.2.
In what concerns integrity attacks, the authors of [Alcaraz and Lopez, 2010]argue that WirelessHART prevents information manipulation network attacksby supporting the use of different SK to generate the MIC between the NM andthe network devices, the network key to encrypt the message, and by its noncethat can be used to validate the age of a packet. However, there is a situationexplored in section 5.4.2 (the new attack explored in this chapter), where asensor node may be the target of an information replay attack.
Lastly, as previously mentioned, confidentiality attacks can also be performed.An attacker with an IEEE802.15.4 radio can sniff a WirelessHART frame andhave access to the contents of DLL packets and to the NLPDU header. This
— 82 —
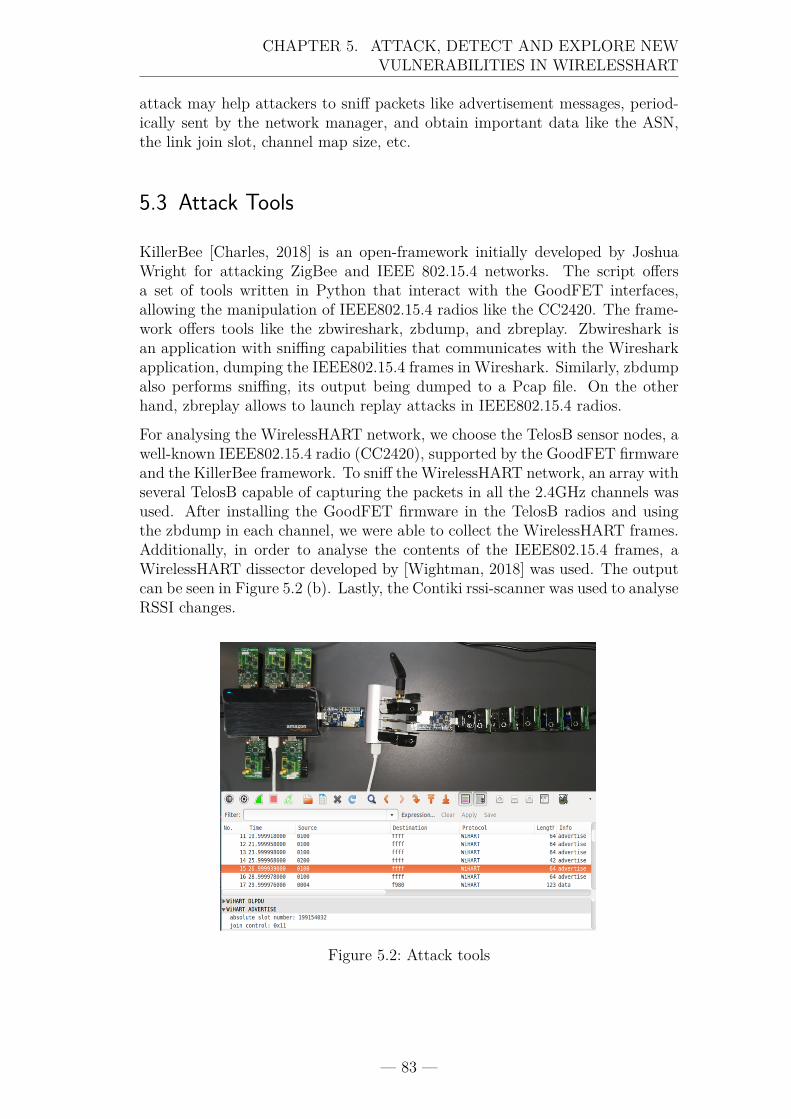
CHAPTER 5. ATTACK, DETECT AND EXPLORE NEWVULNERABILITIES IN WIRELESSHART
attack may help attackers to sniff packets like advertisement messages, period-ically sent by the network manager, and obtain important data like the ASN,the link join slot, channel map size, etc.
5.3 Attack Tools
KillerBee [Charles, 2018] is an open-framework initially developed by JoshuaWright for attacking ZigBee and IEEE 802.15.4 networks. The script offersa set of tools written in Python that interact with the GoodFET interfaces,allowing the manipulation of IEEE802.15.4 radios like the CC2420. The frame-work offers tools like the zbwireshark, zbdump, and zbreplay. Zbwireshark isan application with sniffing capabilities that communicates with the Wiresharkapplication, dumping the IEEE802.15.4 frames in Wireshark. Similarly, zbdumpalso performs sniffing, its output being dumped to a Pcap file. On the otherhand, zbreplay allows to launch replay attacks in IEEE802.15.4 radios.
For analysing the WirelessHART network, we choose the TelosB sensor nodes, awell-known IEEE802.15.4 radio (CC2420), supported by the GoodFET firmwareand the KillerBee framework. To sniff the WirelessHART network, an array withseveral TelosB capable of capturing the packets in all the 2.4GHz channels wasused. After installing the GoodFET firmware in the TelosB radios and usingthe zbdump in each channel, we were able to collect the WirelessHART frames.Additionally, in order to analyse the contents of the IEEE802.15.4 frames, aWirelessHART dissector developed by [Wightman, 2018] was used. The outputcan be seen in Figure 5.2 (b). Lastly, the Contiki rssi-scanner was used to analyseRSSI changes.
Figure 5.2: Attack tools
— 83 —
CHAPTER 5. ATTACK, DETECT AND EXPLORE NEWVULNERABILITIES IN WIRELESSHART
5.4 Attacking an WirelessHART Network
As presented in section 2.2.2, the WirelessHART standard provides several se-curity mechanisms that make the network more robust to attacks. Firstly, sensornodes use a pseudo-random sequence that allows the nodes to communicate indifferent channels in the same timeslot. Thus, it’s difficult to follow the commu-nication of one sensor node and, consequently, several sniffers need to be usedin order to collect the traffic generated in all the channels. Additionally, toauthenticate the packets at the different layers (DLL and NWK), the standardauthenticates each layer with a MIC generated by a nonce, that changes withtime and it is based on the ASN and use distinct keys. To forge a packet, theattacker needs to be synchronized with the network and know the exact timeslot,channel, and key that the node will use for transmission in order to generate avalid MIC accepted by the receiver (use the NK to send to neighbours or one ofthe SKs if the message is sent to the NM).
Lastly, as presented in Figure 5.1 (a), to receive such a packet, the attacker needsto transmit the packet in the guard time period (need to be synchronize). How-ever, despite these aspects that turn hard the reception of a malicious packet,there are a set of attacks that can be made to the network without need to syn-chronize the attackers with the network. In this section two types of attacks willbe used: firstly, we perform the most basic attack, a jamming attack; secondly,we explore an information manipulation attack that, at the same time, performsexhaustion of the sensor node resources (e.g., battery), and the isolation of thenew joining devices. As far as we know, this attack has not been described inthe literature.
To perform the attacks against the network, we start by putting a TelosB nodein promiscuous mode to capture network packets with the zbwireshark tool (e.g.,data, ack, keep-alive, advertise and disconnect DLPDUs). To perform the twoattacks, two types of packets were captured: an advertisement packet and a datapacket sent between two nodes.
5.4.1 Jamming
Because of sharing the physical medium like the other wireless technologies,jamming attacks are the simplest that can be performed over a WirelessHARTnetwork (see section 3.4.2). The attack consists in the disruption of the ori-ginal radio signal, using another signal with the same modulation technique andfrequency. As a result, jamming attacks can be performed by WirelessHARTcompatible nodes and by any other device that is able to reproduce a signal withthese characteristics. In order to evade jamming attacks, the WirelessHART net-work can use the channel blacklisting feature. However, this functionality is notwell defined and described in the standard. For instance, when the current test-bed was installed, we notice that the NM only supports the manual insertion ofthe noise channels in the blacklist. Thus, we did not find evidence that the NMhas support to automatic detection of the noisiest channels.
— 84 —
CHAPTER 5. ATTACK, DETECT AND EXPLORE NEWVULNERABILITIES IN WIRELESSHART
To perform a jamming attack, there are two types of attacks that can be made.In the first, the attacker performs it by emitting a continuous signal. The ra-dio needs to be continuously in the TX mode. However, this attack cannot beperformed with current release of the KilllerBee tool, because this feature hasnot already been implemented in the TelosB interface. The second approach tointerrupt the WirelessHART network is by transmitting IEEE802.15.4 packetsin a fast-enough rate that is capable to collide with existing network communica-tions. The collision will make the packet to be dropped and the victim node willpostpone the transmission of the packet for the next timeslot. Additionally, theWirelessHART also support in each timeslot, the use of Clear Channel Assess-ment (CCA), that can mitigate this attack. However, we note that this featureis disable by default. To replicate this attack using the KillerBee tool in com-bination with the TelosB nodes, some changes in the dev_telosb.py code weredone. Here, the code as a limitation that waits 10 milliseconds for a transmis-sion to complete, not allowing the sensor nodes to continuous transmit packetsto a higher rate. In our jamming attack we change this value to 2 milliseconds,improving the capacity of the collisions.
Lastly, to simulate the difference between broadband and narrowband interfer-ences, the jamming attack was performed in two distinct ways. By putting thearray of attackers in one channel (narrowband), or by splitting it by the availableWirelessHART channels (broadband). Additionally, to understand the impactof distinct packet types with distinct packet sizes, we also performed the attackby using unicast packets and broadcast packets.
5.4.2 Advertisement Based Attack
In section 5.2, after presented the several keys defined by the standard, an im-portant statement was made. The security of the WirelessHART hardly dependson the secrecy of the JK. If an attacker obtains access to it, the other remainingkeys can be retrieved in the security handshake. As a result, a list of insider’sattacks can be performed, if the JK is collected. However, there is an interestingattack that can happen before the handshake procedure, and resides in the factthat, the WK is defined and documented in the standard specification. Thus,in this section we present an attack that performs the resources exhaustion ofjoining nodes, and at the same time its isolation, without the access to the JKand the remaining keys obtained in the security handshake. Additionally, thisattack can also be seen as an information manipulation attack. To understandit, we will start by presenting the distinct phases of the joined procedure definedin the standard, and then presenting some of the characteristics that allow theadvertisement packet to be forged.
The joining of a new device in the network starts by the configuration of thenetwork ID and the JK. After that, the device enters in the join procedure,changing it state to the “listen mode”. In this state, the device will try to listenfor DLPDUs for a defined amount of time, changing between channels if needed,in order to synchronize with the network. When the device is in a synchronize
— 85 —
CHAPTER 5. ATTACK, DETECT AND EXPLORE NEWVULNERABILITIES IN WIRELESSHART
mode, the device is already in a state that is able to receive the advertisementmessages. Lastly, before proceeding to the join request, the device configureitself with some of the data contained in the advertisement message.
Until now, the new device only knows two security keys, the JK (that willbe used in the join procedure) and the WK (that is used to authenticate theadvertisement message). When an advertisement is received, the new devicecompares the network ID of the advertisement message with the network IDconfigured previously. Additionally, the advertisement message is validated byits MIC using the WK. When the packet arrives, the new device collects some ofthe valuable information needed to join the network. Advertisement messagestransport in its payload network information like: the ASN, the size of channelmap array, the graph structure, the number of the superframes and the joinlinks that the new device should be used to start the join procedure. Fakingsuch message with inaccurate data will force the joining device to send a joinrequest that will neither be listening or accepted as valid by the NM. The nodewill wait until the timeout of the join request expires and will need to start allthe process again, expending sensor nodes resources.
Faking an advertisement message in this context is not difficult, perhaps it isrelatively easy, and there are two ways: 1) the attacker performs traffic analysisand collects the network ID, builds an advertisement message and computes itsMIC with the WK; and 2) the attacker collects an old advertisement message,with outdated ASN and join links. This last message is valid to the joiningdevice, because in this phase the device is not able to understand the age of thepacket (does not know the ASN of the network). Furthermore, if this attack wasperformed together with a de-authentication attack, it is possible to put all thenetwork down without the opportunity to recover and re-join the nodes again tothe network. In order to perform this attack over the WirelessHART testbed,we choose to replay an old advertisement packet, previous captured in an oldernetwork configuration phase.
5.5 Detecting the Threats
To monitor the network against security threats, the monitoring architecturecollects two distinct sets of data: sensor node metrics and network-related met-rics. As presented in section 4.6.2, the sensor node monitoring agent collects thenumber of MCU cycles, functions execution time, energy consumption, and calltraces. On the other hand, the collected network metrics are the ones alreadydefined by the WirelessHART standard, and are used by the network managerto perform its tasks. Specifically, the metrics comprise device health reports,neighbour health reports, and the neighbour signal levels. Device health reportssum up all the communication statistics of a network node. These include: pack-ets generated by the device, packets terminated by the device, MIC failures atDLL or NWK layers, CRC errors, and nonce errors. Additionally, neighbourhealth reports include all the statistics of a network node concerning its con-nected neighbours. The report contains: number of linked neighbours, Received
— 86 —
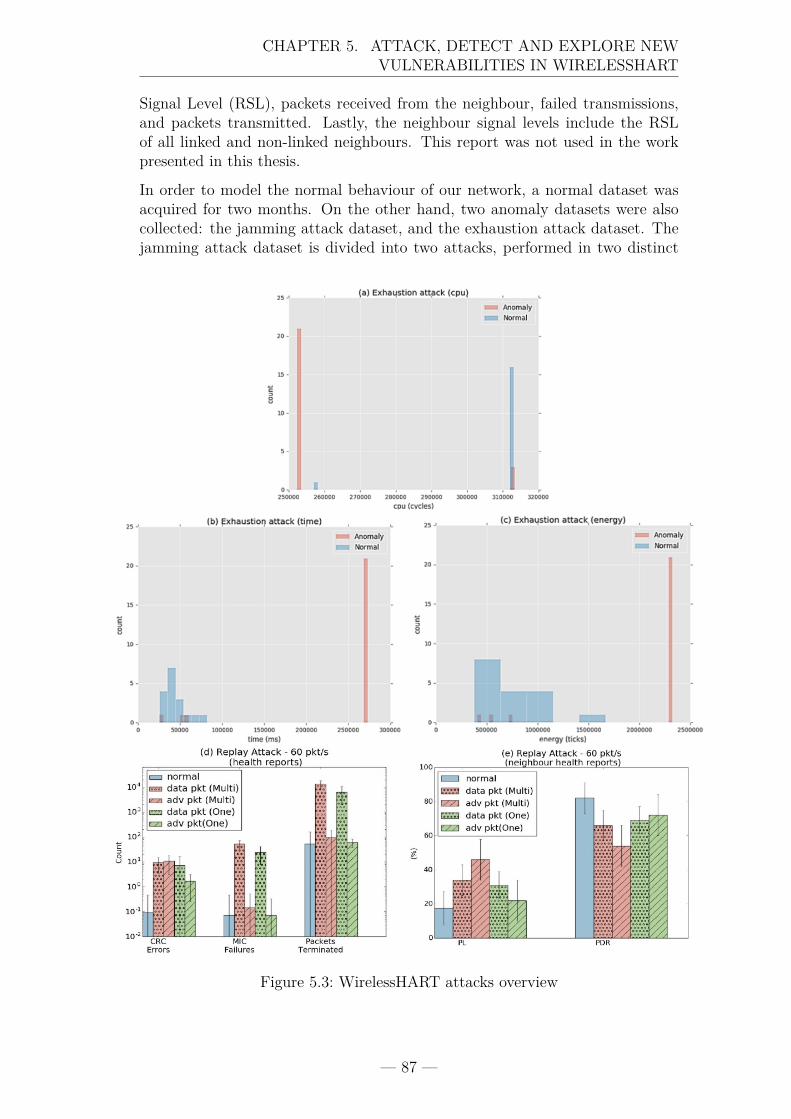
CHAPTER 5. ATTACK, DETECT AND EXPLORE NEWVULNERABILITIES IN WIRELESSHART
Signal Level (RSL), packets received from the neighbour, failed transmissions,and packets transmitted. Lastly, the neighbour signal levels include the RSLof all linked and non-linked neighbours. This report was not used in the workpresented in this thesis.
In order to model the normal behaviour of our network, a normal dataset wasacquired for two months. On the other hand, two anomaly datasets were alsocollected: the jamming attack dataset, and the exhaustion attack dataset. Thejamming attack dataset is divided into two attacks, performed in two distinct
Figure 5.3: WirelessHART attacks overview
— 87 —
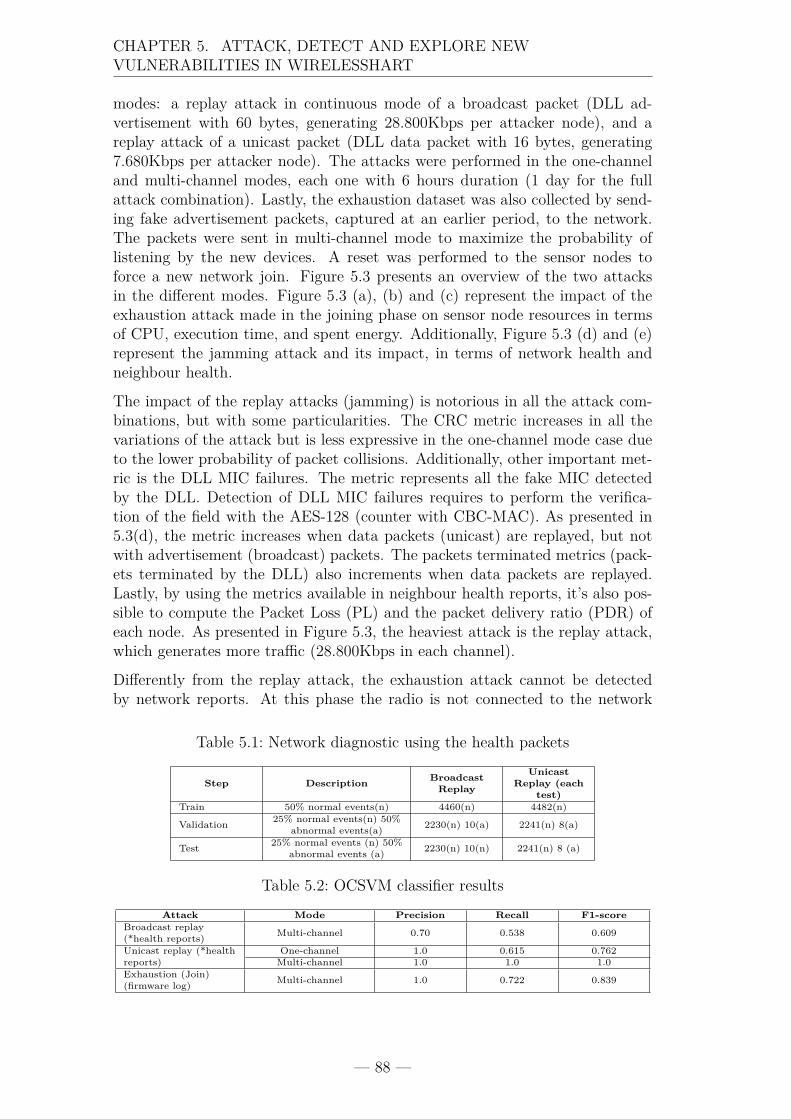
CHAPTER 5. ATTACK, DETECT AND EXPLORE NEWVULNERABILITIES IN WIRELESSHART
modes: a replay attack in continuous mode of a broadcast packet (DLL ad-vertisement with 60 bytes, generating 28.800Kbps per attacker node), and areplay attack of a unicast packet (DLL data packet with 16 bytes, generating7.680Kbps per attacker node). The attacks were performed in the one-channeland multi-channel modes, each one with 6 hours duration (1 day for the fullattack combination). Lastly, the exhaustion dataset was also collected by send-ing fake advertisement packets, captured at an earlier period, to the network.The packets were sent in multi-channel mode to maximize the probability oflistening by the new devices. A reset was performed to the sensor nodes toforce a new network join. Figure 5.3 presents an overview of the two attacksin the different modes. Figure 5.3 (a), (b) and (c) represent the impact of theexhaustion attack made in the joining phase on sensor node resources in termsof CPU, execution time, and spent energy. Additionally, Figure 5.3 (d) and (e)represent the jamming attack and its impact, in terms of network health andneighbour health.
The impact of the replay attacks (jamming) is notorious in all the attack com-binations, but with some particularities. The CRC metric increases in all thevariations of the attack but is less expressive in the one-channel mode case dueto the lower probability of packet collisions. Additionally, other important met-ric is the DLL MIC failures. The metric represents all the fake MIC detectedby the DLL. Detection of DLL MIC failures requires to perform the verifica-tion of the field with the AES-128 (counter with CBC-MAC). As presented in5.3(d), the metric increases when data packets (unicast) are replayed, but notwith advertisement (broadcast) packets. The packets terminated metrics (pack-ets terminated by the DLL) also increments when data packets are replayed.Lastly, by using the metrics available in neighbour health reports, it’s also pos-sible to compute the Packet Loss (PL) and the packet delivery ratio (PDR) ofeach node. As presented in Figure 5.3, the heaviest attack is the replay attack,which generates more traffic (28.800Kbps in each channel).
Differently from the replay attack, the exhaustion attack cannot be detectedby network reports. At this phase the radio is not connected to the network
Table 5.1: Network diagnostic using the health packets
Step Description BroadcastReplay
UnicastReplay (each
test)Train 50% normal events(n) 4460(n) 4482(n)
Validation 25% normal events(n) 50%abnormal events(a) 2230(n) 10(a) 2241(n) 8(a)
Test 25% normal events (n) 50%abnormal events (a) 2230(n) 10(n) 2241(n) 8 (a)
Table 5.2: OCSVM classifier results
Attack Mode Precision Recall F1-scoreBroadcast replay(*health reports) Multi-channel 0.70 0.538 0.609
Unicast replay (*healthreports)
One-channel 1.0 0.615 0.762Multi-channel 1.0 1.0 1.0
Exhaustion (Join)(firmware log) Multi-channel 1.0 0.722 0.839
— 88 —
CHAPTER 5. ATTACK, DETECT AND EXPLORE NEWVULNERABILITIES IN WIRELESSHART
and does not generate any report. However, as presented in Figure 5.3 (a),(b) and (c), the attack can be identified through sensor node log metrics. Inthis attack, the node receives a fake advertisement and, as already explained, itcannot detect if it is fake or not. Thus, by sending a join request assigned witha wrong ASN to a non-existing join link, the radio will wait until the requesttimes out. As presented in (b) and (c), the extra time spent in this functionclearly points to an abnormal behaviour. Furthermore, the node wastes moreenergy in this period. On the other hand, the CPU cycles spent by the functionare less, because the node needs to compute different actions in each of the twoscenarios.
Lastly, the OCSVM was used to detect the anomalies in each attack scenario.The OCSVM classifier is one of the most appropriate algorithms to classify an-omalies in WSNs due to its semi-supervised capabilities (the algorithm onlyneeds training with normal data) [Chandola et al., 2012]. To start, a selectionof the most representative features was made for the health reports and thefirmware log datasets. After that, the data was standardized and divided ran-domly as follows: train (50% of the normal datasets); validation (25% of normaldataset and 50% of anomaly datasets); and lastly, testing (25% of the normaldatasets and the remaining 50% of the anomaly datasets), see table 5.1. All thedata was chosen randomly. To train the OCSVM classifier a radial basis kernelwas selected. Additionally, at validation phase a grid-search was used to tunethe hyper-parameters. The results of the classifier are presented in table 5.2.The classifier obtained good results in the detection of the exhaustion attack(f1=0.839), and in the unicast replay attack (one-channel: f1=0.762 and multi-channel: f1=1.0). In the broadcast replay, despite the increase of the mean inmetrics like the CRC errors, the PL, and the PDR, the classifier performed badlyand was not able to discriminate the anomalies.
5.6 Summary of the Chapter
In the last years, new security threats to industrial control systems appearedand, consequently, new solutions also emerged. However, some of these newsolutions do not address IWSN standards like WirelessHART. In this chapter,the effectiveness of the proposed architecture was evaluated, as well as, to thebest of our knowledge, a new security threat that has never been described.By using the monitoring architecture proposed in this thesis, we proved thatit is possible to detect jamming and exhaustion attacks, using standard Wire-lessHART network metrics and firmware based-node metrics. Additionally, thischapter also demonstrated how easy and cheap it is to attack networks usingthis standard.
The effectiveness of the proposed architecture, in terms of anomaly detec-tion on in-node components (hardware and firmware) is presented in the nextchapter.
— 89 —

Chapter 6Security and Fault Detection inIn-node components of IIoTConstrained Devices
”I can predict things. I canimprove the uptime and thereliability. I can intervene andcause a better outcomebefore there’s a problem.”
(Michael Dell)
Contents6.1 Introduction . . . . . . . . . . . . . . . . . . . . . . . . 926.2 Injecting Anomalies . . . . . . . . . . . . . . . . . . . 93
6.2.1 Firmware: Stack-Based Buffer Overflow . . . . . . . 936.2.2 Hardware: Low-voltage Faults Analysis . . . . . . . 966.2.3 Hardware: SPI Faults . . . . . . . . . . . . . . . . 976.2.4 Hardware: High Temperature Faults . . . . . . . . 99
6.3 Detecting Anomalies And Security Threats . . . . . 1006.3.1 Data Splitting Strategy and Classifiers . . . . . . . 1006.3.2 Results . . . . . . . . . . . . . . . . . . . . . . . 103
6.4 Summary of the Chapter . . . . . . . . . . . . . . . . 104
— 91 —
CHAPTER 6. SECURITY AND FAULT DETECTION IN IN-NODECOMPONENTS OF IIOT CONSTRAINED DEVICES
I n order to keep up with the requirements of new Industry 4.0 applications,sensor nodes software and hardware are becoming more complex and, thus,more prone to faults. In this chapter, using the monitoring architecture
proposed in this thesis, we injected and subsequently proceeded to detect repres-entative firmware and hardware anomalies (namely, buffer overflow attacks, SPIfaults, under-voltage, and high temperature faults) that can be used by attackersto cause major losses or even damage industrial control systems. We evaluatedthe performance of several machine learning techniques commonly used to de-tect anomalies (i.e. OCSVM, kNN, AutoEnconder), in order to determine ifthey could be useful to detect such faults. The obtained results demonstratethat simple and broad scope classifiers, using features that consume little re-sources, can be developed to detect such faults.
6.1 Introduction
Until the last decade, ICS largely remained disconnected from the Internet, rely-ing on proprietary technologies and using the airgap principle to ensure security[Foglietta et al., 2018]. With the adoption of common technologies like theTCP/IP and Ethernet (e.g., Modbus TCP/IP), new threats emerged for suchsystems. At the same time, new wireless standards were developed, designed forfulfilling the requirements of industrial applications. IEEE 802.15.4 [Wang andJiang, 2016] based standards like ZigBee, WirelessHART, ISA100.11a, WIA-PA,and 6TiSCH can offer low-cost and low-latency solutions for some types of in-dustrial applications and, at the same time, coexist with the legacy technologies,as presented previously (see section 2.2.2).
Until recently, known attacks only targeted wired-based industrial technologiesor the SCADA software that controls industrial systems. However, as can beseen in the literature [Granjal et al., 2015; Giannetsos et al., 2010], wireless-based technologies are also subject to such attacks, in different perspectives.Differently from wired technologies already in the field, wireless-based productsare less mature in terms of development (e.g., different types of hardware archi-tectures, fragmented operating systems, bare metal development), and typicallyuse resource constrained components. As pointed in section 1.1, all of these factscontributed to the lack of monitoring systems in IWSN. Moreover, despite theefforts to secure industrial systems, current proposals only address technologiessuch as ModBus, CanBus and Profibus[Maglaras et al., 2018], neglecting the factthat the Compound Annual Growth Rate (CAGR) of the wireless technologiesamounts to 30% [Kim et al., 2019], and are being operated with well-knownsecurity vulnerabilities.
In this context, a monitoring architecture was proposed in chapter 4, that isable to monitor the condition of hardware, firmware, and the network of the fourmain industrial wireless standards (WirelessHART, ISA100.11a, WIA-PA, andZigBee), with small impact on the network and on the sensor nodes resources,without the addition of new hardware (as proved in chapter 4). In chapter 5, thearchitecture was used to effectively monitor and detect a novel network attack
— 92 —
CHAPTER 6. SECURITY AND FAULT DETECTION IN IN-NODECOMPONENTS OF IIOT CONSTRAINED DEVICES
to the WirelessHART standard. Being an architecture that also focuses on thecondition of hardware and firmware, in this chapter the referred architectureis used for detecting representative firmware and hardware faults injected inthe WirelessHART testbed. The injected faults include: 1) a buffer overflowvulnerability used for smashing the call trace of devices with the Von Neumanarchitecture [Giannetsos et al., 2010], and for running arbitrary code; 2) twoSPI faults, that simulate sensor stuck-faults, 3) an undervolting fault, using sixdifferent voltage levels, and 4) a high temperature fault [Hutter and Schmidt,2014], commonly used by attackers to manipulate the MCU behaviour, andextract information. After the injection of the mentioned faults, three differenttypes of semi-supervised machine learning algorithms for outlier detection wereused: a linear-model based, namely One-Class SVM (OCSVM); a proximity-based algorithm, namely k-Nearest Neighbours (kNN); and a neural-network-based algorithm, namely AutoEncoder.
In view of the stated objectives, the remainder of this chapter is organized asfollows. Section 6.2 details the various injected anomalies and discusses theimpact of the faults on the used monitoring metrics. Section 6.3 presents theperformance results for each classifier, in what concerns their ability for detectingthe injected anomalies. Lastly, section 6.4 provides the conclusions and sums upthis chapter.
6.2 Injecting Anomalies
The assessment of the proposed, from the in-node components perspective, wasmade by injecting several abnormal events/behaviours in the testbed. Thissection provides details on the injected anomalies, explaining how they wereinjected, what are they used for, and what are their consequences on the variousmetrics under consideration. From the firmware perspective, a stack-based bufferoverflow fault was injected that enabled us to run malicious code. On the otherhand, from the hardware perspective, low-voltage faults were used, as well asSPI communication faults and high temperature faults.
6.2.1 Firmware: Stack-Based Buffer Overflow
Memory-related vulnerabilities, like buffer overflows, are one of the most studiedvulnerabilities in the WSN domain (see section 3.4.4). Over the years, differentstudies have shown that, similarly to traditional networks, it is also possible tocreate worms and viruses that self-propagate, infecting all the network nodes[Giannetsos et al., 2010]. One of the reasons for this lies in the intrinsic charac-teristics of these systems (e.g., shared RAM and ROM memory, shared accessbuses). Another one, lies in the use of the same program in all the nodes, whichallows attackers to create worms that easily infect all the network. However, themost important reason lies in the low resources available in the nodes, and con-sequently on the use of weakly typed programming languages like C and C++.
— 93 —
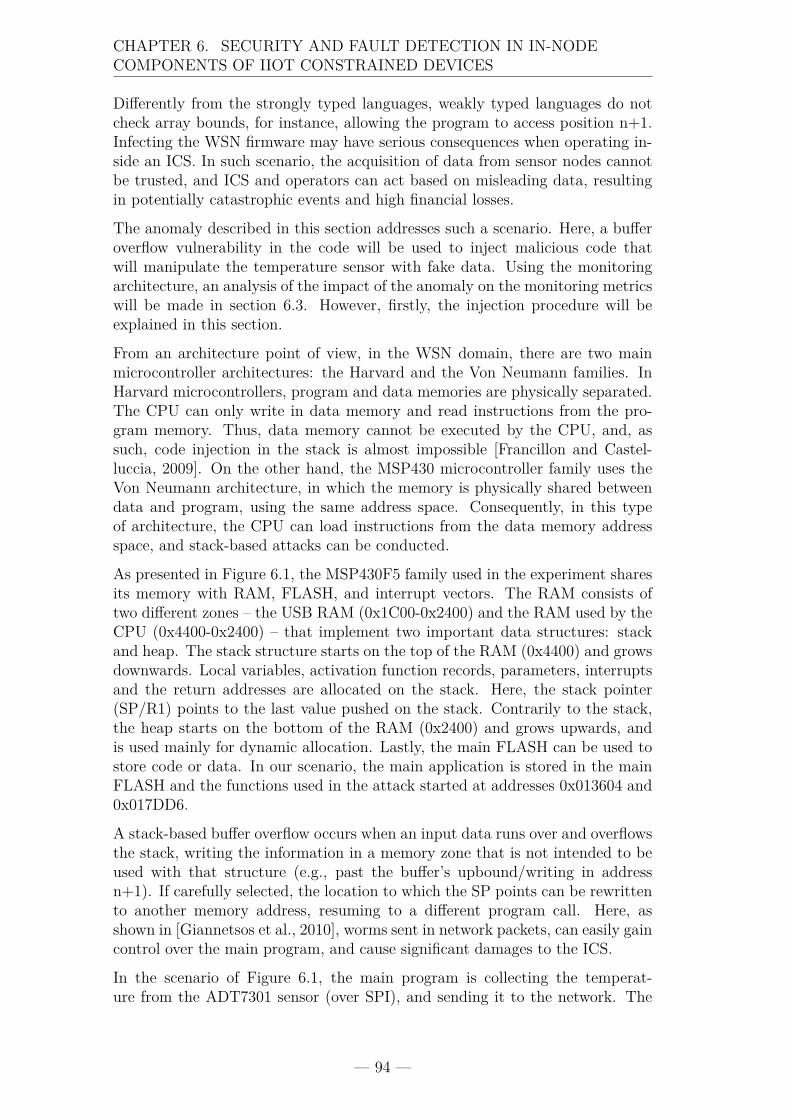
CHAPTER 6. SECURITY AND FAULT DETECTION IN IN-NODECOMPONENTS OF IIOT CONSTRAINED DEVICES
Differently from the strongly typed languages, weakly typed languages do notcheck array bounds, for instance, allowing the program to access position n+1.Infecting the WSN firmware may have serious consequences when operating in-side an ICS. In such scenario, the acquisition of data from sensor nodes cannotbe trusted, and ICS and operators can act based on misleading data, resultingin potentially catastrophic events and high financial losses.
The anomaly described in this section addresses such a scenario. Here, a bufferoverflow vulnerability in the code will be used to inject malicious code thatwill manipulate the temperature sensor with fake data. Using the monitoringarchitecture, an analysis of the impact of the anomaly on the monitoring metricswill be made in section 6.3. However, firstly, the injection procedure will beexplained in this section.
From an architecture point of view, in the WSN domain, there are two mainmicrocontroller architectures: the Harvard and the Von Neumann families. InHarvard microcontrollers, program and data memories are physically separated.The CPU can only write in data memory and read instructions from the pro-gram memory. Thus, data memory cannot be executed by the CPU, and, assuch, code injection in the stack is almost impossible [Francillon and Castel-luccia, 2009]. On the other hand, the MSP430 microcontroller family uses theVon Neumann architecture, in which the memory is physically shared betweendata and program, using the same address space. Consequently, in this typeof architecture, the CPU can load instructions from the data memory addressspace, and stack-based attacks can be conducted.
As presented in Figure 6.1, the MSP430F5 family used in the experiment sharesits memory with RAM, FLASH, and interrupt vectors. The RAM consists oftwo different zones – the USB RAM (0x1C00-0x2400) and the RAM used by theCPU (0x4400-0x2400) – that implement two important data structures: stackand heap. The stack structure starts on the top of the RAM (0x4400) and growsdownwards. Local variables, activation function records, parameters, interruptsand the return addresses are allocated on the stack. Here, the stack pointer(SP/R1) points to the last value pushed on the stack. Contrarily to the stack,the heap starts on the bottom of the RAM (0x2400) and grows upwards, andis used mainly for dynamic allocation. Lastly, the main FLASH can be used tostore code or data. In our scenario, the main application is stored in the mainFLASH and the functions used in the attack started at addresses 0x013604 and0x017DD6.
A stack-based buffer overflow occurs when an input data runs over and overflowsthe stack, writing the information in a memory zone that is not intended to beused with that structure (e.g., past the buffer’s upbound/writing in addressn+1). If carefully selected, the location to which the SP points can be rewrittento another memory address, resuming to a different program call. Here, asshown in [Giannetsos et al., 2010], worms sent in network packets, can easily gaincontrol over the main program, and cause significant damages to the ICS.
In the scenario of Figure 6.1, the main program is collecting the temperat-ure from the ADT7301 sensor (over SPI), and sending it to the network. The
— 94 —
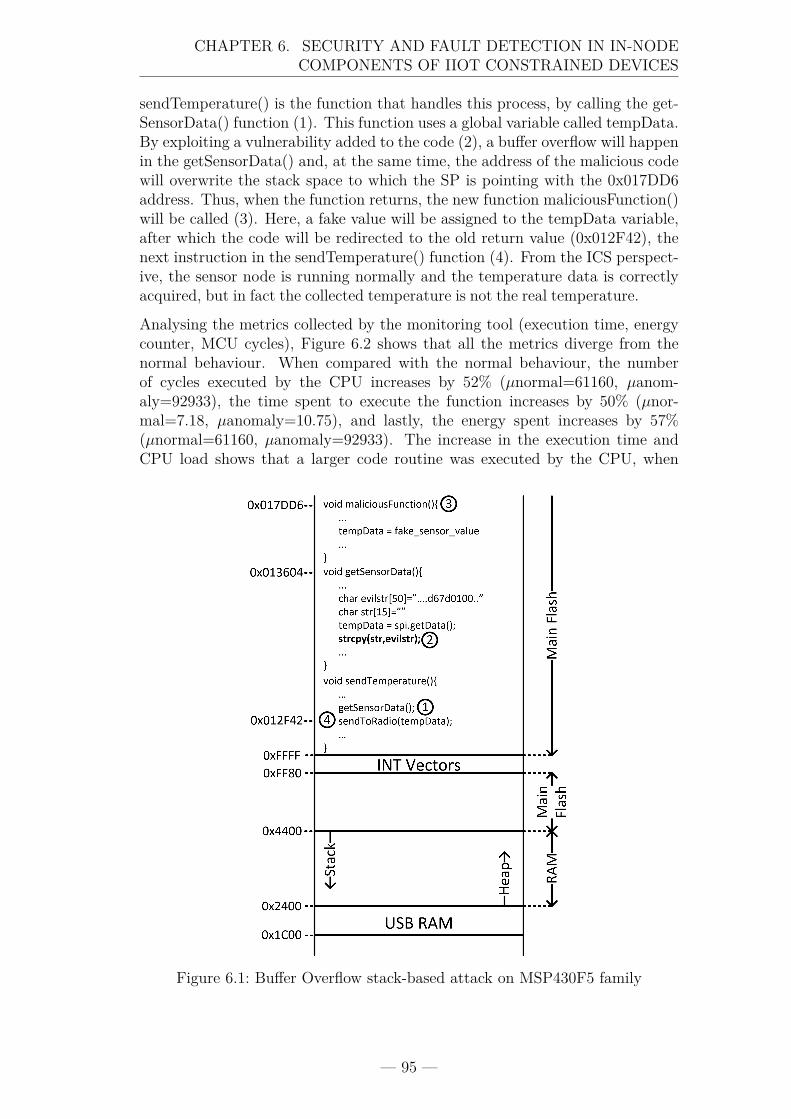
CHAPTER 6. SECURITY AND FAULT DETECTION IN IN-NODECOMPONENTS OF IIOT CONSTRAINED DEVICES
sendTemperature() is the function that handles this process, by calling the get-SensorData() function (1). This function uses a global variable called tempData.By exploiting a vulnerability added to the code (2), a buffer overflow will happenin the getSensorData() and, at the same time, the address of the malicious codewill overwrite the stack space to which the SP is pointing with the 0x017DD6address. Thus, when the function returns, the new function maliciousFunction()will be called (3). Here, a fake value will be assigned to the tempData variable,after which the code will be redirected to the old return value (0x012F42), thenext instruction in the sendTemperature() function (4). From the ICS perspect-ive, the sensor node is running normally and the temperature data is correctlyacquired, but in fact the collected temperature is not the real temperature.
Analysing the metrics collected by the monitoring tool (execution time, energycounter, MCU cycles), Figure 6.2 shows that all the metrics diverge from thenormal behaviour. When compared with the normal behaviour, the numberof cycles executed by the CPU increases by 52% (µnormal=61160, µanom-aly=92933), the time spent to execute the function increases by 50% (µnor-mal=7.18, µanomaly=10.75), and lastly, the energy spent increases by 57%(µnormal=61160, µanomaly=92933). The increase in the execution time andCPU load shows that a larger code routine was executed by the CPU, when
Figure 6.1: Buffer Overflow stack-based attack on MSP430F5 family
— 95 —
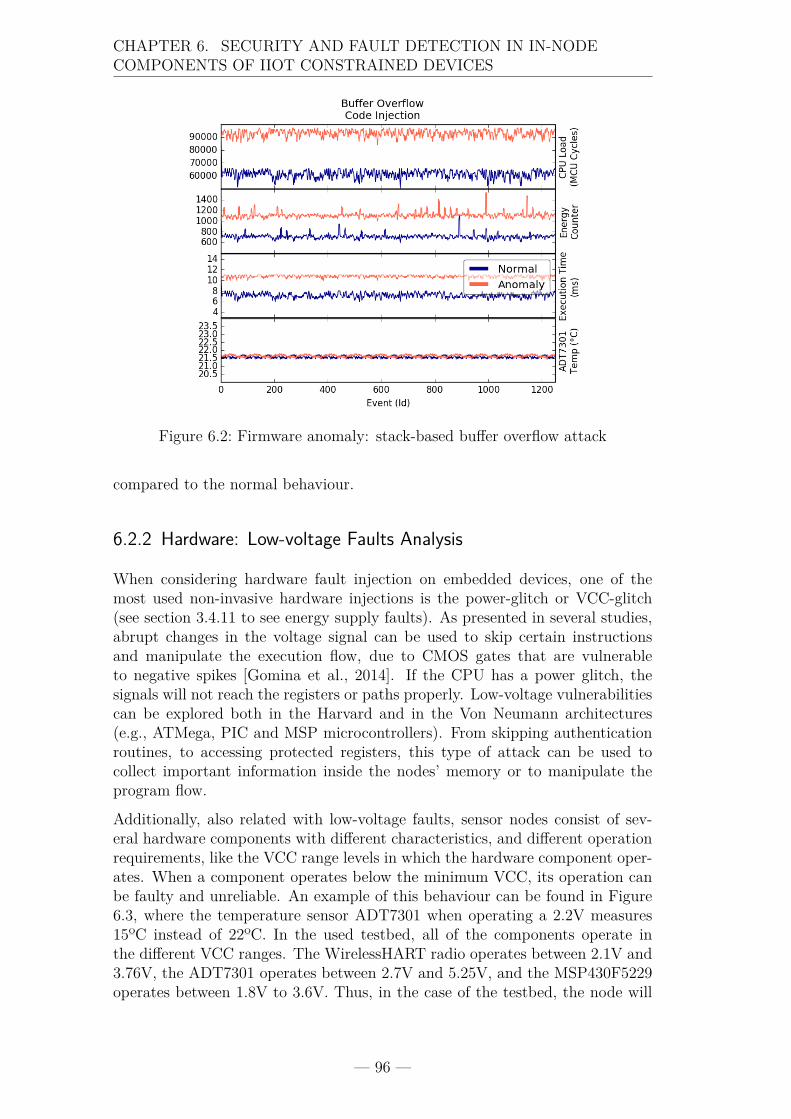
CHAPTER 6. SECURITY AND FAULT DETECTION IN IN-NODECOMPONENTS OF IIOT CONSTRAINED DEVICES
Figure 6.2: Firmware anomaly: stack-based buffer overflow attack
compared to the normal behaviour.
6.2.2 Hardware: Low-voltage Faults Analysis
When considering hardware fault injection on embedded devices, one of themost used non-invasive hardware injections is the power-glitch or VCC-glitch(see section 3.4.11 to see energy supply faults). As presented in several studies,abrupt changes in the voltage signal can be used to skip certain instructionsand manipulate the execution flow, due to CMOS gates that are vulnerableto negative spikes [Gomina et al., 2014]. If the CPU has a power glitch, thesignals will not reach the registers or paths properly. Low-voltage vulnerabilitiescan be explored both in the Harvard and in the Von Neumann architectures(e.g., ATMega, PIC and MSP microcontrollers). From skipping authenticationroutines, to accessing protected registers, this type of attack can be used tocollect important information inside the nodes’ memory or to manipulate theprogram flow.
Additionally, also related with low-voltage faults, sensor nodes consist of sev-eral hardware components with different characteristics, and different operationrequirements, like the VCC range levels in which the hardware component oper-ates. When a component operates below the minimum VCC, its operation canbe faulty and unreliable. An example of this behaviour can be found in Figure6.3, where the temperature sensor ADT7301 when operating a 2.2V measures15ºC instead of 22ºC. In the used testbed, all of the components operate inthe different VCC ranges. The WirelessHART radio operates between 2.1V and3.76V, the ADT7301 operates between 2.7V and 5.25V, and the MSP430F5229operates between 1.8V to 3.6V. Thus, in the case of the testbed, the node will
— 96 —
CHAPTER 6. SECURITY AND FAULT DETECTION IN IN-NODECOMPONENTS OF IIOT CONSTRAINED DEVICES
Figure 6.3: Hardware based anomaly: undervolting anomaly
only lose connection with the network if the WirelessHART radio operates below2.1V. Until then, wrong temperature readings will be sent to the ICS.
In this scenario, several VCC levels were configured in the TPS62740EVM-186boost converter using the appropriate jumper scheme, in order to understandthe impact of a low-voltage scenario on the temperature sensor readings and onthe collected metrics, as shown in the Figure 6.3.
From the normal 3.3V VCC level, to the lowest 2.2V, the energy counter in-creases by 43% (µnormal=710; µanomaly(2.2V)=1019). The increase in thismetric is associated with the increase in the current consumed by the MSP430.Specifically, this microprocessor has a dedicated low-dropout voltage regulator,LDO, to power the core. By reducing the input VCC, the efficiency of theinternal LDO will be lower, consuming more energy to guarantee the sameVCORE.
6.2.3 Hardware: SPI Faults
Serial Peripheral Interface (SPI) uses a master-slave paradigm, and can be foundin embedded systems to communicate between chips like RAM memory, or othercomponents like sensors. The main advantages of this type of communicationare its simplicity and high bandwidth, when compared to other technologies,such as UART. An SPI data bus has Clock (CLK), Master Input Slave Output(MISO), Master Output Slave Input (MOSI) and Slave Select (SS) data lines.Communication starts when the master device pulls the SS line down, wakingup the slave device. Then, the master issues a train of clock pulses, and willcontinue to do so until the end of the communication. The master starts the
— 97 —
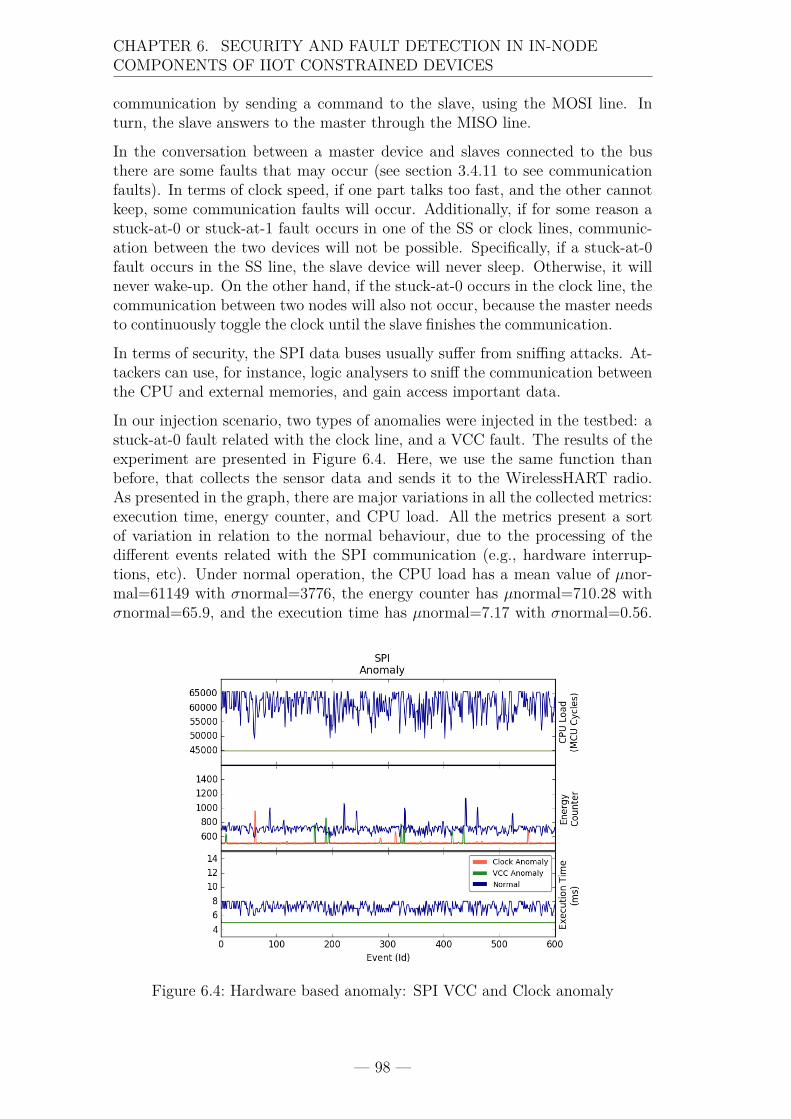
CHAPTER 6. SECURITY AND FAULT DETECTION IN IN-NODECOMPONENTS OF IIOT CONSTRAINED DEVICES
communication by sending a command to the slave, using the MOSI line. Inturn, the slave answers to the master through the MISO line.
In the conversation between a master device and slaves connected to the busthere are some faults that may occur (see section 3.4.11 to see communicationfaults). In terms of clock speed, if one part talks too fast, and the other cannotkeep, some communication faults will occur. Additionally, if for some reason astuck-at-0 or stuck-at-1 fault occurs in one of the SS or clock lines, communic-ation between the two devices will not be possible. Specifically, if a stuck-at-0fault occurs in the SS line, the slave device will never sleep. Otherwise, it willnever wake-up. On the other hand, if the stuck-at-0 occurs in the clock line, thecommunication between two nodes will also not occur, because the master needsto continuously toggle the clock until the slave finishes the communication.
In terms of security, the SPI data buses usually suffer from sniffing attacks. At-tackers can use, for instance, logic analysers to sniff the communication betweenthe CPU and external memories, and gain access important data.
In our injection scenario, two types of anomalies were injected in the testbed: astuck-at-0 fault related with the clock line, and a VCC fault. The results of theexperiment are presented in Figure 6.4. Here, we use the same function thanbefore, that collects the sensor data and sends it to the WirelessHART radio.As presented in the graph, there are major variations in all the collected metrics:execution time, energy counter, and CPU load. All the metrics present a sortof variation in relation to the normal behaviour, due to the processing of thedifferent events related with the SPI communication (e.g., hardware interrup-tions, etc). Under normal operation, the CPU load has a mean value of µnor-mal=61149 with σnormal=3776, the energy counter has µnormal=710.28 withσnormal=65.9, and the execution time has µnormal=7.17 with σnormal=0.56.
Figure 6.4: Hardware based anomaly: SPI VCC and Clock anomaly
— 98 —
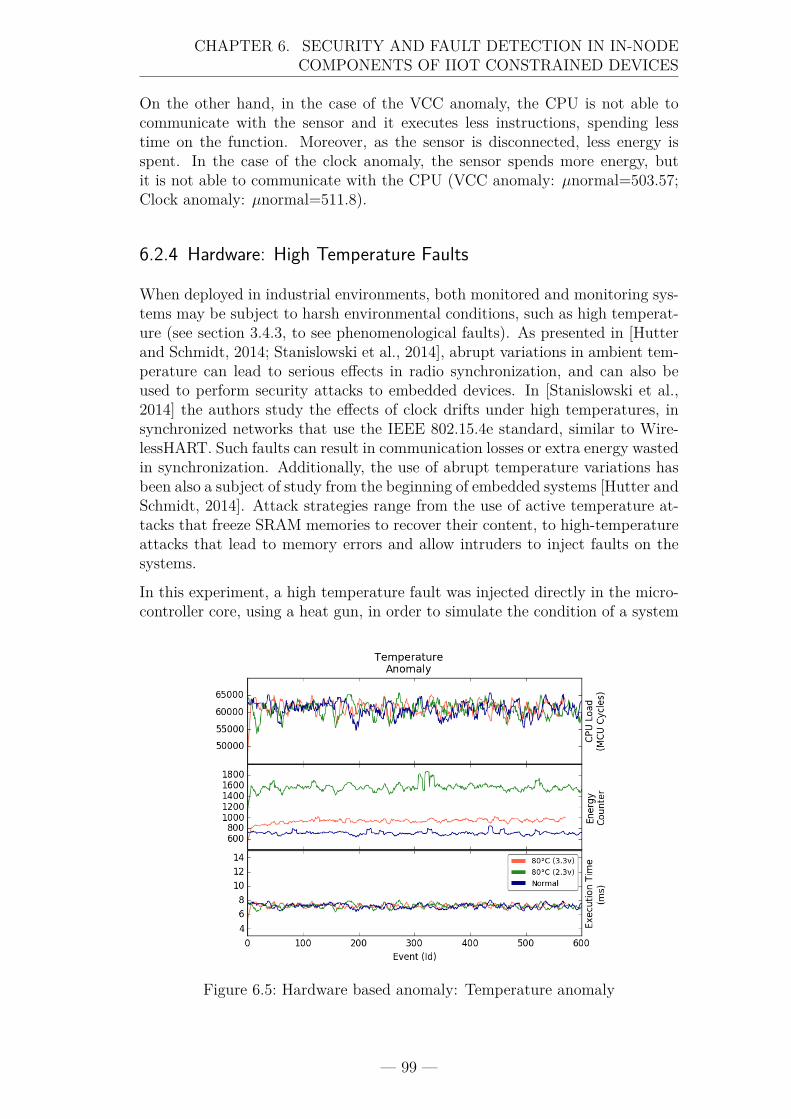
CHAPTER 6. SECURITY AND FAULT DETECTION IN IN-NODECOMPONENTS OF IIOT CONSTRAINED DEVICES
On the other hand, in the case of the VCC anomaly, the CPU is not able tocommunicate with the sensor and it executes less instructions, spending lesstime on the function. Moreover, as the sensor is disconnected, less energy isspent. In the case of the clock anomaly, the sensor spends more energy, butit is not able to communicate with the CPU (VCC anomaly: µnormal=503.57;Clock anomaly: µnormal=511.8).
6.2.4 Hardware: High Temperature Faults
When deployed in industrial environments, both monitored and monitoring sys-tems may be subject to harsh environmental conditions, such as high temperat-ure (see section 3.4.3, to see phenomenological faults). As presented in [Hutterand Schmidt, 2014; Stanislowski et al., 2014], abrupt variations in ambient tem-perature can lead to serious effects in radio synchronization, and can also beused to perform security attacks to embedded devices. In [Stanislowski et al.,2014] the authors study the effects of clock drifts under high temperatures, insynchronized networks that use the IEEE 802.15.4e standard, similar to Wire-lessHART. Such faults can result in communication losses or extra energy wastedin synchronization. Additionally, the use of abrupt temperature variations hasbeen also a subject of study from the beginning of embedded systems [Hutter andSchmidt, 2014]. Attack strategies range from the use of active temperature at-tacks that freeze SRAM memories to recover their content, to high-temperatureattacks that lead to memory errors and allow intruders to inject faults on thesystems.
In this experiment, a high temperature fault was injected directly in the micro-controller core, using a heat gun, in order to simulate the condition of a system
Figure 6.5: Hardware based anomaly: Temperature anomaly
— 99 —
CHAPTER 6. SECURITY AND FAULT DETECTION IN IN-NODECOMPONENTS OF IIOT CONSTRAINED DEVICES
under high temperature. The MSP430F5229 microcontroller can operate in afree-air range between -40ºC to 85ºC, and a storage memory between -55ºC to150ºC. In the experiment, the surface temperature of the core die was main-tained during 1 hour to its maximum (85ºC). As in the previous experiments,the execution time, the energy counter, and the CPU load metrics were collectedfor the same function. Here, the temperature sensor was put far away from theheating point, in order not to affect the ambient temperature collected by theADT7301 sensor.
As can be seen in Figure 6.5, there are some major variations in the en-ergy counter when the microcontroller operates under high temperature (µnor-mal=710.54; µanomaly(3.3V)=933.58), as expected. In [Borgeson et al., 2012],the authors claim that temperature is one of the most overlooked features insystems design, and in some cases the current can increase 10 to 15 times underextreme temperatures. This is similar to what happens during a low-voltagestate (2.3V) (see Figure 4 6.3). On the other hand, the CPU load and executiontime metrics do not show any evidence of errors when compared the normalcase. As mentioned in [Hutter and Schmidt, 2014], memory errors and faultsare only expected to occur when the storage temperature exceeds 150ºC.
6.3 Detecting Anomalies And Security Threats
As seen in the previous sections, industrial wireless sensor networks are notimmune to security threats and faults, which points to the need of Intrusion De-tection Systems (IDS), anomaly detection, and monitoring tools. In this section,experimental results from three anomaly detection approaches will be presented,with the aim of demonstrating that the proposed monitoring approach is suit-able for building tools capable of detecting firmware and hardware faults. Theselected anomaly detection approaches were the following: a linear-based model(the One-Class Support Vector Machine, OCSVM); a proximity-based model(the k-Nearest Neighbours, kNN); and a neural-network based model (AutoEn-conder). These approaches are presented in subsection 6.3.1. Subsection 6.3.2discusses the obtained results.
6.3.1 Data Splitting Strategy and Classifiers
In machine learning, the selection of the algorithm and the splitting strategy ofthe data depend on the type of available data and on the approach to follow inorder to solve the specific problem. There are two main approaches: supervisedlearning, used when the available data is labelled (the classifier is trained forall the classes); and unsupervised learning, used when the data is not labelled(similar to the approach followed in chapter 5). In the latter approach, groupingtechniques like clustering are used for classifying data in a specific group or class,using distance measures.
— 100 —
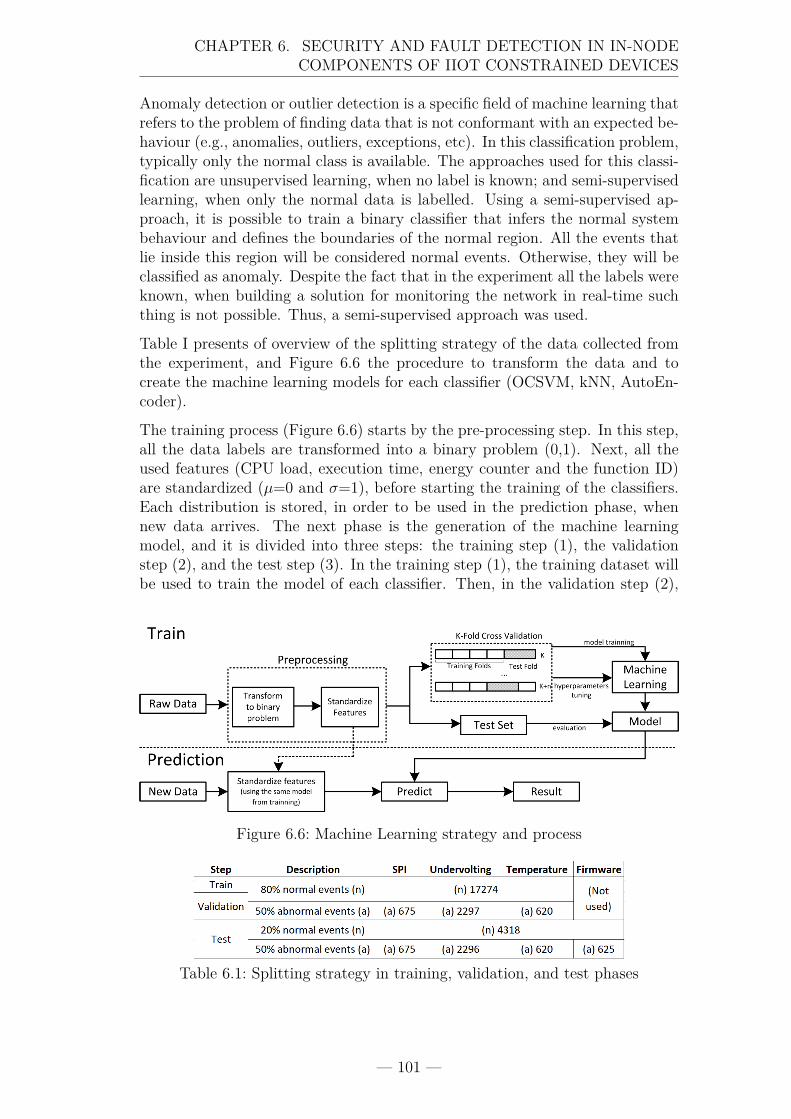
CHAPTER 6. SECURITY AND FAULT DETECTION IN IN-NODECOMPONENTS OF IIOT CONSTRAINED DEVICES
Anomaly detection or outlier detection is a specific field of machine learning thatrefers to the problem of finding data that is not conformant with an expected be-haviour (e.g., anomalies, outliers, exceptions, etc). In this classification problem,typically only the normal class is available. The approaches used for this classi-fication are unsupervised learning, when no label is known; and semi-supervisedlearning, when only the normal data is labelled. Using a semi-supervised ap-proach, it is possible to train a binary classifier that infers the normal systembehaviour and defines the boundaries of the normal region. All the events thatlie inside this region will be considered normal events. Otherwise, they will beclassified as anomaly. Despite the fact that in the experiment all the labels wereknown, when building a solution for monitoring the network in real-time suchthing is not possible. Thus, a semi-supervised approach was used.
Table I presents of overview of the splitting strategy of the data collected fromthe experiment, and Figure 6.6 the procedure to transform the data and tocreate the machine learning models for each classifier (OCSVM, kNN, AutoEn-coder).
The training process (Figure 6.6) starts by the pre-processing step. In this step,all the data labels are transformed into a binary problem (0,1). Next, all theused features (CPU load, execution time, energy counter and the function ID)are standardized (µ=0 and σ=1), before starting the training of the classifiers.Each distribution is stored, in order to be used in the prediction phase, whennew data arrives. The next phase is the generation of the machine learningmodel, and it is divided into three steps: the training step (1), the validationstep (2), and the test step (3). In the training step (1), the training dataset willbe used to train the model of each classifier. Then, in the validation step (2),
Figure 6.6: Machine Learning strategy and process
Table 6.1: Splitting strategy in training, validation, and test phases
— 101 —
CHAPTER 6. SECURITY AND FAULT DETECTION IN IN-NODECOMPONENTS OF IIOT CONSTRAINED DEVICES
the model will be evaluated used the validation dataset. To ensure less bias, andto test how the model handles new data, the k-fold cross validation techniquewas used (k=5), to tune the model hyperparameters. The best hyperparameterswill be selected based on the best f1 score mean (k=5). Finally, in the test step(3), the classifier will be tested using the performance metrics presented in table6.2.
Table 6.1 shows how the data was divided in each phase. In the training step,80% of normal events were randomly selected for training and validation (17274events). 50% of anomalies were used in the validation phase, in order to evaluatethe classifier (SPI:675, Undervolting:2297, Temperature:620). The test used theremaining 20% of normal events (4318 events) and 50% of anomalies (SPI:675,Undervolting:2296, Temperature:620) were used for the test phase. The firm-ware data (625 events) was intentionally not used in the training and validationphases, in order to show how the classifiers handle different anomalies not usedin the validation step. The model was then saved and ready to use in the pre-diction phase. The process was developed using Python, with the scikit-learnframework.
Lastly, using a point anomaly approach, three distinct classification approacheswere selected: the OCSVM, the kNN, and the AutoEncoder. OCSVM is one ofthe most used classifiers in anomaly detection. When used in a semi-supervisedapproach, like the one followed in this article, the classifier creates a model forthe normal data, using the normal data training dataset only. To create themodel, several hyperparameters need to be configured. To select the most ap-propriate parameters, a grid-search was conducted, in the k-fold cross validationstep with the parameters ν and γ. The ν parameter controls the percentage ofanomalies in the normal dataset. Additionally, the γ parameter defines how farthe influence of a single training example reaches (low means far, and high meansclose). All the remaining parameters were used in the default mode. Differentlyfrom OCSVM, the kNN classifier is a nearest-neighbour-based technique, whichuses distance metrics to compute the distance of a specific data point to the kthnearest neighbour as the anomaly score (the classifier uses one of the simplestapproaches in the anomaly detection field). A grid-search was performed in or-der to select the best k. Lastly, a neural network classifier was used, namelyAutoEncoder, which is a specific type of multi-layer neural network that per-forms hierarchical and nonlinear dimensionality reduction of the data, using thesame number of nodes at the input and output networks. The idea behind theuse of this approach in anomaly detection is to train the output to reconstructthe input, using the normal data, as closely as possible. Thus, if the network isable to reproduce the normal data, when an anomaly occurs in the system thenetwork will be not able to reproduce it, and the resulting error will be large.To train the classifier, a grid-search was also conducted, with different hiddenlayers and epochs.
— 102 —
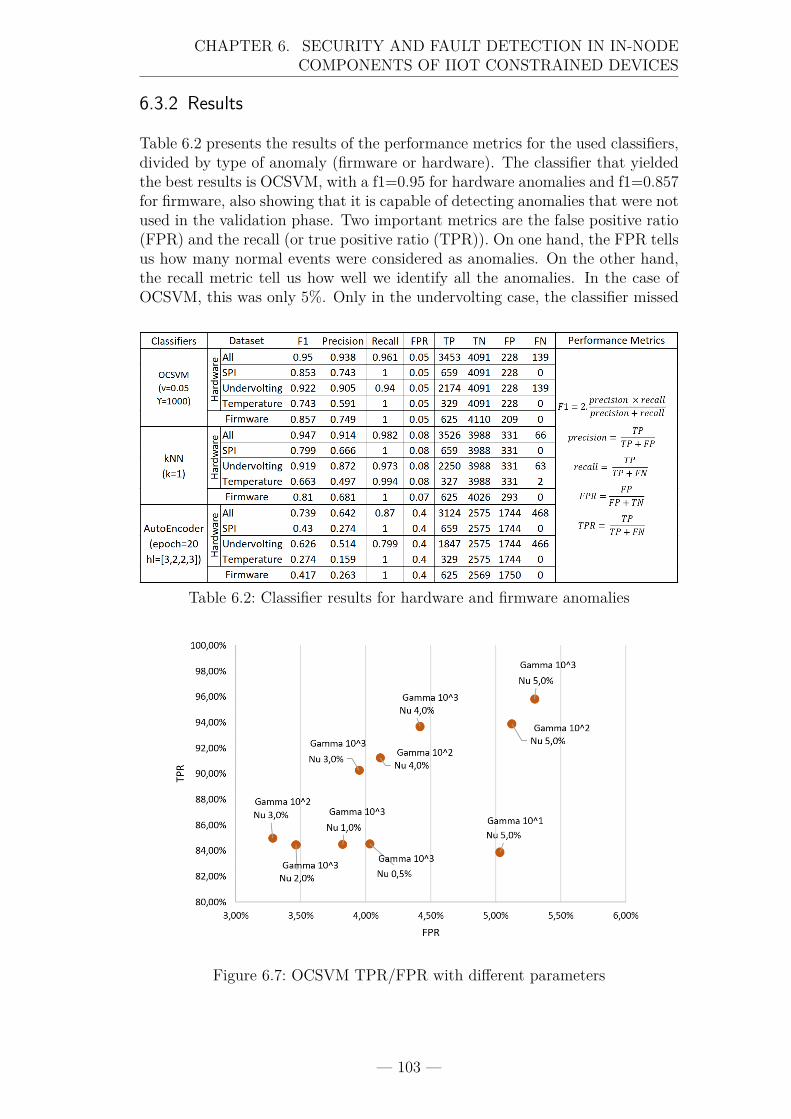
CHAPTER 6. SECURITY AND FAULT DETECTION IN IN-NODECOMPONENTS OF IIOT CONSTRAINED DEVICES
6.3.2 Results
Table 6.2 presents the results of the performance metrics for the used classifiers,divided by type of anomaly (firmware or hardware). The classifier that yieldedthe best results is OCSVM, with a f1=0.95 for hardware anomalies and f1=0.857for firmware, also showing that it is capable of detecting anomalies that were notused in the validation phase. Two important metrics are the false positive ratio(FPR) and the recall (or true positive ratio (TPR)). On one hand, the FPR tellsus how many normal events were considered as anomalies. On the other hand,the recall metric tell us how well we identify all the anomalies. In the case ofOCSVM, this was only 5%. Only in the undervolting case, the classifier missed
Table 6.2: Classifier results for hardware and firmware anomalies
Figure 6.7: OCSVM TPR/FPR with different parameters
— 103 —
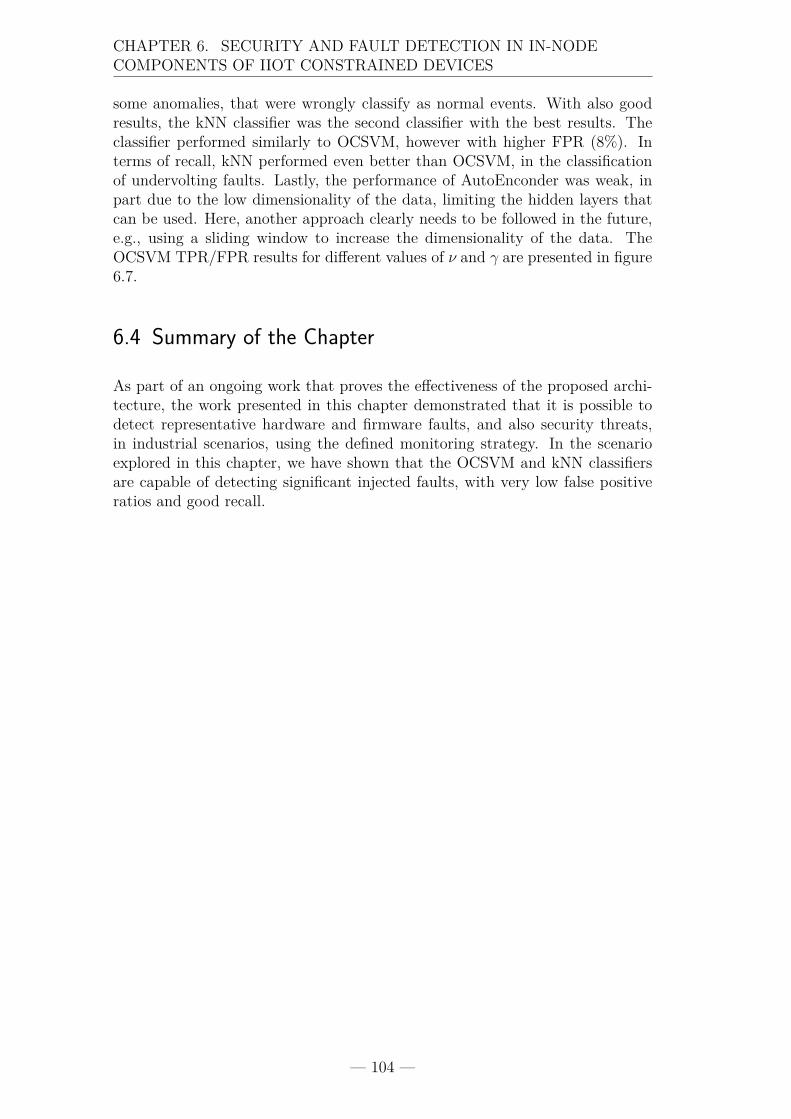
CHAPTER 6. SECURITY AND FAULT DETECTION IN IN-NODECOMPONENTS OF IIOT CONSTRAINED DEVICES
some anomalies, that were wrongly classify as normal events. With also goodresults, the kNN classifier was the second classifier with the best results. Theclassifier performed similarly to OCSVM, however with higher FPR (8%). Interms of recall, kNN performed even better than OCSVM, in the classificationof undervolting faults. Lastly, the performance of AutoEnconder was weak, inpart due to the low dimensionality of the data, limiting the hidden layers thatcan be used. Here, another approach clearly needs to be followed in the future,e.g., using a sliding window to increase the dimensionality of the data. TheOCSVM TPR/FPR results for different values of ν and γ are presented in figure6.7.
6.4 Summary of the Chapter
As part of an ongoing work that proves the effectiveness of the proposed archi-tecture, the work presented in this chapter demonstrated that it is possible todetect representative hardware and firmware faults, and also security threats,in industrial scenarios, using the defined monitoring strategy. In the scenarioexplored in this chapter, we have shown that the OCSVM and kNN classifiersare capable of detecting significant injected faults, with very low false positiveratios and good recall.
— 104 —

Chapter 7Conclusions and Future Work
”A conclusion is the placewhere you got tired thinking.”
(Martin H. Fischer)
Contents7.1 Synthesis of the Thesis . . . . . . . . . . . . . . . . . 1067.2 Future Work . . . . . . . . . . . . . . . . . . . . . . . 108
— 105 —
CHAPTER 7. CONCLUSIONS AND FUTURE WORK
T he industrial field is experiencing a great transformation, in termsof technologies, applications and threats. Current technologies keepincreasing their processing and memory capabilities, improving the
low power consumption, but with an important drawback, its complexity andfault prone nature. At the same time, with the demand of CPS applications,new hardware starts to incorporate specific AI components that confer micro-intelligence to IoT devices, instead of relying on centralized models. As presen-ted, hardware manufacturers like ARM, operating systems like FreeRTOS, andother key-manufacturers start to understand the need to incorporate monitoringtools in their platforms. Thus, it is expected in the following years new typesof monitoring tools for these systems, like the one proposed in this thesis. Thischapter summarizes and resumes all the contributions of the work performed.Additionally, at the end, a forward-looking perspective will be conducted, bypresenting some future work related with the proposed architecture.
7.1 Synthesis of the Thesis
Industrial wireless technologies like ZigBee, ISA100.11a, WIA-PA, and Wire-lessHART were designed to fulfil the low latency requirements needed by in-dustrial systems. Despite the growing use of these technologies in such envir-onments, there is a lack of monitoring tools capable to identify and preventfaults, lowering the availability of these systems. Such shortage happens dueto an important fact: current operating systems and hardware architectures arefragmented, making it difficult to build a general monitoring model to the fourmain standards. In order to propose such monitor architecture, chapter 1 star-ted by identifying these issues, addressing the research challenges that need tobe fulfilled by a new proposal.
The state of the art was presented in chapter 2, as general background. Industrialapplications requirements were revised, in detail, along with legacy wired tech-nologies, IWSN standards, IoT management standards, current diagnostic toolsand techniques, finishing with the efforts made by the industrial and academiccommunity to propose similar solutions. The chapter presented the technologyjourney of industrial systems and monitoring tools, culminating in today’s effortsand proposals. By detailing the technologies, techniques and some of availablesolutions, chapter 2 sustains the proposed model. Not less important, chapter2 presents other small contributions. For instance, the network metrics sharedby these standards for routing purpose are presented and described. This is oneof the contributions of this thesis, that cannot be found, as far as known, in themost relevant literature.
Monitoring tools are used in order to increase the MTTF of industrial systems,and to prevent security threats, combined with IDS. So, it was important toprovide an appropriate characterization of fault nature in WSNs, that until nowwas missed in the literature. Chapter 3 presented a WSN fault taxonomy, thatnot only characterize, WSN faults, but also the impact of such faults on sensornodes components and systems. Examples of faults were given in each taxonomy
— 106 —
CHAPTER 7. CONCLUSIONS AND FUTURE WORK
viewpoint, to make it clear. In addition, this chapter specified the definition usedfor the concepts of fault, error, failure and anomaly, used in the next chapters.Such contribution was important to chapter 5 and 6, in the selection of faults,when fault injection was used to test the effectiveness of the architecture.
The main contribution of this thesis was presented in chapter 4, when the mon-itoring model was proposed. The architectural model consists of several agentsthat collect in-node metrics and network metrics, sharing these metrics to acentral point, the industrial gateway. During this chapter, all these agents weredescribed, and some monitoring techniques recommended for each one. Thenetwork monitoring relies on the available routing metrics described in chapter2. The firmware monitoring is performed by using instrumentation techniques.Lastly, the hardware state metrics are collected using techniques that can beimplemented in most commonly used hardware architectures (also described inchapter 2). At the end, all the monitoring information is shared at the industrialgateway using existing management protocols (e.g., LWM2M, COMI or REST-CONF). To prove the low impact of the monitoring model, a testbed using theWirelessHART standard was built and the impact of the architecture assessed,by measuring: the overhead of each metric in terms of energy consumption; thememory, processing, and latency overhead added to the main program; the net-work overhead; and lastly, the latency introduced by the instrumentation codein the main program. The results showed that the proposed model can be usedin industrial scenarios, without compromising the sensor node lifetime and themain application execution.
After evaluating the proposed model, chapter 5 presented the first use case, byusing the model in the detection of faults and security attacks to the network.To test the effectiveness of the monitoring model, several faults were injected inthe WirelessHART testbed using a security research toolkit for IEEE802.15.4.Thus, chapter 5 started by making an in depth analysis of the WirelessHARTstandard from a security perspective. Several experiments were conducted usingthe Killerbee research toolkit to test the security of the WirelessHART stand-ard. Through the analysis of the standard and experimentation, an importantattack vector was identified, and tested using this testbed. A new, and notknown attack to the standard was identified, allowing an attacker to conduct anexhaustion attack, by manipulating the information of the advertisement mes-sages. Such discovery, represents an additionally contribution of this chapter,and was used to show the importance of the in-node metrics in the detection.Finally, a detection mechanism using the OCSVM classifier was built. The eval-uation of this classifier showed that it is possible to detect specific attacks andfaults like interferences or jamming with good results, using the sensor in-nodeand the network metrics shared by the standard.
The second and last use case evaluated the effectiveness of the model to detectfaults and security attacks in the firmware and hardware of the sensor nodes.Chapter 6 presented a series of faults and security attacks that can be conductedto the existing IoT technologies. A stack-based overflow attack was conductedagainst the main program, and the impact of this attack was evaluated using themetrics collected by the monitoring testbed. Additionally, from the hardware
— 107 —
CHAPTER 7. CONCLUSIONS AND FUTURE WORK
perspective, several faults were injected: a low-voltage fault, an SPI fault, anda high temperature fault. The impact of each fault was also described and com-pared with the normal behaviour of the sensor node. At the end, similarly tochapter 5, a detection mechanism was also proposed, by comparing several an-omaly detection classifiers: OCSVM, kNN, and the AutoEncoder. The classifierwas built using a semi-supervised approach, allowing the detection mechanism toidentify new attacks that were not used in the training phase. The results showthat the mechanism is able to detect with high recall and false positive ratiothe injected anomalies when using the OCSVM and the K-NN classifiers, prov-ing that the proposed model can be used to detect network/hardware/firmwarefaults and attacks in industrial deployments.
7.2 Future Work
Throughout this thesis, several contributions were made, a new architecture wasproposed and evaluated, and several fault detection mechanisms developed, im-proving the current state of the art in the domain of industrial IoT managementand anomaly detection. Nevertheless, the work performed in this thesis opensmore research questions that need to be answered in a near future, as well asnew insights to some other contributions, that could not be answered duringthe entire process of producing this thesis. Complementary to the various con-tributions of this thesis, several research questions arise. Thus, this section isorganized in two topics. The first topic presents some new insights and minorcontributions that can be added to this thesis in the future. On the other hand,the second topic presents a more futuristic perspective, where the impact of newtechnologies in the current architecture will be discussed.
As future work, the monitoring architecture should be further explored by ex-tending and refining the existing implementation. Although Chapter 4 providesa detailed explanation of the experiments conducted using WirelessHART andexplains how each agent can be adapted to the other relevant technologies, itwas not possible to develop a testbed that incorporated the four standards atonce, in the available time frame, in order to show that the proposed architec-ture can seamlessly monitor equipment complying with each and all of the fourstandards. Additionally, the proposed architecture and agents were designed tobe compatible with several firmware architectures (see chapter 4). Apart fromthe existing operating system fragmentation, another contribution to the follow-ing proposal would be the implementation of these agents in operating systemslike FreeRTOS, Contiki and RiOT. Such contribution would allow showing thatthe proposed model is general and can be deployed in a large variety of IoTdevices, with increased potential for its adoption by developers. For instance, inFreeRTOS, such agents could be used and incorporated in the TraceAlyzer tool,by using the new public Software Development Kit (SDK). The synchronizationbetween in-node metrics is another feature that is missing in the presented test-bed. Chapter 4 presents the industrial standards that can support this feature.Using this additional metric, faults associated with all the network or clusters
— 108 —
CHAPTER 7. CONCLUSIONS AND FUTURE WORK
could be more easily identified. More advance instrumentation techniques, likethose proposed in [Schuster et al., 2014; Dong et al., 2013; Shea et al., 2009], canalso be tested, reducing the code instrumentation time. Better log compressiontechniques can also be explored, in order to reduce the overhead created overthe network. The current approach does not explore any type of log compres-sion. In what concerns hardware architectures, the developed testbed can alsobe extended to incorporate ARM microprocessors with the CoreSight techno-logy. As presented in chapters 2 and 4, this technology provides a rich set ofmonitoring metrics related with hardware and firmware condition, that couldhelp in the identification of more advanced anomalies. Lastly, in chapters 5 and6 a dataset was collected, containing the normal state of the system, along withthe time period of network and in-node anomalies injection. The anomaly de-tection mechanisms were built using a semi-supervised approach with classifierslike OCSVM, kNN and AutoEnconder. By using the same dataset, other ma-chine learning techniques and approaches can be used and compared with theones used in this thesis. For instance, Hidden-Markov chains can be tested tomodel the states of the code during normal behaviour, and detecting anomalieswhen an uncommon jump occurs. Lastly, deep learning techniques can also beexplored.
Cybersecurity is nowadays one of the most important topics in the industrialfield. The use of ICT technology, such as TCP/IP protocols, exposes these sys-tems to new security threats. In the near future, security will certainly be thefeature that will contribute the most to the adoption of monitoring tools, IDS,and machine learning in industrial systems. At the same time, the introduc-tion of more complex and capable hardware, with specific AI components, arecontributing to the CPS concept on which Industry 4.0 is based. Moreover, theintroduction of such components in small microprocessors will also create an op-portunity to have monitoring systems capable of detecting anomalies in sensornodes, or even more advanced methods (e.g., sensor node neighbours comput-ing metrics for regions or sets of nodes). An example of such platforms is theApollo 3 board [Allan, 2019], developed by Google and Ambiq, that is capableto provide edge computing by running TensoFlow lite. By giving such capab-ilities to sensor nodes, it will be possible to create more distributed processingalgorithms, and at the same time reduce the overhead of sharing this informationover the network. The enhancement of these new capabilities will be followed byan even greater reduction of energy consumption in the sensor nodes, by usingBulk Acoustic Wave(BAW) resonators technology, for instance, instead of quartzcrystals technology [Yoshida, 2019]. All of these advances in technologies willallow to have more state metrics inside the sensor nodes, of which the CoreSighttechnology is an example. Future operating systems will incorporate these tech-nologies as interfaces, helping in the development of monitoring architecturesthat can be easily integrated in industrial applications. Other important innov-ation is the appearance of new wireless standards, that rely on open technologieslike 6TiSCH. The standard is based in more common technologies from the IoTdomain, maintaining at the same time the deterministic nature and reliability.Last but not least, there is a remaining issue in the state of the art of thistopic, that should be addressed as future work. In chapter 5, when attacks to
— 109 —

CHAPTER 7. CONCLUSIONS AND FUTURE WORK
the WirelessHART were conducted, the Killerbee toolkit was used, but withoutsynchronization capabilities. In order to prevent more sophisticate attacks tothese networks, tools that stay synchronized with the network are needed, inorder to better assess the security of industrial wireless standards.
— 110 —
Bibliography
Alcaraz, C. and Lopez, J. (2010). A Security Analysis for Wireless Sensor MeshNetworks in Highly Critical Systems. IEEE Transactions on Systems, Man,and Cybernetics, Part C (Applications and Reviews), 40(4):419–428.
Alena, R., Gilstrap, R., Baldwin, J., Stone, T., and Wilson, P. (2011). Faulttolerance in ZigBee wireless sensor networks. In 2011 Aerospace Conference.
Ali, A. and Tixeuil, S. (2010). Advanced Faults Patterns for WSN DependabilityBenchmarking. MSWIM’10 - 13th ACM international conference on Modeling,analysis, and simulation of wireless and mobile systems, page 39.
Allan, A. (2019). Introducing the SparkFun Edge.
Alliance, Z. (2015). Zigbee Specification. Zigbee Alliance website, pages 1–542.
Arm (2017). CoreSight Debug and Trace. http://www.arm.com/products/system-ip/coresight-debug-trace.
Avižienis, A., Laprie, J. C., Randell, B., and Landwehr, C. (2004). Basic conceptsand taxonomy of dependable and secure computing. IEEE Transactions onDependable and Secure Computing.
Baccelli, E., Hahm, O., Günes, M., Wählisch, M., and Schmidt, T. (2013).RIOT OS: Towards an OS for the Internet of Things. In The 32nd IEEEInternational Conference on Computer Communications (INFOCOM 2013),Turin, Italy.
Barry, R. (2018). FreeRTOS, a free open source RTOS for small embedded realtime systems. http://www.freertos.org.
Bayou, L., Espes, D., Cuppens, N., Bayou, L., Espes, D., Cuppens, N., Cuppens-Boulahia, N., and Cuppens, F. (2016). Security analysis of WirelessHARTcommunication scheme. In International Symposium on Foundations andPractice of Security, pages 223–238. Springer.
Bhadriraju, A. R., Bhaumik, S., Lohith, Y. S., Brinda, M. C., Anand, S. V. R.,and Hegde, M. (2012). 6PANview: Application performance conscious net-work monitoring for 6LoWPAN based WSNs. 2012 National Conference onCommunications, NCC 2012.
Bierman, A., Bjorklund, M., and Watsen, K. (2017). Restconf protocol. RFC8040, IETF. https://tools.ietf.org/html/rfc8040.
— 111 —
Bibliography
Birolini, A. (1999). Quality and reliability of technical systems. Reliability,IEEE Transactions on, 48(2):205–206.
Bjorklund, M. (2010). Yang - a data modeling language for the network con-figuration protocol (netconf). RFC 6020, IETF. https://tools.ietf.org/html/rfc6020.
Borgeson, J., Schauer, S., and Diewald, H. (2012). Benchmarking MCU powerconsumption for ultra-low-power applications. Texas Instrum., page 8.
Bormann, C., Ersue, M., and Keranen, A. (2014). Terminology for constrained-node networks. RFC 7228, IETF. https://tools.ietf.org/html/rfc7228.
Bosch, R. (1991). CAN Specification Version 2.0. Rober Bousch GmbH, Postfach,300240:72.
Cao, Q., Abdelzaher, T., Stankovic, J., Whitehouse, K., and Luo, L. (2008).Declarative tracepoints: a programmable and application independent de-bugging system for wireless sensor networks. In Proceedings of the 6th ACMconference on Embedded network sensor systems, pages 85–98. ACM.
Case, J. D., Fedor, M., Schoffstall, M. L., and Davin, J. R. (1990). Simplenetwork management protocol (snmp). STD 15, IETF. https://tools.ietf.org/html/rfc1157.
Chandola, V., Banerjee, A., and Kumar, V. (2012). Anomaly detection fordiscrete sequences: A survey. IEEE Transactions on Knowledge and DataEngineering, 24(5):823–839.
Chang, T., Tuset-Peiro, P., Vilajosana, X., and Watteyne, T. (2016). OpenWSNamp; OpenMote: Demo’ing a Complete Ecosystem for the Industrial Internetof Things. In 2016 13th Annual IEEE International Conference on Sensing,Communication, and Networking (SECON), pages 1–3.
Chang, W. G. and Lin, F. J. (2016). Challenges of incorporating OMA LWM2Mgateway in M2M standard architecture. In 2016 IEEE Conference on Stand-ards for Communications and Networking (CSCN), pages 1–6.
Charles, J. (2018). Killerbee. https://github.com/riverloopsec/killerbee.
Chaturvedi, S. K. (2016). Network Reliability: Measures and Evaluation. Per-formability Engineering Series. Wiley.
Chen, B.-r., Peterson, G., Mainland, G., and Welsh, M. (2008). LiveNet: UsingPassive Monitoring to Reconstruct Sensor Network Dynamics. In Nikoletseas,S. E., Chlebus, B. S., Johnson, D. B., and Krishnamachari, B., editors, Dis-tributed Computing in Sensor Systems: 4th IEEE International Conference,DCOSS 2008 Santorini Island, Greece, June 11-14, 2008 Proceedings, pages79–98. Springer Berlin Heidelberg, Berlin, Heidelberg.
— 112 —
Bibliography
Chouikhi, S., El Korbi, I., Ghamri-Doudane, Y., and Azouz Saidane, L. (2015).A survey on fault tolerance in small and large scale wireless sensor networks.Comput. Commun., 69:22–37.
Cinque, M., Cotroneo, D., Marno, C. D., Russo, S., Testa, A., Barrenetxea,G., Ingelrest, F., Schaefer, G., and Vetterli, M. (2009). Avr-inject: a tool forinjecting faults in wireless sensor networks. In IEEE international Symposiumon parallel and distributed processing (IPDPS), volume 1, pages 1–8.
Coronato, A. and Testa, A. (2013). Approaches of Wireless Sensor Networkdependability assessment. In 2013 Federated Conference on Computer Scienceand Information Systems.
de Souza, L. M. S., Vogt, H., and Beigl, M. (2007). A survey on fault toler-ance in wireless sensor networks. Sap research, braunschweig, germany, pages168–173.
der Stok, P. V., Bierman, A., Veillette, M., and Pelov, A. (2017). CoAP Manage-ment Interface. Technical Report draft-ietf-core-comi-00, Internet EngineeringTask Force.
Do, V. L., Fillatre, L., Nikiforov, I., and Willett, P. (2017). Feature article:security of SCADA systems against cyber–physical attacks. IEEE Aerosp.Electron. Syst. Mag., 32(5):28–45.
Dong, W., Chen, C., Bu, J., Liu, X., and Liu, Y. (2013). D2: Anomaly de-tection and diagnosis in networked embedded systems by program profilingand symptom mining. Proceedings - Real-Time Systems Symposium, pages202–211.
Dong, W., Huang, C., Wang, J., Chen, C., and Bu, J. (2014). Dynamic loggingwith Dylog for networked embedded systems. 2014 11th Annual IEEE Inter-national Conference on Sensing, Communication, and Networking, SECON2014, pages 381–389.
Dunkels, A., Gronvall, B., and Voigt, T. (2004). Contiki - A Lightweight andFlexible Operating System for Tiny Networked Sensors. In Proceedings of the29th Annual IEEE International Conference on Local Computer Networks,LCN ’04, pages 455–462, Washington, DC, USA. IEEE Computer Society.
Dutta, P., Feldmeier, M., Paradiso, J., and Culler, D. (2008). Energy meteringfor free: Augmenting switching regulators for real-time monitoring. In Pro-ceedings - 2008 International Conference on Information Processing in SensorNetworks, IPSN 2008, pages 283–294.
Eclipse (2017). Eclipse Leshan. https://github.com/eclipse/leshan.
Enns, R., Bjorklund, M., Schoenwaelder, J., and Bierman, A. (2011). Networkconfiguration protocol (netconf). RFC 6241, IETF. https://tools.ietf.org/html/rfc6241.
— 113 —
Bibliography
Evans, D. (2011). The Internet of Things: How the Next Evolution of theInternet Is Changing Everything. Cisco Internet Bus. Solut. Gr., (April).
Fairbairn, M. L., Bate, I., and Stankovic, J. A. (2013). Improving the dependab-ility of sensornets. Proceedings - IEEE International Conference on DistributedComputing in Sensor Systems, DCoSS 2013, pages 274–282.
FieldComm (2014). HART Technology Detail. https://fieldcom-mgroup.org/technologies/hart/hart-technology-detail.
Foglietta, C., Masucci, D., Palazzo, C., Santini, R., Panzieri, S., Rosa, L., Cruz,T., and Lev, L. (2018). From Detecting Cyber-Attacks to Mitigating RiskWithin a Hybrid Environment. IEEE Syst. J., 13(1):424–435.
Fovino, I. N., Carcano, A., Masera, M., and Trom-Betta, A. (2009). Design andimplementation of a secure Modbus protocol. In IFIP Adv. Inf. Commun.Technol.
Francillon, A. and Castelluccia, C. (2009). Code injection attacks on harvard-architecture devices. Proceedings of the 15th ACM conference on Computerand communications security (CCS).
Giannetsos, T., Dimitriou, T., Krontiris, I., and Prasad, N. R. (2010). Arbitrarycode injection through self-propagating worms in von Neumann architecturedevices. Comput. J., 53(10):1576–1593.
Gomina, K., Rigaud, J. B., Gendrier, P., Candelier, P., and Tria, A. (2014).Power supply glitch attacks: Design and evaluation of detection circuits.Proc. 2014 IEEE Int. Symp. Hardware-Oriented Secur. Trust. HOST 2014,1:136–141.
Granjal, J., Monteiro, E., and Silva, J. S. (2015). Security for the Internet ofThings: A Survey of Existing Protocols and Open Research Issues. IEEECommunications Surveys Tutorials, 17(3):1294–1312.
Graveto, V., Rosa, L., Cruz, T., and Simões, P. (2019). A stealth monitor-ing mechanism for cyber-physical systems. Int. J. Crit. Infrastruct. Prot.,24:126–143.
Grimaldi, S., Gidlund, M., Lennvall, T., and Barac, F. (2016). Detecting com-munication blackout in industrial Wireless Sensor Networks. IEEE Interna-tional Workshop on Factory Communication Systems - Proceedings, WFCS,2016-June.
Gungor, V. and Hancke, G. (2009). Industrial Wireless Sensor Networks: Chal-lenges, Design Principles, and Technical Approaches. IEEE Trans. IndustrialElectronics, 56(10):4258–4265.
Hahm, O., Baccelli, E., Petersen, H., and Tsiftes, N. (2016). Operating Systemsfor Low-End Devices in the Internet of Things: A Survey. IEEE Internet ofThings Journal, 3(5):720–734.
— 114 —
Bibliography
Holenderski, M., Van Den Heuvel, M., Bril, R. J., and Lukkien, J. J. (2010).Grasp: Tracing, visualizing and measuring the behavior of real-time systems.In International Workshop on Analysis Tools and Methodologies for Embeddedand Real-time Systems (WATERS), pages 37–42.
Hutter, M. and Schmidt, J. M. (2014). The temperature side channel and heatingfault attacks. Lect. Notes Comput. Sci. (including Subser. Lect. Notes Artif.Intell. Lect. Notes Bioinformatics), 8419 LNCS:219–235.
IEC (2010). Industrial communication networks - Wireless communication net-work and communication profiles - WirelessHART, IEC 62591:2010. Technicalreport, International Electrotechnical Commission, Geneva, Switzerland.
IEC (2015). Industrial networks - Wireless communication network and commu-nication profiles - WIA-PA, IEC 62601:2015. Technical report, InternationalElectrotechnical Commission, Geneva, Switzerland.
IEEE (2002). IEEE 802.15.1-2002 IEEE Standard for information technology -Telecommunication and information exchange between systems - LAN/MAN- Part 15.1: Wireless Medium Access Control (MAC) and Physical Layer(PHY) specifications for Wireless Personal Area Networks.
IEEE (2006). Local and metropolitan area networks– Specific requirements–Part 15.4: Wireless Medium Access Control (MAC) and Physical Layer (PHY)Specifications for Low Rate Wireless Personal Area Networks (WPANs),IEEE802.15.4-2006. Technical report, Institute of Electrical and ElectronicsEngineers.
IEEE Std (1994). IEEE Standard Classification for Software Anomalies. IEEEStd 1044-1993, pages i–.
Instruments, T. (2017a). CC2430 Single-Chip 2.4GHz IEEE 802.15.4 Compliantand Zigbee Ready RF Transceiver. http://www.ti.com/product/CC2420.
Instruments, T. (2017b). CC2650 SimpleLink multi-standard 2.4 GHz ultra-lowpower wireless MCU. http://www.ti.com/product/CC2650.
Instruments, T. (2017c). Code Composer Studio (CCS) Integrated DevelopmentEnvironment (IDE). http://www.ti.com/tool/ccstudio.
Instruments, T. (2017d). MSP EnergyTrace Technology. http://www.ti.com/tool/energytrace.
Instruments, T. (2019). MSP Driver Library. http://www.ti.com/tool/MSP-DRIVERLIB.
ISA (1972). ISA50, Signal Compatibility of Electrical Instruments. https://www.isa.org/isa50/.
ISA (2009). Wireless systems for industrial automation: Process control andrelated applications, ANSI/ISA-100.11a-2009. Technical report, InternationalSociety of Automation.
— 115 —
Bibliography
Islam, K., Shen, W., Member, S., Wang, X., and Member, S. (2012). Wirelesssensor network reliability and security in factory automation: A survey. IEEETransactions on Systems, Man and Cybernetics Part C: Applications andReviews, 42(6):1243–1256.
ISO/IEC 7498-4 (1989). Information Processing Systems - Open Systems In-terconnection - Basic Reference Model - Part 4 : Management Framework.International Organization for Standardization.
Jalote, P. (1994). Fault Tolerance in Distributed Systems. Prentice-Hall, Inc.,Upper Saddle River, NJ, USA.
Jose Da Cunha, M., De Almeira, M. B., Fernandes, R. F., and Carrijo, R. S.(2017). Proposal for an IoT architecture in industrial processes. 2016 12thIEEE International Conference on Industry Applications, INDUSCON 2016.
Kelava, M., Gavranić, I., and Deškin, J. (2008). Practical experience with in-spection in plants at risk of explosive atmospheres. 5th PCIC Europe 2008:Petroleum and Chemical Industry Conference Europe.
Khan, M. M. H., Le, H. K., Ahmadi, H., Abdelzaher, T. F., and Han, J. (2008).Dustminer: troubleshooting interactive complexity bugs in sensor networks.Proceedings of the 6th ACM conference on Embedded network sensor systems,pages 99–112.
Khan, M. M. H., Luo, L., Huang, C., and Abdelzaher, T. (2007). SNTS: SensorNetwork Troubleshooting Suite. In Aspnes, J., Scheideler, C., Arora, A.,and Madden, S., editors, Distributed Computing in Sensor Systems: ThirdIEEE International Conference, DCOSS 2007, Santa Fe, NM, USA, June18-20, 2007. Proceedings, pages 142–157. Springer Berlin Heidelberg, Berlin,Heidelberg.
Kim, A. N., Hekland, F., Petersen, S., and Doyle, P. (2008). When HARTgoes wireless: Understanding and implementing the WirelessHART stand-ard. IEEE International Conference on Emerging Technologies and FactoryAutomation, ETFA, pages 899–907.
Kim, H., Kim, S., Kwon, S., Jo, W., and Shon, T. (2019). A Novel SecurityFramework for Industrial IoT Based on ISA 100.11a. Springer InternationalPublishing.
Kim, S., Lim, H., Lim, S. M., and Shin, I. H. (2018). Study on cyber securityassessment for wireless network at nuclear facilities. 6th Int. Symp. Digit.Forensic Secur. ISDFS 2018 - Proceeding, 2018-Janua:1–5.
Knowles, W., Prince, D., Hutchison, D., Disso, J. F. P., and Jones, K. (2015).A survey of cyber security management in industrial control systems. Int. J.Crit. Infrastruct. Prot., 9:52–80.
Kobayashi, K. (2015). LAWIN: A Latency-AWare InterNet architecture forlatency support on best-effort networks. In 2015 IEEE 16th InternationalConference on High Performance Switching and Routing (HPSR), pages 1–8.
— 116 —
Bibliography
Koushanfar, F., Potkonjak, M., and Sangiovanni-Vincentelli, A. (2003). On-lineFault Detection of Sensor Measurements. Sensors, 2003. Proceedings of IEEE,Vol.2:974–979.
Krunic, V., Trumpler, E., and Han, R. (2007). NodeMD: Diagnosing Node-levelFaults in Remote Wireless Sensor Systems. In Proceedings of the 5th Inter-national Conference on Mobile Systems, Applications and Services, MobiSys’07, pages 43–56, New York, NY, USA. ACM.
Kumar S., A. A., Ovsthus, K., and Kristensen., L. M. (2014). An industrial per-spective on wireless sensor networks-a survey of requirements, protocols, andchallenges. IEEE Communications Surveys and Tutorials, 16(3):1391–1412.
Kunzel, G., Winter, J. M., Muller, I., Pereira, C. E., and Netto, J. C. (2012).Passive monitoring software tool for evaluation of deployed WirelessHARTnetworks. Brazilian Symposium on Computing System Engineering, SBESC,pages 7–12.
Lampin, Q. and Barthel, D. (2018). Sensorlab2: A monitoring framework for IoTnetworks. PEMWN 2017 - 6th IFIP International Conference on PerformanceEvaluation and Modeling in Wired and Wireless Networks, 2018-Janua.
Lodder, M., Halkes, G. P., and Langendoen, K. G. (2008). A global-state per-spective on sensor network debugging. In In HotEmNets.
Luo, L., He, T., Zhou, G., Gu, L., Abdelzaher, T. F., and Stankovic, J. A.(2006). Achieving Repeatability of Asynchronous Events in Wireless SensorNetworks with EnviroLog. In Proceedings IEEE INFOCOM 2006. 25TH IEEEInternational Conference on Computer Communications, pages 1–14.
Ma, R. M. R., Xing, L. X. L., and Michel, H. E. (2006). Fault-Intrusion Tol-erant Techniques in Wireless Sensor Networks. 2006 2nd IEEE InternationalSymposium on Dependable Autonomic and Secure Computing, pages 85–94.
Maglaras, L. A., Kim, K.-H., Janicke, H., Ferrag, M. A., Rallis, S., Fragkou, P.,Maglaras, A., and Cruz, T. J. (2018). Cyber security of critical infrastructures.ICT Express, 4(1):1–4.
Mahapatro, A. and Khilar, P. M. (2013). Fault Diagnosis in WirelessSensor Networks: A Survey. IEEE Communications Surveys & Tutorials,15(4):2000–2026.
Marotta, M. A., Both, C. B., Rochol, J., Granville, L. Z., and Tarouco, L. M. R.(2014). Evaluating management architectures for Internet of Things devices.2014 IFIP Wireless Days (WD), pages 1–7.
McCloghrie, K., Perkins, D., and Schoenwaelder, J. (1999). Structure of man-agement information version 2 (smiv2). STD 58, IETF. https://tools.ietf.org/html/rfc2578.
— 117 —
Bibliography
Miao, X., Liu, K., He, Y., Papadias, D., Ma, Q., and Liu, Y. (2013). AgnosticDiagnosis: Discovering Silent Failures in Wireless Sensor Networks. IEEETransactions on Wireless Communications, 12(12):6067–6075.
Mukhtar, H., Kang-Myo, K., Chaudhry, S. A., Akbar, A. H., Ki-Hyung, K., andYoo, S. W. (2008). LNMP- management architecture for IPv6 based low-powerWireless Personal Area Networks (6LoWPAN). NOMS 2008 - IEEE/IFIPNetwork Operations and Management Symposium: Pervasive Managementfor Ubiquitous Networks and Services, pages 417–424.
Neumann, A., Ehrlich, M., Wisniewski, L., and Jasperneite, J. (2017). Towardsmonitoring of hybrid industrial networks. IEEE International Workshop onFactory Communication Systems - Proceedings, WFCS.
Nobre, M., Silva, I., and Guedes, L. A. (2015). Routing and Scheduling Al-gorithms for WirelessHARTNetworks: A Survey. Sensors (Basel, Switzer-land), 15(5):9703–9740.
OMA (2017). Lightweight Machine to Machine Technical Specification– Ap-proved Version 1.0, OMA. Technical report, Open Mobile Alliance.
OMA (2018). OMA LightweightM2M (LwM2M) Object and Resource Registry.http://www. openmobilealliance.org/wp/OMNA/LwM2M/LwM2MRe-gistry.html.
Palattella, M. R., Thubert, P., Vilajosana, X., Watteyne, T., Wang, Q., andEngel, T. (2014). 6TiSCH Wireless Industrial Networks: Determinism MeetsIPv6. Internet of Things, 9:111–141.
Paradis, L. and Han, Q. (2007). A survey of fault management in wireless sensornetworks. Journal of Network and Systems Management, 15(2):171–190.
Pasqualetti, F., Dörfler, F., and Bullo, F. (2015). Control-theoretic methods forcyberphysical security: Geometric principles for optimal cross-layer resilientcontrol systems. IEEE Control Systems, 35(1):110–127.
Petersen, S. and Carlsen, S. (2011). WirelessHART versus ISA100.11a: Theformat war hits the factory floor. IEEE Industrial Electronics Magazine,5(4):23–34.
Qi, Y., Li, W., Luo, X., and Wang, Q. (2014). Security analysis of WIA-PAprotocol. In Lecture Notes in Electrical Engineering, volume 295 LNEE, pages287–298.
Quan Wang, W. P. (2010). A Finite-State Markov Model for Reliability Evalu-ation of Industrial Wireless Network. Wireless Communications Networkingand Mobile Computing (WiCOM), 2010 6th International Conference, pages2–5.
Ramanathan, N., Chang, K., Kapur, R., Girod, L., Kohler, E., and Estrin, D.(2005). Sympathy for the Sensor Network Debugger. In Proceedings of the
— 118 —
Bibliography
3rd International Conference on Embedded Networked Sensor Systems, SenSys’05, pages 255–267, New York, NY, USA. ACM.
Raposo, D. (2017). WirelessHART network metrics YANG example.https://github.com/dgraposo/wirelesshartnetworkmetrics/blob/master/wirelesshart-network-metrics.yang.
Raza, S., Slabbert, A., Voigt, T., and Landernäs, K. (2009). Security consider-ations for the wirelessHART protocol. ETFA 2009 - 2009 IEEE Conferenceon Emerging Technologies and Factory Automation.
Ringwald, M., Römer, K., and Vitaletti, A. (2006). Snif: Sensor network in-spection framework. Technical Report 535, Department of Computer Science,ETH Zurich.
Robertson, J. and Riley, M. (2018). The big hack: How china used a tiny chipto infiltrate u.s. companies.
Rodenas-Herráiz, D., Fidler, P. R. A., Feng, T., Xu, X., Nawaz, S., and Soga,K. (2017). A handheld diagnostic system for 6lowpan networks. AnnualConference on Wireless On Demand Network Systems and Services (WONS),1:104–111.
Rodrigues, A., Camilo, T., Silva, J. S., and Boavida, F. (2013). Diagnostic toolsfor wireless sensor networks: A comparative survey, volume 21. Springer.
Rodrigues, A., Silva, J. S., and Boavida, F. (2014). An Automated Application-Independent Approach to Anomaly Detection in Wireless Sensor Networks.In Mellouk, A., Fowler, S., Hoceini, S., and Daachi, B., editors, Wired/Wire-less Internet Communications: 12th International Conference, WWIC 2014,Paris, France, May 26-28, 2014. Proceedings, pages 1–14. Springer Interna-tional Publishing, Cham.
Romer, K. and Ma, J. (2009). PDA: Passive distributed assertions for sensornetworks. In 2009 International Conference on Information Processing inSensor Networks, pages 337–348.
Rost, S. and Balakrishnan, H. (2006). Memento: A Health Monitoring Systemfor Wireless Sensor Networks. In IEEE SECON, Reston, VA.
Sailhan, F., Delot, T., Pathak, A., Puech, A., and Roy, M. (2010). Fault Injec-tion and Monitoring for Dependability Analysis of Wireless Sensor-ActuatorsNetworks. Gedsip.
Saleae (2018). Saleae. https://www.saleae.com/.
Scheible, G., Dzung, D., Endresen, J., and Frey, J. E. (2007). Unplugged butconnected [Design and implementation of a truly wireless real-time sensor/ac-tuator interface]. IEEE Industrial Electronics Magazine, 1(2):25–34.
— 119 —
Bibliography
Scherer, B. and Horváth, G. (2012). Trace and debug port based watchdog pro-cessor. 2012 IEEE I2MTC - International Instrumentation and MeasurementTechnology Conference, Proceedings, pages 488–491.
Scherer, B. and Horvath, G. (2014). Microcontroller tracing in Hardware in theLoop tests integrating trace port measurement capability into NI VeriStand.In Proceedings of the 2014 15th International Carpathian Control Conference(ICCC), pages 522–526.
Schoenwaelder, J. (2003). Overview of the 2002 iab network management work-shop. RFC 3535, IETF. https://tools.ietf.org/html/rfc3535.
Schuster, H., Horauer, M., Kramer, M., Liebhart, H., and Ag, K. T. (2014).A log tool suite for embedded systems. In 7th International Conference onAdvances in Circuits and Microelectronics, pages 16–20. Citeseer.
Sehgal, A., Perelman, V., Kuryla, S., Schonwalder, J., and In, O. (2012). Man-agement of resource constrained devices in the internet of things. Communic-ations Magazine, IEEE, 50(12):144–149.
Shea, R., Cho, Y., and Srivastava, M. (2009). Lis is more: Improved diagnosticlogging in sensor networks with log instrumentation specifications. Univ. Cali-fornia, Los Angeles, CA, USA, Tech. Rep. TR-UCLA-NESL-200906-01.
Shelby, Z., Hartke, K., and Bormann, C. (2014). The constrained applicationprotocol (coap). RFC 7252, IETF. https://tools.ietf.org/html/rfc7252.
Sommerville, I. (2010). Software Engineering. Addison-Wesley Publishing Com-pany, USA, 9th edition.
Špírek, P. (2017). JetConf. https://github.com/CZ-NIC/jetconf.
Stanislowski, D., Vilajosana, X., Wang, Q., Watteyne, T., and Pister, K. S. J.(2014). Adaptive synchronization in IEEE802.15.4e networks. IEEE Trans-actions on Industrial Informatics, 10(1):795–802.
Tanyakom, A., Pongswatd, S., Julsereewong, A., and Rerkratn, A. (2017). Integ-ration of WirelessHART and ISA100.11a field devices into condition monit-oring system for starting IIoT implementation. 2017 56th Annual Conferenceof the Society of Instrument and Control Engineers of Japan, SICE 2017,2017-Novem:1395–1400.
Tavakoli, A., Culler, D., Levis, P., and Shenker, S. (2008). The case for predicate-oriented debugging of sensornets. In Proceedings of the 5th Workshop on HotTopics in Embedded Networked Sensors (HotEmNets), Charlottesville, VA.Citeseer.
Technology, L. (2017). DC9007A - SmartMesh WirelessHART Starter Kit.http://www.linear.com/solutions/3100.
— 120 —
Bibliography
Teslya, N. and Ryabchikov, I. (2018). Blockchain-based platform architecturefor industrial IoT. Conference of Open Innovation Association, FRUCT, pages321–329.
Thubert, P., Palattella, M. R., and Engel, T. (2016). 6TiSCH centralizedscheduling: When SDN meet IoT. 2015 IEEE Conference on Standards forCommunications and Networking, CSCN 2015, 1(October):42–47.
Tolle, G. and Culler, D. (2005). Design of an application-cooperative man-agement system for wireless sensor networks. In Proceeedings of the SecondEuropean Workshop on Wireless Sensor Networks, 2005., pages 121–132.
Tran, T.-D., Oliveira, J., Sá Silva, J., Pereira, V., Sousa, N., Raposo, D., Car-doso, F., and Teixeira, C. (2015). A scalable localization system for criticalcontrolled wireless sensor networks. In International Congress on Ultra Mod-ern Telecommunications and Control Systems and Workshops, volume 2015-Janua.
Trappey, A. J., Trappey, C. V., Govindarajan, U. H., Sun, J. J., and Chuang,A. C. (2016). A Review of Technology Standards and Patent Portfolios forEnabling Cyber-Physical Systems (CPS) in Advanced Manufacturing. IEEEAccess, 3536(c):1–1.
Wang, Q. and Jiang, J. (2016). Comparative examination on architecture andprotocol of industrial wireless sensor network standards. IEEE Communica-tions Surveys and Tutorials, 18(3):2197–2219.
Warriach, E. U., Aiello, M., and Tei, K. (2012). A Machine Learning Approachfor Identifying and Classifying Faults in Wireless Sensor Network. 2012 IEEE15th International Conference on Computational Science and Engineering,pages 618–625.
Whitehouse, K., Tolle, G., Taneja, J., Sharp, C., Kim, S., Jeong, J., Hui, J.,Dutta, P., and Culler, D. (2006). Marionette: using RPC for interactivedevelopment and debugging of wireless embedded networks. In 2006 5th In-ternational Conference on Information Processing in Sensor Networks, pages416–423.
Wightman, R. (2018). WirelessHART dissector. https://github.com/reidmefirst/WirelessHART-Parser.
Yang, J., Soffa, M. L., Selavo, L., and Whitehouse, K. (2007). Clairvoyant: AComprehensive Source-level Debugger for Wireless Sensor Networks. In Pro-ceedings of the 5th International Conference on Embedded Networked SensorSystems, SenSys ’07, pages 189–203, New York, NY, USA. ACM.
Yoshida, J. (2019). TI Claims Breakthrough BAW Technology. https://www.eetimes.com/document.asp?doc_id=1334373.
Yuan, D., Kanhere, S. S., and Hollick, M. (2015). Instrumenting Wireless SensorNetworks - A survey on the metrics that matter. Pervasive and Mobile Com-puting, 37:45–62.
— 121 —

Bibliography
Yuan, F., Song, W. Z., Peterson, N., Peng, Y., Wang, L., Shirazi, B., andLaHusen, R. (2008). A Lightweight Sensor Network Management SystemDesign. In 2008 Sixth Annual IEEE International Conference on PervasiveComputing and Communications (PerCom), pages 288–293.
Zand, P., Chatterjea, S., Das, K., and Havinga, P. (2012a). Wireless industrialmonitoring and control networks: The journey so far and the road ahead.Journal of Sensor and Actuator Networks, 1(3):123–152.
Zand, P., Dilo, A., and Havinga, P. (2012b). Implementation of WirelessHARTin NS-2 simulator. IEEE International Conference on Emerging Technologiesand Factory Automation, ETFA.
— 122 —