Embed Size (px)
Citation preview

Ecography ECOG-02104Carlucci, M. B., Seger, G. D. S., Sheil, D., Amaral, I. L., Chuyong, G. B., Ferreira, L. V., Galatti, U., Hurtado, J., Kenfack, D., Leal, D. C., Lewis, S. L., Lovett, J. C., Marshall, A. R., Martin, E., Mugerwa, B., Munishi, P., Oliveira, Á. C. A., Razafimahaimodison, J. C., Rovero, F., Sainge, M. N., Thomas, D., Pillar, V. D. and Duarte, L. D. S. 2016. Phylogenetic composition and structure of tree communities shed light on historical processes influencing tropical rainforest diversity. – Ecography doi: 10.1111/ecog.02104
Supplementary material
1
Appendix 1. Lists of TEAM Network’s sites (7), Gentry’s sites (74), published studies (34 1
sites from 32 studies) used to compile rainforest tree species pools for Neotropics, Afrotropics 2
and Madagascar. TEAM data sets are available at http://www.teamnetwork.org. Gentry’s 3
transect data is available athttp://www.mobot.org/mobot/research/gentry/welcome.shtml. 4
5
(a) TEAM’s sites used: NEOTROPICS - Volcán Barva (La Selva Biological Station and 6
Braulio Carrillo National Park, Costa Rica), Manaus (three different field stations near the 7
city of Manaus, Brazil) and Caxiuanã (Caxiuanã National Forest, Brazil); AFROTROPICS - 8
Korup (Korup National Park, Cameroon), Bwindi (Bwindi Impenetrable National Park, 9
Uganda), Udzungwa (Udzungwa Mountains National Park, Tanzania); MADAGASCAR - 10
Ranomafana (Ranomafana National Park, Madagascar). 11
We selected seven sites containing information of tree composition and abundance in 12
tropical rainforests. For each site, we used the inventory data that ranged between Aug 2010 13
and May 2011, available in “TEAM-DataPackage-20111206074616_1064”. The TEAM 14
Network sampling design for trees consists of tropical rainforest sites with five to seven 1-ha 15
plots (100 x 100 m), each subdivided in 25 subplots of 400 m2 (20 x 20 m), where trees with 16
diameter at breast height ≥10 cm were recorded. Plots were placed in closed-canopy moist 17
forest habitats. Each of the selected sites was composed by six plots of 1 ha, except for Korup 18
and Volcán Barva, which were composed by five and nine plots, respectively. The data from 19
all these plots were gathered using a defined, shared and therefore comparable method, which 20
follows quality controls, such as including late successional forests with little anthropogenic 21
impact. Further information can be found in TEAM Network (2010) and at 22
http://www.teamnetwork.org. 23
2
24
(b) Alwyn Gentry’s sites (codes in parentheses): AFROTROPICS – Banyong (Afr1), 25
Belinga (Afr6), Makokou 1 (Afr7), Makokou 2 (Afr8), Mount Cameroun (Afr3), Ndakan 26
(Afr4), Pande Forest Reserve (Afr17), Pugu Forest Reserve (Afr18); MADAGASCAR – 27
Nosy Mangabe (Afr13), Perinet Forestry Station (Afr14); NEOTROPICS - Allpahuayo 28
(SAm89), Alter de Chao (SAm20), Alto de Cuevas (SAm33), Alto de Mirador (SAm35), Alto 29
Madidi (SAm10), Alto Madidi – Ridge Top (SAm11), Anchicayá (SAm36), Antado 30
(SAm37), Araracuara (SAm39), Araracuara - High Campina (SAm38), Bajo Calima 31
(SAm40), Belém-Mocambo (SAm29), Berbice River (SAm87), Bosque de la Cueva 32
(SAm41), Bosque Nacional von Humboldt (SAm90), Cabeza de Mono (SAm91), Candamo 33
(SAm108), Carajas (SAm23), Carara National Park (CAm6), Centinela (SAm70), Cerro de la 34
Neblina 1 (SAm124), Cerro de la Neblina 2 (SAm125), Cerro El Picacho (CAm24), Cerro 35
Olumo (CAm23), Cochacashu (SAm96), Constancia (SAm97),Cuangos (SAm71),Curundu 36
(CAm25), Cuzco Amazónico (SAm99), Dureno (SAm72), Fila de Bilsa (SAm68), Huamaní 37
(SAm75), Indiana (SAm101), Jatun Sacha (SAm76), Jenaro Herrera (SAm102), La Planada 38
(SAm54), Madden Forest (CAm26), Maquipucuna (SAm78), Miazi (SAm79), Mishana - 39
Tahuampa (SAm104), Mishana Old Floodplain (SAm105), Mishana White Sand (SAm106), 40
Murrí (SAm59), Osa-Sirena (CAm8), Pampas del Heath (SAm109), Pipeline Road (CAm27), 41
Quebrada Sucusari (SAm112), Rancho Quemado (CAm7), Río Manso (SAm61), Río 42
Nangaritza (SAm82), Río Palenque 1 (SAm83), Río Palenque 2 (SAm84), Río Távara 43
(SAm110), San Sebastían (SAm85), Saul (SAm86), Shiringamazú (SAm111), Tambopata 44
Alluvial (SAm114), Tambopata Lateritic (SAm116), Tambopata Swamp Trail (SAm115), 45
Tambopata Upland Sandy (SAm113), Tutunendo (SAm65), Yanamono 1 (SAm120), 46
Yanamono 2 (SAm121), Yanamono Tahuampo (SAm119). 47
3
48
(c) Published studies: 49
Adekunle, V. A. J. 2006. Conservation of tree species diversity in tropical rainforest ecosystem of 50
South-West Nigeria. – J. Trop. For. Sci. 18: 91-101. 51
Alarcón, J. G. S. and Peixoto, A. L. 2007. Florística e fitossociologia de um trecho de um hectare de 52
floresta de terra firme, em Caracaraí, Roraima, Brasil. - Bol. Mus. Par. Em. Goel. 2: 33-60. 53
Almeida, S. S. et al. 2004. Análise florística e estrutura de florestas de Várzea no estuário Amazônico. 54
- Acta Amaz. 34: 513-524. 55
Amaral, D. D. et al. 2009. Checklist da flora arbórea de remanescentes florestais da região 56
metropolitana de Belém e valor histórico dos fragmentos, Pará, Brasil. - Bol. Mus. Par. Em. Goel. 57
4: 231-289. 58
Batista, F. J. et al. 2011. Comparação florística e estrutural de duas florestas de várzea no estuário 59
amazônico, Pará, Brasil. - Rev. Árv. 35: 289-298. 60
Bongers, E. et al. 1988. Structure and floristic composition of the lowland rain forest of Los Tuxtlas, 61
Mexico. - Vegetatio 74: 55-80. 62
Boubli, J. P. et al. 2004. Mesoscale transect sampling of trees in the Lomako-Yekokora interfluvium, 63
Democratic Republic of the Congo. - Biodivers. Conserv. 13: 2399–2417. 64
Carim, S. et al. Riqueza de espécies, estrutura e composição florística de uma floresta secundária de 40 65
anos no leste da Amazônia. - Acta Bot. Brasilica, 21, 293-308. 66
Chapman, C. A. et al. 1997. Spatial and temporal variability in the structure of a tropical forest. - Afr. 67
J. Ecol. 35: 287-302. 68
Eilu, G. et al. 2004. Density and species diversity of trees in four tropical forests of the Albertine rift, 69
western Uganda. - Divers. Distrib. 10: 303-312. 70
4
Espírito-Santo, F. D. B. et al. 2005. Análise da composição florística e fitossociológica da floresta 71
nacional do Tapajós com o apoio geográfico de imagens de satélites. - Acta Amaz. 35: 155-173. 72
Fashing, P. J. and Gathua, J. M. 2004. Spatial variability in the vegetation structure and composition 73
of an East African rain forest. - Afr. J. Ecol. 42: 189-197. 74
Ihenyen, J. et al. 2009. Composition of tree species in Ehor Forest Reserve, Edo State, Nigeria. - 75
Nature and Science 7: 8-18. 76
Ivanauskas, N. M. et al. 2004. Composição florística de trechos florestais na borda sul-amazônica. - 77
Acta Amaz. 34: 399-413. 78
Jardim, M. A. G. and Vieira, I. C. G. 2001. Composição florística e estrutura de uma floresta de várzea 79
do estuário Amazônico, Ilha do Combu, Estado do Pará, Brasil. - Bol. Mus. Par. Em. Goel. 17: 80
333-354. 81
Lewis, B. A. et al. 1996. A study of the botanical structure, composition, and diversity of the eastern 82
slopes of the Reserve Naturelle Integrate d'Andringitra, Madagascar. - Fieldiana (Zoology), 85, 24-83
75. 84
Maciel, U. N. and Lisboa, P. L. B. 1989. Estudo florístico de 1 hectare de mata de terra firme no km 85
15 da rodovia Presidente Médici Costa Marques (RO-429), Rondônia. - Bol. Mus. Par. Em. Goel. 86
5: 25-37. 87
Malheiros, A. F. et al. 2009. Análise estrutural da floresta tropical úmida do município de Alta 88
Floresta, Mato Grosso, Brasil. - Acta Amaz. 39: 539-548. 89
Montag, L. F. A. et al. 2008. Listagem de espécies. Biodiversidade na Província Petrolífera de Urucu 90
(ed. by S.O.F. Lima et al.), pp. 157-185. Petrobras, Rio de Janeiro, Brazil. 91
Nadkarni, N. M. et al. 1995. Structural characteristics and floristic composition of a Neotropical cloud 92
forest, Monteverde, Costa Rica. - J. Trop. Ecol. 11: 481-495. 93
Nascimento, M. T. et al. 1997. Forest structure, floristic composition and soils of an Amazonian 94
monodominant forest on Maracá Island, Roraima, Brazil. - Edinburgh J. Bot. 54: 1-38. 95
5
Ojo, L. O. and Ola-Adams, B.A. 1996. Measurement of tree diversity in the Nigerian rainforest. - 96
Biodivers. Conserv. 5: 1253-1270. 97
Queiroz, J. A. L. and Machado, S.A. 2008. Fitossociologia em floresta de várzea do estuário 98
Amazônico no Estado do Amapá. - Pesq. Flor. Bras. 57: 5-20. 99
Ribeiro, R. J. et al. 1999. Estudo fitossociológico nas regiões de Carajás e Marabá- Pará, Brasil. - Acta 100
Amaz. 29: 207-222. 101
Salomão, R. P. et al. 2007. As florestas de Belo Monte na grande curva do rio Xingu, Amazônia 102
Oriental. - Bol. Mus. Par. Em. Goel. 2: 57-153. 103
Sheil, D., Jennings, S. and Savill, P. 2000. Long-term permanent plot observations of vegetation 104
dynamics in Budongo, a Ugandan rain forest. - J. Trop. Ecol. 16: 765-800. 105
Silva, K. E. et al. 2008. Composição florística e fitossociologia de espécies arbóreas do Parque 106
Fenológico da Embrapa Amazônia Ocidental. - Acta Amaz. 38: 213-222. 107
Stropp, J. et al. 2011. Tree communities of white-sand and terra-firme forests of the upper Rio Negro. 108
- Acta Amaz. 41: 521-544. 109
ter Steege, H. et al. 2007. Plant diversity of the bauxite plateaus of North East Suriname. A Rapid 110
Biological Assessment of the Lely and Nassau Plateaus, Suriname (with additional information on 111
the Brownsberg Plateau). RAP Bulletin of Biological Assessment, 43 (ed. by L. E. Alonso and J. 112
H. Mol), pp. 76-85. Conservation International, Arlington, VA, USA. 113
van Gemerden, B. S. et al. 2003. The pristine rain forest? Remnants of historical human impacts on 114
current tree species composition and diversity. - J. Biogeogr. 30: 1381-1390. 115
Vicentini, A. 2004. A Vegetação ao longo de um gradiente edáfico no Parque Nacional do Jaú. Janelas 116
para a biodiversidade no Parque Nacional do Jaú: uma estratégia para o estudo da biodiversidade 117
na Amazônia (ed. by S.H. Borges et al.), pp. 105-131. Fundação Vitória Amazônica, WWF-Brasil, 118
USAID, Manaus, Brazil. 119

6
Webb, E. I. and Peralta, R. 1998. Tree community diversity of lowland swamp forest in Northeast 120
Costa Rica, and changes associated with controlled selective logging. - Biodivers. Conserv. 7: 565-121
583. 122
123
7
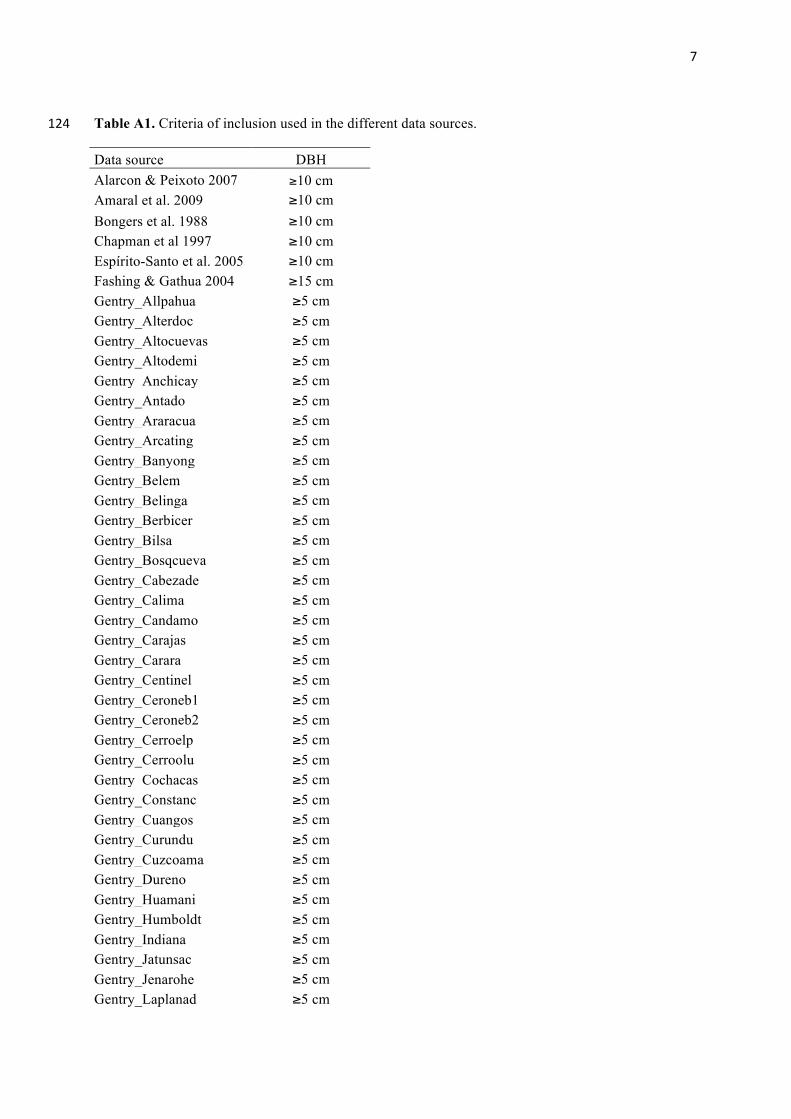
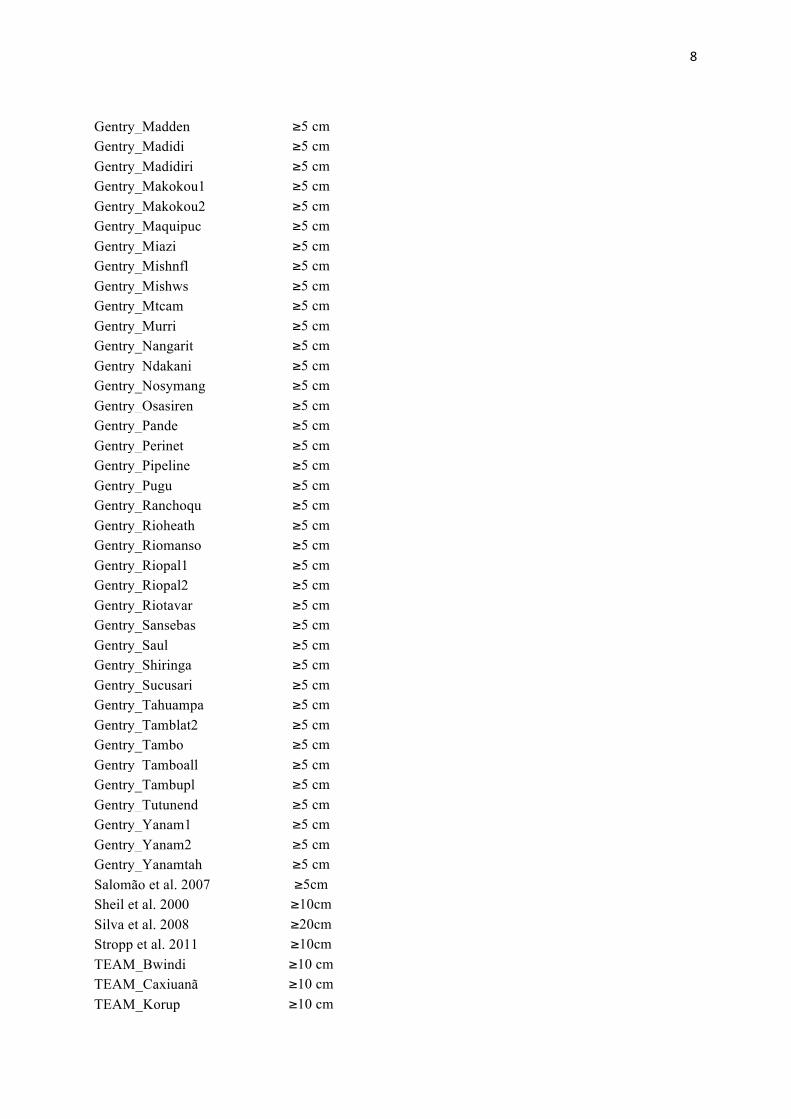
Table A1. Criteria of inclusion used in the different data sources. 124
Data source DBH Alarcon & Peixoto 2007 ≥10 cm Amaral et al. 2009 ≥10 cm Bongers et al. 1988 ≥10 cm Chapman et al 1997 ≥10 cm Espírito-Santo et al. 2005 ≥10 cm Fashing & Gathua 2004 ≥15 cm Gentry_Allpahua ≥5 cm Gentry_Alterdoc ≥5 cm Gentry_Altocuevas ≥5 cm Gentry_Altodemi ≥5 cm Gentry_Anchicay ≥5 cm Gentry_Antado ≥5 cm Gentry_Araracua ≥5 cm Gentry_Arcating ≥5 cm Gentry_Banyong ≥5 cm Gentry_Belem ≥5 cm Gentry_Belinga ≥5 cm Gentry_Berbicer ≥5 cm Gentry_Bilsa ≥5 cm Gentry_Bosqcueva ≥5 cm Gentry_Cabezade ≥5 cm Gentry_Calima ≥5 cm Gentry_Candamo ≥5 cm Gentry_Carajas ≥5 cm Gentry_Carara ≥5 cm Gentry_Centinel ≥5 cm Gentry_Ceroneb1 ≥5 cm Gentry_Ceroneb2 ≥5 cm Gentry_Cerroelp ≥5 cm Gentry_Cerroolu ≥5 cm Gentry_Cochacas ≥5 cm Gentry_Constanc ≥5 cm Gentry_Cuangos ≥5 cm Gentry_Curundu ≥5 cm Gentry_Cuzcoama ≥5 cm Gentry_Dureno ≥5 cm Gentry_Huamani ≥5 cm Gentry_Humboldt ≥5 cm Gentry_Indiana ≥5 cm Gentry_Jatunsac ≥5 cm Gentry_Jenarohe ≥5 cm Gentry_Laplanad ≥5 cm
8
Gentry_Madden ≥5 cm Gentry_Madidi ≥5 cm Gentry_Madidiri ≥5 cm Gentry_Makokou1 ≥5 cm Gentry_Makokou2 ≥5 cm Gentry_Maquipuc ≥5 cm Gentry_Miazi ≥5 cm Gentry_Mishnfl ≥5 cm Gentry_Mishws ≥5 cm Gentry_Mtcam ≥5 cm Gentry_Murri ≥5 cm Gentry_Nangarit ≥5 cm Gentry_Ndakani ≥5 cm Gentry_Nosymang ≥5 cm Gentry_Osasiren ≥5 cm Gentry_Pande ≥5 cm Gentry_Perinet ≥5 cm Gentry_Pipeline ≥5 cm Gentry_Pugu ≥5 cm Gentry_Ranchoqu ≥5 cm Gentry_Rioheath ≥5 cm Gentry_Riomanso ≥5 cm Gentry_Riopal1 ≥5 cm Gentry_Riopal2 ≥5 cm Gentry_Riotavar ≥5 cm Gentry_Sansebas ≥5 cm Gentry_Saul ≥5 cm Gentry_Shiringa ≥5 cm Gentry_Sucusari ≥5 cm Gentry_Tahuampa ≥5 cm Gentry_Tamblat2 ≥5 cm Gentry_Tambo ≥5 cm Gentry_Tamboall ≥5 cm Gentry_Tambupl ≥5 cm Gentry_Tutunend ≥5 cm Gentry_Yanam1 ≥5 cm Gentry_Yanam2 ≥5 cm Gentry_Yanamtah ≥5 cm Salomão et al. 2007 ≥5cm Sheil et al. 2000 ≥10cm Silva et al. 2008 ≥20cm Stropp et al. 2011 ≥10cm TEAM_Bwindi ≥10 cm TEAM_Caxiuanã ≥10 cm TEAM_Korup ≥10 cm

9
TEAM_Manaus ≥10 cm TEAM_Ranomafana ≥10 cm TEAM_Udzungwa ≥10 cm TEAM_Volcán Barva ≥10 cm ter Steege et al. 2007 ≥10cm van Gemergen et al. 2003 ≥10cm Webb & Peralta 1998 ≥10cm 125
10
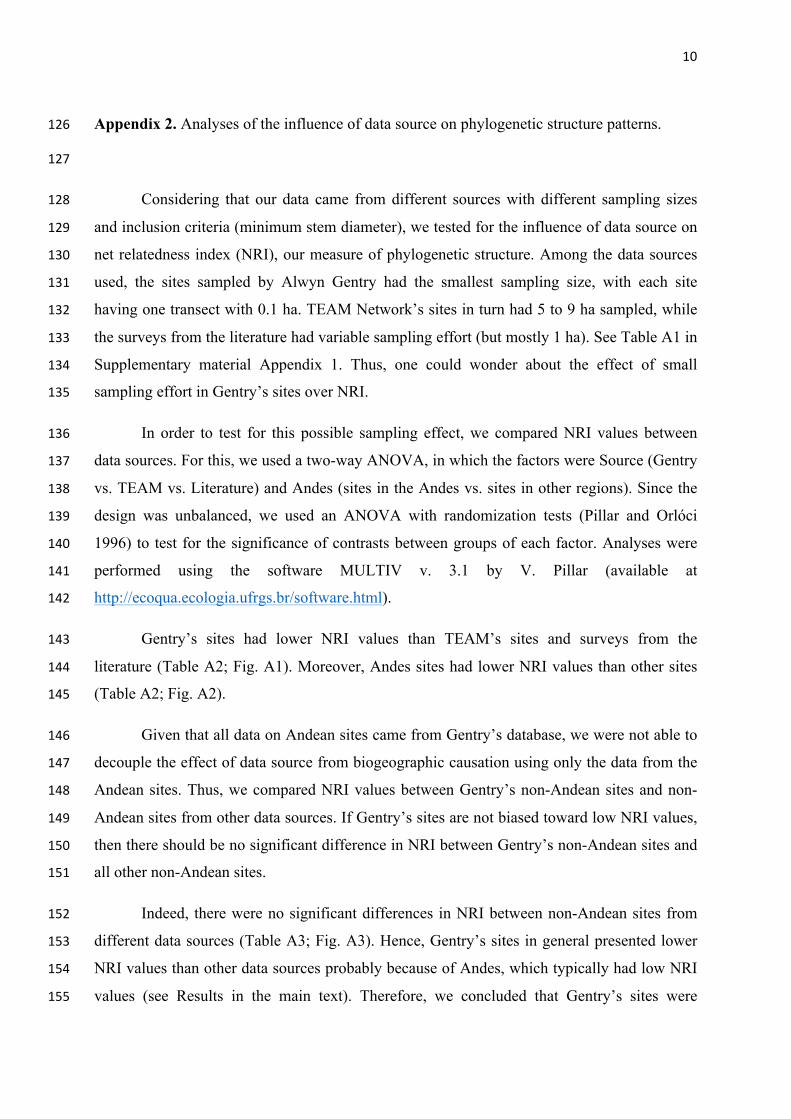
Appendix 2. Analyses of the influence of data source on phylogenetic structure patterns. 126
127
Considering that our data came from different sources with different sampling sizes 128
and inclusion criteria (minimum stem diameter), we tested for the influence of data source on 129
net relatedness index (NRI), our measure of phylogenetic structure. Among the data sources 130
used, the sites sampled by Alwyn Gentry had the smallest sampling size, with each site 131
having one transect with 0.1 ha. TEAM Network’s sites in turn had 5 to 9 ha sampled, while 132
the surveys from the literature had variable sampling effort (but mostly 1 ha). See Table A1 in 133
Supplementary material Appendix 1. Thus, one could wonder about the effect of small 134
sampling effort in Gentry’s sites over NRI. 135
In order to test for this possible sampling effect, we compared NRI values between 136
data sources. For this, we used a two-way ANOVA, in which the factors were Source (Gentry 137
vs. TEAM vs. Literature) and Andes (sites in the Andes vs. sites in other regions). Since the 138
design was unbalanced, we used an ANOVA with randomization tests (Pillar and Orlóci 139
1996) to test for the significance of contrasts between groups of each factor. Analyses were 140
performed using the software MULTIV v. 3.1 by V. Pillar (available at 141
http://ecoqua.ecologia.ufrgs.br/software.html). 142
Gentry’s sites had lower NRI values than TEAM’s sites and surveys from the 143
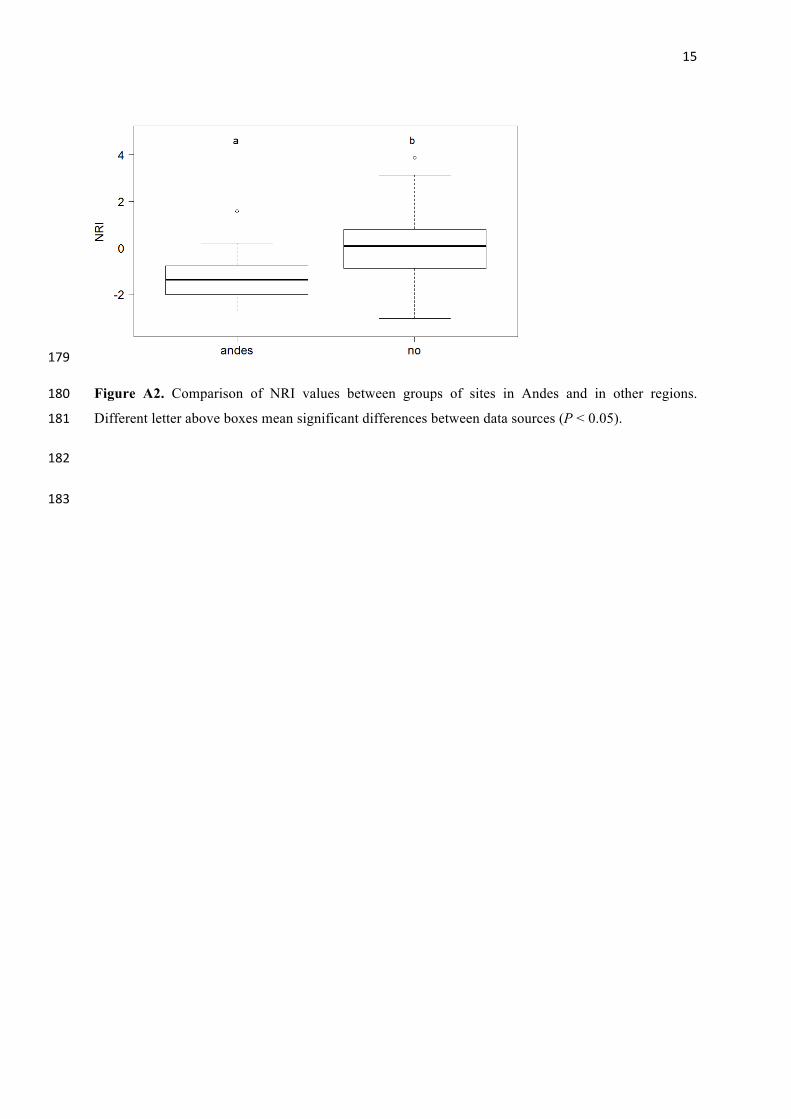
literature (Table A2; Fig. A1). Moreover, Andes sites had lower NRI values than other sites 144
(Table A2; Fig. A2). 145
Given that all data on Andean sites came from Gentry’s database, we were not able to 146
decouple the effect of data source from biogeographic causation using only the data from the 147
Andean sites. Thus, we compared NRI values between Gentry’s non-Andean sites and non-148
Andean sites from other data sources. If Gentry’s sites are not biased toward low NRI values, 149
then there should be no significant difference in NRI between Gentry’s non-Andean sites and 150
all other non-Andean sites. 151
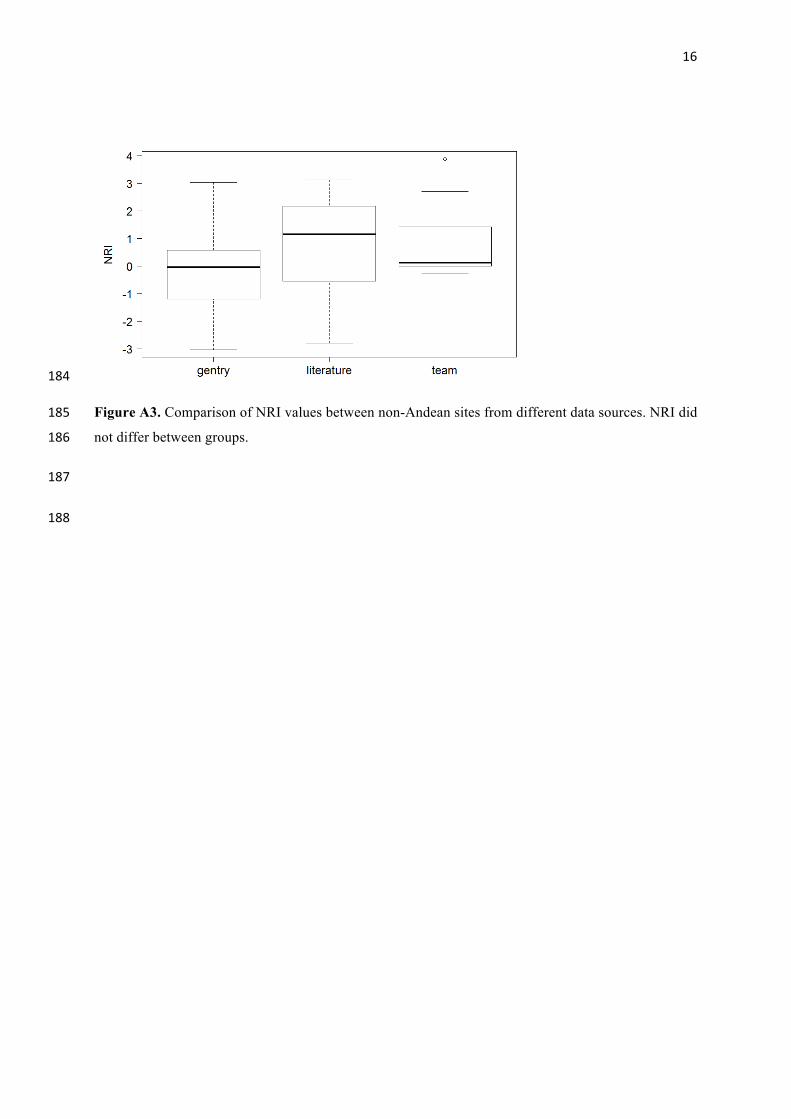
Indeed, there were no significant differences in NRI between non-Andean sites from 152
different data sources (Table A3; Fig. A3). Hence, Gentry’s sites in general presented lower 153
NRI values than other data sources probably because of Andes, which typically had low NRI 154
values (see Results in the main text). Therefore, we concluded that Gentry’s sites were 155
11
unbiased and could be used together with TEAM Network’s sites and the surveys from the 156
literature in the analyses. 157
158
References 159
Pillar, V. D. and Orlóci, L. 1996. On randomization testing in vegetation science: multifactor 160
comparisons of relevé groups. - J. Veg. Sci.: 585–592. 161
162
12
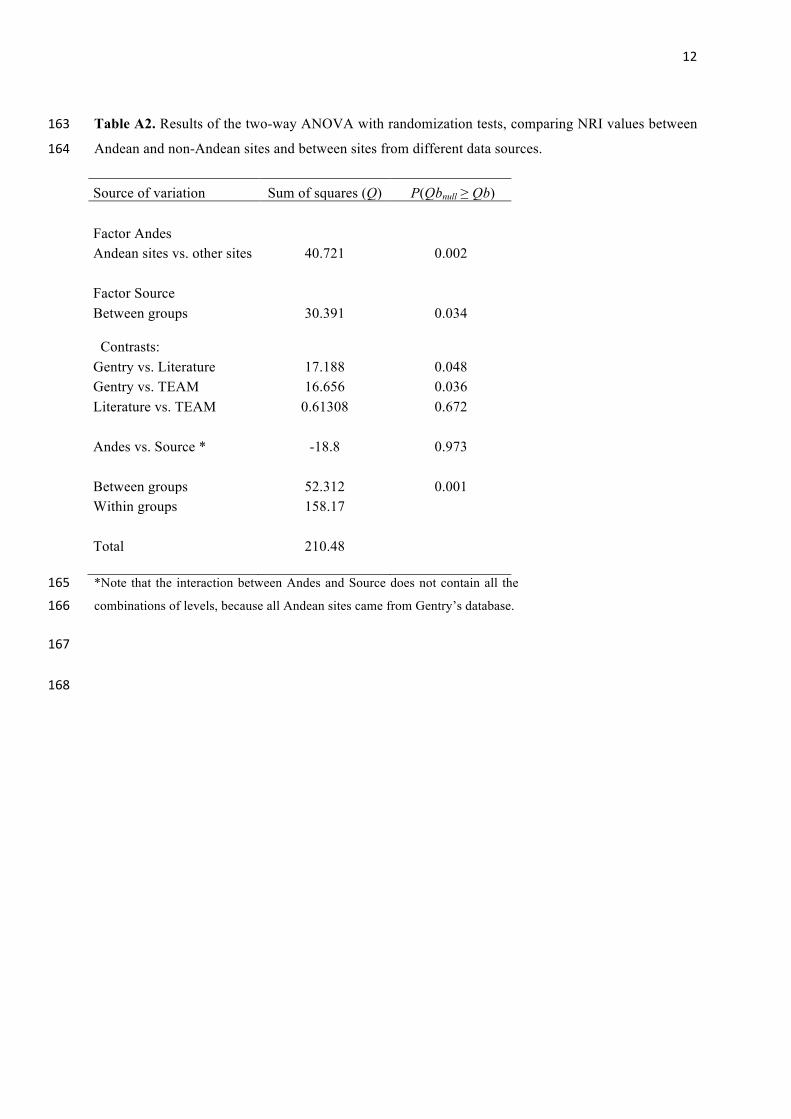
Table A2. Results of the two-way ANOVA with randomization tests, comparing NRI values between 163
Andean and non-Andean sites and between sites from different data sources. 164
Source of variation Sum of squares (Q) P(Qbnull ≥ Qb)
Factor Andes Andean sites vs. other sites 40.721 0.002
Factor Source Between groups 30.391 0.034
Contrasts:
Gentry vs. Literature 17.188 0.048 Gentry vs. TEAM 16.656 0.036 Literature vs. TEAM 0.61308 0.672
Andes vs. Source * -18.8 0.973
Between groups 52.312 0.001 Within groups 158.17
Total 210.48
*Note that the interaction between Andes and Source does not contain all the 165
combinations of levels, because all Andean sites came from Gentry’s database. 166
167
168
13
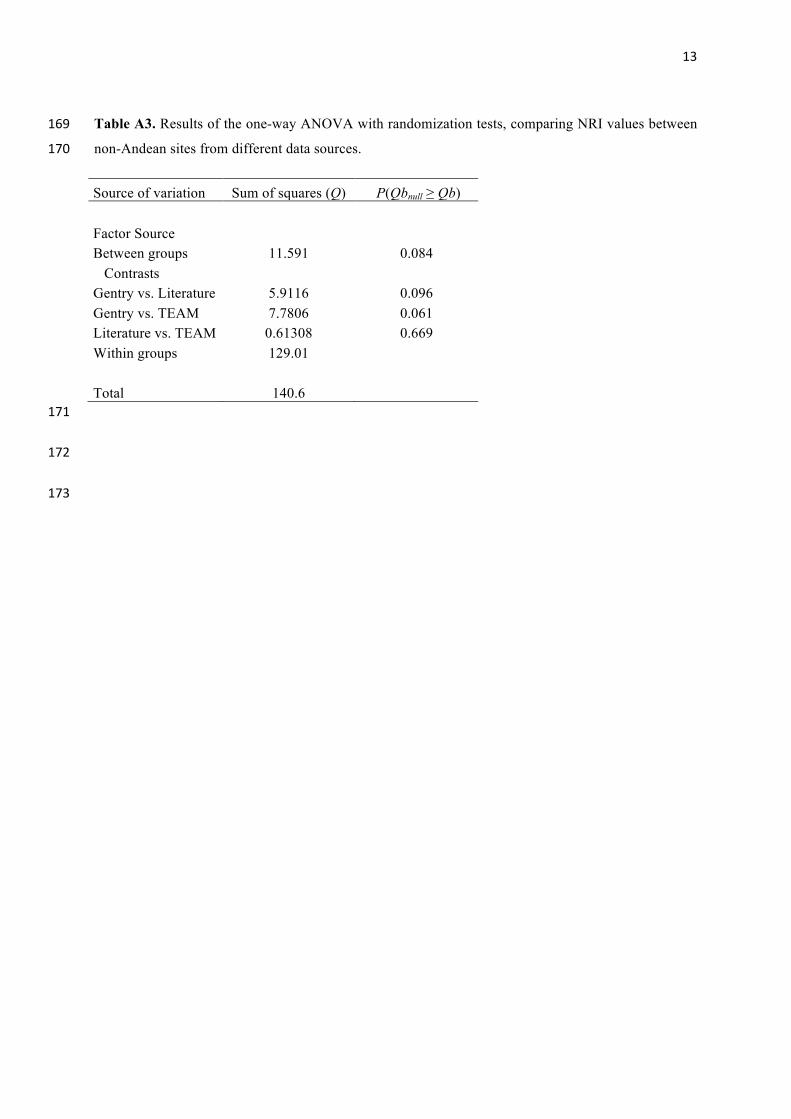
Table A3. Results of the one-way ANOVA with randomization tests, comparing NRI values between 169
non-Andean sites from different data sources. 170
Source of variation Sum of squares (Q) P(Qbnull ≥ Qb)
Factor Source Between groups 11.591 0.084
Contrasts Gentry vs. Literature 5.9116 0.096
Gentry vs. TEAM 7.7806 0.061 Literature vs. TEAM 0.61308 0.669 Within groups 129.01
Total 140.6
171
172
173
14
174
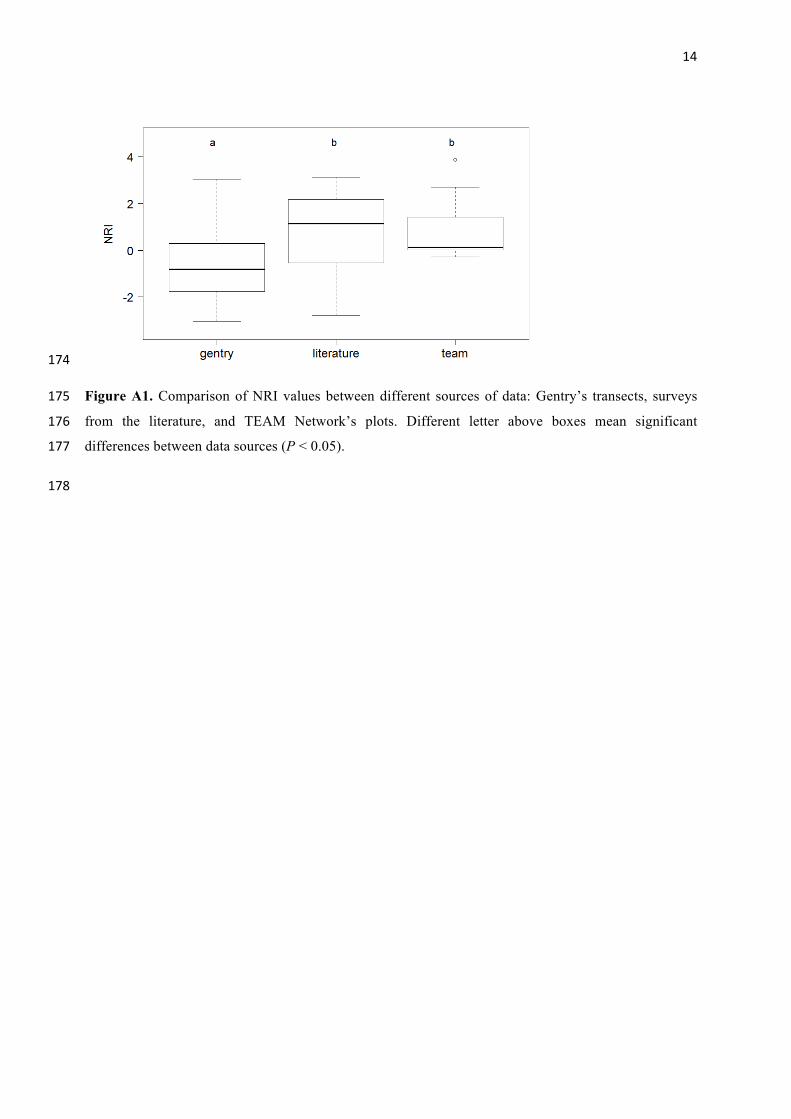
Figure A1. Comparison of NRI values between different sources of data: Gentry’s transects, surveys 175
from the literature, and TEAM Network’s plots. Different letter above boxes mean significant 176
differences between data sources (P < 0.05). 177
178
15
179
Figure A2. Comparison of NRI values between groups of sites in Andes and in other regions. 180
Different letter above boxes mean significant differences between data sources (P < 0.05). 181
182
183
16
184
Figure A3. Comparison of NRI values between non-Andean sites from different data sources. NRI did 185
not differ between groups. 186
187
188
17
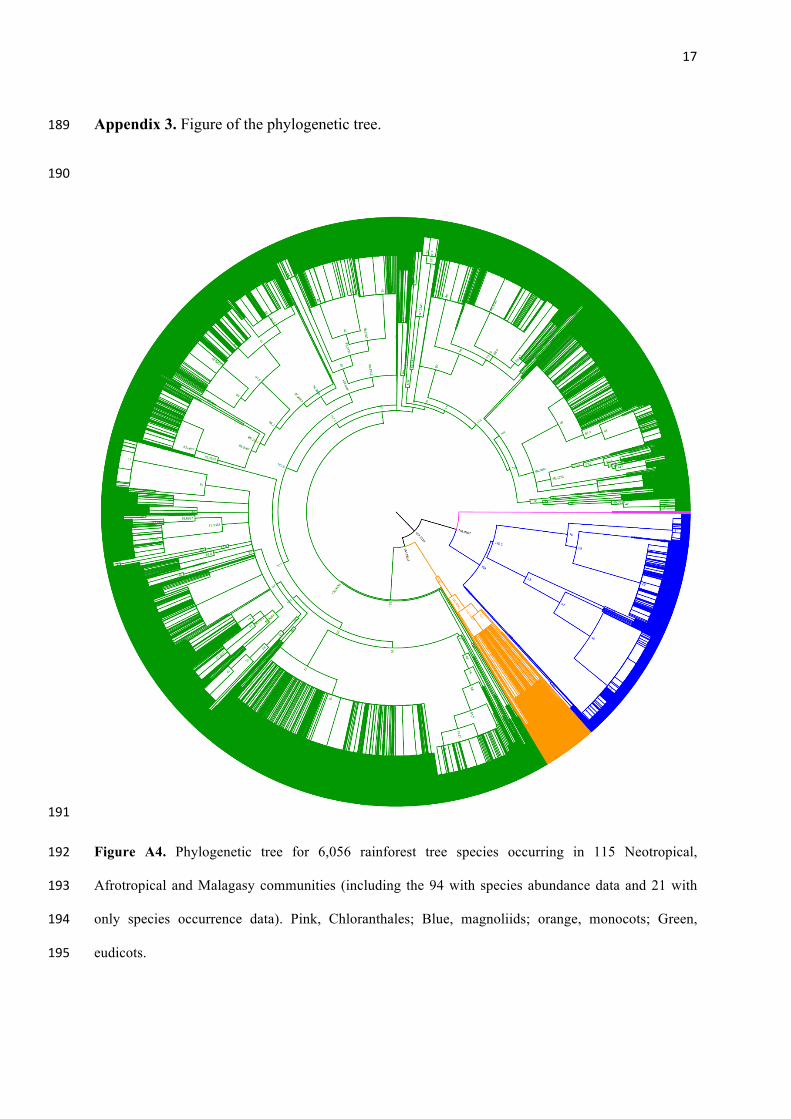
Appendix 3. Figure of the phylogenetic tree. 189
190
191
Figure A4. Phylogenetic tree for 6,056 rainforest tree species occurring in 115 Neotropical, 192
Afrotropical and Malagasy communities (including the 94 with species abundance data and 21 with 193
only species occurrence data). Pink, Chloranthales; Blue, magnoliids; orange, monocots; Green, 194
eudicots. 195
18
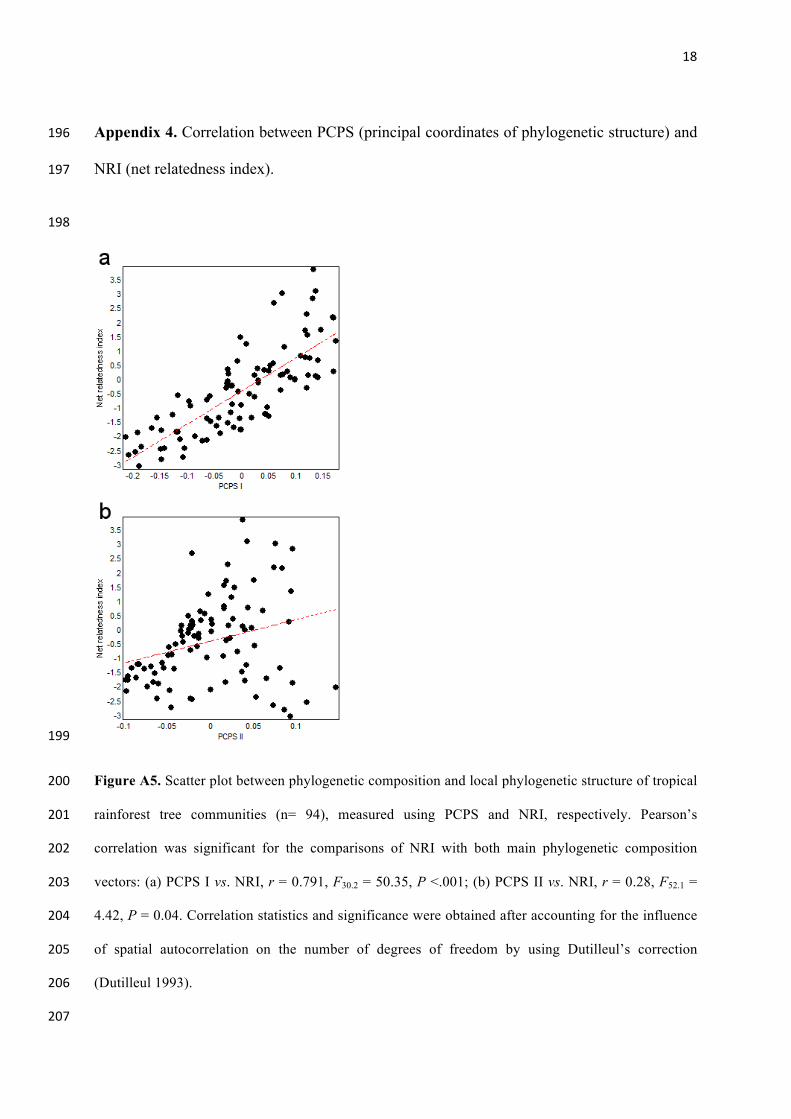
Appendix 4. Correlation between PCPS (principal coordinates of phylogenetic structure) and 196
NRI (net relatedness index). 197
198
199
Figure A5. Scatter plot between phylogenetic composition and local phylogenetic structure of tropical 200
rainforest tree communities (n= 94), measured using PCPS and NRI, respectively. Pearson’s 201
correlation was significant for the comparisons of NRI with both main phylogenetic composition 202
vectors: (a) PCPS I vs. NRI, r = 0.791, F30.2 = 50.35, P <.001; (b) PCPS II vs. NRI, r = 0.28, F52.1 = 203
4.42, P = 0.04. Correlation statistics and significance were obtained after accounting for the influence 204
of spatial autocorrelation on the number of degrees of freedom by using Dutilleul’s correction 205
(Dutilleul 1993). 206
207

19
References 208
Dutilleul, P. 1993. Modifying the t test for assessing the correlation between two spatial processes. - 209
Biometrics 49: 305–314. 210
211