Embed Size (px)
Citation preview
Gest. Prod., São Carlos, v. 25, n. 4, p. 839-853, 2018https://doi.org/10.1590/0104-530X3925-18
ISSN 0104-530X (Print)ISSN 1806-9649 (Online)
Resumo: O crescimento econômico não é o único fator que explica o desenvolvimento humano. Nesse aspecto, índices sobre a qualidade de vida têm sido recorrentes na literatura. Entretanto, esses índices não analisam como a complexidade econômica é convertida em desenvolvimento humano. O objetivo deste artigo é mensurar a eficiência de países latino-americanos e asiáticos na conversão de complexidade econômica em desenvolvimento humano, entre 2010 e 2014. O método utilizado foi o Data Envelopment Analysis (DEA), por meio do Modelo de Retornos Variáveis à Escala (BCC) e Análise de Janela. Os resultados demonstraram que, em 2014, todos os países asiáticos foram eficientes, exceto China e Filipinas. Nesse ano, Cuba foi o país que mais serviu de benchmark para os países ineficientes. A análise em janela demonstrou que apenas Japão, Coréia do Sul e Singapura se mantiveram eficientes ao longo do tempo. Esse resultado confirma a hipótese inicial deste artigo: economias mais complexas são mais eficientes na geração de desenvolvimento humano.Palavras-chave: Análise por Envoltória de Dados (DEA); Análise em janela; Complexidade econômica; Economic Complexity Index (ECI); Desenvolvimento humano.
Abstract: Economic growth is not the only factor to explain human development. Therefore, many authors have prioritized studies to measure the Human Development Index. However, these indexes do not analyze how Economic Complexity can increase Human Development. This paper aimed to determine how efficiently nations from Latin America and Asia measure a country’s performance in converting Economic Complexity into Human Development, between 2010 and 2014. We used Data Envelopment Analysis (DEA), through the Variable Returns of Scale (VRS) Model and Window Analysis. Results showed that in 2014, all Asian countries, except China and the Philippines, were efficient; on the other hand Cuba was the benchmark for inefficient countries. Window Analysis showed Japan, South Korea and Singapore were efficient over time. This result confirms the initial hypothesis of this article: the more complex countries are the more efficiently they create Human Development.Keywords: Data Envelopment Analysis (DEA); Window analysis; Economic complexity; Economic Complexity Index (ECI); Human development.
Economic Complexity and Human Development: DEA performance measurement in Asia and Latin America
Complexidade Econômica e Desenvolvimento Humano: uma análise a partir do DEA
Diogo Ferraz1
Herick Fernando Moralles2
Jessica Suárez Campoli1
Fabíola Cristina Ribeiro de Oliveira3
Daisy Aparecida do Nascimento Rebelatto1
1 Departamento de Engenharia de Produção, Universidade de São Paulo – USP, Avenida Trabalhador São-Carlense, 400, CEP 13566-590, São Carlos, SP, Brasil, e-mail: [email protected]; [email protected]; [email protected]
2 Universidade Federal de São Carlos – UFSCar, Rodovia Washington Luís, Km 235, SP-310, CEP 13565-905, São Carlos, SP, Brasil, e-mail: [email protected]
3 Universidade Metodista de Piracicaba – UNIMEP, Rodovia do Açúcar, Km 156, SP-308, CEP 13423-170, Piracicaba, SP, Brasil, e-mail: [email protected]
Received Apr. 4, 2017 - Accepted Oct. 28, 2017Financial support: The first author acknowledges Coordenação de Aperfeiçoamento de Pessoal de Nível Superior (CAPES) for his funding from Program 6492 – PhD Student CAPES/DAAD/CNPQ / Process nº. 88887.161388/2017-00.
1 IntroductionHuman Development (HD) and quality of life
arise from Economic Growth (EG) and Economic Development (Mariano & Rebelatto, 2014; Sen, 2001). However, EG is not enough to explain HD,
because goods production depends on available knowledge. Jobs and economic diversification are result of goods produced by the country (Hartmann, 2014).
840840/853
Ferraz, D. et al. Gest. Prod., São Carlos, v. 25, n. 4, p. 839-853, 2018
Human Development is the process of expanding individual freedoms. Economic agents must be able to make decisions and to participate in the development of the country. Therefore, individuals need have access to education, health, housing and income, becoming them part of society (Sen, 1981, 2001). Based on this approach, Hartmann (2014) argues development policies neglect the type of jobs importance on HD. Besides growing, governments needs to create conditions for innovation and economic diversification, in order to improve HD. A new conceptualization, called Economic Complexity (EC), has examined the importance of economic diversification.
Complexity arises through the type of goods produced, which defines a country’s productive structure (Hausmann et al., 2014). Countries available to produce high-technology goods, such as machinery, are more complex than commodities countries producing. Countries must overcome dependence on commodities because this causes negative or unstable terms of trade, macroeconomic volatility, Dutch disease phenomenon, and political instability (Bresser-Pereira, 2008; Nkurunziza et al., 2017).
Previous studies demonstrated the strong positively correlation between complexity with EG. In a productive diversification scenario of technology-intensive sectors leads a country to Gross Domestic Product (GDP) growth and income increase in long terms (Hidalgo & Hausmann, 2009). On the other hand, According to Nkurunziza et al. (2017) commodity dependence is even stronger in developing regions and is often associated with a poor socio-economic performance of resource-rich developing countries. Moreover, EC presents significant correlation with HD. Hartmann (2014) has shown economic diversification is more important for HD than EG, because complexity improves people’s capacity, creating better education, health and infrastructure indicators.
Few studies have analyzed Economic Complexity and Human Development. This approach is an interesting subject for a country’s development policy. Although some authors have related EC with HD, for example Hartmann (2014) and Hartmann et al. (2017), we do not found studies that measure the efficiency of this relation. Furthermore, we consider it important to compare the Asian countries with Latin America because several studies have debated the causes of the economic success achieved by the industrialized countries of Asia, as well as the lessons that Latin American countries can learn from this development experience (Agosin, 2009; Ungor, 2017). In addition, we have not detected this type of works comparing Latin American and Asian countries. Therefore, we identified an important gap to be filled.
This article argues that is necessary to measure the efficiency of countries in transforming Economic Complexity into Human Development, because the
efficiency index will allow a reflection of the best practices in the analyzed regions. The initial hypothesis is that complex economies, like Asian countries, are more efficient in transforming complexity in HD than Latin American countries.
In this sense, Asian countries must sustain efficiency over time. The problem investigated is to evaluate which countries, among those selected, are most efficient. The objective of this article is to determine, using Data Envelopment Analysis (DEA) and Window Analysis, the efficiency of a set of nation-states from Latin America and Asia, to measure a country’s performance in converting EC into HD, between 2010 and 2014.
This paper is structured as follows. In the next section, we discuss the relation between Human Development and Economic Growth. Next, we discuss important papers committed to the theme of Social Efficiency. The subsequent section presents the relation among Structural Change, Innovation and Economic Complexity. In section 5, we discuss the relationship between Economic Complexity and Human Development. In section 6, some important studies discuss growth and human development in Latin America and Asia. Major DEA models and the methodological procedures are described in section 7. The results found are described in Section 8. Finally, last section presents the conclusions and suggestions for future researches.
2 Human Development and Economic GrowthInclusive growth is a global concern today. According
to the International Monetary Fund (IMF, 2017), large or small countries with developed or advanced economies have been concerned with promoting the productive employment of the entire labor force, incorporating equal opportunities in terms of access to markets and resources. This new concept of EG is aligned with the HD perspective that the aim of HD is to create an enabling environment for people to improve their individual’s choices, to lead longer, healthier and more complete lives (Suri et al., 2011; Mustafa et al., 2017).
According to the Human Development Report (UNDP, 2016), HD is the process of expanding freedoms for all human beings. These freedoms have two fundamental aspects: freedom of agency, represented by voice and autonomy, and freedom of well-being, representation by functionalities and capabilities. Functions are the diverse things that a person can have or do (to be happy, to be well nourished, and to have good health). Capabilities are a set of essential operations for agent in society (Sen, 2001). This article analyses the relationship between EC and capabilities of freedom of well-being (HD).
841841/853
Economic Complexity and Human Development…
Europe, North Africa, and Middle East. The results showed the Nordic countries and Switzerland as efficient countries.
This brief review of the literature on Social Efficiency shows economic complexity has not been considered in the process of transforming wealth into human development or quality of life. Therefore, the main contributions of this paper, compared with other papers published in this field, are: (a) a comparison between economic complexity and human development. This is important because studies on social efficiency have prioritized GDP per capita in the DEA models; (b) lack of studies prioritizing analyzes over time, for example, Window Analysis and; (c) lack of studies comparing efficiency in Latin America and Asia.
4 Structural change, innovation and economic complexityMany economic sectors have been created since the
Industrial Revolution, changing the goods produced and the social actors during the process of economic development (Saviotti & Pyka, 2013). This is important because, according to Prebisch (1949) and Furtado (1959), the restriction of the productive structure was responsible for generating problems in the distribution of income and employment in a country. According to IMF (2017), structural factors, such as an aggregate value of agriculture, industry and services, urban population, educational levels and demographic patterns under the fertility rate and mortality, are associated with economic development and play an important role in explaining inequality between countries. Recent studies revisit this issue, through the analysis of the export agenda, to predict the pattern of diversification (Hidalgo et al., 2007), economic growth (Agosin, 2009; Hidalgo & Hausmann, 2009; Hausmann et al., 2014) and income (Hartmann, 2014; Hartmann et al., 2016, 2017).
The Economic Complexity approach has argued that countries with high per capita income are characterized by the diversification of the export agenda and the extent to which technology-intensive products can be exported (Tacchella et al., 2013). According to Ferrarini & Scaramozzino (2016), developed economies show higher GDP growth due to their production of more complex goods, which are interconnected by a broader set of products and industries. Hidalgo & Hausmann (2009) have shown economic diversification leads the country to EG and long-term income growth.
For Hausmann et al. (2014), complexity defines the productive structure of a nation. The ability to produce machinery, medical equipment and other high-tech is considered more complex than the ability to export commodities. Nations with low diversification are
EG is commonly considered the unique way to achieve economic and human development. The relation of EG with HD is complex (UNDP, 2000). Sen (1998) analyzed the correlation between income and life expectancy in several countries. The author found some countries with lower incomes have presented a higher life expectancy similar than countries with higher incomes. For this reason, EG does not guarantee quality of life. Quality of EG and ability to face social problems promote HD (Sen, 1981; López et al., 2008).
Growth does not indicate immediate economic development or quality of life (Sachs, 2004; Schumpeter, 1934). On this field, economic literature has given attention to studies on HD, because it understands that increase in quality of life is more important than GDP growth. According to Sen (2001), development involves economic and social aspects, to promote the expansion of agents’ freedoms. One of these dimensions of freedoms is a social opportunity. Because opportunities occur when individuals have access to educational and health system, as well as basic sanitation. To enjoy these opportunities, agents should develop capabilities and functions. Social Efficiency have created indicators to analyze the relationship between EG and HD.
3 Social efficiencySocial Efficiency is a new field of study, with
several gaps to fill, which analyzes the capacity of a country to transform wealth produced into HD (Mariano et al., 2015). The pioneer to calculate the countries’ social efficiency was Despotis (2005a), using GDP per capita as input and education and life expectancy as outputs in the DEA - Variable Returns to Scale (VRS) model. The findings showed Canada, Sweden, Japan, United Kingdom, New Zealand, Spain and Greece as social efficient countries.
Despotis (2005b) also analyzed Asian countries’ social efficiency. This study showed Fiji, Hong Kong - China (SAR), South Korea, Mongolia, Myanmar, Nepal, Philippines, Solomon Islands, Sri Lanka and Vietnam as efficient nations. On the other hand, Morais & Camanho (2011) measured the social efficiency of 284 European cities, using GDP per capita as input and 29 indicators of quality of life as outputs. The results diverges of Human Development Index (HDI, and shows that not always richer countries or with a higher quality of life are the most efficient.
Mariano & Rebelatto (2014) applied weight restriction and tiebreaking methods in a global analysis. According to the authors, the most efficient countries to convert wealth into quality of life are the former Soviet Union countries with socialist past.
Reig-Martínez (2013) advanced in the analysis using the DEA Slacks-Based Model (SBM). The author measured the social efficiency of 42 countries in
842842/853
Ferraz, D. et al. Gest. Prod., São Carlos, v. 25, n. 4, p. 839-853, 2018
efficiency and competitiveness of enterprises. This is true especially in developing countries, where the agricultural machinery and equipment industry is generally the core of the capital goods sector which serve as a basis for development in other areas (Moralles & Rebelatto, 2016).
The structural change caused by innovation is the main way of creating new sectors, which are fundamental for sustaining economic development (Saviotti et al., 2016). This requires technical and social changes, as well as the development of new skills useful to the company and society (Kruss et al., 2015). An economy focused on the export of technological products and R&D tends to grow and develop socially.
One example is the urban centers present in the complex economies. They tend to offer better infrastructure and require more capacities of the agents involved. Hartmann (2014) argued that the region where a person lives influences their abilities. The jobs generated in urban centers are generally technologically intensive, requiring greater technical training and a network of knowledge shared by several individuals. This demonstrates the influence of economic complexity on human development.
5 Economic complexity and human developmentFor production, factors such as capital, land
and labor are needed. Countries also need to have adequate infrastructure, property rights, regulations, labor skills and skilled labor. However, Hidalgo & Hausmann (2009) argue that knowledge is also a relevant production factor, since goods are vehicles of knowledge (Hausmann et al., 2014). According to Hidalgo & Hausmann (2009), labor and capital are not enough to produce goods. Countries must have capacities, such as specific infrastructure, skilled labor, property rights and regulations. High-technology goods producer’s countries (medical equipment, software and others) need more advanced knowledge than commodities producer’s countries.
Hausmann et al. (2014) argue that complex economies are those knowledge producers through a network of people, creating a wide variety of knowledge-intensive products. On the other hand, low complexity economies are those with a narrow base of productive knowledge and produce a smaller variety of goods, which require less knowledge and less people integration.
In view of knowledge importance in complex societies, recent studies have argued that complexity may lead countries to Human Development. Hartmann et al. (2017) found a strong correlation between economic complexity, income inequality, education and GDP growth. Countries more complex showed higher
able to export less products with fewer technological intensity (Tacchella et al., 2013; Gala, 2017).
Economic Complexity refers to the types of products developed, due to a multiplicity of available knowledge. In a complex economy, individuals in a variety of jobs (finance, marketing, technology, human resources, operations, law) need to interact and combine their knowledge to make sophisticated products. Without this available knowledge, countries are not able to make products and wealth (Hausmann et al., 2014).
The importance of exporting high-tech products occurs because of the competitive advantage in the global economy. The greater the ability to produce complex goods, the greater the likelihood of relatively high yields in relation to countries with lesser ability (Tacchella et al., 2013). Countries capable of producing technological goods with diversified exports make the domestic market more dynamic, which requires more sophisticated and rare capacities. On the other hand, commodities dependent countries increase the macroeconomic volatility driven by unpredictable commodities prices and the real exchange-rate volatility discourages investment in tradable goods and services (Agosin, 2009; Ferrarini & Scaramozzino, 2016; Nkurunziza et al., 2017).
One way to verify the degree of complexity of a country is by the Economic Complexity Index (ECI), calculated from data from the United Nations (Hidalgo & Hausmann, 2009). Although ECI has been criticized on the theoretical and mathematical formulation (Tacchella et al., 2013), this is the unique index that we have available to analyze countries. The ECI shows the characteristics of production through exports. The higher the ECI, the more diversified the export agenda and the more complex the economy will be.
It is important to understand the factors that influence the elevation of the complexity of a country. Two factors that affect ECI are the diversification of exports, the ability to export high technology products, and spending on Research and Development (R&D). R&D spending is important because diversification and export of high technology products requires innovation. Companies carry out research and development activities, which generate better quality goods, to create new routines and make production more efficient. It is the research activities that provide the knowledge necessary for the creation of innovations (Saviotti & Pyka, 2004). The new sectors and the improvement of the products compensate for the decrease in the capacity of the established sectors by generating new jobs of skilled labors (Saviotti & Pyka, 2013).
According to Saviotti & Pyka (2004), R&D is the most common, but not the only example of the research and innovation activities that take place in companies. R&D is considered a non-traditional input that defines a significant percentage of the

843843/853
Economic Complexity and Human Development…
Ferrarini & Scaramozzino (2016) have shown that increasing complexity has increased the accumulation of human capital through the advancement of skills and the promotion of learning. Education showed a positive coefficient in relation to per capita production. The coefficient of labor force participation was negative due to the low substitution between the factor of production and the labor force employed in the poorer economies. Asian countries show sustained growth, while US, Germany, France, UK, Italy and Spain showed slower growth.
6 Growth and human development in Asia and Latin AmericaThe importance of comparing Asian and Latin
American countries occurs due to the development experiences of Asia and Latin America, contrasting over the last several decades (Agosin, 2009; Ungor, 2017). According to Huang et al. (2010), it is important to compare these two regions because Latin America is the birthplace of Dependency Theory, while Asian countries have been recognized as the most successful in exploiting the benefits of foreign resources. In addition, in the last decades, while Asian countries have grown economically through the export of technologically intentional products, raising human development, Latin American countries continued to export commodities, without altering the productive structure, although Latin America has improved the indicators of quality of life based on social policies.
Agosin (2009) shows that between 1981 and 2003, Asian exporters of manufactures grew faster than Latin American countries. Asian production and exports grew more than twice as fast as those in Latin America. Part of this growth can be explained by the rise in the level of labor productivity in Asia, which accounted for 15% of the US level in 1963. By 2010, Asian productivity had reached 70% of the US level. On the other hand, labor productivity in Latin America decreased from 35% in 1963 to 25% of the US level in 2010 (Ungor, 2017).
Asian productivity growth stems from the change in employment composition. The decline in the role of agriculture in Asia was 58% in 1963 to less than 7% in 2010. The share of manufacturing industry increased from about 10% in 1963 to 21% in 2010. In Latin America, agriculture accounted for 48% of total employment in 1963, decreasing its share to 15% in 2010. However, the participation of the manufacturing industry stagnated, without showing significant changes over time, going from 14.5% in 1963 to 16% at the end of the 1980s and declining to 12% in 2010 (Ungor, 2017). It is important to note that, according to Ranis et al. (2000), the reduction of poverty depends on the type of growth, the way
GDP growth and average years of study and better income distribution.
For Ferrarini & Scaramozzino (2016), economic complexity influences the development of new skills and the formation of human capital. Complex economic systems require a set of capabilities adaptable to technological change. For the economy to grow and modernize, the state must provide conditions for the intensification of innovation, competitiveness and economic diversification. Agosin (2009) argues that the production of technological goods requires more skilled workers, which also accelerates the training of other workers in an indirect way. In addition, introducing a new type of product increases the likelihood of creating new industries, as well as generating new production solutions.
For Mustafa et al. (2017), advanced Asian economies such as Japan, South Korea, and Taiwan have all achieved exceptionally high rates of growth over the past 30-40 years. In the same period there were rapid human development in these economies, bringing them to levels similar to those of the advanced industrialized countries. For example, Japan has the highest life expectancy among the countries analyzed. Another example is the increase in productivity in South Korea, which is linked to the strong improvement in the accumulation of human capital. The average number of years of schooling increased from 4.1 in 1960 to 12.0 in 2010. In China, there are still significant gaps in human capital, indicating that the Chinese government could stimulate economic growth through educational investment (Lee, 2016a, b).
Hartmann et al. (2016) compared income inequality and economic complexity between Latin America and some Asian countries (China, South Korea, Singapore, and Malaysia). This study is important because Latin America enjoyed higher commodity prices, which has improved social indicators, although it was not able to diversify the region’s export agenda for industrialized products.
According to Hartmann et al. (2017), even though Latin American economies showed social improvements, there was no economic diversification, which reflected in the lack of better quality jobs. On the other hand, Asian countries have invested in human capital and technological innovation have made their economies more robust and complex (Lee, 2016a).
Structural change is important as new technological sectors raise average wages and the demand for skilled labor, which requires higher educational levels (Antonelli, 2016). Labor-specialized education increases per capita income and consumer purchasing power, as well as improving the quality of goods produced by skilled workers (Saviotti et al., 2016). This virtuous cycle plays a fundamental role in transforming societies with an abundance of low-skilled workers.
844844/853
Ferraz, D. et al. Gest. Prod., São Carlos, v. 25, n. 4, p. 839-853, 2018
with the primary production sector. The availability of land for cultivation absorbs workers and migrants from rural areas, displacing skilled labor from other sectors of the economy. The region is susceptible to the “Dutch Disease” effect of a sector of expanding primary products (Bresser-Pereira, 2008). As the price of commodities increases, production and employment grow, specializing the region in the export of primary products (Barbier & Bugas, 2014). According to Barbier & Bugas, (2014), 55.3% of merchandise exports consist of primary products, corresponding to 63.5% of total exports. Only 20.8% of the workforce is in industry and the poverty rate is 41.2%. The results show inadequate access to the transportation system, infrastructure and the international market.
In Brazil, the government still needs to improve the strategy for industrial development. The industrial sector of the country requires highly educated workers and offers more attractive salaries (Ferraz et al., 2016). One successful example is the adoption of biotechnology for soy production, which has reduced the intensity of the workforce in agriculture and expanded employment in industry (Bustos et al., 2016). Another example is mechanization in the cultivation of sugarcane, which practically wiped out migratory flows in the poorest regions and generated employment opportunities for skilled labor in the country (Moraes et al., 2015) or the shift from a fossil-based to a bio-based economy (bioeconomy) which requires more efficient utilization of the biomass generated from agricultural production (Scheiterle et al., 2018). On the other hand, there is still technological adoption that is detrimental to local industry, such as the development of a technology that intensified corn planted area, which increased agricultural labor and contracted industrial employment (Bustos et al., 2016).
It is worth mentioning that technological specialization in specific sectors, such as agriculture in Brazil, result from the adoption of appropriate technologies to the inputs available in the local economy. On the other hand, other sectors, such as Brazilian solar collector manufacturers, have greater difficulty in absorptive capacity for the development of innovative products, corroborating the need for R&D investments (Guedes et al., 2017).
Antonelli (2016) argues that technologically backward countries adapt the technological resources of the advanced countries, which reduces technological congruence and total factor productivity. For this reason, the industrial policy of developing countries should favor structural changes that reinforce the supply of the region’s main production factors. Also, a training policy that supports the creation of skills and competence for regional human capital should be strengthened. In emphasizing the industrial and training policies for the betterment of the region and
employment is generated and the increase in income in the rural area.
Several studies have discussed how structural changes and public policies influence the development of countries. In Japan, agricultural mechanization freed the labor force for the industrial sector, raising wages and generating urbanization. This process lasted more than 15 years and occurred due to productivity growth in all economic sectors. In non-agricultural activities, productivity increased due to the adoption, imitation, and assimilation of advanced knowledge flows, which depended on the level of human capital (Esteban-Pretel & Sawada, 2014).
This structural change occurred because the Japanese government subsidized prices and investments to mechanize agriculture. For industrial development, the government lowered the interest rate and raised the level of loans and investments for the sector. The investments financed public enterprises linked to the infrastructure. Low interest rates have allowed the development of strategic sectors such as shipping, electric power, shipbuilding, automotive, machinery, iron and steel, coal mining and petroleum refining (Esteban-Pretel & Sawada, 2014).
On the other hand, South Korean development policy is based on exports. According to Lee (2016a), trade open the door to the import of cheaper intermediate goods and access to advanced Technologies which contributed to the rapid growth of the productivity of the industry. The export policy for industrialization, encouraged the performance of exporters by generating comparative advantage of Korean companies in international trade. These labor-intensive industries have become capital-intensive in electronics, machinery, automobiles, ships, and information and communications technology. Consequently, Korean per capita income has reached the level of developed countries.
Since its reformulation and economic opening, China has grown on average 9.5% per year (Lee, 2016b). Meanwhile, the Chinese economy lags behind other Asian economies, as China’s GDP per capita in 2011 ($ 8,850 PPP) is comparable to Korea’s level in 1988 ($ 9,137 PPP) and Japan’s in 1968 ($ 9,527 PPP). China’s relative productivity level (44 percent) in 2010 was lower than Korea’s in 1980. In this respect, Lee (2016b) states that the Chinese economy is more than 20 years behind Korea and more than 40 years behind Japan.
In order for China to move from a medium high economy to a high economy, it is necessary to develop technologically more sophisticated industries (Lee, 2016a). China’s technological progress depends on policies that promote technological innovation, increased R&D investment, and industrial modernization.
In Latin America, the development model is criticized because the modern and productive sector compete

845845/853
Economic Complexity and Human Development…
of the DMU, allowing the use of several inputs and outputs for the same index and it is not necessary to transform data to a common measured unit.
For Cook & Zhu (2014), the efficient piecewise linear frontier expresses the maximum number of outputs that can be produced per unit of input, thus representing the production limit determined by the technology of a sector.
This frontier separates the efficient DMU, localized at the border boundaries, from the inefficient ones. The distance from a DMU to the border is an indication of its efficiency level. Effective DMUs represent a “Best Practice Frontier”, serving as an analysis for the less efficient ones (Charnes et al., 1985).
We can use different models to implement DEA. These models differ according to their assumptions: a) returns of scale; b) orientation; and c) inputs and outputs combinations. According to Mariano & Rebelatto (2014), the type of returns of scale designates the two principal DEA models: Constant Returns to Scale (CRS) and Variable Returns to Scale (VRS or BCC). Table 1 shows the CRS and the BCC models formulation in their two possible orientations.
The hypothesis of CRS model considers that outputs vary proportionally to inputs in all regions of frontier (Charnes et al., 1978). However, this model does not consider the scale gains of a system, which demonstrates a limitation of this model (Mariano et al., 2015). On the other hand, the VRS model identify that variation of outputs is not necessarily equiproporcional to inputs, being in frontier three regions: increasing,
human capital there will be an increase in the level of social and economic development.
7 Method7.1 Data Envelopment Analysis (DEA)
Efficiency can be measured by dividing the current value of some system performance indicator by the maximum value that this indicator reaches (Mariano & Rebelatto, 2014). Decision Making Unit (DMU) is an independent system, which transforms a set of inputs into a set of outputs. The method used to determine system efficiency is Data Envelopment Analysis (DEA).
DEA is a non-parametric mathematical method based on linear programming developed by Charnes et al. (1978). The aim of this method is to measure the productive efficiency of a set of DMUs through the empirical construction of a piecewise linear frontier (Mariano & Rebelatto, 2014). This technique is flexible and able to adapt to different problems (Mariano et al., 2015; Camioto et al., 2016; Périco et al., 2017).
According to Cook & Zhu (2014), DEA allows measuring the relative efficiency of DMUs. Each DMU is a black box because its structures and internal operations are ignored. From the efficiency of each DMU, it is possible to elaborate a ranking of relative efficiency with attribution of weights, derived from the selected data that can vary from one DMU to another one (Cooper et al., 2006). According to Mariano et al. (2015), the set of weights maximizes the efficiency
Table 1. Main DEA radial models.
Model Input Oriented Output OrientedCCR m
i i0i 1
n
j j0j 1
m n
i ik j jki 1 j 1
MAX u .y
v .x 1
u .y v
:
.x 0, for k 1,2,...,h
Subject to=
=
= =
=
− ≤ =
∑
∑
∑ ∑
n
j j0j 1
m
i i0i 1m n
i ik j jki 1 j 1
MIN v .x
u .y 1
u .y v
:
.x 0, for k 1,2,...,h
Subject to=
=
= =
=
− ≤ =
∑
∑
∑ ∑
BCC m
i i0i 1
n
j j0j 1
m n
i ik j jki 1 j 1
MAX u .y w
v .x 1
u .y v .x w 0, for k 1,2,...,
:
h
w without signal restriction
Subject to=
=
= =
+
=
− + ≤ =
∑
∑
∑ ∑
01
01
1 1
.
. 1
. . 0, fo
r 1, 2,..
:
.,
n
j jj
m
i iim n
i ik j jki j
MIN v x w
u y
u y v x w k h
w without signal restrict
Subj
ion
ect to=
=
= =
−
=
− + ≤ =
∑
∑
∑ ∑
Where: jkx represents the amount of input j of DMU k; iky represents the amount of output i of DMU k; j0x represents the amount of input j of the DMU under analysis; i0y represents the amount of output i of the DMU under analysis; jv represents the weight of input j for the DMU under analysis; iu represents the weight of output i for the DMU under analysis; m is the quantity of analyzed outputs; n is the quantity of inputs analyzed and; w represents the scale factor. Source: Mariano & Rebelatto (2014, p. 5).
846846/853
Ferraz, D. et al. Gest. Prod., São Carlos, v. 25, n. 4, p. 839-853, 2018
12
kp
+= (1)
Number of Windows 1k p= − + (2)
In this article, we consider the period that includes the years between 2010 and 2014. Therefore, parameter k represents 5 years, the size of each window will be 3 and the number of windows will also be 3. The windows will be: a) 2010 to 2012; b) 2011 to 2013 and; c) 2012 to 2014.
We applied the DEA-BCC model to each of the windows. The final efficiency result of each DMU should be mean of the efficiencies obtained in all years and in all windows. The standard deviation of each DMU should be calculated to test the stability of its efficiency at over time.
We chose the Window Analysis to verify Economic Complexity variation of each country over time, especially for the Latin American countries. We argue that measuring mean and standard deviation of the countries’ efficiency is most significant for analyzing the countries that remained at the efficiency frontier during the proposed period.
7.3 Econometric analysisThe variables about Human Development of this
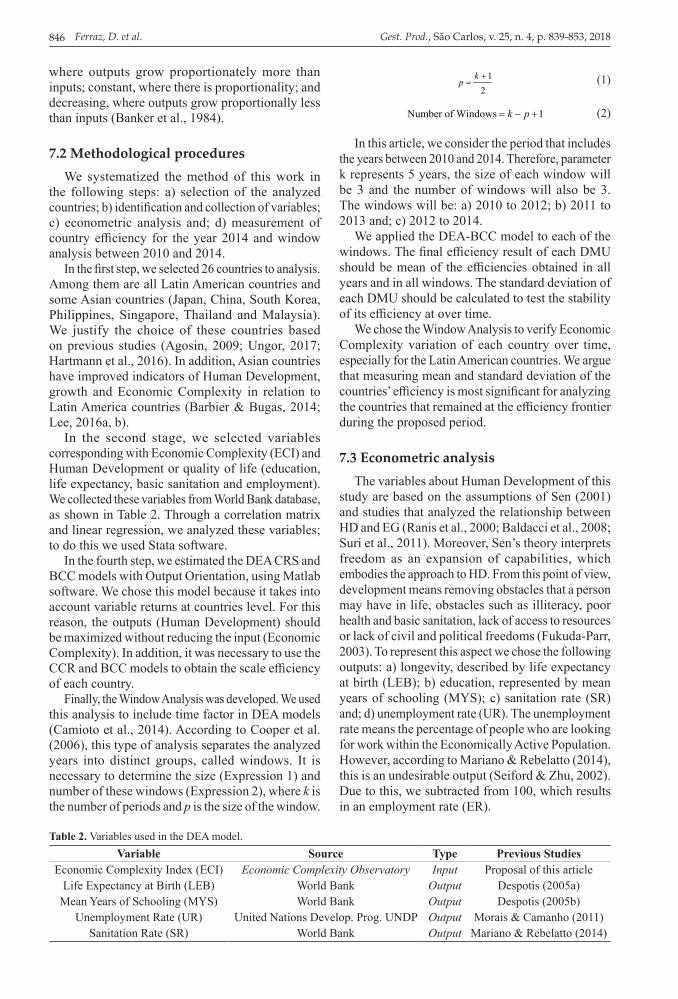
study are based on the assumptions of Sen (2001) and studies that analyzed the relationship between HD and EG (Ranis et al., 2000; Baldacci et al., 2008; Suri et al., 2011). Moreover, Sen’s theory interprets freedom as an expansion of capabilities, which embodies the approach to HD. From this point of view, development means removing obstacles that a person may have in life, obstacles such as illiteracy, poor health and basic sanitation, lack of access to resources or lack of civil and political freedoms (Fukuda-Parr, 2003). To represent this aspect we chose the following outputs: a) longevity, described by life expectancy at birth (LEB); b) education, represented by mean years of schooling (MYS); c) sanitation rate (SR) and; d) unemployment rate (UR). The unemployment rate means the percentage of people who are looking for work within the Economically Active Population. However, according to Mariano & Rebelatto (2014), this is an undesirable output (Seiford & Zhu, 2002). Due to this, we subtracted from 100, which results in an employment rate (ER).
where outputs grow proportionately more than inputs; constant, where there is proportionality; and decreasing, where outputs grow proportionally less than inputs (Banker et al., 1984).
7.2 Methodological proceduresWe systematized the method of this work in
the following steps: a) selection of the analyzed countries; b) identification and collection of variables; c) econometric analysis and; d) measurement of country efficiency for the year 2014 and window analysis between 2010 and 2014.
In the first step, we selected 26 countries to analysis. Among them are all Latin American countries and some Asian countries (Japan, China, South Korea, Philippines, Singapore, Thailand and Malaysia). We justify the choice of these countries based on previous studies (Agosin, 2009; Ungor, 2017; Hartmann et al., 2016). In addition, Asian countries have improved indicators of Human Development, growth and Economic Complexity in relation to Latin America countries (Barbier & Bugas, 2014; Lee, 2016a, b).
In the second stage, we selected variables corresponding with Economic Complexity (ECI) and Human Development or quality of life (education, life expectancy, basic sanitation and employment). We collected these variables from World Bank database, as shown in Table 2. Through a correlation matrix and linear regression, we analyzed these variables; to do this we used Stata software.
In the fourth step, we estimated the DEA CRS and BCC models with Output Orientation, using Matlab software. We chose this model because it takes into account variable returns at countries level. For this reason, the outputs (Human Development) should be maximized without reducing the input (Economic Complexity). In addition, it was necessary to use the CCR and BCC models to obtain the scale efficiency of each country.
Finally, the Window Analysis was developed. We used this analysis to include time factor in DEA models (Camioto et al., 2014). According to Cooper et al. (2006), this type of analysis separates the analyzed years into distinct groups, called windows. It is necessary to determine the size (Expression 1) and number of these windows (Expression 2), where k is the number of periods and p is the size of the window.
Table 2. Variables used in the DEA model.Variable Source Type Previous Studies
Economic Complexity Index (ECI) Economic Complexity Observatory Input Proposal of this articleLife Expectancy at Birth (LEB) World Bank Output Despotis (2005a)
Mean Years of Schooling (MYS) World Bank Output Despotis (2005b)Unemployment Rate (UR) United Nations Develop. Prog. UNDP Output Morais & Camanho (2011)
Sanitation Rate (SR) World Bank Output Mariano & Rebelatto (2014)
847847/853
Economic Complexity and Human Development…
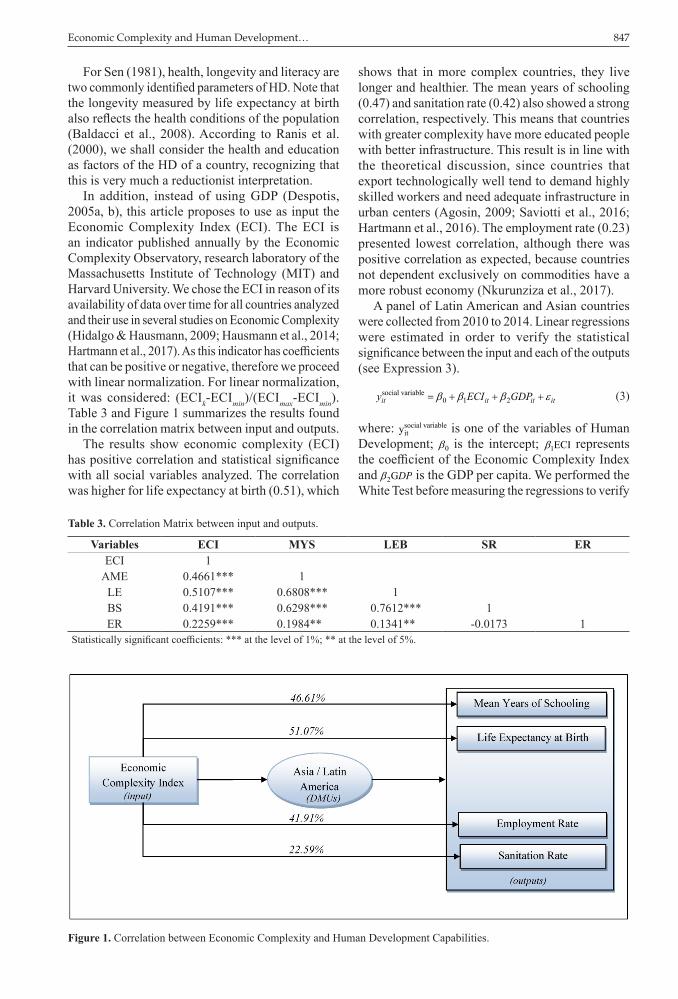
shows that in more complex countries, they live longer and healthier. The mean years of schooling (0.47) and sanitation rate (0.42) also showed a strong correlation, respectively. This means that countries with greater complexity have more educated people with better infrastructure. This result is in line with the theoretical discussion, since countries that export technologically well tend to demand highly skilled workers and need adequate infrastructure in urban centers (Agosin, 2009; Saviotti et al., 2016; Hartmann et al., 2016). The employment rate (0.23) presented lowest correlation, although there was positive correlation as expected, because countries not dependent exclusively on commodities have a more robust economy (Nkurunziza et al., 2017).
A panel of Latin American and Asian countries were collected from 2010 to 2014. Linear regressions were estimated in order to verify the statistical significance between the input and each of the outputs (see Expression 3).
social variable0 1 2it it it ity ECI GDP= + + +β β β ε (3)
where: social variableity is one of the variables of Human
Development; 0β is the intercept; 1ECIβ represents the coefficient of the Economic Complexity Index and 2GDPβ is the GDP per capita. We performed the White Test before measuring the regressions to verify
For Sen (1981), health, longevity and literacy are two commonly identified parameters of HD. Note that the longevity measured by life expectancy at birth also reflects the health conditions of the population (Baldacci et al., 2008). According to Ranis et al. (2000), we shall consider the health and education as factors of the HD of a country, recognizing that this is very much a reductionist interpretation.
In addition, instead of using GDP (Despotis, 2005a, b), this article proposes to use as input the Economic Complexity Index (ECI). The ECI is an indicator published annually by the Economic Complexity Observatory, research laboratory of the Massachusetts Institute of Technology (MIT) and Harvard University. We chose the ECI in reason of its availability of data over time for all countries analyzed and their use in several studies on Economic Complexity (Hidalgo & Hausmann, 2009; Hausmann et al., 2014; Hartmann et al., 2017). As this indicator has coefficients that can be positive or negative, therefore we proceed with linear normalization. For linear normalization, it was considered: (ECIk-ECImin)/(ECImax-ECImin). Table 3 and Figure 1 summarizes the results found in the correlation matrix between input and outputs.
The results show economic complexity (ECI) has positive correlation and statistical significance with all social variables analyzed. The correlation was higher for life expectancy at birth (0.51), which
Table 3. Correlation Matrix between input and outputs.
Variables ECI MYS LEB SR ERECI 1
AME 0.4661*** 1LE 0.5107*** 0.6808*** 1BS 0.4191*** 0.6298*** 0.7612*** 1ER 0.2259*** 0.1984** 0.1341** -0.0173 1
Statistically significant coefficients: *** at the level of 1%; ** at the level of 5%.
Figure 1. Correlation between Economic Complexity and Human Development Capabilities.
848848/853
Ferraz, D. et al. Gest. Prod., São Carlos, v. 25, n. 4, p. 839-853, 2018
social indicators. Probably, social policies explain part of this success (Hartmann, 2014).
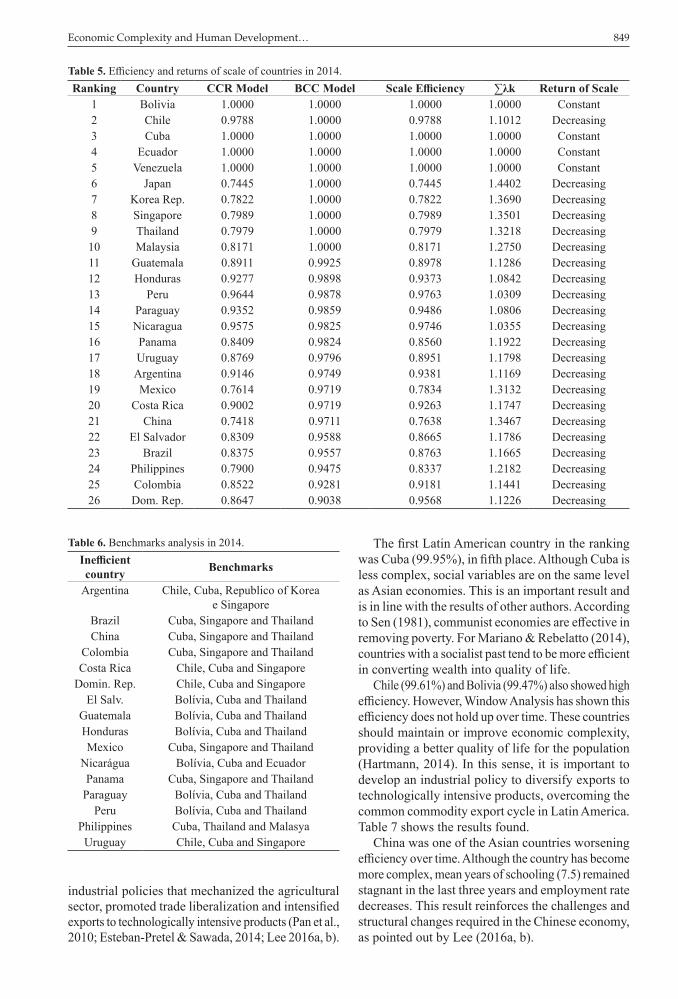
The scale efficiency analysis indicates countries with constant returns are predominantly Latin American (Bolivia, Cuba, Ecuador and Venezuela). The constant return of scale demonstrates that these countries are operating at their optimum scale and without waste. All other countries showed decreasing scale returns. This presents these countries are working above their optimal scale and wasting resources.
Brazil, for example, has technical efficiency of 95.6% in the BCC model, but the efficiency of scale was 87.6%. This occurred because Brazilian economy has relatively higher economic complexity than other Latin American countries, but its social indicators were smaller than the countries of the region. Table 5 presents the results found.
Benchmarking analysis showed which countries are most useful as benchmarks for those are not efficient. Cuba was the main benchmark for the other countries, showing although Cuban economy failed to diversify exports, human development indicators were exceptional, such as mean years of schooling (11.5). This indicator showed the best result in Latin America and Asia, behind only the South Korea. Table 6 presents the results found.
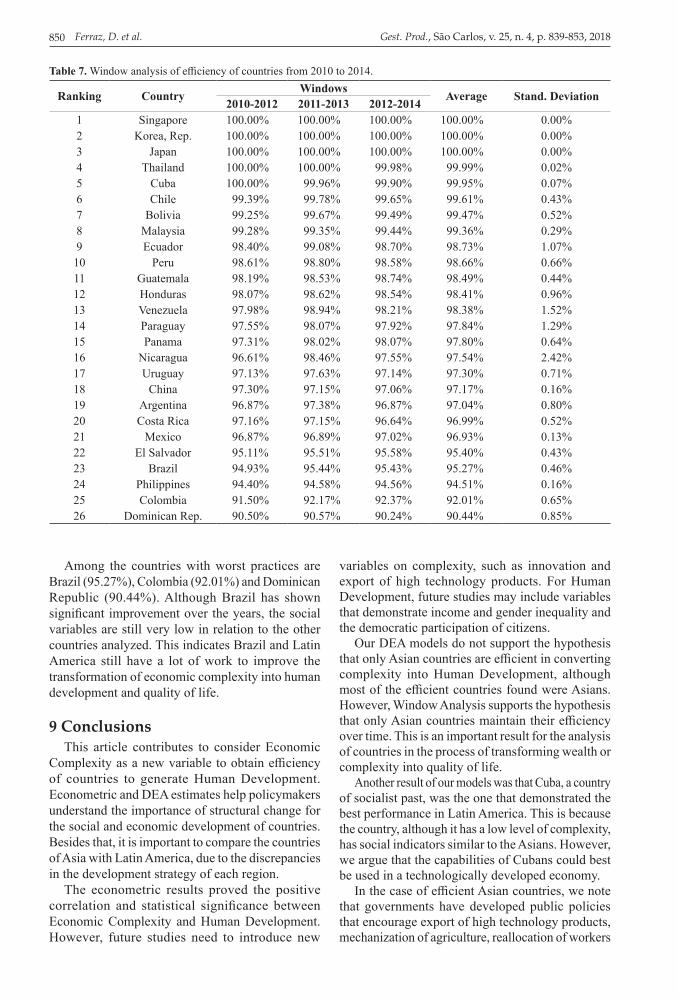
8.2 Window analysis: measuring efficiency between 2010 to 2014
Window Analysis shows which countries have remained technically efficient between 2010 and 2014, using the BCC model. The efficient countries were South Korea, Japan and Singapore. Thailand was also practically efficient (99.99%). This result confirms the initial hypothesis of this article that, over time, countries that are more complex tend to be more efficient and sustain this efficiency in generating human development for the population.
Sen (1981) had already pointed out that some countries, such as Singapore, have a very good performance in terms of social indicators. Moreover, we note that Japan and South Korea developed
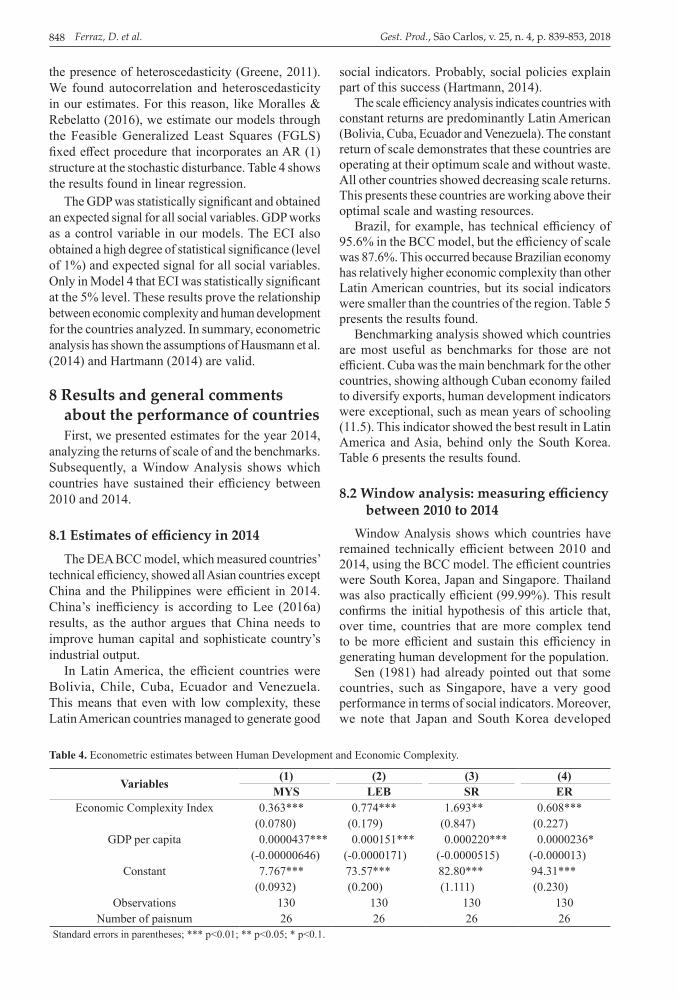
the presence of heteroscedasticity (Greene, 2011). We found autocorrelation and heteroscedasticity in our estimates. For this reason, like Moralles & Rebelatto (2016), we estimate our models through the Feasible Generalized Least Squares (FGLS) fixed effect procedure that incorporates an AR (1) structure at the stochastic disturbance. Table 4 shows the results found in linear regression.
The GDP was statistically significant and obtained an expected signal for all social variables. GDP works as a control variable in our models. The ECI also obtained a high degree of statistical significance (level of 1%) and expected signal for all social variables. Only in Model 4 that ECI was statistically significant at the 5% level. These results prove the relationship between economic complexity and human development for the countries analyzed. In summary, econometric analysis has shown the assumptions of Hausmann et al. (2014) and Hartmann (2014) are valid.
8 Results and general comments about the performance of countriesFirst, we presented estimates for the year 2014,
analyzing the returns of scale of and the benchmarks. Subsequently, a Window Analysis shows which countries have sustained their efficiency between 2010 and 2014.
8.1 Estimates of efficiency in 2014The DEA BCC model, which measured countries’
technical efficiency, showed all Asian countries except China and the Philippines were efficient in 2014. China’s inefficiency is according to Lee (2016a) results, as the author argues that China needs to improve human capital and sophisticate country’s industrial output.
In Latin America, the efficient countries were Bolivia, Chile, Cuba, Ecuador and Venezuela. This means that even with low complexity, these Latin American countries managed to generate good
Table 4. Econometric estimates between Human Development and Economic Complexity.
Variables (1) (2) (3) (4)MYS LEB SR ER
Economic Complexity Index 0.363*** 0.774*** 1.693** 0.608***(0.0780) (0.179) (0.847) (0.227)
GDP per capita 0.0000437*** 0.000151*** 0.000220*** 0.0000236*(-0.00000646) (-0.0000171) (-0.0000515) (-0.000013)
Constant 7.767*** 73.57*** 82.80*** 94.31***(0.0932) (0.200) (1.111) (0.230)
Observations 130 130 130 130Number of paisnum 26 26 26 26
Standard errors in parentheses; *** p<0.01; ** p<0.05; * p<0.1.
849849/853
Economic Complexity and Human Development…
The first Latin American country in the ranking was Cuba (99.95%), in fifth place. Although Cuba is less complex, social variables are on the same level as Asian economies. This is an important result and is in line with the results of other authors. According to Sen (1981), communist economies are effective in removing poverty. For Mariano & Rebelatto (2014), countries with a socialist past tend to be more efficient in converting wealth into quality of life.
Chile (99.61%) and Bolivia (99.47%) also showed high efficiency. However, Window Analysis has shown this efficiency does not hold up over time. These countries should maintain or improve economic complexity, providing a better quality of life for the population (Hartmann, 2014). In this sense, it is important to develop an industrial policy to diversify exports to technologically intensive products, overcoming the common commodity export cycle in Latin America. Table 7 shows the results found.
China was one of the Asian countries worsening efficiency over time. Although the country has become more complex, mean years of schooling (7.5) remained stagnant in the last three years and employment rate decreases. This result reinforces the challenges and structural changes required in the Chinese economy, as pointed out by Lee (2016a, b).
industrial policies that mechanized the agricultural sector, promoted trade liberalization and intensified exports to technologically intensive products (Pan et al., 2010; Esteban-Pretel & Sawada, 2014; Lee 2016a, b).
Table 5. Efficiency and returns of scale of countries in 2014.Ranking Country CCR Model BCC Model Scale Efficiency ∑λk Return of Scale
1 Bolivia 1.0000 1.0000 1.0000 1.0000 Constant2 Chile 0.9788 1.0000 0.9788 1.1012 Decreasing3 Cuba 1.0000 1.0000 1.0000 1.0000 Constant4 Ecuador 1.0000 1.0000 1.0000 1.0000 Constant5 Venezuela 1.0000 1.0000 1.0000 1.0000 Constant6 Japan 0.7445 1.0000 0.7445 1.4402 Decreasing7 Korea Rep. 0.7822 1.0000 0.7822 1.3690 Decreasing8 Singapore 0.7989 1.0000 0.7989 1.3501 Decreasing9 Thailand 0.7979 1.0000 0.7979 1.3218 Decreasing10 Malaysia 0.8171 1.0000 0.8171 1.2750 Decreasing11 Guatemala 0.8911 0.9925 0.8978 1.1286 Decreasing12 Honduras 0.9277 0.9898 0.9373 1.0842 Decreasing13 Peru 0.9644 0.9878 0.9763 1.0309 Decreasing14 Paraguay 0.9352 0.9859 0.9486 1.0806 Decreasing15 Nicaragua 0.9575 0.9825 0.9746 1.0355 Decreasing16 Panama 0.8409 0.9824 0.8560 1.1922 Decreasing17 Uruguay 0.8769 0.9796 0.8951 1.1798 Decreasing18 Argentina 0.9146 0.9749 0.9381 1.1169 Decreasing19 Mexico 0.7614 0.9719 0.7834 1.3132 Decreasing20 Costa Rica 0.9002 0.9719 0.9263 1.1747 Decreasing21 China 0.7418 0.9711 0.7638 1.3467 Decreasing22 El Salvador 0.8309 0.9588 0.8665 1.1786 Decreasing23 Brazil 0.8375 0.9557 0.8763 1.1665 Decreasing24 Philippines 0.7900 0.9475 0.8337 1.2182 Decreasing25 Colombia 0.8522 0.9281 0.9181 1.1441 Decreasing26 Dom. Rep. 0.8647 0.9038 0.9568 1.1226 Decreasing
Table 6. Benchmarks analysis in 2014.Inefficient country Benchmarks
Argentina Chile, Cuba, Republico of Korea e Singapore
Brazil Cuba, Singapore and ThailandChina Cuba, Singapore and Thailand
Colombia Cuba, Singapore and ThailandCosta Rica Chile, Cuba and Singapore
Domin. Rep. Chile, Cuba and SingaporeEl Salv. Bolívia, Cuba and Thailand
Guatemala Bolívia, Cuba and ThailandHonduras Bolívia, Cuba and ThailandMexico Cuba, Singapore and Thailand
Nicarágua Bolívia, Cuba and EcuadorPanama Cuba, Singapore and Thailand
Paraguay Bolívia, Cuba and ThailandPeru Bolívia, Cuba and Thailand
Philippines Cuba, Thailand and MalasyaUruguay Chile, Cuba and Singapore
850850/853
Ferraz, D. et al. Gest. Prod., São Carlos, v. 25, n. 4, p. 839-853, 2018
variables on complexity, such as innovation and export of high technology products. For Human Development, future studies may include variables that demonstrate income and gender inequality and the democratic participation of citizens.
Our DEA models do not support the hypothesis that only Asian countries are efficient in converting complexity into Human Development, although most of the efficient countries found were Asians. However, Window Analysis supports the hypothesis that only Asian countries maintain their efficiency over time. This is an important result for the analysis of countries in the process of transforming wealth or complexity into quality of life.
Another result of our models was that Cuba, a country of socialist past, was the one that demonstrated the best performance in Latin America. This is because the country, although it has a low level of complexity, has social indicators similar to the Asians. However, we argue that the capabilities of Cubans could best be used in a technologically developed economy.
In the case of efficient Asian countries, we note that governments have developed public policies that encourage export of high technology products, mechanization of agriculture, reallocation of workers
Among the countries with worst practices are Brazil (95.27%), Colombia (92.01%) and Dominican Republic (90.44%). Although Brazil has shown significant improvement over the years, the social variables are still very low in relation to the other countries analyzed. This indicates Brazil and Latin America still have a lot of work to improve the transformation of economic complexity into human development and quality of life.
9 ConclusionsThis article contributes to consider Economic
Complexity as a new variable to obtain efficiency of countries to generate Human Development. Econometric and DEA estimates help policymakers understand the importance of structural change for the social and economic development of countries. Besides that, it is important to compare the countries of Asia with Latin America, due to the discrepancies in the development strategy of each region.
The econometric results proved the positive correlation and statistical significance between Economic Complexity and Human Development. However, future studies need to introduce new
Table 7. Window analysis of efficiency of countries from 2010 to 2014.
Ranking Country Windows Average Stand. Deviation2010-2012 2011-2013 2012-20141 Singapore 100.00% 100.00% 100.00% 100.00% 0.00%2 Korea, Rep. 100.00% 100.00% 100.00% 100.00% 0.00%3 Japan 100.00% 100.00% 100.00% 100.00% 0.00%4 Thailand 100.00% 100.00% 99.98% 99.99% 0.02%5 Cuba 100.00% 99.96% 99.90% 99.95% 0.07%6 Chile 99.39% 99.78% 99.65% 99.61% 0.43%7 Bolivia 99.25% 99.67% 99.49% 99.47% 0.52%8 Malaysia 99.28% 99.35% 99.44% 99.36% 0.29%9 Ecuador 98.40% 99.08% 98.70% 98.73% 1.07%10 Peru 98.61% 98.80% 98.58% 98.66% 0.66%11 Guatemala 98.19% 98.53% 98.74% 98.49% 0.44%12 Honduras 98.07% 98.62% 98.54% 98.41% 0.96%13 Venezuela 97.98% 98.94% 98.21% 98.38% 1.52%14 Paraguay 97.55% 98.07% 97.92% 97.84% 1.29%15 Panama 97.31% 98.02% 98.07% 97.80% 0.64%16 Nicaragua 96.61% 98.46% 97.55% 97.54% 2.42%17 Uruguay 97.13% 97.63% 97.14% 97.30% 0.71%18 China 97.30% 97.15% 97.06% 97.17% 0.16%19 Argentina 96.87% 97.38% 96.87% 97.04% 0.80%20 Costa Rica 97.16% 97.15% 96.64% 96.99% 0.52%21 Mexico 96.87% 96.89% 97.02% 96.93% 0.13%22 El Salvador 95.11% 95.51% 95.58% 95.40% 0.43%23 Brazil 94.93% 95.44% 95.43% 95.27% 0.46%24 Philippines 94.40% 94.58% 94.56% 94.51% 0.16%25 Colombia 91.50% 92.17% 92.37% 92.01% 0.65%26 Dominican Rep. 90.50% 90.57% 90.24% 90.44% 0.85%

851851/853
Economic Complexity and Human Development…
Camioto, F. C., Rebelatto, D. A. N., & Rocha, R. T. (2016). Análise da eficiência energética nos países do BRICS: um estudo envolvendo a Análise por Envoltória de Dados. Gestão & Produção, 23(1), 192-203. http://dx.doi.org/10.1590/0104-530X1567-13.
Charnes, A., Cooper, W. W., & Rhodes, E. (1978). Measuring efficiency of decision-making units. European Journal of Operational Research, 2(6), 429-444. http://dx.doi.org/10.1016/0377-2217(78)90138-8.
Charnes, A., Cooper, W. W., Golany, B., Seiford, L., & Stutz, J. (1985). Foundations of data envelopment analysis for Pareto-Koopmans efficient empirical production-functions. Journal of Econometrics, 30(1-2), 91-107. http://dx.doi.org/10.1016/0304-4076(85)90133-2.
Cook, W. D.. & Zhu, J. (2014). Data envelopment analysis: a handbook on the modeling of internal structures and networks (International Series in Operations Research & Management Science). New York: Springer Science + Business Media. http://dx.doi.org/10.1007/978-1-4899-8068-7.
Cooper, W. W., Seiford, L. M., & Tone, K. (2006). Introduction to data envelopment analysis and its uses: with DEA-solver software and references. New York: Springer Science + Business Media.
Despotis, D. (2005a). A reassessment of the human development index via data envelopment analysis. The Journal of the Operational Research Society, 56(8), 969-980. http://dx.doi.org/10.1057/palgrave.jors.2601927.
Despotis, D. (2005b). Measuring human development via data envelopment analysis: the case of Asia and the Pacific. Omega, 33(5), 385-390. http://dx.doi.org/10.1016/j.omega.2004.07.002.
Esteban-Pretel, J., & Sawada, I. (2014). On the role of policy interventions in structural change and economic development: the case of post war Japan. Journal of Economic Dynamics & Control, 40, 67-83. http://dx.doi.org/10.1016/j.jedc.2013.12.009.
Ferrarini, B., & Scaramozzino, P. (2016). Production complexity, adaptability and economic growth. Structural Change and Economic Dynamics, 37, 52-61. http://dx.doi.org/10.1016/j.strueco.2015.12.001.
Ferraz, D., Oliveira, F. C. R. d., & Assumpção, M. R. P. (2016). Educação e renda dos trabalhadores na indústria brasileira sob a ótica da Visão Baseada em Recursos. Revista Espacios, 37(9), 15.
Fukuda-Parr, S. (2003). The human development paradigm: operationalizing Sen’s ideas on capabilities. Feminist Economics, 9(2-3), 301-317. http://dx.doi.org/10.1080/1354570022000077980.
Furtado, C. (1959). Formação econômica do Brasil. Rio de Janeiro: Fundo de Cultura.
Gala, P. (2017). Complexidade Econômica: uma nova perspectiva para entender a antiga questão da riqueza das nações. Rio de Janeiro: Contraponto.
in technologically sectors, such as Industry, and productivity increase. Note that these structural changes were accompanied by the increase of the individual’s capabilities, increase of the human capital and improvement in the infrastructure.
Finally, we note that the Latin American countries supported their development strategy through social policies that were important for improving social indicators but which were not able to change the economic structure of the countries. In this respect, it is possible to observe that the Latin American economies still have low participation of the Industry sector and, especially, exporting manufactured goods. This scenario keeps these countries dependent on commodity exports, which does not necessarily require the improvement of the capacities for a better Human Development. In this sense, we argue that policy makers need to develop an industrial policy in the region that aligns with social policy, promoting inclusive and egalitarian economic growth.
ReferencesAgosin, M. R. (2009). Export diversification and growth
in emerging economies. CEPAL Review, (97), 115-131.
Antonelli, C. (2016). Technological congruence and the economic complexity of technological change. Structural Change and Economic Dynamics, 38, 15-24. http://dx.doi.org/10.1016/j.strueco.2015.11.008.
Baldacci, E., Clements, B., Gupta, S., & Cui, Q. A. (2008). Social spending, human capital, and growth in developing countries. World Development, 36(8), 1317-1341. http://dx.doi.org/10.1016/j.worlddev.2007.08.003.
Banker, R. D., Charnes, A., & Cooper, W. W. (1984). Some models for estimating technical and scale inefficiencies in data envelopment analysis. Management Science, 30(9), 1078-1092. http://dx.doi.org/10.1287/mnsc.30.9.1078.
Barbier, E. B., & Bugas, J. S. (2014). Structural change, marginal land and economic development in Latin America and the Caribbean. Latin American Economic Review, 23(1), 3. http://dx.doi.org/10.1007/s40503-014-0003-5.
Bresser-Pereira, L. C. (2008). The Dutch disease and its neutralization: a Ricardian approach. Brazilian Journal of Political Economy, 28(1), 47-71. http://dx.doi.org/10.1590/S0101-31572008000100003.
Bustos, P., Caprettini, B., & Ponticelli, J. (2016). Agricultural productivity and structural transformation: evidence from Brazil. The American Economic Review, 106(6), 1320-1365. http://dx.doi.org/10.1257/aer.20131061.
Camioto, F. C., Mariano, E. B., & Rebelatto, D. A. D. (2014). Efficiency in Brazil’s industrial sectors in terms of energy and sustainable development. Environmental Science & Policy, 37, 50-60. http://dx.doi.org/10.1016/j.envsci.2013.08.007.

852852/853
Ferraz, D. et al. Gest. Prod., São Carlos, v. 25, n. 4, p. 839-853, 2018
Greene, W. H. (2011). Econometric analysis. New York: Prentice Hall.
Guedes, H. P., Ziviani, F., Paiva, R. V. C., Ferreira, M. A. T., & Herzog, M. M. (2017). Mensuração da capacidade absortiva: um estudo nas empresas brasileiras fabricantes de coletores solares. Gestão & Produção, 24(1), 50-63. http://dx.doi.org/10.1590/0104-530x2666-16.
Hartmann, D. (2014). Economic complexity and human development: how economic diversification and social networks affect human agency and welfare (Vol. 110). New York: Routledge.
Hartmann, D., Guevara, M., Jara-Figueroa, C., Aristarán, M., & Hidalgo, C. (2017). Linking economic complexity, institutions and income inequality. World Development, 93, 75-93. http://dx.doi.org/10.1016/j.worlddev.2016.12.020.
Hartmann, D., Jara-Figueroa, C., Guevara, M., Simoes, A., & Hidalgo, C. A. (2016). The structural constraints of income inequality in Latin America. Integration & Trade Journal, (40), 70-85.
Hausmann, R., Hidalgo, C. A., Bustos, S., Coscia, M., Simoes, A., & Yildirim, M. A. (2014). The atlas of economic complexity: mapping paths to prosperity. Cambridge: Mit Press.
Hidalgo, C. A., & Hausmann, R. (2009). The building blocks of economic complexity. Proceedings of the National Academy of Sciences of the United States of America, 106(26), 10570-10575. http://dx.doi.org/10.1073/pnas.0900943106. PMid:19549871.
Hidalgo, C. A., Klinger, B., Barabasi, A. L., & Hausmann, R. (2007). The product space conditions the development of nations. Science, 317(5837), 482-487. http://dx.doi.org/10.1126/science.1144581. PMid:17656717.
Huang, C. H., Teng, K. F., & Tsai, P. L. (2010). Inward and outward foreign direct investment and poverty: East Asia vs. Latin America. Review of World Economics, 146(4), 763-779. http://dx.doi.org/10.1007/s10290-010-0069-3.
International Monetary Fund – IMF. (2017). Fostering Inclusive Growth: G-20 leaders’ summit. Hamburg: IMF. Retrieved in 2017, September 15, from https://www.imf.org/external/np/g20/pdf/2017/062617.pdf
Kruss, G., McGrath, S., Petersen, I. H., & Gastrow, M. (2015). Higher education and economic development: The importance of building technological capabilities. International Journal of Educational Development, 43, 22-31. http://dx.doi.org/10.1016/j.ijedudev.2015.04.011.
Lee, J. W. (2016a). Korea’s economic growth and catch-up: implications for China. China & World Economy, 24(5), 71-97. http://dx.doi.org/10.1111/cwe.12175.
Lee, J.W. (2016b). China’s economic growth and convergence. CAMA Working Paper, (30), 1-54. http://dx.doi.org/10.2139/ssrn.2785015.
López, R., Thomaz, V., & Wang, Y. (2008). The quality of growth: fiscal policies for better results. Washington: IEG Working Papper.
Mariano, E. B., & Rebelatto, D. A. D. (2014). Transformation of wealth produced into quality of life: analysis of the social efficiency of nation-states with the DEA’s triple index approach. The Journal of the Operational Research Society, 65(11), 1664-1681. http://dx.doi.org/10.1057/jors.2013.132.
Mariano, E. B., Sobreiro, V. A., & Rebelatto, D. A. D. (2015). Human development and data envelopment analysis: a structured literature review. Omega-International Journal of Management Science, 54, 33-49. http://dx.doi.org/10.1016/j.omega.2015.01.002.
Moraes, M., Oliveira, F. C. R., & Diaz-Chavez, R. A. (2015). Socio-economic impacts of Brazilian sugarcane industry. Environmental Development, 16, 31-43. http://dx.doi.org/10.1016/j.envdev.2015.06.010.
Morais, P., & Camanho, A. S. (2011). Evaluation of performance of European cities with the aim to promote quality of life improvements. Omega, 39(4), 398-409. http://dx.doi.org/10.1016/j.omega.2010.09.003.
Moralles, H. F., & Rebelatto, D. A. D. (2016). The effects and time lags of R&D spillovers in Brazil. Technology in Society, 47, 148-155. http://dx.doi.org/10.1016/j.techsoc.2016.10.002.
Mustafa, G., Rizov, M., & Kernohan, D. (2017). Growth, human development, and trade: the Asian experience. Economic Modelling, 61, 93-101. http://dx.doi.org/10.1016/j.econmod.2016.12.007.
Nkurunziza, J. D., Tsowou, K., & Cazzaniga, S. (2017). Commodity Dependence and Human Development. African Development Review-Revue Africaine De Developpement, 29(S1), 27-41. http://dx.doi.org/10.1111/1467-8268.12231.
Pan, T. W., Hung, S. W., & Lu, W. M. (2010). DEA performance measurement of the national innovation system in Asia and Europe. Asia-Pacific Journal of Operational Research, 27(3), 369-392. http://dx.doi.org/10.1142/S0217595910002752.
Périco, A. E., Santana, N. B., & Rebelatto, D. A. N. (2017). Eficiência dos aeroportos internacionais brasileiros: uma análise envoltória de dados com bootstrap. Gestão & Produção, 24(2), 370-381. http://dx.doi.org/10.1590/0104-530x1810-15.
Prebisch, R. (1949). The Economic Development of Latin America and its principal problems. New York: United Nations.
Ranis, G., Stewart, F., & Ramirez, A. (2000). Economic growth and human development. World Development, 28(2), 197-219. http://dx.doi.org/10.1016/S0305-750X(99)00131-X.
Reig-Martínez, E. (2013). Social and Economic Wellbeing in Europe and the Mediterranean basin: building an enlarged human development indicator. Social Indicators Research, 111(2), 527-547. http://dx.doi.org/10.1007/s11205-012-0018-8.
853853/853
Economic Complexity and Human Development…
Sen, A. (1981). Public action and the quality of life in developing countries. Oxford Bulletin of Economics and Statistics, 43(4), 287-319. http://dx.doi.org/10.1111/j.1468-0084.1981.mp43004001.x. PMid:12339005.
Sen, A. (1998). Mortality as an indicator of economic success and failure. Economic Journal (London), 108(446), 1-25. http://dx.doi.org/10.1111/1468-0297.00270.
Sen, A. (2001). Development as freedom. Oxford: Oxford Paperbacks.
Suri, T., Boozer, M. A., Ranis, G., & Stewart, F. (2011). Paths to success: the relationship between human development and economic growth. World Development, 39(4), 506-522. http://dx.doi.org/10.1016/j.worlddev.2010.08.020.
Tacchella, A., Cristelli, M., Caldarelli, G., Gabrielli, A., & Pietronero, L. (2013). Economic complexity: conceptual grounding of a new metrics for global competitiveness. Journal of Economic Dynamics & Control, 37(8), 1683-1691. http://dx.doi.org/10.1016/j.jedc.2013.04.006.
Ungor, M. (2017). Productivity growth and labor reallocation: Latin America versus East Asia. Review of Economic Dynamics, 24, 25-42. http://dx.doi.org/10.1016/j.red.2016.12.004.
United Nations Development Programme – UNDP. (2000). The Human Development Report 2000. New York: Oxford University Press.
United Nations Development Programme – UNDP. (2016). The Human Development Report 2016. New York: Oxford University Press.
Sachs, I. (2004). Desenvolvimento includente, sustentável, sustentado. Rio de Janeiro: Garamond.
Saviotti, P. P., & Pyka, A. (2004). Economic development by the creation of new sectors. Journal of Evolutionary Economics, 14(1), 1-35. http://dx.doi.org/10.1007/s00191-003-0179-3.
Saviotti, P. P., & Pyka, A. (2013). From necessities to imaginary worlds: structural change, product quality and economic development. Technological Forecasting and Social Change, 80(8), 1499-1512. http://dx.doi.org/10.1016/j.techfore.2013.05.002.
Saviotti, P. P., Pyka, A., & Jun, B. (2016). Education, structural change and economic development. Structural Change and Economic Dynamics, 38, 55-68. http://dx.doi.org/10.1016/j.strueco.2016.04.002.
Scheiterle, L., Ulmer, A., Birner, R., & Pyka, A. (2018). From commodity-based value chains to biomass-based value webs: the case of sugarcane in Brazil’s bioeconomy. Journal of Cleaner Production, 172, 3851-3863. http://dx.doi.org/10.1016/j.jclepro.2017.05.150.
Schumpeter, J. A. (1934). The theory of economic development: an inquiry into profits, capital, credit, interest, and the business cycle (Vol. 55). London: Transaction Publishers.
Seiford, L. M., & Zhu, J. (2002). Modeling undesirable factors in efficiency evaluation. European Journal of Operational Research, 142(1), 16-20. http://dx.doi.org/10.1016/S0377-2217(01)00293-4.