Embed Size (px)
Citation preview
EFEITOS DOS PARÂMETROS DE RECOZIMENTO EM UM AÇO AVANÇADO
DE ALTA RESISTÊNCIA DO TIPO DP980
Bruno Felipe Leitão Almeida
Projeto de Graduação apresentado ao Curso de
Engenharia de Materiais da Escola Politécnica,
Universidade Federal do Rio de Janeiro, como
parte dos requisitos necessários à obtenção do
título de Engenheiro.
Orientadora: Adriana da Cunha Rocha
Rio de Janeiro
Janeiro de 2019
iii
Almeida, Bruno Felipe Leitão
Efeitos dos parâmetros de recozimento em um aço
avançado de alta resistência do tipo DP980 / Bruno Felipe
Leitão Almeida. – Rio de Janeiro: UFRJ/ Escola Politécnica,
2019.
XIV, 45 p.: il; 29,7 cm.
Orientadora: Adriana da Cunha Rocha
Projeto de graduação – UFRJ/Escola Politécnica/
Curso de Engenharia de Materiais, 2019.
Referências Bibliográficas: p. 44-45.
1. Tratamento Térmico de Aços.
I. Cunha Rocha, Adriana da. II. Universidade Federal do
Rio de Janeiro, Escola Politécnica, Curso de Engenharia de
Materiais. III. Efeitos dos parâmetros de recozimento em
um aço avançado de alta resistência do tipo DP980.

iv
Dedico às minhas avós,
Maria Regina Heide Almeida e Yacy de Andrade Leitão

v
AGRADECIMENTOS
À minha família, especialmente minha Tia Tina e Tio Márcio pelas discussões, aos meus
avôs Vicente e Waldere, e à Safira.
À minha mãe e ao meu pai.
Aos meus amigos e amigas, do ORT, da UFRJ, da Mines e da Vida.
Ao corpo docente da UFRJ, especialmente ao Felipe, ao Bernardo e à Adriana.
À minha irmã.
Ao meu irmão pelos socos trocados na aula de boxe e conversas filosóficas quando estava
estressado.
vi
Resumo do Projeto de Graduação apresentado à Escola Politécnica/ UFRJ como parte dos
requisitos necessários para obtenção do grau de Engenheira de Materiais.
EFEITOS DOS PARÂMETROS DE RECOZIMENTO EM UM AÇO AVANÇADO DE
ALTA RESISTÊNCIA DO TIPO DP980
Bruno Felipe Leitão Almeida
Janeiro/2019
Orientadora: Adriana da Cunha Rocha.
Curso: Engenharia de Materiais
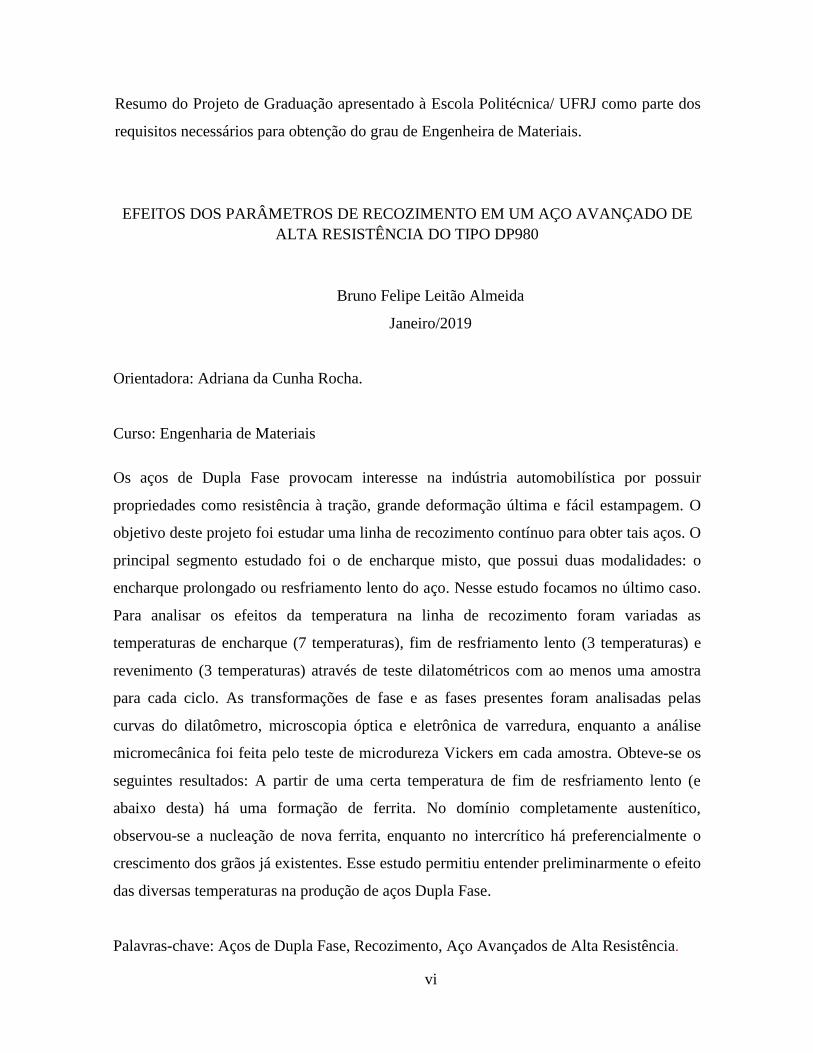
Os aços de Dupla Fase provocam interesse na indústria automobilística por possuir
propriedades como resistência à tração, grande deformação última e fácil estampagem. O
objetivo deste projeto foi estudar uma linha de recozimento contínuo para obter tais aços. O
principal segmento estudado foi o de encharque misto, que possui duas modalidades: o
encharque prolongado ou resfriamento lento do aço. Nesse estudo focamos no último caso.
Para analisar os efeitos da temperatura na linha de recozimento foram variadas as
temperaturas de encharque (7 temperaturas), fim de resfriamento lento (3 temperaturas) e
revenimento (3 temperaturas) através de teste dilatométricos com ao menos uma amostra
para cada ciclo. As transformações de fase e as fases presentes foram analisadas pelas
curvas do dilatômetro, microscopia óptica e eletrônica de varredura, enquanto a análise
micromecânica foi feita pelo teste de microdureza Vickers em cada amostra. Obteve-se os
seguintes resultados: A partir de uma certa temperatura de fim de resfriamento lento (e
abaixo desta) há uma formação de ferrita. No domínio completamente austenítico,
observou-se a nucleação de nova ferrita, enquanto no intercrítico há preferencialmente o
crescimento dos grãos já existentes. Esse estudo permitiu entender preliminarmente o efeito
das diversas temperaturas na produção de aços Dupla Fase.
Palavras-chave: Aços de Dupla Fase, Recozimento, Aço Avançados de Alta Resistência.
vii
Abstract of Undergraduate Project presented to POLI/UFRJ as a partial fulfillment of the
requirements for the degree of Materials Engineer.
EFFECT OF ANNEALING PARAMETERS ON ADVANCED HIGH
STRENGTH STEEL DP980
Bruno Felipe Leitão Almeida
January/2019
Advisor: Adriana da Cunha Rocha.
Course: Materials Engineering
Dual-phase (DP) steels arouse the interest of the automobile industry due to their
properties, such as tensile strengths, high elongation and hole expansion. The objective of
this project was to study a continuous annealing line for DP steels. The main segment
studied was the mixed soaking section, which can be used either for soaking or for slow-
cooling. This project was focused on the latter. In order to analyze all the effects of the heat
treatments, it was decided to vary the temperatures of soaking (3 temperatures), end of
slow-cooling (7 temperatures) and tempering (3 temperatures) through dilatometric trials.
The phases present and phase transformations analysis was performed through the
dilatometer curves, optical and scanning electronic microscopic, while the micromechanical
analysis was through Vickers microhardness test. The main results are: At given
temperature of end of slow-cooling and below it, there is ferrite formation. During slow-
cooling from full-austenitic region new ferrite nucleates, while upon intercritical annealing,
the growth of previous ferrite grains is preferred. This study allowed preliminary
understanding of the temperature influence on the DP steels production.
Keywords: Dual-Phase Steels, Annealing, AHSS
viii
CONTENTS
CONTENTS ............................................................................................................ viii
LIST OF FIGURES .................................................................................................... x
LIST OF EQUATIONS ........................................................................................... xiv
LIST OF TABLES ................................................................................................... xv
LIST OF ABBREVIATIONS ................................................................................. xvi
1. INTRODUCTION ............................................................................................ 1
2. LITERATURE REVIEW ................................................................................. 8
1.1 PHASES OF STEEL AND THEIR INFLUENCE ON DP STEELS ........... 8
1.1.1 FERRITE ................................................................................................ 8
1.1.2 AUSTENITE .......................................................................................... 9
1.2 MARTENSITE ........................................................................................... 11
1.2.1 MARTENSITE START TEMPERATURE ......................................... 12
1.3 MECHANICAL PROPERTIES AND MICROSTRUCTURE .................. 13
1.4 TRANSFORMATION TEMPERATURE ................................................. 15
1.5 MICROSTRUCTURE DEVELOPMENT DURING ANNEALING ........ 16
1.5.1 INHERITANCE FROM ROLLING PROCESSES .............................. 17
1.5.2 HEATING AND SOAKING ................................................................ 19
1.5.3 COOLING SEGMENT ......................................................................... 26
1.5.4 TEMPERING ........................................................................................ 27
2 EXPERIMENTAL PROCEDURE .................................................................... 32
2.1 MATERIALS .............................................................................................. 32
2.2 SAMPLE CHARACTERIZATION ........................................................... 32
ix
2.3 DILATOMETRIC TRIALS ....................................................................... 34
2.3.1 CCT ....................................................................................................... 36
2.3.2 ANNEALING PARAMETERS ........................................................... 37
2.4 COOLING LIMITATIONS ........................................................................ 39
3 RESULTS: CCT ................................................................................................. 40
3.1 CCT ............................................................................................................. 40
3.2 MICROSTRUCTURAL CHARACTERIZATION .................................... 42
4 RESULTS: ANNEALING PARAMETERS ..................................................... 44
4.1 IMPACT OF THE SOAKING SEGMENT ................................................ 44
4.1.1 MICROSTRUCTURAL CHARACTERIZATION .............................. 44
4.1.2 MICROHARDNESS TESTING ........................................................... 49
4.2 IMPACT OF THE SLOW-COOLING SEGMENT ................................... 50
4.2.1 MICROSTRUCTURAL CHARACTERIZATION .............................. 50
4.2.2 MICROHARDNESS TESTING ........................................................... 55
4.3 IMPACT OF TEMPERING ....................................................................... 56
5 CONCLUSION .................................................................................................. 58
6 FURTHER WORK ............................................................................................ 59
6.1 FIRST HEATING SEGMENT ................................................................... 59
6.2 IMPACT OF THE SPEED LINE ............................................................... 60
7 REFERENCES ................................................................................................... 61
x
LIST OF FIGURES
Figure 1: Family of steels classified by their relation between Elongation vs Tensile
Strength. (FONSTEIN, 2015) ................................................................................................. 1
Figure 2: One classic possible metallurgical route for a DP steel. ............................. 2
Figure 3: Example of DP steels as safety details in car bodies (GRANBOM, 2010). 3
Figure 4: SEM picture of the microstructure of a DP800 steel. Using the in-lens
detector the hard martensite phase appears as white areas and the soft ferrite phase is dark. 4
Figure 5: Schematic of both heat treatment methods used to obtain a DP ferrite-
martensite microstructure. Abbreviations: A, austenite; F, ferrite; M, martensite. The
temperatures at which austenite formation starts (Ac1) and ends (Ac3), as well as the
martensite transformation temperatures, are alloy dependent (TASAN et al., 2015). ........... 5
Figure 6: Graph of temperature in function of time for two heat treatments: slow-
cooling and extended soaking. ............................................................................................... 7
Figure 7: Classical Fe-C diagram. (KRAUSS, 2005) ............................................... 10
Figure 8: Stress-strain curve for a dual-phase steel in comparison with other sheet
steels (WASHKO; AGGEN, 1990). ..................................................................................... 14
Figure 9: Example of microstructure and texture evolution during hot rolling and
cold rolling for the sheet center and the near-surface regions of an alloy with 0.147-wt% C,
0.403-wt% Si, and 1.868-wt% Mn (TASAN et al., 2015). .................................................. 18
Figure 10: Recrystallization of ferrite at various temperatures with the chemical
composition 0.08C-1.45Mn-0.21Si. (GRANBOM, 2010) ................................................... 22
xi
Figure 11: Kinetics of austenite formation in 0.12C-1.5Mn steel (WASHKO;
AGGEN, 1990). .................................................................................................................... 23
Figure 12: Evolution of the martensite volume fraction (VM) and hardness for
different annealing treatments steel with 0.147-wt% C, 0.403-wt% Si, and 1.868-wt% Mn
alloying content (TASAN et al., 2015). ............................................................................... 25
Figure 13: Effect of tempering temperature on DP steel TS, YS and YS/TS ratio
(FONSTEIN, 2015). ............................................................................................................. 27
Figure 14: Effect of tempering temperatures and carbon content on the martensite
hardness. ............................................................................................................................... 29
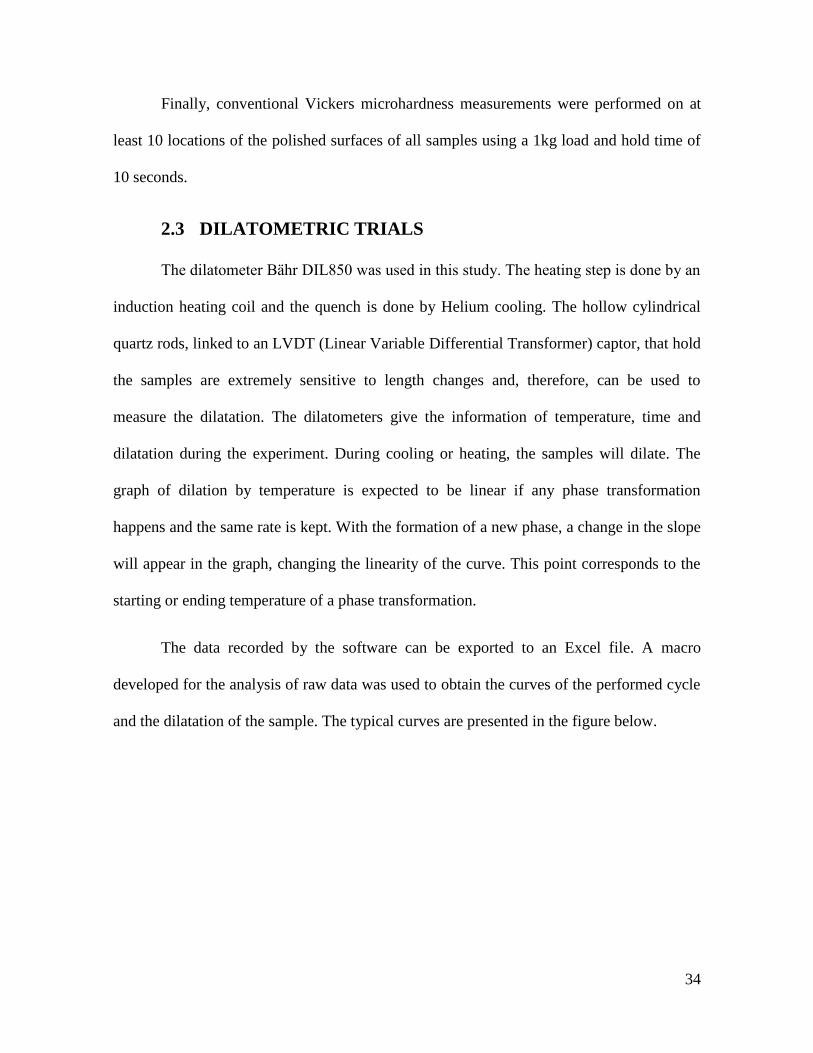
Figure 15: A typical curve o dilatation by temperature given by the dilatometer, for
the annealing with slow-cooling. .......................................................................................... 35
Figure 16: The theoretical cooling and the cooling achieved by the equipment. ..... 39
Figure 17: Real cooling from dilatometer and phase transformations observed by the
dilatometer signal. ................................................................................................................ 40
Figure 18: CCT diagram. .......................................................................................... 41
Figure 19: Samples etched with Nital: (a) SEM and (b) Optical views of the sample
cooled with 1ºC/s rate; (c) SEM and (d) Optical views of the sample cooled with 10ºC/s; (e)
SEM and (f) Optical views of the samples cooled with 50ºC/s (magnification of 2500x for
SEM and 1000x for optical). ................................................................................................ 43
Figure 20: Samples soaked at Ts2 (a) and Ts3(b) and then etched with Nital
(magnification of 1000x). ..................................................................................................... 44
Figure 21: Ferrite phase fraction dependence of soaking temperature. Ferrite phase
fraction was measured by color contrasting method using Metabisulphite etching in at least
10 images for each sample.................................................................................................... 45
xii
Figure 22: Samples etched with Metabisulphite to put in evidence the ferrite: (a)
Sample in the Ts1 soaking state; (b) Sample in the Ts2 soaking state; (c) Sample in the Ts3
soaking state (Magnification of 1000x). ............................................................................... 46
Figure 23: Prior austenite grain size variation in function of soaking temperature. 47
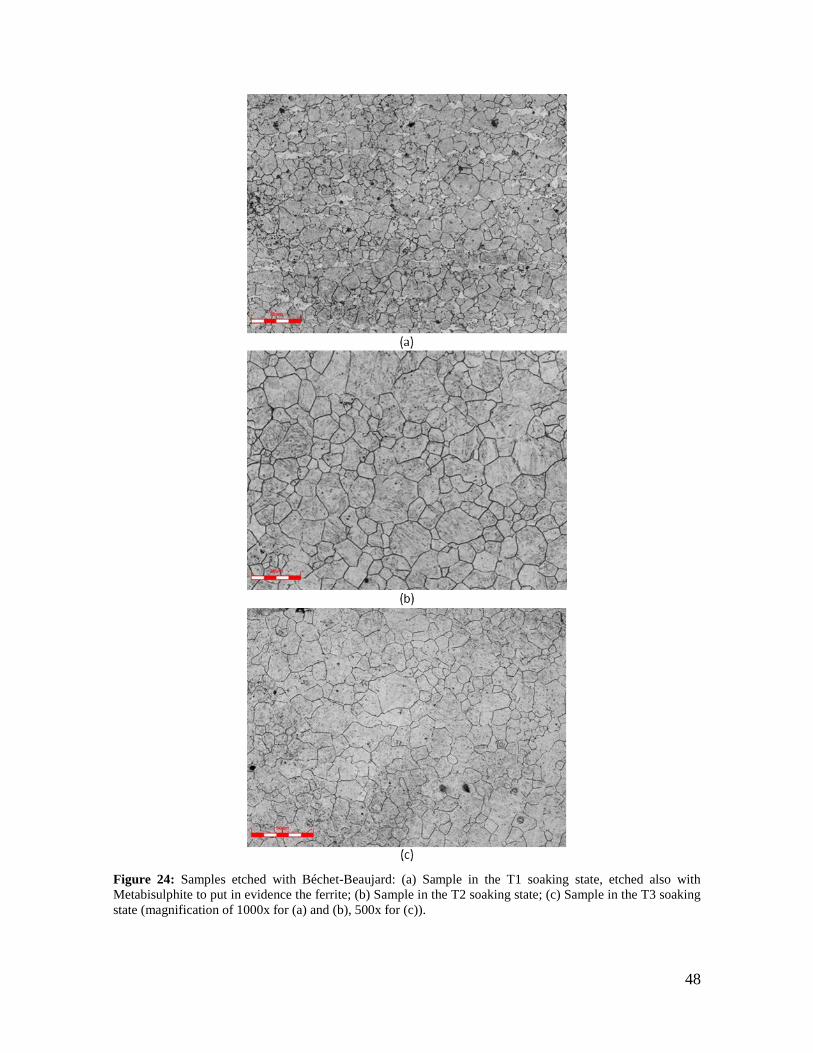
Figure 24: Samples etched with Béchet-Beaujard: (a) Sample in the T1 soaking
state, etched also with Metabisulphite to put in evidence the ferrite; (b) Sample in the T2
soaking state; (c) Sample in the T3 soaking state (magnification of 1000x for (a) and (b),
500x for (c)). ......................................................................................................................... 48
Figure 25: Micro Vickers hardness variation as a function of the soaking
temperature. .......................................................................................................................... 49
Figure 26: (a), (b) and (c) show The evolution of microstructure starting from Ts2.
Respectively, (a) is the image ending of slow-cooling at Tsc3, (c) at Tsc2, and (d) at Tsc1.
(d), (e) and (f) show the evolution of microstructure and ferrite phase fraction from Ts7.
Respectively, (a) is the image ending of slow-cooling at Tsc1, (b) at Tsc2 and (c) at Tsc3.
.............................................................................................................................................. 51
Figure 27: The evolution of ferrite phase fraction with the ending temperature of
slow-cooling. Ferrite phase fraction was measured by color contrasting method using
Metabisulphite etching in at least 10 images for each sample. ............................................ 52
Figure 28: The reduction of ferrite elongation and preferential direction of growth
noticed in the microstructural, images from the ending of slow-cooling at Tsc1 of samples
soaked at the three different temperatures. Respectively, (a) is the image from the sample
soaked at Ts2, (b) at Ts5 and (c) at Ts7. (Magnification of 1000x) ..................................... 54
Figure 29: Micro Vickers hardness dependence of ending temperature of slow-
cooling, for the three different temperatures of soaking. ..................................................... 55

xiii
Figure 30: Ferrite Fraction of the tempered samples. ............................................... 56
Figure 31: Hardness variation by tempering temperature. ....................................... 57
Figure 32: Graph of temperature in function of time for two heat treatments at the
first heating segment: normal heating rate and higher heating rate. ..................................... 59
Figure 33: Effect of the higher heating rate on the prior austenite grain size. ......... 60
Figure 34: Graph of temperature in function of time for two heat treatments: at
normal and faster line speed. ................................................................................................ 60

xiv
LIST OF EQUATIONS
Equation 1: Van Bohemen’s Ms empircal equation (VAN BOHEMEN, 2012) ..... 12
xv
LIST OF TABLES
Table 1: Typical dual-phase steel composition obtained through continuous
annealing, hot-rolled gage (WASHKO; AGGEN, 1990). ...................................................... 6
Table 2: Chemical composition (mass fraction) of the commercial material tested. 32
Table 3: Etchants for metallographic characterization. ............................................ 33
Table 4: Stop cooling temperatures for each cooling rate; except 20°C points, all
were quenched stopped. ........................................................................................................ 36
Table 5: Different studied soaking temperatures and their respective heating rates.37
Table 6: Slow-cooling ending temperatures for different soaking temperatures
(Tsc1<Tsc2<Tsc3). ............................................................................................................... 38
xvi
LIST OF ABBREVIATIONS
AHSS - Advanced High Strength Steel
DP – Dual-Phase
LA – Low Alloy
CAL – Continuous Annealing Line
VM - Martensite Volume Fraction
SM - Martensite Grain Size
CM - Martensite Carbon Content
SF - Ferrite Grain Size
GND - Geometrically Necessary Dislocations
Ms – Starting Temperature of Martensitic Transformation
LLT – Low Temperature Tempered
SEM – Scanning Electron Microscope
LVDT - Linear Variable Differential Transformer
CCT – Continuous Cooling Transformation Diagram
STEM – Scanning Transmission Electron Microscope
SC – Slow-cooling
YS – Yield Strength
xvii
TS – Tensile Strength
HR – Heating Rate
Ts – Soaking Temperature
Tsc – Slow-cooling Temperature
Tt- Tempering Temperature
1
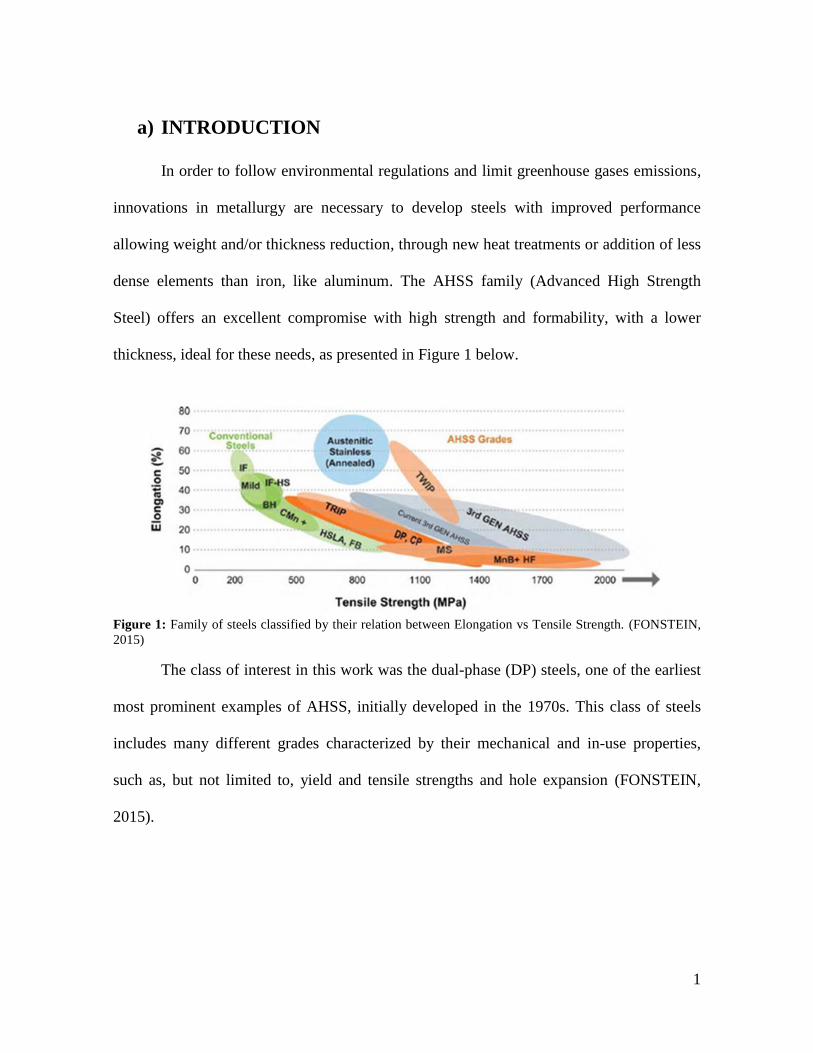
a) INTRODUCTION
In order to follow environmental regulations and limit greenhouse gases emissions,
innovations in metallurgy are necessary to develop steels with improved performance
allowing weight and/or thickness reduction, through new heat treatments or addition of less
dense elements than iron, like aluminum. The AHSS family (Advanced High Strength
Steel) offers an excellent compromise with high strength and formability, with a lower
thickness, ideal for these needs, as presented in Figure 1 below.
Figure 1: Family of steels classified by their relation between Elongation vs Tensile Strength. (FONSTEIN,
2015)
The class of interest in this work was the dual-phase (DP) steels, one of the earliest
most prominent examples of AHSS, initially developed in the 1970s. This class of steels
includes many different grades characterized by their mechanical and in-use properties,
such as, but not limited to, yield and tensile strengths and hole expansion (FONSTEIN,
2015).
2
The classical microstructure of a DP developed in the 1990s is around 20% hard
martensite particles dispersed in a soft ductile ferrite matrix, with a tensile strength value of
approximately 550 MPa (WASHKO; AGGEN, 1990). Nowadays, dual phase steels show a
wider range of microstructures, still mainly composed of two phases; normally a ferrite
matrix and a dispersed second phase of martensite, retained austenite and/or bainite. Some
small amounts of pearlite may be also present (GRANBOM, 2010).
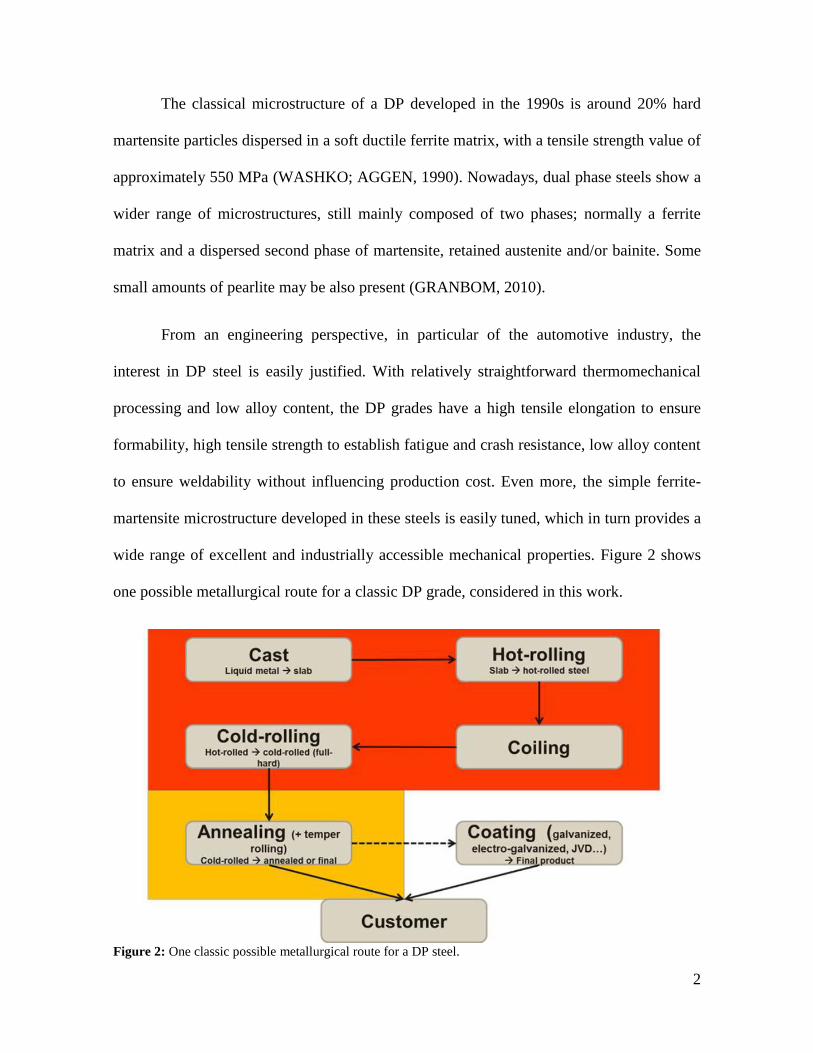
From an engineering perspective, in particular of the automotive industry, the
interest in DP steel is easily justified. With relatively straightforward thermomechanical
processing and low alloy content, the DP grades have a high tensile elongation to ensure
formability, high tensile strength to establish fatigue and crash resistance, low alloy content
to ensure weldability without influencing production cost. Even more, the simple ferrite-
martensite microstructure developed in these steels is easily tuned, which in turn provides a
wide range of excellent and industrially accessible mechanical properties. Figure 2 shows
one possible metallurgical route for a classic DP grade, considered in this work.
Figure 2: One classic possible metallurgical route for a DP steel.
3
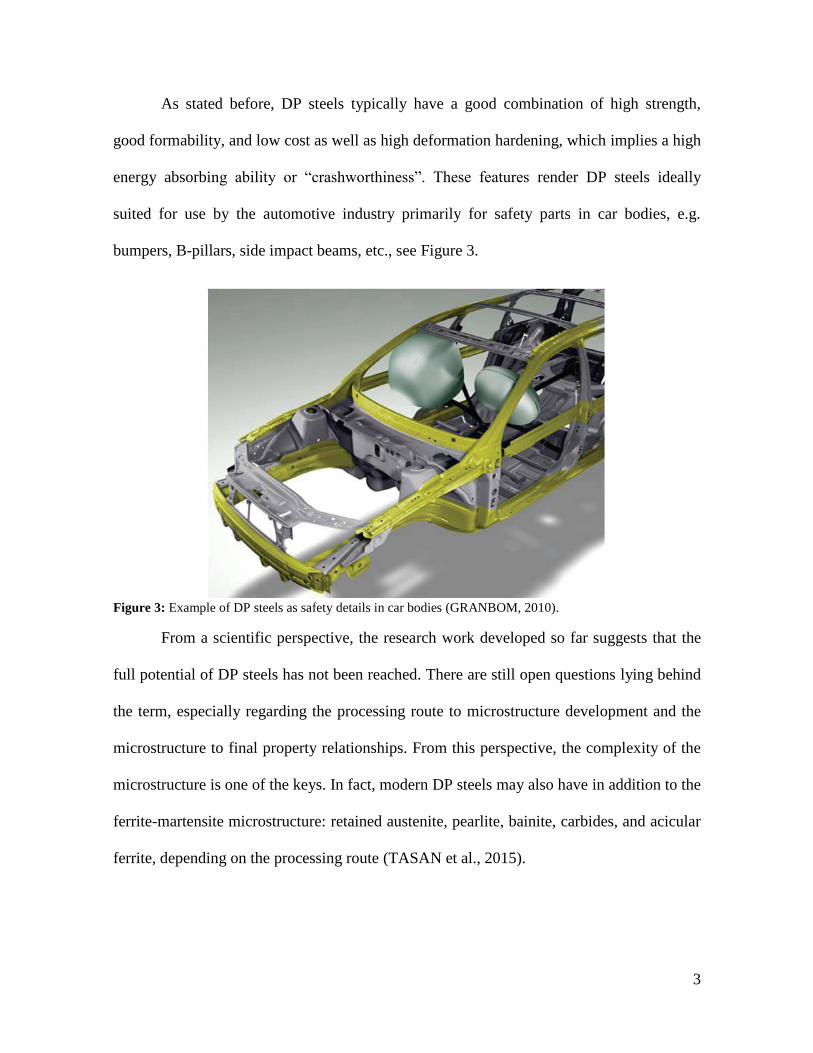
As stated before, DP steels typically have a good combination of high strength,
good formability, and low cost as well as high deformation hardening, which implies a high
energy absorbing ability or “crashworthiness”. These features render DP steels ideally
suited for use by the automotive industry primarily for safety parts in car bodies, e.g.
bumpers, B-pillars, side impact beams, etc., see Figure 3.
Figure 3: Example of DP steels as safety details in car bodies (GRANBOM, 2010).
From a scientific perspective, the research work developed so far suggests that the
full potential of DP steels has not been reached. There are still open questions lying behind
the term, especially regarding the processing route to microstructure development and the
microstructure to final property relationships. From this perspective, the complexity of the
microstructure is one of the keys. In fact, modern DP steels may also have in addition to the
ferrite-martensite microstructure: retained austenite, pearlite, bainite, carbides, and acicular
ferrite, depending on the processing route (TASAN et al., 2015).
4
Various processing- and composition-dependent microstructural parameters
introduce further complexity. The most interesting factors are not limited to, but most
certainly includes, martensite volume fraction (VM), martensite grain size (SM), martensite
carbon content (CM), martensite/ferrite morphology, ferrite grain size (SF), ferrite texture,
density of transformation-induced geometrically necessary dislocations (GNDs), micro-
and mesoscale segregation, and the chemical decoration state of the heterointerfaces
(TASAN et al., 2015).
In this context, the classical way of producing DP steels is by cold rolling of low
alloy (LA) steels followed by intercritical heat treatment in a continuous annealing line
(CAL). The term intercritical refers to the two-phase field of austenite/ferrite in the Fe-C
diagram. In continuous annealing, the steel is heated for a short time in the intercritical
temperature range to form ferrite-austenite mixtures. During the fast cooling that follows,
the austenite phase will transform to martensite when quenching, changing the ferrite-
austenite mixture into the ferrite-martensite mixture. The result is a structure with a soft
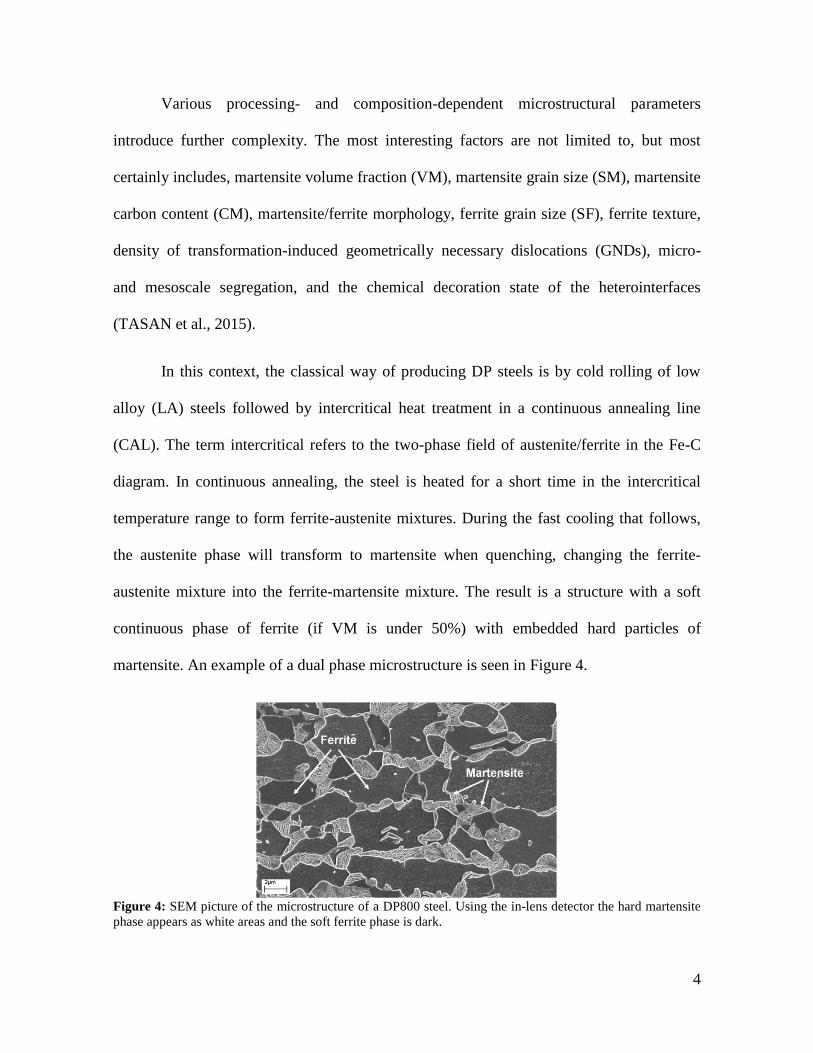
continuous phase of ferrite (if VM is under 50%) with embedded hard particles of
martensite. An example of a dual phase microstructure is seen in Figure 4.
Figure 4: SEM picture of the microstructure of a DP800 steel. Using the in-lens detector the hard martensite
phase appears as white areas and the soft ferrite phase is dark.
5
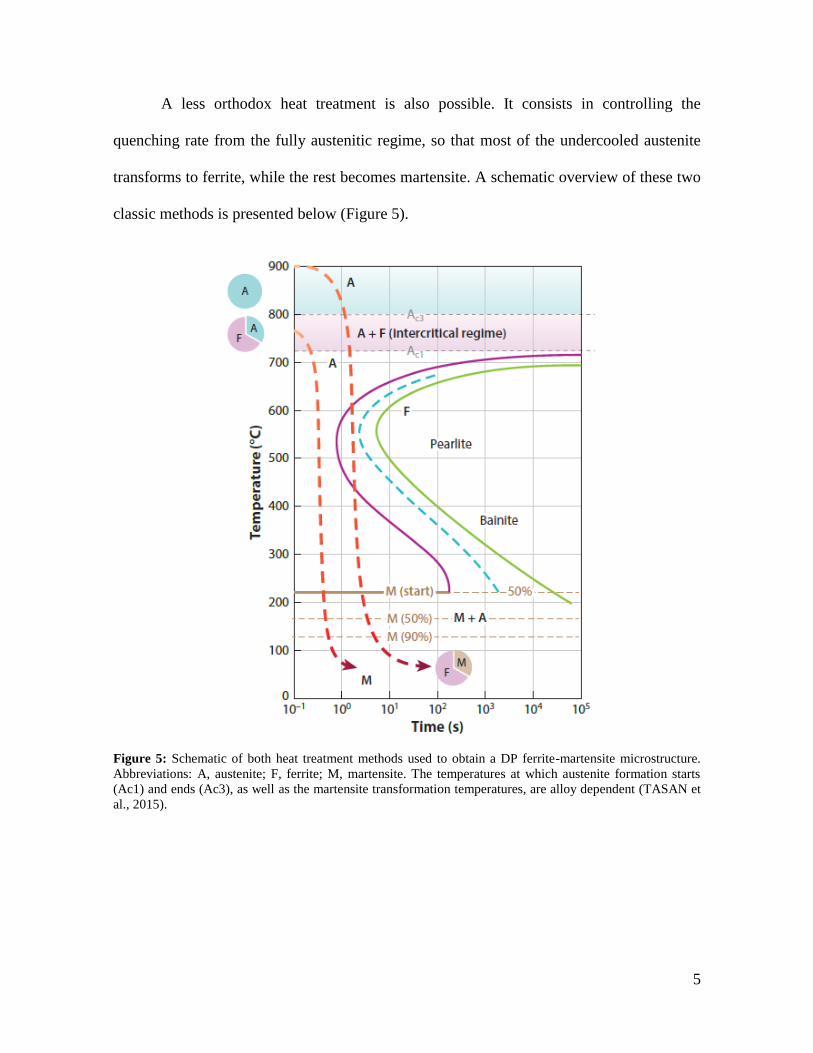
A less orthodox heat treatment is also possible. It consists in controlling the
quenching rate from the fully austenitic regime, so that most of the undercooled austenite
transforms to ferrite, while the rest becomes martensite. A schematic overview of these two
classic methods is presented below (Figure 5).
Figure 5: Schematic of both heat treatment methods used to obtain a DP ferrite-martensite microstructure.
Abbreviations: A, austenite; F, ferrite; M, martensite. The temperatures at which austenite formation starts
(Ac1) and ends (Ac3), as well as the martensite transformation temperatures, are alloy dependent (TASAN et
al., 2015).
6
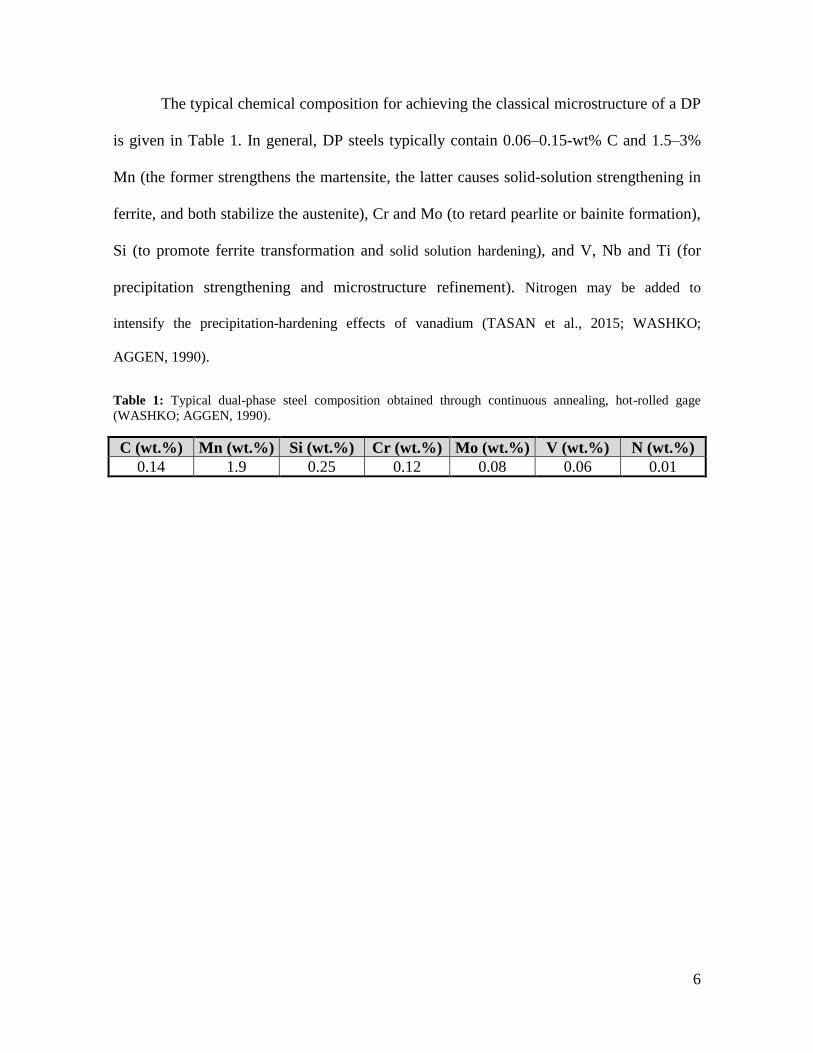
The typical chemical composition for achieving the classical microstructure of a DP
is given in Table 1. In general, DP steels typically contain 0.06–0.15-wt% C and 1.5–3%
Mn (the former strengthens the martensite, the latter causes solid-solution strengthening in
ferrite, and both stabilize the austenite), Cr and Mo (to retard pearlite or bainite formation),
Si (to promote ferrite transformation and solid solution hardening), and V, Nb and Ti (for
precipitation strengthening and microstructure refinement). Nitrogen may be added to
intensify the precipitation-hardening effects of vanadium (TASAN et al., 2015; WASHKO;
AGGEN, 1990).
Table 1: Typical dual-phase steel composition obtained through continuous annealing, hot-rolled gage
(WASHKO; AGGEN, 1990).
C (wt.%) Mn (wt.%) Si (wt.%) Cr (wt.%) Mo (wt.%) V (wt.%) N (wt.%)
0.14 1.9 0.25 0.12 0.08 0.06 0.01
7
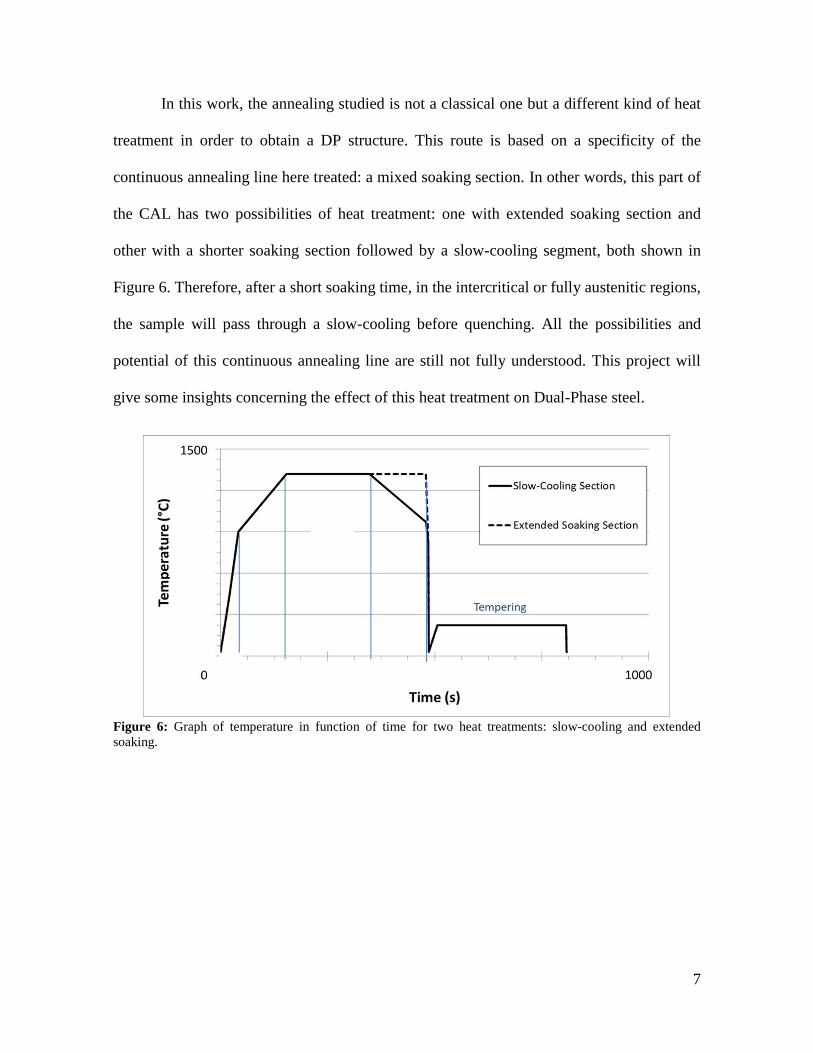
In this work, the annealing studied is not a classical one but a different kind of heat
treatment in order to obtain a DP structure. This route is based on a specificity of the
continuous annealing line here treated: a mixed soaking section. In other words, this part of
the CAL has two possibilities of heat treatment: one with extended soaking section and
other with a shorter soaking section followed by a slow-cooling segment, both shown in
Figure 6. Therefore, after a short soaking time, in the intercritical or fully austenitic regions,
the sample will pass through a slow-cooling before quenching. All the possibilities and
potential of this continuous annealing line are still not fully understood. This project will
give some insights concerning the effect of this heat treatment on Dual-Phase steel.
Figure 6: Graph of temperature in function of time for two heat treatments: slow-cooling and extended
soaking.
8
b) LITERATURE REVIEW
1.1 PHASES OF STEEL AND THEIR INFLUENCE ON DP
STEELS
When characterizing the phases presents on steel, one can find depending on the
heat treatment followed, the following phases: ferrite, martensite, austenite, pearlite,
cementite, and bainite. Since this work deals mostly with ferrite, austenite and martensite
formation and microstructural and mechanic characterization, the other phases will be only
briefly described while martensite will have a subsection only for itself.
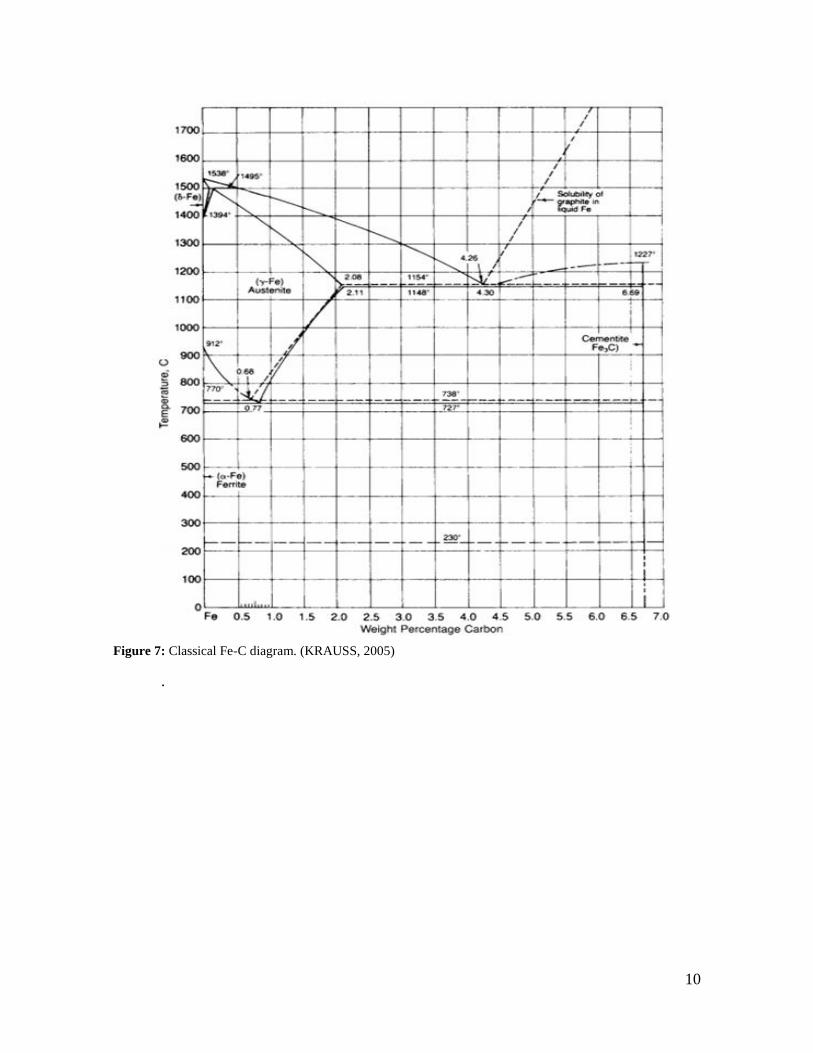
Not all those phases are represented in the classical diagram Fe-C below (Figure 7).
Some of them are not formed by diffusional process (martensite) or are not exactly
composed of only one phase (pearlite/bainite are formed from a mix of cementite and
ferrite).
1.1.1 FERRITE
The ferrite (or alpha iron) phase forms at lower temperatures by diffusional
mechanism. This phase has a space lattice of body-centered cubic (bcc). Carbon solubility
in ferrite reaches a maximum of 0.02% at 727°C. This phase is softer than bainite and
martensite and can sustain more elongation (KRAUSS, 2005).
The increasing on the strength of ferrite results in an increase in the strength of DP
steels. The strength mechanisms for this phase are grain size control and solid solution
hardening from the alloying elements.
9
1.1.2 AUSTENITE
Austenite (or gamma iron) has a face-centered cubic (FCC) lattice. Carbon
stabilizes austenite and thereby increases the range of austenite formation in steels so that
when the solubility limit for carbon in austenite is exceeded, a new phase—iron carbide or
cementite—forms in iron-carbon alloys and steels (KRAUSS, 2005).
The retained austenite remains in the form of very small particles in some annealing
cycles of DP steels. This austenite is stable upon cooling to room temperature but
transforms upon plastic straining (WASHKO; AGGEN, 1990).
1.1.2.1 PEARLITE
This phase is a product of eutectoid transformation, austenite transformed in
cementite and ferrite. Pearlite is made of alternate closely spaced platelets or lamellae of
ferrite and cementite (KRAUSS, 2005). Normally, the pearlite structures found in DP steels
are just small residual traces
10
Figure 7: Classical Fe-C diagram. (KRAUSS, 2005)
.
11
1.1.2.2 BAINITE
Most common in medium- and high-carbon steels, but not always limited to them,
bainite is a mixture of ferrite and cementite. As pearlite, bainite is dependent on the
diffusion-controlled partitioning of carbon between ferrite and cementite. However, unlike
pearlite, the constituent phases are present in non-lamellar arrays. Bainite has similar
morphology to the lathed plate-shaped one of martensite. The ferrite of bainitic
microstructures can be present in the form of acicular crystals (KRAUSS, 2005).
Not many works studying the effect of bainite in DP steels are available. Two main
ways are available: full ferrite-bainite microstructure or the martensite partially replaced by
bainite. Some studies suggested that both martensite and bainite are described by a common
curve, with the hardening and strengthening of bainite weaker than that by martensite
(FONSTEIN, 2017).
1.2 MARTENSITE
During the quenching of austenitized steels, the expected final microstructure is
martensite. This transformation is possible due to a shear driven force which distorts the
microstructure from a body-centered cubic (bcc) to a body-centered-tetragonal (bct) unit
cell. This transformation is normally observed in a rapid cooling rate, to prevent the
diffusional transformation to occur (KRAUSS, 2005).
As for DP steels, as one could expect, the strength of these steels increases when
either the volume fraction or strength (hardness) of the martensite phase increases.
12
1.2.1 MARTENSITE START TEMPERATURE
The starting temperature of martensitic transformation (Ms) reflects the
thermodynamic driving force required to initiate the shear transformation of austenite to
martensite.
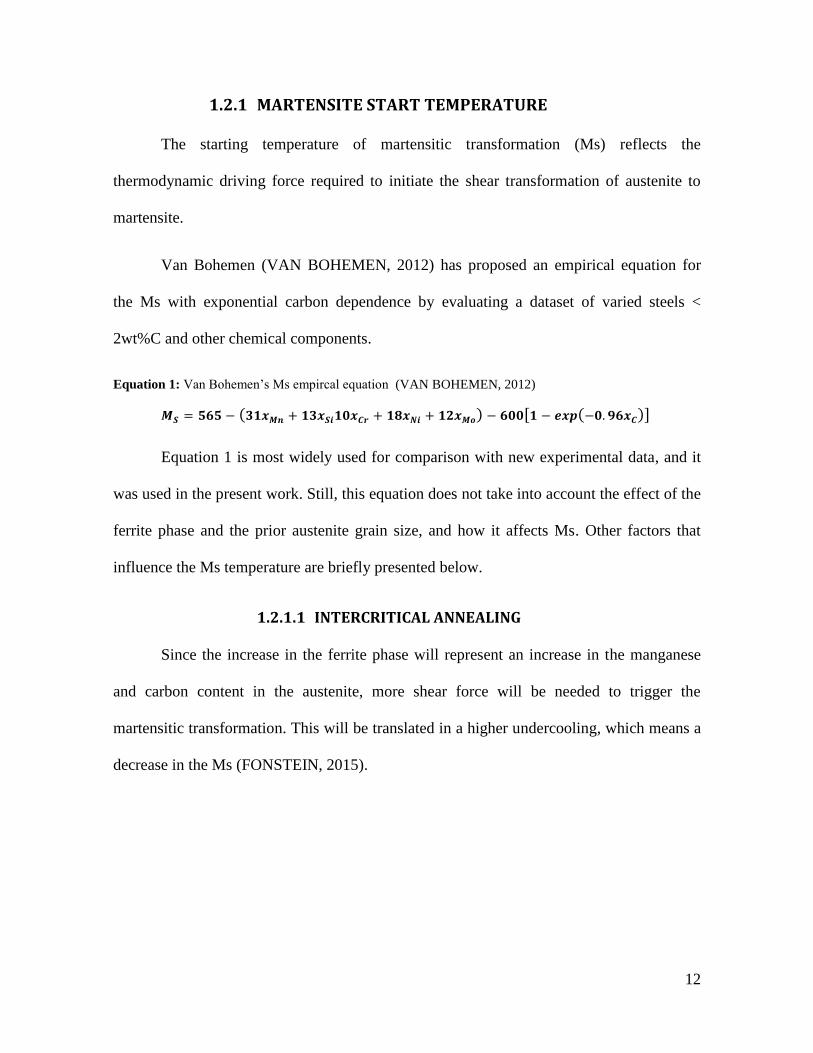
Van Bohemen (VAN BOHEMEN, 2012) has proposed an empirical equation for
the Ms with exponential carbon dependence by evaluating a dataset of varied steels <
2wt%C and other chemical components.
Equation 1: Van Bohemen’s Ms empircal equation (VAN BOHEMEN, 2012)
𝑴𝑺 = 𝟓𝟔𝟓 − (𝟑𝟏𝒙𝑴𝒏 + 𝟏𝟑𝒙𝑺𝒊𝟏𝟎𝒙𝑪𝒓 + 𝟏𝟖𝒙𝑵𝒊 + 𝟏𝟐𝒙𝑴𝒐) − 𝟔𝟎𝟎[𝟏 − 𝒆𝒙𝒑(−𝟎. 𝟗𝟔𝒙𝑪)]
Equation 1 is most widely used for comparison with new experimental data, and it
was used in the present work. Still, this equation does not take into account the effect of the
ferrite phase and the prior austenite grain size, and how it affects Ms. Other factors that
influence the Ms temperature are briefly presented below.
1.2.1.1 INTERCRITICAL ANNEALING
Since the increase in the ferrite phase will represent an increase in the manganese
and carbon content in the austenite, more shear force will be needed to trigger the
martensitic transformation. This will be translated in a higher undercooling, which means a
decrease in the Ms (FONSTEIN, 2015).
13
1.2.1.2 PRIOR AUSTENITE GRAIN SIZE
A decrease in the austenite grain size will lead to an increase of linear density of
grain boundaries. In other words, it leads to more resistant austenite (Hall-Petch
mechanism) (BROFMAN; ANSELL, 1983). In order to initiate the martensitic
transformation, the parent phase needs to accommodate shear and with more resistant
austenite, a higher undercooling is required to transmit the slip across grain boundaries.
(YANG; BHADESHIA, 2009)
1.2.1.3 AUTO-TEMPERED MARTENSITE
It’s also important to notice the effect of high Ms Temperature (>300ºC), when the
temperature is so high that auto-tempering or quench tempering of the martensite occurs
(FONSTEIN, 2015). In these cases, carbides may precipitate in martensite during
quenching, softening the martensite and decreasing the Tensile Strength. The higher the
Ms, the more auto-tempered martensite will be present (MATSUDA et al., 2013).
1.3 MECHANICAL PROPERTIES AND MICROSTRUCTURE
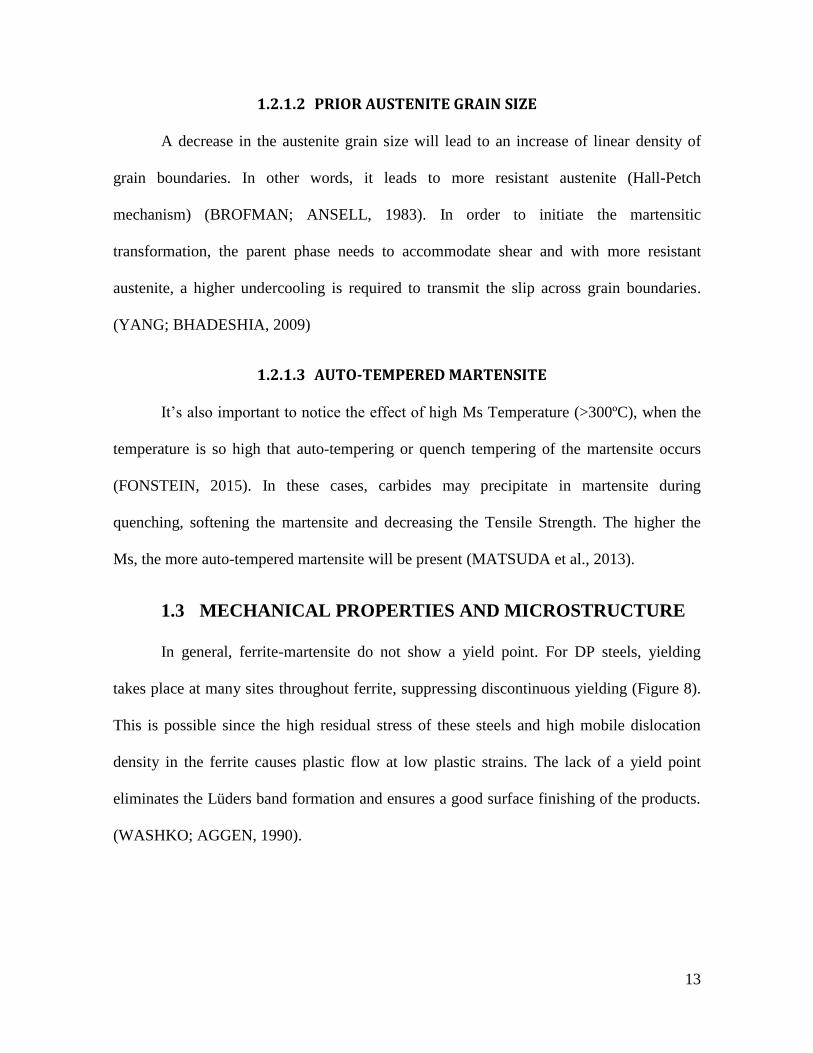
In general, ferrite-martensite do not show a yield point. For DP steels, yielding
takes place at many sites throughout ferrite, suppressing discontinuous yielding (Figure 8).
This is possible since the high residual stress of these steels and high mobile dislocation
density in the ferrite causes plastic flow at low plastic strains. The lack of a yield point
eliminates the Lüders band formation and ensures a good surface finishing of the products.
(WASHKO; AGGEN, 1990).
14
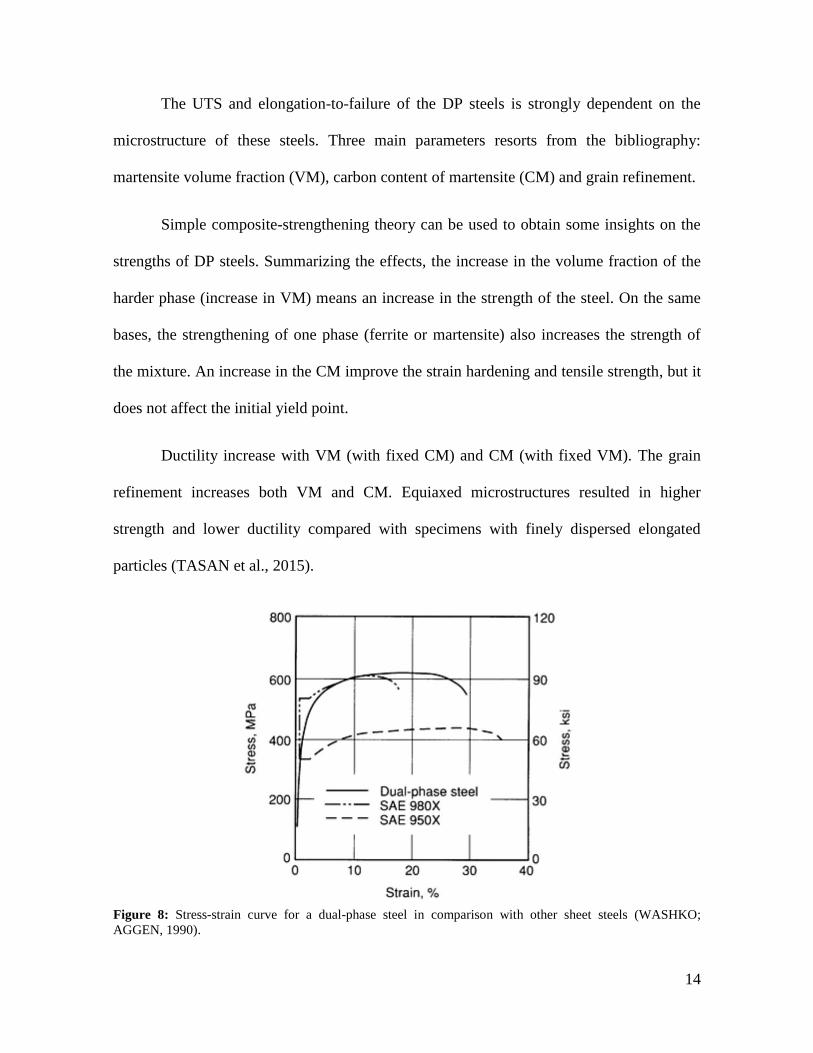
The UTS and elongation-to-failure of the DP steels is strongly dependent on the
microstructure of these steels. Three main parameters resorts from the bibliography:
martensite volume fraction (VM), carbon content of martensite (CM) and grain refinement.
Simple composite-strengthening theory can be used to obtain some insights on the
strengths of DP steels. Summarizing the effects, the increase in the volume fraction of the
harder phase (increase in VM) means an increase in the strength of the steel. On the same
bases, the strengthening of one phase (ferrite or martensite) also increases the strength of
the mixture. An increase in the CM improve the strain hardening and tensile strength, but it
does not affect the initial yield point.
Ductility increase with VM (with fixed CM) and CM (with fixed VM). The grain
refinement increases both VM and CM. Equiaxed microstructures resulted in higher
strength and lower ductility compared with specimens with finely dispersed elongated
particles (TASAN et al., 2015).
Figure 8: Stress-strain curve for a dual-phase steel in comparison with other sheet steels (WASHKO;
AGGEN, 1990).
15
1.4 TRANSFORMATION TEMPERATURE
For a heating treatment of steel, one can name three critical temperatures of high
interest: A1, the boundary between the ferrite cementite field and the fields of austenite-
ferrite or austenite-cementite; A3, the boundary between the ferrite and austenite and
austenite; Acm, the boundary between cementite and austenite and austenite.
Since all these transformations listed are diffusion controlled, these critical
temperatures are sensitive to composition and to heating and cooling rates. Notably, rapid
heating means less time for diffusion, implying an increase of the critical temperature when
compared with equilibrium. In the same way, rapid cooling corresponds to a lower critical
temperature.
Based on this fact, a French metallurgist, Osmond, created two sets of critical
temperatures taking into account the effect of the heating and cooling rates, respectively:
“Ac” or “Ar”; and defining the two sets: Ac1, Ac3 and Accm for heating; and Ar1, Ar3 and
Arcm for cooling (KRAUSS, 2005).
16
1.5 MICROSTRUCTURE DEVELOPMENT DURING
ANNEALING
In this section, the different mechanisms that control the microstructure
development during continuous annealing will be discussed, but before the phases of steels
and their effects will be briefly presented.
Before the start of annealing DP steel, the steel is received from the cold-rolling,
known as full-hard steel, made up of phases depending on the thermal treatments that the
material witness.
As stated before, two classical annealing routes are normally used in order to obtain
a DP steel. The classical heat treatment consists of holding the material in an austenite-
ferrite (intercritical) regime followed by quenching and holding at temperatures slightly
below the martensite start temperature, allowing the transformation of austenite into
martensite. The other approach is quenching from the fully austenitic region, where the
undercooled austenite transforms into ferrite and the reminiscent austenite becomes
martensite. Respectively, the first route the soaking temperature is therefore between Ac1
and Ac3 (intercritical annealing), while the second the soaking temperature is equal to or
higher than Ac3, so the steel will present only austenite at the end of the soaking phase.
Minor additions of Cr and Mn suppress the pearlite and bainite formation.
17
1.5.1 INHERITANCE FROM ROLLING PROCESSES
The process delivering the raw material to the CAL is the cold rolling mill which is
preceded by the hot rolling mill and coiling. One of the first questions to be answered is if
there is an inheritance from the rolling processes on the final mechanical properties of the
cold rolled and annealed DP steel.
During hot and cold rolling of steels, inhomogeneity in microstructure and texture
appears due to the gradient in shear, total deformation, and temperature. This
inhomogeneity is inherited in all the following processing steps. The microstructure is
characterized by a continuous change through thickness, shown in Figure 9. The initial
ferrite-pearlite or partially bainitic microstructures presented in a banded morphology in the
sheet center becomes a heterogeneous distribution near the surface. Therefore, the
mechanical properties of the sheets are anisotropic and dependent on the through-thickness
position. Hot and cold-rolled materials with banded ferritic-pearlitic structure typically
have a pearlite volume fraction of 15–35% (TASAN et al., 2015).

18
Figure 9: Example of microstructure and texture evolution during hot rolling and cold rolling for the sheet
center and the near-surface regions of an alloy with 0.147-wt% C, 0.403-wt% Si, and 1.868-wt% Mn
(TASAN et al., 2015).
The inheritance in the initial ferrite grain sizes before cold rolling remains after
recrystallization: the finer the ferrite grains in the hot-rolled steel the finer the ferrite grains
in the DP steel after cooling of cold rolled steel from the intercritical region (FONSTEIN,
2017).
During cold rolling, the dislocation density increases considerably and the higher
the cold rolling reduction the higher the dislocation density, therefore, being the driving
force for recovery and recrystallization. In addition, pearlite areas are fragmented to
different extents dependent on the properties of the cementite and the degree of cold
rolling. A larger cold rolling reduction yields more and smaller carbides, which in turn
imply more nucleation sites for austenite formation and shorter diffusion distances during
carbide dissolution. The cold rolling reduction is thus an important parameter as it provides
the driving force for the kinetic courses during the subsequent annealing (GRANBOM,
2010).
19
1.5.2 HEATING AND SOAKING
During heating, the full-hard steel, a mixture of ferrite and pearlite, will start to
form an austenite-ferrite composite. Various mechanisms will take place and interact to
form this microstructure, namely ferrite recovery and recrystallization, ferrite-to-austenite
transformation, and carbon diffusion.
Upon soaking, the different soaking temperatures can affect the microstructure of
steels. For the same composition, a difference of 20°C in two soaking temperatures can
change the microstructure from an intercritical to a full austenitic one. Also, as the soaking
temperature increases, the austenite grain size follows it, by a diffusional effect in grain
growth. This section of the annealing cycle is also responsible for the homogenization of
the carbon by diffusional mechanism (SPEICH; DEMAREST; MILLER, 1981).
1.5.2.1 INTERCRITICAL AND AUSTENITIC ANNEALING
Before analyzing the multiple mechanisms that take place during these segments of
the annealing cycle, this section will present an overview based on the temperature regime
of the annealing, namely: austenitic phase field, high intercritical temperature and low
intercritical temperature, based on the work of Peranio et al (PERANIO; ROTERS;
RAABE, 2012).
The annealing in intercritical temperature shows similar morphologies for high
temperatures (close to Ac3) and low temperatures (just above to Ac1). The samples heat
treated at low temperatures showed recrystallization prevailing over phase transformation,
with inherited through-thickness texture and microstructure inhomogeneity. The VM
increases with annealing time during IA until phase transformation is complete.
20
During high intercritical temperature annealing, concurrent recrystallization and
phase transformation take places, with phase transformation overcoming recrystallization
with increasing temperature. The microstructure after quenching was ferrite and martensite
aligned as bands along the rolling direction. The closer to the surface, more dispersed and
heterogeneously distributed both phases are. The inherited through-thickness texture
microstructure inhomogeneity is low even for short annealing times.
At austenitic temperatures, new euiaexied ferrite is formed. Phase transformation
leaded to the formation of martensite and to new equiaxed ferrite grains with smaill in-grain
orientation gradients.(PERANIO; ROTERS; RAABE, 2012)
The classical annealing in the austenitic phase field followed by quenching gave the
samples a microstructure of martensite and ferrite no longer arranged in the form of bands,
with only low through-thickness texture inhomogeneity. The distribution of ferrite-
martensite structures in these samples is more homogenous distributed than in the IA
samples, but still heterogeneously dispersed. As for the high temperature IA, phase
transformation effects are more present than recrystallization effects.
1.5.2.2 RECOVERY AND RECRYSTALLIZATION
The first microstructural mechanism upon heating is recovery. Recovery takes
places prior to recrystallization and partially restores the properties of the steel to those
before cold rolling (JOHN HUMPHREYS, 2017). In a nutshell, this process is the
rearranging of dislocations into a more energetically favorable and ordered state. During
heating, the steel also recrystallizes, which means that new ferrite strain-free grains
nucleate and grow into the unrecrystallized structure (GRANBOM, 2010).
21
Recovery and recrystallization are competing process since both are driven by the
stored energy from the cold rolling and the distinction between the two is impossible. In the
same way that recovery lowers the driving force for recrystallization, once recrystallization
has taken place and all the deformed structure has been consumed, no further recovery can
occur (GRANBOM, 2010).
In recrystallization, new ferrite strain-free grains nucleate and grow.
Recrystallization driven force is the high strain energy stored in dislocation substructure,
result of cold work, and is accomplished by the short-range diffusion of iron atom across
the boundaries of the deformed grains and the strain-free annealed grains of ferrite
(KRAUSS, 2005).
The nucleation and growth of austenite grains start at pearlite regions, by virtue of
their high carbon content. Austenite will continue to nucleate and grow then on the
boundaries between deformed ferrite grains and on the boundaries between recrystallized
and unrecrystallized grains (KRAUSS, 2005).
The recrystallization start temperature is affected by different alloy elements, like
Nb. A small addition of 0.015% Nb retards 20°C of recrystallization start temperature
(GRANBOM, 2010). The retardation of recrystallization results in smaller grain size since
this process is followed by grain growth. Grain growth is a thermally activated process and
time is needed to allow growth. Given that the soaking time is constant, the later the start of
the growth process, the shorter the time allowed for grain growth, and consequently the
material achieves a smaller grain size.
22
Figure 10: Recrystallization of ferrite at various temperatures with the chemical composition 0.08C-1.45Mn-
0.21Si. (GRANBOM, 2010)
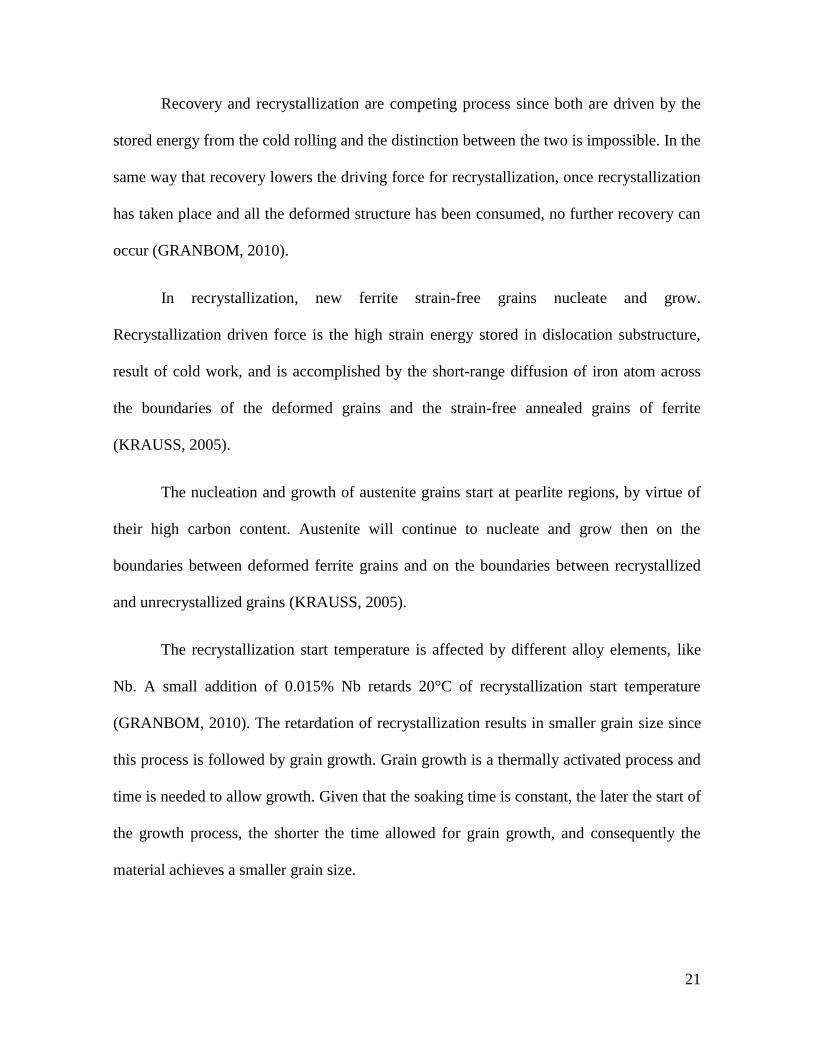
The time needed for the complete recrystallization is highly affected by the
temperature, as shown in Figure 10. An experiment on a DP grade showed that the
recrystallization time decreases with increasing annealing temperature and heating. The
same work also presented that the volume fraction of recrystallized ferrite increases with
increasing temperatures and heating rates, in the case that the annealing temperature is the
same (TASAN et al., 2015).
1.5.2.3 FERRITE TO AUSTENITE TRANSFORMATION
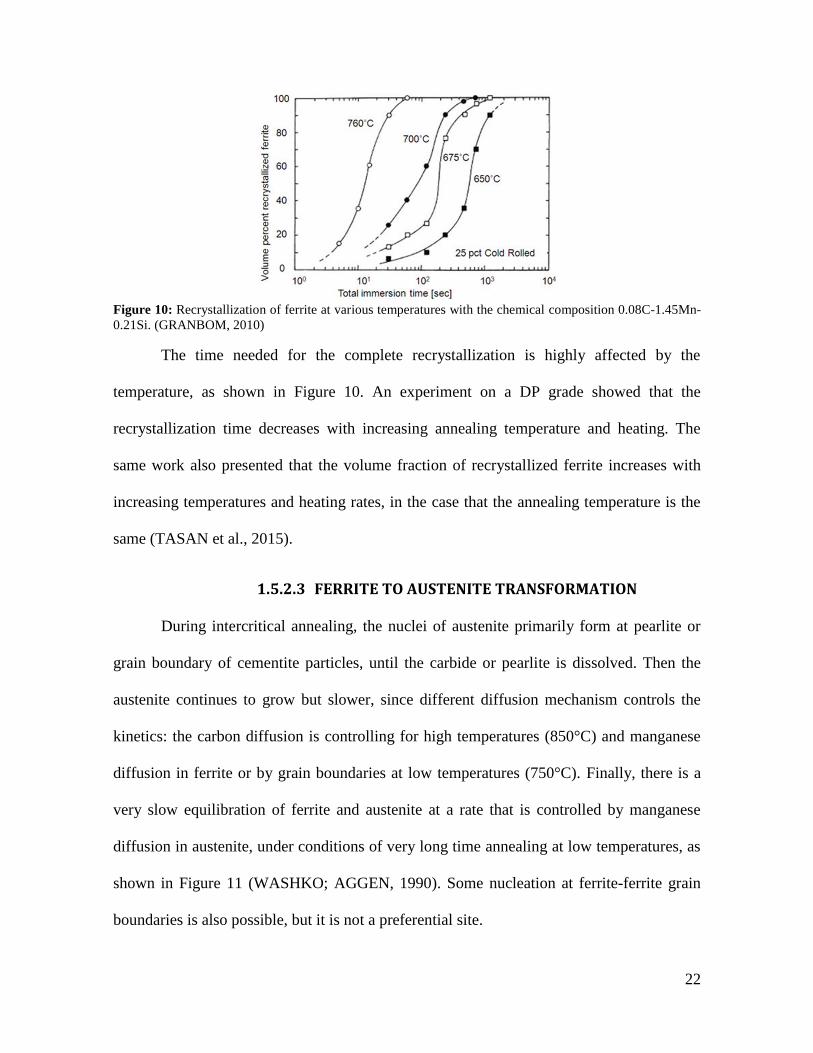
During intercritical annealing, the nuclei of austenite primarily form at pearlite or
grain boundary of cementite particles, until the carbide or pearlite is dissolved. Then the
austenite continues to grow but slower, since different diffusion mechanism controls the
kinetics: the carbon diffusion is controlling for high temperatures (850°C) and manganese
diffusion in ferrite or by grain boundaries at low temperatures (750°C). Finally, there is a
very slow equilibration of ferrite and austenite at a rate that is controlled by manganese
diffusion in austenite, under conditions of very long time annealing at low temperatures, as
shown in Figure 11 (WASHKO; AGGEN, 1990). Some nucleation at ferrite-ferrite grain
boundaries is also possible, but it is not a preferential site.
23
The incubation time for phase transformation decreases with increasing annealing
temperature. The phase transformation kinetics is controlled by the parallel processes of
austenite formation and carbide dissolution. Carbide dissolution is preceded by
spheroidization of the carbides and the driving force is the surface area reduction of the
particles. Since the solubility of carbon in ferrite is low compared to the solubility of carbon
in austenite, nucleation and growth of austenite is a prerequisite for carbide dissolution
(GRANBOM, 2010).
In general way, the time for carbide dissolution is controlled by the amount of
pearlite, in other words, the C- and Mn-content of the alloy. The higher the amount of C,
the longer the time for dissolution (TASAN et al., 2015).
Figure 11: Kinetics of austenite formation in 0.12C-1.5Mn steel (WASHKO; AGGEN, 1990).
24
As for the case of the austenite nucleating on ferrite grain, the austenite is preferably
nucleated on carbides on ferrite-ferrite grain boundaries and triple points, rather than
carbides inside ferrite grains. It is most likely that carbides at grain boundaries are more
energetically favorable than isolated carbides inside ferrite grains. The solubility of carbon
in ferrite is low but the diffusion rate in ferrite is much higher than in austenite. Carbon
from the dissolving carbides thus diffuses through the ferrite via bulk diffusion or via ferrite
grain boundaries to the growing austenite areas (GRANBOM, 2010).
For the case on an initially ferritic-pearlitic microstructure, the two regions have
different kinetics due to the difference in carbon concentration. The pearlitic regions have
more carbon than the ferrite, implying in a faster speed of transformation of austenite zones
that nucleates in the pearlite grain boundaries. As for the austenite nuclei that appear in the
ferrite grain boundaries, they have no carbon source. So for its growth, the carbon diffusion
from the carbon rich areas through the ferrite matrix is necessary to support the austenite
formation. In the case that the DP as cold rolled state presents a ferritic-bainitic
microstructure, the carbon sources are typically more dispersed, allowing a faster austenite
formation (TASAN et al., 2015).
Upon cooling the final microstructure of the DP steel will appear from the austenite
phase. Therefore, the final DP microstructure is governed by the preferential sites of
austenite nucleation and by its geometry of grains (TASAN et al., 2015).
25
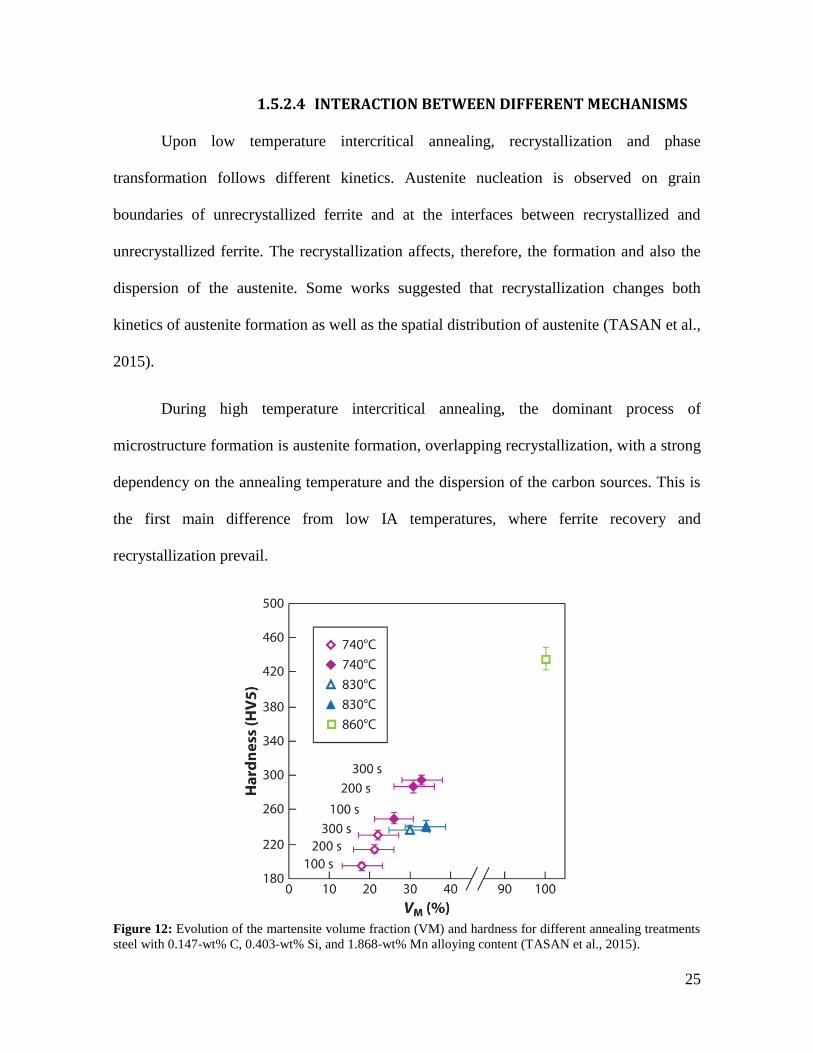
1.5.2.4 INTERACTION BETWEEN DIFFERENT MECHANISMS
Upon low temperature intercritical annealing, recrystallization and phase
transformation follows different kinetics. Austenite nucleation is observed on grain
boundaries of unrecrystallized ferrite and at the interfaces between recrystallized and
unrecrystallized ferrite. The recrystallization affects, therefore, the formation and also the
dispersion of the austenite. Some works suggested that recrystallization changes both
kinetics of austenite formation as well as the spatial distribution of austenite (TASAN et al.,
2015).
During high temperature intercritical annealing, the dominant process of
microstructure formation is austenite formation, overlapping recrystallization, with a strong
dependency on the annealing temperature and the dispersion of the carbon sources. This is
the first main difference from low IA temperatures, where ferrite recovery and
recrystallization prevail.
Figure 12: Evolution of the martensite volume fraction (VM) and hardness for different annealing treatments
steel with 0.147-wt% C, 0.403-wt% Si, and 1.868-wt% Mn alloying content (TASAN et al., 2015).
26
Analyzing Figure 12, one can see that hardness increases in a nonlinear manner.
Two mechanism are suggested to take place. The first is with increasing annealing
temperatures, carbon diffusion is more intense, leading to a more homogeneous carbon
distribution and so to a reduction in the average carbon content within the martensite
(lowering CM). The morphology also affects the hardness, explaining why there is a
nonlinear increase in the steel hardness as a function of VM. After annealing, the martensite
has an acicular morphology for austenitic annealing and a granular morphology for IA.
1.5.3 COOLING SEGMENT
The final microstructure that will be formed during cooling is always dependent of
the cooling rates. Also, the VM increases with increasing cooling rate (TASAN et al.,
2015).
At high cooling rates, most of the austenite is expected to be transformed in
martensite; some austenite can be present at the end and is called retained austenite. At
intermediate and low cooling rates, as epitaxial ferrite grows, carbon is rejected from the
growing ferrite, enabling the formation of the ferrite cementite austenite transformation
products bainite and pearlite together with martensite. At the lowest cooling rates, the
austenite transforms only to epitaxial ferrite and pearlite (FONSTEIN, 2015).
The use of a slow-cooling section before quenching for DP steels is still not fully
understood. Fonstein (FONSTEIN, 2015) analyzed various works of the effect of cooling
from annealing at the intercritical temperature with relatively slow cooling rates (2°C/s-
30°C/s) and noticed that the ferrite can be formed at a near-equilibrium carbon. However,
the “new” ferrite that will be formed through this slow cooling will play a major role in
controlling the carbon content, partitioning it to the remaining austenite.
27
The same will happen with annealing at full austenitic temperature. In this case, the
slow-cooling will promote the nucleation of ferrite at the grains boundaries of austenite.
This ferrite will increase the enrichment of austenite with carbon, lowering the Ms
temperature (FONSTEIN, 2015). Since the ferrite formed from an intercritical annealing is
different from the one formed from a full austenitic temperature, mechanical and kinetics
differences arise between them (FONSTEIN, 2015).
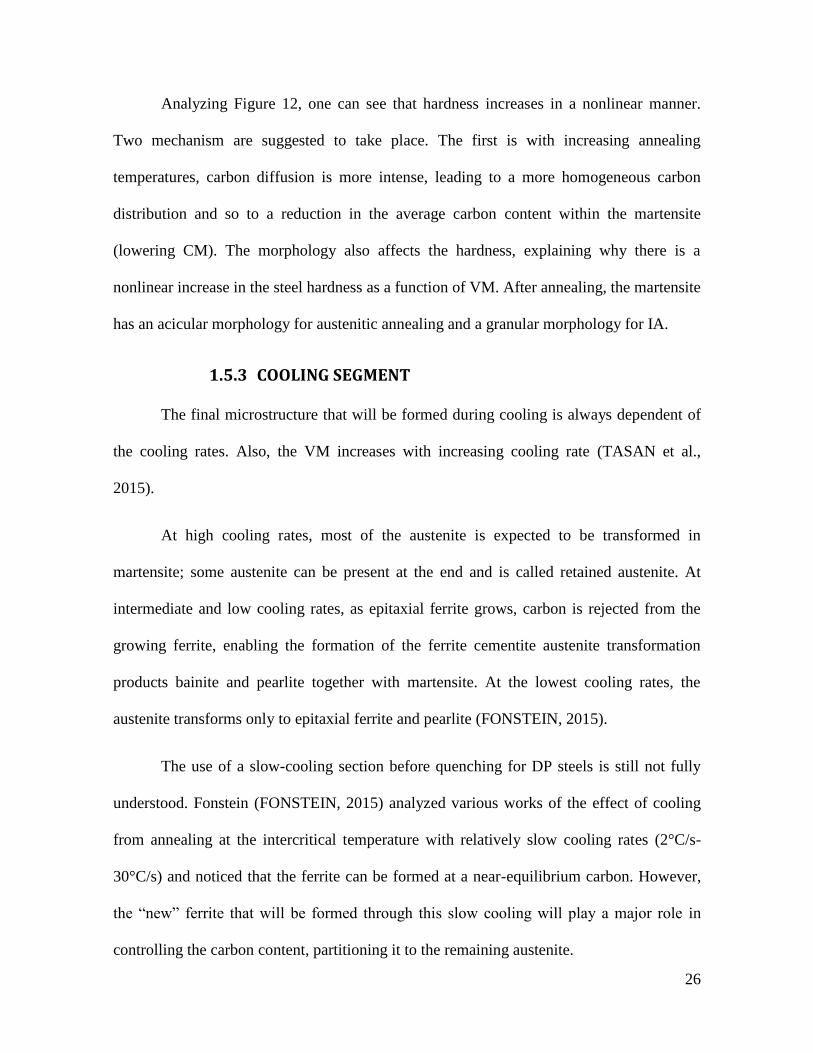
1.5.4 TEMPERING
The tempering of DP steels involves a combination of effects expected for
tempering of each of the individual phases and some coupling effects and is a mandatory
heat treatment in production of this class of steels (SCOTT et al., 2018). In the high-carbon
martensite phase, recovery of the defect structure, precipitation of carbides, and
transformation of retained austenite are expected. Similarly, in the ferrite phase, both
carbon segregation to dislocations and precipitation of carbides are expected. The coupling
effects such as the generation of residual stresses and a high dislocation density in the
ferrite. Therefore, carbon segregation to the dislocations and the elimination of the residual
stresses by the volume contraction of the ferrite are important parts of the tempering
process (WASHKO; AGGEN, 1990).
Figure 13: Effect of tempering temperature on DP steel TS, YS and YS/TS ratio (FONSTEIN, 2015).
28
1.5.4.1 TEMPERING OF MARTENSITE
The carbon excess in martensite lattice is the responsible for the driving force of
processes at martensite tempering. One can divide the tempering of martensite in DP steels
in five different stages, based on the activation energy of each phenomena
(WATERSCHOOT; VERBEKEN; DE COOMAN, 2006):
1. At tempering below 120°C, the redistribution of carbon atoms takes place.
Carbon segregation induces a small volume change of less than 0.05 vol%
and a significant reduction of the tetragonality of the martensite lattice.
2. In between 120°C and 200°C, η-or ε-carbides precipitate. The precipitation
causes a volume reduction of about 0.30 % and complete loss of martensite
tetragonality.
3. At temperatures of 200°C to 300°C Hägg-carbide precipitates and is
followed by the precipitation of η -carbide.
4. Decomposition of retained austenite increases the volume and it takes place
in the range of 250°C to 350°C.
5. The final stage is the replacement of all transition carbides by cementite,
transition carbides formed during transformation of martensite.
The range of the tempering effects is limited by the low tempering temperatures (<
230ºC) in this study and by the quantity of carbon present in martensite, under 0.3%, even
taking in account the maximum ferrite fraction measured, therefore treating the first three
stages.
29
During quenching at low temperatures in fully quenched steels, transition carbides
(epsilon or eta) are formed on very fine particles (2 to 4 nm), and in the case of low-
temperature-tempered (LLT) martensite, they offer a very high useable strength and
hardness, with a higher toughness. At higher tempering temperatures, the cementite
particles precipitate and replace the transitions carbides. The cementite particles coarsen
with increasing intensity of tempering. This implies a reduction of hardness in the
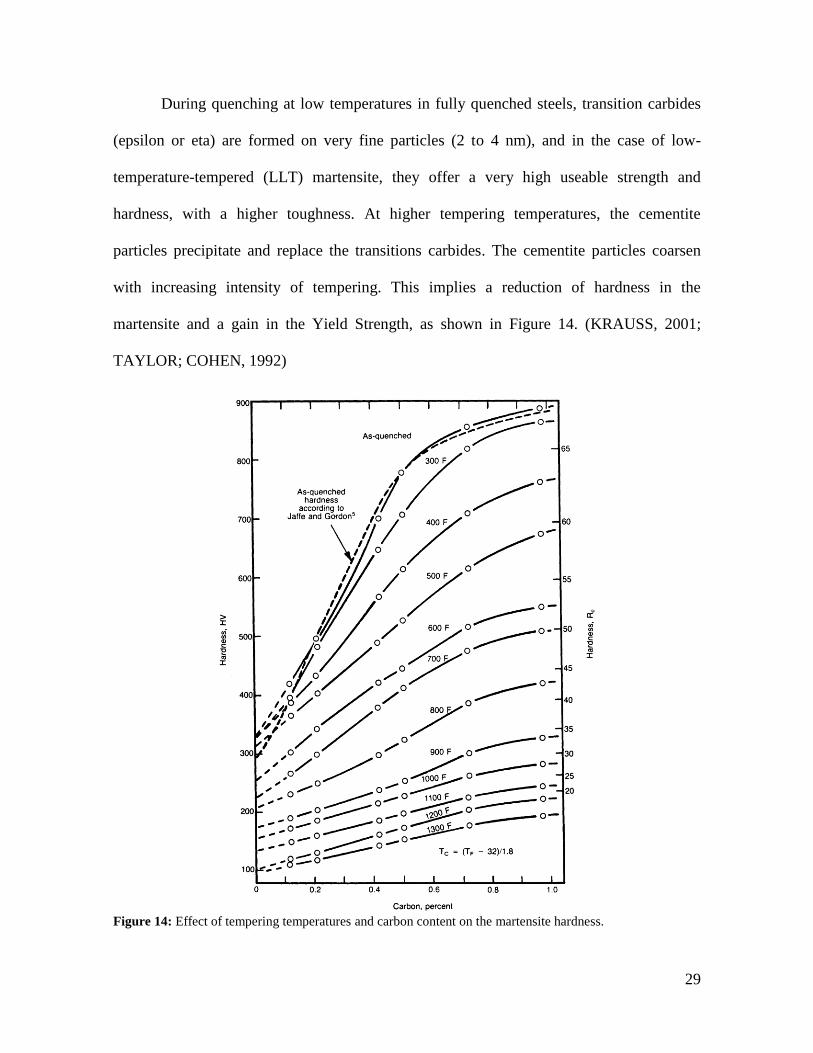
martensite and a gain in the Yield Strength, as shown in Figure 14. (KRAUSS, 2001;
TAYLOR; COHEN, 1992)
Figure 14: Effect of tempering temperatures and carbon content on the martensite hardness.
30
In DP steels, tempering of higher carbon-twinned martensite after annealing at low
intercritical temperatures lead to precipitation of numerous cementite particles in the form
of fine platelets or films, with hardness maxima observed during tempering of dual-phase
steels at 160–200°C as a result of precipitation of fine carbides. Tempering at 300 to 400°C
leads to more intensive precipitation and coarsening of the carbides (FONSTEIN, 2015).
Some volume contraction of martensite also takes place during tempering
decreasing the residual stresses. This is an effect of the precipitation of carbides that
reduces distortions in martensite, induced by local austenite to martensite transformation.
Since hole expansion testing, for DP steels, are highly dependent on the difference
of hardness in the martensite and ferrite, they are sensible to the tempering temperatures.
Some studies showed that the smaller the difference between them, the better the results;
suggesting that increasing the difference in hardness enhances micro-void formation and
crack propagation during the hole expansion (HASEGAWA et al., 2004; MATSUDA et al.,
2013).
1.5.4.1 TEMPERING OF FERRITE
During tempering of ferrite, different effects work together: carbon segregation to
dislocations and precipitation of carbides. In the case for DP steels, some coupling effects
are present, as the generation of residual stresses and a high dislocation density in the
ferrite, due to the martensite presence. Therefore, carbon segregation to the dislocations and
the elimination of the residual stresses by the volume contraction of the ferrite are
important parts of the tempering process (GRANBOM, 2010).

31
The ferrite in dual phase steels is harder than the ferrite phase after softening
annealing, since the strains change accompanying the volume change during martensitic
transformation and the increase in dislocations density. It also has a gain due to
supersaturation with interstitial atoms from rapid cooling from IA, which increases strength
and lower its ductility.
Regarding the precipitation of carbides, according to the Fe(Me)–C diagram (Figure
7), the content of soluble interstitials increases with decreasing temperature of IA, but the
diffusion rate of carbon atoms decreases and so does the probability of homogeneous
precipitation. Experiments showed that tempering at 200°C during 10 min may causes
heterogeneous precipitation at dislocations and ferrite grain and subgrain boundaries. At
300°C tempering, the size of ε-carbide and cementite precipitates grew.
Low temperatures tempering, below 200°C, only causes rearrangements of the
dislocations into lower energy configurations in the ferrite. Increasing the temperature,
between 200°C and 300°C, however, the tempering reduces the lattice distortion induced
by interstitial atoms, decreasing the ferrite hardness. Tempering at 300°C induces the
nucleation of extremely fine (2.5 nm) precipitates at the dislocations. Above 400°C, biggest
changes in ferrite microstructure takes place, with substantially increasing of fine carbides
(5 nm) and cementite particles nucleating at ferrite grain and subgrain boundaries.
Tempering at 500°C induces coarsening of special (V and Nb based) carbonitrides.
The tempering also changes the dislocation density in ferrite in the vicinity of
ferrite–martensite boundaries, substantially decreasing it. However, the precipitated
carbides at dislocations delay the annihilation of dislocations, preserving higher strength of
ferrite in DP steels upon tempering up to 600°C (FONSTEIN, 2015).
32
2 EXPERIMENTAL PROCEDURE
The materials and the methods of all the experimental testing are described in this
section.
2.1 MATERIALS
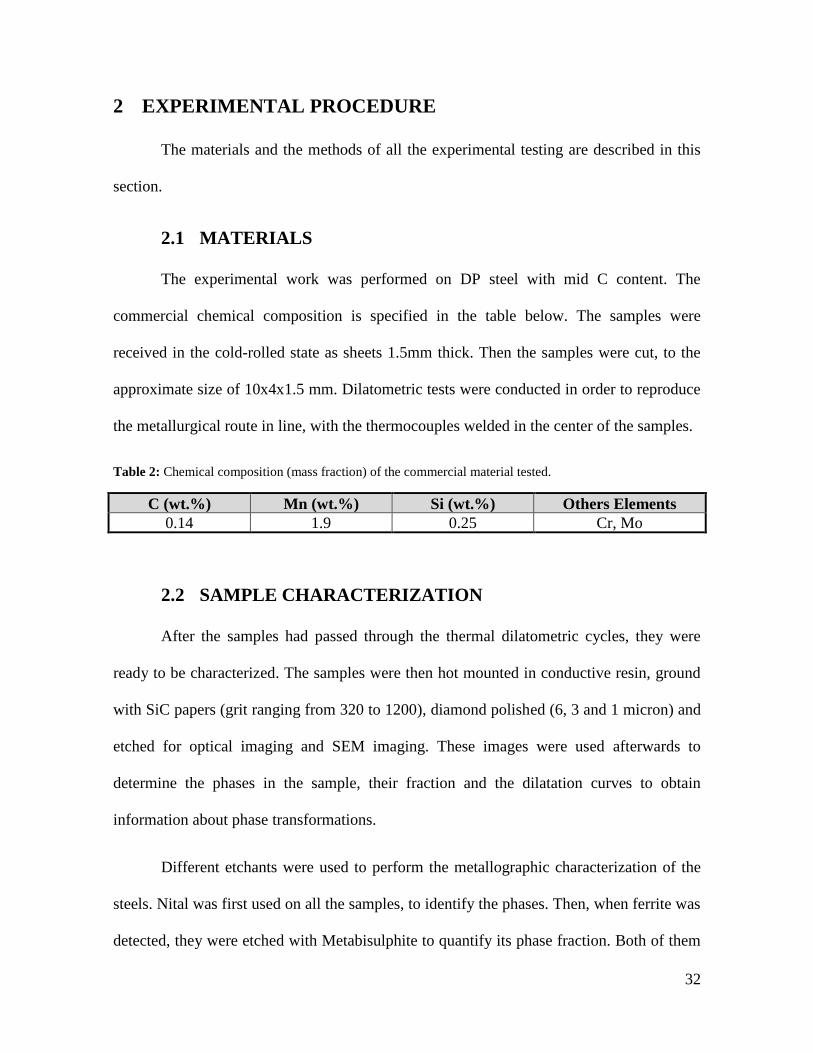
The experimental work was performed on DP steel with mid C content. The
commercial chemical composition is specified in the table below. The samples were
received in the cold-rolled state as sheets 1.5mm thick. Then the samples were cut, to the
approximate size of 10x4x1.5 mm. Dilatometric tests were conducted in order to reproduce
the metallurgical route in line, with the thermocouples welded in the center of the samples.
Table 2: Chemical composition (mass fraction) of the commercial material tested.
C (wt.%) Mn (wt.%) Si (wt.%) Others Elements
0.14 1.9 0.25 Cr, Mo
2.2 SAMPLE CHARACTERIZATION
After the samples had passed through the thermal dilatometric cycles, they were
ready to be characterized. The samples were then hot mounted in conductive resin, ground
with SiC papers (grit ranging from 320 to 1200), diamond polished (6, 3 and 1 micron) and
etched for optical imaging and SEM imaging. These images were used afterwards to
determine the phases in the sample, their fraction and the dilatation curves to obtain
information about phase transformations.
Different etchants were used to perform the metallographic characterization of the
steels. Nital was first used on all the samples, to identify the phases. Then, when ferrite was
detected, they were etched with Metabisulphite to quantify its phase fraction. Both of them
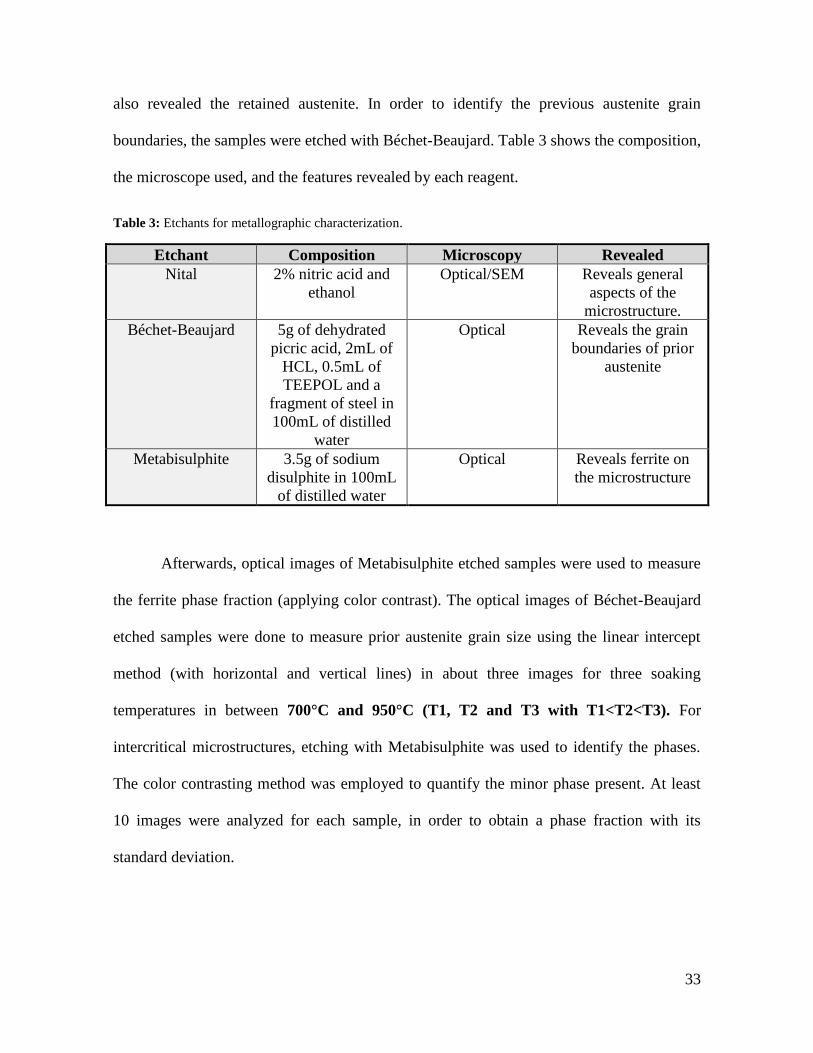
33
also revealed the retained austenite. In order to identify the previous austenite grain
boundaries, the samples were etched with Béchet-Beaujard. Table 3 shows the composition,
the microscope used, and the features revealed by each reagent.
Table 3: Etchants for metallographic characterization.
Etchant Composition Microscopy Revealed
Nital 2% nitric acid and
ethanol
Optical/SEM Reveals general
aspects of the
microstructure.
Béchet-Beaujard 5g of dehydrated
picric acid, 2mL of
HCL, 0.5mL of
TEEPOL and a
fragment of steel in
100mL of distilled
water
Optical Reveals the grain
boundaries of prior
austenite
Metabisulphite 3.5g of sodium
disulphite in 100mL
of distilled water
Optical Reveals ferrite on
the microstructure
Afterwards, optical images of Metabisulphite etched samples were used to measure
the ferrite phase fraction (applying color contrast). The optical images of Béchet-Beaujard
etched samples were done to measure prior austenite grain size using the linear intercept
method (with horizontal and vertical lines) in about three images for three soaking
temperatures in between 700°C and 950°C (T1, T2 and T3 with T1<T2<T3). For
intercritical microstructures, etching with Metabisulphite was used to identify the phases.
The color contrasting method was employed to quantify the minor phase present. At least
10 images were analyzed for each sample, in order to obtain a phase fraction with its
standard deviation.
34
Finally, conventional Vickers microhardness measurements were performed on at
least 10 locations of the polished surfaces of all samples using a 1kg load and hold time of
10 seconds.
2.3 DILATOMETRIC TRIALS
The dilatometer Bӓhr DIL850 was used in this study. The heating step is done by an
induction heating coil and the quench is done by Helium cooling. The hollow cylindrical
quartz rods, linked to an LVDT (Linear Variable Differential Transformer) captor, that hold
the samples are extremely sensitive to length changes and, therefore, can be used to
measure the dilatation. The dilatometers give the information of temperature, time and
dilatation during the experiment. During cooling or heating, the samples will dilate. The
graph of dilation by temperature is expected to be linear if any phase transformation
happens and the same rate is kept. With the formation of a new phase, a change in the slope
will appear in the graph, changing the linearity of the curve. This point corresponds to the
starting or ending temperature of a phase transformation.
The data recorded by the software can be exported to an Excel file. A macro
developed for the analysis of raw data was used to obtain the curves of the performed cycle
and the dilatation of the sample. The typical curves are presented in the figure below.
35
Figure 15: A typical curve o dilatation by temperature given by the dilatometer, for the annealing with slow-
cooling.
A phase transformation is detected by tracing two tangent lines: one before the start
of the dilatation and another when it finishes. The macro will provide the kinetics of the
transformation. The starting and finishing temperatures will be established with 5% and
95% for the normalized phase fraction transformation.
Dilatometric trials were separated into two groups. The first group was used to
highlight the effects of the segments of the continuous annealing line: soaking and slow-
cooling. The second trial group was used to make the CCT.
Monitoring phase transformations and the knowledge giving by a continuous
cooling transformation (CCT) diagram are of primary importance for proper design DP
steels with an optimal morphology. In the case of this work, the annealing cycle used
followed the same cycle of heating and then soaking at a given temperature (T4), and then
cooled with different cooling rates.
36
Since this work concerns the identification of the annealing parameters in the
production line, start the cooling from a temperature so high that it would not show any
marks of macro-segregation and a complete dispersion of manganese was of no interest.
The true objective is to reproduce the effects for the annealing line.
The detailed work plan is described in the following sections for both groups:
2.3.1 CCT
The condition at T4 has been achieved following the same thermal cycle that will be
presented for the soaking cycle. The difference, in this case, was the constant cooling rate
to reach 20°C. The diagram was made using 6 different rates of cooling: 1°C/s, 5°C/s,
10°C/s, 25°C/s, 50°C/s and 100°C/s.
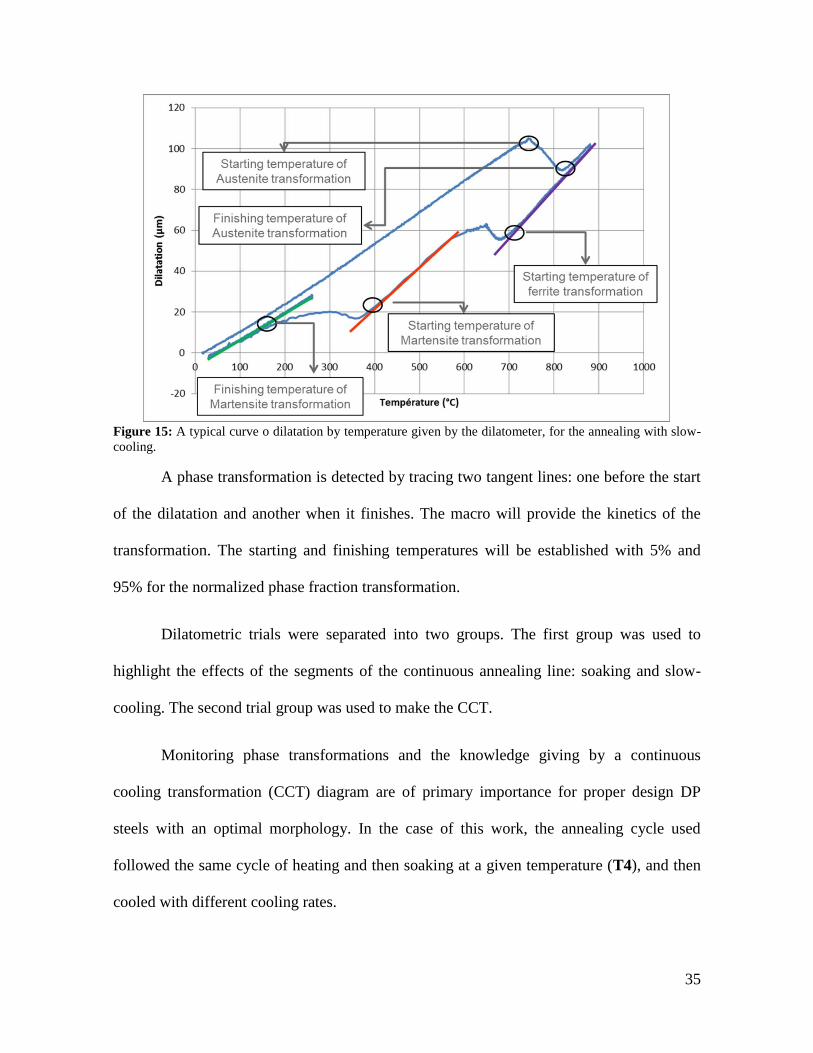
In order to find the evolution of microstructure and each phase fraction, the cooling
was stopped at some points, by quenching. Since the cooling by quenching is too fast to
have any diffusional transformation, the only transformation expected to be noticed is the
martensitic one. These middle points were at least 2 points for each cooling rate. Some
points to each cooling rate are detailed in Table 3 below.
Table 4: Stop cooling temperatures for each cooling rate; except 20°C points, all were quenched stopped.
Cooling Rate (°C/s) Ending
Temperature (°C) Cooling Rate
(°C/s) Ending Temperature
(°C)
1 650 25 650
500 500
20 20
5 650 50 650
500 500
20 20
10 650 100 650
500 500
20 20
37
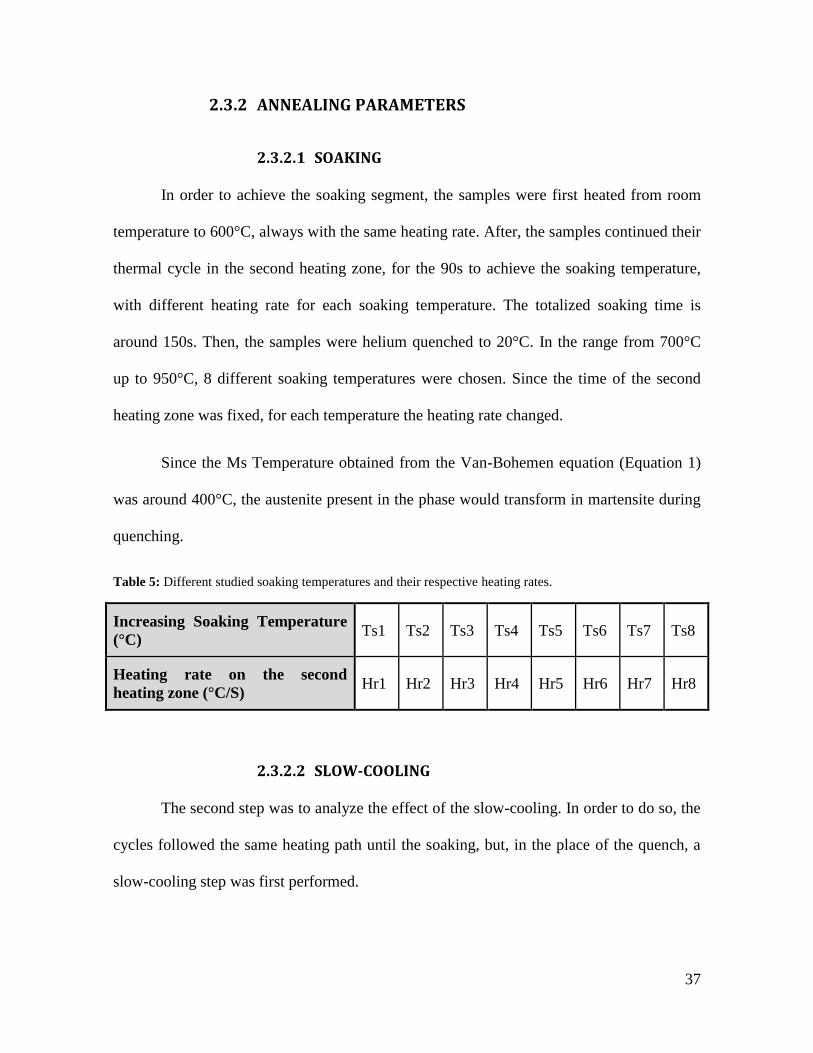
2.3.2 ANNEALING PARAMETERS
2.3.2.1 SOAKING
In order to achieve the soaking segment, the samples were first heated from room
temperature to 600°C, always with the same heating rate. After, the samples continued their
thermal cycle in the second heating zone, for the 90s to achieve the soaking temperature,
with different heating rate for each soaking temperature. The totalized soaking time is
around 150s. Then, the samples were helium quenched to 20°C. In the range from 700°C
up to 950°C, 8 different soaking temperatures were chosen. Since the time of the second
heating zone was fixed, for each temperature the heating rate changed.
Since the Ms Temperature obtained from the Van-Bohemen equation (Equation 1)
was around 400°C, the austenite present in the phase would transform in martensite during
quenching.
Table 5: Different studied soaking temperatures and their respective heating rates.
Increasing Soaking Temperature
(°C) Ts1 Ts2 Ts3 Ts4 Ts5 Ts6 Ts7 Ts8
Heating rate on the second
heating zone (°C/S) Hr1 Hr2 Hr3 Hr4 Hr5 Hr6 Hr7 Hr8
2.3.2.2 SLOW-COOLING
The second step was to analyze the effect of the slow-cooling. In order to do so, the
cycles followed the same heating path until the soaking, but, in the place of the quench, a
slow-cooling step was first performed.
38
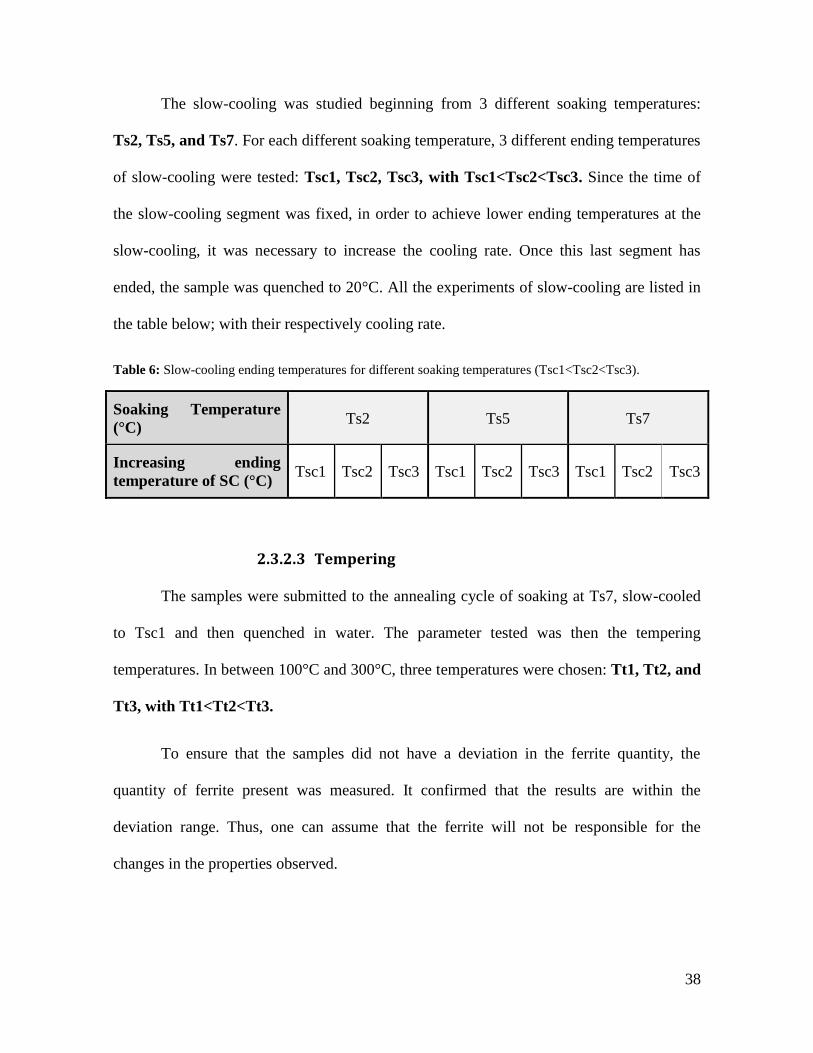
The slow-cooling was studied beginning from 3 different soaking temperatures:
Ts2, Ts5, and Ts7. For each different soaking temperature, 3 different ending temperatures
of slow-cooling were tested: Tsc1, Tsc2, Tsc3, with Tsc1<Tsc2<Tsc3. Since the time of
the slow-cooling segment was fixed, in order to achieve lower ending temperatures at the
slow-cooling, it was necessary to increase the cooling rate. Once this last segment has
ended, the sample was quenched to 20°C. All the experiments of slow-cooling are listed in
the table below; with their respectively cooling rate.
Table 6: Slow-cooling ending temperatures for different soaking temperatures (Tsc1<Tsc2<Tsc3).
Soaking Temperature
(°C) Ts2 Ts5 Ts7
Increasing ending
temperature of SC (°C) Tsc1 Tsc2 Tsc3 Tsc1 Tsc2 Tsc3 Tsc1 Tsc2 Tsc3
2.3.2.3 Tempering
The samples were submitted to the annealing cycle of soaking at Ts7, slow-cooled
to Tsc1 and then quenched in water. The parameter tested was then the tempering
temperatures. In between 100°C and 300°C, three temperatures were chosen: Tt1, Tt2, and
Tt3, with Tt1<Tt2<Tt3.
To ensure that the samples did not have a deviation in the ferrite quantity, the
quantity of ferrite present was measured. It confirmed that the results are within the
deviation range. Thus, one can assume that the ferrite will not be responsible for the
changes in the properties observed.
39
2.4 COOLING LIMITATIONS
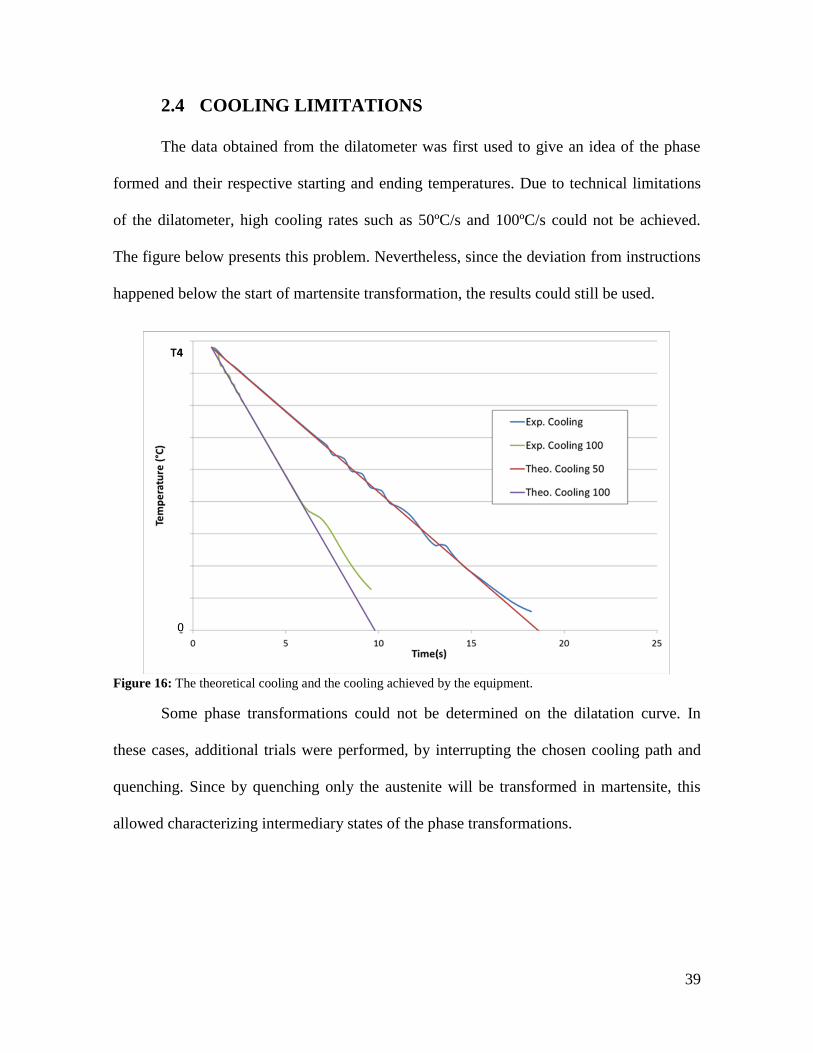
The data obtained from the dilatometer was first used to give an idea of the phase
formed and their respective starting and ending temperatures. Due to technical limitations
of the dilatometer, high cooling rates such as 50ºC/s and 100ºC/s could not be achieved.
The figure below presents this problem. Nevertheless, since the deviation from instructions
happened below the start of martensite transformation, the results could still be used.
Figure 16: The theoretical cooling and the cooling achieved by the equipment.
Some phase transformations could not be determined on the dilatation curve. In
these cases, additional trials were performed, by interrupting the chosen cooling path and
quenching. Since by quenching only the austenite will be transformed in martensite, this
allowed characterizing intermediary states of the phase transformations.
40
3 RESULTS: CCT
3.1 CCT
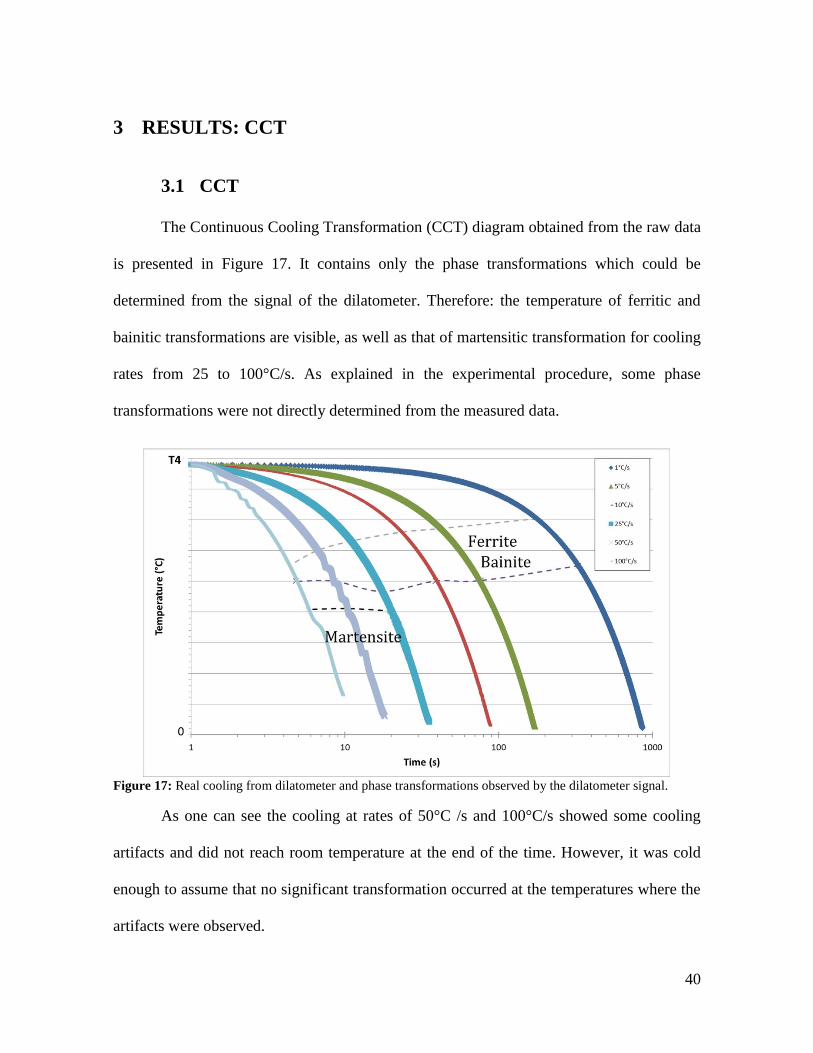
The Continuous Cooling Transformation (CCT) diagram obtained from the raw data
is presented in Figure 17. It contains only the phase transformations which could be
determined from the signal of the dilatometer. Therefore: the temperature of ferritic and
bainitic transformations are visible, as well as that of martensitic transformation for cooling
rates from 25 to 100°C/s. As explained in the experimental procedure, some phase
transformations were not directly determined from the measured data.
Figure 17: Real cooling from dilatometer and phase transformations observed by the dilatometer signal.
As one can see the cooling at rates of 50°C /s and 100°C/s showed some cooling
artifacts and did not reach room temperature at the end of the time. However, it was cold
enough to assume that no significant transformation occurred at the temperatures where the
artifacts were observed.
41
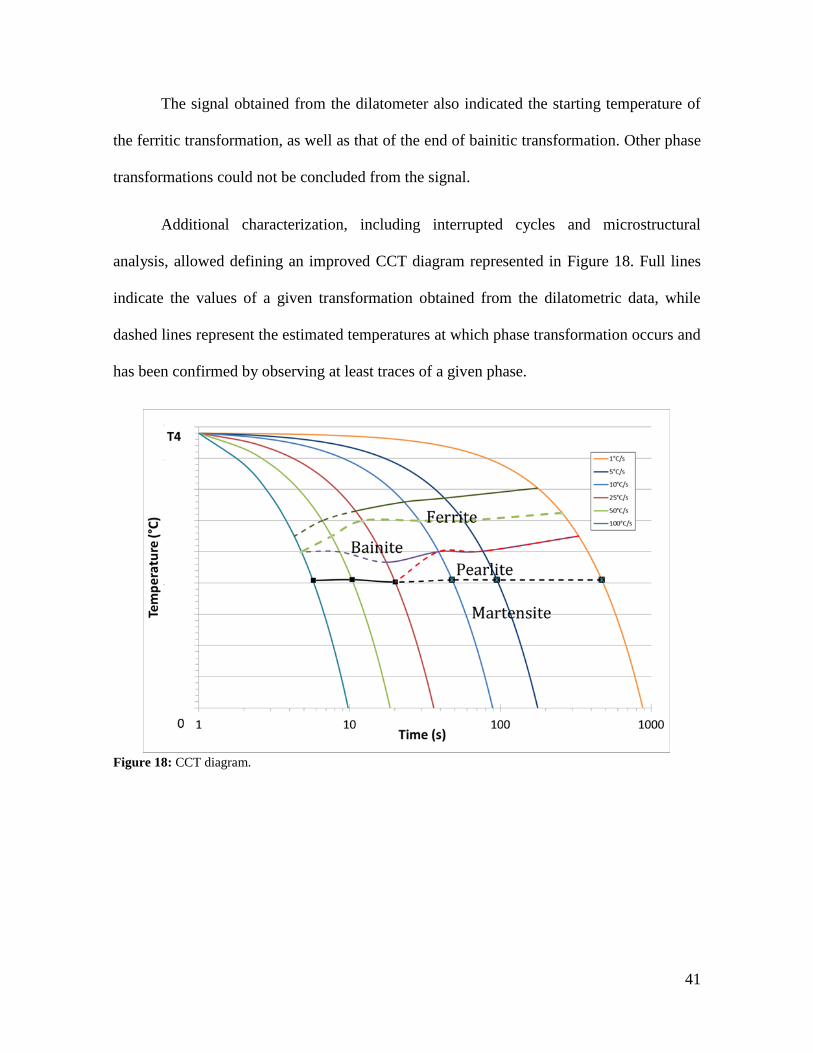
The signal obtained from the dilatometer also indicated the starting temperature of
the ferritic transformation, as well as that of the end of bainitic transformation. Other phase
transformations could not be concluded from the signal.
Additional characterization, including interrupted cycles and microstructural
analysis, allowed defining an improved CCT diagram represented in Figure 18. Full lines
indicate the values of a given transformation obtained from the dilatometric data, while
dashed lines represent the estimated temperatures at which phase transformation occurs and
has been confirmed by observing at least traces of a given phase.
Figure 18: CCT diagram.

42
3.2 MICROSTRUCTURAL CHARACTERIZATION
SEM analyses were realized for all samples, except at 100°C/s cooling rate. The
results for 1°C/s, 10°C/s and 50°C/s cooled to 20ºC are shown below, together with their
respectively Nital etching.
In the 1°C/s cooling, the matrix was of ferrite; pearlite has been seen, with
martensite, retained austenite and some bainite.
In the 10ºC/s cooling, comparing with the previous microstructure, the quantity of
martensite increases, and a mix of bainite, martensite and retained austenite takes place.
As for the 50ºC/s, the matrix was martensitic. Widmanstätten ferrite (i.e ferrite in
lath), characteristic of the faster cooling rate, was detected in the samples, replacing, in
part, the polygonal ferrite.
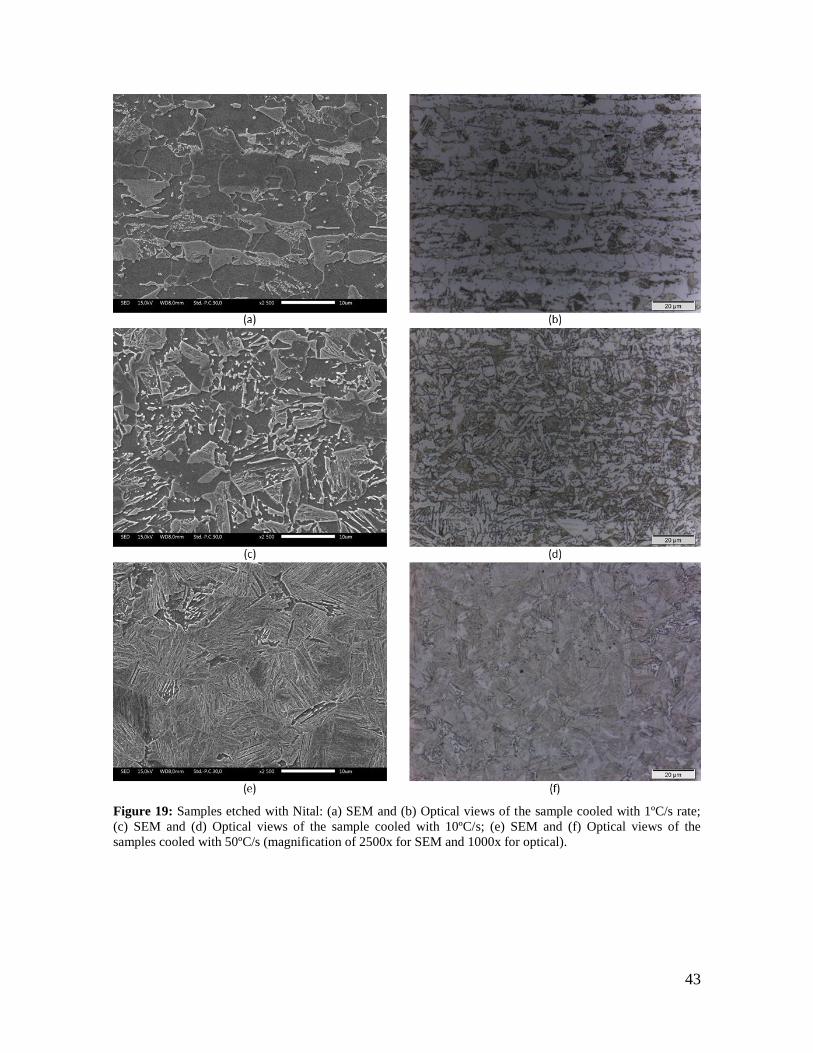
43
Figure 19: Samples etched with Nital: (a) SEM and (b) Optical views of the sample cooled with 1ºC/s rate;
(c) SEM and (d) Optical views of the sample cooled with 10ºC/s; (e) SEM and (f) Optical views of the
samples cooled with 50ºC/s (magnification of 2500x for SEM and 1000x for optical).
44
4 RESULTS: ANNEALING PARAMETERS
4.1 IMPACT OF THE SOAKING SEGMENT
This section presents and discusses the results of the soaking segment. In order to
isolate this parameter of the annealing cycle, direct quenching after soaking was performed.
The influence of soaking temperature was tested from Ts1 to ts8, with them in between
700°C and 950°C.
4.1.1 MICROSTRUCTURAL CHARACTERIZATION
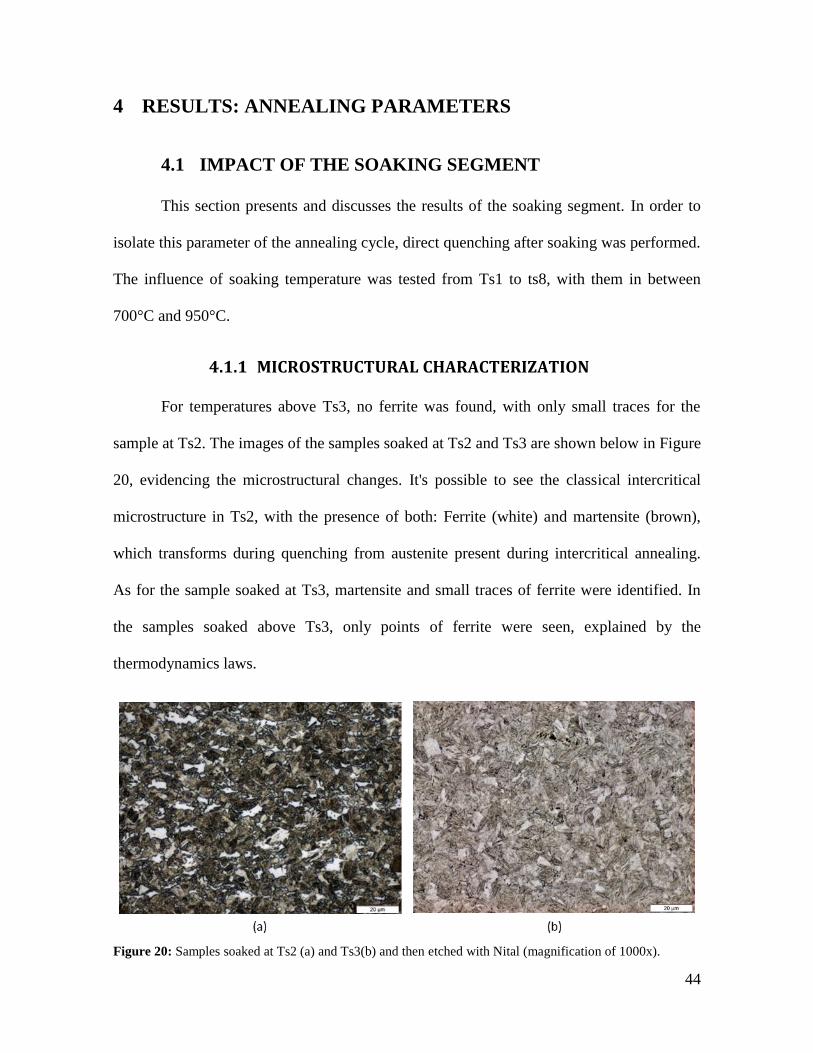
For temperatures above Ts3, no ferrite was found, with only small traces for the
sample at Ts2. The images of the samples soaked at Ts2 and Ts3 are shown below in Figure
20, evidencing the microstructural changes. It's possible to see the classical intercritical
microstructure in Ts2, with the presence of both: Ferrite (white) and martensite (brown),
which transforms during quenching from austenite present during intercritical annealing.
As for the sample soaked at Ts3, martensite and small traces of ferrite were identified. In
the samples soaked above Ts3, only points of ferrite were seen, explained by the
thermodynamics laws.
Figure 20: Samples soaked at Ts2 (a) and Ts3(b) and then etched with Nital (magnification of 1000x).
45
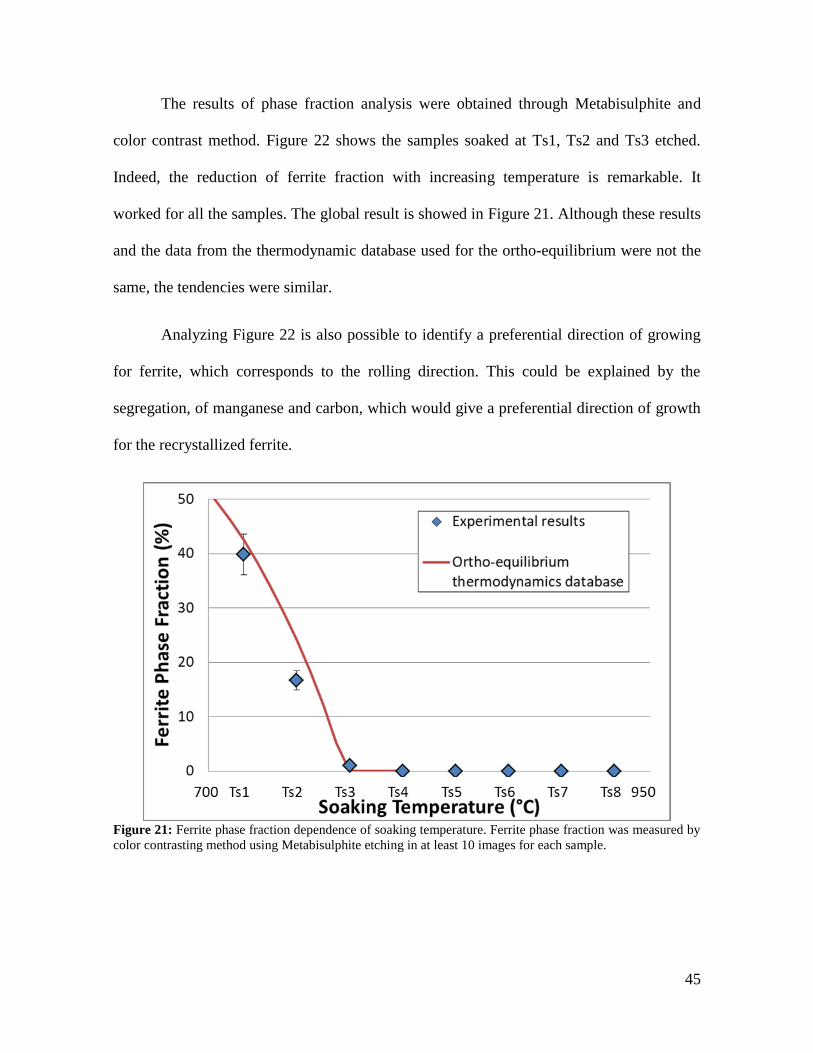
The results of phase fraction analysis were obtained through Metabisulphite and
color contrast method. Figure 22 shows the samples soaked at Ts1, Ts2 and Ts3 etched.
Indeed, the reduction of ferrite fraction with increasing temperature is remarkable. It
worked for all the samples. The global result is showed in Figure 21. Although these results
and the data from the thermodynamic database used for the ortho-equilibrium were not the
same, the tendencies were similar.
Analyzing Figure 22 is also possible to identify a preferential direction of growing
for ferrite, which corresponds to the rolling direction. This could be explained by the
segregation, of manganese and carbon, which would give a preferential direction of growth
for the recrystallized ferrite.
Figure 21: Ferrite phase fraction dependence of soaking temperature. Ferrite phase fraction was measured by
color contrasting method using Metabisulphite etching in at least 10 images for each sample.

46
Figure 22: Samples etched with Metabisulphite to put in evidence the ferrite: (a) Sample in the Ts1 soaking
state; (b) Sample in the Ts2 soaking state; (c) Sample in the Ts3 soaking state (Magnification of 1000x).
47
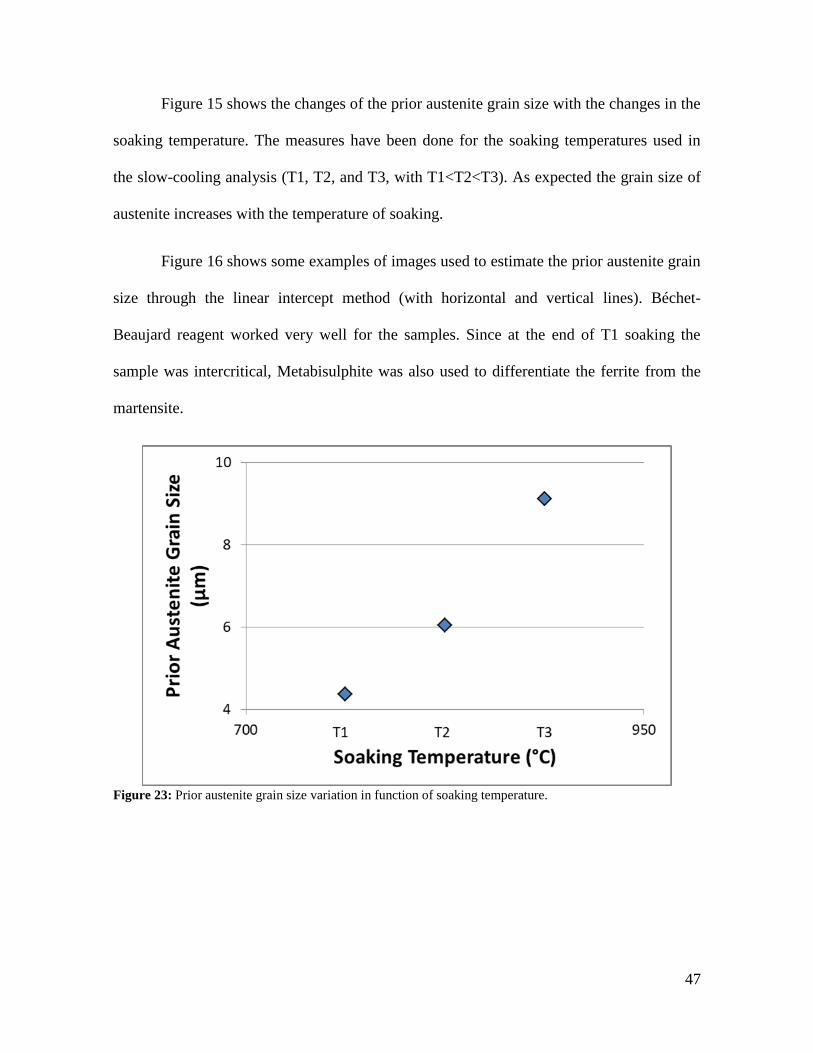
Figure 15 shows the changes of the prior austenite grain size with the changes in the
soaking temperature. The measures have been done for the soaking temperatures used in
the slow-cooling analysis (T1, T2, and T3, with T1<T2<T3). As expected the grain size of
austenite increases with the temperature of soaking.
Figure 16 shows some examples of images used to estimate the prior austenite grain
size through the linear intercept method (with horizontal and vertical lines). Béchet-
Beaujard reagent worked very well for the samples. Since at the end of T1 soaking the
sample was intercritical, Metabisulphite was also used to differentiate the ferrite from the
martensite.
Figure 23: Prior austenite grain size variation in function of soaking temperature.
48
Figure 24: Samples etched with Béchet-Beaujard: (a) Sample in the T1 soaking state, etched also with
Metabisulphite to put in evidence the ferrite; (b) Sample in the T2 soaking state; (c) Sample in the T3 soaking
state (magnification of 1000x for (a) and (b), 500x for (c)).
49
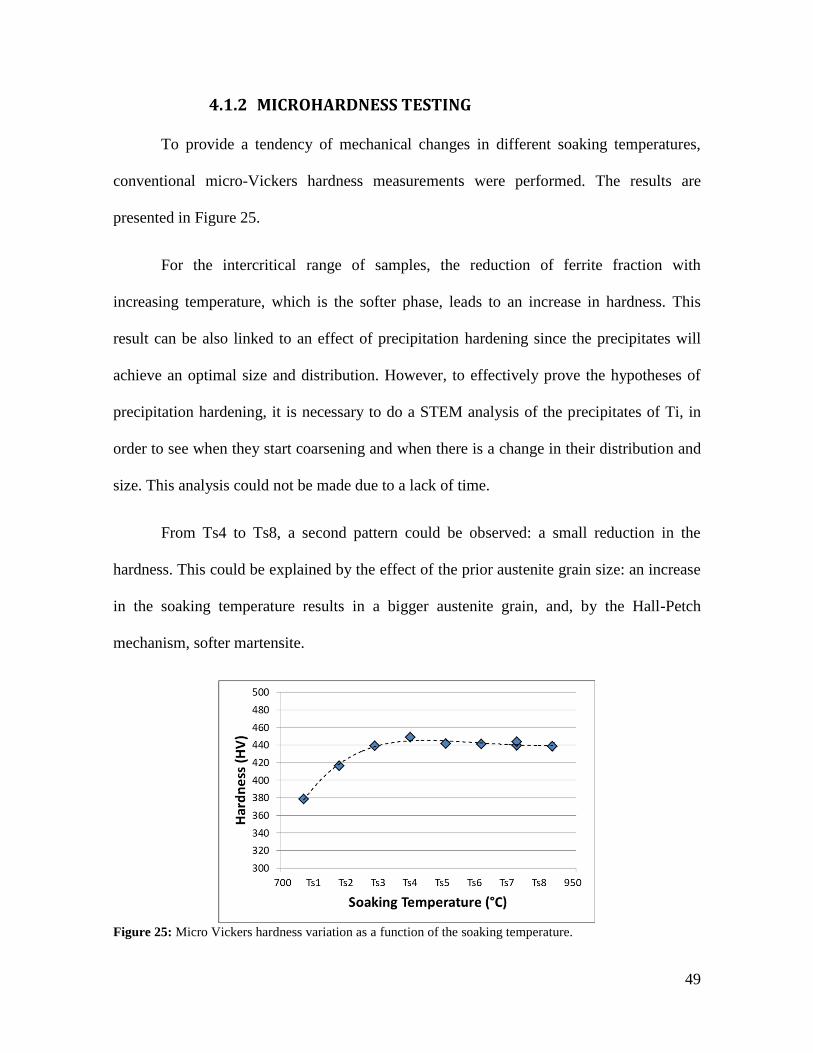
4.1.2 MICROHARDNESS TESTING
To provide a tendency of mechanical changes in different soaking temperatures,
conventional micro-Vickers hardness measurements were performed. The results are
presented in Figure 25.
For the intercritical range of samples, the reduction of ferrite fraction with
increasing temperature, which is the softer phase, leads to an increase in hardness. This
result can be also linked to an effect of precipitation hardening since the precipitates will
achieve an optimal size and distribution. However, to effectively prove the hypotheses of
precipitation hardening, it is necessary to do a STEM analysis of the precipitates of Ti, in
order to see when they start coarsening and when there is a change in their distribution and
size. This analysis could not be made due to a lack of time.
From Ts4 to Ts8, a second pattern could be observed: a small reduction in the
hardness. This could be explained by the effect of the prior austenite grain size: an increase
in the soaking temperature results in a bigger austenite grain, and, by the Hall-Petch
mechanism, softer martensite.
Figure 25: Micro Vickers hardness variation as a function of the soaking temperature.
50
4.2 IMPACT OF THE SLOW-COOLING SEGMENT
This section presents and discusses the impact of the slow-cooling section. In order
to analyze its effects, three soaking temperatures were chosen to start the slow-cooling
(SC): Ts2, Ts5, and Ts7. After being slow-cooled until the ending temperature, the samples
were direct quenched.
4.2.1 MICROSTRUCTURAL CHARACTERIZATION
The Nital etching revealed the presence of ferrite for all the samples which started
the slow-cooling from an intercritical structure, in other words, a soaking temperature of
Ts2. For the samples which started with an initial full-austenitic structure (soaking
temperature of Ts5 and Ts7), the Nital etching highlighted the presence of ferrite for some
ending temperatures. Significant amounts of ferrite phase were measured at Tsc1 ending
temperature.
Figure 26 (a), (b) and (c) present the evolution of the microstructure for the slow-
cooling beginning from an intercritical state (Ts2). Quantity and distribution of ferrite can
remain stable, as in the case of Tsc3 end-of-slow-cooling temperature. Below this
temperature, a significant fraction of ferrite appears, and the preferential direction is less
evident.
Figure 26 (d), (e) and (f) show the evolution of the microstructure for the samples
soaked at Ts7. As one could see, the evolution of the ferrite phase is clear. The ferrite
presence increases in size and quantity with the decrease of slow-cooling temperature. It is
remarkably present starting from Tsc2. Moreover, traces of retained austenite were
observed in some cases.
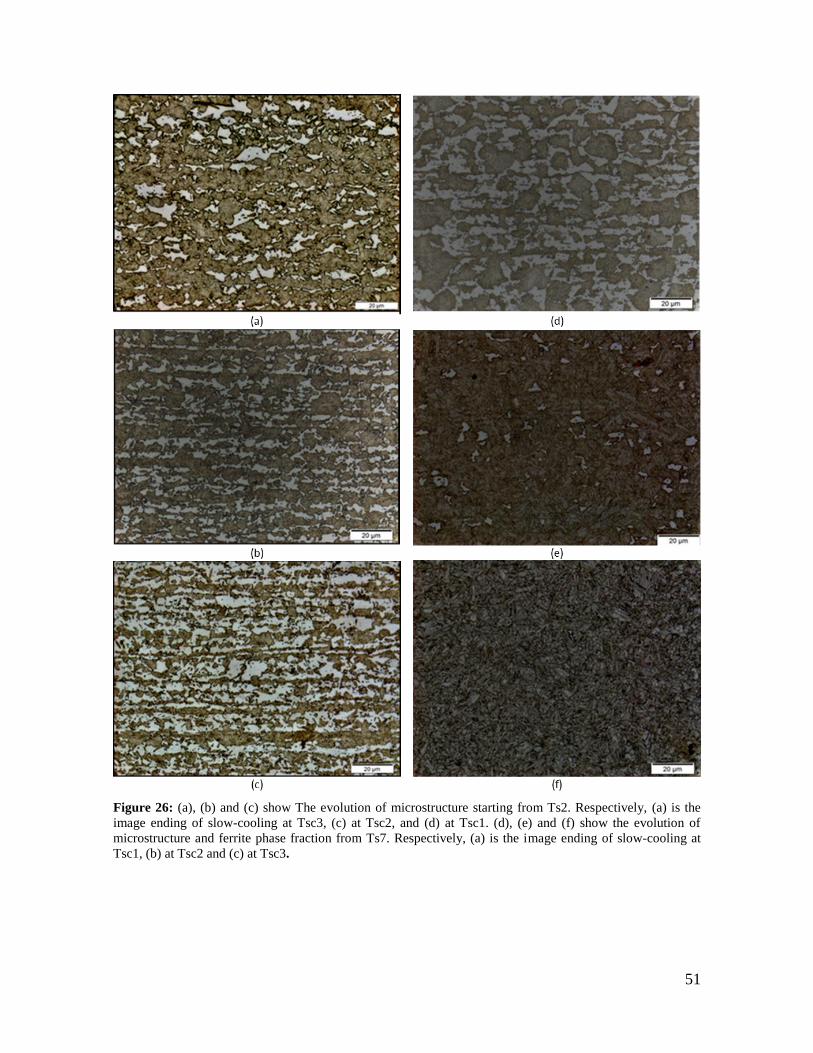
51
Figure 26: (a), (b) and (c) show The evolution of microstructure starting from Ts2. Respectively, (a) is the
image ending of slow-cooling at Tsc3, (c) at Tsc2, and (d) at Tsc1. (d), (e) and (f) show the evolution of
microstructure and ferrite phase fraction from Ts7. Respectively, (a) is the image ending of slow-cooling at
Tsc1, (b) at Tsc2 and (c) at Tsc3.
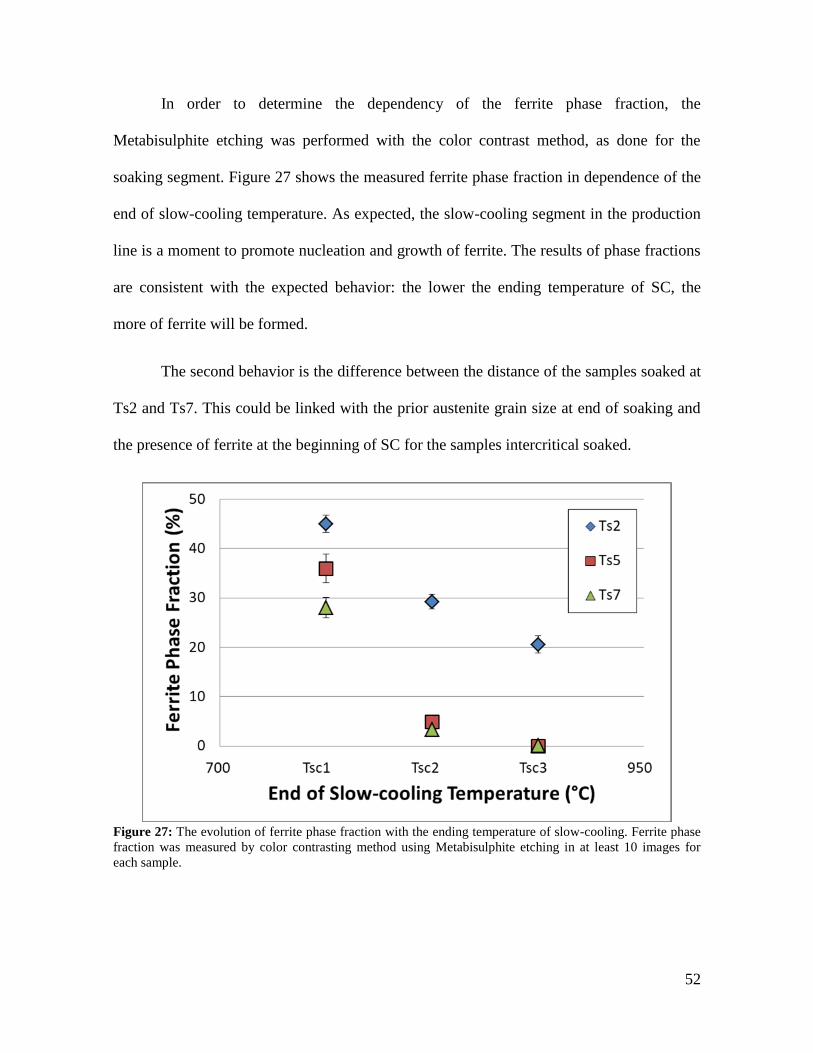
52
In order to determine the dependency of the ferrite phase fraction, the
Metabisulphite etching was performed with the color contrast method, as done for the
soaking segment. Figure 27 shows the measured ferrite phase fraction in dependence of the
end of slow-cooling temperature. As expected, the slow-cooling segment in the production
line is a moment to promote nucleation and growth of ferrite. The results of phase fractions
are consistent with the expected behavior: the lower the ending temperature of SC, the
more of ferrite will be formed.
The second behavior is the difference between the distance of the samples soaked at
Ts2 and Ts7. This could be linked with the prior austenite grain size at end of soaking and
the presence of ferrite at the beginning of SC for the samples intercritical soaked.
Figure 27: The evolution of ferrite phase fraction with the ending temperature of slow-cooling. Ferrite phase
fraction was measured by color contrasting method using Metabisulphite etching in at least 10 images for
each sample.
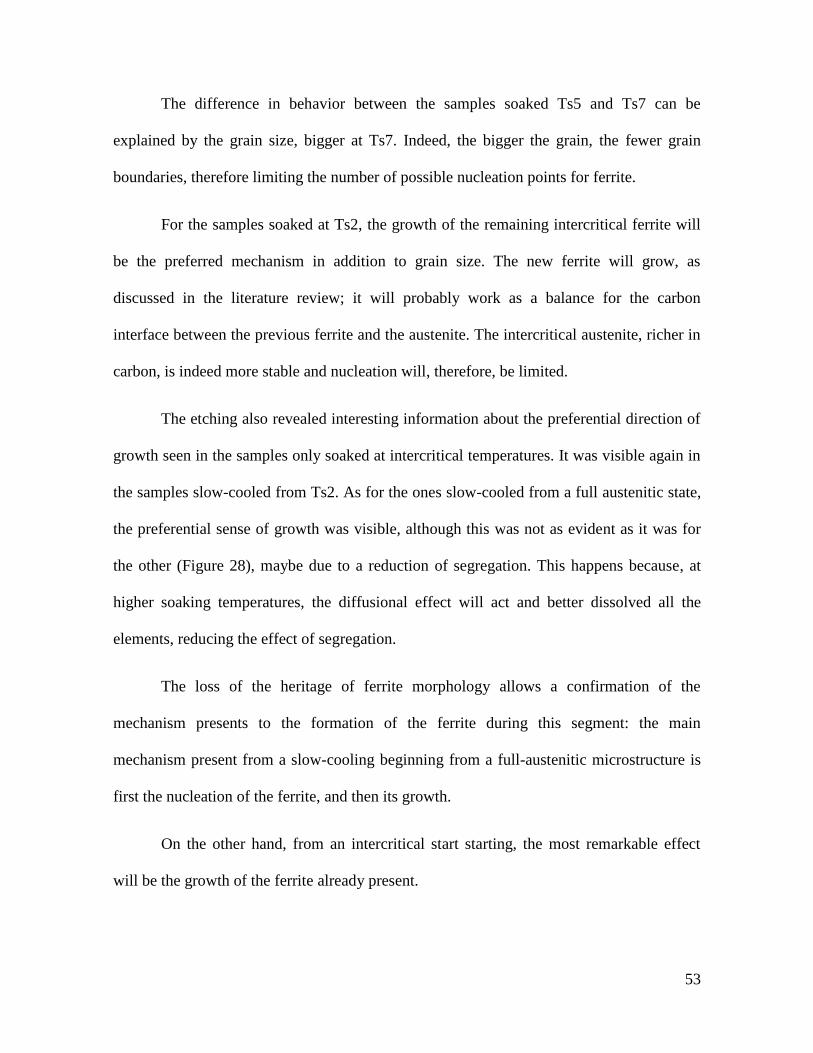
53
The difference in behavior between the samples soaked Ts5 and Ts7 can be
explained by the grain size, bigger at Ts7. Indeed, the bigger the grain, the fewer grain
boundaries, therefore limiting the number of possible nucleation points for ferrite.
For the samples soaked at Ts2, the growth of the remaining intercritical ferrite will
be the preferred mechanism in addition to grain size. The new ferrite will grow, as
discussed in the literature review; it will probably work as a balance for the carbon
interface between the previous ferrite and the austenite. The intercritical austenite, richer in
carbon, is indeed more stable and nucleation will, therefore, be limited.
The etching also revealed interesting information about the preferential direction of
growth seen in the samples only soaked at intercritical temperatures. It was visible again in
the samples slow-cooled from Ts2. As for the ones slow-cooled from a full austenitic state,
the preferential sense of growth was visible, although this was not as evident as it was for
the other (Figure 28), maybe due to a reduction of segregation. This happens because, at
higher soaking temperatures, the diffusional effect will act and better dissolved all the
elements, reducing the effect of segregation.
The loss of the heritage of ferrite morphology allows a confirmation of the
mechanism presents to the formation of the ferrite during this segment: the main
mechanism present from a slow-cooling beginning from a full-austenitic microstructure is
first the nucleation of the ferrite, and then its growth.
On the other hand, from an intercritical start starting, the most remarkable effect
will be the growth of the ferrite already present.
54
Figure 28: The reduction of ferrite elongation and preferential direction of growth noticed in the
microstructural, images from the ending of slow-cooling at Tsc1 of samples soaked at the three different
temperatures. Respectively, (a) is the image from the sample soaked at Ts2, (b) at Ts5 and (c) at Ts7.
(Magnification of 1000x)
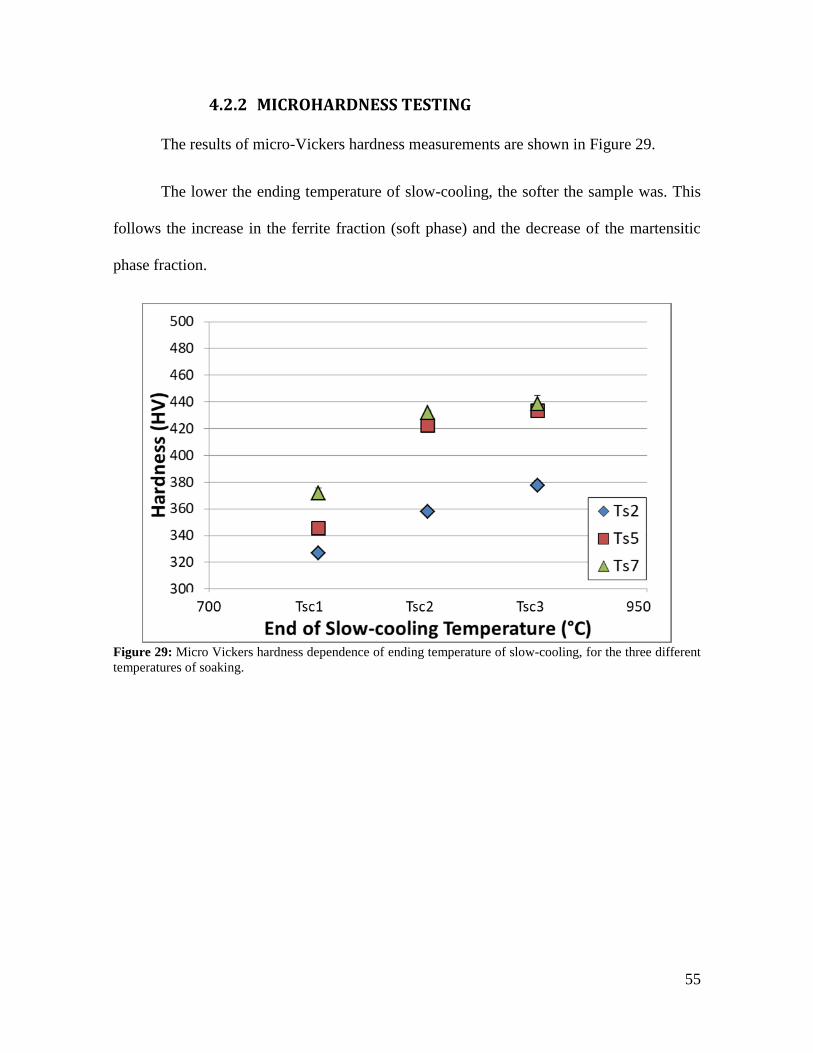
55
4.2.2 MICROHARDNESS TESTING
The results of micro-Vickers hardness measurements are shown in Figure 29.
The lower the ending temperature of slow-cooling, the softer the sample was. This
follows the increase in the ferrite fraction (soft phase) and the decrease of the martensitic
phase fraction.
Figure 29: Micro Vickers hardness dependence of ending temperature of slow-cooling, for the three different
temperatures of soaking.
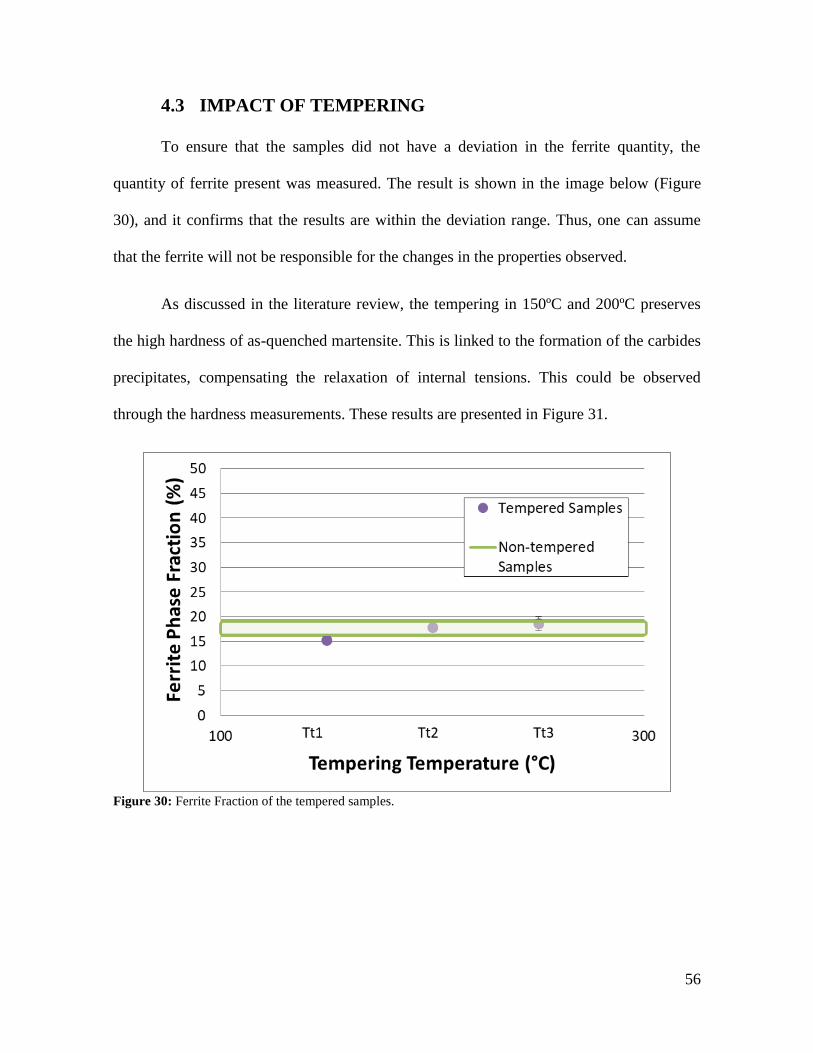
56
4.3 IMPACT OF TEMPERING
To ensure that the samples did not have a deviation in the ferrite quantity, the
quantity of ferrite present was measured. The result is shown in the image below (Figure
30), and it confirms that the results are within the deviation range. Thus, one can assume
that the ferrite will not be responsible for the changes in the properties observed.
As discussed in the literature review, the tempering in 150ºC and 200ºC preserves
the high hardness of as-quenched martensite. This is linked to the formation of the carbides
precipitates, compensating the relaxation of internal tensions. This could be observed
through the hardness measurements. These results are presented in Figure 31.
Figure 30: Ferrite Fraction of the tempered samples.
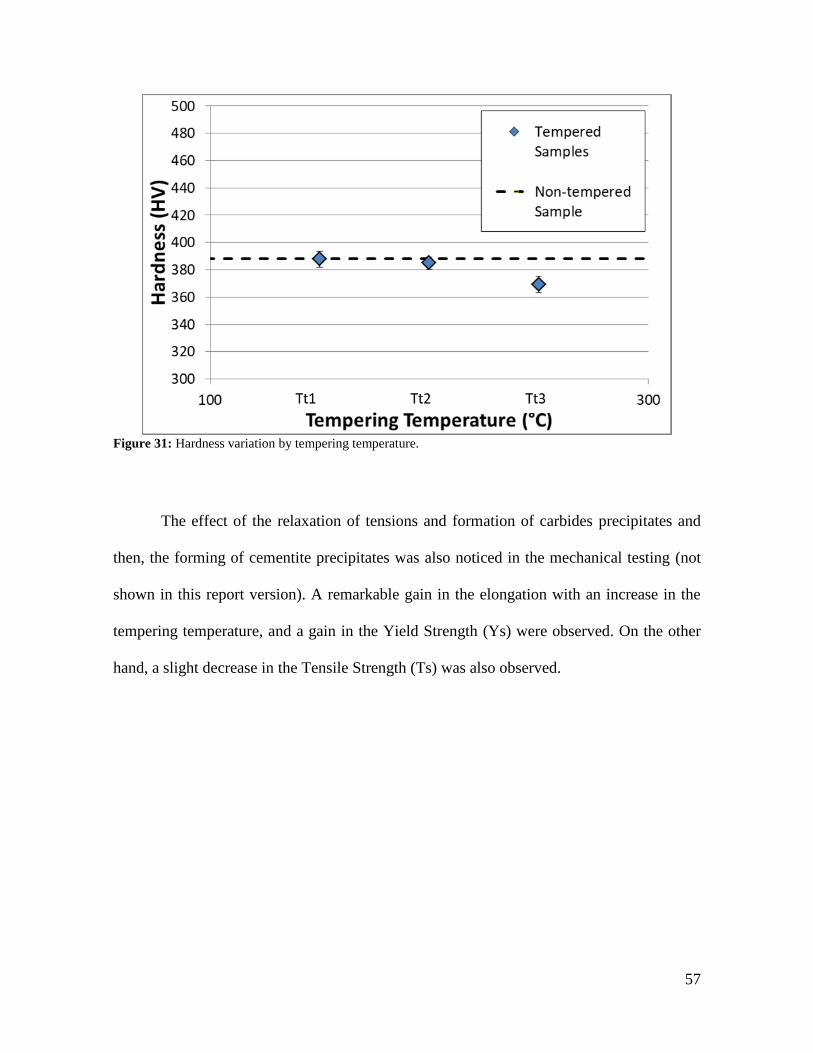
57
Figure 31: Hardness variation by tempering temperature.
The effect of the relaxation of tensions and formation of carbides precipitates and
then, the forming of cementite precipitates was also noticed in the mechanical testing (not
shown in this report version). A remarkable gain in the elongation with an increase in the
tempering temperature, and a gain in the Yield Strength (Ys) were observed. On the other
hand, a slight decrease in the Tensile Strength (Ts) was also observed.
58
5 CONCLUSION
The DP steel studied in this work follows the production annealing line separated in
4 segments: heating (1), soaking (2), cooling (3) and tempering (4). This project assessed
the influence of the segments of soaking, cooling and tempering to the final microstructure
and microhardness of that steel. The results may be summarized as follow:
a) A CCT diagram was built according to segments (1), (2) and (3), where cooling was
performed in a linear fashion with rates ranging from 1 °C/s up to 100 °C/s. Ferrite
and martensite were present in the final microstructure, apart from the cooling rates
chosen.
b) When the soaking was varied, the result obtained was the reduction of the ferrite
volume fraction with increasing soaking temperature. These experiments also
showed a non-linear dependence of the microhardness on the ferrite phase fraction.
c) When the cooling segment (3) is modified, with a slow-cooling followed by a
quenching, the results obtained were:
• Nucleation and growth of a quasi-equiaxial ferrite, for annealing
temperatures starting at a full-austenitic domain;
• Growth of pre-existent ferrite grains, along the same rolling direction as
previously observed;
d) It could also be observed that tempering treatments performed afterwards, had no
further effect on the microstructure, as the phase fractions remained unchanged.
However, a reduction on the microhardness values was perceived at the highest
tempering temperature tested
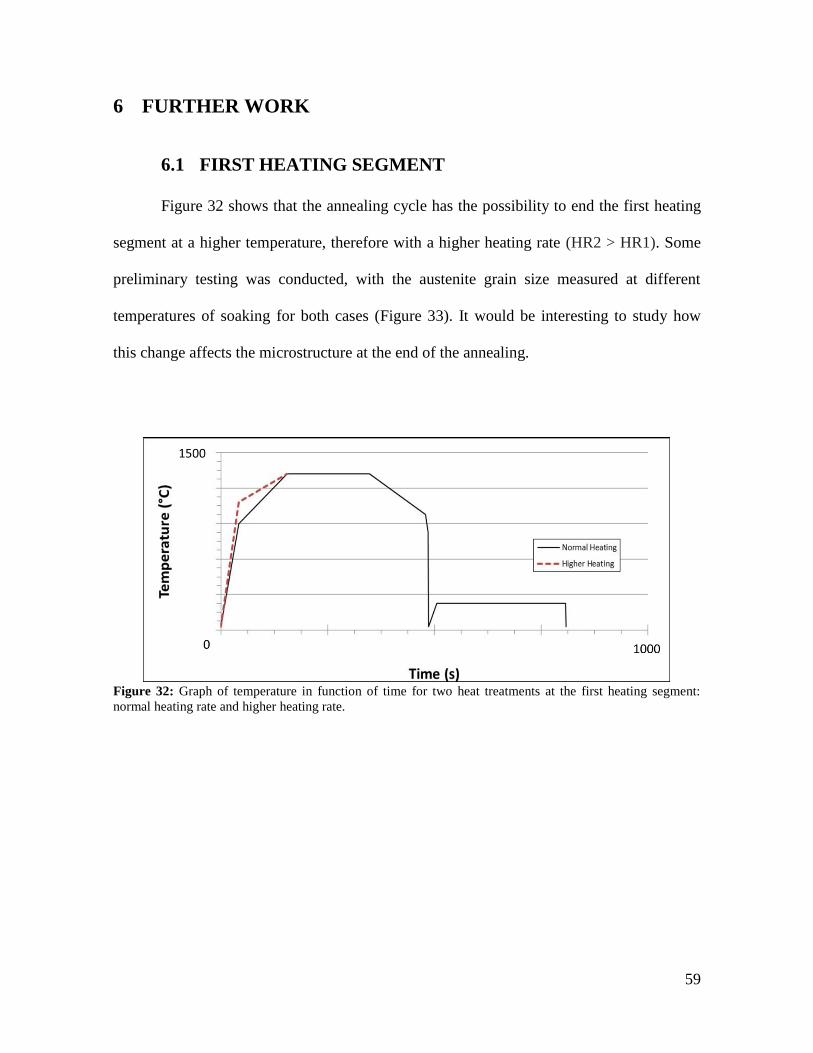
59
6 FURTHER WORK
6.1 FIRST HEATING SEGMENT
Figure 32 shows that the annealing cycle has the possibility to end the first heating
segment at a higher temperature, therefore with a higher heating rate (HR2 > HR1). Some
preliminary testing was conducted, with the austenite grain size measured at different
temperatures of soaking for both cases (Figure 33). It would be interesting to study how
this change affects the microstructure at the end of the annealing.
Figure 32: Graph of temperature in function of time for two heat treatments at the first heating segment:
normal heating rate and higher heating rate.
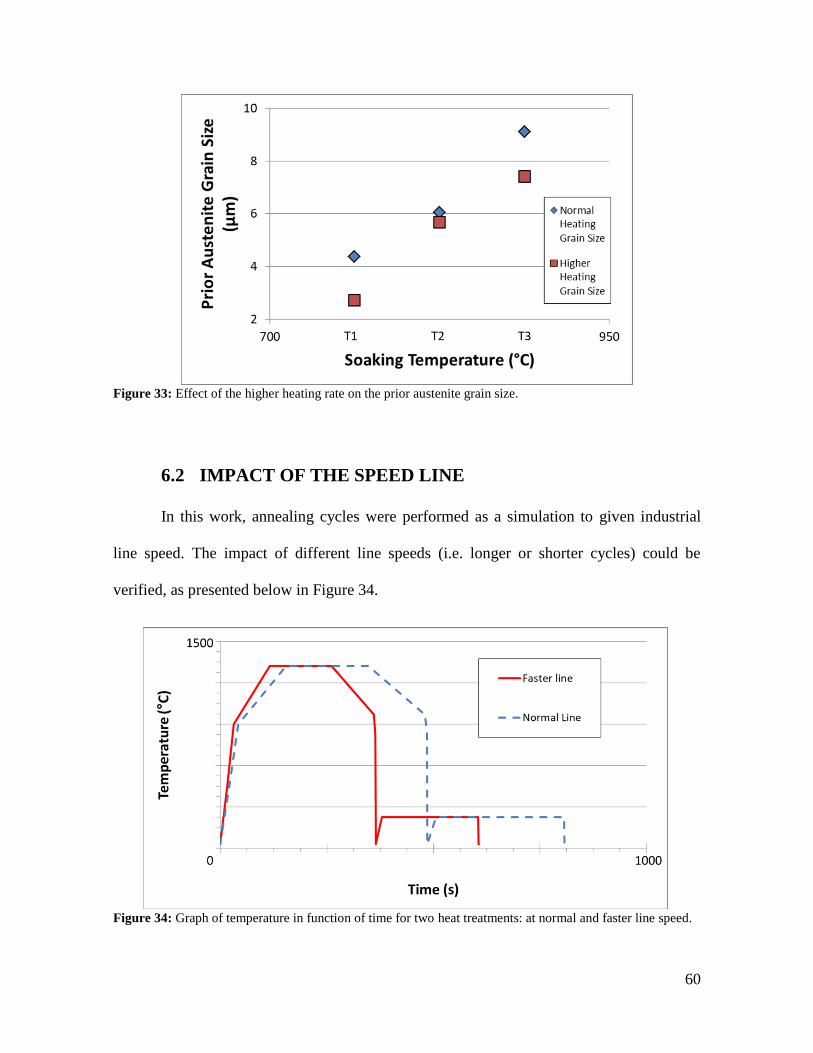
60
Figure 33: Effect of the higher heating rate on the prior austenite grain size.
6.2 IMPACT OF THE SPEED LINE
In this work, annealing cycles were performed as a simulation to given industrial
line speed. The impact of different line speeds (i.e. longer or shorter cycles) could be
verified, as presented below in Figure 34.
Figure 34: Graph of temperature in function of time for two heat treatments: at normal and faster line speed.
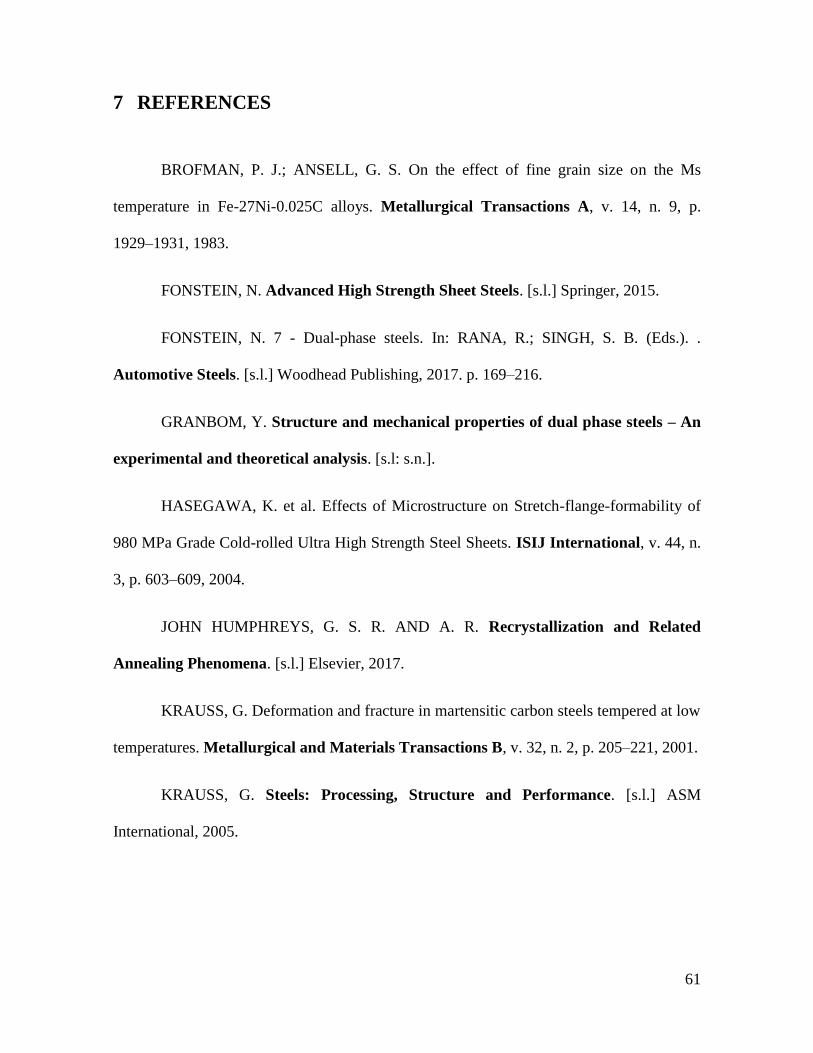
61
7 REFERENCES
BROFMAN, P. J.; ANSELL, G. S. On the effect of fine grain size on the Ms
temperature in Fe-27Ni-0.025C alloys. Metallurgical Transactions A, v. 14, n. 9, p.
1929–1931, 1983.
FONSTEIN, N. Advanced High Strength Sheet Steels. [s.l.] Springer, 2015.
FONSTEIN, N. 7 - Dual-phase steels. In: RANA, R.; SINGH, S. B. (Eds.). .
Automotive Steels. [s.l.] Woodhead Publishing, 2017. p. 169–216.
GRANBOM, Y. Structure and mechanical properties of dual phase steels – An
experimental and theoretical analysis. [s.l: s.n.].
HASEGAWA, K. et al. Effects of Microstructure on Stretch-flange-formability of
980 MPa Grade Cold-rolled Ultra High Strength Steel Sheets. ISIJ International, v. 44, n.
3, p. 603–609, 2004.
JOHN HUMPHREYS, G. S. R. AND A. R. Recrystallization and Related
Annealing Phenomena. [s.l.] Elsevier, 2017.
KRAUSS, G. Deformation and fracture in martensitic carbon steels tempered at low
temperatures. Metallurgical and Materials Transactions B, v. 32, n. 2, p. 205–221, 2001.
KRAUSS, G. Steels: Processing, Structure and Performance. [s.l.] ASM
International, 2005.
62
MATSUDA, H. et al. Effects of auto-tempering behaviour of martensite on
mechanical properties of ultra high strength steel sheets. Journal of Alloys and
Compounds, v. 577, p. S661–S667, 2013.
PERANIO, N.; ROTERS, F.; RAABE, D. Microstructure Evolution during
Recrystallization in Dual-Phase Steels. Materials Science Forum, v. 715–716, p. 13–22,
2012.
SCOTT, C. P. et al. New insights into martensite strength and the damage behaviour
of dual phase steels. Acta Materialia, v. 159, p. 112–122, 2018.
SPEICH, G. R.; DEMAREST, V. A.; MILLER, R. L. Formation of Austenite
During Intercritical Annealing of Dual-Phase Steels. Metallurgical and Materials
Transactions A, v. 12, n. 8, p. 1419–1428, 1981.
TASAN, C. C. et al. An Overview of Dual-Phase Steels: Advances in
Microstructure-Oriented Processing and Micromechanically Guided Design. Annual
Review of Materials Research, v. 45, n. 1, p. 391–431, 2015.
TAYLOR, K. A.; COHEN, M. Aging of ferrous martensites. Progress in Materials
Science, v. 36, p. 151–272, 1992.
VAN BOHEMEN, S. M. C. Bainite and martensite start temperature calculated with
exponential carbon dependence. Materials Science and Technology, v. 28, n. 4, p. 487–
495, 1 abr. 2012.
WASHKO, S. D.; AGGEN, D. Volume 1: Properties and Selection: Irons, Steels,
and High-Performance Alloys. ASM Handbook, 1990.
63
WATERSCHOOT, T.; VERBEKEN, K.; DE COOMAN, B. C. Tempering Kinetics
of the Martensitic Phase in DP Steel. ISIJ International, v. 46, n. 1, p. 138–146, 2006.
YANG, H.-S.; BHADESHIA, H. K. D. H. Austenite grain size and the martensite-
start temperature. Scripta Materialia, v. 60, n. 7, p. 493–495, 2009.


![Tratamentos de Recozimento [20] - feis.unesp.br · Tratamentos de Recozimento [20] ¾Finalidade dos tratamentos de recozimento:Finalidade dos tratamentos de recozimento: eli i f it](https://img.document.onl/doc/110x75/5c4cc36c93f3c3245e2872bb/tratamentos-de-recozimento-20-feisunespbr-tratamentos-de-recozimento-20.jpg)

![Tratamentos de Recozimento [20] - Unesp · 2013. 11. 14. · Tratamentos de Recozimento ¾Recozimento pleno: Procedimento: • Aquecimento hipoeutetóide: A 3 + 50°C hipereutetóide:](https://img.document.onl/doc/110x75/60fff03b1ed004215b3b1282/tratamentos-de-recozimento-20-2013-11-14-tratamentos-de-recozimento-recozimento.jpg)


![89023611-Wiring diagram VM EM-EU5[1].pdf](https://img.document.onl/doc/110x75/55cf94e1550346f57ba50dac/89023611-wiring-diagram-vm-em-eu51pdf.jpg)