Embed Size (px)
Citation preview
___________________________________
1 John Deere Brasil, Av. Brás Olaia Costa, 727 - sala 1707, Ribeirão Preto - SP, Brazil. 2 ESALQ, Universidade de São Paulo, Av. Pádua Dias, 11, Piracicaba - SP, Brazil, [email protected]. Recebido pelo Conselho Editorial em: 22-9-2009 Aprovado pelo Conselho Editorial em: 12-11-2010
Eng. Agríc., Jaboticabal, v.30, n.6, p.1110-1122, nov./dez. 2010
EVALUATION OF FIVE SUGAR CANE PLANTERS
MARCO L. C. RÍPOLI1, TOMAZ C. C. RÍPOLI2
ABSTRACT: Brazil is the world biggest producer of sugar cane with an area of 7x10⁶ hectares. Mainly the system used for planting is the semi-mechanized one, which consists in opening the furrows with a machine, manually allocating the fractioned stalks and then covering the furrows done by the machines. The great amount of human labor used in the semi-mechanized system is becoming harder to find and also more expensive, indicating the need of a fully mechanized operation. Currently in Brazil these agriculture machines industries offers six different types of fully mechanized sugar cane planters (two types of whole stalks for planting and four using mechanized harvested stalks known as billets). All of them plant in two furrows simultaneously in 1.5 m row spacing. This study analyzed five different machines and the following variables: Working Speed (km h-1); Effective Capacity (ha h-1), Drawbar Force (kgf), Draw Bar Power (in HP), Fuel Consumption (L h-1) and Costs (US$ ha-1) comparing them with the semi-mechanized system. This research also characterized the stalks for planting as viable gems number (%), non viable gems number (%) and billet length (m). And lastly the mechanized planting system is cheaper than the conventional one and none of the machines has an adequate mechanism for placing the right amount of sugar cane seed. KEYWORDS: sugar cane; planters; performance, costs.
ENSAIOS DE CINCO PLANTADORAS DE CANA-DE-AÇÚCAR
RESUMO: O Brasil é o maior produtor de cana com área de 7 milhões de hectares. O sistema de plantio mais utilizado é o semimecanizado (sulcação mecânica, distribuição e picamento das mudas manual e cobertura de sulco com máquina). A carência e o custo de mão de obra têm aumentado, mostrando a necessidade de mecanização total da operação. Atualmente a indústria de máquinas oferece seis diferentes modelos de plantadoras (duas de mudas inteiras e quatro de mudas picadas). Todas plantam duas fileiras por vez, no espaçamento de 1,5 m. O estudo analisou as variáveis velocidade efetiva (km h-1), capacidade efetiva (ha h-1), força de tração na barra (kgf), potência na barra (HP), consumo de combustível (L h-1) e custos (US$ ha-1), confrontando essas variáveis com o sistema semi-mecanizado. Caracterizaram-se, ainda, as mudas em termos de gemas viáveis (%), não viáveis (%) e comprimento dos rebolos (m). O sistema mecanizado foi mais barato que o semimecanizado. Nenhuma máquina apresentou mecanismo dosador de mudas adequado. PALAVRAS-CHAVE: cana-de-açúcar, plantadoras, desempenho, custos. INTRODUCTION
Due to the mechanized planting system in Brazil is a very recent activity, it does not have much scientific references. Only references about essays and tests with no scientific method.
CARLIN et al. (2004) considers the most important factor for good yield is the quality of planting, which should provide a good stand of buds per meter.
RIPOLI (2006) says that the excessive variability in the agricultural productivity of sugar cane is not only due to genetic factors, but in practice did not provide adequate soil preparation for planting and that the mechanical planting should reduce this tendency.
Evaluation of five sugar cane planters
Eng. Agríc., Jaboticabal, v.30, n.6, p.1110-1122, nov./dez. 2010
1111
STOLF et al. (1984) studied the influence of mechanized planting on germination rate of sugarcane. The results showed that the germination rates were: conventional system = 38% and mechanized system = 37.2% and 35, 5%.
This study presents the main results gathered in Costa Pinto Sugar Mill (COSAN Group), in the city of Piracicaba, state of São Paulo, Brazil during October 2005 which had as objectives to find comparative results among five sugar cane planters, based in a standard method under the same field conditions.
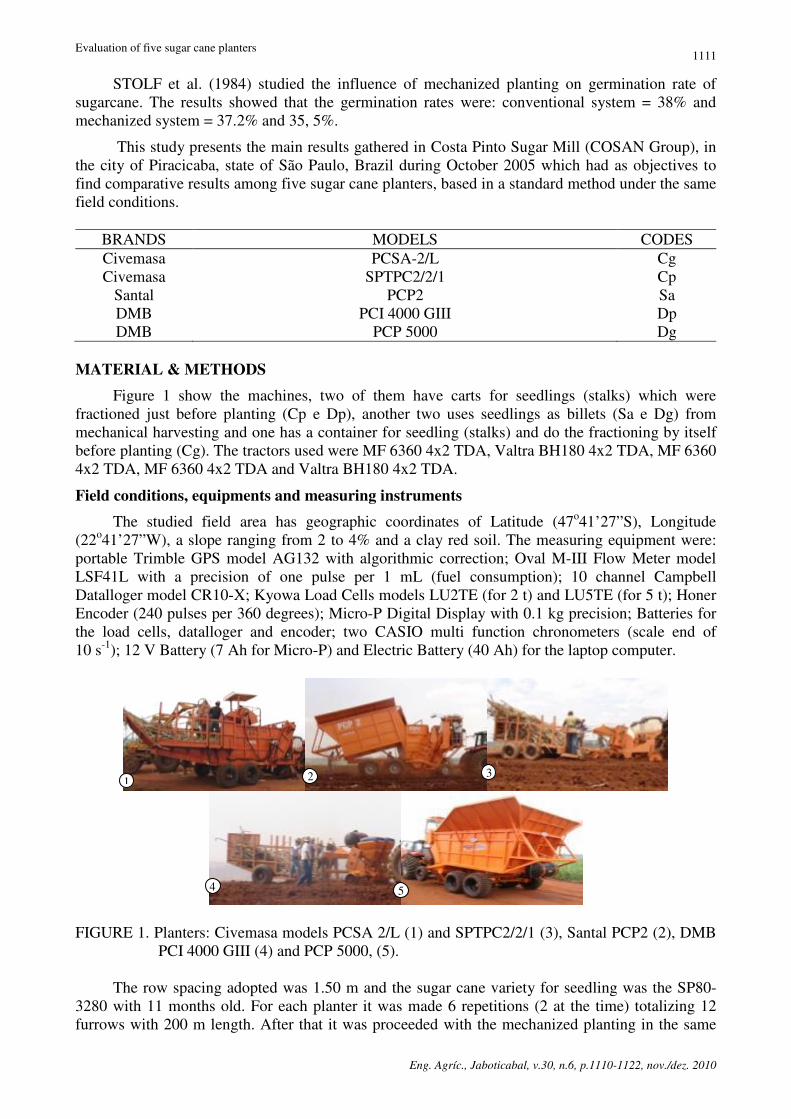
BRANDS MODELS CODES Civemasa PCSA-2/L Cg Civemasa SPTPC2/2/1 Cp
Santal PCP2 Sa DMB PCI 4000 GIII Dp DMB PCP 5000 Dg
MATERIAL & METHODS
Figure 1 show the machines, two of them have carts for seedlings (stalks) which were fractioned just before planting (Cp e Dp), another two uses seedlings as billets (Sa e Dg) from mechanical harvesting and one has a container for seedling (stalks) and do the fractioning by itself before planting (Cg). The tractors used were MF 6360 4x2 TDA, Valtra BH180 4x2 TDA, MF 6360 4x2 TDA, MF 6360 4x2 TDA and Valtra BH180 4x2 TDA.
Field conditions, equipments and measuring instruments
The studied field area has geographic coordinates of Latitude (47o41’27”S), Longitude (22o41’27”W), a slope ranging from 2 to 4% and a clay red soil. The measuring equipment were: portable Trimble GPS model AG132 with algorithmic correction; Oval M-III Flow Meter model LSF41L with a precision of one pulse per 1 mL (fuel consumption); 10 channel Campbell Datalloger model CR10-X; Kyowa Load Cells models LU2TE (for 2 t) and LU5TE (for 5 t); Honer Encoder (240 pulses per 360 degrees); Micro-P Digital Display with 0.1 kg precision; Batteries for the load cells, datalloger and encoder; two CASIO multi function chronometers (scale end of 10 s-1); 12 V Battery (7 Ah for Micro-P) and Electric Battery (40 Ah) for the laptop computer.
FIGURE 1. Planters: Civemasa models PCSA 2/L (1) and SPTPC2/2/1 (3), Santal PCP2 (2), DMB
PCI 4000 GIII (4) and PCP 5000, (5).
The row spacing adopted was 1.50 m and the sugar cane variety for seedling was the SP80-3280 with 11 months old. For each planter it was made 6 repetitions (2 at the time) totalizing 12 furrows with 200 m length. After that it was proceeded with the mechanized planting in the same
1 2 3
4 5
Marco L. C. Rípoli & Tomaz C. C. Rípoli
Eng. Agríc., Jaboticabal, v.30, n.6, p.1110-1122, nov./dez. 2010
1112
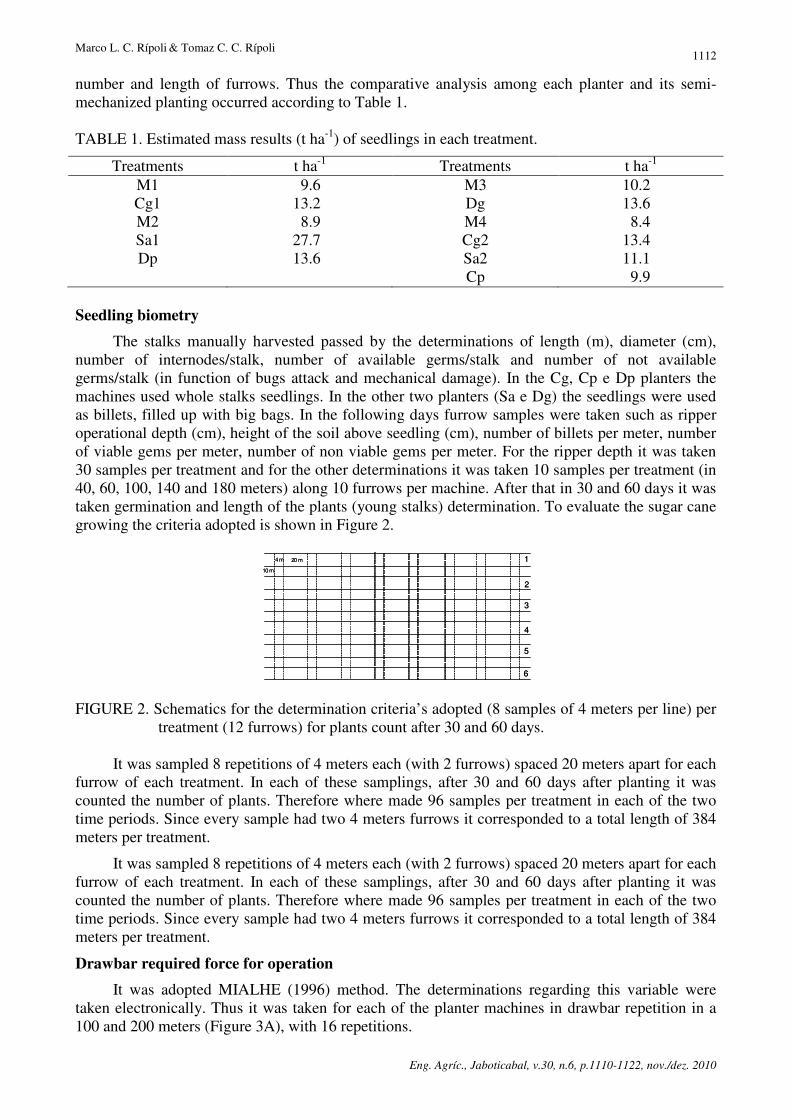
number and length of furrows. Thus the comparative analysis among each planter and its semi-mechanized planting occurred according to Table 1.
TABLE 1. Estimated mass results (t ha-1) of seedlings in each treatment.
Treatments t ha-1 Treatments t ha-1
M1 9.6 M3 10.2 Cg1 13.2 Dg 13.6 M2 8.9 M4 8.4 Sa1 27.7 Cg2 13.4 Dp 13.6 Sa2 11.1
Cp 9.9 Seedling biometry
The stalks manually harvested passed by the determinations of length (m), diameter (cm), number of internodes/stalk, number of available germs/stalk and number of not available germs/stalk (in function of bugs attack and mechanical damage). In the Cg, Cp e Dp planters the machines used whole stalks seedlings. In the other two planters (Sa e Dg) the seedlings were used as billets, filled up with big bags. In the following days furrow samples were taken such as ripper operational depth (cm), height of the soil above seedling (cm), number of billets per meter, number of viable gems per meter, number of non viable gems per meter. For the ripper depth it was taken 30 samples per treatment and for the other determinations it was taken 10 samples per treatment (in 40, 60, 100, 140 and 180 meters) along 10 furrows per machine. After that in 30 and 60 days it was taken germination and length of the plants (young stalks) determination. To evaluate the sugar cane growing the criteria adopted is shown in Figure 2.
20 m4 m
10 m
1
2
3
4
5
6
20 m4 m
10 m
1
2
3
4
5
6 FIGURE 2. Schematics for the determination criteria’s adopted (8 samples of 4 meters per line) per
treatment (12 furrows) for plants count after 30 and 60 days.
It was sampled 8 repetitions of 4 meters each (with 2 furrows) spaced 20 meters apart for each furrow of each treatment. In each of these samplings, after 30 and 60 days after planting it was counted the number of plants. Therefore where made 96 samples per treatment in each of the two time periods. Since every sample had two 4 meters furrows it corresponded to a total length of 384 meters per treatment.
It was sampled 8 repetitions of 4 meters each (with 2 furrows) spaced 20 meters apart for each furrow of each treatment. In each of these samplings, after 30 and 60 days after planting it was counted the number of plants. Therefore where made 96 samples per treatment in each of the two time periods. Since every sample had two 4 meters furrows it corresponded to a total length of 384 meters per treatment.
Drawbar required force for operation
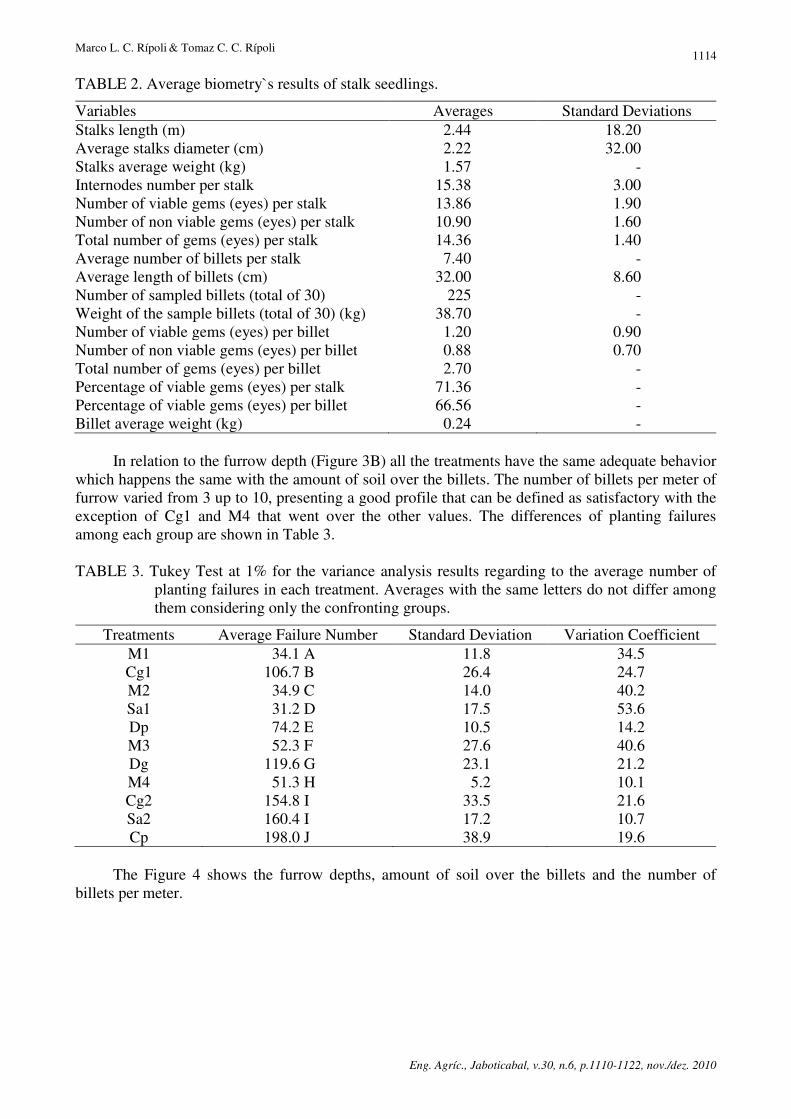
It was adopted MIALHE (1996) method. The determinations regarding this variable were taken electronically. Thus it was taken for each of the planter machines in drawbar repetition in a 100 and 200 meters (Figure 3A), with 16 repetitions.
Evaluation of five sugar cane planters
Eng. Agríc., Jaboticabal, v.30, n.6, p.1110-1122, nov./dez. 2010
1113
1- Drawbar (FTc) demanded for the Tractor and Planter;
2- Drawbar (FTt) demanded only for the Tractor.
Therefore the drawbar demanded (FTp) only for the planter was:
FTp = FTc – FTt (1)
The engine horse powers demanded for the tractors to haul the planters were obtained according to ASAE STANDARD EP391 (1983).
Effective capacity determination
In each treatment it was measured time and the effective trajectory in each repetition separated from the times taken to maneuvering.
Fuel effective consumption
The fuel effective consumption (L h-1) was determinate with a flow meter for every treatment. It was also found the drawbar needs for every treatment.
Furrow depth and amount of soil over the billets
It was taken 20 samples per treatment as shown in Figure 3B and 3C.
FIGURE 3. Determinations of (A) drawbar force; (B) furrow depth and (C) amount of soil over the
billets. Estimates for effective costs
The hourly costs of Tractor and Planter were obtained from the market as acquisition prices for new machines. It was adopted the ASAE method presented by MIALHE (1974).
The effective capacities for instance were represented by the average values obtained in each repetition and as show by MIALHE (1974). It was also considered the planters use as being 9 months per year, 25 days per month and 10 hours per day, with a 10 years lifetime (22.500 hours). The lifetime for the power source was taken as 15 years (45.000 hours), for the fixed costs estimates. The operational costs considered 2.250 hours per year which would be the usage of the planters. The estimate for maintenance rate was 1% per year over the acquisition price. For spare parts and services it was considered the acquisition price divided by the lifetime. Regarding the salaries (including social taxes) of the manual hand labor which operate the planter it was used US$242.92 per month and for the tractor operator US$531.81 per month. The final scrape value of the equipment was considered as 10% of the acquisition price. The invested money interest rate was 12% per year. The warehousing was 1.5% over the acquisition price. The insurance premium was 1% over the acquisition price. The diesel fuel price considered was US$0.85 per liter.
The effective planting cost for the conventional (semi-mechanized) with 70% of field efficiency was US$2,100.58 per hectare. The acquisition amounts for the tractor used were: MF 6360 = US$127,813.95 and Valtra BH180 = US$69,767.44. RESULTS
Biometry and another correlated analysis
The biometry presented the results shown in Table 2.
Marco L. C. Rípoli & Tomaz C. C. Rípoli
Eng. Agríc., Jaboticabal, v.30, n.6, p.1110-1122, nov./dez. 2010
1114
TABLE 2. Average biometry`s results of stalk seedlings.
Variables Averages Standard Deviations Stalks length (m) 2.44 18.20 Average stalks diameter (cm) 2.22 32.00 Stalks average weight (kg) 1.57 - Internodes number per stalk 15.38 3.00 Number of viable gems (eyes) per stalk 13.86 1.90 Number of non viable gems (eyes) per stalk 10.90 1.60 Total number of gems (eyes) per stalk 14.36 1.40 Average number of billets per stalk 7.40 - Average length of billets (cm) 32.00 8.60 Number of sampled billets (total of 30) 225 - Weight of the sample billets (total of 30) (kg) 38.70 - Number of viable gems (eyes) per billet 1.20 0.90 Number of non viable gems (eyes) per billet 0.88 0.70 Total number of gems (eyes) per billet 2.70 - Percentage of viable gems (eyes) per stalk 71.36 - Percentage of viable gems (eyes) per billet 66.56 - Billet average weight (kg) 0.24 -
In relation to the furrow depth (Figure 3B) all the treatments have the same adequate behavior
which happens the same with the amount of soil over the billets. The number of billets per meter of furrow varied from 3 up to 10, presenting a good profile that can be defined as satisfactory with the exception of Cg1 and M4 that went over the other values. The differences of planting failures among each group are shown in Table 3.
TABLE 3. Tukey Test at 1% for the variance analysis results regarding to the average number of
planting failures in each treatment. Averages with the same letters do not differ among them considering only the confronting groups.
Treatments Average Failure Number Standard Deviation Variation Coefficient M1 34.1 A 11.8 34.5 Cg1 106.7 B 26.4 24.7 M2 34.9 C 14.0 40.2 Sa1 31.2 D 17.5 53.6 Dp 74.2 E 10.5 14.2 M3 52.3 F 27.6 40.6 Dg 119.6 G 23.1 21.2 M4 51.3 H 5.2 10.1 Cg2 154.8 I 33.5 21.6 Sa2 160.4 I 17.2 10.7 Cp 198.0 J 38.9 19.6
The Figure 4 shows the furrow depths, amount of soil over the billets and the number of
billets per meter.
Evaluation of five sugar cane planters
Eng. Agríc., Jaboticabal, v.30, n.6, p.1110-1122, nov./dez. 2010
1115
FIGURE 4. Furrow depth (cm), amount of soil over the furrow (cm) and billets number per meter.
M1 to M4 = conventional. Semi-mechanized system
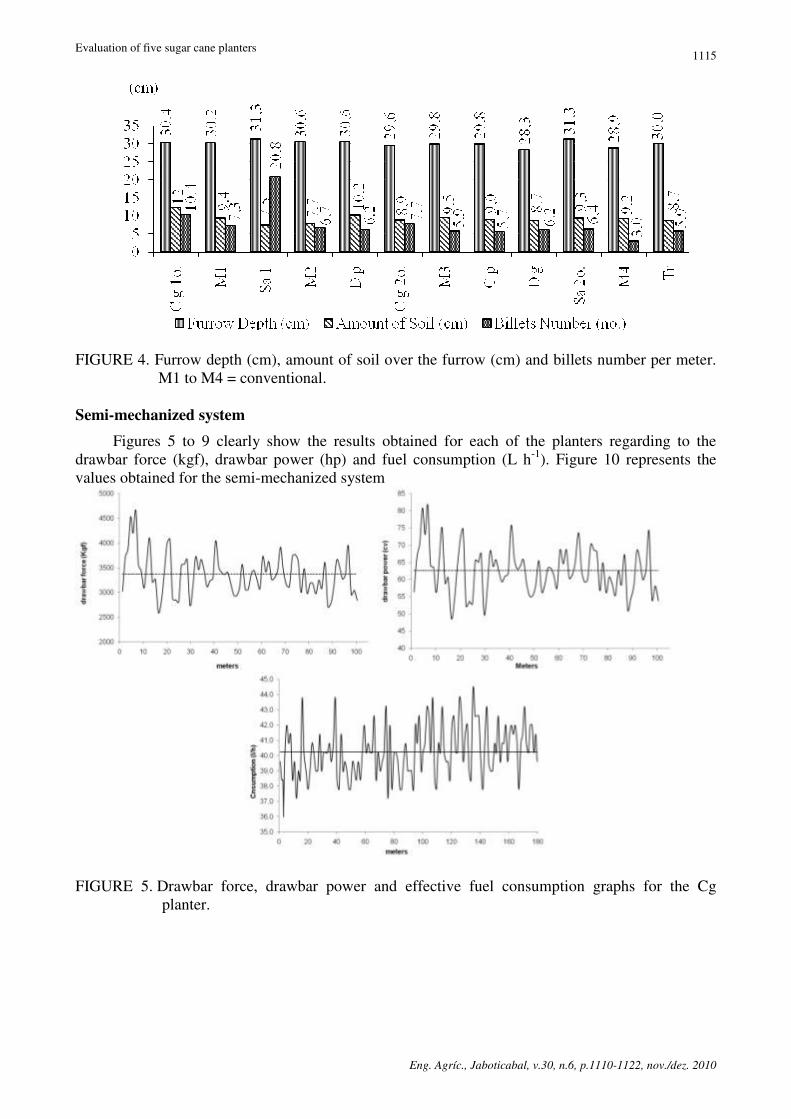
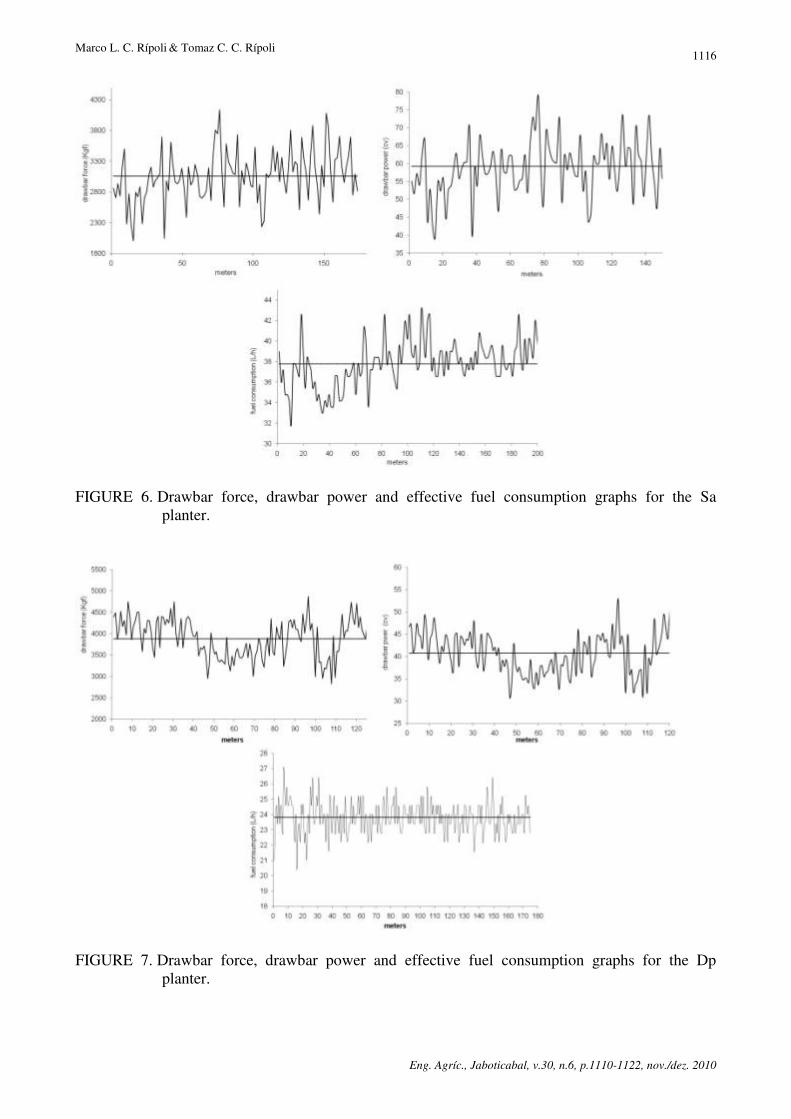
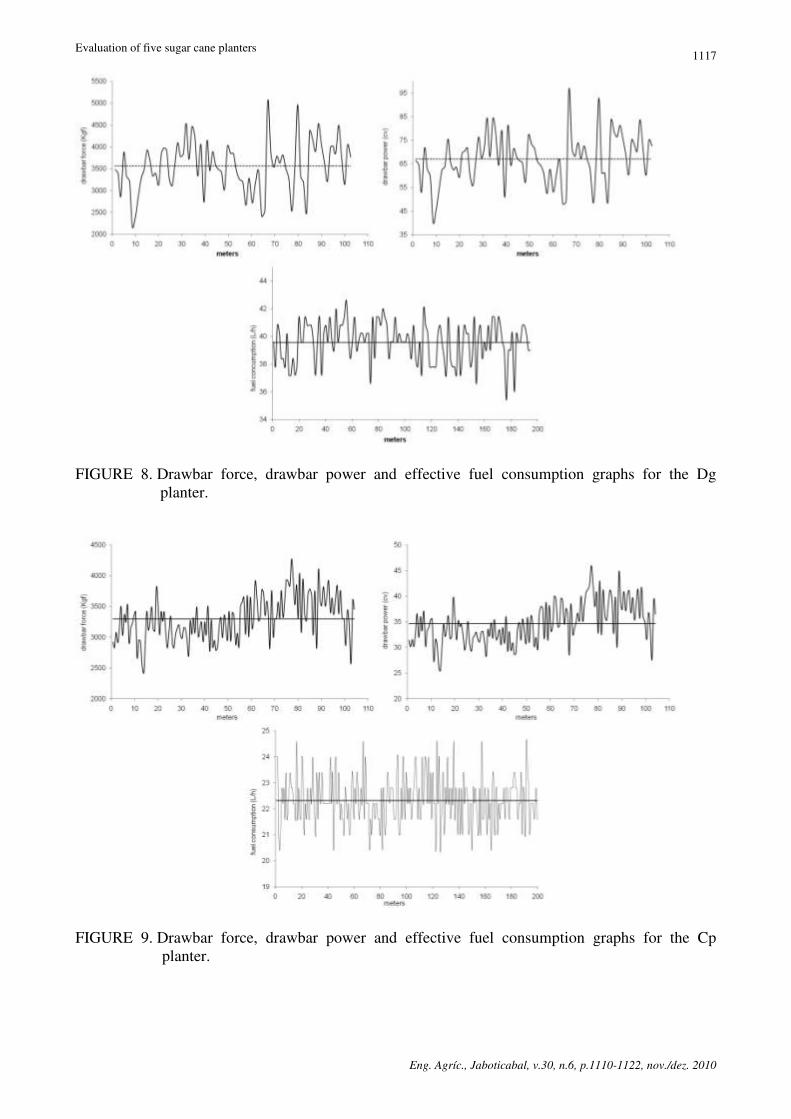
Figures 5 to 9 clearly show the results obtained for each of the planters regarding to the drawbar force (kgf), drawbar power (hp) and fuel consumption (L h-1). Figure 10 represents the values obtained for the semi-mechanized system
FIGURE 5. Drawbar force, drawbar power and effective fuel consumption graphs for the Cg planter.
Marco L. C. Rípoli & Tomaz C. C. Rípoli
Eng. Agríc., Jaboticabal, v.30, n.6, p.1110-1122, nov./dez. 2010
1116
FIGURE 6. Drawbar force, drawbar power and effective fuel consumption graphs for the Sa planter.
FIGURE 7. Drawbar force, drawbar power and effective fuel consumption graphs for the Dp planter.
Evaluation of five sugar cane planters
Eng. Agríc., Jaboticabal, v.30, n.6, p.1110-1122, nov./dez. 2010
1117
FIGURE 8. Drawbar force, drawbar power and effective fuel consumption graphs for the Dg
planter.
FIGURE 9. Drawbar force, drawbar power and effective fuel consumption graphs for the Cp
planter.
Marco L. C. Rípoli & Tomaz C. C. Rípoli
Eng. Agríc., Jaboticabal, v.30, n.6, p.1110-1122, nov./dez. 2010
1118
�
5.0
2.8
5.2
2.8
5.1
6.2 6.2
1
2
3
4
5
6
7
Cg2 Cp Sa2 Dp Dg S3 S2
Vef (km h-1)
62.0
35.0
59.0
41.0
67.077.0
52.0
0
20
40
60
80
Cg2 Cp Sa2 Dp Dg S3 S2
Pb (cv)
�
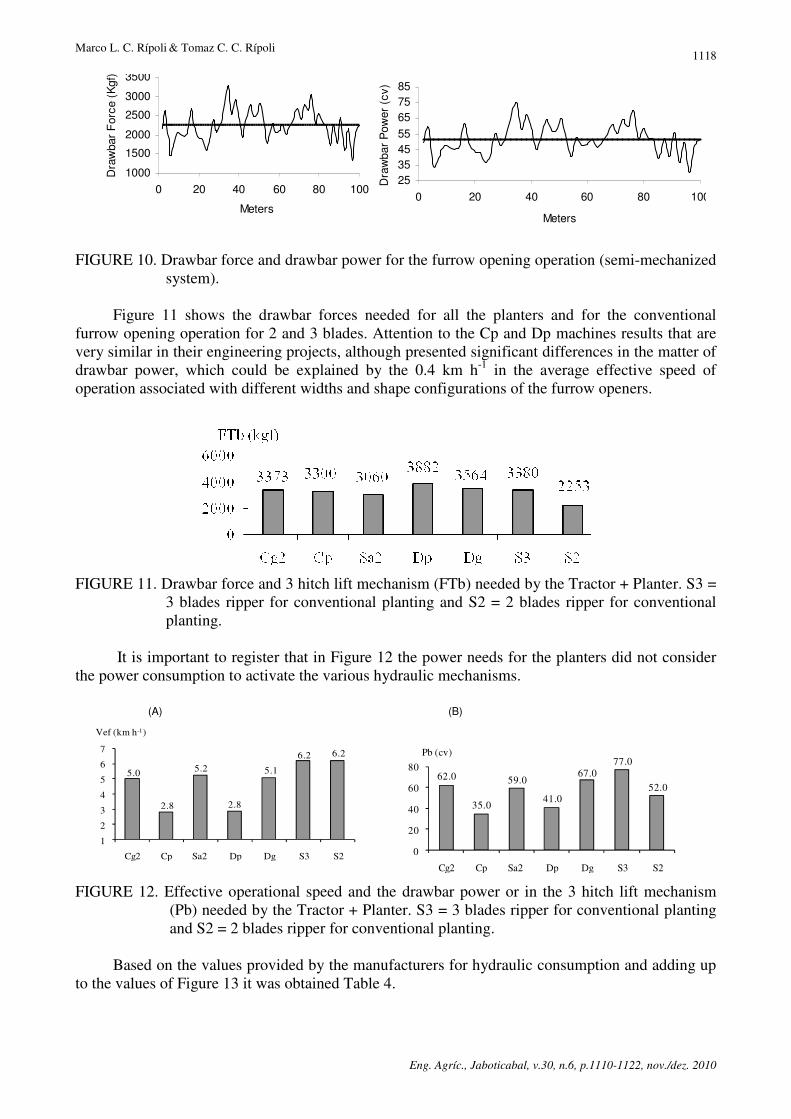
FIGURE 10. Drawbar force and drawbar power for the furrow opening operation (semi-mechanized
system).
Figure 11 shows the drawbar forces needed for all the planters and for the conventional furrow opening operation for 2 and 3 blades. Attention to the Cp and Dp machines results that are very similar in their engineering projects, although presented significant differences in the matter of drawbar power, which could be explained by the 0.4 km h-1 in the average effective speed of operation associated with different widths and shape configurations of the furrow openers.
FIGURE 11. Drawbar force and 3 hitch lift mechanism (FTb) needed by the Tractor + Planter. S3 =
3 blades ripper for conventional planting and S2 = 2 blades ripper for conventional planting.
It is important to register that in Figure 12 the power needs for the planters did not consider
the power consumption to activate the various hydraulic mechanisms.
FIGURE 12. Effective operational speed and the drawbar power or in the 3 hitch lift mechanism
(Pb) needed by the Tractor + Planter. S3 = 3 blades ripper for conventional planting and S2 = 2 blades ripper for conventional planting.
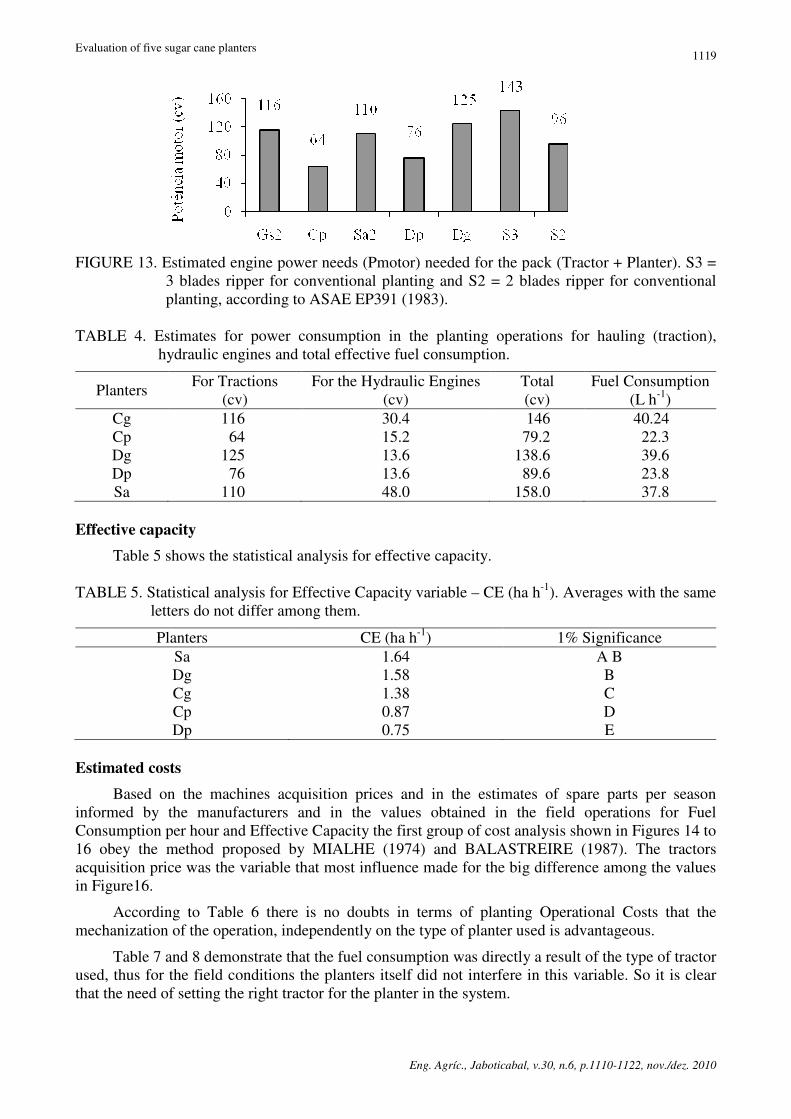
Based on the values provided by the manufacturers for hydraulic consumption and adding up
to the values of Figure 13 it was obtained Table 4.
25354555657585
0 20 40 60 80 100
Meters
Dra
wba
r P
ower
(cv
)
1000
1500
2000
2500
3000
3500
0 20 40 60 80 100
Meters
Dra
wba
r F
orce
(K
gf)
(A) (B)
Evaluation of five sugar cane planters
Eng. Agríc., Jaboticabal, v.30, n.6, p.1110-1122, nov./dez. 2010
1119
FIGURE 13. Estimated engine power needs (Pmotor) needed for the pack (Tractor + Planter). S3 =
3 blades ripper for conventional planting and S2 = 2 blades ripper for conventional planting, according to ASAE EP391 (1983).
TABLE 4. Estimates for power consumption in the planting operations for hauling (traction),
hydraulic engines and total effective fuel consumption.
Planters For Tractions (cv)
For the Hydraulic Engines (cv)
Total (cv)
Fuel Consumption (L h-1)
Cg 116 30.4 146 40.24 Cp 64 15.2 79.2 22.3 Dg 125 13.6 138.6 39.6 Dp 76 13.6 89.6 23.8 Sa 110 48.0 158.0 37.8
Effective capacity
Table 5 shows the statistical analysis for effective capacity.
TABLE 5. Statistical analysis for Effective Capacity variable – CE (ha h-1). Averages with the same letters do not differ among them.
Planters CE (ha h-1) 1% Significance Sa 1.64 A B Dg 1.58 B Cg 1.38 C Cp 0.87 D Dp 0.75 E
Estimated costs
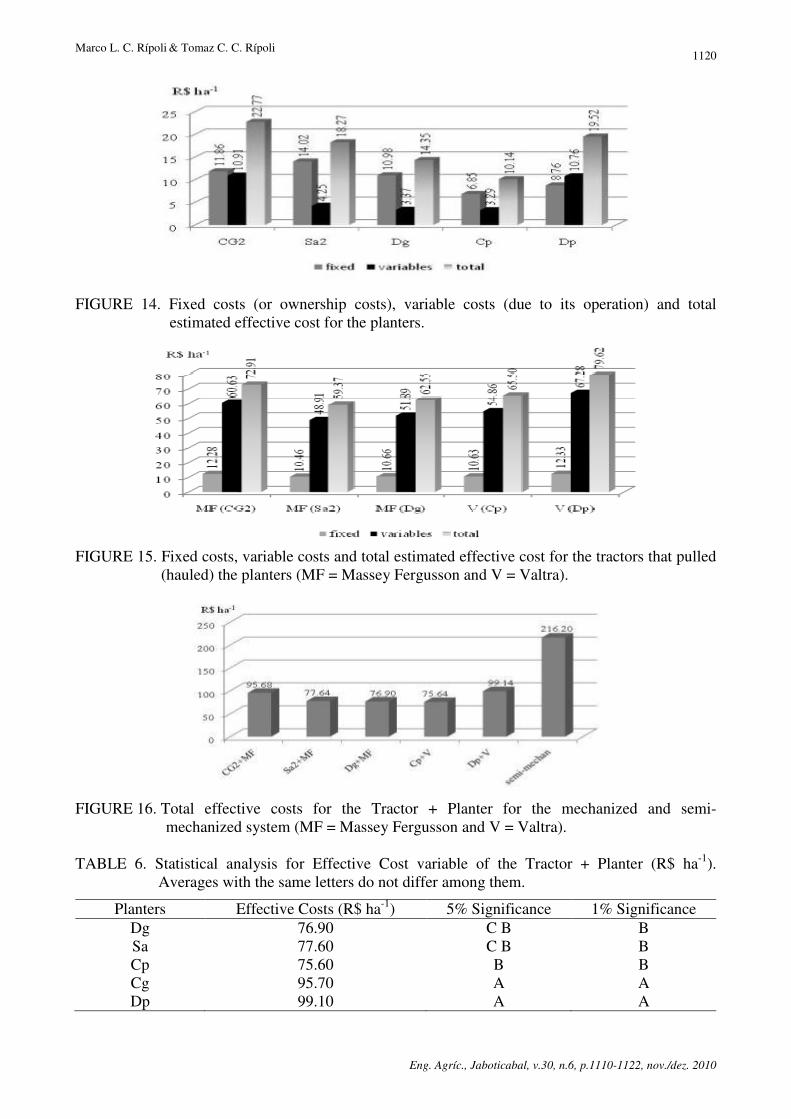
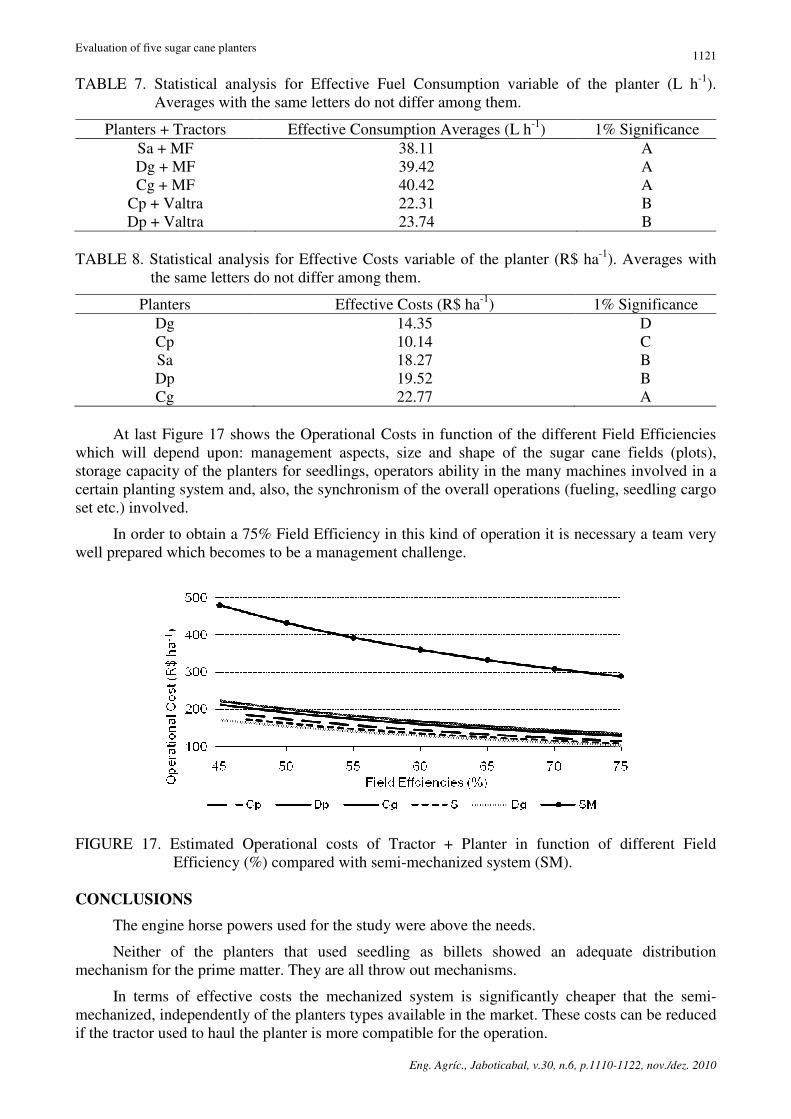
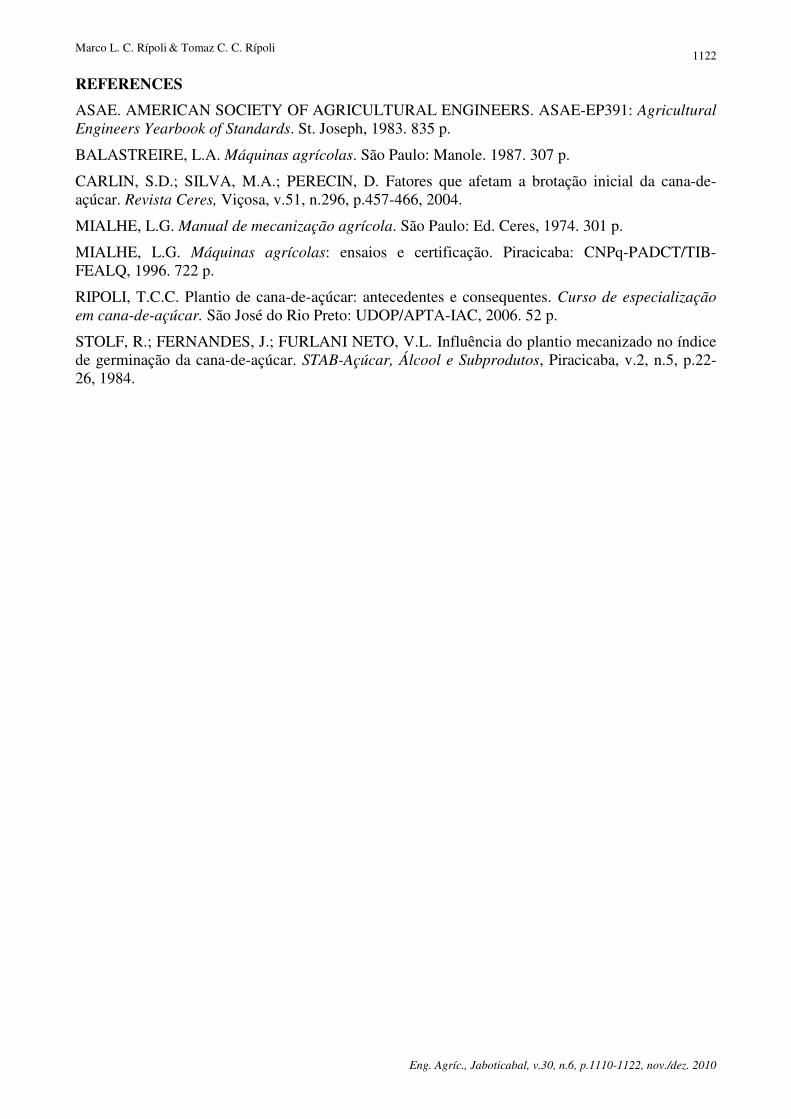
Based on the machines acquisition prices and in the estimates of spare parts per season informed by the manufacturers and in the values obtained in the field operations for Fuel Consumption per hour and Effective Capacity the first group of cost analysis shown in Figures 14 to 16 obey the method proposed by MIALHE (1974) and BALASTREIRE (1987). The tractors acquisition price was the variable that most influence made for the big difference among the values in Figure16.
According to Table 6 there is no doubts in terms of planting Operational Costs that the mechanization of the operation, independently on the type of planter used is advantageous.
Table 7 and 8 demonstrate that the fuel consumption was directly a result of the type of tractor used, thus for the field conditions the planters itself did not interfere in this variable. So it is clear that the need of setting the right tractor for the planter in the system.
Marco L. C. Rípoli & Tomaz C. C. Rípoli
Eng. Agríc., Jaboticabal, v.30, n.6, p.1110-1122, nov./dez. 2010
1120
FIGURE 14. Fixed costs (or ownership costs), variable costs (due to its operation) and total estimated effective cost for the planters.
FIGURE 15. Fixed costs, variable costs and total estimated effective cost for the tractors that pulled
(hauled) the planters (MF = Massey Fergusson and V = Valtra).
FIGURE 16. Total effective costs for the Tractor + Planter for the mechanized and semi-
mechanized system (MF = Massey Fergusson and V = Valtra). TABLE 6. Statistical analysis for Effective Cost variable of the Tractor + Planter (R$ ha-1).
Averages with the same letters do not differ among them.
Planters Effective Costs (R$ ha-1) 5% Significance 1% Significance Dg 76.90 C B B Sa 77.60 C B B Cp 75.60 B B Cg 95.70 A A Dp 99.10 A A
Evaluation of five sugar cane planters
Eng. Agríc., Jaboticabal, v.30, n.6, p.1110-1122, nov./dez. 2010
1121
TABLE 7. Statistical analysis for Effective Fuel Consumption variable of the planter (L h-1). Averages with the same letters do not differ among them.
Planters + Tractors Effective Consumption Averages (L h-1) 1% Significance Sa + MF 38.11 A Dg + MF 39.42 A Cg + MF 40.42 A
Cp + Valtra 22.31 B Dp + Valtra 23.74 B
TABLE 8. Statistical analysis for Effective Costs variable of the planter (R$ ha-1). Averages with
the same letters do not differ among them.
Planters Effective Costs (R$ ha-1) 1% Significance Dg 14.35 D Cp 10.14 C Sa 18.27 B Dp 19.52 B Cg 22.77 A
At last Figure 17 shows the Operational Costs in function of the different Field Efficiencies
which will depend upon: management aspects, size and shape of the sugar cane fields (plots), storage capacity of the planters for seedlings, operators ability in the many machines involved in a certain planting system and, also, the synchronism of the overall operations (fueling, seedling cargo set etc.) involved.
In order to obtain a 75% Field Efficiency in this kind of operation it is necessary a team very well prepared which becomes to be a management challenge.
FIGURE 17. Estimated Operational costs of Tractor + Planter in function of different Field
Efficiency (%) compared with semi-mechanized system (SM). CONCLUSIONS
The engine horse powers used for the study were above the needs.
Neither of the planters that used seedling as billets showed an adequate distribution mechanism for the prime matter. They are all throw out mechanisms.
In terms of effective costs the mechanized system is significantly cheaper that the semi-mechanized, independently of the planters types available in the market. These costs can be reduced if the tractor used to haul the planter is more compatible for the operation.
Marco L. C. Rípoli & Tomaz C. C. Rípoli
Eng. Agríc., Jaboticabal, v.30, n.6, p.1110-1122, nov./dez. 2010
1122
REFERENCES
ASAE. AMERICAN SOCIETY OF AGRICULTURAL ENGINEERS. ASAE-EP391: Agricultural Engineers Yearbook of Standards. St. Joseph, 1983. 835 p.
BALASTREIRE, L.A. Máquinas agrícolas. São Paulo: Manole. 1987. 307 p.
CARLIN, S.D.; SILVA, M.A.; PERECIN, D. Fatores que afetam a brotação inicial da cana-de-açúcar. Revista Ceres, Viçosa, v.51, n.296, p.457-466, 2004.
MIALHE, L.G. Manual de mecanização agrícola. São Paulo: Ed. Ceres, 1974. 301 p.
MIALHE, L.G. Máquinas agrícolas: ensaios e certificação. Piracicaba: CNPq-PADCT/TIB-FEALQ, 1996. 722 p.
RIPOLI, T.C.C. Plantio de cana-de-açúcar: antecedentes e consequentes. Curso de especialização em cana-de-açúcar. São José do Rio Preto: UDOP/APTA-IAC, 2006. 52 p.
STOLF, R.; FERNANDES, J.; FURLANI NETO, V.L. Influência do plantio mecanizado no índice de germinação da cana-de-açúcar. STAB-Açúcar, Álcool e Subprodutos, Piracicaba, v.2, n.5, p.22-26, 1984.