Embed Size (px)
Citation preview
1
Historical Climate off the Atlantic Iberian Peninsula
Abrantes1,2, Fátima; Teresa Rodrigues1,2, Marta Rufino2,3; Emília Salgueiro1,2; Dulce Oliveira1,2,4;
Sandra Gomes1; Paulo Oliveira1; Ana Costa5; Mário Mil-Homens1; Teresa Drago1, 6; Filipa Naughton1,2,
1 –Portuguese Institute for the Ocean and Atmosphere (IPMA), Divisão de Geologia Marinha (DivGM), Rua Alferedo
Magalhães Ramalho 6, Lisboa, Portugal 5
2 - CCMAR, Centro de Ciências do Mar, Universidade do Algarve, Campus de Gambelas, 8005-139 Faro, Portugal
3 – IFREMER - Centre Atlantique (French Research Institute for Exploitation of the Sea, Département Ecologie et
Modèles pour l'Halieutique (EMH), Rue de l'Ile d'Yeu - BP 21105, 44311 Nantes cedex 3, France
4 – Univ. Bordeaux, EPOC, UMR 5805, F-33615 Pessac, France
5 - Centro de Investigação em Biodiversidade e Recursos Genétics (EnvArchCIBIO/InBIO) and Archaeosciences 10
Laboratory (LARC/DGPC), Rua da Bica do Marquês, 2, 1300-087, Lisboa, Portugal
6 – Instituto Dom Luiz, Universidade de Lisboa, 1749-016 Lisboa, Portugal
Correspondence to: Fatima Abrantes ([email protected])
Key Words – Last 2ky, climate, SST, Precipitation, Iberian Peninsula 15
Abstract. The Iberian Peninsula, at North Atlantic mid-latitude and the western extreme of the
European continent, is a key point for climate reconstructions. This work provides multi-proxy records
measured in 8 inner-shelf sediment cores from 5 sites located between South Portugal (Algarve) and
Northwest Spain (Galiza) (36 to 41 ºN) and target a regional reconstruction of climate variability during 20
the Historic period (last 2 ky).
The SST records reveal a long-term scale cooling (± 1º C/ 2 ky) that ends at the beginning of the 20th
century at all latitudes. This cooling is a follow up of the cooling process that started in the early
Holocene driven by a decrease in summer insolation in the Northern Hemisphere.
Within this long term SST variability multi-decadal/ centennial scale variability is detected along Iberia. 25
The different latitudinal SST reconstructions jointly with a determined regional SST stack were
compared to on-land precipitation from higher plant n-alkanes and pollen data, to assess the relationship
between hydroclimate (drought and/or precipitation) and SST. Regional variability is overall in
consonance with NE Spain, and other European and north Hemisphere reconstructions. Warm
Clim. Past Discuss., doi:10.5194/cp-2017-39, 2017Manuscript under review for journal Clim. PastDiscussion started: 16 March 2017c© Author(s) 2017. CC-BY 3.0 License.
2
conditions prevailed throughout 1300 yr, encompassing the Roman Period (RP), the Dark Ages (DA)
and the Medieval Warm Period (MWP). The initial cooling at 1300 CE leads to 4 centuries of ±1º C
colder mean SSTs contemporaneous with the Little Ice Age (LIA). The transition towards the Industrial
Era starts by 1800 CE with a rise to pre-LIA SSTs. Climate specificities have been detected in western
Iberian margin records and reveal the existence of two distinct phases within the MWP and a two-step 5
SST increase towards the Industrial Era. The intense precipitation/ flooding and warm winters but
cooler intermediate seasons observed for the early MWP imply the interplay of internal oceanic
variability with the three known atmospheric circulation modes, NAO, EA and SCAND in a positive
phase. The late MWP, typified by drier and cooler winters and warmer intermediate seasons calls for a
change in sign of the SCAND. A stronger mark of oceanic influences on western Iberian Peninsula (IP) 10
starts with the transition to the Industrial Era.
1 Introduction
Today’s climate goes through a warming shift caused by the increased release of human-generated
greenhouse gases, such as CO2, and poses a pressing problem on societies’ sustainability (IPCC,
2013b). CO2 uptake by the ocean (Sabine, 2004), although helping to control atmospheric temperature, 15
it is changing ocean’s temperature and chemistry, mainly lowering the oceans’ pH (acidification).
Ocean warming, on the other side, is driving changes in atmospheric and oceanic circulation patterns.
Additionally, the Mediterranean region has been highlighted as one of the most sensitive region to the
ongoing global climatic changes (Giorgi, 2006). Increasing temperatures to higher values than the
predicted global mean and changes in precipitation in the Iberian Peninsula (IP), accompanied by long 20
dry summers and a short and wetter rainy season, are projected both by global and regional model
simulations in particular for its southern region (Miranda et al., 2002), making it one of the European
regions with highest potential vulnerability in regard to current global warming (Climate, 2011).
Most of this knowledge is based on the analysis of instrumental data and modeling of global and
hemispheric average conditions. However, given the limited time-span covered by the instrumental 25
data, to better understand the impact of climate warming it is essential to analyze and understand the
response of the system in perspective of a longer time-scale, and investigate previous warm periods and
warming transitions such as those occurring over the historical times (last 2,000 years). Records and
model reconstructions (Fernandez-Donado et al., 2013) identified solar and volcanic activity,
greenhouse gases, and land-use changes as the main external drivers of the global climate shifts during 30
the last millennium (Hegerl et al., 2006), while (Schurer et al., 2014) defends greenhouse gases
concentration and volcanic eruptions as the main drivers of atmospheric temperature changes in the
northern Hemisphere. In general, a large number of reconstructions find a Medieval Warm Period
(MWP) / Medial Climate Anomaly (MCA), that lasted from 900 to 1300 CE, associated to high solar
and low volcanic activity, while low solar activity and high volcanic activity dominate during the Little 35
Clim. Past Discuss., doi:10.5194/cp-2017-39, 2017Manuscript under review for journal Clim. PastDiscussion started: 16 March 2017c© Author(s) 2017. CC-BY 3.0 License.
3
Ice Age (LIA), which extended between 1350 and 1850 CE (Jones et al., 2001). After 1900 CE, global
mean atmospheric temperature rise became mainly an effect of the huge increase of greenhouses gases
in the atmosphere (IPCC, 2013b).
Over the last two decades, many Iberian lake sediments (e.g. (Hernández et al., 2015; Jambrina-
Enríquez et al., 2016; Morellón et al., 2009; Moreno et al., 2008; Valero-Garcés et al., 2006); 5
speleothems (e.g. (Martín-Chivelet et al., 2011) and marine sediments (e.g (Abrantes et al., 2005;
Abrantes et al., 2011; Lebreiro et al., 2006; Pena et al., 2010), have provided individual records and
compiled evaluations of climate evolution over Iberia during the historical period (e.g. (Moreno et al.,
2011; Sánchez-López et al., 2016). Results reveal multi-decadal to centennial climate variability,
manifesting a MWP and a LIA, in accordance with the main pattern encountered for the north Atlantic, 10
although the expected complex regional differences appear reflected by the lack of agreement on the
exact timing and duration of those two most important historic climatic periods (e.g. (Ahmed et al.,
2013; Büntgen et al., 2011; Cook et al., 2004; Esper et al., 2002; Luterbacher et al., 2004; Luterbacher
et al., 2016; Moberg et al., 2005). Additionally, given the dominance of the large-scale climate mode
operating in the Northern Hemisphere, the North Atlantic Oscillation (NAO) (Hurrell, 1995), most of 15
the above referred studies attribute the inferred variability to changes in the prevailing modes of the
NAO. Being mainly a winter season mode, NAO phases, defined from the strength and positions of the
Icelandic Low and the Azores High pressure systems, vary on scales of days to decades. The effects of
its variability translate into strong northerly winds during positive NAO periods, while westerly/
southwesterly winds become predominant and result in very cold winters and increased storm activity 20
during NAO negative phases (also known as “blocked”) (Hurrell, 1995; Trigo et al., 2004). That leads
to an attribution of the warm and dry conditions of the MWP to a dominance of the NAO+ conditions,
and the more cold and humid conditions of the LIA to the dominance of a negative NAO.
Other prominent modes of climate, the East Atlantic (EA) and the Scandinavia (SCAND) (Comas-Bru
and McDermott, 2014; Jerez and Trigo, 2013), constitute second leading modes, which interplay with 25
the NAO, and their temporal variability, must have also had a role on the climatic evolution of the north
Atlantic. The EA has a strong effect on the strength and location of the NAO dipoles mainly on a multi-
decadal time-scale, and according to (Hernández et al., 2015), has a major control on winter and
summer temperature over the Iberian Peninsula. The SCAND pattern, functions as a blocking high-
pressure system that changes the westerly winds path and influences southwestern Europe mainly 30
during its positive phase, when it contributes to temperatures below average and above average
precipitation (e.g. (Jerez and Trigo, 2013)). Sánchez-Lopez et al., (2016), on the basis of a
spatiotemporal integration of several reconstructions, attempt to identify the role of those main climatic
drivers over the Iberian Peninsula. Their results reveal the existence of E-W and N-S humidity gradients
from 0 to 500 CE and between 500 and 900 CE respectively, while between 900 and 1850 CE 35
temperature and humidity conditions are more homogenous throughout the Peninsula. Using the EOF-
Clim. Past Discuss., doi:10.5194/cp-2017-39, 2017Manuscript under review for journal Clim. PastDiscussion started: 16 March 2017c© Author(s) 2017. CC-BY 3.0 License.
4
based indices for different NAO and EA indices of (Comas-Bru and McDermott, 2014), the authors
propose equally negative NAO and EA during the LIA, as well as an equally positive NAO and EA
during the MWP. On the contrary, NAO- and EA+ would explain the warm temperatures and E-W
humidity gradient before 500 CE, while the inverse conditions between 500 – 900 CE could be
explained by a NAO+ but EA-. These conclusions support atmospheric pathways as the main control of 5
climate variability in Western Europe on multi-decadal time-scales. However, the ocean side is poorly
represented (2 reconstructions) relatively to the mountainous interior and it has for long been accepted
that Western Europe winter temperatures are influenced by the heat transported to the east by the Gulf
Stream and its North Atlantic Currentextension (Palter, 2015). (Wang and Dong, 2010) on the other
hand, consider that North Atlantic temperature variability at decadal scale, the Atlantic Multidecadal 10
Oscillation/ Variability (AMO/AMV), goes beyond the influence of neighbor continents, contributing
also to global SST variability. The work of (Yamamoto and Palter, 2016) shows a clear relation
between the NAO derived atmospheric circulation over Europe and the AMO, with northerly winds
associated to a positive state of AMO and zonal winds to a negative state of AMO. But, although the
same authors find a clear imprint of AMO variability in European temperature in summer, such does 15
not happen during winter. From the analysis of a 70 yr (1940-2011) dataset of SST and Western
European surface atmospheric temperature and particle trajectory modeling, (Yamamoto and Palter,
2016) attribute the absence of a winter signal to a cancelation of the ocean SST expression by strong
cold winds.
The two reconstructions from the Iberian/Atlantic ocean region (Abrantes et al, 2005; 2011), indicate 20
coastal upwelling variability not only in consonance with inferred NAO conditions but also coherence
with the instrumentally and tree-ring reconstructed Atlantic Multidecadal Oscillation (AMO) (Gray et
al., 2004), suggesting a connection between the IP coastal circulation and the North Atlantic Ocean
SSTs.
Given the risk to climate warming derived threats for ecosystems and society estimated for Western 25
Iberia, both at global and European level, high-resolution climate archives for the most recent centuries
and millennia are pivotal to better understand the interactions of the various modes of variability in
future scenarios of climate and their relevance to the IP region.
The purpose of this work is to investigate the latitudinal and temporal variation of winter precipitation
over the Westernmost European territory, the Western Iberian Peninsula, as well as oceanic SST 30
behavior on decadal to multi-decadal scales. For that we combine the above mentioned published
records with 5 new records, covering the last 2 millennia, and spanning along the Iberian margin from
41º N to 36 ºN. Furthermore, a regional SST stack of the last 2,000 yr was developed and compared to
proxy and model derived reconstructions of forcing factors and environmental properties.
2 Oceanographic Conditions 35
Clim. Past Discuss., doi:10.5194/cp-2017-39, 2017Manuscript under review for journal Clim. PastDiscussion started: 16 March 2017c© Author(s) 2017. CC-BY 3.0 License.
5
The western coast of the Iberian Peninsula is characterized by the occurrence of contrasting
oceanographic conditions between a quasi-permanent coastal upwelling regime and a surface
equatorward current in summer (April to October) (Fiuza, 1982, 1983; Peliz, 2002), and a poleward
alongshore warm counter current in winter (Fiuza and Frouin, 1986; Peliz et al., 2005).
The spring-summer upwelling, constitutes the northern part of the Eastern North Atlantic Upwelling / 5
Canary System and is connected to the presence of the Azores high-pressure system and the
development of northerly alongshore winds (Fiuza, 1983).
Waters Upwelled waters are transported southwards by a jet-like surface current, the Portuguese Coastal
Current (PCC), the coastal component of the Portuguese current (PC) that branches of the North
Atlantic Current, (Fiuza, 1982, 1983; Fiúza and Macedo, 1982). On the southern/ Algarve coast, 10
upwelling favorable conditions are rare, but western upwelled waters flow around Cape S. Vicente and
along the south coast, (Fiuza, 1982, 1983; Fiúza and Macedo, 1982; Sánchez and Relvas, 2003)
generating high biological productivity that can spread to its easternmost sector (Cardeira et al., 2013).
This eastward flow of cold western upwelled waters is alternated with the propagation of westward
flows related to warm water and increased vertical stratification and show a direct relationship between 15
flow velocity and water temperature (Garel et al., 2016; Relvas and Barton, 2002).
In winter, the prevalence of westerly/southwesterly winds leads to the occurrence of a predominantly
poleward surface and subsurface current, the Iberian Poleward Current (IPC). It consists of an upper
slope/shelf break poleward flow that is a branch of the Azores current, transports saltier and warmer
(subtropical) waters (Peliz et al., 2005) and depends most on the intensity of the southerly winds (Teles-20
Machado et al., 2015). Another important feature of the winter circulation over the western margin is
the formation of coastal buoyant plumes, characterized by low salinities and temperature lower than the
ambient shelf waters (Peliz et al., 2005). Such plumes result from the discharge of freshwater from
rivers, which in turn reflects continental precipitation. Precipitation occurs mainly in winter, as a result
of the moist carried by the westerly winds into the Peninsula, but has important latitudinal differences, 25
from 500 mm/year in the southeast to >3000 mm/year in the northwestern area (Miranda et al., 2002).
As a consequence, buoyant plumes are mainly associated to the major northern Portuguese rivers
(Minho, Douro, Mondego) but occur also associated to the Tagus, and can either develop into inshore
currents, under typical winter downward conditions, or spread offshore under northerly wind periods
(Iglesias et al., 2014; Marta-Almeida et al., 2002; Mendes et al., 2016; Oliveira et al., 2007; Otero et al., 30
2008).
3 Material and Methods
This study compares proxy data from 8 records collected from 5 sites along the inner-shelf of the
Iberian Margin (Table 1, Figure 1). Three cores were retrieved in the Northern area and off Vigo
(GeoB11033-1 referred to as Galiza), off the Minho River mouth (Diva09 GC, Diva from now on) and 35
Clim. Past Discuss., doi:10.5194/cp-2017-39, 2017Manuscript under review for journal Clim. PastDiscussion started: 16 March 2017c© Author(s) 2017. CC-BY 3.0 License.
6
in the Douro sediment patch (PO287-6G, designated as Porto); 4 cores were retrieved in the central
western Iberia off the Tagus River mouth (PO26- B PO26G, D13902 and D13882), and 1 core from
southern Iberia at Algarve margin (POPEI VC2B). With the exception of the Galiza core, all other
sedimentary sequences were collected in the inner shelf, and in areas directly affected by river
discharge. 5
Iron (Fe) content as counts per second (cps) was determined by X-ray fluorescence core scanning for
non-destructive semi-quantitative analysis of major elements at MARUM – Bremen University.
Alkenones and higher plant n-alkanes, were determined on 2 g of homogenized sediment using a Varian
gas chromatograph Model 3800 equipped with a septum programmable injector and a flame ionization
detector at the DivGM-IPMA laboratory according to the methods described in (Villanueva, 1996; 10
Villanueva and et, 1997; Villanueva and Grimalt, 1997). Analytical precision was 0.5oC. The
concentration of each compound was determined using n-nonadecan-1-ol, n-hexatriacontane and n-
tetracontane as internal standards. For Sea Surface Temperature (SST) calculation, the global character
of the (Müller et al., 1998) calibration determined its selection.
Sample preparation procedure for pollen analyses is described in detail at http://www.ephe-15
paleoclimat.com/ephe/Pollen%20sample%20preparation.htm and (Naughton et al., 2007). Pollen and
spores were counted using a Nikon light microscope at x550 and x1250 (oil immersion) magnification.
Pollen identification was done via comparison with the atlases of (Moore et al., 1991); and (Reille,
1992). A minimum of 100 Lycopodium grains, 20 pollen types and 100 pollen grains, excluding the
overrepresented Pinus, have been counted (Naughton et al., 2007). Pollen was gathered in two main 20
groups: AP (arboreal pollen) including all trees and shrubs but excluding the overrepresented pine taxa
and the semi-desert plants, which groups xerophytic shrubs of semi-desert habitats (Artemisia,
Chenopodiaceae, Ephedra);
To reduce individual noise and better evaluate the most robust multi-decadal variability at the regional
level, a stack off all the cores was created for SST and n-alkanes original records, without previous 25
alignment. Each core was centered (subtracting each value by the mean) and scaled (dividing the
centered columns by its standard deviation). This technique weights high-resolution records more
heavily and prevents interpolation across gaps or hiatuses from affecting the stack (Lisiecki and Raymo,
2005).
Given that temporal resolution changes along each and every core, a 2 ky stack was attempted for 30
different bin sizes (20 to 50 yr). Results revealed that main trends were independent of the used size bin
(not shown for brevity), but to convey with the most recent compilation works 30 yr bins were used
(Ahmed et al., 2013; Luterbacher et al., 2016). Furthermore, in order to investigate possible contrasts
between the northern and southern sites, one additional stack was produced just for the northern sites
(Galiza, Minho e Porto). To verify any potential effect of the existing hiatus on the Tagus record 35
(Abrantes et al., 2005), as well as any possible bias caused by the Algarve record, stacks were also
Clim. Past Discuss., doi:10.5194/cp-2017-39, 2017Manuscript under review for journal Clim. PastDiscussion started: 16 March 2017c© Author(s) 2017. CC-BY 3.0 License.
7
constructed excluding the Tagus record, and excluding the Algarve one. Figure 2 shows a comparison
of the calculated stacks for SST, demonstrating that the trends are maintained.
To investigate the existence of periodic signals and potential changes in their amplitude of variation
over time, we carried out a continuous transformation of the time series with a Morlet wavelet analysis
on each dataset and stack (Torrence and Compo, 1998), after interpolation of the series to regular time 5
steps. Interpolation was done using a cubic splines method and the temporal resolution of the
interpolation was established as half of the absolute median difference between every consecutive time
span. Data was then detrended using a modified negative exponential curve, as required for the
analysis. All statistical analysis was done using the libraries dplR (Bunn et al., 2017) and Akima
(Akima and Gebhardt, 2016), from r-project (R Core Team, 2013). 10
4 Age model
Age-depth models of 5 records have been previously published (Table 1).
The Galiza (GeoB11033-1), Minho (DIVA09 GC) and Algarve (POPEI VC2B) age-depth models were
constructed based on accelerator mass spectrometry radiocarbon (AMS 14C) and 210Pb-inferred dates. 210Pb activity analysis, which provides a method to assess mass accumulation rates, was performed at 15
NIOZ. AMS 14C - accelerator mass spectrometry (AMS) radiocarbon measurements were performed at
the Leibniz-Laboratory for Radiometric Dating and Stable Isotope Research, Kiel (Germany), the
National Ocean Sciences AMS Facility of the Woods Hole Oceanographic Institution (USA), and Beta
Analytic(Table 2).
Raw AMS 14C dates were corrected for marine reservoir ages of 400 yr (Abrantes et al., 2005) and 20
converted to calendar ages using INTCAL04 (Reimer et al., 2004). The obtained calendar ages are
presented in years Anno Domini, now designated by Common Era (CE - (McKim, 1998).
All age models were interpolated linearly between all accepted 14C dated levels.
5 Results and Discussion
Proxy reconstructions are in general, affected by many limitations; from dating uncertainties and coarse 25
temporal resolution, to challenging temporal correlations, or yet in determining the seasonality of the
process(es) leading to the generation of each used proxy. However, the signal blender effect of the
sediments is also been shown to be an advantage (Hernández et al., 2015).
The sedimentary sequences selected for this study have a high temporal resolution, that is, in order of 2-
3 yr in the recent sediments and down to 30 yr in the older part due to a larger sampling interval (Table 30
1). Furthermore, the measurement of multiple proxies, for Sea Surface Temperature (SST) and on-land
Precipitation in the same archive, reduces the difficulties in temporal correlation.
5.1 Sea Surface Temperature (SST)
Clim. Past Discuss., doi:10.5194/cp-2017-39, 2017Manuscript under review for journal Clim. PastDiscussion started: 16 March 2017c© Author(s) 2017. CC-BY 3.0 License.
8
As a proxy for SST we use the alkenone Uk’37 derived temperature applying the global calibration of
(Müller et al., 1998). A local calibration for the Porto site, via SST data from a 5° grid provided by the
Climatic Research Unit shows the alkenone SST as a Spring / Fall record Abrantes (Abrantes et al.,
2011). In order to confirm that indication for other sites, the same exercise was performed, but now
using a smaller grid satellite estimated mean annual and seasonal temperatures for the Porto, Lisbon and 5
Algarve sites. As it can be observed in figure 3, at the west coast sites, alkenone production appears
associated to the late winter-spring phytoplankton bloom resulting from the nutrient input by the large
Douro and Tagus Rivers (Cabeçadas et al., 2003. ; Cabeçadas et al., 2008; Guerreiro et al., 2013). In
contrast, the alkenone derived SST measured in the sediments at Algarve (south Iberia), the alkenone
derived SST follows the spring/ fall SST that coincide with the annual mean satellite SSTs (Fig. 3), 10
suggesting a minor influence of the smaller and more distant Guadiana River on the site, but a dominant
influence of the waters advected from the west coast during the upwelling season, into the local bloom
development (Moita, 2001).
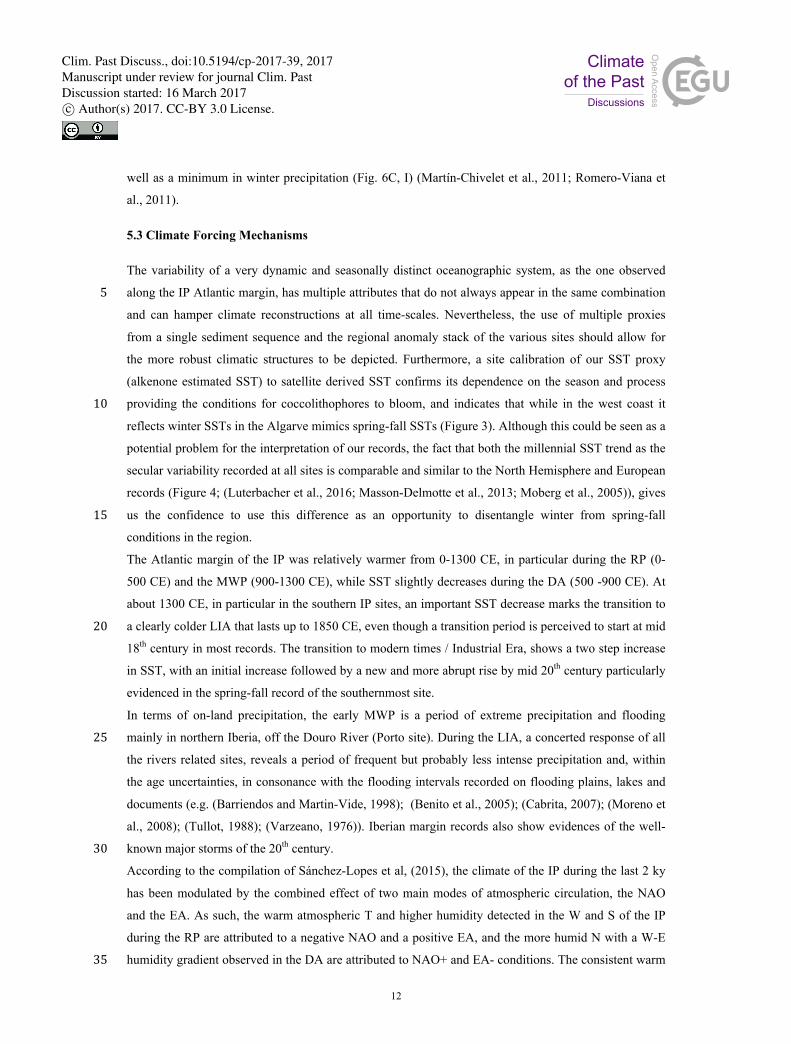
Figure 4A displays the alkenone derived SST reconstructions for all the Iberian margin records.
Although the differences in the period covered by each record, the temporal resolution of the different 15
cores, and even the different seasons recorded by the SST at distinct sites, all the sites reveal an overall
long-term cooling trend from 0 CE up to the beginning of the 20th century. This trend corresponds to the
last segment of the 4 ºC decreasing trend reported for the entire Holocene in this region by Rodrigues et
al, (Rodrigues et al., 2009), similar to the more recently observed in Europe and worldwide (Ahmed et
al., 2013; Luterbacher et al., 2016; McGregor et al., 2015). This general cooling was ascribed to an 20
orbital driven decrease in Northern Hemisphere summer insolation. In Iberia, this long-term sea surface
cooling is stronger in the Tagus site (2.5 ºC/ 2 ky) than in all other sites (1ºC / 2ky). Moreover, SST
minima occur off Oporto (14 to 16 ºC) while the warmest temperatures are found in the Algarve inner
shelf (17 to 20 ºC). Tagus, Minho and Galiza reconstructions show intermediate values (15 to 18 ºC).
The temperature difference between areas is maintained throughout the last 2 ky but variability shows 25
higher amplitude in the Tagus and Algarve sites (3ºC) compared to the 1.5 ºC observed in the northern
sites (Porto, Minho and Galiza).
Both the individual SST records and the SST stack (Fig. 4B) display a secular scale variability
comparable with that recorded for Europe and the North Hemisphere (Figure 4C – E); (Luterbacher -
(Luterbacher et al., 2016; Masson-Delmotte et al., 2013; Moberg et al., 2005). Relatively high SSTs 30
occur during the first 9 centuries encompassing the Roman and Dark Ages (Fig. 4), when SST is
slightly higher than the recorded for the 20th century at the Southern sites (Tagus and Algarve; Table 3).
Consistent warmth conditions are also recognized at all sites as reflected by the stack between 900 and
1300 CE (Figure 4B), within the timing of the Northern Hemisphere Medieval Warm Period (MWP)
also designated by Medieval Climate Anomaly (MCA). Furthermore, the warmest first phase of the 35
MWP from western Iberia records contrast with a coldest phase in southern Iberia (Algarve). The
Clim. Past Discuss., doi:10.5194/cp-2017-39, 2017Manuscript under review for journal Clim. PastDiscussion started: 16 March 2017c© Author(s) 2017. CC-BY 3.0 License.
9
warmest phase of the MWP in western Iberia is in accordance with the findings of (Cunningham et al.,
2013) for the NE North Atlantic.
Reconstructed cold conditions in Iberia, with an average 0.5 ºC colder SST in the northern sites and
1.2ºC in the southern sites, characterize most of the 15th to 18th centuries (Figure 4B). The transition
from warm to colder climatic conditions occurs around 1300 CE associated with the Wolf solar 5
minimum (Fig. 4B, G). The coldest SSTs are detected between 1350 and 1850 CE, on Iberia during the
well-known Little Ice Age (LIA) (Bradley and Jones, 1993), with the most intense cooling episodes
related with other solar minima events, and major volcanic forcing (Fig. 4F, G) and separated by
intervals of relative warmth (e.g. (Crowley and Unterman, 2013; Solanki et al., 2004; Steinhilber et al.,
2012; Turner et al., 2016; Usoskin et al., 2011)). 10
During the 20th century, the southern records show unusually large decadal scale SST oscillations in the
context of the last 2 millennia, in particular after the mid 1970’s (Fig. 4A), within the Great Solar
Maximum (1940 – 2000 - (Usoskin et al., 2011) and the “greater salinity anomaly” event in the
northern Atlantic (Dickson et al., 1988), or yet the higher global temperatures of the last 1.4 ky detected
by (Ahmed et al., 2013). 15
Although the increased amplitude of variability in SST for the last 50 years of record, in particular at
the Algarve site, this may result of the effect of a higher resolution and better proxy preservation in the
more pristine recent sediments (Calvert and Pedersen, 2007), or, it can also be a reflection of the
expected increase of climatic extremes in particular in spring and summer at southwestern Iberia, as a
reaction to climate warming (IPCC, 2013a; Miranda et al., 2002). 20
5.2 Temperature and Precipitation over western Iberia
Higher river discharge parallels precipitation patterns (Trigo and DaCamara, 2000), and previous work
in the area revealed sediment Fe content as a good proxy for instrumentally measured river outflow
(Abrantes et al., 2009). The new sites lack such data, but given that Fe and lipid compounds synthesized
by higher plants, such as C23–C33 n-alkanes ([n-alc]), show a coherent pattern of variability at both the 25
Tagus and Porto sites (Abrantes et al, 2005b, 2011), a Pearson correlation of 0.47 at p>0.01 and n=250,
and that [n-alc] is available for all sites, we will use this proxy to qualify the intensity of River runoff.
Furthermore, Total Pollen Concentration (TPC), which also reflects the relative quantity of terrestrial
material that reaches the marine environment mainly through river discharges, is considered as an
independent proxy (Naughton et al., 2007; Naughton et al., 2009). Moreover, pollen production occurs 30
during the spring season and should therefore reflect atmospheric temperature and precipitation during
that season (e.g. (Guiot et al., 2009)). However, trees growth is completely dependent on the humidity
of the previous winter season (Gouveia et al., 2008). In this work we use the arboreal and the semi-
desertic groups as proxies for those conditions on land. The arboreal pollen representing a sum of the
Atlantic and Mediterranean trees are sensitive to temperature and require relatively high winter 35
Clim. Past Discuss., doi:10.5194/cp-2017-39, 2017Manuscript under review for journal Clim. PastDiscussion started: 16 March 2017c© Author(s) 2017. CC-BY 3.0 License.
10
precipitation to grow. The expansion of semi-desert plants (Ephedra, Chenopodiaceae and Artemisia)
reflects increasing dry conditions all over the year.
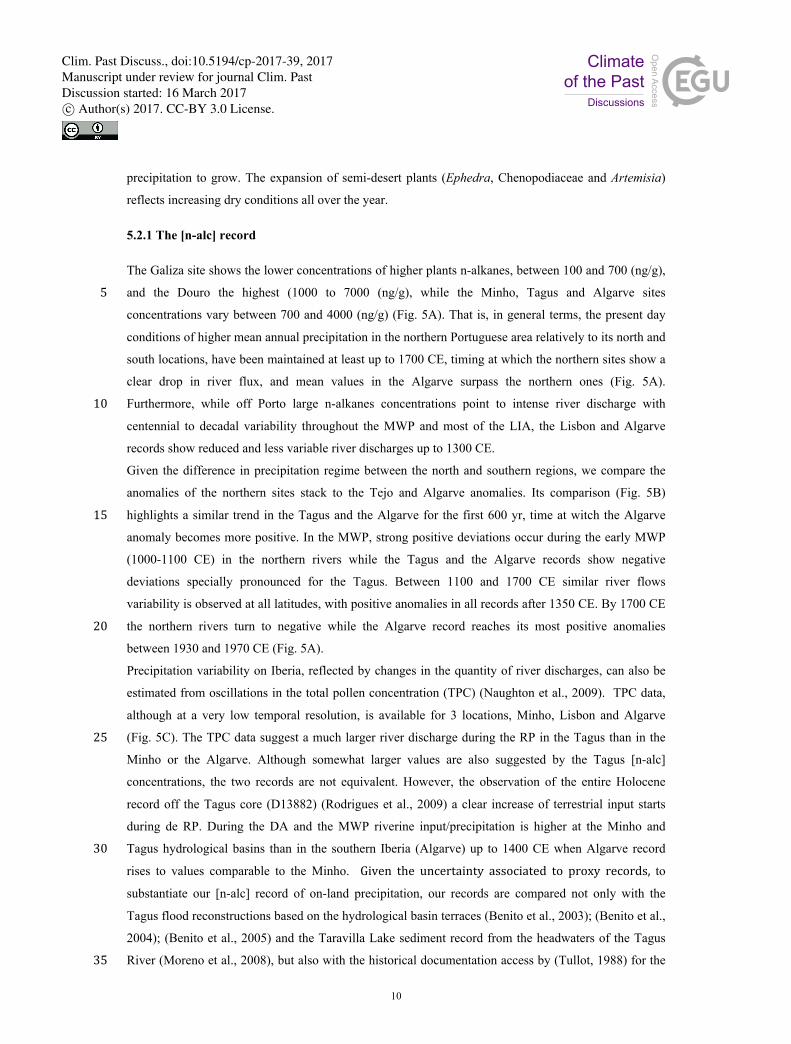
5.2.1 The [n-alc] record
The Galiza site shows the lower concentrations of higher plants n-alkanes, between 100 and 700 (ng/g),
and the Douro the highest (1000 to 7000 (ng/g), while the Minho, Tagus and Algarve sites 5
concentrations vary between 700 and 4000 (ng/g) (Fig. 5A). That is, in general terms, the present day
conditions of higher mean annual precipitation in the northern Portuguese area relatively to its north and
south locations, have been maintained at least up to 1700 CE, timing at which the northern sites show a
clear drop in river flux, and mean values in the Algarve surpass the northern ones (Fig. 5A).
Furthermore, while off Porto large n-alkanes concentrations point to intense river discharge with 10
centennial to decadal variability throughout the MWP and most of the LIA, the Lisbon and Algarve
records show reduced and less variable river discharges up to 1300 CE.
Given the difference in precipitation regime between the north and southern regions, we compare the
anomalies of the northern sites stack to the Tejo and Algarve anomalies. Its comparison (Fig. 5B)
highlights a similar trend in the Tagus and the Algarve for the first 600 yr, time at witch the Algarve 15
anomaly becomes more positive. In the MWP, strong positive deviations occur during the early MWP
(1000-1100 CE) in the northern rivers while the Tagus and the Algarve records show negative
deviations specially pronounced for the Tagus. Between 1100 and 1700 CE similar river flows
variability is observed at all latitudes, with positive anomalies in all records after 1350 CE. By 1700 CE
the northern rivers turn to negative while the Algarve record reaches its most positive anomalies 20
between 1930 and 1970 CE (Fig. 5A).
Precipitation variability on Iberia, reflected by changes in the quantity of river discharges, can also be
estimated from oscillations in the total pollen concentration (TPC) (Naughton et al., 2009). TPC data,
although at a very low temporal resolution, is available for 3 locations, Minho, Lisbon and Algarve
(Fig. 5C). The TPC data suggest a much larger river discharge during the RP in the Tagus than in the 25
Minho or the Algarve. Although somewhat larger values are also suggested by the Tagus [n-alc]
concentrations, the two records are not equivalent. However, the observation of the entire Holocene
record off the Tagus core (D13882) (Rodrigues et al., 2009) a clear increase of terrestrial input starts
during de RP. During the DA and the MWP riverine input/precipitation is higher at the Minho and
Tagus hydrological basins than in the southern Iberia (Algarve) up to 1400 CE when Algarve record 30
rises to values comparable to the Minho. Given the uncertainty associated to proxy records, to
substantiate our [n-alc] record of on-land precipitation, our records are compared not only with the
Tagus flood reconstructions based on the hydrological basin terraces (Benito et al., 2003); (Benito et al.,
2004); (Benito et al., 2005) and the Taravilla Lake sediment record from the headwaters of the Tagus
River (Moreno et al., 2008), but also with the historical documentation access by (Tullot, 1988) for the 35
Clim. Past Discuss., doi:10.5194/cp-2017-39, 2017Manuscript under review for journal Clim. PastDiscussion started: 16 March 2017c© Author(s) 2017. CC-BY 3.0 License.
11
Douro and Minho Rivers, and by (Barriendos and Rodrigo, 2006) for most IP basins including the
coastal Mediterranean, or yet to daily journals for the most recent flood events of the Guadiana River
(Barriendos and Martin-Vide, 1998; Barriendos and Rodrigo, 2006; Cabrita, 2007; Varzeano, 1976)
(Table 4). Those intervals are marked on figure 5 and although the age uncertainties, the northern sites
stack [n-alc] maxima between 1000 and 1100 AD coincide with reports of major flooding events in both 5
the Douro and Minho (Tullot, 1988). Other periods marked by strong precipitation occur in the MWP
between 1180 – 1200 CE, and again in the beginning of LIA, 1450- 1470 CE. In the Tagus sites
(Lisbon) the record also agrees with Tagus flooding times (1200 – 1280 CE; 1950 – 1980 CE). The
Algarve site, located 80 km to the west of the Guadiana River mouth appears to be recording not only at
the most recent newspaper’s reported flooding events of 1876 and 1979 CE (Cabrita, 2007); (Varzeano, 10
1976), but also the Atlantic basin flooding events (Benito et al., 2004); (Barriendos and Rodrigo, 2006).
The similarity of the independently identified recordsof storm/floodingperiods at the various
regions, leads to theconclusion that themaxima in [n-alc] can indeedbeattributed toextreme
precipitationandfloodingconditions.
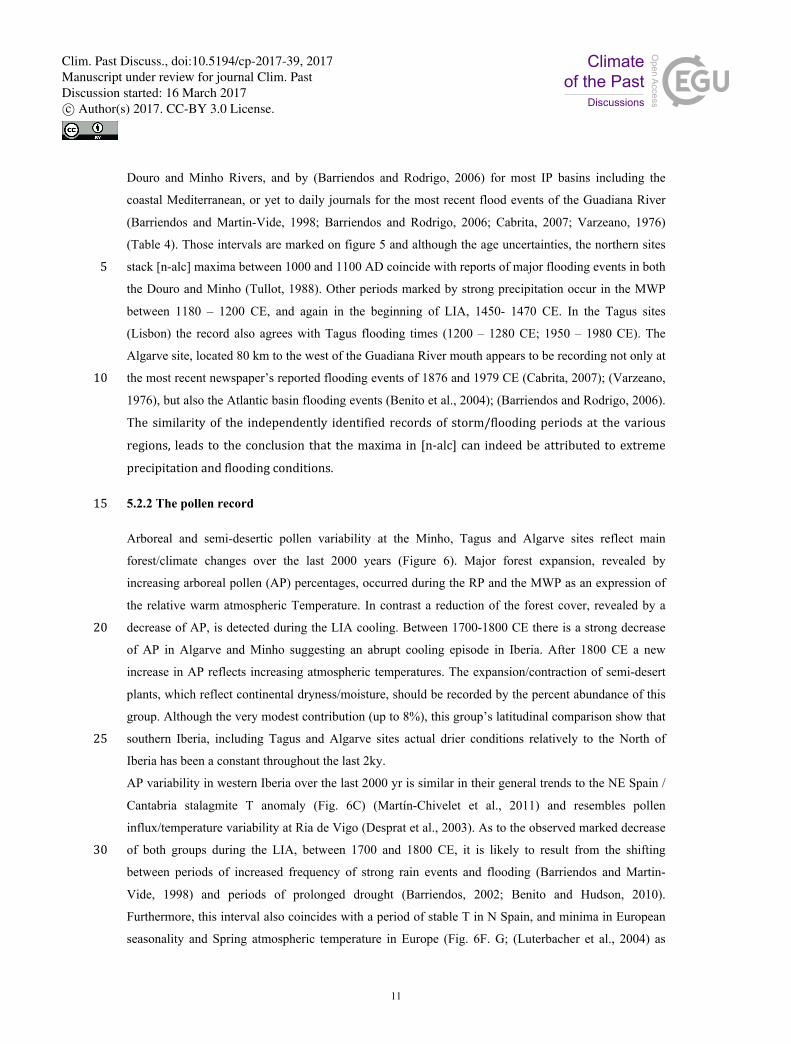
5.2.2 The pollen record 15
Arboreal and semi-desertic pollen variability at the Minho, Tagus and Algarve sites reflect main
forest/climate changes over the last 2000 years (Figure 6). Major forest expansion, revealed by
increasing arboreal pollen (AP) percentages, occurred during the RP and the MWP as an expression of
the relative warm atmospheric Temperature. In contrast a reduction of the forest cover, revealed by a
decrease of AP, is detected during the LIA cooling. Between 1700-1800 CE there is a strong decrease 20
of AP in Algarve and Minho suggesting an abrupt cooling episode in Iberia. After 1800 CE a new
increase in AP reflects increasing atmospheric temperatures. The expansion/contraction of semi-desert
plants, which reflect continental dryness/moisture, should be recorded by the percent abundance of this
group. Although the very modest contribution (up to 8%), this group’s latitudinal comparison show that
southern Iberia, including Tagus and Algarve sites actual drier conditions relatively to the North of 25
Iberia has been a constant throughout the last 2ky.
AP variability in western Iberia over the last 2000 yr is similar in their general trends to the NE Spain /
Cantabria stalagmite T anomaly (Fig. 6C) (Martín-Chivelet et al., 2011) and resembles pollen
influx/temperature variability at Ria de Vigo (Desprat et al., 2003). As to the observed marked decrease
of both groups during the LIA, between 1700 and 1800 CE, it is likely to result from the shifting 30
between periods of increased frequency of strong rain events and flooding (Barriendos and Martin-
Vide, 1998) and periods of prolonged drought (Barriendos, 2002; Benito and Hudson, 2010).
Furthermore, this interval also coincides with a period of stable T in N Spain, and minima in European
seasonality and Spring atmospheric temperature in Europe (Fig. 6F. G; (Luterbacher et al., 2004) as
Clim. Past Discuss., doi:10.5194/cp-2017-39, 2017Manuscript under review for journal Clim. PastDiscussion started: 16 March 2017c© Author(s) 2017. CC-BY 3.0 License.
12
well as a minimum in winter precipitation (Fig. 6C, I) (Martín-Chivelet et al., 2011; Romero-Viana et
al., 2011).
5.3 Climate Forcing Mechanisms
The variability of a very dynamic and seasonally distinct oceanographic system, as the one observed
along the IP Atlantic margin, has multiple attributes that do not always appear in the same combination 5
and can hamper climate reconstructions at all time-scales. Nevertheless, the use of multiple proxies
from a single sediment sequence and the regional anomaly stack of the various sites should allow for
the more robust climatic structures to be depicted. Furthermore, a site calibration of our SST proxy
(alkenone estimated SST) to satellite derived SST confirms its dependence on the season and process
providing the conditions for coccolithophores to bloom, and indicates that while in the west coast it 10
reflects winter SSTs in the Algarve mimics spring-fall SSTs (Figure 3). Although this could be seen as a
potential problem for the interpretation of our records, the fact that both the millennial SST trend as the
secular variability recorded at all sites is comparable and similar to the North Hemisphere and European
records (Figure 4; (Luterbacher et al., 2016; Masson-Delmotte et al., 2013; Moberg et al., 2005)), gives
us the confidence to use this difference as an opportunity to disentangle winter from spring-fall 15
conditions in the region.
The Atlantic margin of the IP was relatively warmer from 0-1300 CE, in particular during the RP (0-
500 CE) and the MWP (900-1300 CE), while SST slightly decreases during the DA (500 -900 CE). At
about 1300 CE, in particular in the southern IP sites, an important SST decrease marks the transition to
a clearly colder LIA that lasts up to 1850 CE, even though a transition period is perceived to start at mid 20
18th century in most records. The transition to modern times / Industrial Era, shows a two step increase
in SST, with an initial increase followed by a new and more abrupt rise by mid 20th century particularly
evidenced in the spring-fall record of the southernmost site.
In terms of on-land precipitation, the early MWP is a period of extreme precipitation and flooding
mainly in northern Iberia, off the Douro River (Porto site). During the LIA, a concerted response of all 25
the rivers related sites, reveals a period of frequent but probably less intense precipitation and, within
the age uncertainties, in consonance with the flooding intervals recorded on flooding plains, lakes and
documents (e.g. (Barriendos and Martin-Vide, 1998); (Benito et al., 2005); (Cabrita, 2007); (Moreno et
al., 2008); (Tullot, 1988); (Varzeano, 1976)). Iberian margin records also show evidences of the well-
known major storms of the 20th century. 30
According to the compilation of Sánchez-Lopes et al, (2015), the climate of the IP during the last 2 ky
has been modulated by the combined effect of two main modes of atmospheric circulation, the NAO
and the EA. As such, the warm atmospheric T and higher humidity detected in the W and S of the IP
during the RP are attributed to a negative NAO and a positive EA, and the more humid N with a W-E
humidity gradient observed in the DA are attributed to NAO+ and EA- conditions. The consistent warm 35
Clim. Past Discuss., doi:10.5194/cp-2017-39, 2017Manuscript under review for journal Clim. PastDiscussion started: 16 March 2017c© Author(s) 2017. CC-BY 3.0 License.
13
and dry conditions detected during the MWP throughout the IP, are attributed to NAO+ and EA+. On
the contrary, NAO- and EA- are considered to explain the cold and wet winters, as well as, the cold
summers proposed for the LIA.
Our results do not contradict Sánchez-Lopez conclusions for the RP, the DA and the LIA, but climate
specificities, to be discussed below, occur in the early MWP and the Industrial Era, associated to major 5
changes in the solar TSI record (Fig. 4G; (Bard et al., 2007)). Such distinctive features may indicate
either a more direct impact of internal oceanic variability on these coastal sites, the effect of the
SCAND mode, or yet the interplay of the various atmospheric modes of circulation with oceanic
dynamics.
5.3.1 The MWP phases 10
In the early MWP (900 - 1100 CE), warmer winters are recorded on the west coast while cooler spring-
falls occur in the Algarve and clustered events of extreme precipitation are registered in the northern IP.
On the contrary, the late MWP (1180 - 1280 CE) shows relatively cooler winters in the west, warmer
spring-fall in the Algarve and no sign of extraordinary winter storms. That is, climacteric conditions
that are in contradiction with the expected dry and warm winters as well as warm summers likely to be 15
generated by the prevalence of NAO+ and EA+ modes proposed by (Sánchez-Lopes et al., 2015). Yet,
stronger coastal upwelling conditions have also been suggested to explain the productivity record of the
southern Tagus site, implying the existence of northerly winds and an active Portuguese Current, that is,
a persistent, positive NAO-like state or the frequent occurrence of extreme NAO maxima during the
MWP (Abrantes et al, 2005). Furthermore, arboreal pollen indicate relatively warm conditions in both 20
northwestern and southern IP (Fig. 6B), and are in good agreement with atmospheric temperature over
NE Spain (Fig. 6C) (Martín-Chivelet et al., 2011) up to the beginning of the LIA, what is likely to
reflect similar on-land conditions on both regions. (Marullo et al., 2011) found significant correlations
between the AMO and the climate of the Euro-Mediterranean region, mainly in summer and
intermediate seasons (spring and fall). Persistent positive NAO conditions during the MWP are also 25
pointed as a source of strong heat transport from the Atlantic and an equally strong north Atlantic
current (Yang and Myers, 2007). Furthermore, the Portuguese current is a southward extension of the
North Atlantic Current, which in turns flows off the Gulf Stream.
Proxy reconstructions of the Gulf Stream SST and hydrographic variability reveal two periods of
warmer SSTs within the general warm waters of the MWP, between 700 – 1070 CE and again between 30
1180 and 1280 CE (Fig. 5E) (Saenger et al., 2011). While the general warmth of the MWP is attributed
to a more positive NAO like circulation, evidence for lower salinities lead the authors to conclude a
northward advection of warm and less saline waters from the tropical Atlantic, in support of fresher
tropical Atlantic caused by shifts in the latitudinal position of the ITCZ, and a stronger overturning
circulation (AMOC) during the MWP relatively to the LIA. Such conditions have also been suggested 35
Clim. Past Discuss., doi:10.5194/cp-2017-39, 2017Manuscript under review for journal Clim. PastDiscussion started: 16 March 2017c© Author(s) 2017. CC-BY 3.0 License.
14
by other Atlantic records (e.g. (Bianchi and McCave, 1999; Boessenkool et al., 2007; Keigwin and
Pickart, 1999), and sustained by model simulations that highlight the potential role of the NAO in
driving variability in the North Atlantic Sea Surface Temperature (AMO) which is associated with
AMOC variability and consequently in the thermohaline circulation (Delworth and Dixon, 2000).
Although the existence of salinity anomalies in the northern Atlantic are defended by many model 5
studies as a prerequisite for AMOC intensification (Buckley and Marshall, 2016), some modeling
studies emphasize the need for a weakening of the subtropical and subpolar gyres (Häkkinen et al.,
2011; Häkkinen et al., 2013), to allow for a greater penetration of warm subtropical waters into the
subpolar gyre (e.g (Danabasoglu et al., 2012)). According to (Häkkinen et al., 2011), the mean gyre
strength is driven by changes in the wind stress curl that in turn is associated with changes in blocking 10
between Greenland and Western Europe. Considering the modern observations of (Marshall and al,
2001), the Atlantic zero wind stress curl line shifts northward during more positive NAO-like
conditions. However, to explain the occurrence of big storms clustered in the early MWP on the
northwestern IP (off the Douro River), one has to imply a storm track position southward of the modern
path of the westerly winds under NAO+ conditions, to at least 41ºN, a shift that could have been caused 15
by an increase in mid-latitude blocking anticyclones. The SCAND is related to major blocking
anticyclones over Scandinavia and has a positive mode associated with above-average precipitation
across southern Europe (Comas-Bru and McDermott, 2014; Jerez and Trigo, 2013). Although
considered to have a larger influence on the IP in summer than in winter, (Hernández et al., 2015)
attribute the interannual winter variability in the northern IP lake Sanabria to the joint action of NAO 20
and SCAND modes, while EA appears to have a weak influence in summer. The regional effect of all
three modes of atmospheric circulation on the SST and precipitation at IP, for winter and summer
periods, is presented in figure 5 of (Hernández et al., 2015). Bearing in mind the Atlantic coast, besides
the evident negative relation observed between NAO and precipitation in winter, EA and SCAND are
also positively related to winter precipitation in particular in the northern IP. In summer, there is a slight 25
positive relation of SCAND with precipitation in the north but an important negative effect with
temperature in most of IP. Assuming that these modern patterns were maintained during the MWP, one
possible explanation for the observed strong precipitation in the north and lower SST in the Algarve
during the early MWP may be the effect of a positive SCAND in the early MWP, but negative in late
MWP. 30
To investigate the influence of the Atlantic SST multi-decadal variability of the weather regime over the
Atlantic IP region, wavelet analysis was performed on our records (Figs. 7, 8). Both SST and
precipitation data series exhibit low frequency variability. Although dominant periods occur within the
shaded area the cone of influence, the occurrence of different cycles is taken as an indication of their
importance. SST reveals a dominance period centered at 32 yr throughout the north stack (Fig. 7C), two 35
dominant periods centered at 32 and 64 yr throughout the Algarve record (Fig. 7B) and a mix of the two
Clim. Past Discuss., doi:10.5194/cp-2017-39, 2017Manuscript under review for journal Clim. PastDiscussion started: 16 March 2017c© Author(s) 2017. CC-BY 3.0 License.
15
bands when the total stack is considered (Fig. 7A). The precipitation records show the same band of
dominance centered at 64 yr in the Algarve record (Fig. 8A), but a dominance centered at 20 yr after ±
1050 CE for the northern stack (Fig. 8B). That is, a 64 yr period appears for SST both on the west and
south coasts as well as for recipitation over the southern Algarve coast. In addition, shorter period
processes are found for SST in the Algarve (32 yr), and precipitation in the northern sites (20 yr). 5
(Stocker and Mysak, 1992), attribute the 38-110 yr cycles found in their model exercise, to natural
internal variability. (Frankcombe et al., 2010), propose that the north Atlantic multidecadal variability is
dominated by two main time scales, a 20-30 yr associated with the AMOC and so, of ocean internal
origin and a 50-70 yr related to the atmospheric exchange between the Atlantic and the Arctic Ocean.
(Cunningham et al., 2013), in its NE North Atlantic composite finds 111, 55.6, 40 and 31.3 yr cycles. 10
However, the small amount of variance of the record explained those periods, lead the authors to
conclude for a weak influence of ocean internal variability into the NE North Atlantic Climate. More
recently, (Buckley and Marshall, 2016), revise the periodicities shown by various instrumental and
proxy records, group them into decadal (20 yr) and multidecadal (± 40-70 yr), and present results with
statistical significance support for the 70 yr periodicity. Additionally, the authors support (Zhang, 2007) 15
and (Yamamoto and Palter, 2016), in that on decadal and multi-decadal time scale, ocean dynamics
does play a role in the European climate variability.
If our wavelet results are interpreted in light of the above-presented information, multi-decadal
variability of the North Atlantic dynamics, including the resulting heat transport into Europe, impacts
Atlantic IP SST and precipitation in the southern site. Decadal variability, in turn, appears to affect 20
precipitation in the northern sites mainly after 1050 CE and SST in the southern.
5.3.2 The Industrial Era
The transition to the Industrial Era, in the northern Porto site, although distinct at 1850 CE, starts at
1730−1740 CE (Abrantes et al., 2011) and is accompanied by the return of SSTs to the values observed
pre 1300 CE. A pattern that coincides with the atmospheric temperature rise detected in NE Spain, 25
Europe and the northern Hemisphere (Luterbacher et al., 2016; Martín-Chivelet et al., 2011; Moberg et
al., 2005), as well as with a drought period that mainly affects the Atlantic sector of the Iberian
Peninsula (Domínguez-Castro et al., 2010). A second and more marked rise of SST occurs by the mid
20th century (± 1970) being particularly distinct in the southern Algarve site, and in consonance with the
second warming phase also observed in the western Mediterranean (Lionello et al., 2006; Martín-30
Puertas et al., 2010).
The transition into the Industrial Era is also marked by a shift in the phytoplankton community and
water column stratification over the northern Porto site, which was interpreted by Abrantes et al.,
(2011), as a response to a reduction in the summer and/or annual upwelling and more frequent
fall−winter upwelling-like events, on the basis of published evidence ((Abrantes et al., 2011; Alvarez et 35
Clim. Past Discuss., doi:10.5194/cp-2017-39, 2017Manuscript under review for journal Clim. PastDiscussion started: 16 March 2017c© Author(s) 2017. CC-BY 3.0 License.
16
al., 2005; Gómez-Gesteira M et al., 2008; Pardo et al., 2011; Pérez et al., 2010)). This shift corresponds
to an intensified NAO+ phase followed by slightly positive NAO up to 1850 CE (Fig. 4I) (Cook et al.,
2002; Luterbacher et al., 2002; Vinther et al., 2003), and is concomitant with a higher coherence
between the Porto SST data and the AMO index (Abrantes et al., 2011). On the basis of this information
the authors propose a connection between the Iberian coastal upwelling variability and the North 5
Atlantic Ocean’s surface and thermohaline circulation at the decadal scale. More recently, (Zampieri et
al., 2016), propose that the rapid warming periods of the Northern Hemisphere, including the last one in
the ‘90s, are in great part modulated by shifts in the north Atlantic decadal mode of SST variability
(AMO) from negative (cold) to positive (warm phases). A close look to the AMO index records of
(Gray et al., 2004) and (Mann et al., 2010) (Fig. 4H), reveals that the two warming steps referred above 10
do indeed occur during warming transitions in the AMO index, supporting the influence of the N
Atlantic SST pattern on the Atlantic IP and its southern area in particular. A connection also defended
by (Cisneros et al., 2016) to explain the last 400 yr SST reconstruction of the central-western
Mediterranean Sea.
The prominent increase in the southern site SST might be explained by the dynamics of the coastal 15
counter-current of the Gulf of Cadiz, were higher SSTs are reached at periods of large-scale northerly
winds during the upwelling season (Garel et al., 2016). And a substantial intensification of the
upwelling off the Southwestern coast in the last 50 years, particularly noticeable during the peak
summer months (July to September) has been defended by (Relvas et al., 2009). Nevertheless, it
emerges as a regional imprint of a major reorganization of the oceanic dynamics that is likely to have 20
been initiated in the mid 18th century. Considering the high relevance of such environmental changes to
ecosystems, a more in depth discussion of its effect at the regional scale is necessary.
6 Conclusions
The combination of SST and terrestrial input/river discharge records from six sites distributed along the
Iberian margin, from 36º to 41 ºN latitude, captures the spatial character of the Iberian margin SST and 25
continental precipitation variability at various time scales through the last 2000 yr. Furthermore, a
regional anomaly stack for SST and river discharge, constructed from the grouping of individual
records’ anomalies, provide a meaningful form to understand the role of global/hemispheric vs regional
processes.
On the long-term, a decreasing trend between 0 CE and the beginning of the 20th century is observed at 30
all latitudes with max amplitude in the southern site.
Within the long term cooling a series of century/decadal scale climate changes are detected by
combining information of the different site records. This century/decadal variability follows the overall
climatic patterns of the extra-tropical northern Hemisphere and Europe. Warm and wet RP and DA are
in accordance with the northeastern Iberian records, as also indicated by the good agreement between 35
Clim. Past Discuss., doi:10.5194/cp-2017-39, 2017Manuscript under review for journal Clim. PastDiscussion started: 16 March 2017c© Author(s) 2017. CC-BY 3.0 License.
17
the arboreal vegetation and NE Spain air temperature up to the beginning of the LIA. Colder conditions
and frequent but apparently not extreme storms occur during the LIA all along the Atlantic IP concerted
with flood plain, lakes and historic documents. The alternation between stormy and drought periods is
likely to be the cause for a marked decrease of both arboreal and semi-desertic vegetation at all latitudes
during the LIA. However, climate specificities occur in the MWP, mainly in the early MWP and again 5
in the transition from the LIA into the Industrial Era, in both cases, associated to transition periods in
solar activity (TSI).
In the MWP, two phases could be distinguished, an early MWP phase marked by warmer winters but
cooler spring-falls and extraordinary storms in the northern sites, and a second consistent dry period
with warmer spring-falls. To explain the MWP record, we support the propose interplay between the 10
NAO and EA modes of atmospheric circulation, both of which on a positive phase, and suggest a
stronger influence of the north Atlantic dynamics on Iberian climate. Furthermore, in the early MWP
the flooding record imply a southward shift of the modern storm track under NAO+ conditions, that is,
the presence of a high pressure blocking system over northwestern Europe, such as it can be provided
by a positive-like mode of the SCAND atmospheric mode of circulation. 15
The Industrial Era SST rise occurs in two steps, at the end of the LIA (1730 -1850), and again in the
mid 20th century. At 1800 CE an imprint of oceanic processes becomes apparent in the northern records,
supporting a stronger influence of the internal ocean variability into the Atlantic IP climate. This second
increase in SST is particularly marked in the southern Algarve site as a regional imprint of a larger-
scale process that can also reflect the global warming impact that is expected mainly for southern Iberia. 20
7. Team list
5. Copyright statement 25 6. Code availability 7. Data availability 30
Data will be archived at PANGEA and link to data will be included on the final version
11. Appendices 3513. Author contribution
Abrantes, F – PI of the various projects that funded all the data combined in this paper, has the idea and
wrote the paper;
Rodrigues, T- Responsible for the biomarkers analysis in all cores;
Clim. Past Discuss., doi:10.5194/cp-2017-39, 2017Manuscript under review for journal Clim. PastDiscussion started: 16 March 2017c© Author(s) 2017. CC-BY 3.0 License.
18
Rufino, M – Statistical data analysis;
Naughton, F – Responsible for the pollen analysis;
Salgueiro, E – Data of GeoB11033-1 core;
Oliveira, D – Pollen analysis of the DIVA and POPEI cores;
Domingues, S – Pollen analysis for the Tagus site D13882 core; 5
Costa, A. – Age model for GeoB11033-1;
Oliveira, P – Provided the satellite SST data;
Drago, T – Provided the Algarve core (POPEI);
Mil-Homens, M - Recovered the DIVA core;
10
Acknowledgments
The authors express their gratitude to the captain, crew and participants of the cruises Discovery 249,
Poseidon PALEO I, GALIOMAR P34, and B/O Mytilus DIVA09 for their contribution during the
retrieval of the various cores used in this study. Thanks are due in particular to Guilhermo F. Pedraz and
the Departamento de Geociencias Marinas y Ordenación del Territorio (Universidade de Vigo) for 15
allowing the recovery of the DIVA core on their DIVA09 cruise.
Funding was provided by projects INGMAR (FCT ARIPIPI Program –Support for State Labs
Development), HOLSMEER (EVK2-CT-2000-00060), CLIMHOL (PTDC/AAC-CLI/100157/2008),
MIÑO-MINHO (0234_NATURA_MM_1_E), POPEI (PDCT/MAR/55618/2004), CALIBERIA
(PTDC/MAR/102045/2008 from FCT and COMPETE/FEDER -FCOMP-01-0124-FEDER-010599), 20
CIIMAR (20132017 CIMAR), CCMAR (Associated Lab PEstC/ MAR/LA0015/2013); felowships to
Filipa Naughton (SFRH / BPD / 36615 / 2007), Teresa Rodrigues (SFRH/BPD/66025/2009), Emília
Salgueiro (Ref. SFRH / BPD / 26525 / 2006 & SFRH / BPD /111433 / 2015). Marta Rufino was funded
by contrato ciência 2007 and by a post- doctoral grant of IPMA, within the EU project SAFI (FP7-
SPACE-2013-1, grant agreement n8 607155). Finally we thank A. Inês, D. Ferreira and C. Monteiro 25
for their help and support with the laboratory analysis. This is a contribution to the PAGES 2k Network.
Past Global Changes (PAGES) is supported by the US National Science Foundations and Swiss
Academy of Sciences.
Clim. Past Discuss., doi:10.5194/cp-2017-39, 2017Manuscript under review for journal Clim. PastDiscussion started: 16 March 2017c© Author(s) 2017. CC-BY 3.0 License.
19
List of Tables and Figures
Table 1 – Geographic location, water depth, sampling cruise, sedimentation rate (SR) and age model
origin for the eight studied cores.
5
Table 2 – Results of 14C accelerator mass spectrometry dating (means ± SE) of the cores GeoB11033-1
(Galiza), DIVA 09CG (Minho) and POPEI VC2B (Algarve). Ages were reservoir corrected by 400 yr
(years before present, yr BP) and converted into calendar years (AD/CE).
Table 3 –SST mean during major climatic episodes along Atlantic margin of the Iberian Peninsula. 10
Existing sediment hiatus likely affected estimated value. Shades of blue and pink highlight respectively
colder and warmer periods.
Table 4 – Compilation of flooding and drought events on the western Iberian Peninsula, according to
published information. 15
Figure 1 –Cores location over Iberian Margin bathymetry. Geoß11033-1 / Galiza in orange, DIVA09
GC / Minho in magenta, PO287-26B, -26G, PO287-6B, -6G / Porto (Douro Mud Belt) in blue,
D130902, D13882 Lisbon (Tagus Mud Belt) in green, POPEI VC2B/ Algarve in red. The color and
selected for each region will be applied in all figures. 20
Figure 2 – Comparison of SST stacks constructed using all the cores (total – black), without the Tagus
cores (effect of existing hiatus - green), without the Popei record (effect of different coccolithophores
generating process - red) and considering only the northern sites (Galiza, Minho and Porto - blue)
25
Figure 3 – Comparison of alkenone-derived sea surface temperature (SST – black diamonds) measured
in cores PO287-6B, PO287-26B and POPEI with annual, seasonal average, NAO winter (djfm) and
upwelling season (mjjas) satellite derived SST at the three sites location.
Figure 4 – Comparison of SST along the last 2,000 years at sites Galiza (magenta), Minho (orange), 30
Porto (blue), Lisbon (green) and Algarve (red) (A); SST stack constructed from all Iberian margin
records (B); northern Hemisphere annual mean atmospheric temperature anomaly (Moberg et al., 2005)
(C); northern Spain atmospheric temperature anomaly (Martín-Chivelet et al., 2011) (D); European
spring-fall atmospheric temperature anomaly (Luterbacher et al., 2016) (E); vulcanic activity as aerosol
optical depth (Crowley and Unterman, 2013) (F); radionuclide-derived total solar irradiance (TSI) (Bard 35
et al., 2007) and 14C estimated production (Marchal, 2005) (G); northern Atlantic Ocean SST anomaly,
Clim. Past Discuss., doi:10.5194/cp-2017-39, 2017Manuscript under review for journal Clim. PastDiscussion started: 16 March 2017c© Author(s) 2017. CC-BY 3.0 License.
20
AMO index (gray, (Mann et al., 2010) and (black, Gray et al., 2004) (H); NAO index (Luterbacher et
al., 2002) and (Trouet et al., 2009) (I). Light grey band marks the Roman Period (RP), the pink band
marks the Medieval Warm Period (MWP/MCA); the blue band marks the Little Ice Age (LIA).
Figure 5 – [n-alc] variability along the last millennium and at the 5 different sites of the Iberian Atlantic 5
margin (A); the [n-alc] stack anomaly of the north sites, Tagus and Algarve (B); total pollen
concentration (# pollen grains/cm3 sediment) (C); SST stack anomaly (D); SST NW Atlantic cores
KNR140-2-59GGC and CH07-98-MC22 (Saenger et al., 2011) (E); instrumental NAO index (black
line), Luterbacher reconstruction (black line; Luterbacher et al. 2002), Cook reconstruction (green line;
(Cook et al., 2002) and (gray line; Trouet et al, 2009) (F); Radionuclide-derived total solar irradiance 10
(TSI) (Bard et al., 2007) (G). Grey bands mark the periods of Atlantic flooding as listed in Table 4.
Figure 6 – Variability of semi-desert plants percent percentages along the 2,000 yr record of cores Diva,
Tejo and Popei (A); arboreal species percent abundance (B); northern Spain atmospheric temperature
anomaly (Martín-Chivelet et al., 2011) (C); European spring-fall atmospheric temperature anomaly 15
(Luterbarher et al., 2016) (D); Spring Precipitation Central Europe (Büntgen et al., 2011) (E): European
Seasonality and Spring AT (Luterbacher et al., 2004) (F, G); may-august Precipitation (Touchan et al.,
2005) (H); winter (djfm) Precipitation (Romero-Viana et al., 2011) (I).
Figure 7 – The continuous wavelet power spectrum of the SST STACK (A); the Algarve SST record 20
(B); and the north SST STACK (C). The thick black contour designates the 95% confidence level and
the lighter shaded area represents the cone of influence (COI) where edge effects might distort the
results.
Figure 8 – The continuous wavelet power spectrum of the Algarve [n-alc] record (A) and the north [n-25
alc] STACK (B). The thick black contour designates the 95% confidence level and the lighter shaded
area represents the cone of influence (COI) where edge effects might distort the results.
References
Abrantes,F.,Lebreiro,S.,Rodrigues,T.,Gil,I.,Bartels-Jónsdóttir,H.,Oliveira,P.,Kissel,C.,and
Grimalt,J.O.:Shallow-marinesedimentcoresrecordclimatevariabilityandearthquakeactivity30
offLisbon(Portugal)forthelast2,000years.,QuaternaryScienceReviews,doi:
10.1016/j.quascirev.2004.04.009,2005.2005.
Abrantes,F.,Lopes,C.,Rodrigues,T.,Gil,I.,Witt,L.,Grimalt,J.,andHarris,J.:Proxycalibrationto
instrumentaldataset:Implications
forpaleoceanographicreconstructions,Geochem.Geophys.Geosyst.,10,2009.35
Clim. Past Discuss., doi:10.5194/cp-2017-39, 2017Manuscript under review for journal Clim. PastDiscussion started: 16 March 2017c© Author(s) 2017. CC-BY 3.0 License.

21
Abrantes,F.,Rodrigues,T.,Montanari,B.,Santos,C.,Witt,L.,Lopes,C.,andVoelker,A.H.L.:
ClimateofthelastmillenniumatthesouthernpoleoftheNorthAtlanticOscillation:aninner-shelf
sedimentrecordoffloodingandupwelling,ClimateResearch,48,261-280,2011.
Ahmed,M.,Anchukaitis,K.J.,Asrat,A.,Borgaonkar,H.P.,Braida,M.,Buckley,B.M.,Buntgen,U.,
Chase,B.M.,Christie,D.A.,Cook,E.R.,Curran,M.A.J.,Diaz,H.F.,Esper,J.,Fan,Z.-X.,Gaire,N.P.,5
Ge,Q.,Gergis,J.,Gonzalez-Rouco,J.F.,Goosse,H.,Grab,S.W.,Graham,N.,Graham,R.,Grosjean,M.,
Hanhijarvi,S.T.,Kaufman,D.S.,Kiefer,T.,Kimura,K.,Korhola,A.A.,Krusic,P.J.,Lara,A.,Lezine,
A.-M.,Ljungqvist,F.C.,Lorrey,A.M.,Luterbacher,J.,Masson-Delmotte,V.,McCarroll,D.,
McConnell,J.R.,McKay,N.P.,Morales,M.S.,Moy,A.D.,Mulvaney,R.,Mundo,I.A.,Nakatsuka,T.,
Nash,D.J.,Neukom,R.,Nicholson,S.E.,Oerter,H.,Palmer,J.G.,Phipps,S.J.,Prieto,M.R.,Rivera,A.,10
Sano,M.,Severi,M.,Shanahan,T.M.,Shao,X.,Shi,F.,Sigl,M.,Smerdon,J.E.,Solomina,O.N.,Steig,
E.J.,Stenni,B.,Thamban,M.,Trouet,V.,Turney,C.S.M.,Umer,M.,vanOmmen,T.,Verschuren,D.,
Viau,A.E.,Villalba,R.,Vinther,B.M.,vonGunten,L.,Wagner,S.,Wahl,E.R.,Wanner,H.,Werner,J.
P.,White,J.W.C.,Yasue,K.,andZorita,E.:Continental-scaletemperaturevariabilityduringthe
pasttwomillennia,NatureGeosci,advanceonlinepublication,2013.15
Akima,H.andGebhardt,A.:akima:InterpolationofIrregularlyandRegularlySpacedData.R
packageversion0.6-2.2016.
Alvarez,I.,Gomez-Gesteira,M.,deCastro,M.,andPrego,R.:Variationinupwellingintensityalong
theNorthWestIberianPeninsula(Galicia),JournalofAtmospheric&OceanScience,10,309-324,
2005.20
Bard,E.,Raisbeck,G.,Yiou,F.,andJouzel,J.:Commenton"Solaractivityduringthelast1000yr
inferredfromradionucliderecordsbyMuscheleretal.(2007).QuaternaryScienceReviews,26,
2301-2308,2007.
Barriendos,M.:Losriesgosclimáticosatravésdelahistoria:avancesenelestudiodeepisodios
atmosféricosextraordinarios.In:Riesgosnaturales,Ayala-Carcedo,F.J.andOlcina,J.(Eds.),Ariel,25
Barcelona,2002.
Barriendos,M.andMartin-Vide,J.:Secularclimaticoscillationsasindicatedbycatastrophicfloods
intheSpanishMediterraneancoastlandarea.,ClimateChange38,473–491,1998.
Barriendos,M.andRodrigo,F.S.:StudyofhistoricalfloodeventsonSpanishriversusing
documentarydata,HydrologicalSciencesJournal,51,765-783,2006.30
Benito,G.,Barriendos,M.,Llasat,M.C.,Machado,M.J.,andThorndycraft,V.R.:Impactsonnatural
hazardsofclimaticorigin.A.Floodrisk.In:PreliminaryEvaluationoftheImpactsofClimate
ChangeinSpain.,Moreno,J.M.(Ed.),MinisteriodeMedioAmbiente,Madrid,,2005.
Benito,G.,Díez-Herrero,A.,andFernándezdeVillalta,M.:FloodResponsetoSolarActivityinthe
TagusBasin(CentralSpain)overtheLastMillennium,ClimaticChange,66,27-28,2004.35
Clim. Past Discuss., doi:10.5194/cp-2017-39, 2017Manuscript under review for journal Clim. PastDiscussion started: 16 March 2017c© Author(s) 2017. CC-BY 3.0 License.
22
Benito,G.andHudson,P.:Floodhazards:ThecontextoffluvialGeomorphology...In:
GeomorphologicalHazardsandDisasterPrevention,Alcántara-Ayala,I.andGoudie,A.(Eds.),
CambridgeUniversityPress2010.
Benito,G.,Sopeña,A.,Sánchez-Moya,Y.,Machado,M.a.J.,andPérez-González,A.:Palaeoflood
recordoftheTagusRiver(CentralSpain)duringtheLatePleistoceneandHolocene,Quaternary5
ScienceReviews,22,1737-1756,2003.
Bianchi,G.andMcCave,I.:HoloceneperiodicityinNorthAtlanticclimateanddeep-oceanflow
southofIceland,Nature,397,515−517,1999.
Boessenkool,K.P.,I.R.Hall,H.Elderfield,andYashayaev,I.:NorthAtlanticclimateanddeep-ocean
flowspeedchangesduringthelast230years.10
,Geophys.Res.Lett.,34,2007.
Bradley,R.S.andJones,P.D.:LittleIceAge'summertemperaturevariations:theirnatureand
relevancetorecentglobalwarmingtrends,TheHolocene,3,367-376,1993.
Buckley,M.W.andMarshall,J.:Observations,inferences,andmechanismsoftheAtlantic
MeridionalOverturningCirculation:Areview,ReviewsofGeophysics,54,5-63,2016.15
Bunn,A.,Korpela,M.,Biondi,F.,Campelo,F.,Mérian,P.,Qeadan,F.,andZang,C.:dplR:
DendrochronologyProgramLibraryinR.Rpackageversion1.6.5.,2017.
Büntgen,U.,Tegel,W.,Nicolussi,K.,McCormick,M.,Frank,D.,Trouet,V.,Kaplan,J.O.,Herzig,F.,
Heussner,K.-U.,Wanner,H.,Luterbacher,J.,andEsper,J.:2500YearsofEuropeanClimate
VariabilityandHumanSusceptibility,Science,331,578,2011.20
Cabeçadas,G.,Brogueira,M.J.,Nogueira,M.,Cabeçadas,L.,Cavaco,H.,andNogueira,P.:Coastal
phytoplanktonproductivityassociatedwithdifferentstabilityandnutrientpatterns.,Nice,
France2003.,EAE-A-09277.
Cabeçadas,G.,Brogueira,M.J.,T.Coutinho,andOliveira,A.P.:Impactofhydrodynamicsonthe
ecologyofDourocoastalwaters,EGUGeneralAssembly2008,Viena,2008.25
Cabrita,A.N.:ACheiaGrandenoGuadiana,7deDezembrode1876.In:EventosMeteorológicos,
Estremoz,2007.
Calvert,S.E.andPedersen,T.F.:ChapterFourteenElementalProxiesforPalaeoclimaticand
PalaeoceanographicVariabilityinMarineSediments:InterpretationandApplication.In:
DevelopmentsinMarineGeology,Claude,H.M.andAnneDe,V.(Eds.),Elsevier,2007.30
Cardeira,S.,Rita,F.,Relvas,P.,andCravo,A.:Chlorophyllaandchemicalsignaturesduringan
upwellingeventofftheSouthPortuguesecoast(SWIberia),ContinentalShelfResearch,52,133-
149,2013.
Cisneros,M.,Cacho,I.,Frigola,J.,Canals,M.,Masqué,P.,Martrat,B.,Casado,M.,Grimalt,J.O.,Pena,
L.D.,Margaritelli,G.,andLirer,F.:Seasurfacetemperaturevariabilityinthecentral-western35
Clim. Past Discuss., doi:10.5194/cp-2017-39, 2017Manuscript under review for journal Clim. PastDiscussion started: 16 March 2017c© Author(s) 2017. CC-BY 3.0 License.
23
MediterraneanSeaduringthelast2700years:amulti-proxyandmulti-recordapproach,Clim.
Past,12,849-869,2016.
Climate,E.:ESPONCLIMATE-ClimateChangeandTerritorialEffectsonRegionsandLocal
EconomiesinEurope.AppliedResearch2013/1/4.DraftFinalReport|Version25/2/2011.,TU
DortmundUniversity,Germany.,2011.5
Comas-Bru,L.andMcDermott,F.:ImpactsoftheEAandSCApatternsontheEuropeantwentieth
centuryNAO–winterclimaterelationship,QuarterlyJournaloftheRoyalMeteorologicalSociety,
140,354-363,2014.
Cook,E.,D’ArrigoRD,andME,M.:Awell-verified,multiproxyreconstructionofthewinterNorth
AtlanticOscillationindexsinceA.D.400,J.Clim.,15,1754−1764,2002.10
Cook,E.R.,Esper,J.,andD'Arrigo,R.D.:Extra-tropicalNorthernHemispherelandtemperature
variabilityoverthepast1000years,QuaternaryScienceReviews,23,2063-2074,2004.
Crowley,J.andUnterman,M.B.:Technicaldetailsconcerningdevelopmentofa1200-yrproxy
indexforglobalvolcanism,Crowley2013AOD-Reff,5,187-197,2013.
Cunningham,L.K.,Austin,W.E.N.,Knudsen,K.L.,Eiríksson,J.,Scourse,J.D.,Wanamaker,A.D.,15
Butler,P.G.,Cage,A.G.,Richter,T.,Husum,K.,Hald,M.,Andersson,C.,Zorita,E.,Linderholm,H.W.,
Gunnarson,B.E.,Sicre,M.-A.,Sejrup,H.P.,Jiang,H.,andWilson,R.J.S.:Reconstructionsofsurface
oceanconditionsfromthenortheastAtlanticandNordicseasduringthelastmillennium,The
Holocene,23,921-935,2013.
Danabasoglu,G.,Yeager,S.G.,Kwon,Y.-O.,Tribbia,J.J.,Phillips,A.S.,andHurrell,J.W.:Variability20
oftheAtlanticMeridionalOverturningCirculationinCCSM4,JournalofClimate,25,5153-5172,
2012.
Delworth,T.L.andDixon,K.W.:ImplicationsoftherecenttrendintheArctic/NorthAtlantic
OscillationfortheNorthAtlanticthermohaline
circulation,J.Clim.,13,3721–3727,2000.25
Desprat,S.,SánchezGoñi,M.a.F.,andLoutre,M.-F.:Revealingclimaticvariabilityofthelastthree
millenniainnorthwesternIberiausingpolleninfluxdata,EarthandPlanetaryScienceLetters,
213,63-78,2003.
Dickson,R.R.,Meincke,J.,Malmberg,S.-A.,andLee,A.J.:The“greatsalinityanomaly”inthe
NorthernNorthAtlantic1968–1982,ProgressinOceanography,20,103-151,1988.30
Domínguez-Castro,F.,García-Herrera,R.,Ribera,P.,andBarriendos,M.:Ashiftinthespatial
patternofIberiandroughtsduringthe17thcentury,Clim.Past,6,553-563,2010.
Esper,J.,Cook,E.R.,andSchweingruber,f.H.:Low-FrequencySignalsinLongTre-Ring
ChronologiesforReconstructingPastTemperature,Science,295,2250-2253,2002.
Clim. Past Discuss., doi:10.5194/cp-2017-39, 2017Manuscript under review for journal Clim. PastDiscussion started: 16 March 2017c© Author(s) 2017. CC-BY 3.0 License.
24
Fernandez-Donado,L.,Gonzalez-Rouco,J.F.,Raible,C.C.,Ammann,C.M.,Barriopedro,D.,García-
Bustamante,E.,Jungclaus,J.H.,Lorenz,S.J.,Luterbacher,J.,Phipps,S.J.,Servonnat,J.,
Swingedouw,D.,Tett,S.F.B.,Wagner,S.,Yiou,P.,andZorita,E.:Large-scaletemperatureresponse
toexternalforcinginsimulationsandreconstructionsofthelastmillennium,ClimateofthePast,
9,293-421,2013.5
Fiuza,A.:ThePortugueseCoastalUpwelling,Lisbon1982,45-71.
Fiuza,A.:UpwellingpatternsoffPortugal.In:CoastalUpwellingitssedimentrecord.,Suess,E.and
Thiede,J.(Eds.),Plenum,NewYork,1983.
Fiúza,A.andMacedo,M.E.:ClimatologicalspaceandtimevariationofthePortuguesecoastal
upwelling,OceanologicaActa,5,31-40,1982.10
Fiuza,A.A.andFrouin,T.B.R.:ObservationsofaWarmOceanicCurrentFlowingNorthward
alongtheCoastsOfPotugalandSpainDuringNov-Dec1983,Eos,Transactions,American
GeophysicalUnion,67,1054,1986.
Frankcombe,L.M.,Heydt,A.v.d.,andDijkstra,H.A.:NorthAtlanticMultidecadalClimate
Variability:AnInvestigationofDominantTimeScalesandProcesses,JournalofClimate,23,3616-15
3638,2010.
Garel,E.,Laiz,I.,Drago,T.,andRelvas,P.:Characterisationofcoastalcounter-currentsonthe
innershelfoftheGulfofCadiz,JournalofMarineSystems,155,19-34,2016.
Giorgi,F.:Climatechangehot-spots,GeophysicalResearchLetters,33,n/a-n/a,2006.
Gómez-GesteiraM,deCastroM,A.I.,andJL,G.-G.:Coastalseasurfacetemperaturewarmingtrend20
alongthecontinentalpartoftheAtlanticArc(1985−2005).JGeophysRes,113,2008.
Gouveia,C.,Trigo,R.M.,DaCamara,C.C.,Libonati,R.,andPereira,J.M.C.:TheNorthAtlantic
OscillationandEuropeanvegetationdynamics.,Int.J.Climatol,28,2008.
Gray,S.T.,Graumlich,L.J.,Betancourt,J.L.,andPederson,G.T.:Atree-ringbasedreconstruction
oftheAtlanticMultidecadalOscillationsince1567A.D.,GEOPHYSICALRESEARCHLETTERS,31,25
L12205,doi:12210.11029/12004GL019932,2004.
Guerreiro,C.,Oliveira,A.,deStigter,H.,Cachão,M.,Sá,C.,Borges,C.,Cros,L.,Santos,A.,Fortuño,J.-
M.,andRodrigues,A.:LatewintercoccolithophorebloomoffcentralPortugalinresponsetoriver
dischargeandupwelling,ContinentalShelfResearch,59,65-83,2013.
Guiot,J.,WuHB,GarretaV,HattéC,andM,M.:Afewprospectiveideasonclimatereconstruction:30
fromastatisticalsingleproxyapproachtowardsamulti-proxyanddynamicalapproach,Climate
ofthePast2009.5:571–583,2009.
Häkkinen,S.,Rhines,P.B.,andWorthen,D.L.:AtmosphericblockingandAtlanticmultidecadal
oceanvariability,Science,334,655–659,2011.
Clim. Past Discuss., doi:10.5194/cp-2017-39, 2017Manuscript under review for journal Clim. PastDiscussion started: 16 March 2017c© Author(s) 2017. CC-BY 3.0 License.
25
Häkkinen,S.,Rhines,P.B.,andWorthen,D.L.:NorthernNorthAtlanticseasurfaceheightand
oceanheatcontentvariability
,J.Geophys.Res.,118,3670–3678,2013.
Hegerl,G.C.,Crowley,T.J.,Hyde,W.T.,andFrame,D.J.:Climatesensitivityconstrainedby
temperaturereconstructionsoverthepastsevencenturies,Nature,440,1029-1032,2006.5
Hernández,A.,Trigo,R.M.,Pla-Rabes,S.,Valero-Garcés,B.L.,Jerez,S.,Rico-Herrero,M.,Vega,J.C.,
Jambrina-Enríquez,M.,andGiralt,S.:SensitivityoftwoIberianlakestoNorthAtlantic
atmosphericcirculationmodes,ClimateDynamics,45,3403-3417,2015.
Hurrell,J.:DecadaltrendsintheNorthAtlanticOscillation-regionaltemperaturesand
precipitation.,Science,269,679,1995.10
Iglesias,I.,Avilez-Valente,P.,Couvelard,X.,andCaldeira,R.:GeostrophicinfluenceintheRiver
Douroplume:aclimatological
study,Porto2014,75-80.
IPCC:AnnexII:ClimateSystemScenarioTablesIn:ClimateChange2013:ThePhysicalScience
Basis.ContributionofWorkingGroupItotheFifthAssessmentReportoftheIntergovernmental15
PanelonClimateChange,Stocker,T.F.,Qin,D.,Plattner,G.-K.,Tignor,M.,Allen,S.K.,Boschung,J.,
Nauels,A.,Xia,Y.,Bex,V.,andMidgley,P.M.(Eds.),CambridgeUniversityPress,Cambridge,
UnitedKingdomandNewYork,NY,USA,2013a.
IPCC:ClimateChange2013:ThePhysicalScienceBasis.ContributionofWorkingGroupItothe
FifthAssessmentReportoftheIntergovernmentalPanelonClimateChange,Cambridge20
UniversityPress,Cambridge,UnitedKingdomandNewYork,NY,USA,2013b.
Jambrina-Enríquez,M.,Sachse,D.,andValero-Garcés,B.L.:AdeglaciationandHolocene
biomarker-basedreconstructionofclimateandenvironmentalvariabilityinNWIberian
Peninsula:theSanabriaLakesequence,JournalofPaleolimnology,56,49-66,2016.
Jerez,S.andTrigo,R.M.:Time-scaleandextentatwhichlarge-scalecirculationmodesdetermine25
thewindandsolarpotentialintheIberianPeninsula,EnvironmentalResearchLetters,8,044035,
2013.
Jones,P.D.,Osborn,T.J.,andBriffa,K.R.:TheEvolutionofClimateOvertheLastMillenium.,
Science,292,662-667,2001.
Keigwin,L.andPickart,R.:SlopeWaterCurrentovertheLaurentianFanonInterannualto30
MillenialTimeScales.,Science,286,520-523,1999.
Lebreiro,S.M.,Francés,G.,Abrantes,F.F.G.,Diz,P.,Bartels-Jónsdóttir,H.B.,Stroynowski,Z.N.,
Gil,I.M.,Pena,L.D.,Rodrigues,T.,Jones,P.D.,Nombela,M.A.,Alejo,I.,Briffa,K.R.,Harris,I.,and
Grimalt,J.O.:ClimatechangeandcoastalhydrographicresponsealongtheAtlanticIberianmargin
Clim. Past Discuss., doi:10.5194/cp-2017-39, 2017Manuscript under review for journal Clim. PastDiscussion started: 16 March 2017c© Author(s) 2017. CC-BY 3.0 License.
26
(TagusProdeltaandMurosRía)duringthelasttwomillennia,TheHolocene,16,1003-1015,
2006.
Lionello,P.,Malanott-Rizzoli,R.,Boscolo,R.,Alpert,P.,Artale,V.,Li,L.,Luterbacher,J.,May,W.,
Trigo,R.,Tsimplis,M.,Ulbrich,U.,andXoplaki,E.T.:TheMediterraneanclimate:Anoverviewof
themaincharacteristicsandissues.In:MediterraneanClimateVariability(MedClivar),Elsevier,5
Amsterdam,2006.
Lisiecki,L.E.andRaymo,M.E.:APliocene-Pleistocenestackof57globallydistributedbenthic
D18Orecords,Paleoceanography,20,2005.
Luterbacher,J.,Dietrich,D.,Xoplaki,E.,Grosjean,M.,andWanner,H.:EuropeanSeasonaland
AnnualTemperatureVariability,Trends,10
andExtremesSince1500,Science,303,DOI:10.1126/science.1093877,2004.
Luterbacher,J.,Werner,J.P.,Smerdon,J.E.,Fernández-Donado,L.,González-Rouco,F.J.,
Barriopedro,D.,Ljungqvist,F.C.,Büntgen,U.,Zorita,E.,Wagner,S.,Esper,J.,McCarroll,D.,Toreti,
A.,Frank,D.,Jungclaus,J.H.,Barriendos,M.,Bertolin,C.,Bothe,O.,Brázdil,R.,Camuffo,D.,
Dobrovolný,P.,Gagen,M.,García-Bustamante,E.,Ge,Q.,Gómez-Navarro,J.J.,Guiot,J.,Hao,Z.,15
Hegerl,G.C.,Holmgren,K.,Klimenko,V.V.,Martín-Chivelet,J.,Pfister,C.,Roberts,N.,Schindler,A.,
Schurer,A.,Solomina,O.,Gunten,L.v.,Wahl,E.,Wanner,H.,Wetter,O.,Xoplaki,E.,Yuan,N.,
Zanchettin,D.,Zhang,H.,andZerefos,C.:EuropeansummertemperaturessinceRomantimes,
EnvironmentalResearchLetters,11,024001,2016.
Luterbacher,J.,Xoplaki,E.,Dietrich,D.,Jones,P.D.,Davies,T.D.,Portis,D.,Gonzalez-Rouco,J.F.,20
vonStorch,H.,Gyalistras,D.,Casty,C.,andWanner,H.:ExtendingNorthAtlanticOscillation
ReconstructionsBackto1500,AtmosphericScienceLetters,2,114-124,2002.
Mann,M.E.,Zhang,Z.,Rutherford,S.,Bradley,R.S.,Hughes,M.K.,Shindell,D.,Ammann,C.,
Faluvegi,G.,andNi.,F.:GlobalSignaturesandDynamicalOriginsoftheLittleIceAgeandMedieval
ClimateAnomaly,Science,326,1256-1260,2010.25
Marchal,O.:Optimalestimationofatmospheric14CproductionovertheHolocene:paleoclimate
implications,ClimateDynamics,24,71-88,2005.
Marshall,J.andal,e.:NorthAtlanticclimatevariability:Phenomena,impactsandMechanisms,
InternationalJournalofClimatology,21,1863-1898,2001.
Marta-Almeida,M.,Dubert,J.,andPeliz,Á.:Simulationsofextremeshelfcurrent30
alongtheNorth-WesternIberianShelfforcedbywindandriverrunoff.,Valencia,Spain2002,
1555–1559.
Martín-Chivelet,J.,Muñoz-García,M.B.,Edwards,R.L.,Turrero,M.J.,andOrtega,A.I.:Land
surfacetemperaturechangesinNorthernIberiasince4000yrBP,basedonδ13Cofspeleothems,
GlobalandPlanetaryChange,77,1-12,2011.35
Clim. Past Discuss., doi:10.5194/cp-2017-39, 2017Manuscript under review for journal Clim. PastDiscussion started: 16 March 2017c© Author(s) 2017. CC-BY 3.0 License.
27
Martín-Puertas,C.,Jiménez-Espejo,F.,Martínez-Ruiz,F.,Nieto-Moreno,V.,Rodrigo,M.,Mata,M.P.,
andValero-Garcés,B.L.:LateHoloceneclimatevariabilityinthesouthwesternMediterranean
region:anintegratedmarineandterrestrialgeochemicalapproach,Clim.Past,6,807–816,2010.
Marullo,S.,Artale,V.,andSantoleri,R.:TheSSTMultidecadalVariabilityintheAtlantic–
MediterraneanRegionandItsRelationtoAMO,JournalofClimate,24,4385-4401,2011.5
Masson-Delmotte,V.,Schulz,M.,Abe-Ouchi,A.,Beer,J.,Ganopolski,A.,GonzálezRouco,J.F.,
Jansen,E.,Lambeck,K.,Luterbacher,J.,Naish,T.,Osborn,T.,Otto-Bliesner,B.,Quinn,T.,Ramesh,
R.,Rojas,M.,Shao,X.,andTimmermann,A.:InformationfromPaleoclimateArchives.In:Climate
Change2013:ThePhysicalScienceBasis.ContributionofWorkinggroupItotheFifthAssessment
ReportoftheIntergovernmentalPanelonClimateChange,F.,S.T.,Qin,D.,Platnner,G.-H.,Tignor,10
M.,Allen,S.K.,Boschung,J.,Nauels,A.,Xia,Y.,Bex,V.,andMidgley,P.M.(Eds.),Cambridge
UniversityPress,Cambridge,UnitedKingdomandNewYork,NY,USA,2013.
McGregor,H.V.,Evans,M.N.,Goosse,H.,Leduc,G.,Martrat,B.,Addison,J.A.,Mortyn,P.G.,Oppo,
D.W.,Seidenkrantz,M.-S.,Sicre,M.-A.,Phipps,S.J.,Selvaraj,K.,Thirumalai,K.,Filipsson,H.L.,and
Ersek,V.:Robustglobaloceancoolingtrendforthepre-industrialCommonEra,NatureGeosci,8,15
671-677,2015.
McKim,D.K.:CommonEraentry,WestminsterJohnKnoxPress,Louisville,Kentucky,1998.
Mendes,R.,Sousa,M.C.,deCastro,M.,Gómez-Gesteira,M.,andDias,J.M.:Newinsightsintothe
WesternIberianBuoyantPlume:InteractionbetweentheDouroandMinhoRiverplumesunder
winterconditions,ProgressinOceanography,141,30-43,2016.20
Miranda,P.,M.A.,Coelho,F.E.S.,Tomé,A.R.,Valente,M.A.,Carvalho,A.,Pires,C.,Pires,H.O.,
Pires,V.C.,andRamalho,C.:20thCenturyPortugueseClimateandClimateScenarios.In:Climate
ChangesinPortugal:Scenarios,ImpactsandAdaptationMeasures(SIAMProject),Santos,F.D.,
Forbes,K.,andMoita,R.(Eds.),Gradiva,2002.
Moberg,A.,Sonechkin,D.M.,Holmgren,K.,Datsenko,N.M.,andKarlén,W.H.:Highlyvariable25
NorthernHemispheretemperaturesreconstructedfromlow-andhigh-resolutiondata,Nature,
433,613-617,2005.
Moita,T.:Estrutura,VariabilidadeeDinamicadoFitoplanctonnaCostadePortugalContinental.,
2001.articlecompilation,FaculdadedeCienciasdaUniversidadedeLisboa,UniversityofLisbon,
Lisbon,272pp.,2001.30
Moore,P.D.,Webb,J.A.,andCollinson,M.E.:Pollenanalysis,Blackwellscientificpublication,
Oxford,1991.
Morellón,M.,Valero-GarcÉS,B.,Anselmetti,F.,Ariztegui,D.,Schnellmann,M.,Moreno,A.N.A.,
Mata,P.,Rico,M.,andCorella,J.P.:LateQuaternarydepositionandfaciesmodelforkarsticLake
Estanya(North-easternSpain),Sedimentology,56,1505-1534,2009.35
Clim. Past Discuss., doi:10.5194/cp-2017-39, 2017Manuscript under review for journal Clim. PastDiscussion started: 16 March 2017c© Author(s) 2017. CC-BY 3.0 License.
28
Moreno,A.,Morellón,M.,Martín-Puertas,C.,Frigola,J.,Canals,M.,Cacho,I.,Corella,J.P.,Pérez,A.,
Belmonte,Á.,Vegas-Vilarrúbia,T.,González-Sampériz,P.,andValero-Garcés,B.L.:Wastherea
commonhydrologicalpatternintheIberianPeninsularegionduringtheMedievalClimate
Anomaly?,PAGESnews,19,16-18,2011.
Moreno,A.,Valero-Garcés,B.L.,González-Sampériz,P.,andRico,M.:Floodresponsetorainfall5
variabilityduringthelast2000yearsinferredfromtheTaravillaLakerecord(CentralIberian
Range,Spain),JournalofPaleolimnology,40,943-961,2008.
Müller,P.J.,Kirst,G.,Ruhland,G.,vonStorch,I.,andRosell-Meré,A.:Calibrationofthealkenone
paleotemperatureindexUK’37basedoncore-popsfromtheeasternSouthAtlanticandtheglobal
ocean(60ºN-60ºS),GeochimicaetCosmochimicaActa,62,1757-1772,1998.10
Naughton,F.,SanchezGoñi,M.F.,Desprat,S.,Turon,J.L.,Duprat,J.,Malaizé,B.,Joli,C.,Cortijo,E.,
Drago,T.,andFreitas,M.C.:Present-dayandpast(last25000years)marinepollensignaloff
westernIberia,MarineMicropaleontology,62,91-114,2007.
Naughton,F.,SánchezGoñi,M.F.,Kageyama,M.,Bard,E.,Cortijo,E.,Desprat,S.,Duprat,J.,Malaizé,
B.,Joli,C.,Rostek,F.,andTuron,J.-L.:WettodryclimatictrendinnorthwesternIberiawithin15
Heinrichevents,EarthandPlanetaryScienceLetters,284,329-342,2009.
Oliveira,P.B.,Moita,T.,Catarino,R.,andSilva,A.J.d.:WintertimeSSTandChlaoffNWIberian
shelffromsatelliteandinsitudata,Amsterdam,24–28September2007,2007.
Otero,P.,Ruiz-Villarreal,M.,andPeliz,A.:VariabilityofriverplumesoffNorthwestIberiain
responsetowindevents,JournalofMarineSystems,72,238-255,2008.20
Palter,J.B.:TheRoleoftheGulfStreaminEuropeanClimate.,Annu.Rev.MarineSci.,7,113–137,
2015.
Pardo,P.C.,Padín,X.A.,Gilcoto,M.,Farina-Busto,L.,andPérez,F.F.:Evolutionofupwelling
systemscoupledtothelong-termvariabilityinseasurfacetemperatureandEkmantransport,
ClimateResearch,48,231:246,2011.25
Peliz,Á.:Fronts,jets,andcounter-flowsintheWesternIberianupwellingsystem,Journalof
MarineSystems,35,61-77,2002.
Peliz,Á.,Dubert,J.,Santos,A.M.P.,Oliveira,P.B.,andLeCann,B.:Winterupperoceancirculation
intheWesternIberianBasin—Fronts,EddiesandPolewardFlows:anoverview,DeepSea
ResearchPartI:OceanographicResearchPapers,52,621-646,2005.30
Pena,L.D.,Francés,G.,Diz,P.,Esparza,M.,Grimalt,J.O.,Nombela,M.A.,andAlejo,I.:Climate
fluctuationsduringtheHoloceneinNWIberia:Highandlowlatitudelinkages,ContinentalShelf
Research,30,1487-1496,2010.
Clim. Past Discuss., doi:10.5194/cp-2017-39, 2017Manuscript under review for journal Clim. PastDiscussion started: 16 March 2017c© Author(s) 2017. CC-BY 3.0 License.
29
Pérez,F.F.,Padín,X.,Pazos,Y.,Gilcoto,M.,Cabanas,J.M.,Pardo,P.,Doval,D.,andFarina-Bustos,L.:
PlanktonresponsetoweakningoftheIberiancoastalupwelling,GlobalChangeBiology,16,1258-
1267,2010.
RCoreTeam:Alanguageandenvironmentforstatisticalcomputing.RFoundationforStatistical
Computing,.Vienna,Austria,2013.5
Reille,M.:Pollenetsporesd'Europeetd'AfriqueduNord,Laboratoiredebotaniquehistoriqueet
palynologie,Marseille,1992.
Reimer,P.,Baillie,M.,Bard,E.,Bayliss,A.,Beck,J.,Bertrand,C.,Blackwell,P.,Buck,C.,Burr,G.,
Cutler,K.,Damon,P.,Edwards,R.,Fairbanks,R.,Friedrich,M.,Guilderson,T.,Hughen,K.,Kromer,
B.,McCormac,F.,Manning,Ramsey,C.B.,Reimer,R.,Remmele,S.,Southon,J.,Stuiver,M.,Talamo,10
S.,Taylor,F.,Plicht,J.v.d.,andWeyhenmeyer,C.:Marine04Marineradiocarbonagecalibration,
26-0kaBP,Radiocarbon,46,1029-1058,2004.
Relvas,P.andBarton,E.D.:MesoscalepatternsintheCapeSãoVicente(IberianPeninsula)
upwellingregion,JournalofGeophysicalResearch,107,28/21-23,2002.
Relvas,P.,Luıs,J.,andSantos,A.M.P.:Importanceofthemesoscaleinthedecadalchanges15
observedinthenorthernCanaryupwellingsystem,Geophys.Res.Lett.,36,L226012009.
Rodrigues,T.,Grimalt,J.O.,Abrantes,F.G.,Flores,J.A.,andLebreiro,S.M.:Holocene
interdependencesofchangesinseasurfacetemperature,productivity,andfluvialinputsinthe
Iberiancontinentalshelf(Tagusmudpatch),Geochemistry,Geophysics,Geosystems,10,n/a-n/a,
2009.20
Romero-Viana,L.,Julià,R.,Schimmel,M.,Camacho,A.,Vicente,E.,andMiracle,M.R.:
ReconstructionofannualwinterrainfallsinceA.D.1579incentraleasternSpainbasedoncalcite
laminatedsedimentfromLakeLaCruz,ClimateChange,107,343-361,2011.
Sabine,C.L.:TheOceanicSinkforAnthropogenicCO2,Science,305,367-371,2004.
Saenger,C.,Came,R.E.,Oppo,D.W.,Keigwin,L.D.,andCohen,A.L.:Regionalclimatevariabilityin25
thewesternsubtropicalNorthAtlanticduringthepasttwomillennia,Paleoceanography,26,n/a-
n/a,2011.
Sánchez,R.F.andRelvas,P.:Spring–summerclimatologicalcirculationintheupperlayerinthe
regionofCapeSt.Vincent,SouthwestPortugal
,ICESJ.Mar.Sci.,60,1232-1250,2003.30
Sánchez-López,G.,Hernández,A.,Pla-Rabes,S.,Trigo,R.M.,Toro,M.,Granados,I.,Sáez,A.,
Masqué,P.,Pueyo,J.J.,Rubio-Inglés,M.J.,andGiralt,S.:Climatereconstructionforthelasttwo
millenniaincentralIberia:TheroleofEastAtlantic(EA),NorthAtlanticOscillation(NAO)and
theirinterplayovertheIberianPeninsula,QuaternaryScienceReviews,149,135-150,2016.
Clim. Past Discuss., doi:10.5194/cp-2017-39, 2017Manuscript under review for journal Clim. PastDiscussion started: 16 March 2017c© Author(s) 2017. CC-BY 3.0 License.
30
Schurer,A.P.,Tett,S.F.B.,andHegerl,G.C.:Smallinfluenceofsolarvariabilityonclimateoverthe
pastmillennium,NatureGeoscience,7,104-108,2014.
Solanki,S.K.,Usoskin,I.G.,Kromer,B.,Schüssler,M.,andBeer,J.:AnunusuallyactiveSunduring
recentdecadescomparedtotheprevious11,000years,Nature,431,1084-1087,2004.
Steinhilber,F.,Abreu,J.A.,Beer,J.,Brunner,I.,Christl,M.,Fischer,H.,Heikkilä,U.,Kubik,P.W.,5
Mann,M.,McCracken,K.G.,H.Miller,Miyahara,H.,Oerter,H.,andWilhelms,F.:9,400yearsof
cosmicradiationandsolaractivityfromicecoresandtreerings.,ProceedingsoftheNational
AcademyofSciences,doi:doi:10.1073/pnas.11189651092012.2012.
Stocker,T.andMysak,L.:Climaticfluctuationsonthecenturytimescale:Areviewofhigh
resolutionproxydataandpossiblemechanisms,ClimaticChange,20,227-250,1992.10
Teles-Machado,A.,Peliz,Á.,McWilliams,J.C.,Cardoso,R.M.,Soares,P.M.M.,andMiranda,P.M.
A.:Ontheyear-to-yearchangesoftheIberianPolewardCurrent,JournalofGeophysicalResearch:
Oceans,120,4980-4999,2015.
Torrence,C.andCompo,G.P.:Apracticalguidetowaveletanalysis,BulletinoftheAmerican
MeteorologicalSociety,79,61-78,1998.15
Touchan,R.,Xoplaki,E.,Funkhouser,G.,Luterbacher,J.,Hughes,M.K.,Erkan,N.,Akkemik,Ü.,and
Stephan,J.:ReconstructionsofSpring/SummerPrecipitationfortheEasternMediterraneanfrom
Tree-RingWidthsanditsConnectiontoLarge-ScaleAtmosphericCirculation,ClimateDynamics,
25,75-98,2005.
Trigo,R.M.andDaCamara,C.C.:CirculationWeatherTypesandTheirinfluenceonthe20
PrecipitationRegimeinPortugal,InternationalJournalofClimatology,20,1559-1581,2000.
Trigo,R.M.,Pozo-Vázquez,D.,Osborn,T.J.,Castro-Díez,Y.,Gámiz-Fortis,S.,andEsteban-Parra,M.
J.:NorthAtlanticoscillationinfluenceonprecipitation,riverflowandwaterresourcesinthe
IberianPeninsula,InternationalJournalofClimatology,24,925-944,2004.
Trouet,V.,Esper,J.,Graham,N.E.,Baker,A.,Scourse,J.D.,andFrank,D.C.:PersistentPositive25
NorthAtlanticOscillationModeDominatedtheMedievalClimateAnomaly,Science,324,78,2009.
Tullot,I.:HistoricaldocumentationofSpain'sclimate,Madrid,1988.
Turner,T.E.,Swindles,G.T.,Charman,D.J.,Langdon,P.G.,Morris,P.J.,Booth,R.K.,Parry,L.E.,
andNichols,J.E.:Solarcyclesorrandomprocesses?EvaluatingsolarvariabilityinHolocene
climaterecords,ScientificReports,6,23961,2016.30
Usoskin,I.G.,Solanki,S.K.,andKovaltsov,G.A.:Grandminimaofsolaractivityduringthelast
millennia,ProceedingsoftheInternationalAstronomicalUnion,7,372-382,2011.
Valero-Garcés,B.L.,González-Sampériz,P.,Navas,A.,Machín,J.,Mata,P.,Delgado-Huertas,A.,Bao,
R.,Moreno,A.,Carrión,J.S.,Schwalb,A.,andGonzález-Barrios,A.:HumanImpactSinceMedieval
Clim. Past Discuss., doi:10.5194/cp-2017-39, 2017Manuscript under review for journal Clim. PastDiscussion started: 16 March 2017c© Author(s) 2017. CC-BY 3.0 License.
31
TimesandRecentEcologicalRestorationinaMediterraneanLake:TheLagunaZoñar,Southern
Spain,JournalofPaleolimnology,35,441-465,2006.
Varzeano,J.:HáumséculoagrandecheiadoGuadianaprovocoutragédiaemAlcoutim.In:Jornal
doAlgarve,VilaRealdeSantoAntónio,1976.
Villanueva,J.:Estudidelesvariacionesclimàtiquesioceanogràfiquesal`atlanticNordDurantels5
últims300.000anysmitjançantl`análisidemarcadoresmoleculars,1996.Dep.Química
Ambiental,UniversitatdeBarcelona,Barcelona,186pp.,1996.
Villanueva,J.andet,a.:AbiomarkerapproachtotheorganicmatterdepositedintheNorth
Atlanticduringthelastclimaticcycle,GeochimicaetCosmochimicaActa,61,4633-4646,1997.
Villanueva,J.andGrimalt,J.O.:GasChromatographicTuningoftheUK37Paleothermometer,10
AnalyticalChemistry,69,3329-3332,1997.
Vinther,B.M.,K.K.Andersen,A.W.Hansen,T.Schmith,andJones,P.D.:Improvingthe
Gibraltar/ReykjavikNAOindex,GEOPHYSICALRESEARCHLETTERS,30,
doi:10.1029/2003GL018220,2003.
Wang,C.andDong,S.:Isthebasin-widewarmingintheNorthAtlanticOceanrelatedto15
atmosphericcarbondioxideandglobalwarming?,GeophysicalResearchLetters,37,n/a-n/a,
2010.
Yamamoto,A.andPalter,J.B.:TheabsenceofanAtlanticimprintonthemultidecadalvariability
ofwintertimeEuropeantemperature,NatureCommunications,7,10930,2016.
Zampieri,M.,Toreti,A.,Schindler,A.,Scoccimarro,E.,andGualdi,S.:Atlanticmulti-decadal20
oscillationinfluenceonweatherregimesoverEuropeandtheMediterraneaninspringand
summer,GlobalandPlanetaryChange,doi:http://dx.doi.org/10.1016/j.gloplacha.2016.08.014,
2016.2016.
Zhang,R.:AnticorrelatedmultidecadalvariationsbetweensurfaceandsubsurfacetropicalNorth
Atlantic,GeophysicalResearchLetters,34,n/a-n/a,2007.25
Clim. Past Discuss., doi:10.5194/cp-2017-39, 2017Manuscript under review for journal Clim. PastDiscussion started: 16 March 2017c© Author(s) 2017. CC-BY 3.0 License.
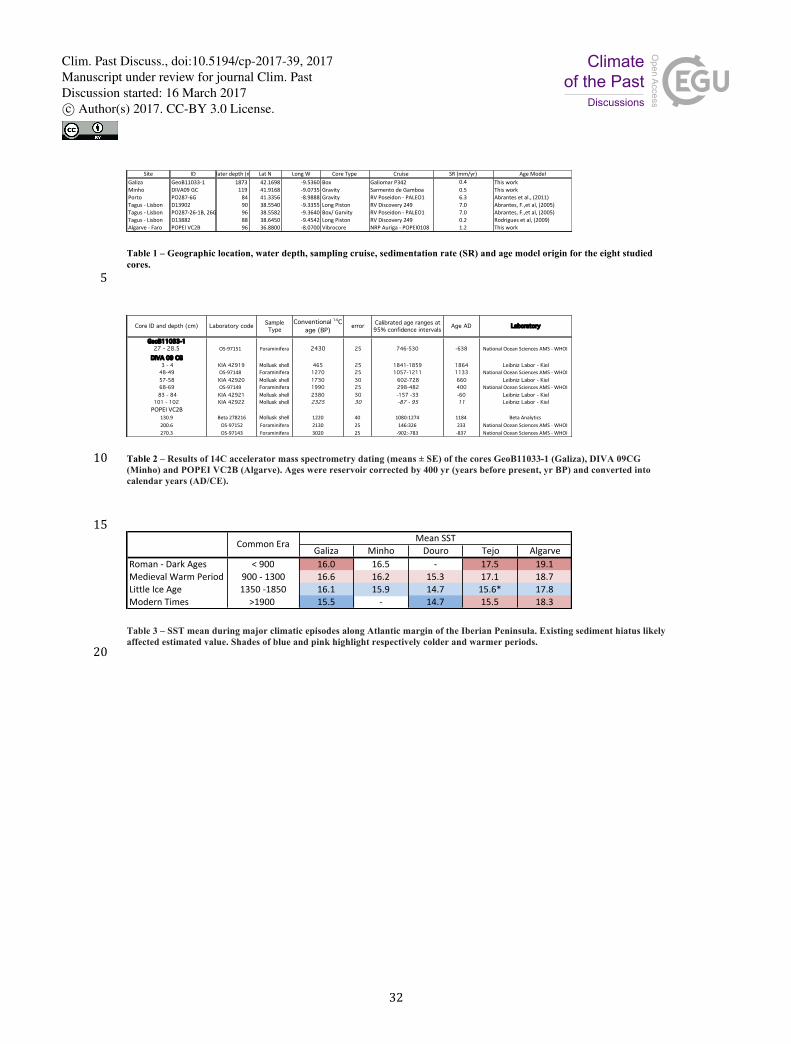
32
Table 1 – Geographic location, water depth, sampling cruise, sedimentation rate (SR) and age model origin for the eight studied cores. 5
Table 2 – Results of 14C accelerator mass spectrometry dating (means ± SE) of the cores GeoB11033-1 (Galiza), DIVA 09CG 10(Minho) and POPEI VC2B (Algarve). Ages were reservoir corrected by 400 yr (years before present, yr BP) and converted into calendar years (AD/CE). 15
Table 3 – SST mean during major climatic episodes along Atlantic margin of the Iberian Peninsula. Existing sediment hiatus likely affected estimated value. Shades of blue and pink highlight respectively colder and warmer periods. 20
Site ID Waterdepth(m) LatN LongW CoreType Cruise SR(mm/yr) AgeModel
Galiza GeoB11033-1 1873 42.1698 -9.5360 Box GaliomarP342 0.4 ThisworkMinho DIVA09GC 119 41.9168 -9.0735 Gravity SarmentodeGamboa 0.5 ThisworkPorto PO287-6G 84 41.3356 -8.9888 Gravity RVPoseidon-PALEO1 6.3 Abrantesetal.,(2011)Tagus-Lisbon D13902 90 38.5540 -9.3355 LongPiston RVDiscovery249 7.0 Abrantes,F.,etal,(2005)Tagus-Lisbon PO287-26-1B,26G 96 38.5582 -9.3640 Box/Garvity RVPoseidon-PALEO1 7.0 Abrantes,F.,etal,(2005)Tagus-Lisbon D13882 88 38.6450 -9.4542 LongPiston RVDiscovery249 0.2 Rodriguesetal,(2009)Algarve-Faro POPEIVC2B 96 36.8800 -8.0700 Vibrocore NRPAuriga-POPEI0108 1.2 Thiswork
Core ID and depth (cm) Laboratory code Sample Type
Conventional 14C age (BP) error Calibrated age ranges at
95% confidence intervals Age AD Laboratory
GeoB11033-127 - 28.5 OS-97151 Foraminifera 2430 25 746-530 -638 NationalOceanSciencesAMS-WHOI
DIVA 09 CG 3 - 4 KIA 42919 Mollusk shell 465 25 1841-1859 1864 Leibniz Labor - Kiel48-49 OS-97148 Foraminifera 1270 25 1057-1211 1133 NationalOceanSciencesAMS-WHOI57-58 KIA 42920 Mollusk shell 1730 30 602-728 660 Leibniz Labor - Kiel68-69 OS-97149 Foraminifera 1990 25 298-482 400 NationalOceanSciencesAMS-WHOI
83 - 84 KIA 42921 Mollusk shell 2380 30 -157 -33 -60 Leibniz Labor - Kiel101 - 102 KIA 42922 Mollusk shell 2325 30 -87 - 95 11 Leibniz Labor - KielPOPEIVC2B
130.9 Beta278216 Mollusk shell 1220 40 1080:1274 1184 BetaAnalytics200.6 OS-97152 Foraminifera 2130 25 146:326 233 NationalOceanSciencesAMS-WHOI270.3 OS-97143 Foraminifera 3020 25 -902:-783 -837 NationalOceanSciencesAMS-WHOI
Galiza Minho Douro Tejo AlgarveRoman-DarkAges <900 16.0 16.5 - 17.5 19.1MedievalWarmPeriod 900-1300 16.6 16.2 15.3 17.1 18.7LittleIceAge 1350-1850 16.1 15.9 14.7 15.6* 17.8ModernTimes >1900 15.5 - 14.7 15.5 18.3
MeanSSTCommonEra
Clim. Past Discuss., doi:10.5194/cp-2017-39, 2017Manuscript under review for journal Clim. PastDiscussion started: 16 March 2017c© Author(s) 2017. CC-BY 3.0 License.
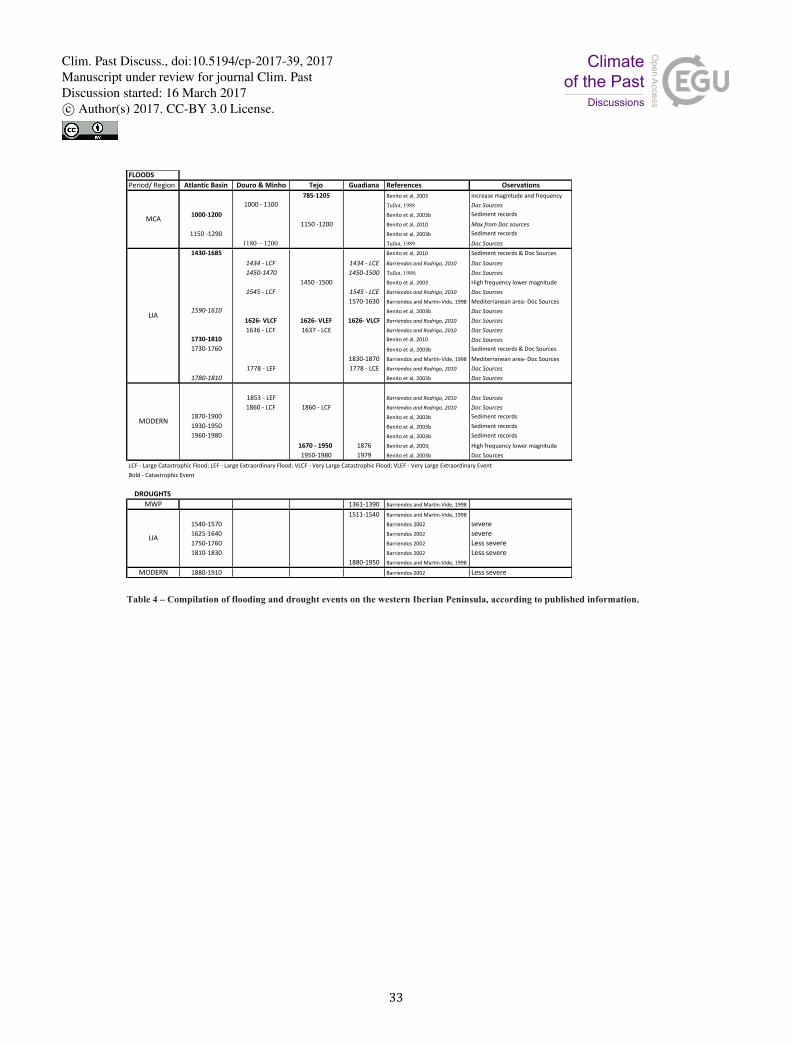
33
Table 4 – Compilation of flooding and drought events on the western Iberian Peninsula, according to published information.
FLOODSPeriod/Region AtlanticBasin Douro&Minho Tejo Guadiana References Oservations
785-1205 Benitoetal,2003 Increasemagnitudeandfrequency1000-1100 Tullot, 1988 DocSources
1000-1200 Benitoetal,2003b Sedimentrecords1150-1200 Benitoetal,2010 MaxfromDocsources
1150-1290 Benitoetal,2003b Sedimentrecords1180 – 1200 Tullot, 1989 DocSources
1430-1685 Benitoetal,2010 Sedimentrecords&DocSources1434-LCF 1434-LCE BarriendosandRodrigo,2010 DocSources1450-1470 1450-1500 Tullot, 1988; DocSources
1450-1500 Benitoetal,2003 Highfrequencylowermagnitude1545-LCF 1545-LCE BarriendosandRodrigo,2010 DocSources
1570-1630 BarriendosandMartín-Vide,1998 Mediterraneanarea-DocSources1590-1610 Benitoetal,2003b DocSources
1626-VLCF 1626-VLEF 1626-VLCF BarriendosandRodrigo,2010 DocSources1636-LCF 1637-LCE BarriendosandRodrigo,2010 DocSources
1730-1810 Benitoetal,2010 DocSources1730-1760 Benitoetal,2003b Sedimentrecords&DocSources
1830-1870 BarriendosandMartín-Vide,1998 Mediterraneanarea-DocSources1778-LEF 1778-LCE BarriendosandRodrigo,2010 DocSources
1780-1810 Benitoetal,2003b DocSources
1853-LEF BarriendosandRodrigo,2010 DocSources1860-LCF 1860-LCF BarriendosandRodrigo,2010 DocSources
1870-1900 Benitoetal,2003b Sedimentrecords1930-1950 Benitoetal,2003b Sedimentrecords1960-1980 Benitoetal,2003b Sedimentrecords
1670-1950 1876 Benitoetal,2003; Highfrequencylowermagnitude1950-1980 1979 Benitoetal,2003b DocSources
LCF-LargeCatastrophicFlood;LEF-LargeExtraordinaryFlood;VLCF-VeryLargeCatastrophicFlood;VLEF-VeryLargeExtraordinaryEventBold-CatastrophicEvent
DROUGHTSMWP 1361-1390 BarriendosandMartín-Vide,1998
1511-1540 BarriendosandMartín-Vide,1998
1540-1570 Barriendos2002 severe1625-1640 Barriendos2002 severe1750-1760 Barriendos2002 Lesssevere1810-1830 Barriendos2002 Lesssevere
1880-1950 BarriendosandMartín-Vide,1998
MODERN 1880-1910 Barriendos2002 Lesssevere
LIA
MODERN
LIA
MCA
Clim. Past Discuss., doi:10.5194/cp-2017-39, 2017Manuscript under review for journal Clim. PastDiscussion started: 16 March 2017c© Author(s) 2017. CC-BY 3.0 License.
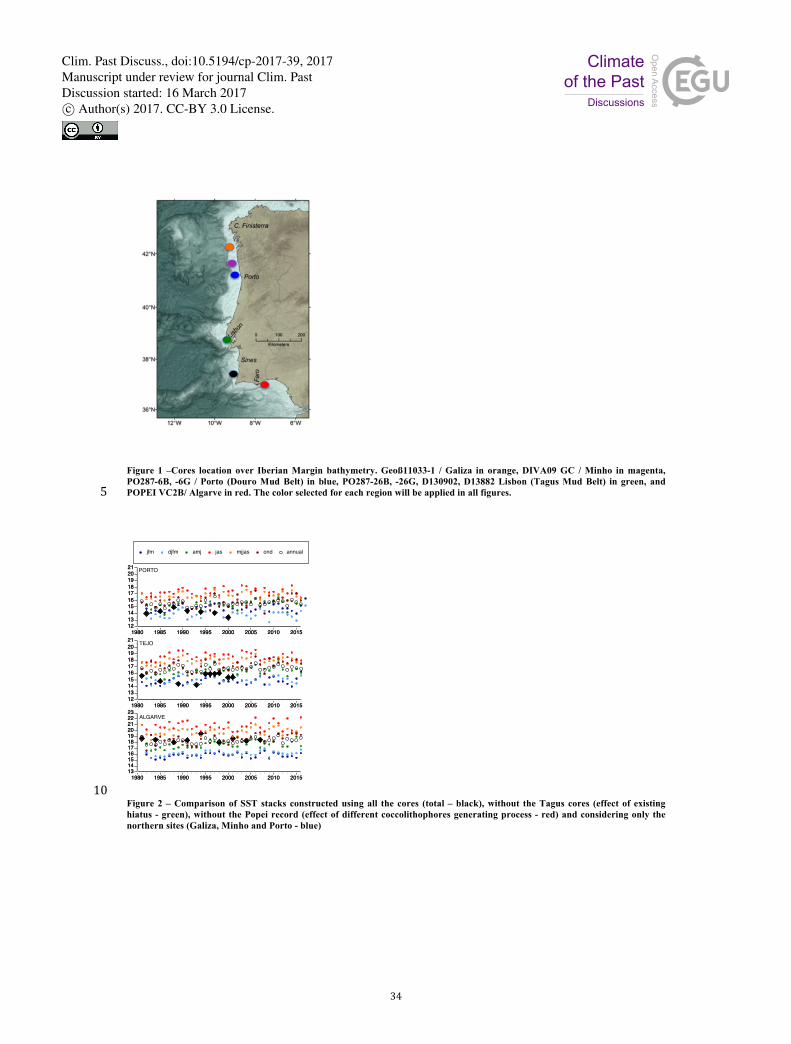
34
Figure 1 –Cores location over Iberian Margin bathymetry. Geoß11033-1 / Galiza in orange, DIVA09 GC / Minho in magenta,
PO287-26B, -26G, D130902, D13882 Lisbon (Tagus Mud Belt) in green, PO287-6B, -6G / Porto (Douro Mud Belt) in blue, and POPEI VC2B/ Algarve in red. The color selected for each region will be applied in all figures. 5
10Figure 2 – Comparison of SST stacks constructed using all the cores (total – black), without the Tagus cores (effect of existing hiatus - green), without the Popei record (effect of different coccolithophores generating process - red) and considering only the northern sites (Galiza, Minho and Porto - blue)
PORTO
12131415161718192021
1980 1985 1990 1995 2000 2005 2010 201512131415161718192021
1980 1985 1990 1995 2000 2005 2010 2015
ALGARVE
1314151617181920212223
1980 1985 1990 1995 2000 2005 2010 20151314151617181920212223
1980 1985 1990 1995 2000 2005 2010 2015
12131415161718192021
1980 1985 1990 1995 2000 2005 2010 2015
jfm djfm amj jas mjjas ond annual
TEJO
12131415161718192021
1980 1985 1990 1995 2000 2005 2010 2015
Clim. Past Discuss., doi:10.5194/cp-2017-39, 2017Manuscript under review for journal Clim. PastDiscussion started: 16 March 2017c© Author(s) 2017. CC-BY 3.0 License.
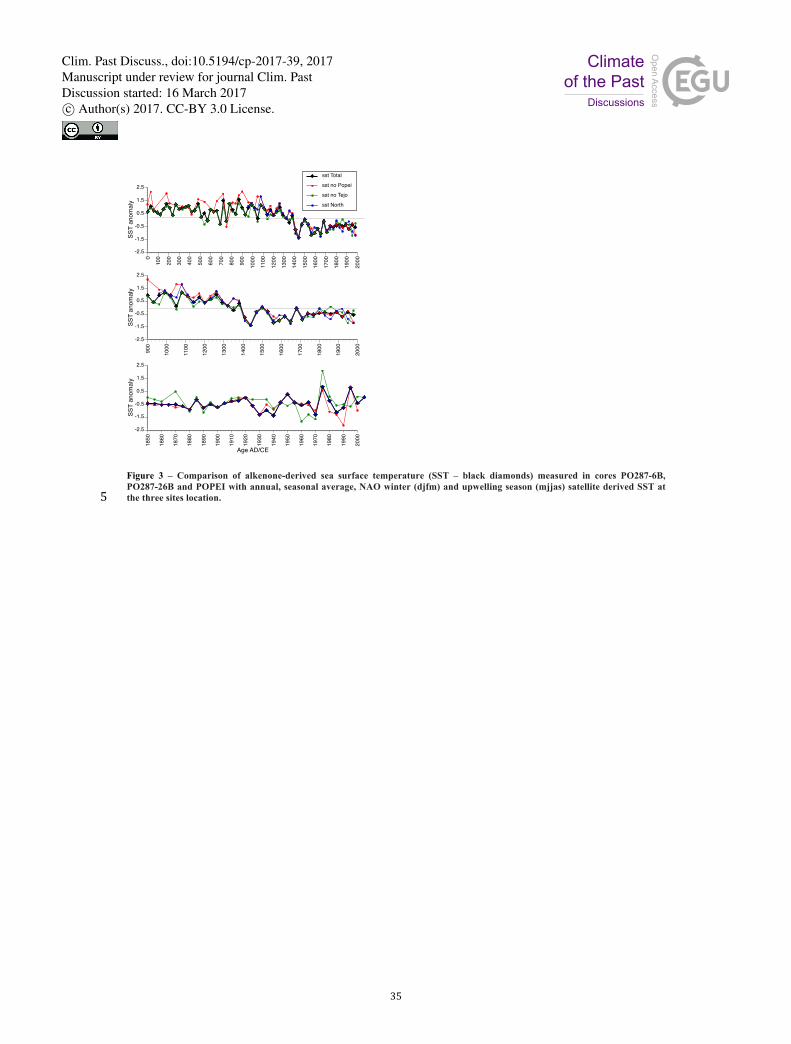
35
Figure 3 – Comparison of alkenone-derived sea surface temperature (SST – black diamonds) measured in cores PO287-6B, PO287-26B and POPEI with annual, seasonal average, NAO winter (djfm) and upwelling season (mjjas) satellite derived SST at the three sites location. 5
-2.5
-1.5
-0.5
0.5
1.5
2.5
0
100
200
300
400
500
600
700
800
900
1000
1100
1200
1300
1400
1500
1600
1700
1800
1900
2000
SST
anom
aly
sst Total
sst no Popei
sst no Tejo
sst North
-2.5
-1.5
-0.5
0.5
1.5
2.5
900
1000
1100
1200
1300
1400
1500
1600
1700
1800
1900
2000
SST
anom
aly
-2.5
-1.5
-0.5
0.5
1.5
2.5
1850
1860
1870
1880
1890
1900
1910
1920
1930
1940
1950
1960
1970
1980
1990
2000
SST
anom
aly
Age AD/CE
Clim. Past Discuss., doi:10.5194/cp-2017-39, 2017Manuscript under review for journal Clim. PastDiscussion started: 16 March 2017c© Author(s) 2017. CC-BY 3.0 License.
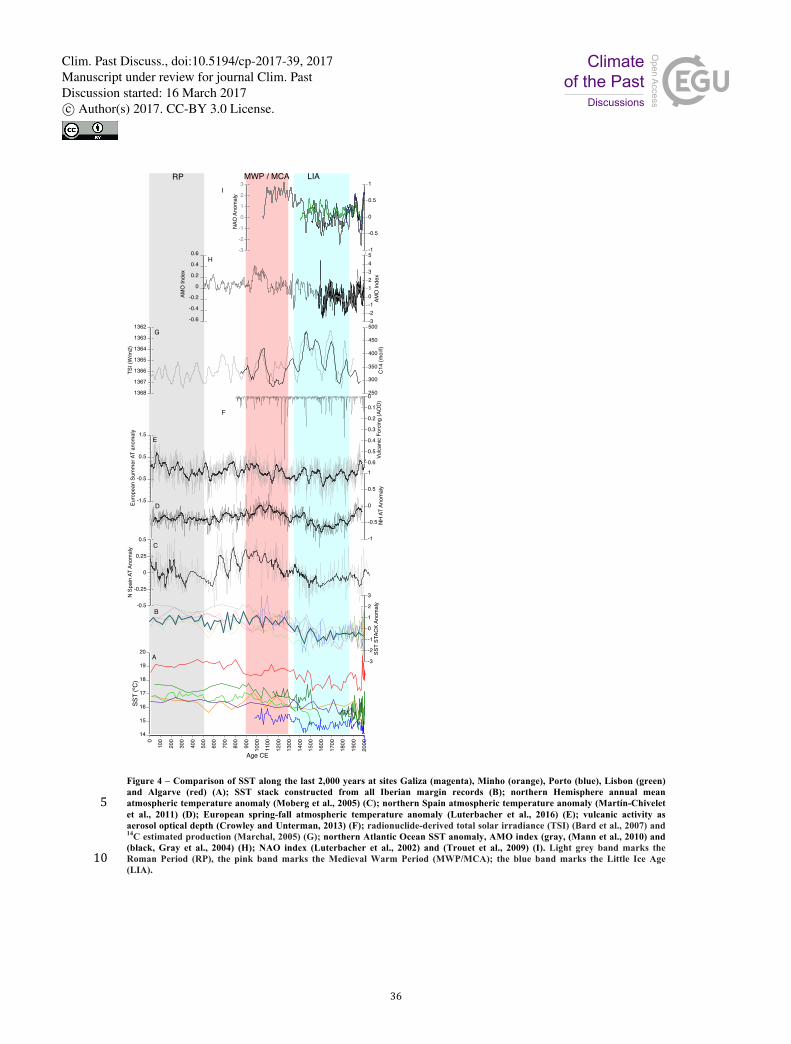
36
Figure 4 – Comparison of SST along the last 2,000 years at sites Galiza (magenta), Minho (orange), Porto (blue), Lisbon (green) and Algarve (red) (A); SST stack constructed from all Iberian margin records (B); northern Hemisphere annual mean atmospheric temperature anomaly (Moberg et al., 2005) (C); northern Spain atmospheric temperature anomaly (Martín-Chivelet 5et al., 2011) (D); European spring-fall atmospheric temperature anomaly (Luterbacher et al., 2016) (E); vulcanic activity as aerosol optical depth (Crowley and Unterman, 2013) (F); radionuclide-derived total solar irradiance (TSI) (Bard et al., 2007) and 14C estimated production (Marchal, 2005) (G); northern Atlantic Ocean SST anomaly, AMO index (gray, (Mann et al., 2010) and (black, Gray et al., 2004) (H); NAO index (Luterbacher et al., 2002) and (Trouet et al., 2009) (I). Light grey band marks the Roman Period (RP), the pink band marks the Medieval Warm Period (MWP/MCA); the blue band marks the Little Ice Age 10(LIA).
D
E
F
H
-1.5
-0.5
0.5
1.5
Euro
pean
Sum
mer
AT
anom
aly
-1
-0.5
0
0.5
1
NH A
T An
omal
y
-0.6
-0.4
-0.2
0
0.2
0.4
0.6
AMO
Inde
x
-3-2-1012345
AMO
Inde
x
MWP / MCA LIARP
0.6
0.5
0.4
0.3
0.2
0.1
0
Vulca
nic
Forc
ing
(AO
D)
-3
-2
-1
0
1
2
3
NAO
Ano
mal
y
-1
-0.5
0
0.5
1
A
14
15
16
17
18
19
20
0
100
200
300
400
500
600
700
800
900
1000
1100
1200
1300
1400
1500
1600
1700
1800
1900
2000
SST
(ºC)
Age CE
C
-0.5
-0.25
0
0.25
0.5
N Sp
ain
AT A
nom
aly
I
B
-3
-2
-1
0
1
2
3
SST
STAC
K An
omal
y
G
1368
1367
1366
1365
1364
1363
1362
TSI (
W/m
2)
250
300
350
400
450
500
C14
(mol
/l)
Clim. Past Discuss., doi:10.5194/cp-2017-39, 2017Manuscript under review for journal Clim. PastDiscussion started: 16 March 2017c© Author(s) 2017. CC-BY 3.0 License.
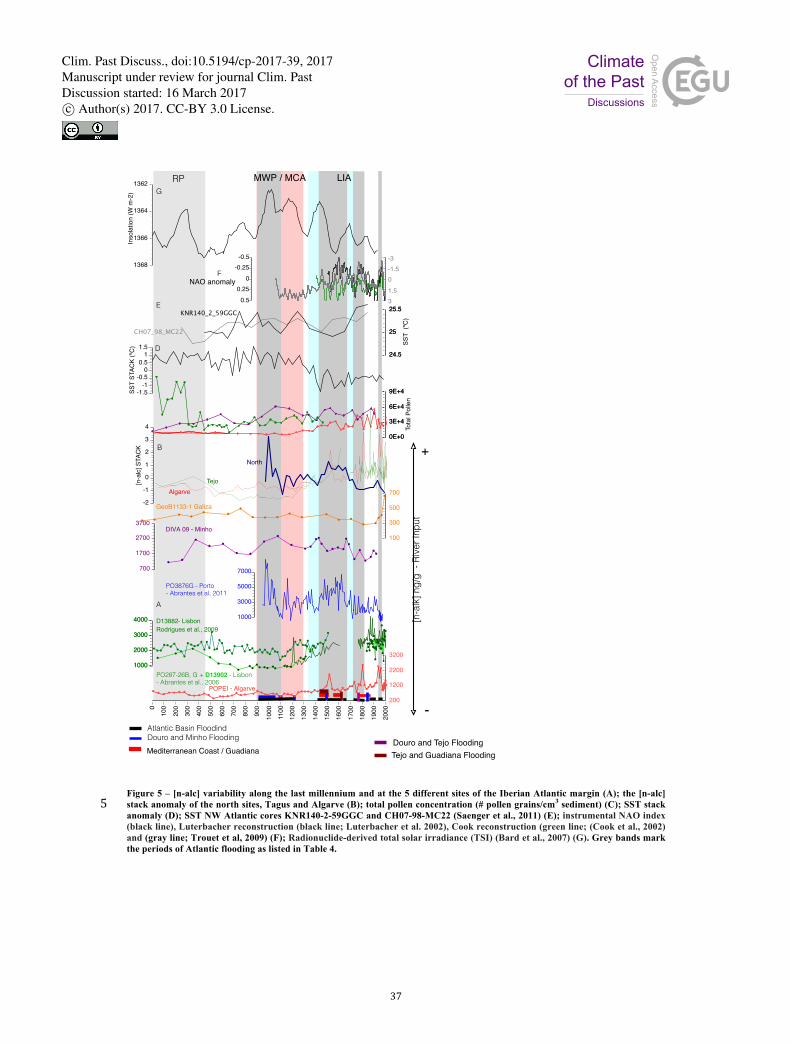
37
Figure 5 – [n-alc] variability along the last millennium and at the 5 different sites of the Iberian Atlantic margin (A); the [n-alc] stack anomaly of the north sites, Tagus and Algarve (B); total pollen concentration (# pollen grains/cm3 sediment) (C); SST stack 5anomaly (D); SST NW Atlantic cores KNR140-2-59GGC and CH07-98-MC22 (Saenger et al., 2011) (E); instrumental NAO index (black line), Luterbacher reconstruction (black line; Luterbacher et al. 2002), Cook reconstruction (green line; (Cook et al., 2002) and (gray line; Trouet et al, 2009) (F); Radionuclide-derived total solar irradiance (TSI) (Bard et al., 2007) (G). Grey bands mark the periods of Atlantic flooding as listed in Table 4.
+
-
A
B
C
D
F
J
JJ
J
J
J
J
J
J
J
JJJ
J
JJJJJJJ
JJ
J
J
JJ
JJ
JJJJJJJ
J
JJJ
J
J
J
J
JJJJ
JJJJJJJJ
JJ
JJ
JJ
J
JJ
J
1000
2000
3000
4000
PO287-26B, G + D13902 - Lisbon- Abrantes et al., 2006
J
JJJJ
JJ
J
JJJ
J
JJ
JJJJ
J
JJJ
JJJ
JJ
JJJJ
J
J
JJ
JJJ
J
JJ
JJ
J
J
J
J
JJJJ
J
J
JJ
JJJJ
JJJ
1000
2000
3000
4000 D13882 - LisbonRodrigues et al., 2009
[n-a
lk] n
g/g
- Ri
ver I
nput
POPEI - Algarve JJJJ
JJJJJJJ
J
J
J
JJJJ
JJJ
J
J
JJ
J
JJJ
JJJ
JJJJ
J
JJJJJJJJJ
JJJJ
JJJJ
JJJJJ
JJJJJJ
JJJJJJJJJJJJ
200
1200
2200
3200
010
0
200
300
400
500
600
700
800
900
1000
1100
1200
1300
1400
1500
1600
1700
1800
1900
2000
DIVA 09 - Minho
JJ
JJ
J
J
J
J
JJJJ
J
JJ
JJ
J
J
J
JJ
JJ
J
JJ
700
1700
2700
3700
0.50.25
0-0.25
-0.5
NAO anomaly
-1.5-1
-0.50
0.51
1.5
SST
STAC
K (ºC
)
31.50-1.5-3
J
JJ
JJ
JJ
JJ
JJJJ
J
JJJJ
JJ
100
300
500
700
GeoB1133-1 Galiza
1000
3000
5000
7000
PO3876G - Porto- Abrantes et al, 2011
0E+0
3E+4
6E+4
9E+4
0E+0
3E+4
6E+4
9E+4
Tota
l Pol
len
-2
-1
0
1
2
3
4
[n-a
lc] S
TACK
North
TejoAlgarve
1368
1366
1364
1362
Inso
latio
n (W
m-2
)
MWP / MCA LIARP
24.5
25
25.5
24.5
25
25.5
SST
(ºC)
KNR140_2_59GGC
CH07_98_MC22
B
D
E
A
F
G
Mediterranean Coast / Guadiana
Atlantic Basin FloodindDouro and Minho Flooding Douro and Tejo Flooding
Tejo and Guadiana Flooding
Clim. Past Discuss., doi:10.5194/cp-2017-39, 2017Manuscript under review for journal Clim. PastDiscussion started: 16 March 2017c© Author(s) 2017. CC-BY 3.0 License.
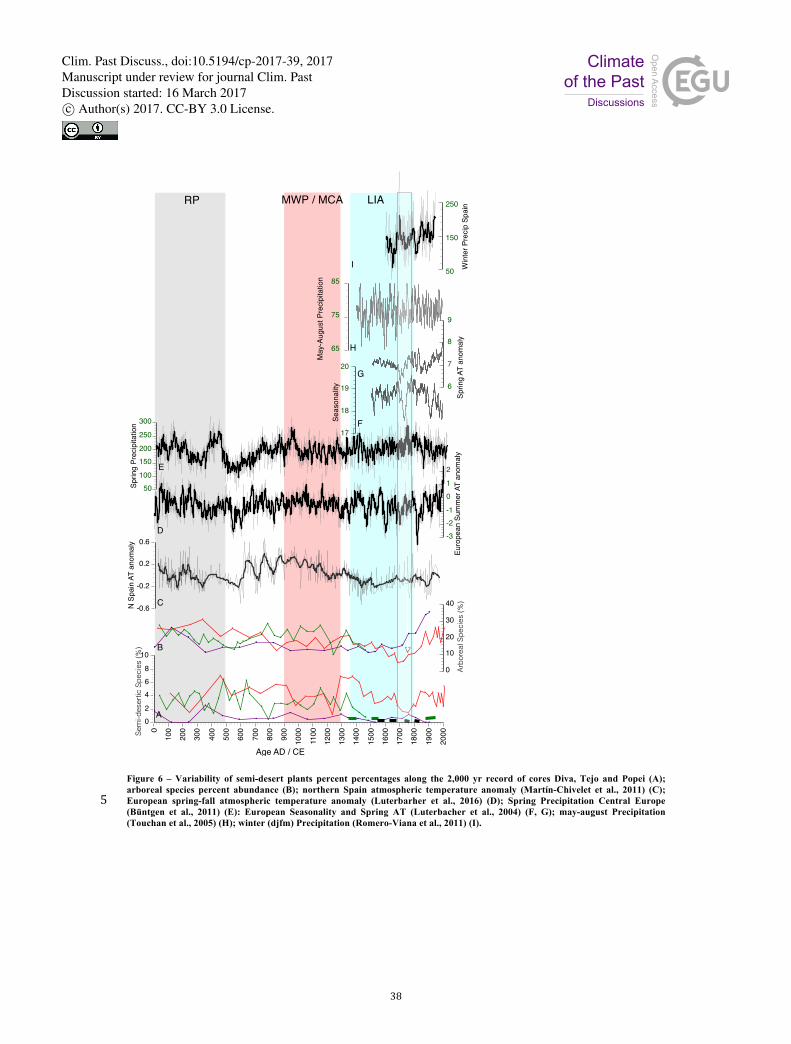
38
Figure 6 – Variability of semi-desert plants percent percentages along the 2,000 yr record of cores Diva, Tejo and Popei (A); arboreal species percent abundance (B); northern Spain atmospheric temperature anomaly (Martín-Chivelet et al., 2011) (C); European spring-fall atmospheric temperature anomaly (Luterbarher et al., 2016) (D); Spring Precipitation Central Europe 5(Büntgen et al., 2011) (E): European Seasonality and Spring AT (Luterbacher et al., 2004) (F, G); may-august Precipitation (Touchan et al., 2005) (H); winter (djfm) Precipitation (Romero-Viana et al., 2011) (I).
A
B
C
D
E
F
G
H
I
Age AD / CE
Sem
i-des
ertic
Spe
cies
(%)
X
X
X
X
X
XX
XX
XX
XX
XX
X
X
XX
XX
XX
X
XX
X
X
XXX
X
XX
X
X
X
X
X
X
X
0
100
200
300
400
500
600
700
800
900
1000
1100
1200
1300
1400
1500
1600
1700
1800
1900
2000
XXX
XXX
XXXXXX
XX
XXXX
X
X
XX
X
XX
X
X
X
X
X
X
XX
XX
XXX
X
X
X
X
X
X
X
X
X
X
X
X
X
X
XX
X
X
X
X
X
X
02
468
10
-0.6
-0.2
0.2
0.6
N S
pain
AT
anom
aly
Arbo
real
Spe
cies
(%)
50
150
250
Win
ter P
reci
p Sp
ain
65
75
85
May
-Aug
ust P
reci
pita
tion
-3-2-1
01
2Eu
rope
an S
umm
er A
T an
omal
y
50100
150200
250
300
Sprin
g Pr
ecip
itatio
n
17
18
19
20
Seas
onal
ity 6
7
8
9
Sprin
g AT
ano
mal
y
A
B
C
D
F
E
H
G
I
MWP / MCA LIARP
XX
XX
XX
X
XX
XX
XXXX
XXXX
X
X
X
X
XX
XX
X
X
X
X
X
X
XXXX
XX
XXX
XX
XXXX
XXX
X
X
XXX
X
XX
X
X
XX
XX
0
10
20
30
40
X
XX
X
X
X
X
X
XXX
X
X
XX
X
XXXX
XX
XXX
XX
X
X
XX
XX
X
X
X
X
Clim. Past Discuss., doi:10.5194/cp-2017-39, 2017Manuscript under review for journal Clim. PastDiscussion started: 16 March 2017c© Author(s) 2017. CC-BY 3.0 License.
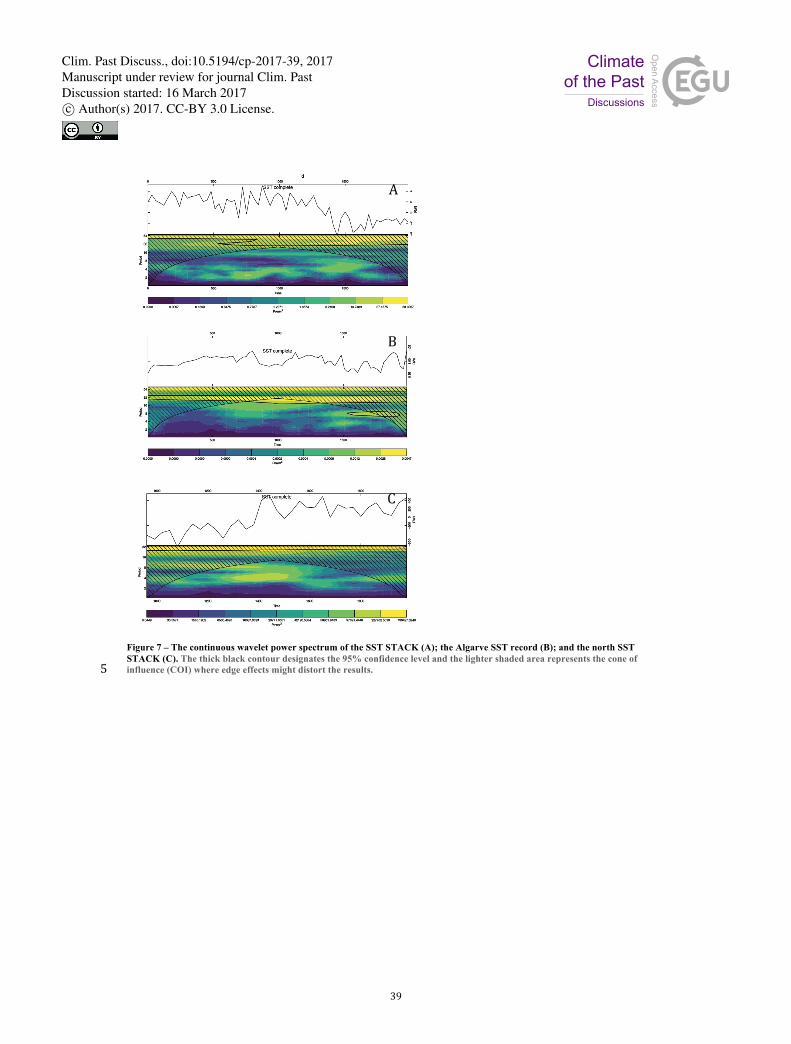
39
Figure 7 – The continuous wavelet power spectrum of the SST STACK (A); the Algarve SST record (B); and the north SST STACK (C). The thick black contour designates the 95% confidence level and the lighter shaded area represents the cone of influence (COI) where edge effects might distort the results. 5
A
B
C
Clim. Past Discuss., doi:10.5194/cp-2017-39, 2017Manuscript under review for journal Clim. PastDiscussion started: 16 March 2017c© Author(s) 2017. CC-BY 3.0 License.
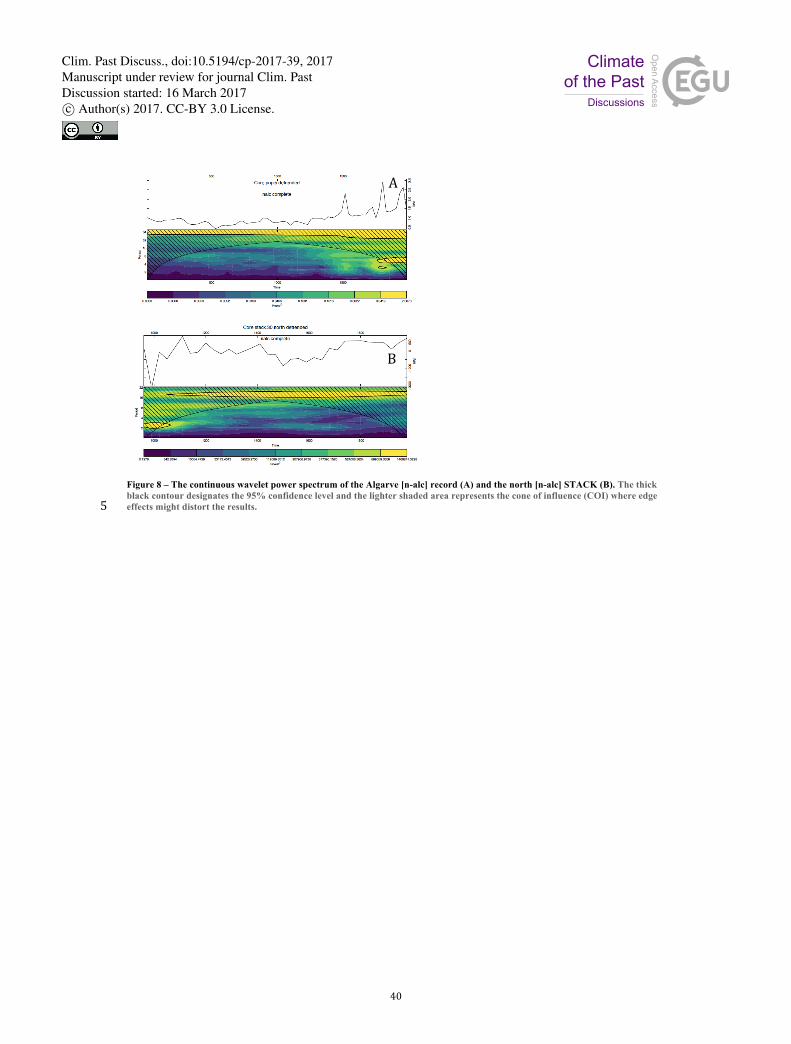
40
Figure 8 – The continuous wavelet power spectrum of the Algarve [n-alc] record (A) and the north [n-alc] STACK (B). The thick black contour designates the 95% confidence level and the lighter shaded area represents the cone of influence (COI) where edge effects might distort the results. 5
A
B
Clim. Past Discuss., doi:10.5194/cp-2017-39, 2017Manuscript under review for journal Clim. PastDiscussion started: 16 March 2017c© Author(s) 2017. CC-BY 3.0 License.