Embed Size (px)
Citation preview
Centro de Estudos Integrados sobre Meio Ambiente e Mudanças Climáticas
Instituto Virtual de Mudanças Globais
HYDROELECTRIC RESERVOIRS AND GLOBAL WARMING
Luiz Pinguelli RosaDeputy Director of COPPE Federal University of Rio de Janeiro, Cidade
Universitária, Rio de Janeiro, Brazil, e-mail: [email protected] Aurélio dos Santos
PPE/COPPE/UFRJ, Centro de Tecnologia, Bloco C, sala 211CidadeUniversitária, Rio de Janeiro , Brazil, zip code: 21945-970Phone: 55 21
5608995 Fax: 55 21 290 6626e-mail: [email protected] Matvienko
Hydraulics Department, University of São Paulo São Carlos SP 13560-970, e-mail: [email protected]
Elizabeth SikarConstrumaq C.P. 717 São Carlos SP 13560-970, e-mail:
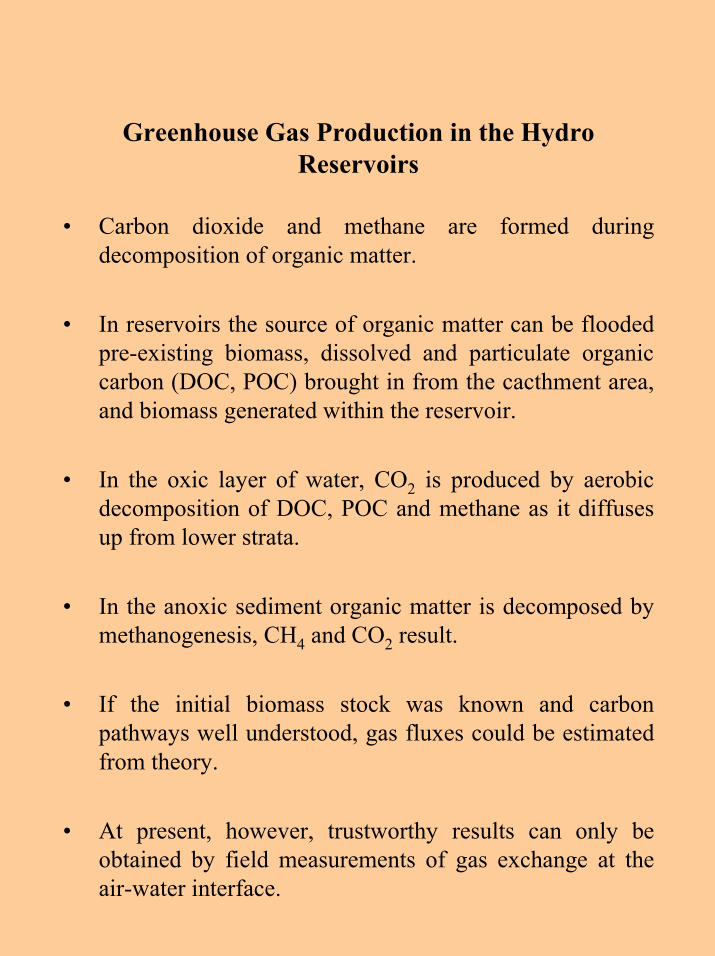
Greenhouse Gas Production in the Hydro Reservoirs
• Carbon dioxide and methane are formed during decomposition of organic matter.
• In reservoirs the source of organic matter can be flooded pre-existing biomass, dissolved and particulate organic carbon (DOC, POC) brought in from the cacthment area, and biomass generated within the reservoir.
• In the oxic layer of water, CO2 is produced by aerobic decomposition of DOC, POC and methane as it diffuses up from lower strata.
• In the anoxic sediment organic matter is decomposed by methanogenesis, CH4 and CO2 result.
• If the initial biomass stock was known and carbon pathways well understood, gas fluxes could be estimated from theory.
• At present, however, trustworthy results can only be obtained by field measurements of gas exchange at the air-water interface.
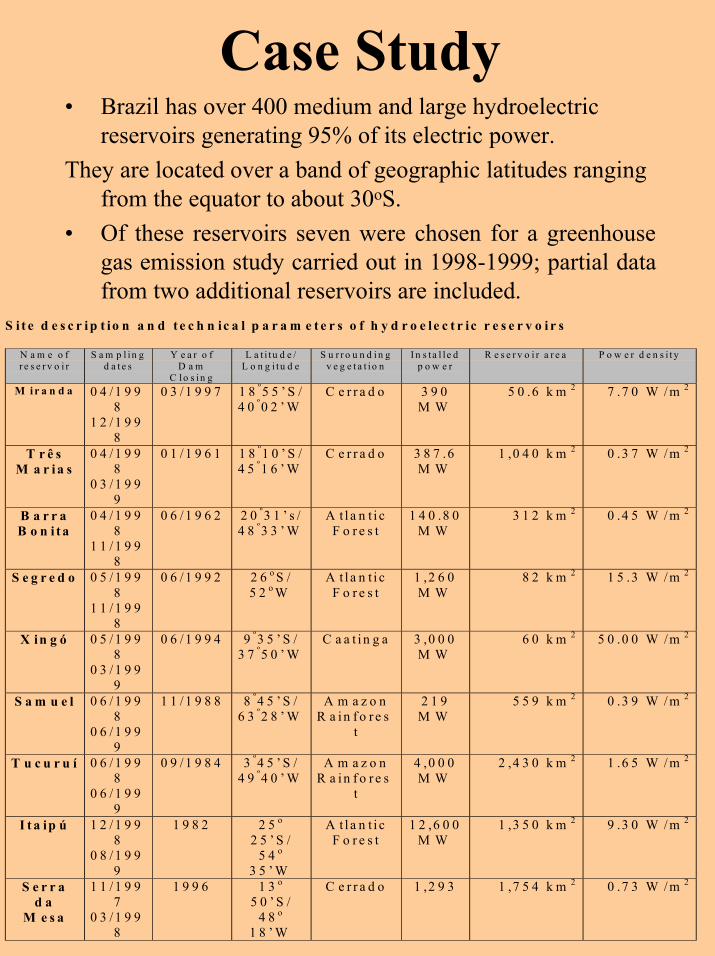
Case Study• Brazil has over 400 medium and large hydroelectric
reservoirs generating 95% of its electric power. They are located over a band of geographic latitudes ranging
from the equator to about 30oS. • Of these reservoirs seven were chosen for a greenhouse
gas emission study carried out in 1998-1999; partial data from two additional reservoirs are included.
S i t e d e s c r i p t io n a n d t e c h n ic a l p a r a m e t e r s o f h y d r o e le c t r ic r e s e r v o i r s
N a m e o fr e s e r v o i r
S a m p l in gd a t e s
Y e a r o fD a m
C lo s in g
L a t i tu d e /L o n g i tu d e
S u r r o u n d i n gv e g e t a t io n
I n s t a l l e dp o w e r
R e s e r v o i r a r e a P o w e r d e n s i t y
M i r a n d a 0 4 / 1 9 98
1 2 / 1 9 98
0 3 / 1 9 9 7 1 8 º5 5 ’ S /4 0 º0 2 ’ W
C e r r a d o 3 9 0M W
5 0 .6 k m 2 7 .7 0 W / m 2
T r ê sM a r i a s
0 4 / 1 9 98
0 3 / 1 9 99
0 1 / 1 9 6 1 1 8 º1 0 ’ S /4 5 º1 6 ’ W
C e r r a d o 3 8 7 .6M W
1 ,0 4 0 k m 2 0 .3 7 W / m 2
B a r r aB o n i t a
0 4 / 1 9 98
1 1 / 1 9 98
0 6 / 1 9 6 2 2 0 º3 1 ’ s /4 8 º3 3 ’ W
A t l a n t i cF o r e s t
1 4 0 .8 0M W
3 1 2 k m 2 0 .4 5 W / m 2
S e g r e d o 0 5 / 1 9 98
1 1 / 1 9 98
0 6 / 1 9 9 2 2 6 o S /5 2 o W
A t l a n t i cF o r e s t
1 ,2 6 0M W
8 2 k m 2 1 5 .3 W / m 2
X in g ó 0 5 / 1 9 98
0 3 / 1 9 99
0 6 / 1 9 9 4 9 º3 5 ’ S /3 7 º5 0 ’ W
C a a t i n g a 3 ,0 0 0M W
6 0 k m 2 5 0 .0 0 W /m 2
S a m u e l 0 6 / 1 9 98
0 6 / 1 9 99
1 1 / 1 9 8 8 8 º4 5 ’ S /6 3 º2 8 ’ W
A m a z o nR a i n f o r e s
t
2 1 9M W
5 5 9 k m 2 0 .3 9 W / m 2
T u c u r u í 0 6 / 1 9 98
0 6 / 1 9 99
0 9 / 1 9 8 4 3 º4 5 ’ S /4 9 º4 0 ’ W
A m a z o nR a i n f o r e s
t
4 ,0 0 0M W
2 ,4 3 0 k m 2 1 .6 5 W / m 2
I t a ip ú 1 2 / 1 9 98
0 8 / 1 9 99
1 9 8 2 2 5 o
2 5 ’ S /5 4 o
3 5 ’ W
A t l a n t i cF o r e s t
1 2 ,6 0 0M W
1 ,3 5 0 k m 2 9 .3 0 W / m 2
S e r r ad a
M e s a
1 1 / 1 9 97
0 3 / 1 9 98
1 9 9 6 1 3 o
5 0 ’ S /4 8 o
1 8 ’ W
C e r r a d o 1 ,2 9 3 1 ,7 5 4 k m 2 0 .7 3 W / m 2

Results• Greenhouse gas emission from the reservoir surface
comes from bubbling and diffusive flow.• Gas fluxes by molecular diffusion are much greater than
by bubbling. • Around 99% of CO2 is emitted into the atmosphere by
diffusive flow. For methane, diffusion into the atmosphere is in the range of 14% to 90% of total flow.
• According to our measurements, flux intensity at reservoirs varies with time, but the fluctuations appear to be modulated by a strong random component.
• The coexistence in the water of sources and sinks of CO2, as well as of CH4 , with their activity governed by a complex interplay of internal and external factors results in this apparent randomness and explains the presence of extreme values.
• The large variability is real and not a consequence of faulty analyses because chromatographic analyses are reproducible to better than 4% and thus could not have caused such huge variability.
• These ranged between 7.7 and 88% for methane and between 51 and 902% for CO2 .
• Methane emission flow rates do not show dependence with latitude.
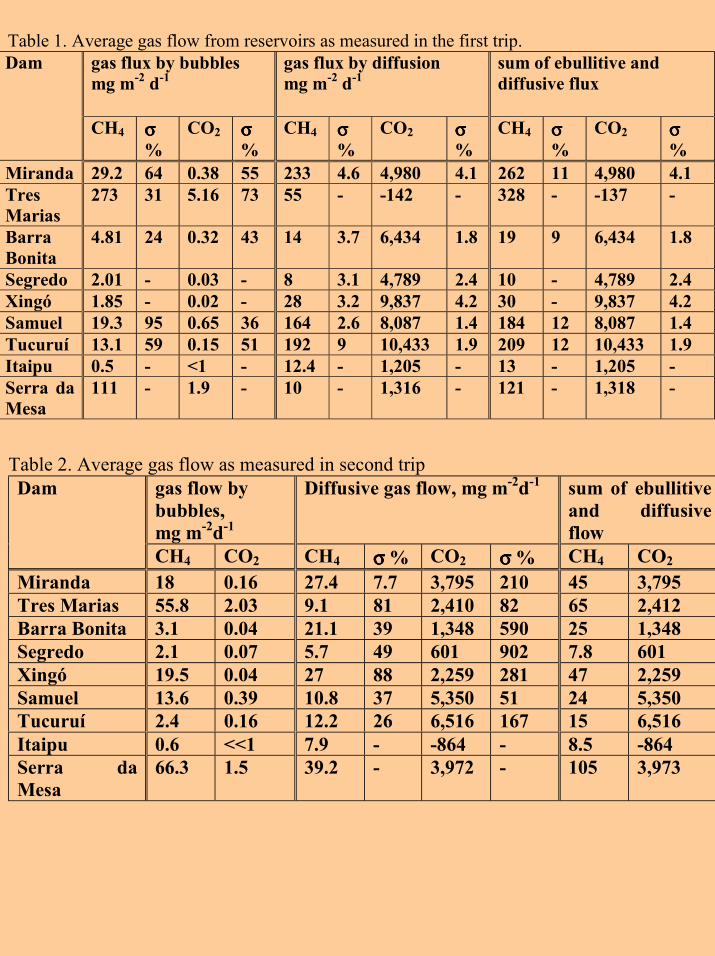
Table 1. Average gas flow from reservoirs as measured in the first trip.gas flux by bubblesmg m-2 d-1
gas flux by diffusionmg m-2 d-1
sum of ebullitive anddiffusive flux
Dam
CH4 σσσσ%
CO2 σσσσ%
CH4 σσσσ%
CO2 σσσσ%
CH4 σσσσ%
CO2 σσσσ%
Miranda 29.2 64 0.38 55 233 4.6 4,980 4.1 262 11 4,980 4.1TresMarias
273 31 5.16 73 55 - -142 - 328 - -137 -
BarraBonita
4.81 24 0.32 43 14 3.7 6,434 1.8 19 9 6,434 1.8
Segredo 2.01 - 0.03 - 8 3.1 4,789 2.4 10 - 4,789 2.4Xingó 1.85 - 0.02 - 28 3.2 9,837 4.2 30 - 9,837 4.2Samuel 19.3 95 0.65 36 164 2.6 8,087 1.4 184 12 8,087 1.4Tucuruí 13.1 59 0.15 51 192 9 10,433 1.9 209 12 10,433 1.9Itaipu 0.5 - <1 - 12.4 - 1,205 - 13 - 1,205 -Serra daMesa
111 - 1.9 - 10 - 1,316 - 121 - 1,318 -
Table 2. Average gas flow as measured in second tripgas flow bybubbles,mg m-2d-1
Diffusive gas flow, mg m-2d-1 sum of ebullitiveand diffusiveflow
Dam
CH4 CO2 CH4 σσσσ % CO2 σσσσ % CH4 CO2
Miranda 18 0.16 27.4 7.7 3,795 210 45 3,795Tres Marias 55.8 2.03 9.1 81 2,410 82 65 2,412Barra Bonita 3.1 0.04 21.1 39 1,348 590 25 1,348Segredo 2.1 0.07 5.7 49 601 902 7.8 601Xingó 19.5 0.04 27 88 2,259 281 47 2,259Samuel 13.6 0.39 10.8 37 5,350 51 24 5,350Tucuruí 2.4 0.16 12.2 26 6,516 167 15 6,516Itaipu 0.6 <<1 7.9 - -864 - 8.5 -864Serra daMesa
66.3 1.5 39.2 - 3,972 - 105 3,973

Figure 1. Nine of our flow values, and four values from literature, plotted against
latitude. The dotted line is the exponential y = 9408 exp (-x / 16.6).
0 10 20 30 40 50 60 70
0
2000
4000
6000
8000
10000
mg CO2 m-2 d-1
latitude, degrees
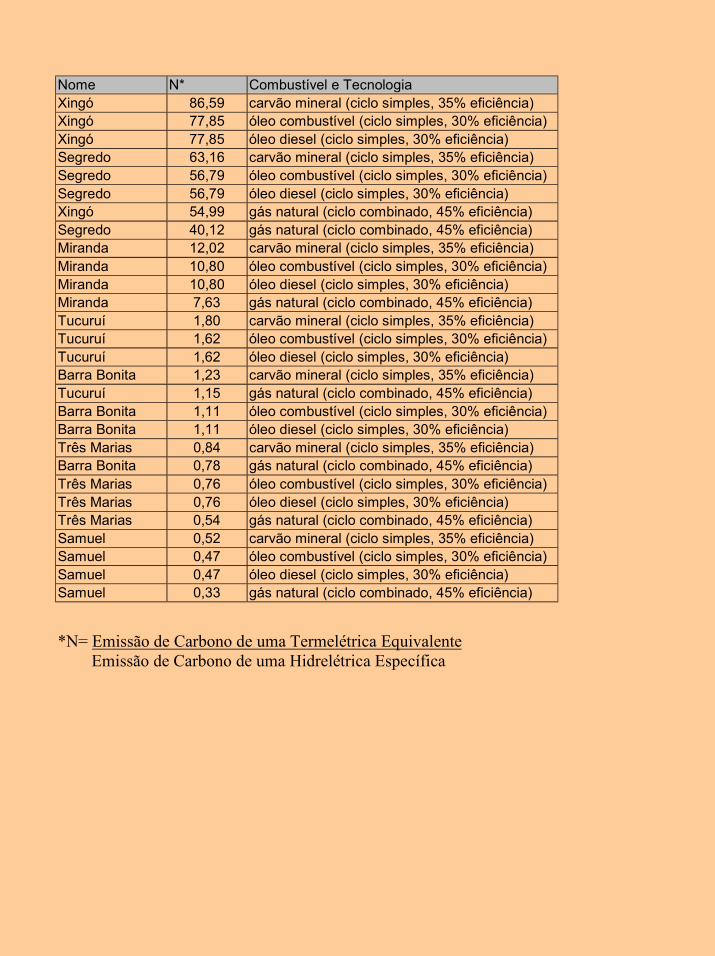
Nome N* Combustível e TecnologiaXingó 86,59 carvão mineral (ciclo simples, 35% eficiência)Xingó 77,85 óleo combustível (ciclo simples, 30% eficiência)Xingó 77,85 óleo diesel (ciclo simples, 30% eficiência)Segredo 63,16 carvão mineral (ciclo simples, 35% eficiência)Segredo 56,79 óleo combustível (ciclo simples, 30% eficiência)Segredo 56,79 óleo diesel (ciclo simples, 30% eficiência)Xingó 54,99 gás natural (ciclo combinado, 45% eficiência)Segredo 40,12 gás natural (ciclo combinado, 45% eficiência)Miranda 12,02 carvão mineral (ciclo simples, 35% eficiência)Miranda 10,80 óleo combustível (ciclo simples, 30% eficiência)Miranda 10,80 óleo diesel (ciclo simples, 30% eficiência)Miranda 7,63 gás natural (ciclo combinado, 45% eficiência)Tucuruí 1,80 carvão mineral (ciclo simples, 35% eficiência)Tucuruí 1,62 óleo combustível (ciclo simples, 30% eficiência)Tucuruí 1,62 óleo diesel (ciclo simples, 30% eficiência)Barra Bonita 1,23 carvão mineral (ciclo simples, 35% eficiência)Tucuruí 1,15 gás natural (ciclo combinado, 45% eficiência)Barra Bonita 1,11 óleo combustível (ciclo simples, 30% eficiência)Barra Bonita 1,11 óleo diesel (ciclo simples, 30% eficiência)Três Marias 0,84 carvão mineral (ciclo simples, 35% eficiência)Barra Bonita 0,78 gás natural (ciclo combinado, 45% eficiência)Três Marias 0,76 óleo combustível (ciclo simples, 30% eficiência)Três Marias 0,76 óleo diesel (ciclo simples, 30% eficiência)Três Marias 0,54 gás natural (ciclo combinado, 45% eficiência)Samuel 0,52 carvão mineral (ciclo simples, 35% eficiência)Samuel 0,47 óleo combustível (ciclo simples, 30% eficiência)Samuel 0,47 óleo diesel (ciclo simples, 30% eficiência)Samuel 0,33 gás natural (ciclo combinado, 45% eficiência)
*N= Emissão de Carbono de uma Termelétrica Equivalente Emissão de Carbono de uma Hidrelétrica Específica
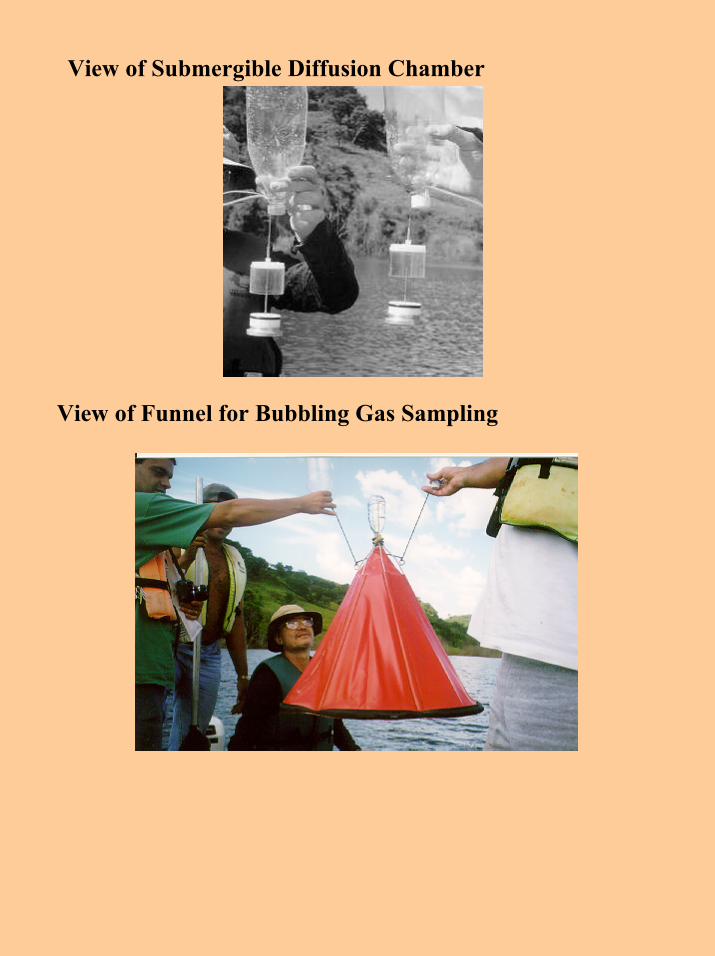
View of Submergible Diffusion Chamber
View of Funnel for Bubbling Gas Sampling

• The scientific literature shows that reservoirs can emit methane due to the anaerobic decomposition of biomass and carbon dioxide.
• In some particular circumstances, this can be substantial and of a similar order of magnitude as the thermal emissions avoided.
• Tropical reservoirs that are shallow anduncleared of biomass appear most at risk.
• Scenarios are calculated showing that in cases where the power capacity by the hydroplant is less than 0.1 W per square meter of reservoir area then there is a risk that the GHG emissions may exceed the thermal emissions avoided.
• Where values exceed 0.5 W/m2 of reservoir the scenarios show that possibility of reservoirs emissions putting at risk the benefits of CO2 avoided by hydro are reduced.
• The main scientific controversy centres on the extrapolation of measured emissions per m2 in selected parts of the reservoir to the whole reservoir area.
• Emissions of CH4 almost certainly vary according to depth and the distribution of the submerged biomass.
• Studies have not yet been carried out over long periods to characterize the full life-cycle curve of the emissions.
DAMS AND DEVELOPMENT REPORT -WCD CONCLUSIONS ON DAMS AND
GHGs EMISSION
• Reservoirs interrupt the downstream flow of organic carbon, leading to emissions of greenhouse gases such as methane and carbon dioxide that contribute to climate change.
• The emission of greenhouse gases (GHG) from reservoirs due to rotting vegetation and carbon inflows from the catchment is a recently identified ecosystem impact (on climate) of storage dams.
• A first estimate suggests that the gross emissions from reservoirs may account for between 1% and 28% of the global warming potential of GHG emissions.
• All large dams and natural lakes in the boreal and tropical regions that have been measured emit greenhouse gases (carbon dioxide, methane, or sometimes both);
• For example, a floodplain tropical forest in Amazonia may emit methane from soils and, at the same time, absorb carbon dioxide in leaves.
• Some values for gross GHG emissions are extremely low and may be 10 times less than the thermal option. Yet in some circumstances the gross emissions can be considerable, and possibly greater thanthe thermal alternatives.
• Calculations of the contribution of new reservoirs to climate change must therefore include an assessment of the natural pre-dam emission or sinkin order to determine the net impact of the dam.
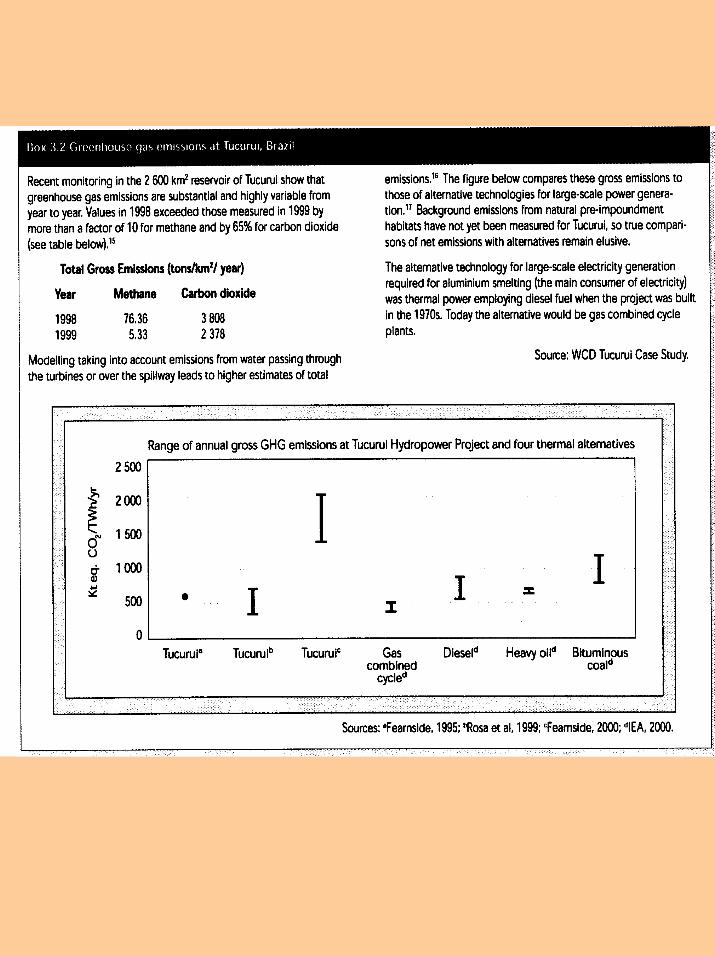
• The WCD Case Studies only provide data on carbon dioxide and methane emissions from the Tucurui reservoir .

• Current understanding of emissions suggests that shallow, warm tropical dams are more likely to bemajor GHG emitters than deep cold boreal dams.
• In the case of hydropower dams, tropical dams that have low installed capacity and large shallow reservoirs are more likely to have gross emissions that approach those of comparable thermal alternatives than those with small, deep reservoirs and high in-stalled capacity.
• No experience exists with minimising, mitigating, or compensating these impacts.
• Pre-inundation removal of vegetation is one alternative, but the net effects of such an activityare not well understood.
• The outcome of global negotiations on climate change may bear on future penalties and incentives for net GHG emissions from dams.