Embed Size (px)
Citation preview
Rev Saúde Pública 2014;48(3):468-477
Spatial study of homicide rates in the state of Bahia, Brazil, 1996-2010
Estudo espacial da mortalidade por homicídio, Bahia, 1996-2010
I Programa de Pós-Graduação em Saúde Pública. Escola Nacional de Saúde Pública. Fundação Oswaldo Cruz. Rio de Janeiro, RJ, Brasil
II Centro Latino-americano de Estudos de Violência e Saúde Jorge Careli. Fundação Oswaldo Cruz. Rio de Janeiro, RJ, Brasil
Correspondence: Tiago Oliveira de Souza CLAVES/Fiocruz Av. Brasil, 4036/700 Manguinhos 21040-361 Rio de Janeiro, RJ, Brasil E-mail: [email protected]
Received: 10/23/2013 Approved: 2/26/2014
Article available from: www.scielo.br/rsp
ABSTRACT
OBJECTIVE: To analyze the spatial distribution of homicide mortality in the state of Bahia, Northeastern Brazil.
METHODS: Ecological study of the 15 to 39-year old male population in the state of Bahia in the period 1996-2010. Data from the Mortality Information System, relating to homicide (X85-Y09) and population estimates from the Brazilian Institute of Geography and Statistics were used. The existence of spatial correlation, the presence of clusters and critical areas of the event studied were analyzed using Moran’s I Global and Local indices.
RESULTS: A non-random spatial pattern was observed in the distribution of rates, as was the presence of three clusters, the first in the north health district, the second in the eastern region, and the third cluster included townships in the south and the far south of Bahia.
CONCLUSIONS: The homicide mortality in the three different critical areas requires further studies that consider the socioeconomic, cultural and environmental characteristics in order to guide specific preventive and interventionist practices.
DESCRIPTORS: Men. Homicide. Mortality. Spatial Analysis. Violence. External Causes. Ecological Studies.
Original Articles DOI:10.1590/S0034-8910.2014048005201
Tiago Oliveira de SouzaI
Liana Wernersbach PintoII
Edinilsa Ramos de SouzaII
469Rev Saúde Pública 2014;48(3):468-477
Homicides represent 36.8% of total deaths by external causes and were the number one cause of death for ages 15 to 39 in Brazil in 2009. “The greatest risk of death by aggressions and legal interventions (homicides) is found in men, aged 15 to 39, residing in the Northeast and Central-West regions”, according to the Brazilian Ministry of Health.a They are also the main perpetrators of homicidal violence, according to studies in Brazil and around the world.4,8,18,23
One of the great challenges of contemporary society is to measure the impacts of violence, among these, the structural, assistance and asset expenditures of health and other sectors standout. Violence changes during the course of history and presents itself in different ways according to distinct geographical, socioeconomic, political and cultural contexts.9,16,17,23
Violence, principally in the form of homicide, is worri-some in the male population aged 15 to 39 in Bahia.22 If at other times Bahia was one of the states recognized for its low homicide rates, from 2000 to 2009, it presented the greatest increase in the homicide rate in the country:
RESUMO
OBJETIVO: Analisar a distribuição espacial da mortalidade por homicídio no estado da Bahia.
MÉTODOS: Estudo ecológico com a população masculina de 15 a 39 anos do estado da Bahia, no período de 1996 a 2010. Foram analisados dados do Sistema de Informações sobre Mortalidade, referentes aos homicídios (X85 a Y09) e as estimativas populacionais do Instituto Brasileiro de Geografia e Estatística. A existência de correlação espacial, a presença de conglomerados (clusters) e áreas críticas foram analisadas por meio dos índices (I) de Moran, global e local.
RESULTADOS: Observou-se padrão espacial, não aleatório, na distribuição das taxas, além da presença de três conglomerados locais (clusters): um na macrorregião de saúde do norte, o segundo na do leste e o terceiro compreendendo municípios da região sul e do extremo sul da Bahia.
CONCLUSÕES: A mortalidade por homicídio nas três áreas críticas demanda estudos mais aprofundados que considerem as características socioeconômicas, culturais e ambientais para orientar práticas preventivas e interventivas específicas.
DESCRITORES: Homens. Homicídio. Mortalidade. Análise Espacial. Violência. Causas Externas. Estudos Ecológicos.
INTRODUCTION
of 303.2%. States with traditionally elevated homi-cide rates such as Pernambuco, Northeastern Brazil, (-28.2%), Rio de Janeiro (-48.6%) and Sao Paulo, Southeastern Brazil, (-67.0%) presented decreases in the same period.b
According to Waiselfisz,b Bahia went from 23rd posi-tion to 7th in the ranking of homicide rates by state. The homicide rate jumped from 9.4 per 100,000 inhabit-ants in 2000 to 37.7 per 100,000 in 2010. Three cities in Bahia, Northeastern Brazil, (Simoes Filho, Porto Seguro and Itabuna) appear among the top ten with the highest homicide rates (2008 to 2010) in the classifi-cation of the 200 Brazilian municipalities with more than 10,000 inhabitants, respectively occupying first, fifth and eighth place.
Of these three municipalities, Simoes Filho is part of the metropolitan region of Salvador, Capital of Bahia. The others are located in the extreme southern and southern regions of the state. Nevertheless, the majority of the studies are concentrated almost exclusively on analysis of the state capital.10,12,19-21,c
a Ministério da Saúde, Secretaria de Vigilância em Saúde, Departamento de Análise de Situação em Saúde. Saúde Brasil 2010: uma análise da situação de saúde e de evidências selecionadas de impacto de ações de vigilância em saúde. Brasília (DF); 2007 [cited 16 Sept 2012]. Epidemiologia das causas externas no Brasil: mortalidade por acidentes e violências no período de 2000 a 2009. Available from: http://portal.saude.gov.br/portal/arquivos/pdf/cap_11_saude_brasil_2010.pdfb Waiselfisz JJ. Mapa da Violência 2012: os novos padrões da violência homicida no Brasil. São Paulo: Instituto Sangari; 2011 [cited 23 Oct 2012]. Available from: http://mapadaviolencia.org.br/mapa2012.phpc Viana LAC. Mortalidade por causas externas: evolução temporal das desigualdades sociais no espaço intra-urbano [dissertation]. Salvador: Instituto de Saúde Coletiva da Universidade Federal da Bahia; 2010.

470 Spatial study of homicide rates in Bahia Souza TO et al
Investigating local distribution patterns of homi-cides in socioeconomic and specific spatial contexts is fundamental for the guidance of more focused and integrated preventive and interventive measures.11 “Local patterns” are understood to be the existence of some systematic spatial pattern in a particular health macro region (HMR), i.e., the clustering of municipal-ities with high rates inside the same HMR, configure “local patterns” in the distribution of homicide in the whole State of Bahia. It is possible to identify risk areas and develop explanatory hypotheses for the violence phenomenon.
The objective of this study is to analyze the spatial distri-bution of mortality by homicide in the State of Bahia.
METHODS
Ecologic study, in which the spatial distribution of mortality from homicide rates (MHR) in men aged 15 to 39 in Bahia from 1996 to 2010 is analyzed.
The 417 municipalities of the state were utilized as anal-ysis units. These municipalities were located according to their HMR for the description of the spatial pattern, specifically, Center-East, Center-North, Extreme South, East, Northeast, North, West, Southwest and South. The HMR are delimited according to the demographic and socioeconomic characteristics of the various territorial areas for the purpose of the process of regionalization of heath assistance.d
The data on mortality and population estimates were extracted from the Mortality Information System (SIM) and the Brazilian Institute of Geography and Statistics (IBGE), available on the Brazilian Unified Health System Information Technology Department (DATASUS) site.e The data included deaths by aggres-sion, referred to in the study as homicide, selected according to the 10th revision of the International Statistical Classification of Health Related Diseases and Problems (ICD-10) under the codes X85 and Y09.
The MHR were grouped in five trienniums to diminish the instability of the data by municipality and smooth the random indicator fluctuations: 1996 to 1998, 1999 to 2001, 2002 to 2004, 2005 to 2007, 2008 to 2010. The MHR represent the cause of death in each triennium, by the population in the middle of the period per 100,000 inhabitants calculated in the following manner: sum of deaths in the triennium in the numerator; population in the middle of the period in the denominator (1997, 2000, 2003, 2006, 2009); multiplying the result by 100,000.
The cartographic bases and digital networks used in the georeferencing were obtained from the IBGE.f
The spatial distribution of the MHR was presented in class intervals and classified according to quartiles. Each part represents 1/4 of the rates in all of the munici-palities. The measure, since it is a separatrix, does not suffer the influence of extreme values, facilitating the identification of the median (Md) and makes it possible to compare the spatial pattern of the rates over time.
The existence of spatial autocorrelation was analyzed by Moran’s Global (I) index. In this test the null hypoth-esis (H0) affirms the spatial independence whose value will be equal to zero. Positive values (between 0 and +1) and negative values (between 0 and -1), indicate the presence of positive and negative spatial autocorrela-tion, respectively.13 The statistical significance of the index was determined by the p-value.
The presence of clusters was evaluated by Moran’s Local I index (Local Indicators of Spatial Association – LISA).1 This index makes it possible to identify the spatial dependence and quantify the degree of spatial association in each locality of the sample group.1
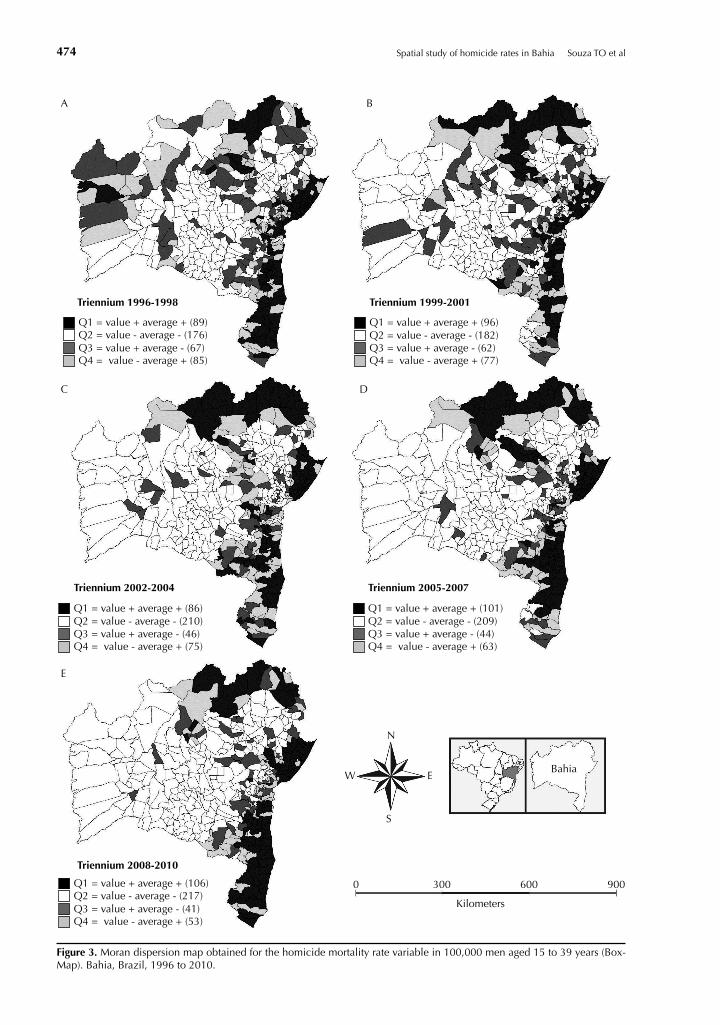
BoxMap and Moran Map were constructed to visu-alize the results.
The quadrants (Q) presented in the map legends corre-spond to the relation between the values of the devia-tion vector (Z) and the local weighted average vector (Wz). These values can be positive or negative and are distributed in one of the four quadrants which compose the dispersion graphic (Moran dispersion diagram). These quadrants are interpreted in the following manner: Q1 (positive values, positive averages), Q2 (negative values, negative averages), both indicating areas with positive spatial association, i.e., the exis-tence of municipalities that have values similar to their neighbors; Q3 (positive values negative averages), Q4 (negative values, positive averages), indicating points of negative spatial association or localities that present distinct values among the neighboring municipalities.5
The BoxMap does not consider statistical signifi-cance. The Moran Map presents clusters identified by BoxMap, considering the level of spatial significance of ≤ 5%. A locality classified by the Moran Map as Q1, i.e., when a particular municipality has a high MHR and is near other municipalities in the same situation, was considered as critical area for the event studied.
The software used for building the database and for the calculation of the rates of mortality by triennium
d Secretaria da Saúde do Estado da Bahia. Plano diretor de regionalização. Salvador, BA; [s.d.] [cited 10 Oct 2012]. Available from: http://www1.saude.ba.gov.br/mapa_bahia/e Ministério da Saúde. Informações de Saúde. Brasília (DF); 2008 [cited 2 Oct 2012]. Available from: http://www2.datasus.gov.br/DATASUS/index.php?area=02f Instituto Brasileiro de Geografia e Estatística. Download - Geociências. Brasília (DF); [s.d.] [cited 2 Oct 2012]. Available from: http://downloads.ibge.gov.br/downloads_geociencias.htm
471Rev Saúde Pública 2014;48(3):468-477
were Excel© and Statistical Package for Social Science (SPSS©) version 19.0. Terraview 3.2.0 (developed by the Instituto Nacional de Pesquisas Espaciais (INPE − National Space Research Institute)) for the calcula-tion of spatial statistics and building of thematic maps.g
This study was approved by the Research Ethics committee of the Escola Nacional de Saúde Pública Sergio Arouca (CEP/ENSP; Report 07/2012).
RESULTS
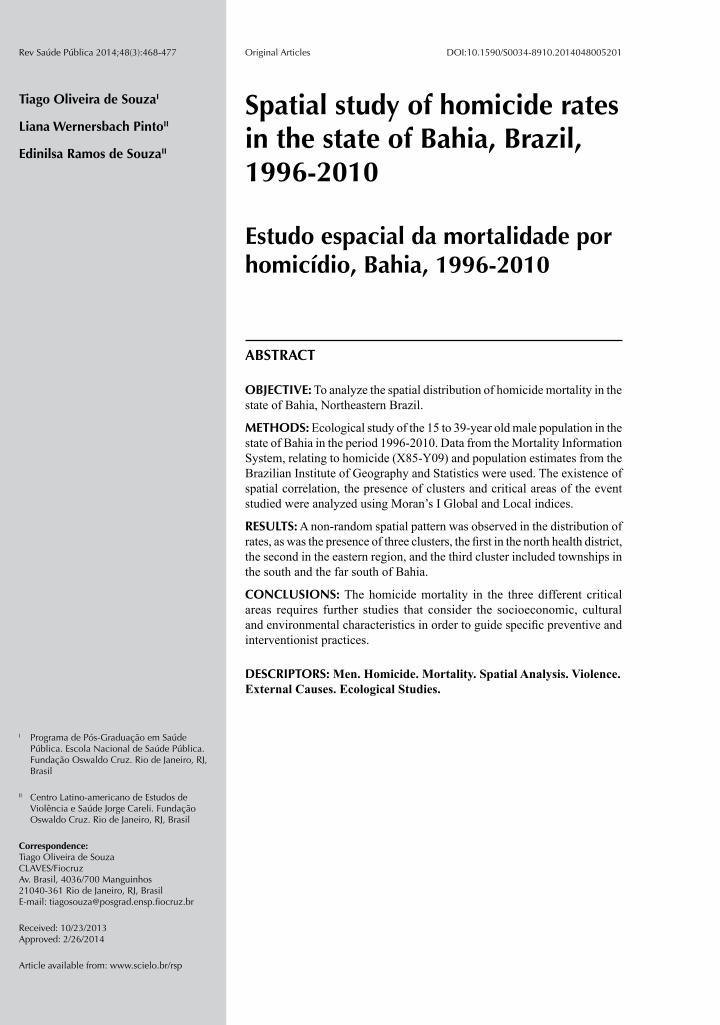
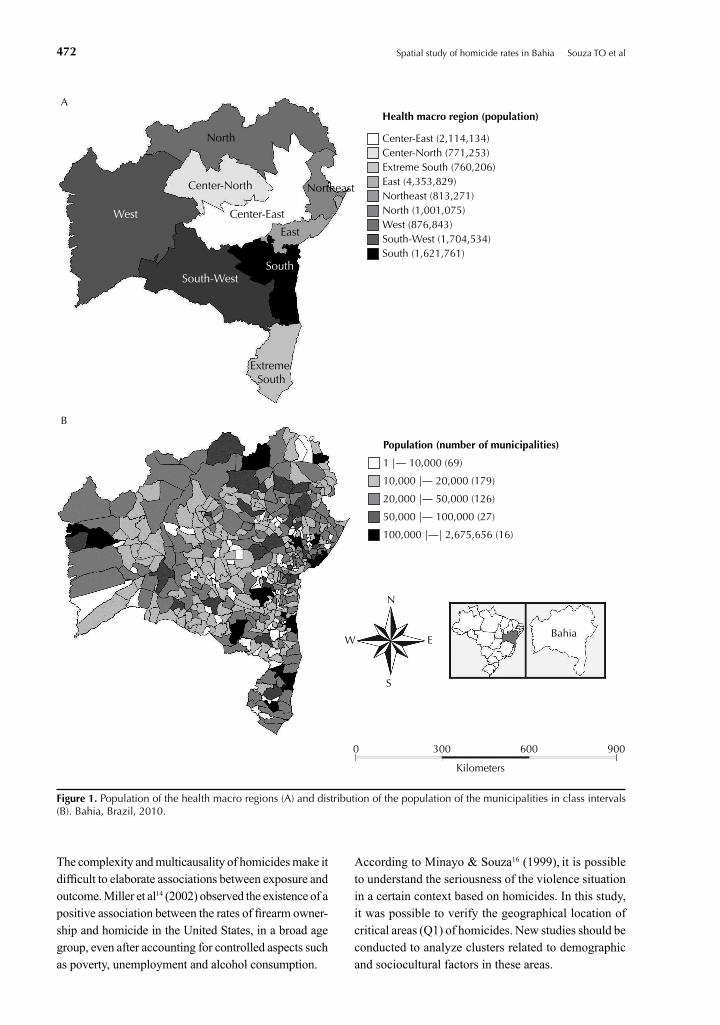
The East, Center-East, Southeast and South regions were the HMR with the greatest number of inhabitants, in this order (Figure 1, A). Most municipalities (89.7%) that comprise the macro regions of the state were small in size (population < 50,000 inhabitants; Figure 1, B).
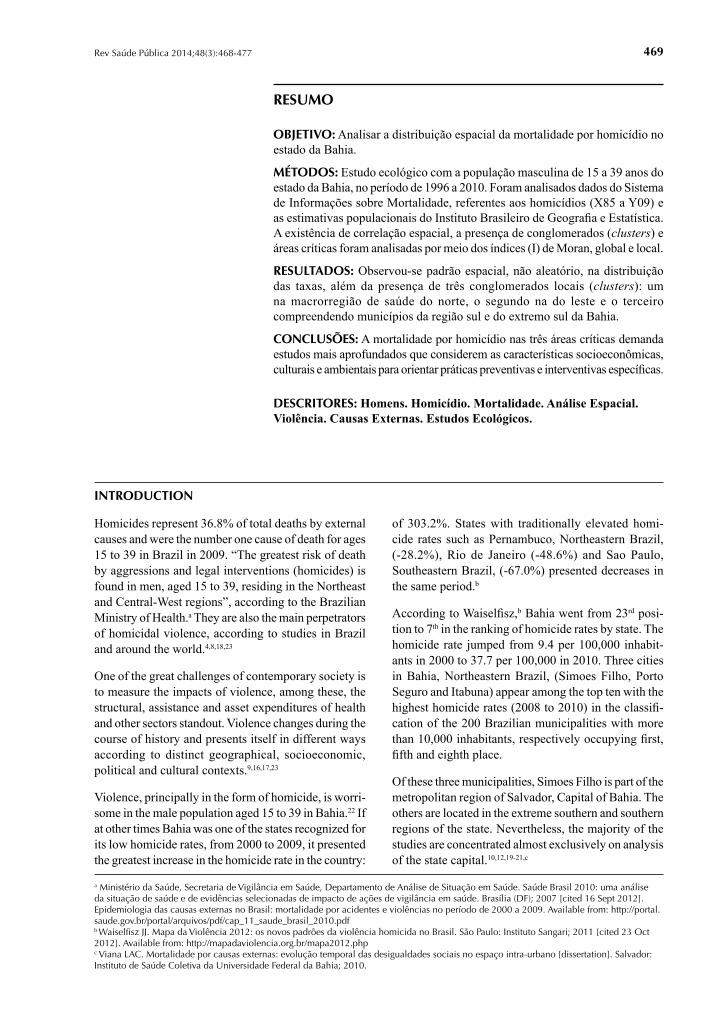
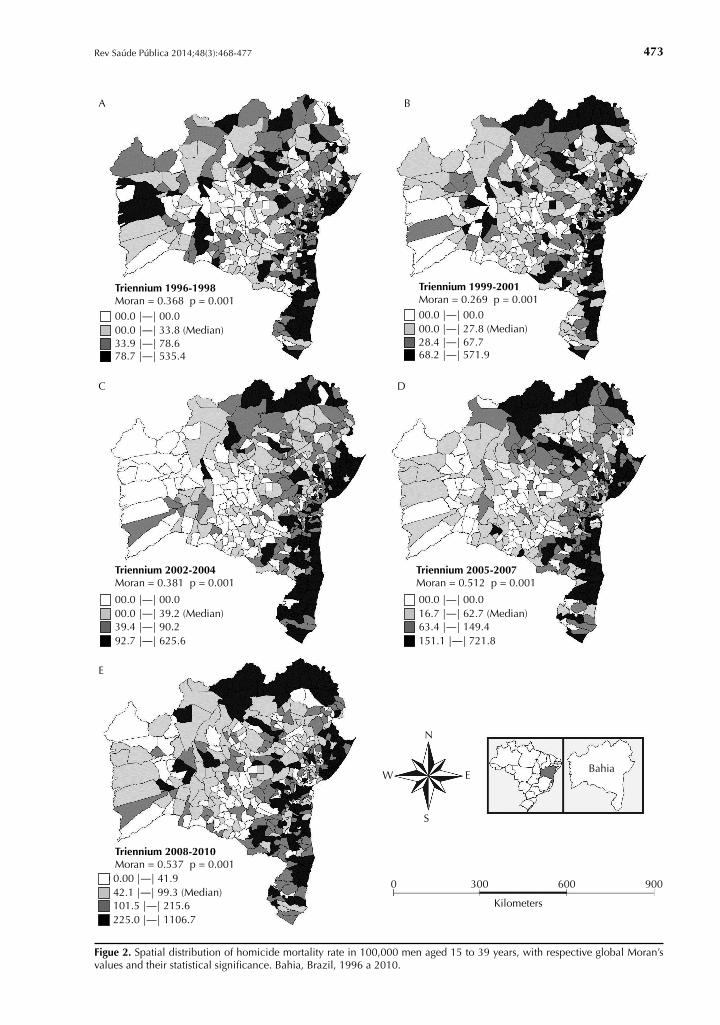
A non-random pattern occurred in the MHR distribution in 100,000 men aged 15 to 39 (Figure 2). An explor-atory analysis of spatial data showed greater MHR in the northern HMR and coastal municipalities (Figure 2).
The existence of spatial autocorrelation of the MHR variable appeared initially in the positive and highly significant values of Moran’s Global I. The presence and magnitude of correlation become clearer when Figures 2, A and 2, E are compared; where Moran’s I varied between 0.368 to 0.537; the median changed from 33.8 to 99.3 homicides per 100,000 men and the MHR upper limit more than doubled (Figure 2).
The municipality of Lauro de Freitas, in the eastern HMR, presented a higher MHR in the first triennium (1996 a 1998) and Eunápolis (extreme south HMR) appeared with the highest MHR in the last triennium (2008 a 2010). The municipalities of Juazeiro in the northern HMR and Itabuna in the southern HMR presented the highest MHR in the State in other trien-niums, Juazeiro in the second and third trienniums and Itabuna in the fourth triennium.
The Q1 municipalities are mostly located in the North, East, Northeast, South, and extreme South HMR (Figures 1 and 3). Most municipalities classified in quadrant Q2 are located in the West and Southwest HMR. Most municipalities and their contiguous neigh-bors presented low MHR in these regions.
The municipalities located in Q3 and Q4 present different values than their neighbors. Those located in Q3 and Q4 became less frequent and more concen-trated in a particular locality, mainly when the differ-ences between Figures 3, A and 3, E were compared.
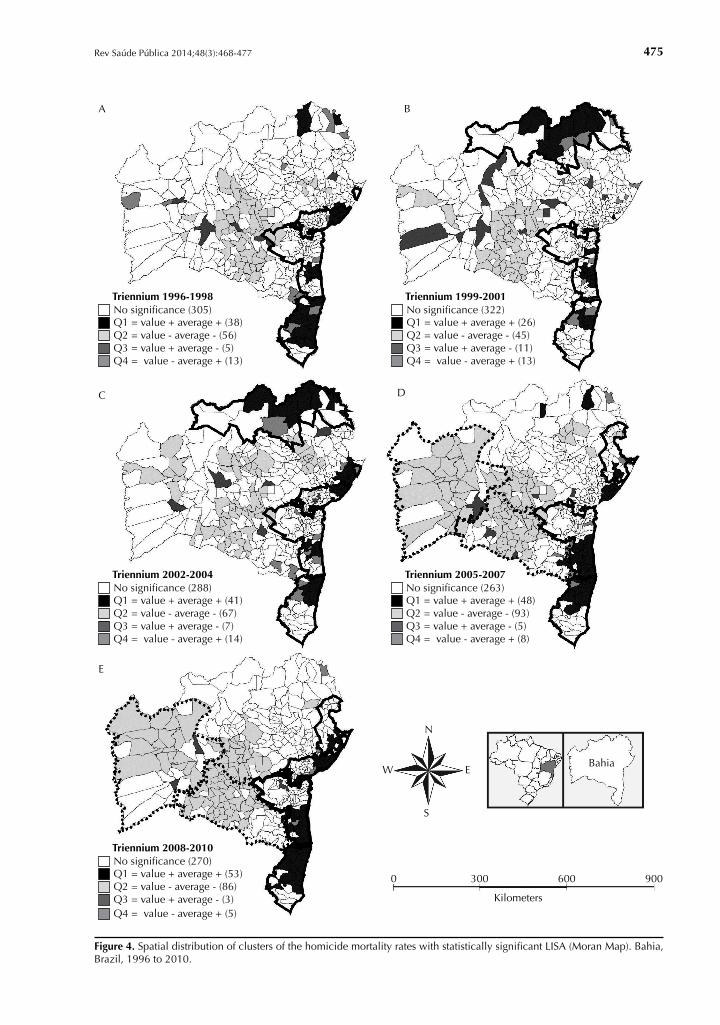
It was possible to identify three local clusters from the MHR with the LISA statistic (Moran Map).
The first was located in the northern macro region, with municipalities that border Pernambuco (Figures 4, B and 4, C), with highlights for Juazeiro, Abaré and Curaçá.
The second was located starting from the metropolitan region (eastern HMR), beginning in Salvador heading towards the northeastern region in the direction of Sergipe (Figures 4, C; 4, D and 4, E). The municipali-ties of Camaçari, Dias D’Ávila, Lauro de Freitas and Simoes Filho are highlighted in this region in the last three trienniums.
The last cluster identified is located in the region that extends from the South to Extreme South of Bahia in the direction of Espírito Santo (Figures 4, D and 4, E). The municipalities of Eunápolis, Itabuna and Porto Seguro presented the highest MHR between the trien-niums 2005 to 2007 and 2008 to 2010.
The Moran Map confirmed the results presented in the BoxMap for Q1 and Q2. In this last triennium, the presence of ample clustering of values and nega-tive averages was identified, mainly in the western and southwestern HMR in the last two triennium (Figures 4, D and 4, E).
It was possible to confirm positive spatial association with 95% confidence. Municipalities with high MHR appeared, surrounded by other municipalities that presented the same condition, as well as municipalities with low MHR, similar to their contiguous neighbors. The quadrants Q3 and Q4 do not appear in the descrip-tion of the results as they are not considered significant, given the low occurrence of municipalities with these conditions (Figure 4).
DISCUSSION
The findings suggest the existence of significant statistical spatial autocorrelation, measured using the Moran’s I calculation for the MHR variable in men aged 15 to 39. It was further possible to identify three clusters of homicides in the state, classified as (Q1) that are not merely random. Such clusters were considered as critical areas for homicides.
Studies show different variables to explain the rates of homicides in certain regions.7,14 A study about the pres-ence of clusters of homicides in Belo Horizonte, MG, showed that the precarious socioeconomic conditions together with narcotic commerce and the violence of drug trafficking, represent higher risk for homicides in certain geographic areas.3
g Instituto Nacional de Pesquisas Espaciais (INPE ). TerraView 4.1.0. São José dos Campos; 2010 [cited 2012 Oct 2012]. Available from: http://www.dpi.inpe.br/terraview
472 Spatial study of homicide rates in Bahia Souza TO et al
North
Center-North
Center-East
Extreme South
South-West
East
South
Northeast
West
A
B
Center-East (2,114,134)Center-North (771,253)Extreme South (760,206)East (4,353,829)Northeast (813,271)North (1,001,075)West (876,843)South-West (1,704,534)South (1,621,761)
Health macro region (population)
1 |— 10,000 (69)
10,000 |— 20,000 (179)
20,000 |— 50,000 (126)
50,000 |— 100,000 (27)
Population (number of municipalities)
0 300
Bahia
N
W E
S
600
Kilometers
900
100,000 |—| 2,675,656 (16)
Figure 1. Population of the health macro regions (A) and distribution of the population of the municipalities in class intervals (B). Bahia, Brazil, 2010.
The complexity and multicausality of homicides make it difficult to elaborate associations between exposure and outcome. Miller et al14 (2002) observed the existence of a positive association between the rates of firearm owner-ship and homicide in the United States, in a broad age group, even after accounting for controlled aspects such as poverty, unemployment and alcohol consumption.
According to Minayo & Souza16 (1999), it is possible to understand the seriousness of the violence situation in a certain context based on homicides. In this study, it was possible to verify the geographical location of critical areas (Q1) of homicides. New studies should be conducted to analyze clusters related to demographic and sociocultural factors in these areas.
473Rev Saúde Pública 2014;48(3):468-477
0 300
Bahia
N
W E
S
600
Kilometers
900
A
00.0 |—| 33.8 (Median)33.9 |—| 78.6
Triennium 1996-1998Moran = 0.368 p = 0.00100.0 |—| 00.0
78.7 |—| 535.4
C
00.0 |—| 39.2 (Median)39.4 |—| 90.2
Triennium 2002-2004Moran = 0.381 p = 0.001
00.0 |—| 00.0
92.7 |—| 625.6
E
42.1 |—| 99.3 (Median)101.5 |—| 215.6
Triennium 2008-2010Moran = 0.537 p = 0.001
00 0.00 |—| 41.9
225.0 |—| 1106.7
D
16.7 |—| 62.7 (Median)63.4 |—| 149.4
Triennium 2005-2007Moran = 0.512 p = 0.001
00.0 |—| 00.0
151.1 |—| 721.8
B
00.0 |—| 27.8 (Median)28.4 |—| 67.7
Triennium 1999-2001Moran = 0.269 p = 0.00100.0 |—| 00.0
68.2 |—| 571.9
Figue 2. Spatial distribution of homicide mortality rate in 100,000 men aged 15 to 39 years, with respective global Moran’s values and their statistical significance. Bahia, Brazil, 1996 a 2010.
474 Spatial study of homicide rates in Bahia Souza TO et al
0 300
Bahia
N
W E
S
600
Kilometers
900
A
Q2 = value - average - (176)Q3 = value + average - (67)
Triennium 1996-1998
Q1 = value + average + (89)
Q4 = value - average + (85)
Q2 = value - average - (182)Q3 = value + average - (62)
Q1 = value + average + (96)
Q4 = value - average + (77)
Q2 = value - average - (209)Q3 = value + average - (44)
Q1 = value + average + (101)
Q4 = value - average + (63)
Q2 = value - average - (210)Q3 = value + average - (46)
Q1 = value + average + (86)
Q4 = value - average + (75)
Q2 = value - average - (217)Q3 = value + average - (41)
Q1 = value + average + (106)
Q4 = value - average + (53)
C
Triennium 2002-2004
E
Triennium 2008-2010
D
Triennium 2005-2007
B
Triennium 1999-2001
Figure 3. Moran dispersion map obtained for the homicide mortality rate variable in 100,000 men aged 15 to 39 years (Box-Map). Bahia, Brazil, 1996 to 2010.
475Rev Saúde Pública 2014;48(3):468-477
0 300
Bahia
N
W E
S
600
Kilometers
900
A
Q2 = value - average - (56)
Triennium 1996-1998
Q1 = value + average + (38)
Q3 = value + average - (5)Q4 = value - average + (13)
No significance (305)
Q2 = value - average - (67)
Triennium 2002-2004
Q1 = value + average + (41)
Q3 = value + average - (7)Q4 = value - average + (14)
No significance (288)
Q2 = value - average - (86)
Triennium 2008-2010
Q1 = value + average + (53)
Q3 = value + average - (3)Q4 = value - average + (5)
No significance (270)
Q2 = value - average - (93)
Triennium 2005-2007
Q1 = value + average + (48)
Q3 = value + average - (5)Q4 = value - average + (8)
No significance (263)
Q2 = value - average - (45)
Triennium 1999-2001
Q1 = value + average + (26)
Q3 = value + average - (11)Q4 = value - average + (13)
No significance (322)
C
E
D
B
Figure 4. Spatial distribution of clusters of the homicide mortality rates with statistically significant LISA (Moran Map). Bahia, Brazil, 1996 to 2010.
476 Spatial study of homicide rates in Bahia Souza TO et al
One hypothesis to be investigated in these critical areas of greater risk for homicides would be the centrality and economic influence of some municipalities that comprise the three identified clusters. Some cities that comprise the clusters are among the municipalities with the highest MHR in the country.9,b Furthermore, they comprise polarized regions of the state’s economy, including farming and livestock, industries and the service sector.h In spite of the fact these municipalities and regions present a greater presence of social equip-ment, are centers of commerce, financial activities and political decision making, they are possibly the loca-tions with the greatest social inequality.2
A recent study about the homicide rates in the young population indicated the existence of two clusters of homicides: One in the surrounding areas of Salvador and another in the South of Bahia.i Another study about the spatial distribution and determinants of the homicides in Salvador, in 1998 to 2001, showed that the population residing in census zones with unfavorable socioeconomic conditions present a higher risk of homicide, especially in the population with ages between 15 and 24.j
These studies agree with the result of this article regarding the seriousness of the violence in certain regions and highlight the importance of Bahia in the national scenario of homicides. The state government initiatives for dealing with homicides are focused mostly on actions in the area of public safety.
This is the case with the Bases Comunitárias de Segurança (BCS − Community Safety Bases), implanted in 2011 and that now have 12 units in the state, four of which are found in the interior of the state.k They were inspired by the Unidades de Polícia Pacificadora (UPP − Police Pacification Units) in Rio de Janeiro, RJ. The base installation locations consider the violence rates according to the Bahia state government. The municipali-ties of Itabuna in the southern HMR, Porto Seguro in the Extreme South and Lauro de Freitas in the eastern HMR, this one located in the metropolitan region, received Community Safety Bases. These same cities stand out for presenting high homicide rates.6,22
One of the limitations of the current study resulted from changes in the information quality over the period. An inexplicable reduction in the number of deaths by homi-cide (from 1,981 cases in 1997, to 1,271 cases in the following year and 913 cases in 1999) was highlighted by the Violence Map 2011. However, the numbers of homicides began to stabilize starting in 2000 and have continued to rise until 2010.l This variation in the quan-titative data of death is related to possible problems of underreporting in the state, which needs to be investi-gated and problematized in future studies.
Few studies bring information about all the municipal-ities of a state, especially in the interior regions. The majority of the studies about homicides investigate the state capitals and metropolitan regions, as is the case of the few studies about this topic in Bahia.10,12,19-21 This lack of knowledge brings obstacles for understanding the reality about the determinants of homicides and make it difficult to elaborate public policies.
New studies should include other variables related to homicide, such as population density and envi-ronmental, socioeconomic and cultural characteris-tics in multiple analysis. Broader study of homicides may overcome the limitations of this model and guide preventive and interventive practices.
To go beyond the Cartesian approach of the epidemiolog-ical profile of homicides and construct a reflection about this phenomenon considering theoretical aspects such as masculine dominance, the relation between power and social representations of violence is a huge challenge for the authors and for the scientific community. Studies perform this integration of sciences combining multiple points of view from triangulation methods.15
This study has brought unquestionable contributions regarding the spatial pattern of mortality by homicide in the male population aged 15 to 39. It takes an ecological approach to the situation of homicides in all the munici-palities of Bahia, considering the HMR. It made it possible to emphasize the importance of the use of spatial analysis and geoprocessing tools for understanding violence.
h Trindade GA. Urbanização e gestão urbana no Sul da Bahia: o predomínio da aglomeração de Itabuna-Ilhéus na rede urbana regional. In: Lopes DMF, Henrique W, organizadores. Cidades médias e pequenas: teorias, conceitos e estudos de caso. Salvador, BA; 2010 [cited 2012 Sept 20]. Available from: http://www.redbcm.com.br/arquivos/bibliografia/cidades%20m%C3%A9dias%20e%20pequenas%20teorias,%20conceitos%20e%20estudos%20de%20caso.pdfi Sousa CAM. Homicídios na Bahia em 2009: determinantes socioeconômicos e a mortalidade por violência [master’s dissertation]. Rio de Janeiro: Escola Nacional de Saúde Pública Sergio Arouca da Fundação Oswaldo Cruz; 2012.j Santana FS. Homicídios em Salvador 1998-2001: efeitos das desigualdades socioeconômicas na mortalidade por violência [master’s dissertation]. Rio de Janeiro: Escola Nacional de Saúde Pública Sergio Arouca da Fundação Oswaldo Cruz; 2004.k Secretaria de Comunicação Social. Secretaria da Segurança Pública. Base Comunitária de Segurança. Salvador; 2013 [cited 2013 Jan 30]. Available from: http://www.ouvidoriageral.ba.gov.br/tag/base-comunitaria/l Waiselfisz JJ. Mapa da Violência 2011: Os jovens do Brasil. São Paulo/ Brasília (DF): Instituto Sangari /Ministério da Justiça; 2010 [cited 2012 Oct 23]. Available from: http://mapadaviolencia.org.br/
477Rev Saúde Pública 2014;48(3):468-477
1. Anselin, L. Local indicators of spatial association - LISA. Geographical Analysis. Ohio; 1995.
2. Barata RB. O que queremos dizer com desigualdades sociais em saúde? Rio de Janeiro: Editora Fiocruz; 2009. Como e por que as desigualdades sociais fazem mal à saúde; p.11-21.
3. Beato FCC, Assunção RM, Silva BFA, Marinho FC, Reis IA, Almeida MCM. Conglomerados de homicídios e o tráfico de drogas em Belo Horizonte, Minas Gerais, Brasil, de 1995 a 1999. Cad Saude Publica. 2001;17(5):1163-71. DOI:10.1590/S0102-311X2001000500017
4. Belon AP, Barros MBA, Marín-León L. Mortality among adults: gender and socioeconomic differences in a Brazilian city. BMC Public Health. 2012;12(39). DOI:10.1186/1471-2458-12-39
5. Câmara G, Carvalho MS, Cruz OG, Correa V. Análise espacial de áreas. In: Druck S, Carvalho MS, Câmara G, Monteiro AMV, editores. Análise espacial de dados geográficos. Brasília (DF): EMBRAPA; 2004 [citado 2012 Ago 01]. Disponível em: http://www.dpi.inpe.br/gilberto/livro/analise/
6. Carvalho AXY, Silva GDM, Almeida Jr GR, Albuquerque PHM. Taxas bayesianas para o mapeamento de homicídios nos municípios brasileiros. Cad Saude Publica. 2012;28(7):1249-62. DOI:10.1590/S0102-311X2012000700004
7. Cerdá M, Messner SF, Tracy M, Vlahov D, Goldmann E, Tardiff KJ, et al. Investigating the Effect of Social Changes on Age-Specific Gun-Related Homicide Rates in New York City During the 1990s. Am J Public Health. 2010;100(6):1107-15. DOI:10.2105/AJPH.2008.158238
8. Dahlberg LL, Krug EG. Violência: um problema global de saúde pública. Cienc Saude Coletiva. 2006;11Suppl:1163-78. DOI:10.1590/S1413-81232006000500007
9. Duarte EC, Garcia LP, Freitas LRS, Mansano NH, Monteiro RA, Ramalho WM. Associação ecológica entre características dos municípios e o risco de homicídios em homens adultos de 20-39 anos de idade no Brasil, 1999-2010. Cienc Saude Coletiva. 2012;17(9):2259-68. DOI:10.1590/S1413-81232012000900008
10. Freitas ED, Paim JS, Silva LMV, Costa MCN. Evolução e distribuição espacial da mortalidade por causas externas em Salvador, Bahia, Brasil. Cad Saude Publica. 2000;16(4):1059-70. DOI:10.1590/S0102-311X2000000400024
11. Lima MLC, Ximenes RAA, Souza ER, Luna CF, Albuquerque MFPM. Análise espacial dos determinantes socioeconômicos dos homicídios no Estado de Pernambuco. Rev Saude Publica. 2005;39(2):176-182. DOI:10.1590/S0034-89102005000200006
12. Macedo AC, Paim JS, Silva LMV, Costa MCN. Violência e desigualdade social: mortalidade por homicídios e condições de vida em Salvador, Brasil. Rev Saude Publica. 2001;35(6):515-22. DOI:10.1590/S0034-89102001000600004
13. Medronho RA, Werneck GL. Análise de dados espaciais em saúde. In: Medronho RA, Carvalho DM, Bloch KV, Luiz RR, Werneck GL, editores. Epidemiologia. 2. ed. São Paulo: Editora Atheneu; 2009. p.493-511.
14. Miller M, Azrael D, Hemenway D. Rates of Household Firearm Ownership and Homicide Across US Regions and States, 1988–1997. Am J Public Health. 2002;92(12):1988-93. DOI:10.2105/AJPH.92.12.1988
15. Minayo MCS, Assis SG, Souza ER, organizadores. Avaliação por Triangulação de Métodos: abordagem de programas sociais. Rio de Janeiro: Editora Fiocruz; 2005.
16. Minayo MCS, Souza ER. É possível prevenir a violência? Reflexões a partir do campo da saúde pública. Cienc Saude Coletiva. 1999;4(1):7-32. DOI:10.1590/S1413-81231999000100002
17. Minayo MCS. Violência e Saúde. Rio de Janeiro; Editora Fiocruz; 2006.
18. Minayo MCS. Violência Social sob a Perspectiva da Saúde Pública. Cad Saude Publica. 1994;10Suppl1:7-18. DOI:10.1590/S0102-311X1994000500002
19. Nunes M, Paim JS. Um estudo etno-epidemiológico da violência urbana na cidade de Salvador, Bahia, Brasil: os atos de extermínio como objeto de análise. Cad Saude Publica. 2005;21(2):459-68. DOI:10.1590/S0102-311X2005000200012
20. Paim JS, Costa HOG, Vilasboas ALQ. Política pública e controle da violência: um estudo de caso na cidade de Salvador, Bahia, Brasil. Cad Saude Publica. 2009;25(3):485-94. DOI:10.1590/S0102-311X2009000300003
21. Santos JEF. Homicídio entre jovens de uma periferia de Salvador, Bahia: um relato de experiência sobre a violência e o desenvolvimento humano. Rev Bras Crescimento Desenvolv Hum. 2007;17(3):72-83.
22. Souza TO, Souza ER, Pinto LW. Evolução da mortalidade por homicídio no Estado da Bahia, no período de 1996 a 2010. Cienc Saude Coletiva. 2013 [citado 2013 jan 15]. No prelo. Disponível em: http://www.cienciaesaudecoletiva.com.br/artigos/artigo_int.php?id_artigo=13786
23. Velis E, Shaw G, Whiteman AS. Victim’s profile analysis reveals homicide affinity for minorities and the youth. J Inj Violence Res. 2010;2(2):67-74. DOI:10.5249/jivr.v2i2.50
REFERENCES
Article based on the master’s dissertation by Souza TO, entitled: “Perfil Epidemiológico da Mortalidade por Homicídio no Estado da Bahia no período de 1996 a 2010”, presented to Escola Nacional de Saúde Pública Sergio Arouca of the Fundação Oswaldo Cruz, in 2013.The authors declare that there is no conflict of interest.

![Margarida Tavares [Modo de Compatibilidade] - gis.pt Tavares... · Sucessos do controlo de infecção – microrganismos mu ltiresistentes 30 • Reduced rates of MRSA transmission](https://img.document.onl/doc/110x75/5c4cfc7f93f3c304f47a7503/margarida-tavares-modo-de-compatibilidade-gispt-tavares-sucessos-do.jpg)