Embed Size (px)
Citation preview
II Simpósio Brasileiro de Geofísica
,
II Simpósio Brasileiro da SBGf – Natal 2006.
Passive Seismic
Ernst D. Rode
Marmot Passive Monitoring Technologies SA – 1024 Ecublens VD Switzerland [email protected]
Copyright 2006, SBGf - Sociedade Brasileira de Geofísica
Este texto foi preparado para a apresentação no I Simpósio de Geofísica da Sociedade Brasileira de Geofísica, São Paulo, 26-28 de setembro de 2004. Seu conteúdo foi revisado pela Comissão Tecno-científica do I SR-SBGf mas não necessariamente representa a opinião da SBGf ou de seus associados. E proibida a reprodução total ou parcial deste material para propósitos comerciais sem prévia autorização da SBGf. ____________________________________________________________________
Summary
Geospectra IPDS (Infrasonic Passive Differential Spectroscopy) is a technology for direct detection of hydrocarbons applied in exploration, field development and field monitoring.
Geospectra IPDS technique is based on the principles of non-linear behavior of fluid systems in porous media. Hydrocarbon in the pore system of reservoir rocks can be detected as a characteristic deformation of the natural earth noise spectra in the low frequency range between 0.2 and 10 Hz. These low frequency seismic signals are recorded passively at the surface with ultra high sensitive seismometers. The signals are spectroscopically analyzed to produce a unique spectral signature which is used as a direct hydrocarbon indicator.
Introduction
“Passive seismic” technologies in general can be divided into the following categories:
- Low frequency acoustic spectroscopy
- Structural seismic
- Micro earth quake monitoring
Low frequency acoustic spectroscopy as a technology has been applied since several years for long distance detection of objects (submarines and others) and natural events in earth hazard prediction and vulcanology. In 1995 a small group of scientists converted the experiences from the military industry to apply low frequency acoustic spectroscopy to detect the presence (or absence) of hydrocarbon in geological structures. In
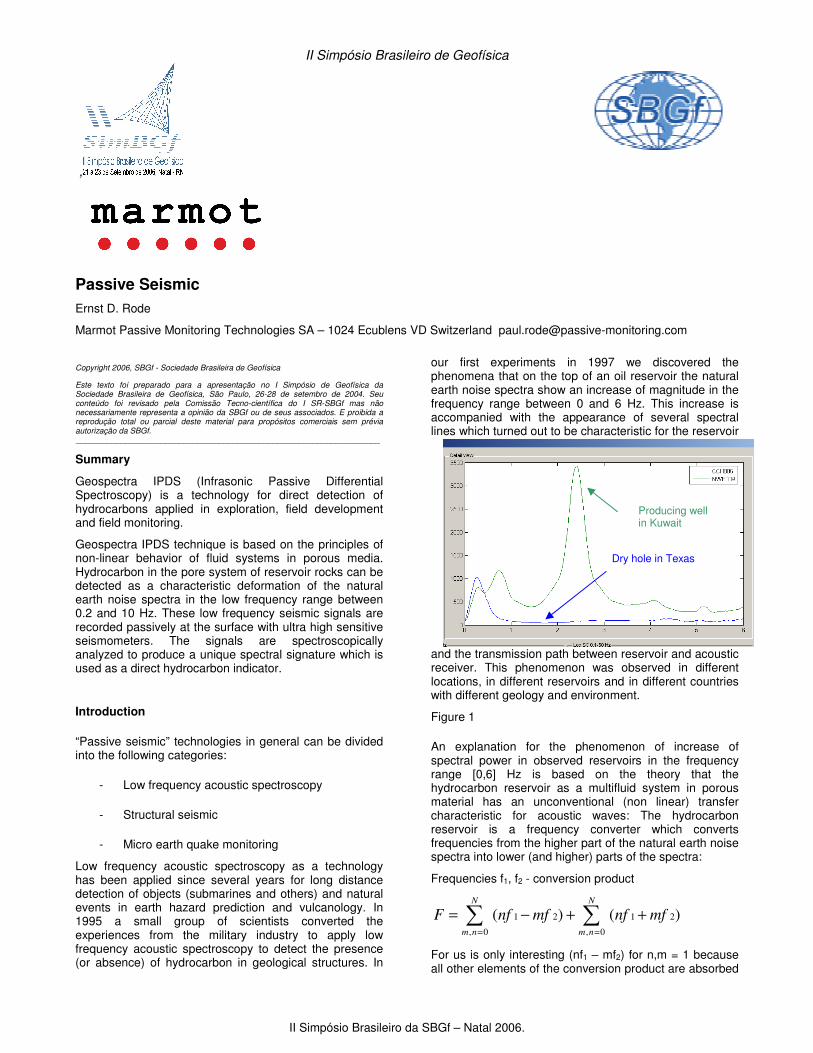
our first experiments in 1997 we discovered the phenomena that on the top of an oil reservoir the natural earth noise spectra show an increase of magnitude in the frequency range between 0 and 6 Hz. This increase is accompanied with the appearance of several spectral lines which turned out to be characteristic for the reservoir
and the transmission path between reservoir and acoustic receiver. This phenomenon was observed in different locations, in different reservoirs and in different countries with different geology and environment.
Figure 1
An explanation for the phenomenon of increase of spectral power in observed reservoirs in the frequency range [0,6] Hz is based on the theory that the hydrocarbon reservoir as a multifluid system in porous material has an unconventional (non linear) transfer characteristic for acoustic waves: The hydrocarbon reservoir is a frequency converter which converts frequencies from the higher part of the natural earth noise spectra into lower (and higher) parts of the spectra:
Frequencies f1, f2 - conversion product
)()( 21
0,
21
0,
mfnfmfnfFN
nm
N
nm
++−= ∑∑==
For us is only interesting (nf1 – mf2) for n,m = 1 because all other elements of the conversion product are absorbed
Producing well in Kuwait
Dry hole in Texas

PASSIVE SEISMIC ________________________________________________________________________________________________________________________________________________________________________________________________________________________________________________________________________________________________________________________________________________________________________________________________________________________________________________________________________________
II Simpósio Brasileiro da SBGf, Natal 21-23 de setembro de 2006
2
between reservoir and surface. The conversion power S of the reservoir can be approximated as
NPTKS •=
with K = Constant (reservoir characteristic)
NPT = Net pay Thickness.
This theoretical approach can be shown in a simulation, however, a microscopic explanation is still under investigation. An interesting aspect from the history of the development of Geospectra IPDS is that the R + D team at the beginning was dominated by physicists and electronic engineers and we were not focused on detecting hydrocarbon: Our focus was to detect an object (reservoir) in the subsurface with a certain influence on the propagation of acoustic and/or electromagnetic direct waves. For this reason it is not correct to call Geospectra IPDS a “Direct Hydrocarbon Indicator” – it is rather a “Reservoir Indicator”.
Method and Problems
Geospectra IPDS is called a “passive Technology”. “Passive” means we do not apply an artificial technical source like a vibrator – however of course there is a source: The source is the omni present and omni directional natural earth noise. This seismo acoustic background noise – which can be observed at every location around the globe – is a white noise with some characteristic spectral peaks at 0,1 – 0,2 Hz caused by the standing waves of the ocean (Aki and Richard, 1980) and by the eigenmodus of the terrestrial crust (Suda et al, 1980) in the millihertz range. The converter response of the reservoir is registered by an ultra sensitive seismometer on the surface. We use a seismometer which was specially designed in-house by GeoDynamics
Figure 2
The seismometer is based on the electrodynamic principle and has a proprietary so called “inverse loop” magnetic system with an extremely high magnetic flux to avoid any influence from external magneto dynamic fields.
� System constant 30.000 – 120.000 V sec/m
� weight 18 kg
� natural frequency 0.4 Hz
� frequency range 0.1 – 40 Hz.
The series 30 Seismometer is battery powered (30 hours) self adjusting against gravity changes and self calibrating. (Remark: The 30.000 V sec/m version was specially designed for low noise desert environment while the 120.000 V sec/m version was designed to detect micro dynamic events.) In a normal setup we use an array of 4 to 20 seismometer simultaneously which are arranged in a line profile or an aerial grid with a spacing between 150 and 1000 meter depending on the special target of the survey. Unfortunately the signal detected is a composition of the natural earth noise (which is unstable for short periods) of transients, man made noise and a non periodic converter response of the reservoir or in other words – the signal detected has a certain non periodic dynamic behavior. For this reason to achieve a statistical reliable result the recording time has to be “as long as possible”, i.e. not less than 40 minutes. We apply 40 minutes for regular surveys and 90 minutes for well measurements. In special cases we use a permanently installed monitor seismometer as a reference point. In regular surveys the density of data points is approximately 3 per line profile or 4 per sqkm. The advantage of the system is that it is extremely flexible and the setup can be adapted to the actual needs: A field monitoring survey may have 400 data points on an area of 100 sqkm whereas in a pre cursor survey for the detection of leads an area of 1000 sqkm may be covered with only 200 data points which has an important economic aspect. The interpretation of the recorded signals is very complex and the key factors for the analyses are:
� Spectral Power
� Appearance of Spectral Lines
� Dynamic Behavior of the Signal.
Results
In this paper we will demonstrate the results of three field applications:
A: Delineation of a drilling location in a field under development in Middle East;
B: Delineation of a drilling position for two well in West Texas;
C: Time lapse monitoring results in a gas field in Middle East.
A:
Problem: The field Q in Middle East is under development. A certain number of wells are drilled, tested and plugged. 5 of those wells are located on a profile QP1 with a total length of 30 km. Another well No. 11 was scheduled to be drilled in February 2006. Our task was to

ERNST D. RODE ________________________________________________________________________________________________________________________________________________________________________________________________________________________________________________________________________________________________________________________________________________________________________________________________________________________________________________________________________________
II Simpósio Brasileiro da SBGf, Natal 2006
3
found out, if the chosen well position would be prospective. From the existing wells W1, W2, W4, W5, W7 the petrophysical data especially the Net Pay Thickness were known. In June 2005 we acquired Geospectra IPDS field data from the 5 existing wells along profile QP1. The data acquisition on the 32 km profile took one week due to the unfriendly desert environment. We correlated the IPDS data with the Total Net Pay Thickness. The correlation is shown in Figure 3.
Figure 3
The quality of the correlation gave us a reliable tool to calibrate further measurements in this area. In December 2005 we ran an infill program between well No. 2 and well No. 7 on a 9 km section of QP1 covering the proposed new well position. The data acquisition program took 8 days. According to the trend line in Figure 3 the acquired data resulted in a total Net Pay in this position of about 132 ft. The well No. 11 in this position was spudded in February 2006 and tested and completed in May 2006. The findings resulted in 125 ft Net Pay. The total Net Pay distribution according to our calibration is shown in Figure 4:
Figure 4
The figure shows also the pattern of a possible sealing fault system in this section of profile QP1.
Remark: The problem with this type of calibration is that a) reliable petrophysical data must be available and b) the calibration wells should have the same depth and should have penetrated the same horizons. Also it is a problem to compare data from different geological situations and different reservoir types.
B:
Problem: Find drilling location in an oil field in West Texas. The field has a size of approximately 2 x 2 km. We applied a 2D grid across the whole area of interest with a DP spacing of approximately 180 meter with 130 Data Points. Survey time 8 days. No precise data were available except the position of a dry hole and the position of a producing well. The results are shown in Figure 5:
Figure 5
Remark: In that part of the world the key task is not to predict precisely the amount of recoverable oil – it is more important to avoid drilling of dry holes because drilling dry holes is the major cash drain for small independent oil companies.
C:
The following example shows the results of a time lapse acquisition in a Gas field in Middle East after 3 years of production. Figure 6 shows the situation from the data of an acquisition campaign executed in 2001.
Figure 6:

PASSIVE SEISMIC ________________________________________________________________________________________________________________________________________________________________________________________________________________________________________________________________________________________________________________________________________________________________________________________________________________________________________________________________________________
II Simpósio Brasileiro da SBGf, Natal 21-23 de setembro de 2006
4
Figure 7
shows the situation in 2004 when an extended survey program was executed for further field extension. (Unfortunately no production reference data are available or can be published.) The acquired IPDS data were referenced to an undisturbed position indicated in Figure 6.
Discussions and Conclusions
Passive low frequency seismo acoustic spectroscopy (Geospectra IPDS) has proven more than 90 projects – with approximately 15.000 data sets – worldwide to be a reliable information tool for the identification of hydrocarbon reservoirs. Geospectra IPDS as a Direct Reservoir Indicator is complementary to traditional geological and geophysical methods – and is not intending to replace any of them; however, it provides a set of information which was not available or recognized until now. The passive nature of this technology opens a new dimension of information although instrumentation and data interpretation have a certain limit in application. The technology is extremely flexible and environmental friendly and able to reduce costs and risks dramatically – both in exploration and in production. The most prominent sectors of application are to be seen in
� Greenfield delineation in virgin areas as a pre cursor for traditional reflection seismic
� Exploration to delineate most probable drilling positions and to reduce drastically the risk for drilling dry wells.
� Field development for the delineation of the hydrocarbon pool and identification of the oil/water contact.
� Oil field monitoring to identify the time lapse sweep efficiency of the hydrocarbon pool and provide an intelligent quasi online information system
Passive identification methods by nature provide broadband multiple information and so there are several spin offs in passive low frequency seismoacoustic signals subject to complementary interpretation such as
identification of faults, identification of structural reservoir changes. At the current situation of world wide energy aspects the most important things are to reduce the risk of exploration, because the “easy” reserves are already discovered, but much more important is to increase the recovery factor in already explored and producing oil fields by enhanced oil field management – and for this purpose and under all relevant aspects passive acoustic spectroscopy like Geospectra IPDS seems to be the most effective monitoring tool.
Acknowledgements
We want to thank the ADCO Management Mr. Fareed Al Sayed Abdulla (ADCO), Mr. Gerard Bloch (Shell), Dr. Karim Akrawi (ADCO), Assistant Professor Dr. Mohamed Ali (ADNOC PI), Dr. Johannes Singer (Shell); Dr. Jürgen Moritz (Geolab), Mr. Timur Abu Ghazaleh (Geolab), Dr. Dewitt C. Shreve (Geospec Texas), Mr. Hans Georg Winkler (Geolab) and Professor Igor P. Bashilov (Academy of Science, Russia) and our survey teams for their valuable contribution to the development of the Geospectra IPDS Technology.
References Aki, K. and Richards, P.G. [1980] Quantitative Seismology, Theory and Methods. Freemann Biot, M.A. [1956] Theory of propagation of elastic waves in a fluid-saturated porous solid – 1. Low frequency range. J. Acoust.Soc.Am., 28, 168-178 Dangel, S. et.al. [2003] Phenomology of tremor-lie signals observed over hydrocarbon reservoirs. Journal of Volcanology and Geothermal Research, 128, 135-158 Singer J. et.al [2002] Spectroscopic identification of tremor phenomena over hydrocarbon reservoirs. EAGE 64
th Conference & Exhibition – Florence, Italy, 27-30 May
2002 Suda, N., Nawa, K.,Fukao, Y., [1998] Earth’s background free oscillations. Science 279, 2089-2091 Westervelt, P.J.[1963] Parametric Acoustic Array. The Journal of the acoustical society of America, Volume 35, Number 4 US-Patent No. 6,473,695: “Method for Locating (Detecting) and (for) Identifying the type and geometrical dimensions of hydrocarbon deposits” European Patent No. 1 166 151: “Method and apparatus for investigating an area with respect to presence/absence of predetermined geophysical subterranean properties” German Patent No. 10 2004 028 034: “Method for the detection and exploration of subterranean hydrocarbon deposits by receivers of acoustic waves in a frequency range from 0.2 to 30 Hz”