Embed Size (px)
Citation preview

1
INSTITUTO POLITÉCNICO DE LISBOA
ESCOLA SUPERIOR DE TECNOLOGIA DA SAÚDE DE
LISBOA
IGRT COM CBCT: O IMPACTO NA PRECISÃO EM RADIOTERAPIA
ANA RITA LOPES SIMÕES
ORIENTADORAS:
PROF. MARGARIDA EIRAS, ESCOLA SUPERIOR DE TECNOLOGIA DA SAUDE DE LISBOA
PROF. DOUTORA ISABEL MONTEIRO GRILLO, HOSPITAL DE SANTA MARIA- CHLN
Mestrado em Radiações aplicadas às tecnologias da saúde
Lisboa, 2012

2
INSTITUTO POLITÉCNICO DE LISBOA
ESCOLA SUPERIOR DE TECNOLOGIA DA SAÚDE DE
LISBOA
IGRT COM CBCT: O IMPACTO NA PRECISÃO EM RADIOTERAPIA
ANA RITA LOPES SIMÕES
ORIENTADORAS:
PROF. MARGARIDA EIRAS, ESCOLA SUPERIOR DE TECNOLOGIA DA SAUDE DE LISBOA
PROF. DOUTORA ISABEL MONTEIRO GRILLO, HOSPITAL DE SANTA MARIA- CHLN
JÚRI:
MESTRE MIGUEL PONTES
Mestrado em Radiações aplicadas às tecnologias da saúde
(esta versão incluiu as críticas e sugestões feitas pelo júri)
Lisboa, 2012

3
IGRT COM CBCT: O IMPACTO NA PRECISÃO EM RADIOTERAPIA
A Escola Superior de Tecnologia da Saúde de Lisboa tem o direito, perpétuo e sem limites
geográficos, de arquivar e publicar esta dissertação através de exemplares impressos
reproduzidos em papel ou de forma digital, ou por qualquer outro meio conhecido ou que
venha a ser inventado, e de a divulgar através de repositórios científicos e de admitir a sua
copia e distribuição com objectivos educacionais ou de investigação, não comerciais, desde
que seja dado crédito ao autor e editor e que tal não viole nenhuma restrição imposta por
artigos publicados que estejam incluídos neste trabalho

4

5
AGRADECIMENTOS
O percurso deste semestre, embora intelectualmente muito estimulante, foi bastante difícil e
árduo devido à elevada exigência a que um profissional da área da saúde é submetido no
seu dia-a-dia. Assim, é de notar que este percurso, que agora termina, teria sido impossível
caso não tivesse contado com a ajuda de muitas pessoas em diferentes momentos e a
vários níveis. Assim gostaria de agradecer:
-Às minhas orientadoras, Professora Margarida Eiras e Professora Doutora Isabel Monteiro
Grillo pela orientação dada nesta trabalho, partilha de conhecimento científico e apoio
fundamental na resolução de problemas, mesmo quando pensei que estes não teriam
resolução.
-À Técnica Coordenadora Isabel Diegues pelos sábios conselhos e experiência, que nunca
hesitou partilhar comigo. Agradeço não só o apoio a nível profissional, mas também
emocional, que se revelou essencial como uma base de apoio para toda a realização do
trabalho. Gostaria também de agradecer, igualmente à Técnica Sub-Coordenadora Céu
Raimundo.
-À Coordenadora do Departamento de Física Médica do HSM, Doutora Esmeralda Poli, por
me ter concedido autorização para realizar o trabalho no departamento. Se não
ultrapassasse esta fase, uma grande parte do trabalho não passaria de uma simples ideia.
-Especialmente, ao Eng. Luís Madureira pela ajuda na aquisição de dados CTDI, Téc. Ana
Duarte e Téc. Ana Rato pela ajuda na elaboração de distribuições de dose no sistema de
planeamento. Agradeço aos três pelas horas de trabalho que dispensaram comigo,
principalmente à Téc. Ana Duarte, cujas noites passadas em claro e fins-de-semana no
Serviço a ajudar-me foram cruciais e de um valor absolutamente incalculável.
-Às minhas colegas, Téc. Rita Lourenço, Téc. Isabel Caetano, Téc. Catarina Marques, Téc.
Sandra Cabral, Téc. Sandra Lemos, Téc. Vera Quintino, Téc. Marta Rocha, Téc. Dagmar
Parreira, Téc. Sara Brito, Téc. Adriana Borges, Téc. Mayra Pereira, Téc. Mafalda Ferreira e
Téc. Inês Lima, pela aquisição de dados para o trabalho.
- À Professora Elisabete Carolino pelo esclarecimento de dúvidas na análise estatística.

6
-À Dra. Joana Pinto pelo suporte prestado no esclarecimento de dúvidas, acerca da estação
de trabalho XVI®.
-Ao meu noivo Miguel Reis Ferreira pelo apoio prestado a nível pessoal e científico, mas
principalmente pelo suporte emocional, deveras importante para ter conseguido levar a cabo
este trabalho.
-À minha mãe e ao meu padrasto Zé Maria, responsáveis pelo meu sucesso profissional e
pessoal ao longo dos anos e que mais uma vez me apoiaram sem qualquer reserva.
-Aos amigos Adriana Nogueira, Ana Rodrigues, Ana Martins, Carlos Pedroso e Fernando
Almeida, por me acompanharem em todos os momentos, especialmente pelas visitas que
me fizeram nos dias mais difíceis pelos quais passei nesta fase.
Muito Obrigada a todos,
Espero um dia poder retribuir todo o apoio prestado.
Rita Simões, Dezembro 2011.

7

8
INTRODUCTORY NOTE
Precision is an imperative in modern radiotherapy. This concept is applied in a day-to-day
basis at all levels in planning and delivering treatment to patients, since only by uniting all
these aspects is it’s real application possible.
Given that I am a radiation technologist in an institution where the purpose is to ensure
accuracy in administered treatment, my main focus was to direct this work towards the field
in which I dwell daily. Indeed, making sure that all instruments available have a precisely
studied role in the quality of the execution of prescribed treatment has become a necessity
that justifies the enormous amount of care put in the treatment phase in radiotherapy. This
applies, namely, to the recently-implemented cone-beam computed tomography (CBCT) tool.
Therefore, computerized tomography dose indices (CTDI) were acquired in order to monitor
doses administered to patients through CBCT. This was followed by the selection of twenty
one patients of pathologies involving a great amount of precision: fourteen patients with
prostate and seven patients with head and neck tumours. This sample was characterized
with the acquisition of CBCT pre and post-treatment, as well as after any correction
performed on their positioning. This allowed for evaluating intra-fraction errors.
From within this sample, patients out of action limits were chosen, as analyzed in control
charts for mean and standard deviation of their positioning deviations, as well as patients out
of tolerance limits for deviation correction.
Finally, new dosimetric distributions were performed, in which the isocenter accounts for the
measured positioning errors. The doses in organs at risk and eventual differences in
planning target volume (PTV) coverage with 95% of the dose between these and the planned
distributions were compared for each of these patients. This simulation allowed for inferring
what would have happened had these errors not been accounted for and corrected.
This study also evaluated the feasibility of using CBCT in the imaging verification during the
treatment of patients with the aforementioned pathologies, as well as the adequacy of the
image acquisition protocol, as currently implemented at the department. The evaluation and
quantification of systematic and random translational and rotational errors was also made
possible, as defined by current departmental practices. This allowed for adapting not only the
mentioned protocol, but also margins currently added to clinical target volumes (CTV) for
PTV generation. This will allow to ensure that protocols are based on data obtained locally,
which will undoubtedly procure better results in cancer healthcare at the department.
It is noteworthy that the Master Comission authorized the presentation of this work as a
scientific article, with the purpose of future publication in international, peer-reviewed

9
journals. In order to do so, it is not only written in English, but it also respects criteria related
to this objective.
In the first part, a review on state-of-the-art literature is rendered (previously submitted in
May 2011, even though some aspects have been corrected or updated), as to allow for a
contextualization of my work. The feasibility of the IGRT protocol, as implemented at my
department, is then assessed. Finally, as previously discussed, systematic and random
translational and rotational errors are evaluated.

10
INDEX
INTRODUCTORY NOTE…………………………………………………………………………….p.10
DESVIOS DE POSICIONAMENTO EM RT PARA PATOLOGIAS DE CP E PRÓSTATA:
REVISÃO DE LITERATURA…………………………………………………………………….p.12
Resumo……………………………………………………………………………………p.12
Abstract…………………………………………………………………………………....p.13
Introdução………………………………………………………………………………....p.13
Metodologia………………………………………………………………………….……p.15
Resultados………………………………………………………………………...….…..p.17
Discussão…………………………………………………………………………………p.18
Conclusão…………………………………………………………………………………p.20
Referências Bibliográficas……………………………………………………………….p.21
THE FEASIBILITY OF AN IGRT PROTOCOL……………………………..…………...………..p.26
Abstract…………………………………………………………………………………..,,p.26
Introduction………………………………………………………………………………..p.26
Methods and Materials…………………………………………………………………..p.27
Results……………………………………………………………………………………..p.31
Discussion………………………………………………………………………………...p.39
Conclusion………………………………………………………………………………...p.40
References………………………………………………………………………………..p.41
IMPACT OF RANDOM AND SYSTEMATIC ERRORS IN THE DAILY PRACTICE
IN RADIOTHERAPY…………………………………………………………...………………….….p.45
Abstract…………………………………………………………………………………..,,p.45
Introduction………………………………………………………………………………..p.46
Methods and Materials…………………………………………………………………..p.47
Results……………………………………………………………………………………..p.49
Discussion\ Conclusion…..……………………………………………………………...p.52
References………………………………………………………………………………..p.53
GENERAL CONCLUSION……………………………………………………………………………p.57

11

12
DESVIO DE POSICIONAMENTO EM RADIOTERAPIA PARA PATOLOGIAS
DE CABEÇA E PESCOÇO E PRÓSTATA: REVISÃO DE LITERATURA
RADIOTHERAPY SETUP DEVIATIONS IN HEAD AND NECK AND
PROSTATE TUMOURS: A REVIEW
(TITULO ABREVIADO: DP EM CP E PRÓSTATA: REVISÃO DE LITERATURA)
ANA RITA SIMÕES1, MARGARIDA EIRAS
2, ISABEL MONTEIRO GRILLO1.
1-SERVIÇO DE RADIOTERAPIA, HOSPITAL DE SANTA MARIA, CENTRO HOSPITALAR LISBOA NORTE, EPE.
2-ESCOLA SUPERIOR DE TECNOLOGIA DA SAÚDE DE LISBOA.
RESUMO
INTRODUÇÃO: Numa era em que os tratamentos de Radioterapia Externa (RTE) exigem cada vez mais
precisão, a utilização de imagem médica permitirá medir, quantificar e avaliar o impacto do erro
provocado pela execução do tratamento ou pelos movimentos dos órgãos. OBJECTIVO: Analisar os
dados existentes na literatura acerca de desvios de posicionamento (DP) em patologias de Cabeça e
Pescoço (CP) e próstata, medidos com Cone Beam Computed Tomography (CBCT) ou Electronic
Portal Image Device (EPID). METODOLOGIA: Para esta revisão da literatura foram pesquisados artigos
recorrendo às bases de dados Medline/Pubmed e B-on. Foram incluídos artigos que reportassem DP
em patologias CP e próstata medidos através de CBCT e EPID. Seguidamente foram aplicados
critérios de validação, que permitiram a selecção dos estudos. RESULTADOS: Após a análise de 35
artigos foram incluídos 13 estudos e validados 9 estudos. Para tumores CP a média (μ) dos DP
encontra-se entre 0,0 e 1,2 mm, com um desvio padrão (σ) máximo de 1,3mm. Para patologias de
próstata observa-se μDP compreendido entre 0,0 e 7,1 mm, com σ máximo de 7,5mm. DISCUSSÃO/
CONCLUSÃO: Os DP em patologias CP são atribuídos, maioritariamente, aos efeitos secundários da
RTE, como mucosite e dor, que afectam a deglutição e conduzem ao emagrecimento, contribuindo
para a instabilidade da posição do doente durante o tratamento, aumentando as incertezas de
posicionamento. Os movimentos da próstata devem-se principalmente às variações de
preenchimento vesical, rectal e gás intestinal. O desconhecimento dos DP afecta negativamente a
precisão da RTE. É importante detectá-los e quantificá-los para calcular margens adequadas e a
magnitude dos erros, aumentando a precisão da administração de RTE, incluindo o aumento da
segurança do doente.
PALAVRAS CHAVE: Desvios de posicionamento, Cone-Beam CT, EPID, Precisão.

13
ABSTRACT:
BACKGROUND AND PURPOSE: In an era where precision is an increasing necessity in external
radiotherapy (RT), modern medical imaging techniques provide means for measuring, quantifying and
evaluating the impact of treatment execution and movement error. The aim of this paper is to review
the current literature on the quantification of setup deviations (SD) in patients with head and neck
(H&N) or prostate tumors, using Cone Beam Computed Tomography (CBCT) or Electronic Portal
Image Device (EPID). METHODS: According to the study protocol, Medline/Pubmed and B-on
databases were searched for trials, which were analyzed using selection criteria based on the quality
of the articles. RESULTS: After assessment of 35 papers, 13 studies were included in this analysis and
nine were authenticated (6 for prostate and 3 for H&N tumors). The SD in the treatment of H&N
cancer patients is in the interval of 0.1 to 1.2 mm, whereas in prostate cancer this interval is 0.0 to 7.1
mm. DISCUSSION: The reproducibility of patient positioning is the biggest barrier for higher precision in
RT, which is affected by geometrical uncertainty, positioning errors and inter or intra-fraction organ
movement. There are random and systematic errors associated to patient positioning, introduced
since the treatment planning phase or through physiological organ movement. CONCLUSION: The H&N
SD are mostly assigned to the Radiotherapy adverse effects, like mucositis and pain, which affect
swallowing and decrease secretions, contributing for the instability of patient positioning during RT
treatment and increasing positioning uncertainties. Prostate motion is mainly related to the variation in
bladder and rectal filling. Ignoring SD affects negatively the accuracy of RT. Therefore, detection and
quantification of SD is crucial in order to calculate appropriate margins, the magnitude of error and to
improve accuracy in RTE and patient safety.
KEYWORDS: Set-up deviation, Cone-Beam CT, EPID, Accuracy.
1. INTRODUÇÃO
O objectivo primordial da Radioterapia Externa (RTE) é a administração de uma
dose de radiação, medida com precisão, num volume tumoral definido, com o
mínimo possível de efeitos secundários nas células vizinhas. Com este método de
tratamento, pretende-se a erradicação do tumor, elevada qualidade de vida e
prolongamento da sobrevivência.1
De maneira a tornar este objectivo real e exequível, com o menor número de
imprecisões, foram definidas incertezas e fontes de erro em RTE associadas à
preparação e administração do tratamento. Sabe-se, então, que as fontes de
introdução de incertezas estão principalmente relacionadas com incertezas de
posicionamento do doente, assim como com a delimitação do Gross Tumor Volume

14
(GTV), devendo-se esta última ao desconhecimento da extensão microscópica do
tumor. 2-8,10
Centrar-nos-emos, neste trabalho, na análise das incertezas de posicionamento,
nomeadamente dos desvios de posicionamento (DP) do doente durante o
tratamento de radioterapia. São estes definidos como diferenças anatómicas
observáveis através da comparação de uma imagem de referência com uma
imagem prévia ao tratamento.10-13
Atendendo à dimensão desta problemática e centrando-nos numa Era em que a
precisão é cada vez mais exigida, a utilização de imagem médica permitirá medir,
quantificar e avaliar o impacto dos DP na execução do tratamento ou no erro
provocado pelos movimentos dos órgãos de uma forma mais precisa. Nesse sentido,
tem-se verificado, nas últimas décadas, um claro aumento do investimento na
tecnologia utilizada nesta área. Tornou-se assim comum a introdução de protocolos
de verificação imagiológica com recurso a ferramentas como o Electronic Portal
Image Device (EPID) ou a Cone Beam Computed Tomography (CBCT) nos
departamentos de radioterapia a nível mundial.
A utilização de EPID para verificação do posicionamento do doente revelou-se
um método eficaz, substituindo a utilização de filmes radiográficos em Radioterapia.
Tal, deve-se, ao facto de estas imagens digitais, obtidas através de um detector de
silício amorfo, terem um maior contraste e uma qualidade marcadamente superior.
Ao recorrermos a este método, os DP são baseados, principalmente, na anatomia
óssea, facilmente observada em duas dimensões (2D).14
Com o intuito de aumentar a precisão da Radioterapia, surge o CBCT, com a
possibilidade de realizar imagens volumétricas, associadas a uma boa visualização
de tecidos moles, baixas doses de radiação e possibilidade de observar variações
inter e intrafracção.15 Este sistema é baseado numa fonte de raios x posicionada no
sentido oposto do detector, posicionada no anel do acelerador linear. Enquanto a
gantry roda à volta do doente, a reconstrução da imagem é obtida através de uma
aproximação bidimensional dos dados de projecção.3
Tendo em conta esta realidade, o presente trabalho pretende analisar a literatura
existente acerca de DP em doentes com patologias de Cabeça e Pescoço (CP) e
próstata, medidos com CBCT ou EPID.

15
2. METODOLOGIA
2.1 PESQUISA DE ARTIGOS
Para esta revisão de literatura foram pesquisados artigos recorrendo às bases de
dados Medline/Pubmed e B-On, através das palavras Cone-Beam CT, EPID, Head
and Neck, Prostate, Intrafraction errors, intrafraction errors e setup error. A pesquisa
foi limitada a publicações escritas em Inglês.
Tabela 1: Parâmetros de validação dos estudos incluídos.
Parâmetros de avaliação dos estudos Classificação
1. Materiais e métodos explicados 5
2. Dados dos desvios disponíveis: a) Dados em bruto b) Média, desvio padrão, medida de tendência central
3 2
3. Descrição da metodologia de análise dos DP e erros aleatórios e sistemáticos
3
4. Avaliação dos erros de setup segundo um protocolo de aquisição de imagem
2
5. Dimensão da amostra: a) 6 a 10 doentes b) 11 ou mais doentes
2 3
6. Conformidade entre objectivo e métodos utilizados 5
7. São quantificados DP? 5
8. Existe análise dos desvios de posicionamento? 5
9. É apresentado um significado clínico para os DP? 5
10. É um estudo prospectivo? 5
11. A conclusão está em conformidade com o objectivo proposto? 5
12. São sugeridas estratégias para diminuição do erro sistemático? 3
13. Um dos objectivos é definição de protocolo ou linhas de orientação para implementação?
3
14. Existe uma preparação prévia ao tratamento? 4
15. Descrição da preparação, se aplicável. 3
16. Uniformidade do posicionamento dos doentes. 2
17. Consentimento informado 1
Classificação máxima: 62
16
2.2 SELECÇÃO DE ARTIGOS
Foram incluídos artigos que quantificassem DP de doentes com tumores
malignos de próstata ou localizados na região de CP submetidos a tratamentos RTE.
Destes, foram seleccionados os estudos cujos DP foram avaliados através das
ferramentas de aquisição de imagem CBCT ou EPID.
Em alguns dos estudos foram apenas seleccionados os dados referentes às
patologias de próstata e patologias de CP, sendo excluídos todos os DP existentes
referentes a outras patologias.
Autor Ano Posicionamento Amostra
Ferramenta
de aquisição
de imagem
Xu et al21
2008
Dec. Dorsal; Acessório de fixação de mascaras; máscara termoplástica de cabeça; depressor de ombros; apoio
popliteu.
n=19 CBCT
Wang et al23
2009
Dec. Dorsal; Acessório de fixação de mascaras; máscara termoplástica de
cabeça; apoio popliteu. n=22 CBCT
Xu et al22
2009
Dec. Dorsal; Acessório de fixação de mascaras; máscara termoplástica de cabeça; depressor de ombros; apoio
popliteu.
n=19 CBCT
Tabela 2 : Representação por autor, ano, posicionamento, ferramenta de aquisição de imagem dos estudos de
patologias de CP considerados para este trabalho.
2.3 ESTRATÉGIAS DE SELECÇÃO DE ARTIGOS
Para a presente revisão, foram definidos parâmetros de avaliação da qualidade
dos estudos incluídos, tal como descritos por Jadad et al.17
Elaborou-se uma tabela (tabela1) com os itens considerados como
desejavelmente descritos nos artigos. De seguida, foi verificada a conformidade
entre os parâmetros definidos e os descritos nos estudos. Caso os itens estivessem
descritos, seria atribuída a classificação designada. A classificação máxima
estimada para os artigos incluídos foi de 62 pontos. Foram excluídos todos os
estudos que obtiveram uma classificação inferior ou igual a 29 pontos, cujos dados
de DP não estivessem quantificados e cuja amostra fosse inferior a 5 doentes.
Após terem sido incluídos 13 estudos para esta revisão foram validados 9 estudos (3
referentes a tumores de CP e 6 a patologias de próstata). A pontuação média obtida

17
no processo de validação dos estudos foi de 39,1 pontos, com amplitude de 31 a 49
pontos.
Na tabela 2 e 3 encontram-se descritos os estudos e algumas das suas
características.
Tabela 3 : Representação por autor, ano, posicionamento, dimensão da amostra, marcadores fiduciais,
preparação e ferramenta de aquisição de imagem dos estudos de patologias de próstata considerados.
3. RESULTADOS
3.1. DESVIOS DE POSICIONAMENTO
3.1.1. CABEÇA E PESCOÇO
Na tabela 4 encontram-se descritos os resultados, da média (µDP) e desvio
padrão (σDP) dos DP dos mesmos autores. Wang et al. documentaram que a µDP se
encontrava entre 0,0 e 0,7 mm, enquanto o intervalo de σDP é de 0,4 a 1,3 mm. Xu et
al. registou, em 2008, valores de µDP entre 0,6 e 1,2 mm com σDP entre 0,5 e 1,1mm.
Em 2009, o mesmo autor publicou um estudo cujos doentes apresentavam DP entre
0,1 e 0,3 mm, com σ entre 0,4 e 0,8 mm.
Nairz et al.26
2008 Não especificado n=27 Não Não CBCT
Aubry et al.29
2004 Não especificado
n=18 Sim
Bexiga Cheia e recto vazio
EPID
Sandhu et al.
27 2008 Dec. Dorsal;
colchão de vácuo. n=26 Sim
Bexiga Cheia e recto vazio
EPID
Polat et al.28
2008 Não especificado n=27 Não
Bexiga Cheia e recto Vazio. Aconselhame
nto nutricional.
CBCT
Chueng et al.
30 2005 Dec. Dorsal;
colchão de vácuo. n=33 Sim
Bexiga e recto vazios
EPID
Rajendran et al.
31 2010 Dec. Dorsal; apoio
região pélvica e região politeia
n=28 Sim Bexiga cheia EPID

18
Tabela 4: Representação dos DP (média ± desvio padrão) para patologias de CP.X,Y e Z, representam,
respectivamente, os sentidos latero-medial, crânio-caudal e antero-posterior.
3.1.2. PRÓSTATA
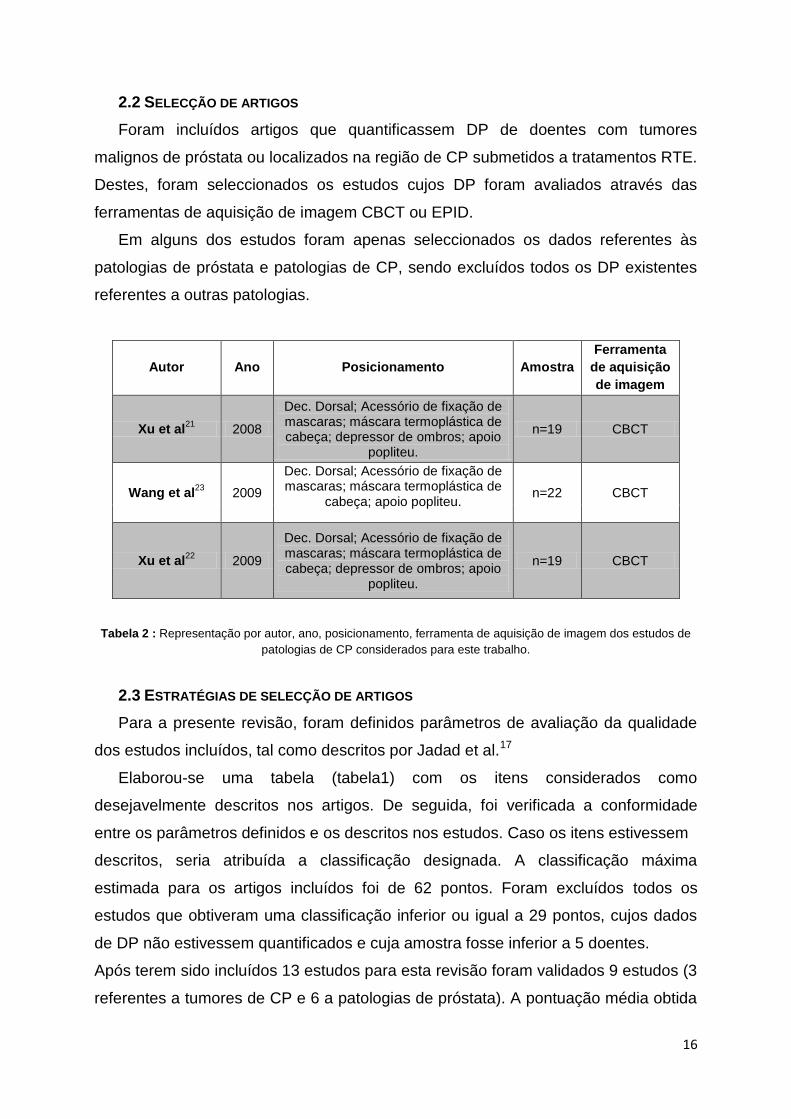
Na tabela 5 encontram-se descritos os resultados dos autores. Nairz et al.
documentaram que o µDP se encontrava entre 0,0 e 0,7 mm, enquanto o intervalo de
σDP é de 1,6 a 3,4 mm. Aubry et al. registou valores de µDP entre 0,0 e 0,2 mm com
σDP entre 0,2 e 0,7mm. Sandhu et al publicou DP entre 1,0 e 5,3 mm, com σDP entre
1,7 e 8,1 mm. Polat et al. analisou, apenas, os DP no sentido antero-posterior, e foi
obtida µDP=0 mm, para todas as aquisições, os valores de σDP encontraram-se entre
1,0 e 1,7mm, enquanto que para Cheung et al., a média dos DP foi quantificada
entre 0,14 e 0,72mm. Rajendram et al. registou um µDP entre 0,7 mm e 7,1mm.
Os valores mais elevados de DP, para estas patologias encontram-se no sentido
antero-posterior.
4. DISCUSSÃO
A reprodutibilidade do posicionamento do doente é a maior barreira para o
aumento da precisão em Radioterapia, que é afectada por múltiplos aspectos
inerentes ao tratamento.13,24,25 Nesse sentido, caracterizam-se os DP como o
somatório de erros sistemáticos (introduzidos ao longo do planeamento), erros
aleatórios (associados a cada fracção) e de incertezas geométricas (relacionadas
com o equipamento).6
Para CP, observa-se que a média dos DP tem uma amplitude entre 0,0 e 1,2
mm, com um desvio padrão máximo de 1,3 mm. É ainda de referir que os resultados
dos não diferem significativamente na literatura consultada, o que poderá ser
atribuído à utilização de máscara de imobilização. Nestes estudos, o aumento dos
AUTOR
DP (MÉDIA ± DESVIO PADRÃO) SENTIDOS
Latero-medial (X)
Cranio-caudal (Y)
Antero-Posterior (Z)
Wang et al.23
-0,7±1,1 -0,4±0,5 -0,3±0,7
-0,7±1,3 0,3±0,5 0,3±0,9
-0,3±1,2 0,0±0,4 0,1±0,7
Xu et al.22
-0,3±0,5 -0,3±0,6
0,1±0,5 0,3±0,8
0,2±0,4 0,2±0,6
Xu et al.21
1,2±0,9 1,2±1,1 1,0±0,8
0,7±0,6 0,6±0,5 0,6±0,5
0,9±0,8 1,0±0,9 0,9±0,7
19
Tabela 5: Representação dos DP(média ± desvio padrão), em mm, para patologias de Próstata. X,Y e Z,
representam, respectivamente, os sentidos latero-medial, crânio-caudal e antero-posterior.
DP no decorrer da RTE é relacionado com o aparecimento de efeitos secundários do
tratamento, nomeadamente mucosite e xerostomia. De facto, com o aparecimento
destes sintomas, a deglutição é afectada, conduzindo a perda ponderal. Se
somarmos a este factor a dor inerente ao desenvolvimento de inflamação nos
tecidos durante o tratamento, compreende-se que o posicionamento do doente sofre
de uma maior imprecisão e menor reprodutibilidade. 21-23
Nesta análise verifica-se que os DP em doentes com patologia de CP são
menores do que no caso de doentes com patologia prostática. No entanto, não
devemos descurar o seu estudo e medição, já que existem valores atípicos para
alguns doentes que deverão sempre ser corrigidos.
Os DP da próstata devem-se principalmente a variações de preenchimento
vesical e rectal. Observa-se que a média dos DP para próstata tem uma amplitude
de 0,0 e 7,1 mm, com um desvio padrão máximo de 7,5mm. Os menores valores de
DP são reportados por Polat et al., apresentando-se no sentido antero-posterior. Tal
poderá estar relacionado com o facto de o aconselhamento nutricional, aplicado por
estes autores, ser um factor essencial para o controlo da posição do recto e,
consequentemente, da próstata. É assim realçada a importância da implementação
de um protocolo que englobe esta componente, além da necessária preparação de
bexiga e recto. Note-se que apenas um autor desconsiderou a preparação rectal e
vesical.26
Autor DP (média±desvio padrão)
S.Latero-Medial (X) S. Craneo-caudal (Y) S.Antero-posterior (Z)
Nairz et al.26
0,0±1,6 0,0±2,4 0,7±3,4
Aubry et al.29
0,2±0,2 0,0±0,4 0,2±0,7
Sandhu et al.27
3,9±5,9 1,0±1,7 3,6±5,6
5,3±8,1 2,4±2,1 4,9±7,5
3,8 ±5,5 2,8±2,1 5,2±7,1
Polat et al.28
Não foi avaliado Não foi avaliado 0±1,7 0±1,0 0±1,3
Chueng et al.30
0,14±0,9 0,45±1,3 0,72±1,8
Rajendran et al.31
0,8±6,8 4,2±4,9 7,1±7,4

20
É ainda de referir que não existe unanimidade na literatura em relação ao
procedimento que deverá ser realizado para controlar o volume da bexiga. Alguns
autores referem instruir os doentes para ingerir sempre a mesma quantidade de
água antes do tratamento. Contudo, na maioria dos artigos analisados não é descrita
a quantidade de água nem o tempo de espera antes de realizar tratamento. Por
outro lado, Chueng et al. defendem que a bexiga e o recto deverão estar vazios
antes do tratamento para que se possa controlar o movimento interno da próstata de
uma forma precisa.
Verifica-se ainda que os autores que utilizam CBCT não colocam marcas
radiopacas na próstata, apesar de não ser referida uma justificação. Sugere-se que
o motivo desta observação se prende com a visualização de tecidos moles nas
imagens de CBCT. Apesar da visualização da próstata se manter inexacta ao
recorrer a tomografia computorizada, é muito mais precisa quando comparada com
EPID, onde apenas são visíveis estruturas ósseas. É ainda de referir que os quatro
autores analisados que utilizam EPID, recorrem à utilização de marcadores fiduciais.
Os DP apresentados nos estudos que contemplam a patologia de próstata
poderão não ser comparáveis, uma vez que se verificam diferenças no
posicionamento utilizado para os doentes de próstata entre os diversos autores.
5. CONCLUSÃO
O desconhecimento dos DP afecta negativamente a precisão da radioterapia,
pelo que a detecção e quantificação dos primeiros permitirá o aumento da última. De
facto, conhecer o DP para cada patologia em cada centro de Radioterapia permitirá
calcular o erro sistemático e aleatório associado à localização de tratamento. Tal
permitirá não só calcular margens de tratamento adequadas, mas também definir
protocolos de aquisição de imagem. Esta abordagem levará a um incremento da
precisão e diminuição das incertezas no tratamento. Aumentar-se-á,
consequentemente, a sua qualidade de administração.
Verifica-se existirem mais estratégias de redução de DP para a patologia de
próstata do que para CP. Esta diferença decorrerá potencialmente dos valores de
DP documentados para CP serem relativamente diminutos quando comparados com
os DP de patologias próstaticas. No entanto, entende-se que para CP é desejável o
desenvolvimento de estratégias que minimizem a toxicidade da RTE. Tal como

21
anteriormente referido, a toxicidade do tratamento provoca queixas álgicas e
evolução da morfologia (com a perda ponderal) do doente, tornando-a, segundo os
autores, na maior fonte de DP durante o tratamento.
Verificam-se, presentemente, grandes discrepâncias na forma de apresentar
estes resultados na literatura. Futuramente dever-se-ão definir linhas de orientação
que permitam uma definição uniforme e inequívoca de como quantificar DP com os
vários métodos disponíveis. Deverão ser sempre tomados em conta aspectos como
a ferramenta de imagem usada, os momentos da sua utilização, a definição de um
eventual protocolo nutricional e/ou de preparação de órgãos de risco e o método de
análise dos vários parâmetros. A instituição de uma homogeneização dos dados
publicados permitiria, no futuro, análises metodológicas mais claras e a potenciação
do desenvolvimento de melhores estratégias no caminho para o aumento da
precisão em radioterapia.
6. REFERÊNCIAS BIBLIOGRÁFICAS
1. Perez C. Principles and practice of Radiation Oncology. Lipincott Williams & WillKins;
2008.
2.Verellen D., Ridder M., Storme G. A (short) history of image-guided radiotherapy.
Radiotherapy and Oncology. 2008;86:4–13.
3.Verellen D., Ridder M., Tournel K., Duchateau M., Reynders T., Gevaert T., Linthout N.,
Storme g. An overview of volumetric imaging technologies and their quality assurance for
IGRT. Acta Oncologica 2008;47:1271-1278.
4.Olsen D., Thwaites D. Now you see it… Imaging in radiotherapy treatment planning and
delivery. Radiotherapy and Oncology 2007;85:173-175
5.Xing L., Thorndyke B., Schreibmann E., Yang Y., Li T., Kim G., Luxton G., Koong A.
Overview of image-guided Radiation Therapy. Medical Dosimetry 2006;31:91-112.
6.Van Herk M. Errors and Margins in Radiotherapy. Seminars in Radiation Oncology
2004;14(1):52-64.
7.Mansson S. Patient positioning correction strategies in radiotherapy: A portal imaging study
[Master thesis]. Lund: Lund University; 2004.
8.Van Herk M., Remeijer P., Rasch C., Lebesque J. The Probability of correct target dosage:
Dose-population histograms for deriving treatment margins in Radiotherapy. Int J Radiation
Oncology Biol Phys 2000;47(4):1121–1135.
9.Kukołowicz P. ICRU 50 & ICRU 62. In: Summer School of Radiotherapy, 2003, Kielce,
Poland. Available from: http://www.pptsearch.net/details-icru-50-amp-icru-62-129640.html

22
10.Langen K., Jones T. Organ Motion and its Management. Int J Radiation Oncology Biol
Phys 2001;50(1):265–278.
11.Yan, D., Lockman, D., Martinez, A., Wong ,J., Brabbins D., Vicini,F., Liang, J., Kestin, L.
Computed Tomography Guided Management of Interfractional Patient Variation. Semin
Radiat Oncol 2005;15:168-179.
12.ICRU Report 62. International Commission on Radiation Units and Measurements.
Prescribing, recording and reporting photon beam therapy. Supplement to ICRU Report 50;
1999.
13.Kupelian P., Langen K., Willoughby T., Zeidan O., Meeks S. Image-Guided Radiotherapy
for Localized Prostate Cancer: Treating a Moving Target. Seminars in Radiation Oncology
2008;18:58-66.
14.Herman M. Clinical use of portal imaging. Seminars in Radiation
Oncology. 2005;15(3):157-67.
15.Oldham M., Le´tourneau D., Watt L., Hugo G., Yan D.,Lockman D., Kim L., Chen P.,
Martinez A., Wong J. Cone-beam-CT guided radiation therapy: A model for on-line
application. Radiotherapy and Oncology. 2005;75(3):271-8.
16.Cook D., Mulrow C., Haynes R. Systematic Reviews: Synthesis of Best Evidence for
Clinical Decisions. Annals of Internal Medicine 1997;126:376-380.
17.Jadad A., Moore R., Carroll D., Jenkinson C., Reynolds D., Gavaghan D., McQuay H.
Assessing the Quality of Reports of Randomized Clinical Trials: Is Blinding Necessary?
Controlled Clinical Trials 1996;17:1-12.
18.Green J. Cochrane Handbook for Systematic Reviews of Interventions - Cochrane Book
Series. The Cochrane Collaboration and John Wiley & Sons; 2008.
19. Ramalho A. Redacção de estudos e projectos de revisão com e sem metanálise.
Coimbra: formasau; 2005.
20.Huang E., Dong L., Chandra A., Kuban D., Rosen I., Evans A., Pollack A. Intrafraction
prostate motion during IMRT for Prostate Cancer. Int J Radiation Oncology Biol Phys 2002;
53(2):261–268.
21.Xu F., Wang J., Bai S., Xu Q., Shen Y., Zhong R. Interfractional and intrafractional setup
errors in radiotherapy for tumors analyzed by cone-beam computed tomography. Chinese
Journal of Cancer 2008;27(10):372-376.
22.Xu F., Wang J., Bai S., Li Y., Shen Y., Zhong R., Jiang X., Xu Q. Detection of
intrafractional tumour position error in radiotherapy utilizing cone beam computed
tomography. Radiotherapy and Oncology 2009;89:311–319.
23.Wang J., Bai S., Chen N., Xu F., Jiang X., Li Y., Xu Q., Shen Y., Zhang H., Gong Y.,
Zhong R., Jiang Q. The clinical feasibility and effect of online cone beam computer

23
tomography-guided intensity-modulated radiotherapy for nasopharyngeal cancer.
Radiotherapy and Oncology 2009;90:221–227.
24.Smitsmans M., Pos F, Bois J., Heemsbergen W., Sonke J., Lesbesque J., Van Herk M.
The influence of a dietary protocol on Cone Beam CT-Guided Radiotherapy For Prostate
Cancer Patients. Int J Radiation Oncology Biol Phys 2008;71(4):1279–1286.
25.Rosewall T., Chung P., Bayley A., Lockwood G., Bristow R., Kong V., Milosevic M.,
Catton C. A randomized comparison of interfraction and intrafraction prostate motion with
and without abdominal compression. Radiotherapy and Oncology 2008;88:88–94.
26.Nairz O, Merz F, Deutschmann H, Kopp P, Schöller H, Zehentmayr F, Wurstbauer K,
Kametriser G, Sedlmayer F. A strategy for the use of image-guided radiotherapy (IGRT) on
linear accelerators and its impact on treatment margins for prostate cancer patients.
Strahlenther Onkol. 2008;184(12):663-7.
27.Sandhu A., Sethi R., Rice R., Wang J., Marcus L., Salem C.,Downs T., Kellogg J., Millard
F., Pawlicki T., Mundt A. Prostate bed localization with image-guided approach using on-
board imaging: Reporting acute toxicity and implications for radiation therapy planning
following prostatectomy. Radiotherapy and Oncology 2008;88:20–25.
28.Polat B., Guenther I., Wilbert J., Goebel J., Sweeney R., Flentje M.,Guckenberger M.
Intra-Fractional Uncertainties in Image-Guided Intensity-Modulated Radiotherapy (IMRT) of
Prostate Cancer. Strahlenther Onkol 2008;184:668–73
29.Aubry F., Beaulieu L., Girouard L., Aubin S., Tremblay D., Laverdière J., Vigneault E.
Measurements of intrafraction motion and interfraction and intrafraction rotation of prostate
by three-dimensional analysis of daily portal imaging with radiopaque markers. Int J Radiat
Oncol Biol Phys. 2004;60(1):30-9.
30.Cheung P., Sixel K., Morton G., Loblaw D., Tirona R., Pang G., Choo R., Szumacher E.,
Deboer G., Pignol J. Individualized planning target volumes for intrafraction motion during
hypofractionated intensity-modulated radiotherapy boost for prostate cancer. Int J Radiat
Oncol Biol Phys. 2005;62(2):418-25.
31.Rajendran R., Plastaras J., Mick R., McMichael Kohler D., Kassaee A., Vapiwala N. Daily
isocenter correction with electromagnetic-based localization improves target coverage and
rectal sparing during prostate radiotherapy. Int J Radiat Oncol Biol Phys. 2010;76(4):1092-9.
32.Skarsgard D., Cadman P., El-Gayed A., Pearcey R., Tai P., Pervez N., Wu J. Planning
target volume margins for prostate radiotherapy using daily electronic portal imaging and
implanted fiducial markers. Radiation Oncology 2010;5:52.
33.Huang E, Dong L, Chandra A, Kuban DA, Rosen II, Evans A, Pollack A. Intrafraction
prostate motion during IMRT for prostate cancer. Int J Radiat Oncol Biol Phys
2002;53(2):261-8.

24
34.Létourneau D, Martinez AA, Lockman D, Yan D, Vargas C, Ivaldi G, Wong J. Assessment
of residual error for online cone-beam CT-guided treatment of prostate cancer patients. Int J
Radiation Oncology Biol Phys 2005;62(4):1239–1246.
35.Takemura A, Shoji S, Ueda S, Kurata Y, Kumano T, Takamatsu S, Suzuki M. Effect of
daily setup errors on individual dose distribution in conventional radiotherapy: an initial study.
Radiol Phys Technol 2009;2(2):151-8.

25
26
THE FEASIBILITY OF AN IGRT PROTOCOL
ANA RITA SIMÕES1, MARGARIDA EIRAS
2, ISABEL MONTEIRO GRILLO1.
1-SERVIÇO DE RADIOTERAPIA, HOSPITAL DE SANTA MARIA, CENTRO HOSPITALAR LISBOA NORTE, EPE.
2-ESCOLA SUPERIOR DE TECNOLOGIA DA SAÚDE DE LISBOA.
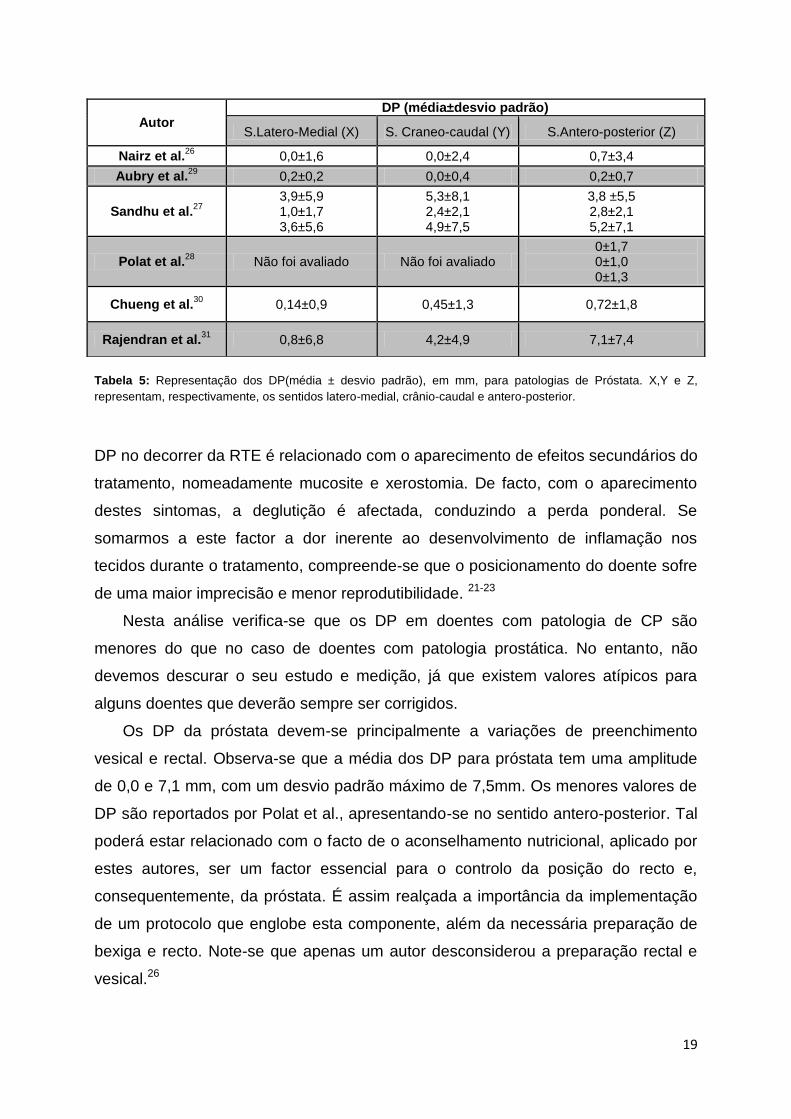
BACKGROUND/PURPOSE: Treatment accuracy and reproducibility are important issues in
radiotherapy. In order to minimize uncertainties, implementation of Image-Guided
Radiotherapy(IGRT) has become an imperative. This work is intended to discuss and assess
the feasibility of an implemented IGRT protocol in a radiotherapy department, for prostate
and Head ans Neck(HN) patients, with the use of Cone-Beam Computed
Tomography(CBCT).
MATERIAL/METHODS: Computed Tomography Dose Indices(CTDI) were measured in a
phantom to preview the delivered doses with CBCT. A sample of 21 patients(pts) was then
selected, composed of 14 pts with prostate and 7 pts with HN tumours. CBCT images were
subsequently acquired from pts. Dose distributions were performed for 6 prostate and 6 head
and neck pts, chosen according to setup deviation magnitude in control charts.
RESULTS: The administered doses ranged from 9,18mGy to 15,76mGy for HN and from
170,7mGy to 528,8mGy. Differences in Prostate PTV were:-40,3cc to 2,8cc for PTV1; -
22,3cc to -4cc for PTV2 and -8,1cc to -2,7cc for PTV3. For HN pts the differences in dose
distributions ranged from -7,4cc to 3,3cc for PTV1 and from -5,1cc to 0.8 cc for PTV2.
CONCLUSIONS: The IGRT protocol is feasible, safe and yields a clear therapeutic gain for
pts with HN and prostate tumours. Future work should be aimed at accounting for the dose
delivered with CBCT at the treatment planning level.
ADVANCES IN KNOWLEDGE: A new evaluation method for IGRT protocol efficacy, that
takes into account setup error corrections dosimetrically, is described. According to it,
increased dose administered by CBCT is justified.
INTRODUCTION
With the emergence of new dose-delivering techniques in the 1990s, such as radiosurgery
and Intensity Modulated Radiotherapy (IMRT), treatment accuracy and reproducibility in

27
Rdiotherapy (RT) became a crucial issue.[1-4] In order to minimize positioning uncertainties,
previously described by several authors, implementation of imaging tools for treatment
verification has become an imperative. [5-8]
The utilisation of Imaged-guided Radiotherapy (IGRT) protocols has been precisely
described in the literature in several instances, as has the use of imaging tools in the
treatment room to evaluate and correct set-up deviation (SetD). One of these tools is the
Cone Beam Computed Tomography (CBCT), which allows the tridimensional verification of
patient anatomy, enabling visualization of the tumour and surrounding structures. It is thus
possible to adjust patient positioning immediately before treatment, detecting gross errors,
eliminating systematic errors and reducing random errors.[9-13] The implementation of an
IGRT protocol, using CBCT, allows for a predicted increase in the clinical benefit of
radiotherapy, since monitoring organ motion, verification of tumour volume movement, size
and position, and control position error are thus made possible.[7,14-20]
However, there is a foreseeable consequence: the administered dose is increased by image
acquisition during treatment. The Report of the American Association of Physicists in
Medicine (AAPM) Task Group 75 recommends that the risk of increasing dose has to be
weighed against the eventual increase in precision during treatment delivery.[21]
In accordance with this paradigm, the feasibility of the imaging verification protocol for
prostate and head and neck tumours using CBCT, implemented at our department, is hereby
analysed, we verify an eventual clinical benefit that, may, outweigh the aforementioned dose
increment. In order to accomplish this purpose, Computed Tomography Dose Index (CTDI)
values were measured in a phantom so as to preview the delivered doses with CBCT
acquisition. CBCT images were subsequently acquired from patients. Doses distributions
were then performed in a Treatment Planning System (TPS), taking into account the setup
deviation (SetD) measured in patients, with the objective of simulating what would be the
predictible scenario if the deviations had not been corrected.
METHODS AND MATERIALS
As aforementioned, the main objective of the work hereby reported was the evaluation of the
feasibility of the IGRT protocol currently implemented at our department. CTDI
measurements inherent to the acquisition of CBCT imaging were quantified for prostate and
HN pathologies with the different filters and collimators of the Beam Modulator TM (ELEKTA
Oncology Systems,Crawley, UK) linear accelerator. A sample of 21 patients 7 with HN and
14 with prostate tumours) was subsequently selected. Pre-treatment imaging was acquired in
accordance with the IGRT protocol, and by using control charts, pts with SetD out of statistic

28
control were identified. Dosimetric distributions were performed for the latter patients to
evaluate the impact of the SetD in case these would not have been corrected.
Kilovoltage X-ray IGRT system
CTDI measurements were made in a Beam ModulatorTM (ELEKTA Oncology Systems,
Crawley, UK) linear accelerator using CBCT protocols integrated into the X-Ray Volume
Imaging (XVI®) software as described by several authors. [22-24] The XVI® system (release
4.2.1) consists of a conventional x-ray tube mounted on a retractable arm and a kV detector
planel, itself mounted on the drum of the digital accelerator. The tube was located 1000mm
from the center of rotation and has 1,5mm Al equivalent inherent filtration and additional
compound filtration of 2mm Al and 0,1mm Cu. The tube potentials ranged from 40kVp to
130kVp. Exposures are pulsed and range from 0,1mAs to 500 mAs per X-ray projection. In
the site opposite to the tube is located the amorphous silicon (AmSi) flat panel, which has an
active area of 409,6x409,6mm and is located 536mm from the axis rotation.
CTDI measurements
CTDI measurements were performed in a phantom (Fluke Biomedical Model 76-414-4150)
made of solid acrylic having a thickness of 15 cm and a diameter of 32 cm, in order to
simulate the pelvis, or 16 cm, to simulate the head (Figure 1).These two phantoms contained
five probe holes, one in the center and four around the perimeter, 90º apart from the center
and 1cm from the edge. Each part includes five acrylic rods for plugging all the holes in the
phantom. A 0,125cm3 ionization chamber (TM3009, PTW Freiburg) was used in this study
(Nk= 8,342*10^6 Gy/C and Kq=1.0 were introduced in PTW webline electrometer).
Measurements were made in the center and at four equal peripheral holes. For the pelvis,
dose indices were acquired with 660 frames in full rotation (360º). The reconstructed
diameter for this location was the medium field of view (FOV), corresponding to 410 mm. For
the head, 361 frames were acquired with a 160º rotation and a small FOV, with 270 mm of
diameter. In order to simulate the treatment setup for this location, the flat panel was shifted
laterally to a corresponding asymmetric collimator.
The Report of the AAPM Task Group 75 recommends CTDIw to be a weighted index, since it
reflects the weighted average of dose deposition in the peripheral (p) and centrer (c) as in
the relation (1):
(1) CTDIw=
, in mGy.
Figure 1: CTDI measurements for pelvis region (on the left) and Head region (on the right).

29
Patients
Prostate and HN patients were randomly selected. This study included 14 prostate patients
and 7 HN patients. Regardless of the treatment technique, all patients underwent an IGRT
protocol for verification of patient setup and treatment delivery conditions. All patients had
localized tumours, with no known metastases in other organs. The HN patients were
diagnosed with tumours located in the tongue (n=2), in the oral cavity (n=2), in the glottis
(n=1), in the parotid (n=1) and in the cheek mucosa (n=1).
Prostate patients were instructed to urinate and drink 250mL of water 30 minutes before
treatment. They were also told to empty their rectums 2 hours prior to each radiotherapy
fraction. Nutritional support was provided, in order to allow for a diet without residue.
All patients signed an informed consent.
IGRT Protocol
Each imagiologic verification comprised of an acquisition before treatment. A post-correction
acquisition was carried out to confirm SetD corrections.
The periodicity of acquisitions was consecutive for the first four fractions of treatment. A
mean of the deviations from the three initial fractions was calculated, with the purpose of
minimising systematic error and, thereafter, applied to the fourth treatment fraction. Weekly
verifications were subsequently scheduled.
Deviation corrections were performed according to the defined tolerance values (TL), which
were 3 mm for HN in all axes and for all treatment phases. For the first phase of treatment of
the prostate group, tolerance values were 5 mm in the latero-medial (LM) and in the cranio-
caudal (CC) axes, with 3 mm in the antero-posterior axis (AP). For the second and third
treatment phases, tolerance values were defined, for the latter group, as 3 mm in all
directions.

30
Setup deviation impact
In order to select the patients whose SetD were out of statistical control and to evaluate
process quality, control charts were constructed for the mean and standard deviations of the
setup deviations observed in the LM, CC and AP axes. The upper and lower control limits
(UCL and LCL, respectively) were built with the values of 3 standard deviations and TL,
which were previously described.
Patients with SetD out of the action limits and/or the TL on the control charts were selected
from the sample of 21 patients. The analysis of the points in the control charts was restricted
to points over or overlapping the control limits for mean and standard deviation (SD), since
the established order of these points corresponds to each patient and not to a temporal
observation.
For evaluating the SetD impact dose distribution a method described by Takemura et al.[25]
was adapted. Initial dose distributions (dose distribution 1), approved at the beginning of
treatment, were copied for the selected patients and new dose distributions (dose distribution
2) were carried out on the XIO® (CMS) TPS. The only difference applied to these new
plannimetries was the isocenter location, in order to simulate SetD.
For SetD simulation, treatment fields were copied. As an example, if we consider 3 corrected
SetD and an implemented mean of the systematic error for the ensuing fractions of HN
treatment, prescribed as 2 Gy in 25 fractions, the initially generated fields were copied 4
times (the fields with the isocenter of the mean were prescribed with 22 fractions and the
other 3 groups of fields with one fraction, corresponding to 3 corrected SetD). If SetD weren’t
corrected during the 3 initial fractions, the mean was applied to all the subsequent fractions.
In order to find the new isocenter that took the corrected SetD or mean into account, a sum
of the SetD values was calculated and applied to the number of fractions in which they
occurred. After this, monitor unit number was verified and adjusted, if necessary, to be
exactly equal to the dosimetric distribution 1. Normalization points were also maintained.
However, it became clear that the Multi Leaf Collimator (MLC) conformation was altered in
the treatment planning system, when the isocenter coordinates were modified. In order to
tackle this problem, the coordinates of each leaf pair was manually introduced for each field
as to ensure that they would be in the exact same position of the initial plan.
Lastly, dose-volume histograms (DVH) were generated and the differences in dose received
by organs at risk (OAR) were calculated between dose distribution 2 and dose distribution 1.
The expression (2) summarizes what has been here described.
(2)

31
Where is the difference in dose, received by OAR (in percentage, %, of irradiated
volume for prostate patients and in cGy for HN patients since for these mean and maximum
doses were evaluated), is the OAR irradiated volume in dose distribution 2 (in % of
irradiated volume, for prostate patients or cGy, for HN patients) and is the OAR
irradiated volume in dose distribution 1 (in % of irradiated volume or cGy).
Differences in the Planning Target Volume (PTV) coverage with 95% of the prescribed dose
(in cc) between the dose distribution 1 and dose distribution 2 were, likewise, compared. The
expression (3) describes this is:
(3)
is the difference in the volume of the PTV coverage with 95% (in cc), is the
volume of PTV coverage with 95% of the prescribed dose in the dose distribution 2 (in cc)
and is the volume of PTV coverage with 95% of the prescribed dose in the dose
distribution 1 (in cc).
Since there were differences in the OAR considered for treatment planning in the HN group,
maximum and mean doses (cGy) were compared in these patients only for the spinal cord,
since this is an organ commonly considered for all patients. For prostate patients, dose
differences for the OAR were evaluated for bladder and rectum according to the following
constraints: 50% of the bladder volume should only receive up to 70 Gy and 50%, 25% and
5% of the rectal volume should be irradiated with no more than 60 Gy, 72 Gy and 74 Gy
respectively. Differences between the final and initial dose distributions were calculated and
the results were analyzed. Differences in the coverage of volumes irradiated with 95% of the
dose were evaluated for both pathologies.
For the analysis of the difference of the dose distribution values, either for the PTV coverage
with 95% of the prescribed dose or for the aforementioned OAR assessment, a Wilcoxon test
for paired samples was used. Statistical significance was considered with p<0,05.
RESULTS
CTDI
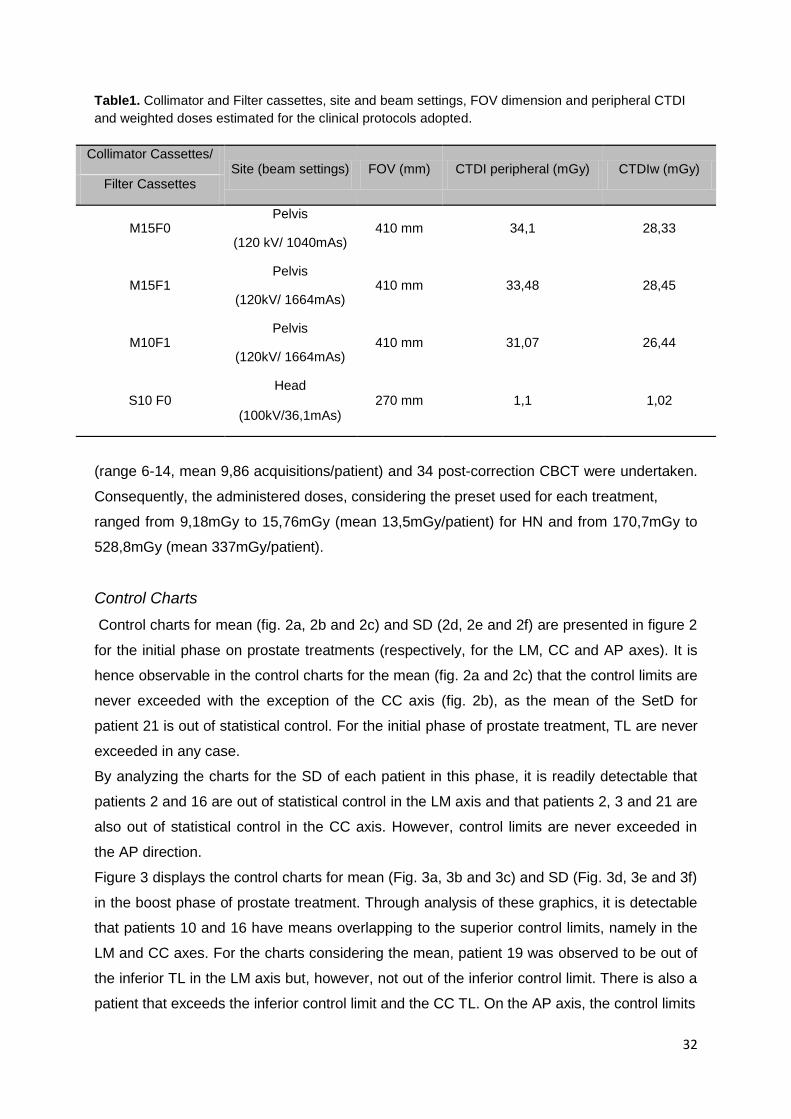
Table 1 shows the values of CTDI, CTDI peripheral and CTDIw. Measurements of CTDIw for
beam settings in the pelvis were 28.33, 28.45 and 26.44 mGy for 410 mm medium FOV, for
M15F0, M15F1 and M10F1, respectively. For head, CTDIw measurement was 1,02 mGy.
A total of 76 HN pre-treatment CBCT (range 9-13, mean 10,86 acquisitions/patient) and 17
HN post-correction CBCT were performed. For prostate patients, 138 pre-treatment CBCT
32
Table1. Collimator and Filter cassettes, site and beam settings, FOV dimension and peripheral CTDI
and weighted doses estimated for the clinical protocols adopted.
(range 6-14, mean 9,86 acquisitions/patient) and 34 post-correction CBCT were undertaken.
Consequently, the administered doses, considering the preset used for each treatment,
ranged from 9,18mGy to 15,76mGy (mean 13,5mGy/patient) for HN and from 170,7mGy to
528,8mGy (mean 337mGy/patient).
Control Charts
Control charts for mean (fig. 2a, 2b and 2c) and SD (2d, 2e and 2f) are presented in figure 2
for the initial phase on prostate treatments (respectively, for the LM, CC and AP axes). It is
hence observable in the control charts for the mean (fig. 2a and 2c) that the control limits are
never exceeded with the exception of the CC axis (fig. 2b), as the mean of the SetD for
patient 21 is out of statistical control. For the initial phase of prostate treatment, TL are never
exceeded in any case.
By analyzing the charts for the SD of each patient in this phase, it is readily detectable that
patients 2 and 16 are out of statistical control in the LM axis and that patients 2, 3 and 21 are
also out of statistical control in the CC axis. However, control limits are never exceeded in
the AP direction.
Figure 3 displays the control charts for mean (Fig. 3a, 3b and 3c) and SD (Fig. 3d, 3e and 3f)
in the boost phase of prostate treatment. Through analysis of these graphics, it is detectable
that patients 10 and 16 have means overlapping to the superior control limits, namely in the
LM and CC axes. For the charts considering the mean, patient 19 was observed to be out of
the inferior TL in the LM axis but, however, not out of the inferior control limit. There is also a
patient that exceeds the inferior control limit and the CC TL. On the AP axis, the control limits
Collimator Cassettes/ Site (beam settings) FOV (mm) CTDI peripheral (mGy) CTDIw (mGy)
Filter Cassettes
M15F0 Pelvis
410 mm 34,1 28,33 (120 kV/ 1040mAs)
M15F1 Pelvis
410 mm 33,48 28,45 (120kV/ 1664mAs)
M10F1 Pelvis
410 mm 31,07 26,44 (120kV/ 1664mAs)
S10 F0 Head
270 mm 1,1 1,02 (100kV/36,1mAs)

33
are never exceeded. Nevertheless, the superior TL is exceeded in the cases of patients 2, 3,
7 and 21. It is evident that patients 2 and 3 are out of control limits on the LM and CC axes,
respectively, on the SD charts. On the AP axis, there are no patients that exceed the
aforementioned control limits.
The control charts for the mean of the SetD of the initial phase in HN patients are displayed
in figures 4a, 4b and 4c for the LM, CC and AP axes, respectively. It is observable that there
are no points out of the control limits, except for the chart of the SetD in the AP axis, since
the mean of the deviations in patient 12 is out of the inferior limit. After investigation of its
causes, this discrepancy was attributed to the patient’s severe weight loss, with increasing
SetD during the first phase of treatment. In this case, during the last week of the initial phase,
daily CBCT became mandatory. As a correction strategy during the boost phase, a new
dosimetric planning was performed including obviously a new immobilization mask and a
second planning CT. In the control charts of the SD on the LM (4d), CC (4e) and AP (4f)
directions, patients 12, 6 and 1, respectively, had SD that exceeded the control limits.

34
Through analyzing the control chart for the mean of the SetD during the boost phase (Fig.
5a, 5b and 5c) in HN patients, it can be observed that the SD of patients 4 and 11 is out of
control limits in the AP and LM axes, respectively. Also worthy of note are the mean of
patient 4, which is very close to the inferior control limit of the chart in the CC axis, and the
mean of the SetD of patient 8, which exceeds the superior TL but keeps within control limits
in the CC axis. In the control charts of the SD (Fig. 5d, 5e and 5f) there are no patients out of
statistical control.
According to the results in the control charts, 6 prostate and 6 head and neck patients were
selected for a new dosimetric distribution accounting for the setup errors on the isocenter
position (distribution 2), with the intent of verifying what would have happened if these out-of-
tolerance SetD had not been corrected. This was done by comparing distribution 2 to the
dose distribution approved at the treatment planning phase (initial distribution or distribution
1), performed on the treatment planning computed tomography.
It is important to note that the patients out of statistical control were found not to comply with
the dietary recommendations, even though they did not have a filled rectum as observed on
CBCT imaging.

35
Dose distributions
Table 2 displays the result of for the prostate patients. For this group, considered
OAR were the rectum and the bladder and were evaluated according to aforementioned
dose constraints. For patient 3, the prescribed dose was 65Gy, hence, bladder or rectal
volumes irradiated with a dose equal or superior to 70Gy and 72Gy, respectively, were not
considered. A negative value on the reflects a decrease of the OAR irradiated volume
in the dose distribution 2 which was performed with the observed setup errors, whereas a
positive value represents an increase in the irradiated volume.
With the exception of patient 3, an increase in the difference of irradiated rectum
corresponds to a decrease in bladder volume and vice-versa in all patients. Differences in
dose distributions for the irradiated bladder volume percentage range from -4,69% to 5,44%
(in average -1,4%).
It is noteworthy to state that, for 4 of the studied patients, a decrease of the bladder irradiated
volume is observed in dose distribution 2, whereas an increase of bladder irradiated volume
in dose distribution 2 happens in the other 2 patients. However, the bladder volume

36
percentage irradiated with a dose equal or superior to 70Gy on distribution 2 does not
significantly differ from the initial one (p=0,232).
Table 2. Difference in percentage of irradiated volume in bladder and rectum observed in the two dose
distributions for prostate patients.
, Differences in volume of organ at risk (% irradiated volume)
Patient Bladder ≥70Gy Rectum ≥60 Gy Rectum ≥72Gy Rectum ≥74Gy
2 -3,97 9,81 1,61 0,26
3 NA 2,55 NA NA
7 -4,6 14,83 16,38 11,29
10 1,22 -3,5 -1,72 -1,25
16 -4,69 6,62 4,46 3,47
19 5,44 -16,31 -12,48 -1,92
21 -1,83 9,75 7,78 6,29
Average, µ -1,4 3,4 2,7 3

37
On the other hand, differences in dose distribution for the irradiated rectum volume ranged
from -16,32% to 16,38% (in average 3,4, 2,7 and 3 for the Rectum≥60 Gy, 72Gy and 74Gy,
respectively). In this case, it was verified that 5 of 7 patients had an increase of irradiated
rectum volume for the measured dose constraints.
Nevertheless, the volume percentage of the irradiated rectal volume with a dose equal or
superior to 60Gy, 72 Gy or 74 Gy on distribution 2 does not significantly differ from dose
distribution 1 (p=0,199; p=0,232; p=0,232; respectively).
The difference in volume (cc) of the PTV (1; 2 and 3) irradiated with 95% of the prescribed
dose between the dose distribution 2 and 1 is shown in Table 3. This was not evaluated in
the case of the PTV3 of patient 3, since he did not have a third phase of treatment. The
negative values displayed on the table reflect a decrease in this difference. These
differences range from -40,3cc to 2,8cc for PTV1; -22,3cc to -4cc for PTV2 and -8,1cc to -
2,7cc for PTV3.
Table 3. , difference in PTV volume (cc) irradiated with 95% of the prescribed dose as
observed in the two dose distributions for prostate patients.
In all cases, distribution 2 demonstrates that there is a decrease in the volume irradiated with
95% of the prescribed dose against the initial distribution (dose distribution 1).
The median of the PTV1, PTV2 and PTV3 volumes irradiated with 95% of the prescribed
dose for distribution 2 was significantly lower than on the initial distributions (p=0,009;
p=0.009 and p=0,014; respectively).
Table 4 displays the result of the differences of the maximum and mean doses on the spinal
cord of HN patients between dose distribution 1 and 2. As stated earlier in other instances, a
negative value for these differences reflects a decrease in the dose as observed on
distribution 2. This was, however, not performed in the case of patient 6, since the spinal
cord was not considered as an organ at risk for the initial distribution.
, Difference in irradiated PTV for prostate patients (in cc)
Patient PTV 1 PTV 2 PTV3
2 -11,37 -13,43 -5,19
3 -40,3 -22,3 NA
7 -14,1 -10,8 -4,4
10 -2,8 -6,6 -3,6
16 -4,8 -5,4 -4,1
19 -15,4 -11,7 -8,1
21 -4,4 -4 -2,7
Average, µ -13,3 -10,6 -4,7

38
Three of the analyzed patients would have an inferior dose maximum if the SetD had not
been corrected, however, two patients have an increase in this dose maximum. It is also
observable that the mean dose on the spinal cord would increase only in one patient and
would diminish in 4 other cases if the SetD had not been corrected.
The median of the dose maximum on the spinal cord does not significantly differ between
distributions 2 and 1(p=0,229). A similar observation was made for the median of the mean
dose on the spinal cord (p=0,137).
Table 4. Difference in percentage of spinal cord maximum and mean observed in two dose
distributions for HN patients.
Volume irradiated (in cc)
Patient Spinal cord max Spinal cord
mean
1 86 21
4 -103 -59
6 NA NA
8 -36,8 -17,3
11 -66 -7
12 64 -33
The difference in volume (in cc) of both PTV1 and PTV2 irradiated with 95% of the
prescribed dose between distribution 1 and 2 is presented on table 5. This difference was not
assessed for patient 6, since in this case there was no second phase of treatment.
The negative values on this table report a decrease in the volume of the PTV irradiated with
95% of the prescribed dose between dose distribution 2 and 1, so a negative value implies
that the volume covered with 95% of the dose was inferior in distribution 2.
As can be seen, differences in these values range from -7,4cc to 3,3cc for PTV1 and from -
5,1cc to 0.8 cc for PTV2.
For PTV1, in all cases, distribution 2 demonstrates a decrease in the volume irradiated with
95% of the prescribed dose with the exception of patient 1. In the case of PTV2 results are
similar, with a decrease in values for all patients except for patient 2, in whose case there is
an increase in the volume of the PTV2 irradiated with 95% of the dose and for patient 12, for
whom no difference can be noted.
The median of the volume of PTV1 irradiated with 95% of the prescribed dose on distribution
2 is significantly inferior to this value as verified on the initial distribution (p=0,0365). For the

39
PTV2, the median of the volume covered with 95% of the prescribed dose does not differ
significantly between dose distributions (p=0,1425).
Table 5. Difference in cc, on PTV 1 and 2 observed in two dose distribution for HN patients.
Volume irradiated com 95% da dose prescrita (in cc)
Patient PTV 1 PTV 2
1 2,5 0,8
4 -3,4 -5,1
6 3,3 NA
8 -1,9 -2,2
11 -4,7 -0,9
12 -7,4 0
Average, µ -1,9 -1,5
DISCUSSION:
The main purposes of the reported work were to quantify SetD during radiotherapy for
prostate and head and neck (HN) pathologies, as measured with CBCT. Justification of
CBCT doses administered to the patients was hence performed, verifying the eventual
treatment benefit of this IGRT protocol by simulation of the SetD during radiotherapy in dose
distributions. This allowed for predicting a situation in which these errors would not have
been corrected. The adequacy of the imaging protocol for these pathologies was assessed.
Finally, the identification of an optimal point between imaging dose and beam alignment error
correction, which is a key issue in the precision of radiotherapy delivery, was also addressed.
The TL for the initial prostate treatment phase, either for the mean or for the standard
deviation, are never exceeded. This might result from the fact that every patient was carefully
instructed about rectum and bladder preparation. It is noteworthy that the LM and CC TL set
for the initial phase of the prostate should be rethought, since the mean values of the SetD of
the sample set never exceed ± 0.3 cm. Patients were also instructed to repeat the
preparation protocol again in case a rectal and/or bladder filling that differed from the
planned one was observed on pre-treatment control imaging. Still it is important to state that
the SD for the prostate patients was high, because even when the means of SetD are in
control, most patients are out of statistical control in SD charts. This induced us to think
about our methods and protocols.

40
The TL at the initial phase of HN treatment could also be reduced, since the mean of the
SetD is never superior to ± 0,2 cm in the LM and CC directions. On the AP axis, the mean is
always inferior to ±0,25cm.
In view of the results observed on the control charts, it is clear that 29% and 25% of the
sample set of patients with prostate tumours is out of statistical control on the initial and
boost phases of treatment, respectively. In the case of the HN group, 43% of the sample set
is out of statistical control, however, in the boost phase, this proportion is reduced to 33%.
Through the simulation reported in this work, it was found that if the SetD had not been
corrected, there would not be a significant difference on the median of the percentage of the
irradiated volume of the OAR for prostate patients. Interestingly for PTV coverage with 95%
of the prescribed dose, the opposite is observed, with a decrease of, in average 13,3 cc in
PTV1, 10,6 cc in PTV2 and 4,7 cc in PTV3. This demonstrates a therapeutic gain through the
use of verification imaging, even though we are increasing the delivered dose by 337 mGy
(in average) with its use. This increment is obtained through ensuring that the planned dose
is indeed administered on the target volume and that this volume is treated globally and
reproducibly.
Regarding the HN patients, there was no significant difference in median values of the mean
dose delivered to the spinal cord after comparison of the aforementioned dose distributions.
Yet, there is a significant decrease in PTV1 coverage with 95% of the prescribed dose when
comparison of the distribution 1 with distribution 2 was undertaken, with an average of -1,9
cc in loss. This difference was not observed for PTV2. It is thus clear that, from the
therapeutic perspective, there is an increase in the therapeutic ratio from the increment of
dose delivery of an average of 13,5 mGy/patient provoked by verification imaging, since the
tumour control probability might again be affected by a decreased dose coverage of the
target volume.
Other positive aspects might be inferred from the reported observations, since the
visualization of target volumes and surrounding structures allow for monitoring of the filling
status of organs such as the bladder or the rectum. It is also possible to assess the status of
the target volume itself, which might decrease, move and thus be altered during treatment.
CONCLUSION:
Even though this is a small series of patients, the reported work clearly states both the utility
and feasibility of the IGRT protocol in view of the dose-benefit paradigm, with a solid
justification of the dose increment delivery through the use of the CBCT imaging tool. Indeed,
simulated data confirmed the point of using CBCT according to the described protocol.

41
In the future, studies should be made to allow for the CBCT dose to be accounted for in the
treatment planning phase, even though there are difficulties in adding this dose to the
prescribed one, as described by Murphy et al. [21]
This work allowed for determination of aspects of our IGRT protocol that need to be
rethought, namely on the TL. These must be chiefly re-assessed in the LM and CC axes
during the first phase of treatment for prostate tumours, whereas for HN tumours this must
be done for all axes.
To conclude, the next steps in the adaptation of the IGRT protocol will be to study and
recalculate the TL, just as defining the correct methodology to apply these in all cases. In the
ever developing field of radiotherapy precision, adapting and revising these protocols, in light
of new imaging tools, will bring clear gains in the treatment of patients with such a
devastating disease as cancer proves to be.
Acknowledgments: The authors want to thank to Luis Madureira, Ana Duarte and Ana Rato
for helping us with CTDI acquisitions and dose distribution analyses.
References:
1. Verellen D., Ridder M., Tournel K., Duchateau M., Reynders T., Gevaert T., Linthout N.,
Storme g. An overview of volumetric imaging technologies and their quality assurance for
IGRT. Acta Oncol 2008,47:1271-1278.
2. Verellen D, Ridder M, Storme G. A (short) history of image-guided radiotherapy. Radiother
Oncol 2008;86:4–13.
3. Xing L., Thorndyke B., Schreibmann E., Yang Y., Li T., Kim G., Luxton G., Koong A.
Overview of image-guided Radiation Therapy. Med Dosim 2006;31:91-112.
4. Olsen D., Thwaites D. Now you see it…Imaging in radiotherapy treatment planning and
delivery. Radiother Oncol 2007;85:173-175
5. Van Herk M. Errors and Margins in Radiotherapy. Seminars Radiat Oncol 2004
January;14, (1):52-64.
6. Van Herk M, Remeijer P, Rasch C, Lebesque J. The Probability of correct target dosage:
Dose-population histograms for deriving treatment margins in Radiotherapy. Int J Radiat
Oncol Biol Phys 2000;47(4):1121–1135.
7. Langen K, Jones T. Organ Motion and its Management. Int J Radiat Oncol Biol. Phys
2001;50(1):265–278.
8. Yan D, Lockman D, Martinez A, Wong J, Brabbins D, Vicini F, Liang J, Kestin L.
Computed Tomography Guided Management of Interfractional Patient Variation. Semin
Radiat Oncol 2005;15:168-179.

42
9. The Royal College of Radiologists, Society and College of Radiographers, Institute of
Physics and Engineering in Medicine. On Target: ensuring geometric accuracy in
Radiotherapy. London: The Royal College of Radiologist, 2008.
10. Korreman S, Rasch C, McNair H, Verellen D, Oelfke U, Maingon P, Mijnheer B, Khoo V.
The European Society of Therapeutic Radiology and Oncology–European Institute of
Radiotherapy (ESTRO–EIR) report on 3D CT-based in-room image guidance systems: A
practical and technical review and guide. Radiother Oncol 2010;94:129–144.
11. Van Herk M, Different styles of Image-Guided Radiotherapy. Semin Radiat Oncol 2007;
17:258-267.
12. Dawson L, Sharpe M. Image-guided radiotherapy: rationale, benefi ts, and Limitations.
Lancet Oncol 2006;7:848–58
13. Yan D and Lockman D. Organ/patient geometric variation in external beam radiotherapy
and its effects. Med Phys 2001;28(4):593-602
14. Kupelian P., Langen K., Willoughby T., Zeidan O., Meeks S. Image-Guided Radiotherapy
for Localized Prostate Cancer: Treating a Moving Target. Semin Radiat Oncol 2008;18:58-
66.
15. Huang E., Dong L., Chandra A., Kuban D., Rosen I., Evans A., Pollack A. Intrafraction
prostate motion during IMRT for Prostate Cancer. Int J Radiat Oncol Biol Phys
2002;53(2):261–268.
16. Xu F., Wang J., Bai S., Xu Q., Shen Y., Zhong R. Interfractional and intrafractional setup
errors in radiotherapy for tumors analyzed by cone-beam computed tomography. Chin J
Cancer 2008;27(10):372-376.
17. Xu F., Wang J., Bai S., Li Y., Shen Y., Zhong R., Jiang X., Xu Q. Detection of
intrafractional tumour position error in radiotherapy utilizing cone beam computed
tomography. Radiother and Oncol 2009;89:311–319.
18. Wang J., Bai S., Chen N., Xu F., Jiang X., Li Y., Xu Q., Shen Y., Zhang H., Gong Y.,
Zhong R., Jiang Q. The clinical feasibility and effect of online cone beam computer
tomography-guided intensity-modulated radiotherapy for nasopharyngeal cancer. Radiother
and Oncol 2009;90:221–227.
19. Smitsmans M., Pos F, Bois J., Heemsbergen W., Sonke J., Lesbesque J., Van Herk M.
The influence of a dietary protocol on Cone Beam CT-Guided Radiotherapy For Prostate
Cancer Patients. Int J Radiat Oncol Biol Phys 2008;71(4):1279–1286.
20. Létourneau D, Martinez AA, Lockman D, Yan D, Vargas C, Ivaldi G, Wong J.
Assessment of residual error for online cone-beam CT-guided treatment of prostate cancer
patients. Int J Radiat Oncol Biol Phys 2005;62(4):1239–1246.

43
21. Murphy M, Balter J, Balter S, BenComo J, Das I, Jiang S, Ma C, Olivera G, Rodebaugh
R, Ruchala K, Shirato H, Yin F. The management of imaging dose during image-guided
radiotherapy: Report of the AAPM task Group 75. Med Phys 2007;34(10):4041-4063.
22. Amer A, Marchant T, Sykes J, Czajka J, Moore C. Imaging doses from the Elekta
Synergy X-ray cone beam CT system. Br J Radiol 2007;80:476–482.
23. Islam M., Purdie T.,Norrlinger B., Alasti H., Moseley D., Sharpe M., Siewerdsen J, Jaffray
D. Patient dose from kilovoltage cone beam computed tomography imaging in radiation
therapy Med Phys 2006;33(6):1572-82.
24. Walter C., Boda-Heggemann J., Wertz H., Loeb J, Rahn A.,Lohr F.,Wenz F. Phantom
and in-vivo measurements of dose exposure by image-guided radiotherapy (IGRT): MV
portal images vs. Kv portal images vs. cone-beam CT. Radiot Oncol 2007;85:418–423.
25. Takemura A, Shoji S, Ueda S, Kurata Y, Kumano T, Takamatsu S, Suzuki M. Effect of
daily setup errors on individual dose distribution in conventional radiotherapy: an initial study.
Radiot Phys Tecnhol 2009;2(2):151-8.

44
45
ABSTRACT:
BACKGROUND/PURPOSE: Radiotherapy precision is an important issue in current state of the
art treatment methods. In order to ensure target volume coverage and organs at risk sparing,
ensuring that radiation is delivered to intended targets is of utmost importance. Image-guided
radiotherapy (IGRT) provides us with useful tools to address this problem. However, in order
to allow for correct use of these technologies and ensuring proper treatment delivery
methods, systematic and random errors need to be assessed and accounted for at the
treatment planning and delivery stages.
MATERIAL/METHODS: 21 patients (pts) undergoing prostate or head and neck (HN)
radiotherapy at our department were randomly selected and underwent an IGRT protocol
resorting to cone-beam computed tomography (CBCT) as the verification imaging technique.
Setup error analysis was performed in order to evaluate systematic and random errors during
treatment delivery in the cranio-caudal (CC), latero-medial (LM) and antero-posterior (AP)
directions.
RESULTS: Intrafraction movements do not increase during HN treatment except for the LM
direction. In the case of the prostate group, the most increased systematic error values are
observed in the AP direction. For the initial phase of HN treatment, ideal margins for PTV are
2,1mm, 3,5mm and 2,1mm, in the LM, CC and AP directions respectively. For the boost
phase, values thus calculated are 4,0 mm, 1,6 mm e 2,7 mm in the same order. In the
prostate group, ideal margins of 4,8mm, 4,3mm and 5,4mm for the initial phase in the LM,
CC and AP axes were calculated, whereas for the boost phase 5,7mm, 6,5mm e 8,0mm
margins were obtained, considering the same order.
CONCLUSIONS: Patient information on dietary requirements, rectal and bladder preparation
should be stressed and informative methods revised. PTV margins used at our department
IMPACT OF RANDOM AND SYSTEMATIC ERRORS IN
THE DAILY PRACTICE IN RADIOTHERAPY
ANA RITA SIMÕES1, MARGARIDA EIRAS
2, ISABEL MONTEIRO GRILLO1.
1-SERVIÇO DE RADIOTERAPIA, HOSPITAL DE SANTA MARIA, CENTRO HOSPITALAR LISBOA NORTE, EPE.
2-ESCOLA SUPERIOR DE TECNOLOGIA DA SAÚDE DE LISBOA.

46
might be reduced for both phases of HN cancer treatment and for the initial prostate cancer
treatment phase. However, margins applied at the treatment planning stage in the prostate
boost phase need to be increased.
Keywords: Setup Errors, Sistematic Error, Random Error and Isotropic Margins
INTRODUCTION
Precision is a key issue in current state of the art radiotherapy. In fact, as we moved from 2D
to 3D imaging techniques and with the subsequent application of more refined radiotherapy
technologies, such as Intensity Modulated Radiotherapy (IMRT) or stereotactic radiotherapy,
ascertaining that radiation is delivered to the intended targets has become more important
than ever. Indeed, radiation accuracy is logically coupled to an increase in tumour control
probability and a concurrent decrease in treatment-related toxicity. However, the advent of
such concepts, with a close conformity to the tumour progressively becoming the paradigm in
this cancer treatment method, imposes treatment accuracy as a crucial aspect of modern
radiotherapy. 1
The ever evolving field of image-guided Radiotherapy (IGRT) provides us with the tools for
bringing this important issue to new harbours. Indeed, this has been the focus of active
research and development in recent years, with exciting new technologies being looked into
and applied in numerous centers around the globe. One of these advents was the Cone
Beam Computed Tomography (CBCT), which allowed us to perform computed tomography
(CT) immediately before radiotherapy fractions.2-6 Thus, we are nowadays empowered with
the means to compare, with nearly identical resources, patient data, obtained at the planning
and treatment delivery stages, in a safe and effective way. This might allow us to reduce
margins used for treatment planning, with a consequent decrease in toxicity, but still keeping
treated volumes focused on the tumour and any of its microscopic extensions.7
However, we still rely on guidelines yielded by key, world-class, institutes of reference.
Although these guidelines provide crucial information that enables other departments to
implement techniques in a somewhat faster way, it is important to study the impact of these
new radiotherapy delivery methods, in order to provide patients with quality-assured and
reliable treatments.8 Furthermore, people and technology differ between departments and
guidelines implemented in a particular case might help, but they cannot replace data
obtained locally, in the actual working conditions of a particular healthcare unit.
The work hereby reported focused on quantifying the translational and rotational setup
deviations, as well as quantifying the intrafraction movements and setup errors in head and
neck (HN) and prostate cancer patients treated at our department. Its main purpose is,

47
therefore, to adapt our currently implemented IGRT protocol in light of this data. In order to
tackle these issues, rotational and translational deviations were quantified for prostate and
HN patients during treatment, resorting to CBCT as a way to detect differences during
radiotherapy. In addition, the question of the direction with the most important amplitude of
deviation is addressed, as is the eventual difference in systematic and random errors
between the initial and boost phases, since these subjects might yield new paradigms at the
radiotherapy planning stage.
METHODS AND MATERIALS
Patients
From May 2011 to September 2011, patients with prostate and HN cancer undergoing
radiotherapy at our department were randomly selected. This study included 21 patients, 19
male and 2 female, with a mean age of 65 (range 36-79) years. Diagnoses were prostate
cancer in 14 cases and HN cancer in the remaining 7 cases. For the HN patients, 2 were
diagnosed with tumours of the tongue, 2 with oral cavity cancer and the remainder 3 cases
had a diagnosis of glottis, parotid and cheek mucosa tumours. All prostate patients had an
adenocarcinoma histology and all the HN patients had squamous cell carcinomas, except for
the parotid case, in which an adenocarcinoma was confirmed. All the patients had localized
tumours, with no clinical evidence of distant metastases. They all had Karnofsky indices that
were superior to 70%.
Regardless of the treatment technique, all patients underwent an IGRT protocol for
verification of patient setup and treatment delivery conditions.
All patients signed an informed consent.
Patient Positioning
All HN patients were set in a supine position, with their arms along the body, with both
palmar regions touching the table. The MedTechTM (CVICO®) head and shoulder mask
fixation system, as well as thermoplastic head and shoulder masks were used in HN
patients, in order to immobilize the HN region during planning CT and all treatment sessions.
A planning CT with 3mm slices was performed from the vertex of the skull to 3 cm bellow the
xiphoid process.
Prostate patients were set in a supine position using the Combi-FixTM (CVICO®) baseplate,
which combines feet and knee support. Planning CT was acquired from the fourth lumbar
vertebra to 3 cm below the tuberosity of the ischium. For these patients, a bladder and
rectum preparation was recommended: patients were asked to urinate and drink 250 mL of

48
water 30 minutes before treatment and planning CT and instructed to empty their rectums 2
to 3 hours prior to treatment and planning CT. All patients underwent a dietary protocol in
order to minimize bowel movements.
CBCT scans and IGRT Protocol
For each HN patient, CBCT was obtained with 100 kV, 361 mAs, 205º of gantry rotation,
acquiring 361 frames. The prostate parameters for CBCT imaging were 120 kV, 1040 mAs,
360º of gantry rotation and 650 frames were acquired.
All setup errors were analyzed with the Elekta X-ray Volume image (XVI) software.
Automatic-3D registration of the reference planning CT and CBCT scans was performed
using the cross-relation algorithm provided in this Elekta software. In order to obtain setup
errors, CBCT images were acquired according to our IGRT protocol, as described below. An
automatic grey-value matching was performed for prostate patients and an automatic bone
matching was obtained for HN patients. The HN alignment clip-box was defined to include all
the PTV and surrounding bones, like vertebras and the base of skull, excluding chin. The
prostate alignment clip-box was defined to include the whole PTV, surrounding tissues like
the bladder and bones, such as the femoral heads. The rectal volume was excluded to the
maximum possible extent.
In order to assess patient positioning, a pre-treatment (pre-tt) CBCT acquisition was
executed for all imaging verifications. A post-treatment (post-tt) acquisition was also obtained
to evaluate treatment reproducibility. For every setup error correction, a post-correction
acquisition was performed in order to confirm accurate positioning.
The timing of acquisition was consecutive for the first four treatment fractions. An average of
the setup errors was calculated for the first three fractions to allow for systematic error
minimization and applied at the fourth fraction of treatment. Subsequently, verifications were
scheduled on a weekly basis.
During weekly verification, only setup errors were corrected, according to defined values.
These were 3 mm for HN in all axes and for all treatment phases. For the prostate group, an
action level (AL) values were defined for the first phase of treatment as 5 mm in the latero-
medial (LM) and cranio-caudal (CC) axes; 3 mm were defined in the antero-posterior (AP)
direction. For the second and third treatment phases in the latter group, AL was defined as 3
mm in all axes.

49
Table 1. HN Translational setup errors for the initial and boost phases of treatment.
XVI quality assurance was carried out monthly by checking geometric accuracy, image
quality and safety of the mechanical system.
Setup error analysis
Initially, the mean and standard deviation were calculated, for each patient. The group mean
(M) is the mean of all means. The systematic error (∑) of setup positioning was defined as
the variability of the mean and was calculated as the standard deviation of the individual
means. The random error (σ) was defined as the root-mean-square of the individual standard
deviation of setup error in each patient.9 Intrafraction movement was also calculated for both
groups as the difference between the post-tt and pre-tt acquisitions. The Wilcoxon signed-
rank test was used to assess the differences in the pre-tt and post-tt translational and
rotational setup errors. In order to assess intrafraction movement, a Mann-Whitney test was
used to compare the means in the three axes. The Kruskal-Wallis one-way analysis of
variance was used to test the differences in intrafraction movement during treatment.
Statistical significance was considered when the p value was inferior to 0,05.
RESULTS
Twenty-one patients underwent CBCT scan for 7-17 fractions of their treatment, with a mean
of 11 CBCT for HN patients and 10 CBCT for prostate patients. A total of 161 HN CBCT and
294 prostate CBCT were acquired, including 214 pre-treatment CBCT in both pathologies, 51
pre-correction CBCT and 190 post-treatment CBCT.
HN translational setup errors
M (mm) ∑ (mm) σ (mm)
LM CC AP LM CC AP LM CC AP
First treatment
Phase
Pre-treatment (N=56) -0,3 0,5 -0,1 1,2 1,0 1,8 0,8 1,5 1,1
Post-correction (N=9) 0,3 0,5 -0,2 0,4 0,3 0,1 1,0 0,4 1,3
Post-treatment (N=51) -0,4 0,0 -0,7 0,4 0,7 1,6 1,3 1,1 1,3
Boost treatment
phase
Pre-treatment (N=20) 0,4 1,8 -0,9 1,7 1,8 2,2 0,9 1,1 1,0
Post-correction (N=8) 0,3 -0,2 -1,1 1,1 1,1 1,1 0,4 0,5 0,5
Post-treatment (N=17) 0,1 0,4 -0,6 0,6 1,4 1,3 0,8 0,7 0,2

50
Table 2. HN rotational setup errors for the initial and boost phases of treatment.
Tables 1 and 2 summarize the translational and rotational setup errors, respectively. As can
be observed, the M of the translational setup errors of the first phase of treatment is ranged
between -0,7 and 0,5 mm, the range of ∑ is from 0,1 to 1,8 mm and the σ is ranged from 0,8
to 1,3 mm. For the boost phase, a marked difference is observed, since the calculated M
ranges from -1,1 to 1,8 mm and the ∑ is ranged from 0,6 to 2,2 mm. In this case, σ ranged
from 0,2 to 1,1 mm. It is noteworthy that, for the initial phase of treatment, 72,1% of the pre-tt
translational deviations on the LM direction in HN patients range from -2 to 2 mm. The same
range is observed for 71,1% of the setup errors in the CC and for 67,3% in the AP axis. For
the boost phase, this observation is also valid for 85% of the setup errors in the LM, for 45%
in the CC and for 80% in the AP directions.
For the initial phase of treatment, the M of the measured rotational setup errors is ranged
from -2,6º e 1,1º, ∑ ranges from 0,3º to 5,3º and σ ranges between 0,1º and 1,4º. For the
boost phase the interval of M ranges from 0º a 0,8º, ∑ ranges from 0,3º to 1,4º and σ ranges
from 0,1º to 1,4º.
The median of the post-tt translational setup errors is therefore superior to the median of the
pre-tt setup errors in all axes, with the exception of the AP direction. (p value=0,0235 for the
LM direction, p value= 0,0025 for the CC direction and p value= 0,3525 for AP direction). No
significant difference in the rotational deviations was found when compared to the pre-tt
setup errors.
It was also observed that, in the case of intrafraction movement in these pathologies, there is
a significant increase in the LM axis (p= 0,043), however, this is not observed for the other
two axes, in which there is no significant difference.
HN rotational setup errors
M (º) ∑ (º) σ (º)
LM CC AP LM CC AP LM CC AP
First treatment
Phase
Pre-treatment (N=56) 1,1 -2,6 0,4 0,6 5,3 0,6 0,4 3,0 0,3
Post-correction (N=9) 1,2 0,1 0,5 1,0 0,3 0,3 0,6 0,8 0,7
Post-treatment (N=51) 1,0 -0,4 0,4 0,8 0,7 0,4 0,5 0,5 0,4
Boost treatment
phase
Pre-treatment (N=20) 0,8 0,2 0,1 1,4 0,3 0,8 0,4 0,8 0,5
Post-correction (N=8) 0,2 0,3 0,0 1,1 1,0 0,7 1,4 0,5 0,2
Post-treatment (N=17) 0,7 0,2 0,2 1,1 0,7 1,1 0,1 0,5 0,6

51
Table 3. Prostate translational setup errors for the initial and boost phases of treatment.
Significant differences in the intrafraction movement were not observed during treatment for
LM and CC direction (p= 0,146 and 0,1295, respectively). However it was found that
intrafraction movement increases in the course of treatment for the AP axis (p=0,0265). The
translational and rotational setup errors for the prostate groups are displayed on tables 3 and
4, respectively. For the initial phase of treatment, M is ranged between -0,7 and 0,3 mm, ∑
between 0,4 and 1,5 mm and σ ranges from 0,4 to 2,8 mm. For the boost phase, M ranges
from -0,2 to 1,3 mm, ∑ from 0,4 to 2,9 mm and σ ranges from 0,3 to 2,0
mm. On the translational pre-tt setup errors in the LM direction in prostate patients, 82,8% of
these are ranged between -3,5 and 3,5 mm; the same is observed for 88,4% of these in the
90,6% of the pre-tt setup errors in the LM axis, for 95,3% in the CC axis and for 67,4% in the
CC and 76,7% in the AP directions. In the boost phase, the same range was for the AP axis.
No significant difference in the translational deviations was found when compared to the pre-
tt setup errors and for rotational CC axis deviations. However, an increase in post-tt
deviations was noted for the LM and AP directions, when compared to pre-tt data (p value=
0,002 and 0,0 respectively).
For the initial phase of treatment, the M of the measured rotational setup errors is ranged
from -0,1º e 0,4º, ∑ ranged from 0,4º to 1,5º and σ ranges between 0,2º and 1º. For the boost
phase the interval of M ranges from -0,3º a 0,6º, ∑ ranges from 0,4º to 1,6º and σ ranges
from 0,0º to 1,1º.
No significant differences were observed for the mean of the intrafraction movements, which
were not demonstrated to increase during treatment of prostate cancer patients.
Prostate translation error
M (mm) ∑ (mm) σ (mm)
LM CC AP LM CC AP LM CC AP
First treatment
Phase
Pre-treatment (N=99) 0,3 0,2 -0,7 1,1 1,2 1,5 2,8 2,0 2,5
Post-correction (N=27) 0,3 -0,1 -0,2 0,5 0,4 0,8 0,9 0,4 0,6
Post-treatment (N=88) 0,0 0,1 -0,6 1,3 0,8 0,7 1,3 1,4 1,4
Boost treatment
phase
Pre-treatment (N=39) -0,2 -0,5 1,3 1,9 2,0 2,9 1,4 2,0 1,2
Post-correction (N=7) -0,1 -0,1 -0,4 0,6 0,4 0,7 0,6 0,4 0,4
Post-treatment (N=34) -0,3 0,2 -0,2 1,2 1,0 0,8 1,0 0,3 0,4

52
Table 4. Prostate Rotational setup errors for the initial and boost phases of treatment.
DISCUSSION/ CONCLUSION
The hereby reported work focused on studying the random and systematic errors associated
to treatment delivery at our department, aiming at adapting the currently implemented IGRT
protocol and at revising the adopted margins in the treatment planning stage.
It was thus possible to understand that the intrafraction movements, unexpectedly, do not
increase during HN treatment except for the LM direction. In fact, side-effects kick in during
treatment and, although they are tackled through supportive treatment, they still may worsen
and would be expected to create patient instability. The aforementioned exception might be
attributed to the shape of thermoplastic masks used at our department and this question
should be addressed in future work.
Future steps regarding this issue might revolve around the definition of rotational AL that,
regardless of a previous guideline in the case of HN patients, should be addressed. This
point is even more valid if we consider the CC direction, in which they are more severely
altered.
In the case of the studied prostate group, the most increased ∑ values are observed in the
AP direction. This may logically be attributed to intestinal, rectal and bladder movement.
Even though all patients were carefully instructed about the rectal preparation and received
information on dietary requirements during treatment, compliance with these measures is
poor in a major proportion of patients. Furthermore, this might be complicated by a degree of
unpredictability in the outcome of such preparations. Nevertheless, new methods to increase
awareness of these issues in patients undergoing radiotherapy should be investigated,
namely resorting to audiovisual material, in order to generate a clear understanding of the
benefits of these simple, yet very important measures.
Prostate Rotational error
M (mm) ∑ (mm) σ (mm)
LM CC AP LM CC AP LM CC AP
First treatment
phase
Pre-treatment (N=99) 0,1 0,1 -0,1 1,4 0,5 0,4 0,6 0,2 0,2
Post-correction (N=27) 0,1 0,2 -0,1 1,5 0,7 0,4 0,9 0,5 0,2
Post-treatment (N=88) 0,4 0,2 0,0 1,1 0,7 0,5 1,0 0,2 0,2
Boost treatment
phase
Pre-treatment (N=39) 0,4 0,1 -0,1 1,5 0,6 0,4 1,0 0,6 0,3
Post-correction (N=7) -0,2 0,1 -0,3 1,6 0,5 0,5 1,1 0,3 0,0
Post-treatment (N=34) 0,6 0,3 -0,1 1,3 0,7 0,5 0,1 0,3 0,3

53
Moreover, the identification of systematic and random errors allow for calculation of PTV
isotropic margins according to the formula devised by Van Herk et al. 20:
M=2,5 ∑+ 0,7σ.
For the initial phase of HN treatment, yielded values are 2,1mm, 3,5mm and 2,1mm, in the
LM, CC and AP directions respectively. For the boost phase, values thus calculated are 4,0
mm, 1,6 mm e 2,7 mm in the same order. This suggests that, at our department, currently
used margins, which slightly exceed these limits, ensure adequate coverage of the PTV.
In the case of prostate cancer treatment, in order to ensure PTV coverage with at least 95%
of the prescribed dose, this formula generates margin values of 4,8mm, 4,3mm and 5,4mm
for the initial phase in the LM, CC and AP axes respectively, whereas for the boost phase it
yields 5,7mm, 6,5mm e 8,0mm, considering the same order.
Unlike the previous observation, an increase in currently used margins seems to be
mandatory to ensure a safe treatment delivery. This also suggests that the random and
systematic errors increase during the boost phase, which might be explained by the onset or
increase of radiotherapy side-effects in this phase in the studied cohort. A possible way to
tackle this problem would be treatment replanning at the boost phase, resorting to a new
planning CT.
When these results are compared to the random and systematic errors reported by other
authors13-19, it is verifiable that they are in the same order of magnitude, with the sole
exception of the prostate boost phase, which further stresses the importance of addressing
this problem.
In conclusion, this study allowed for uncovering an eventual possibility of decreasing the PTV
margins for HN cancer radiotherapy planning. It also showed that prostate margins might
also be reduced during the first phase of treatment. In fact, a decrease in the irradiated
volume, as defined in the ICRU 62 report 21, might account for less side-effects, with a
consequent increase in patient stability and, more importantly, life-quality. These conclusions
should, therefore, make way for new treatment delivery methods. Future steps should be
made in order to minimize systematic and random errors associated to the boost phase in
prostate patients, as to ensure more and more accuracy in radiotherapy and a consequent
increment in the quality of treatment.
References:
1. Korreman S, Rasch C, McNair H, Verellen D, Oelfke U, Maingon P, Mijnheer B, Khoo V.
The European Society of Therapeutic Radiology and Oncology-European Institute of
Radiotherapy (ESTRO-EIR) report on 3D CT-based in-room image guidance systems: a

54
practical and technical review and guide. Radiother Oncol. 2010 Feb;94(2):129-44. Epub
2010 Feb 12.
2. Jaffray DA, Siewerdsen JH, Wong JW, Martinez AA. Flat-panel cone-beam computed
tomography for image-guided radiation therapy. Int J Radiat Oncol Biol Phys 2002;53:1337–
49.
3. Smitsmans MH, de Bois J, Sonke JJ, Betgen A, Zijp LJ, Jaffray DA, et al. Automatic
prostate localization on cone-beam CT scans for high precision image-guided radiotherapy.
Int J Radiat Oncol Biol Phys 2005;63:975–84.
4. Dawson LA, Jaffray DA. Advances in image-guided radiation therapy. J Clin Oncol
2007;25:938–46.
5. Purdie TG, Bissonnette JP, Franks K, Bezjak A, Payne D, Sie F, et al. Cone-beam
computed tomography for on-line image guidance of lung stereotactic radiotherapy:
localization, verification, and intrafraction tumor position. Int J Radiat Oncol Biol Phys
2007;68:243–52.
6. Borst GR, Sonke JJ, Betgen A, Remeijer P, van Herk M, Lebesque JV. Kilovoltage cone-
beam computed tomography setup measurements for lung cancer patients; first clinical
results and comparison with electronic portalimaging device. Int J Radiat Oncol Biol Phys
2007;68:555–61.
7. Perez C., Halperin E., Brady L. et al. Principles and practice of radiation oncology, fifth
edition: 225
8. Jin Wang, Sen Bai, Nianyong Chen, Feng Xu, Xiaoqin Jiang, Yan Li, Qingfeng Xu, Yali
Shen, Hong Zhang, Youling Gong, Renming Zhong, Qingfeng Jiang. The clinical feasibility
and effect of online cone beam computer tomography-guided intensity-modulated
radiotherapy for nasopharyngeal cancer. Radiother Oncol. 2009 Feb;90(2):221-7. Epub 2008
Oct 17.
9. Yan, D., Lockman, D., Martinez, A., Wong ,J., Brabbins D., Vicini,F., Liang, J., Kestin, L.
Computed Tomography Guided Management of Interfractional Patient Variation Semin
Radiat Oncol. 2005; 15:168-179.
10. Langen K., Jones T. Organ Motion and its Management. Int. J. Radiation Oncology Biol.
Phys. 2001; 50 (1): 265–278.
11. The Royal college of Radiologists. On target: ensuring geometric accuracy in
Radiotherapy. Available from:
http://www.rcr.ac.uk/docs/oncology/pdf/BFCO(08)5_On_target.pdf
12. Kupelian P., Langen K., Willoughby T., Zeidan O., Meeks S. Image-Guided Radiotherapy
for Localized Prostate Cancer: Treating a Moving Target. Seminars in Radiation Oncology.
2008; 18:58-66.

55
13. Huang E., Dong L., Chandra A., Kuban D., Rosen I., Evans A., Pollack A. Intrafraction
prostate motion during IMRT for Prostate Cancer. Int. J. Radiation Oncology Biol. Phys.
2002; 53 (2): 261–268.
14. Xu F., Wang J., Bai S., Xu Q., Shen Y., Zhong R. Interfractional and intrafractional setup
errors in radiotherapy for tumors analyzed by cone-beam computed tomography. Chinese
Journal of Cancer. 2008; October. 27 (10): 372-376.
15. Xu F., Wang J., Bai S., Li Y., Shen Y., Zhong R., Jiang X., Xu Q. Detection of
intrafractional tumour position error in radiotherapy utilizing cone beam computed
tomography. Radiotherapy and Oncology. 2009. 89: 311–319.
16. Wang J., Bai S., Chen N., Xu F., Jiang X., Li Y., Xu Q., Shen Y., Zhang H., Gong Y.,
Zhong R., Jiang Q. The clinical feasibility and effect of online cone beam computer
tomography-guided intensity-modulated radiotherapy for nasopharyngeal cancer.
Radiotherapy and Oncology. 2009. 90: 221–227.
17. Nairz O, Merz F, Deutschmann H, Kopp P, Schöller H, Zehentmayr F, Wurstbauer K,
Kametriser G, Sedlmayer F. A strategy for the use of image-guided radiotherapy (IGRT) on
linear accelerators and its impact on treatment margins for prostate cancer patients.
Strahlenther Onkol. 2008 Dec 24;184(12):663-7.
18. Sandhu A., Sethi R., Rice R., Wang J., Marcus L., Salem C.,Downs T., Kellogg J., Millard
F., Pawlicki T., Mundt A. Prostate bed localization with image-guided approach using on-
board imaging: Reporting acute toxicity and implications for radiation therapy planning
following prostatectomy. Radiotherapy and Oncology.2008; 88: 20–25.
19. Polat B., Guenther I., Wilbert J., Goebel J., Sweeney R., Flentje M.,Guckenberger M.
Intra-Fractional Uncertainties in Image-Guided Intensity-Modulated Radiotherapy (IMRT) of
Prostate Cancer. Strahlenther Onkol 2008;184:668–73
20. Van Herk M. Errors and Margins in Radiotherapy. Seminars in Radiation Oncology. 2004
January; 14, (1): 52-64.
21. ICRU Report 62. International Commission on Radiation Units and Measurements.
Prescribing, recording and reporting photon beam therapy. Supplement to ICRU Report 50;
1999.

56

57
GENERAL CONCLUSION:
The purpose of this study was to verify the feasibility of a previously devised IGRT protocol,
as to adapt it to the observed reality at the department.
In conclusion, every prostate patient received in average 337 mGy and every HN patient
received in average 13.5 mGy derived from CBCT usage during their treatments. However, if
the SetD had not been corrected, there would not be a significant difference on the irradiated
volume of the OAR for prostate patients, as well as a decrease in PTV coverage. In the case
of HN patients, the PTV coverage would have been decreased. For all these reasons, the
outcome of treatment would have been greatly modified, with a probable decrease in both
toxicity outcomes and tumour control.
It was also observed that systematic errors increase during treatment for both pathologies.
We should therefore rethink current strategies employed for informing patients about
treatment preparation. Moreover, the data presented here supports that patients should be
re-planned when they enter the boost phase.
Future research should be aimed at accounting for the dose of CBCT during the treatment
planning phase. Tolerance limits, as currently applied to prostate and HN patients, should
also be recalculated, This is especially important for boost margins in the case of both
pathologies.