Embed Size (px)
Citation preview
Universidade Estadual de CampinasInstituto de Computação
INSTITUTO DECOMPUTAÇÃO
Jaudete Daltio
Views over Graph Databases: A Multifocus Approach
for Heterogeneous Data
Visões em Bancos de Dados de Grafos: Uma
Abordagem Multifoco para Dados Heterogêneos
CAMPINAS
2017
Jaudete Daltio
Views over Graph Databases: A Multifocus Approach for
Heterogeneous Data
Visões em Bancos de Dados de Grafos: Uma Abordagem
Multifoco para Dados Heterogêneos
Tese apresentada ao Instituto de Computaçãoda Universidade Estadual de Campinas comoparte dos requisitos para a obtenção do títulode Doutora em Ciência da Computação.
Thesis presented to the Institute of Computingof the University of Campinas in partialful�llment of the requirements for the degree ofDoctor in Computer Science.
Supervisor/Orientadora: Profa. Dra. Claudia Maria Bauzer Medeiros
Este exemplar corresponde à versão �nal daTese defendida por Jaudete Daltio eorientada pela Profa. Dra. Claudia MariaBauzer Medeiros.
CAMPINAS
2017
Agência(s) de fomento e nº(s) de processo(s): Não se aplica.
Ficha catalográficaUniversidade Estadual de Campinas
Biblioteca do Instituto de Matemática, Estatística e Computação CientíficaAna Regina Machado - CRB 8/5467
Daltio, Jaudete, 1983- D17v DalViews over graph databases : a multifocus approach for heterogeneous
data / Jaudete Daltio. – Campinas, SP : [s.n.], 2017.
DalOrientador: Claudia Maria Bauzer Medeiros. DalTese (doutorado) – Universidade Estadual de Campinas, Instituto de
Computação.
Dal1. Banco de dados. 2. Grafo (Sistema de computador). 3. Modelagem de
dados. 4. Gerenciamento da informação. I. Medeiros, Claudia MariaBauzer,1954-. II. Universidade Estadual de Campinas. Instituto deComputação. III. Título.
Informações para Biblioteca Digital
Título em outro idioma: Visões em bancos de dados de grafos : uma abordagem multifocopara dados heterogêneosPalavras-chave em inglês:DatabasesGraph (Computer system)Data modelingInformation managementÁrea de concentração: Ciência da ComputaçãoTitulação: Doutora em Ciência da ComputaçãoBanca examinadora:Claudia Maria Bauzer Medeiros [Orientador]Ana Carolina Brandão SalgadoRicardo Rodrigues CiferriAndré SantanchèGuilherme Pimentel TellesData de defesa: 04-09-2017Programa de Pós-Graduação: Ciência da Computação
Powered by TCPDF (www.tcpdf.org)
Universidade Estadual de CampinasInstituto de Computação
INSTITUTO DECOMPUTAÇÃO
Jaudete Daltio
Views over Graph Databases: A Multifocus Approach for
Heterogeneous Data
Visões em Bancos de Dados de Grafos: Uma Abordagem
Multifoco para Dados Heterogêneos
Banca Examinadora:
• Profa. Dra. Claudia Maria Bauzer MedeirosInstituto de Computação/ Universidade Estadual de Campinas
• Profa. Dra. Ana Carolina Brandão SalgadoCentro de Informática/ Universidade Federal de Pernambuco
• Prof. Dr. Ricardo Rodrigues CiferriDepartamento de Computação/ Universidade Federal de São Carlos
• Prof. Dr. André SantanchèInstituto de Computação/ Universidade Estadual de Campinas
• Prof. Dr. Guilherme Pimentel TellesInstituto de Computação/ Universidade Estadual de Campinas
A ata da defesa com as respectivas assinaturas dos membros da banca encontra-se noprocesso de vida acadêmica do aluno.
Campinas, 04 de setembro de 2017
Two roads diverged in a wood, and I-I took the one less traveled by,And that has made all the di�erence.
(The Road Not Taken, Robert Frost)

Agradecimentos
A professora Claudia, por ter sido tudo o que eu precisei ao longo desse processo. Muitomais do que uma professora. Muito mais do que uma orientadora. Por acreditar que euera capaz. Pela con�ança, pela atenção, pela paciência e pelas críticas. É um grandeprevilégio tê-la em minha vida.
Ao Cristiano, por sempre estar ao lado. Pelo incentivo e pela compreensão. In�nitacompreensão. Por me ajudar a enfrentar todos os desa�os, principalmente aqueles queachei que não seria capaz de superar. Por fazer de mim uma pessoa melhor a cada dia.
A minha família, pelo apoio e pela con�ança. Aos meus queridos irmãos, pela constantepreocupação. Aos meus pais, Hermes e Bernadete, lembrados com muito carinho e semprepresentes em meu coração. E Dante e Fernanda, meus pequenos amores, pelos grandessorrisos.
Aos amigos que estiveram sempre comigo ao longo dessa jornada. É uma dádiva tertantas pessoas maravilhosas em minha vida com quem compartilhar minhas conquistas.Em especial aos amigos do Laboratório de Sistemas de Informação � LIS, pelas opniões,discussões e contribuições neste trabalho.
Ao especialista em geoprocessamento da Agência Nacional de Águas (ANA), Alexandrede Amorim Teixeira, pelo auxílio no acesso e na interpretação dos dados utilizados napesquisa.
Aos membros da banca, pelas sugestões e contribuições no trabalho.À Empresa Brasileira de Pesquisa Agropecuária (EMBRAPA) e às agências de fomento
CAPES, CNPq e projetos, FAPESP/CEPID in Computational Engineering and Sciences(2013/08293-7), INCT in Web Science pelo apoio direto ou indireto na realização destetrabalho.
Resumo
A pesquisa cientí�ca tornou-se cada vez mais dependente de dados. Esse novo paradigmade pesquisa demanda técnicas e tecnologias computacionais so�sticadas para apoiar tantoo ciclo de vida dos dados cientí�cos como a colaboração entre cientistas de diferentes áreas.Uma demanda recorrente em equipes multidisciplinares é a construção de múltiplas pers-pectivas sobre um mesmo conjunto de dados. Soluções atuais cobrem vários aspectos,desde o projeto de padrões de interoperabilidade ao uso de sistemas de gerenciamentode bancos de dados não-relacionais. Entretanto, nenhum desses esforços atende de formaadequada a necessidade de múltiplas perspectivas, denominadas focos nesta tese. Emtermos gerais, um foco é projetado e construído para atender um determinado grupo depesquisa (mesmo no escopo de um único projeto) que necessita manipular um subconjuntode dados de interesse em múltiplos níveis de agregação/generalização. A de�nição e cria-ção de um foco são tarefas complexas que demandam mecanismos capazes de manipularmúltiplas representações de um mesmo fenômeno do mundo real.
O objetivo desta tese é prover múltiplos focos sobre dados heterogêneos. Para atingiresse objetivo, esta pesquisa se concentrou em quatro principais problemas. Os problemasinicialmente abordados foram: (1) escolher um paradigma de gerenciamento de dadosadequado e (2) elencar os principais requisitos de pesquisas multifoco. Nossos resulta-dos nos direcionaram para a adoção de bancos de dados de grafos como solução para oproblema (1) e a utilização do conceito de visões, de bancos de dados relacionais, parao problema (2). Entretanto, não há consenso sobre um modelo de dados para bancos dedados de grafos e o conceito de visões é pouco explorado nesse contexto. Com isso, osdemais problemas tratados por esta pesquisa são: (3) a especi�cação de um modelo dedados de grafos e (4) a de�nição de um framework para manipular visões em bancos dedados de grafos. Nossa pesquisa nesses quatro problemas resultaram nas contribuiçõesprincipais desta tese: (i) apontar o uso de bancos de dados de grafos como camada depersistência em pesquisas multifoco � um tipo de banco de dados de esquema �exível eorientado a relacionamentos que provê uma ampla compreensão sobre as relações entre osdados; (ii) de�nir visões para bancos de dados de grafos como mecanismo para manipularmúltiplos focos, considerando operações de manipulação de dados em grafos, travessias ealgoritmos de grafos; (iii) propor um modelo de dados para grafos � baseado em grafos depropriedade � para lidar com a ausência de um modelo de dados pleno para grafos; (iv)especi�car e implementar um framework, denominado Graph-Kaleidoscope, para prover ouso de visões em bancos de dados de grafos e (v) validar nosso framework com dados reaisem aplicações distintas � em biodiversidade e em recursos naturais � dois típicos exemplosde pesquisas multidisciplinares que envolvem a análise de interações de fenômenos a partirde dados heterogêneos.
Abstract
Scienti�c research has become data-intensive and data-dependent. This new researchparadigm requires sophisticated computer science techniques and technologies to supportthe life cycle of scienti�c data and collaboration among scientists from distinct areas. Amajor requirement is that researchers working in data-intensive interdisciplinary teamsdemand construction of multiple perspectives of the world, built over the same datasets.Present solutions cover a wide range of aspects, from the design of interoperability stan-dards to the use of non-relational database management systems. None of these e�orts,however, adequately meet the needs of multiple perspectives, which are called foci in thethesis. Basically, a focus is designed/built to cater to a research group (even within asingle project) that needs to deal with a subset of data of interest, under multiple ag-gregation/generalization levels. The de�nition and creation of a focus are complex tasksthat require mechanisms and engines to manipulate multiple representations of the samereal world phenomenon.
This PhD research aims to provide multiple foci over heterogeneous data. To meetthis challenge, we deal with four research problems. The �rst two were (1) choosing anappropriate data management paradigm; and (2) eliciting multifocus requirements. Ourwork towards solving these problems made us choose graph databases to answer (1) andthe concept of views in relational databases for (2). However, there is no consensualdata model for graph databases and views are seldom discussed in this context. Thus,research problems (3) and (4) are: (3) specifying an adequate graph data model and(4) de�ning a framework to handle views on graph databases. Our research in theseproblems results in the main contributions of this thesis: (i) to present the case forthe use of graph databases in multifocus research as persistence layer � a schemaless andrelationship driven type of database that provides a full understanding of data connections;(ii) to de�ne views for graph databases to support the need for multiple foci, consideringgraph data manipulation, graph algorithms and traversal tasks; (iii) to propose a propertygraph data model (PGDM) to �ll the gap of absence of a full-�edged data model forgraphs; (iv) to specify and implement a framework, named Graph-Kaleidoscope, thatsupports views over graph databases and (v) to validate our framework for real worldapplications in two domains � biodiversity and environmental resources � typical examplesof multidisciplinary research that involve the analysis of interactions of phenomena usingheterogeneous data.
List of Figures
1.1 Overview of the Research Problems . . . . . . . . . . . . . . . . . . . . . . 17
2.1 Overview of the Focus Generation Process . . . . . . . . . . . . . . . . . . 242.2 Partial Metadata Graph Database of FNJV Observations - Gobs . . . . . . 252.3 Focus: (a) location and number of distinct species and (b) Partial Biome
Graph Database - Gbio . . . . . . . . . . . . . . . . . . . . . . . . . . . . . 262.4 (a) Query View Focus: Observation Locations and Biomes (b) Central
Concept Focus: species closest to Tinamus tao . . . . . . . . . . . . . . . 27
3.1 Kinds of Points in Drainage Network . . . . . . . . . . . . . . . . . . . . . 313.2 Di�erent Drainage Stretch Scales in Drainage Network . . . . . . . . . . . 323.3 (a) Rivers: continuous drainage stretches with the same hydronym and (b)
HCA: drainage stretches and their hydrographic catchment area . . . . . . 333.4 Otto Pfafstetter methodology . . . . . . . . . . . . . . . . . . . . . . . . . 343.5 PgHydro Database Conceptual Model . . . . . . . . . . . . . . . . . . . . . 353.6 GHydro: Brazilian Drainage Network as a Graph Database . . . . . . . . . 363.7 LOAD CSV commands . . . . . . . . . . . . . . . . . . . . . . . . . . . . . 37
4.1 PgHydro Database Conceptual Model . . . . . . . . . . . . . . . . . . . . . 434.2 Coexisting stretch scales in the drainage network, extracted from [32] . . . 444.3 Overview of Graph Data Management - a multitude of models, operators
and query languages . . . . . . . . . . . . . . . . . . . . . . . . . . . . . . 454.4 An example of the RDF graph extracted from [62] . . . . . . . . . . . . . 464.5 An example of a property graph, extracted from [83] . . . . . . . . . . . . 474.6 Di�erent purposes of Views � adapted from [14] (dimensions of heterogeneity) 484.7 GHydro graph database schema GS (a) and state GS (b) . . . . . . . . . . . 524.8 Example of the Restriction Operator . . . . . . . . . . . . . . . . . . . . . 564.9 Example of Projection Operator . . . . . . . . . . . . . . . . . . . . . . . . 574.10 Example of Rename Operator . . . . . . . . . . . . . . . . . . . . . . . . . 584.11 Example of Edge Creation Operator . . . . . . . . . . . . . . . . . . . . . . 604.12 Example of Group Operator . . . . . . . . . . . . . . . . . . . . . . . . . . 614.13 Example of Attribute Creation Operator . . . . . . . . . . . . . . . . . . . 634.14 Example of Conditional Traversal Operator . . . . . . . . . . . . . . . . . . 644.15 View Requirements and Operators . . . . . . . . . . . . . . . . . . . . . . 664.16 Graph-Kaleidoscope Architecture . . . . . . . . . . . . . . . . . . . . . . . 674.17 Ottocoded Watersheds - The code itself follows Pfafstetter methodology . . 704.18 Rivers View of Drainage Network . . . . . . . . . . . . . . . . . . . . . . . 714.19 GVRiver graph view schema (a) and state (b) . . . . . . . . . . . . . . . . . 724.20 HCA: drainage stretches and their hydrographic catchment area . . . . . . 734.21 GVWatershed graph view schema (a) and state (b) . . . . . . . . . . . . . . . 74
4.22 Related Work � Comparative Table . . . . . . . . . . . . . . . . . . . . . . 76
List of Tables
4.1 Elementary Unary Operators . . . . . . . . . . . . . . . . . . . . . . . . . 544.2 Elementary Binary Operators . . . . . . . . . . . . . . . . . . . . . . . . . 55
Contents
1 Introduction 141.1 Motivation . . . . . . . . . . . . . . . . . . . . . . . . . . . . . . . . . . . . 141.2 Problem Statement and Research Problems . . . . . . . . . . . . . . . . . . 151.3 Contributions . . . . . . . . . . . . . . . . . . . . . . . . . . . . . . . . . . 181.4 Thesis Organization . . . . . . . . . . . . . . . . . . . . . . . . . . . . . . . 19
2 Handling Multiple Foci in Graph Databases 212.1 Introduction and Motivation . . . . . . . . . . . . . . . . . . . . . . . . . . 212.2 Theoretical Foundations and Related Work . . . . . . . . . . . . . . . . . . 22
2.2.1 Graph Databases . . . . . . . . . . . . . . . . . . . . . . . . . . . . 222.2.2 Views . . . . . . . . . . . . . . . . . . . . . . . . . . . . . . . . . . 222.2.3 Multifocus Research . . . . . . . . . . . . . . . . . . . . . . . . . . 23
2.3 A Framework to Generate Foci . . . . . . . . . . . . . . . . . . . . . . . . 232.4 Running Example . . . . . . . . . . . . . . . . . . . . . . . . . . . . . . . . 24
2.4.1 Example Focus 1: Location and Biomes . . . . . . . . . . . . . . . 252.4.2 Example Focus 2: Species �Closely Related� to Tinamus tao . . . 26
2.5 Conclusions and Ongoing Work . . . . . . . . . . . . . . . . . . . . . . . . 27
3 Hydrograph: Exploring Geographic Data In Graph Databases 293.1 Introduction and Motivation . . . . . . . . . . . . . . . . . . . . . . . . . . 293.2 Research Scenario and Theoretical Foundations . . . . . . . . . . . . . . . 30
3.2.1 Brazilian Water Resources Database . . . . . . . . . . . . . . . . . 303.2.2 Graph Data Management Paradigm . . . . . . . . . . . . . . . . . . 34
3.3 Implementation . . . . . . . . . . . . . . . . . . . . . . . . . . . . . . . . . 353.3.1 Original Relational Database: pgHydro . . . . . . . . . . . . . . . . 353.3.2 Proposal Graph Database: HydroGraph . . . . . . . . . . . . . . . 363.3.3 PgHydro Functions . . . . . . . . . . . . . . . . . . . . . . . . . . . 37
3.4 Research Challenges . . . . . . . . . . . . . . . . . . . . . . . . . . . . . . 383.5 Conclusions . . . . . . . . . . . . . . . . . . . . . . . . . . . . . . . . . . . 39
4 Graph-Kaleidoscope: A Framework to Handle Multiple Perspectives inGraph Databases 404.1 Introduction . . . . . . . . . . . . . . . . . . . . . . . . . . . . . . . . . . . 404.2 Motivation Scenario - Brazilian Water Resources Database . . . . . . . . . 424.3 Theoretical Foundations . . . . . . . . . . . . . . . . . . . . . . . . . . . . 43
4.3.1 The Graph Data Management Paradigm . . . . . . . . . . . . . . . 434.3.2 Extending Database Views . . . . . . . . . . . . . . . . . . . . . . . 48
4.4 PGDM: The Data Model of the Graph-Kaleidoscope Framework . . . . . . 494.4.1 PGDM - Data Structure . . . . . . . . . . . . . . . . . . . . . . . . 49
4.4.2 PGDM - Integrity Constraints . . . . . . . . . . . . . . . . . . . . . 514.4.3 PGDM - Elementary Operators . . . . . . . . . . . . . . . . . . . . 52
4.5 Graph-Kaleidoscope Framework - Architecture and Prototype . . . . . . . 654.6 Case Study: Providing Perspectives of the Water Resources Database for
Environmental Resource Applications . . . . . . . . . . . . . . . . . . . . . 684.6.1 View GVHydro454: Determining the Longer Drainage Stretch of Wa-
tershed 454 . . . . . . . . . . . . . . . . . . . . . . . . . . . . . . . 694.6.2 View GVRiver: Determining the Most Connected River . . . . . . . 714.6.3 View GVWatershed: Determining the Most In�uential Sub-watershed
of a Given Watershed . . . . . . . . . . . . . . . . . . . . . . . . . . 724.7 Related Work . . . . . . . . . . . . . . . . . . . . . . . . . . . . . . . . . . 744.8 Research Challenges and Lessons Learned . . . . . . . . . . . . . . . . . . 764.9 Conclusions and Ongoing Work . . . . . . . . . . . . . . . . . . . . . . . . 77
5 Conclusions and Extensions 795.1 Overview . . . . . . . . . . . . . . . . . . . . . . . . . . . . . . . . . . . . . 795.2 Main Contributions . . . . . . . . . . . . . . . . . . . . . . . . . . . . . . . 795.3 Extensions . . . . . . . . . . . . . . . . . . . . . . . . . . . . . . . . . . . . 80
Bibliography 83
Chapter 1
Introduction
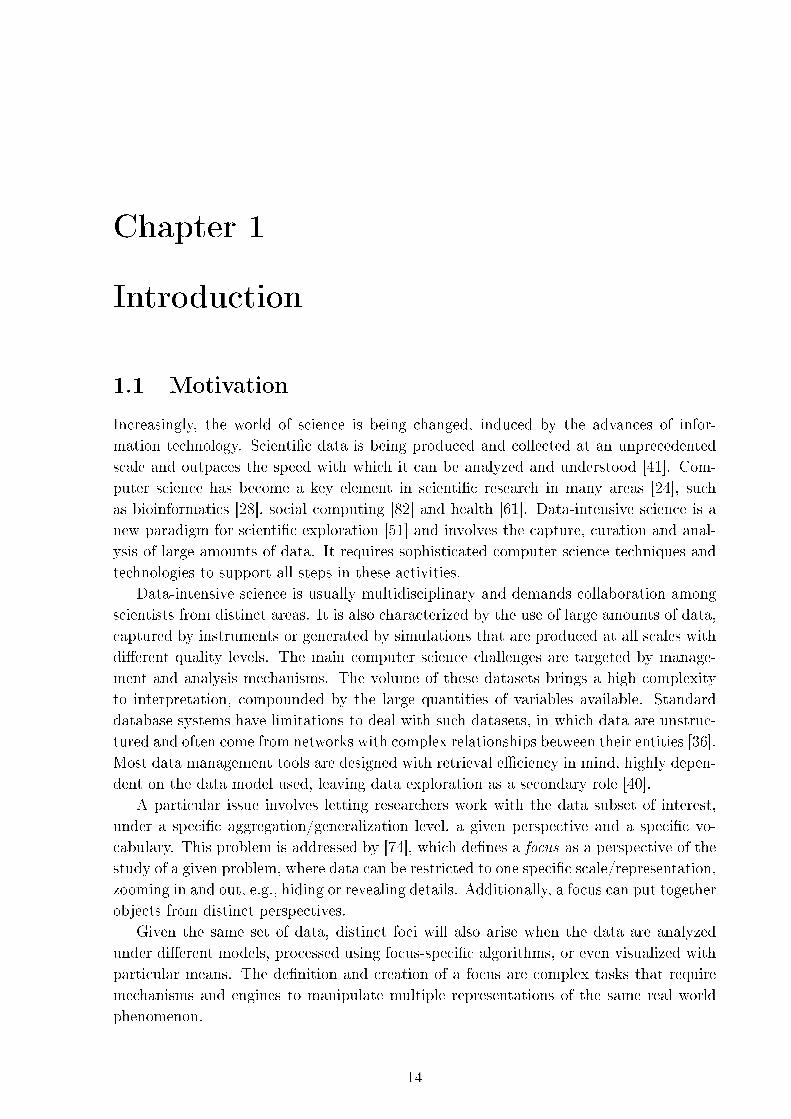
1.1 Motivation
Increasingly, the world of science is being changed, induced by the advances of infor-mation technology. Scienti�c data is being produced and collected at an unprecedentedscale and outpaces the speed with which it can be analyzed and understood [41]. Com-puter science has become a key element in scienti�c research in many areas [24], suchas bioinformatics [28], social computing [82] and health [61]. Data-intensive science is anew paradigm for scienti�c exploration [51] and involves the capture, curation and anal-ysis of large amounts of data. It requires sophisticated computer science techniques andtechnologies to support all steps in these activities.
Data-intensive science is usually multidisciplinary and demands collaboration amongscientists from distinct areas. It is also characterized by the use of large amounts of data,captured by instruments or generated by simulations that are produced at all scales withdi�erent quality levels. The main computer science challenges are targeted by manage-ment and analysis mechanisms. The volume of these datasets brings a high complexityto interpretation, compounded by the large quantities of variables available. Standarddatabase systems have limitations to deal with such datasets, in which data are unstruc-tured and often come from networks with complex relationships between their entities [36].Most data management tools are designed with retrieval e�ciency in mind, highly depen-dent on the data model used, leaving data exploration as a secondary role [40].
A particular issue involves letting researchers work with the data subset of interest,under a speci�c aggregation/generalization level, a given perspective and a speci�c vo-cabulary. This problem is addressed by [74], which de�nes a focus as a perspective of thestudy of a given problem, where data can be restricted to one speci�c scale/representation,zooming in and out, e.g., hiding or revealing details. Additionally, a focus can put togetherobjects from distinct perspectives.
Given the same set of data, distinct foci will also arise when the data are analyzedunder di�erent models, processed using focus-speci�c algorithms, or even visualized withparticular means. The de�nition and creation of a focus are complex tasks that requiremechanisms and engines to manipulate multiple representations of the same real worldphenomenon.
14
Chapter 1. Introduction 15
1.2 Problem Statement and Research Problems
This thesis aims at answering the following research question: �How can we provide mul-tiple foci over heterogeneous data collections ?� There are two issues involved: (i) how todeal with heterogeneous data and (ii) how to provide multiple foci. Due to the complexityinvolving both subjects, we start our research exploring two research problems: (1) elicit-ing multifocus requirements; (2) choosing an appropriate data management paradigm forhandle heterogeneous data.
Problem 1: Eliciting Multifocus Requirements
The basic idea of multifocus work is to support construction of arbitrary perspectivesof a given dataset. In some cases, a simple operation is enough � just to restrict a subsetof the variables available or to restrict to data having some property. The challenge ariseswhen there is need for data transformation � e.g., in terms of aggregating or disaggregatingparts of the data or combining data from di�erent perspectives. Data transformationmay also require rearrangement of data according to the semantic relations among data.Whether using simple or complex operations, the result is a representation of the samereal world phenomena under di�erent perspectives.
In geographic data research, scale studies are often considered as (geographic) scaletransformations, but the ideas can be extrapolated. They usually apply abstraction lev-els to describe the original data [76], generalization algorithms [85] and identify, fromthe underlying dataset, which elements are relevant to a given perspective [67]. Relatedwork about semantic transformations usually applies ontologies (i.e., abstract model ofterms [45]) as a central role to provide a perspective of the data [46]. The use of on-tologies helps to solve interoperability issues in knowledge representation [52], allowingto e�ectively share data in research communities [7, 9, 21]. A di�erent approach appearsin [60], which treated each perspective as a version of the dataset.
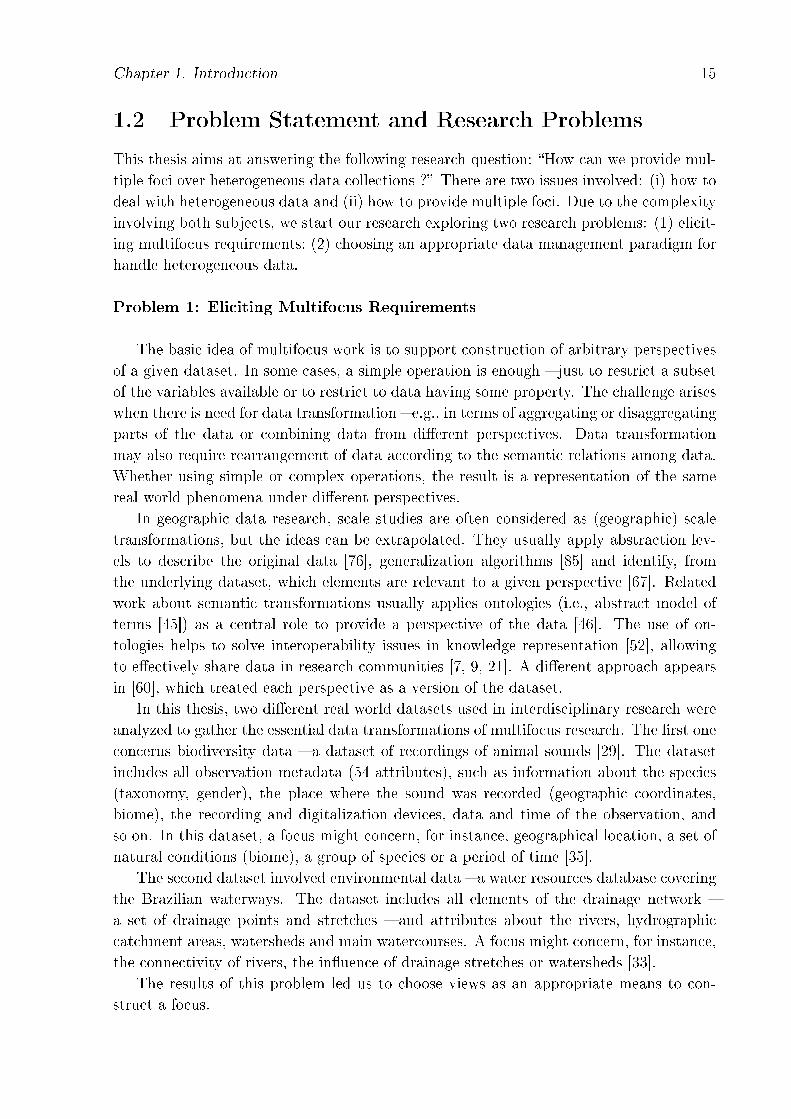
In this thesis, two di�erent real world datasets used in interdisciplinary research wereanalyzed to gather the essential data transformations of multifocus research. The �rst oneconcerns biodiversity data � a dataset of recordings of animal sounds [29]. The datasetincludes all observation metadata (54 attributes), such as information about the species(taxonomy, gender), the place where the sound was recorded (geographic coordinates,biome), the recording and digitalization devices, data and time of the observation, andso on. In this dataset, a focus might concern, for instance, geographical location, a set ofnatural conditions (biome), a group of species or a period of time [35].
The second dataset involved environmental data � a water resources database coveringthe Brazilian waterways. The dataset includes all elements of the drainage network �a set of drainage points and stretches � and attributes about the rivers, hydrographiccatchment areas, watersheds and main watercourses. A focus might concern, for instance,the connectivity of rivers, the in�uence of drainage stretches or watersheds [33].
The results of this problem led us to choose views as an appropriate means to con-struct a focus.
Chapter 1. Introduction 16
Problem 2: Choosing an Appropriate Data Management Paradigm
The continued growth of data and its heterogeneity led to the emergence of newdatabase models and technologies � the NoSQL databases. These databases do not have allproperties of traditional relational databases and are generally not queried with SQL [50].Related work classi�es NoSQL databases in four categories, according to their data model:(i) key value stores, in which a piece of data is addressed by a unique key and it isisolated from remaining data [78]; (ii) document stores, in which data is stored in aninteroperable document (JSON, for instance) addressed by a unique key [4]; (iii) columnoriented stores, which create a sparse sorted map in which rows store an arbitrary numberof key-value pairs [23, 37]; and (iv) graph stores, in which data are stored as nodes, edgesand properties [83].
Each NoSQL data model attempts to solve a particular data management issue andthe diversity of these models shows that there is no data model or database able to dealwith all challenges [72]. However, with few exceptions, graph stores are the only capable ofhandling relations among data [50]. Indeed, the interpretation of complex datasets usuallyrequires understanding data connections, interactions with other data and topologicalproperties about data organization. Besides, graph stores are schemaless, in the sensethat it is not necessary to �rst create a schema and then insert data - schema and dataare inserted together. Nevertheless, it is possible to add properties to each individualvertex or edge at any time, an important requirement to deal with heterogeneous data.
Given these considerations, we chose graphs as our data management paradigm.
Research Overview
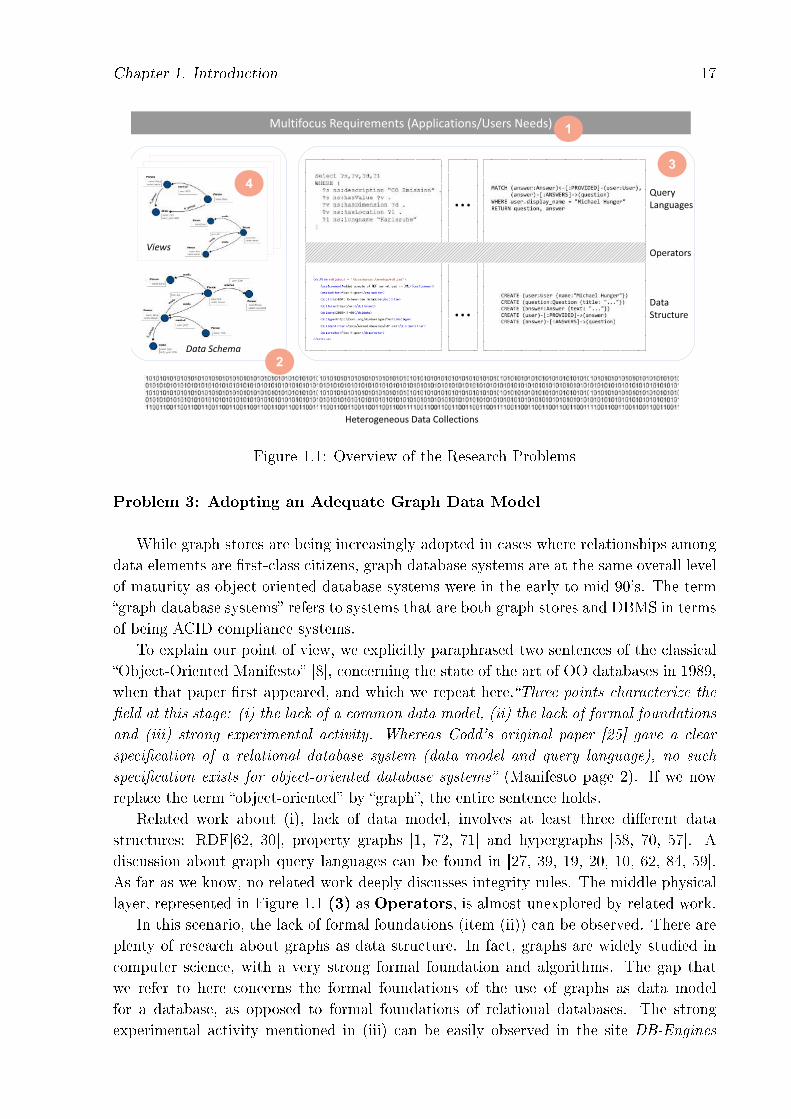
Figure 1.1 provides an overview of our research, presenting how the research problemsare correlated under the graph data management paradigm. Each research problem ishighlighted in the �gure (indicated by its number).
Raw data are represented in the bottom. The left side of the �gure shows the userperception of the graph data management paradigm: data in the database are understoodto be organized in a graph, in the simplest form G = (V,E). Each application has tobuild its own �stack of standards�, shown in the right side of the �gure, to deal with graphdatabase system issues. Since there is no consensus on a formal graph data model or evenfor a graph data structure, there are many possible �stacks of standards� available in theliterature to meet this architecture. Applications and users needs of multifocus researchare represented on the top of both logical and physical perceptions.
Research problem (1) concerns applications and user needs in multifocus research.Problem (2) involves the data management paradigm and the datasets explored. Toachieve our goal, two additional research problems needed to be explored: (3) adoptingan adequate graph data model and (4) de�ning a framework to handle views on graphdatabases. Research problem (3) concerns about physical issues of graph data manage-ment, in terms of graph data model. Research problem (4) concerns about how to providethe user perception of views over graphs.
Chapter 1. Introduction 17
Figure 1.1: Overview of the Research Problems
Problem 3: Adopting an Adequate Graph Data Model
While graph stores are being increasingly adopted in cases where relationships amongdata elements are �rst-class citizens, graph database systems are at the same overall levelof maturity as object-oriented database systems were in the early to mid-90's. The term�graph database systems� refers to systems that are both graph stores and DBMS in termsof being ACID compliance systems.
To explain our point of view, we explicitly paraphrased two sentences of the classical�Object-Oriented Manifesto� [8], concerning the state of the art of OO databases in 1989,when that paper �rst appeared, and which we repeat here.�Three points characterize the
�eld at this stage: (i) the lack of a common data model, (ii) the lack of formal foundations
and (iii) strong experimental activity. Whereas Codd's original paper [25] gave a clear
speci�cation of a relational database system (data model and query language), no such
speci�cation exists for object-oriented database systems� (Manifesto page 2). If we nowreplace the term �object-oriented� by �graph�, the entire sentence holds.
Related work about (i), lack of data model, involves at least three di�erent datastructures: RDF[62, 30], property graphs [1, 72, 71] and hypergraphs [58, 70, 57]. Adiscussion about graph query languages can be found in [27, 39, 19, 20, 10, 62, 84, 59].As far as we know, no related work deeply discusses integrity rules. The middle physicallayer, represented in Figure 1.1 (3) as Operators, is almost unexplored by related work.
In this scenario, the lack of formal foundations (item (ii)) can be observed. There areplenty of research about graphs as data structure. In fact, graphs are widely studied incomputer science, with a very strong formal foundation and algorithms. The gap thatwe refer to here concerns the formal foundations of the use of graphs as data modelfor a database, as opposed to formal foundations of relational databases. The strongexperimental activity mentioned in (iii) can be easily observed in the site DB-Engines
Chapter 1. Introduction 18
Ranking 1, that presents monthly rankings of over 300 DBMS. There, graph DBMS is anindependent category of database management systems and currently ranks 26 softwaresolutions.
Due to this lack of consensus in formalization, one of the challenges addressed by ourresearch was to formalize the graph data model that underpins our research in terms ofCodd's principles [25]. That means that we had to determine a graph data structure,integrity rules and the elementary operations [75]. This resulted in our Property GraphData Model (PGDM), presented in the thesis. As will be seen in Chapter 4, these opera-tions are used to generate ours views on graph databases.
Problem 4: De�ning a Framework to Handle Views
The �rst proposal for views over graphs appeared in the 80's, together with the �rstgraph data models [56]. With the arrival of graph stores, some view mechanisms havestarted to appear since 2014.
The major weakness of all related work about views on graphs is the limited kindof data transformation allowed. Few approaches adopt the classical idea, borrowed fromrelational databases, of performing queries in graphs to extract views [61]. This idea,though intuitive, is itself a challenge, since a graph query answer may not be a graph.The more broad approach is to use graph patterns to extract views, which are neverthelessonly capable of performing simple data restrictions [38, 11].
Given this scenario, we propose the formalization of views in graph databases. Wespecify a framework to handle multiple views over graph databases. This resulted inGraph-Kaleidoscope, presented in the thesis. Though the notion of views as perspectives(foci) does not depend on the underlying system, view mechanisms are strongly dependenton the underlying model. For this reason, our framework is based on our PGDM DataModel.
1.3 Contributions
This PhD research resulted in �ve main contributions, summarized as follows:
• To present the case for the use of graph databases in multifocus research. From asurvey of data management requirements, we justify the use of graph databases as asuitable persistence layer to meet these requirements and to store/analyze datasetsof highly connected data. This contribution is a result of the research problems 1and 2 and it is presented in Chapter 2;
• To propose a property graph data model (PGDM) with a set of operators to ma-nipulate and retrieve graph data. Ours is a �exible approach, to be incorporated inany graph data structure and query language. This is the main contribution of ourthesis, motivated by research problem 3 and proposed to �ll the gap of the absence
1db-engines.com/en/ranking/graph+dbms
Chapter 1. Introduction 19
of a full-�edged data model for graph databases. Results are presented in Chapter4;
• To de�ne views for graph databases to support the need for multiple perspectives,motivated by research problems 1 and 4. Views are speci�ed through view generat-ing functions, considering graph data manipulation, classical graph algorithms andtraversal tasks. This is introduced in Chapter 2 and formalized in Chapter 4;
• To analyze real life examples of interdisciplinary research, showing how they canbene�t from our proposal. We present how biodiversity and environmental resourcedatasets can be modeled and explored by experts using graph databases and mul-tiple perspectives, pointing out the advantages of this approach. This contributionconverged from all the research problems explored, and is presented in Chapters 2,3 and 4;
• The speci�cation and implementation of a prototype of the Graph-Kaleidoscopeframework to support views over graph databases in a graph software engine. Thiscontribution is a result of research problem 4 and is presented in Chapter 4.
1.4 Thesis Organization
This chapter presented the motivation, goal, research problems and main contributionsof this PhD research. The remainder of this text is organized as a collection of papers, asfollows.
Chapter 2 corresponds to the paper �Handling Multiple Foci in Graph Databases�,published in the Proceedings of the 10th International Conference on Data Integrationin Life Science [35]. This chapter discusses the requirements of the multifocus research(research problem 1) targeted to the biodiversity domain (research problem 2). It alsopresents the �rst version of our framework (research problem 4) considering two mainapproaches to building views on graphs: general queries and exploration around a centralconcept. These two approaches were subsequently aggregated in our graph operators.This chapter also presents how biodiversity studies of animal observations can be bene�tfrom our research.
Chapter 3 corresponds to the paper �Hydrograph: Exploring Geographic Data InGraph Databases�, published in the Brazilian Journal of Cartography [33]. This chapterpresents our progress in the requirements of multifocus research (research problem 1)by exploring another interdisciplinary domain � environmental research on hydrography.This progress con�rmed our solution to the research problem 2 and the choice of graphsas data management paradigm. This chapter presents our software technology choice forour framework, Neo4j 2, and presents all steps for data migration from relational to graphdatabase while maintaining application semantics. We also present a set of importantanalysis operations recurrently performed in this dataset and how they can bene�t fromthe graph paradigm and the idea of views.
2www.neo4j.com
Chapter 1. Introduction 20
Chapter 4 corresponds to the paper �Graph-Kaleidoscope: A Framework to Han-dle Multiple Perspectives in Graph Databases�, submitted to the International Journalof Data Science and Analytics [34]. This paper, currently under review, describes ourde�nition of a graph data model (research problem 3), PGDM, based on the propertygraph data structure. The most important part of our de�nition are operators, a middlelayer between graph data structures and query languages. Our operators are de�ned ina generic way and they can be implemented in di�erent stack of standards of physicalgraph representations. This chapter also presents the speci�cation and the prototype ofGraph-Kaleidoscope (research problem 4). This is an improved version of the frameworkpresented in Chapter 2 and adopts our operators to de�ne the view generating function.Some challenges faced and lessons learned are presented at the end of this chapter.
Chapter 5 contains conclusions and some directions for future work.Besides the papers in Chapters 2, 3 and 4, others were also published in the course of
this thesis, directly related to this research. There follows a list of publications, includingthe ones that compose the thesis.
• J. Daltio and C. B. Medeiros. Handling multiple foci in graph databases. In Pro-
ceedings of 10th International Conference on Data Integration in the Life Sciences,volume 8574, pages 58-65, Lisboa, Portugal, 2014.
• J. Daltio and C. B. Medeiros. HydroGraph: Exploring Geographic Data in GraphDatabases. In Proceedings XVI Brazilian Symposium on Geoinformatics - GeoInfo,Brazil, 2015.
• J. Daltio and C. B. Medeiros. HydroGraph: Exploring Geographic data in GraphDatabases (extended version of the 2015 GeoInfo). In Brazilian Journal of Cartog-
raphy, volume 68, number 6, 2016.
• J. Daltio and C. B. Medeiros. A view handler for semantic graphs. In Proceedings
of the IEEE 10th International Conference on Semantic Computing, pages 1-5, LosAngeles, 2016.
• J. Daltio and C. B. Medeiros. Graph-Kaleidoscope: A Framework to Handle Multi-ple Perspectives in Graph Databases. In International Journal of Data Science and
Analytics, 2017 (under review).
Chapter 2
Handling Multiple Foci in Graph
Databases
2.1 Introduction and Motivation
eScience, sometimes used as a synonym for data-intensive science [51], is characterizedby joint research in computer science and other �elds to support the whole research cycle� from data collection, mining, and visualization to data sharing. Biodiversity research� our target domain � is a good example of eScience. It is a multidisciplinary �eld thatrequires associating data about living beings and their habitats, constructing models todescribe species' interactions and correlating di�erent information sources. Such dataincludes information on environmental and ecological factors, as well as on species, andincludes images, text, video and sound recordings [29], in multiple spatial and temporalscales.
Sharing and reuse of data are hampered by the heterogeneity of data and user require-ments inherent to such domains. Each community applies di�erent data extraction andprocessing methodologies and has distinct research perspectives and vocabularies. Sev-eral researchers have adopted graph representations (and graph database systems) as acomputational means to deal with such integration challenges [68], especially in situationswhere relations among data and the data itself are at the same importance level [6].
However, graph database systems present limitations when it comes to creating andprocessing multiple perspectives of the underlying data. This paper presents our approachto these issues, which consists of a conceptual framework that allows experts to specifyand construct arbitrary perspectives on top of graph databases. This framework, underconstruction, takes advantage of some of our previous implementation work, in particularconcerning ontology management [31]. Informally, the idea is to support a notion similarto that of database views, constructed on top of graph databases. However, our constructsgo beyond standard database views.
Here, we follow the terminology we introduced in [74], and use the term focus for suchviews. Intuitively, a focus is a perspective of study of a given problem, where data can berestricted to one speci�c scale/representation, or put together objects from distinct scales.Moreover, given the same set of data, distinct foci will arise when the data is analyzed
21
Chapter 2. Handling Multiple Foci in Graph Databases 22
under di�erent models, processed using focus-speci�c algorithms, or even visualized withparticular means.
This paper has two main contributions. The �rst is to explore the notion of viewson graph database systems, which is not yet supported in such systems. This requiresextending the traditional speci�cation of views, while at the same time maintaining thesame principles. The second contribution is to show, via the running example, how tomodel and create multiple foci, for biodiversity research, thereby allowing experts tomanage and analyze the same underlying datasets under arbitrary perspectives.
2.2 Theoretical Foundations and Related Work
2.2.1 Graph Databases
Graph databases allow to represent information about the connectivity of unstructureddata � a recurrent scenario in scienti�c research. The interpretation of scienti�c datausually requires the understanding about linked data, interactions with other data andtopological properties about data organization.
The formal foundation of all graph data structures is based on the mathematicalde�nition of graphs and, on top of this basic layer, several graph data structures wereproposed [6, 71], including features such as directed or undirected edges, labeled or un-labeled edges and hypernodes. One of the most popular structures supported by manygraph database systems is the property graph. It tries to arrange all the features thatthese graph types express in a single and �exible structure through key-value pairs todescribe vertex and edge characteristics, such as type, label or direction.
To manipulate these data, graph query languages can be used to [84]: (i) �nd verticesthat satisfy a pattern; (ii) �nd pairs (x, y) of vertices such that there is a path from x
to y whose sequence of edge labels matches some pattern; (iii) express relations amongpaths; (iv) compute aggregate functions based on graph properties; and (v) create newelements. Each query language has its own syntax and considers its own data structureto represent a graph.
2.2.2 Views
In the context of relational databases, a view can be regarded as a temporary relationagainst which database requests may be issued [42]. Views are widely used to restrict,protect or reorganize relational data. Views are built by a combination of operationsapplied on the underlying relations, creating alternative or composite representations ofexisting database objects. The sequence of operations that creates a particular view iscalled view generating function.
The concept of view is used in many data management contexts. A view of an on-
tology is a subset of the original ontology, built by the extraction of some relevant partsthereof. Tools and languages for ontologies usually take advantage of their graph struc-ture; vertices represent classes and instances and edges represent properties, relations andclass hierarchies. There are di�erent approaches to create ontology views [65]. Some are
Chapter 2. Handling Multiple Foci in Graph Databases 23
based on query languages and others are based on guidelines to navigate through ontologyconcepts, using the notion of central concept � a class around which the view is built andthat de�nes which elements must be part of a view. Di�erent from databases in whicha query always results in an instance set, a query on an ontology can result in a partialschema (classes, relations), an instance set or a combination of both [31].
2.2.3 Multifocus Research
The notion of focus (a perspective of study of a given problem) appears naturally ineScience. The idea behind a focus is similar to the idea of an application � each applicationhas its own perception of the world, goal, complexity and speci�c requirements. For thesame underlying datasets, each focus represents a perception of the data, how it can beanalyzed, visualized and interpreted.
A focus allows to restrict data, manage spatial and temporal scales thereof (multiplerepresentations) and create distinct scenarios, including the vocabulary, constraints, pro-cess and rules that should be applied to the dataset [74, 85]. The same data item canbe interpreted in distinct ways � a species observation, for example, could represent anorganism to be analyzed in a small level of detail or, in a macro perspective, a feature ofa biome.
One important problem in focus-related research is how to improve data semantics,increasing its understanding and removing ambiguity. The use of ontologies has beenpointed out as a means to deal with some of these issues and used to drive data manage-ment. This notion, known as �ontology-driven information systems� [46], uses ontologiesas a central role with impact on the main components of the system and providing multipleperspectives of the data.
2.3 A Framework to Generate Foci
The goal of our research is to specify and implement a framework to build and explorearbitrary foci. To achieve this purpose, we extend the traditional de�nition of views torepresent a focus, providing a reorganization of the original data or part thereof. Theframework uses graph databases as the basis of data management, taking advantage oftheir ability to deal with highly connected datasets, a common scenario in eScience. Sincegraph databases do not implement the view concept, the framework introduces extensionsto existing systems.
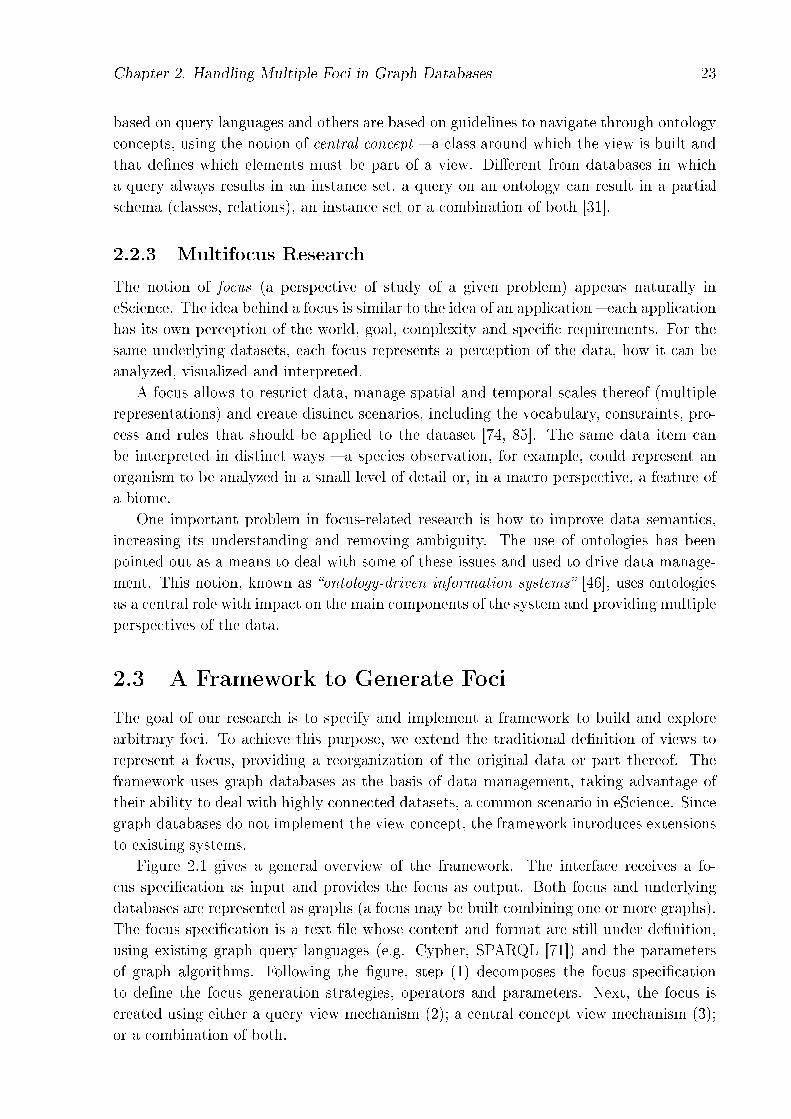
Figure 2.1 gives a general overview of the framework. The interface receives a fo-cus speci�cation as input and provides the focus as output. Both focus and underlyingdatabases are represented as graphs (a focus may be built combining one or more graphs).The focus speci�cation is a text �le whose content and format are still under de�nition,using existing graph query languages (e.g. Cypher, SPARQL [71]) and the parametersof graph algorithms. Following the �gure, step (1) decomposes the focus speci�cationto de�ne the focus generation strategies, operators and parameters. Next, the focus iscreated using either a query view mechanism (2); a central concept view mechanism (3);or a combination of both.
Chapter 2. Handling Multiple Foci in Graph Databases 24
Figure 2.1: Overview of the Focus Generation Process
The query view approach (2) adopts concepts from relational databases. Here we havetwo tasks: processing the operators that compose the query and creating new elementsthat do not belong to the original graph. Part of the focus speci�cation is used to createthe �view generator function�, the sequence of operators to be applied to the database.The traditional operators are adapted by the framework: (i) selection: to �lter parts of thegraph applying predicates; (ii) projection: to restrict parts of the original graph; (iii) join:to combine two or more graph databases via join conditions; (iv) aggregate functions: toprovide graph summarizations, extracting vertex and edge properties.
The central concept view approach (3) is inspired by approaches to construct viewson ontologies. Here, just one task is executed: processing of graph algorithms, startingfrom a central concept, namely a vertex de�ned in the focus speci�cation. This graphalgorithm can provide, for instance, the neighborhood, the shortest path to another ver-tex, the maximum clique, and so on [16]. The combination of these approaches allowsexpressiveness higher than graph query languages alone, usually untyped [26], based ontriple patterns [71] and without native graph algorithms. Besides that, graph languageshave limitations to create temporary elements without altering the original database andthe result of a query is not necessarily a graph.
Graph databases and the foci created on the top of them are stored in a persistencelayer, so that a focus can be reused. Moreover, since a focus is represented as a sub-graph,it can be used to construct other foci. We also keep the speci�cation that originates afocus for provenance information � e.g., to describe the perspective materialized in thefocus and to allow to update a focus when the graph databases used to generate it areupdated.
2.4 Running Example
Our running example concerns biodiversity studies of animal species, concentrating onobservation metadata. In particular, we deal with observations of animal vocalizations,motivated by the challenges faced by the Fonoteca Neotropical Jacques Vielliard (FNJV)at the University of Campinas (UNICAMP) 1. FNJV has a large collection of animal sound
1http://proj.lis.ic.unicamp.br/fnjv
Chapter 2. Handling Multiple Foci in Graph Databases 25
recordings (about 30 thousand observations), whose metadata is stored in a relationaldatabase [29]. Observation metadata include information about the species, the placewhere the sound was recorded, the recording devices, date and time of the observation,and so on.
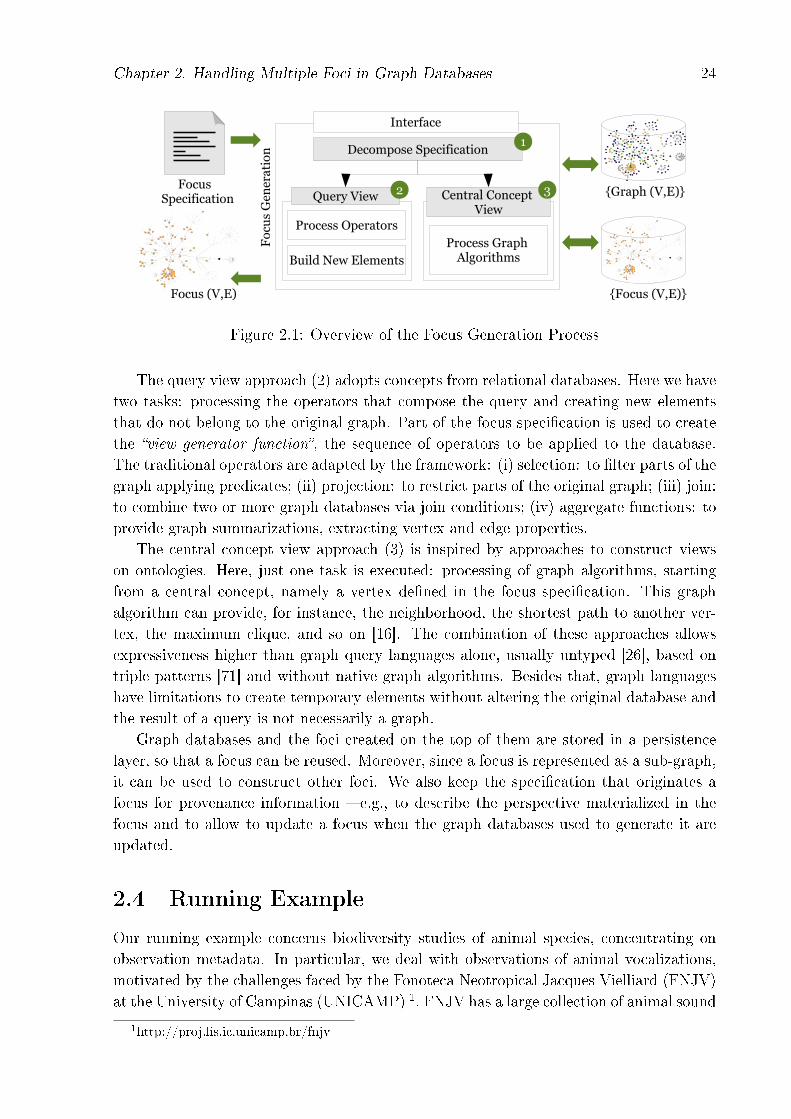
Although the metadata is, currently, structured as a relational database, it can bedirectly converted to a property graph database [71], applying straight formal approaches,e.g. [12, 68]. Each row of each table can be modeled as a vertex, using the column namesas attributes, and each foreign key can be modeled as an edge. Altogether, an observationhas 54 metadata attributes, which can be combined in di�erent ways to determine theedges of the graph database. Figure 2.2 shows one possible graph database denoted byGobs. In the �gure, vertices 1 through 6 represent the taxonomic hierarchy of the observedspecies, and vertices 8 through 11 characterize an observation, represented by vertex 7.
Figure 2.2: Partial Metadata Graph Database of FNJV Observations - Gobs
Gobs can be integrated with many additional information sources, such as biologicaland environmental variables to describe the context in which vocalizations were recorded.Distinct pieces of information can be used to produce speci�c analyses and to build foci.A focus may concern, for example, a geographical scale or a group of species of interest.The following examples describe some use scenarios of foci for this graph database.
2.4.1 Example Focus 1: Location and Biomes
An example of focus which changes the perspective of analysis is de�ned as:
�Set of all locations in which observations were made, summarizing the number of
distinct species observed at each location, and connecting the locations that belong to the
same biome�.
This kind of focus can be helpful to analyze the biological and environmental char-acteristics of locations that were targets of study. To process this focus, it is necessary
Chapter 2. Handling Multiple Foci in Graph Databases 26
to aggregate the observation data to generate new information (here, the number of dis-tinct species) and to link the original data with biome information (graph external to ourdatabase).
Let us �rst consider just the �rst part of the focus: �Set of all locations in which
observations were made, summarizing the number of distinct species observed at each
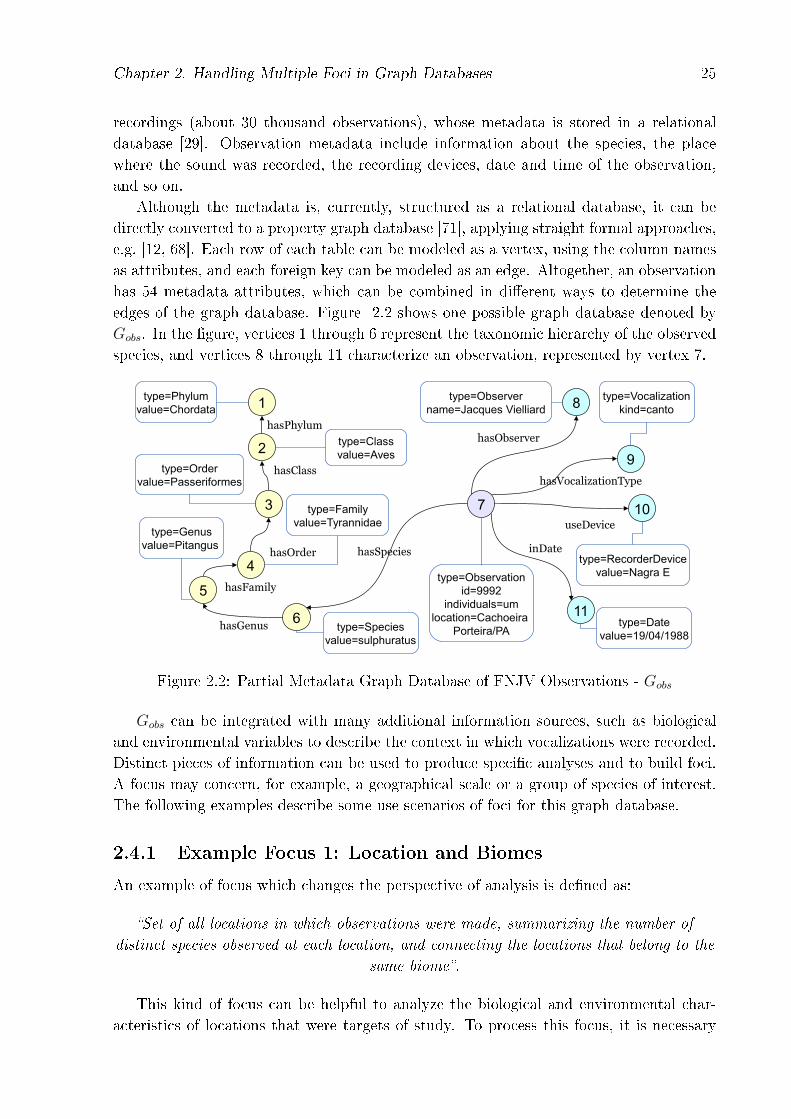
location�. This kind of focus can also be processed by the query view approach (2) of theframework, combining: (i) �build new element� operator, to create the set of vertices withtype Location from the attribute location of vertices of type Observation in Gbio; (ii)�aggregate function� operator, to count the number of distinct species observed in eachLocation and store the value in numberOfSpecies attribute; (iii) �projection� operator, to�lter the vertex and edge types that should be part of the focus (in this case, Location).
Figure 2.3: Focus: (a) location and number of distinct species and (b) Partial BiomeGraph Database - Gbio
Figure 2.3 (a) presents a portion of Gobs and explains these steps, with the creationof vertex 6 Campinas SP of type Location and numberOfSpecies (here, set to value 2).To connect the locations of the same biome, it is necessary to add biome information notavailable in Gobs. Figure 2.3 (b) shows a partial biome graph database (here shortenedto Gbio), which is used to integrate this information, using the join operator. In thiscase, the focus speci�cation combines: (i) �join� operator, to link each vertex with typeLocation in Gobs with the corresponding vertex of type Biome in Gbio, creating an edge(hasBiome) between Location and Biome; (ii) �build new element� operator, to createthe set of edges with type sameBiome beetween the Locations connected to the sameBiome; (iii) �projection� operator, to �lter the vertex and edge types that should be partof the focus (vertices of types Location and Biome). A partial view of the result focusis shown in Figure 2.4 (a).
2.4.2 Example Focus 2: Species �Closely Related� to Tinamus
tao
Another possible scenario builds the focus from a central concept. Here, an examplewould be:
Chapter 2. Handling Multiple Foci in Graph Databases 27
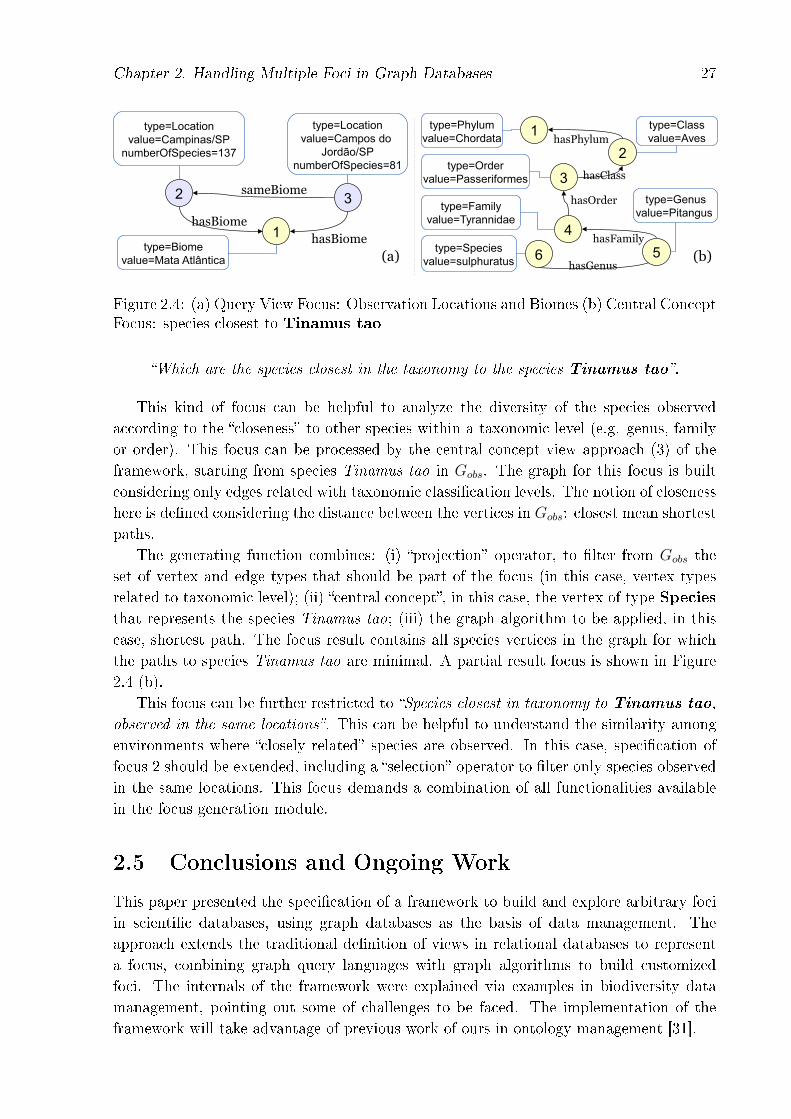
Figure 2.4: (a) Query View Focus: Observation Locations and Biomes (b) Central ConceptFocus: species closest to Tinamus tao
�Which are the species closest in the taxonomy to the species Tinamus tao�.
This kind of focus can be helpful to analyze the diversity of the species observedaccording to the �closeness� to other species within a taxonomic level (e.g. genus, familyor order). This focus can be processed by the central concept view approach (3) of theframework, starting from species Tinamus tao in Gobs. The graph for this focus is builtconsidering only edges related with taxonomic classi�cation levels. The notion of closenesshere is de�ned considering the distance between the vertices in Gobs: closest mean shortestpaths.
The generating function combines: (i) �projection� operator, to �lter from Gobs theset of vertex and edge types that should be part of the focus (in this case, vertex typesrelated to taxonomic level); (ii) �central concept�, in this case, the vertex of type Speciesthat represents the species Tinamus tao; (iii) the graph algorithm to be applied, in thiscase, shortest path. The focus result contains all species vertices in the graph for whichthe paths to species Tinamus tao are minimal. A partial result focus is shown in Figure2.4 (b).
This focus can be further restricted to �Species closest in taxonomy to Tinamus tao,
observed in the same locations�. This can be helpful to understand the similarity amongenvironments where �closely related� species are observed. In this case, speci�cation offocus 2 should be extended, including a �selection� operator to �lter only species observedin the same locations. This focus demands a combination of all functionalities availablein the focus generation module.
2.5 Conclusions and Ongoing Work
This paper presented the speci�cation of a framework to build and explore arbitrary fociin scienti�c databases, using graph databases as the basis of data management. Theapproach extends the traditional de�nition of views in relational databases to representa focus, combining graph query languages with graph algorithms to build customizedfoci. The internals of the framework were explained via examples in biodiversity datamanagement, pointing out some of challenges to be faced. The implementation of theframework will take advantage of previous work of ours in ontology management [31].
Chapter 2. Handling Multiple Foci in Graph Databases 28
The �rst challenge involves extending the concept of view of relational databases tograph databases. Another challenge is related to the speci�cation of a focus. At themoment, we assume that a focus is speci�ed by indicating a suite of operations to beapplied to the underling graph databases. This, however, will need to be improved oncewe formalize focus construction operators.
Chapter 3
Hydrograph: Exploring Geographic
Data In Graph Databases
3.1 Introduction and Motivation
During the last decade, the volumes of data that are being stored have increased massively.This has been called the �industrial revolution of data�, and directly a�ected the worldof science. Nowadays, the available data volume easily outpaces the speed with which itcan be analyzed and understood [41]. Computer science has thus become a key elementin scienti�c research.
This phenomenon, known as eScience, is characterized by conducting joint research incomputer science and other �elds to support the whole research cycle, from collection andmining of data to visual representation and data sharing. It encompasses techniques andtechnologies for data-intensive science, the new paradigm for scienti�c exploration [51].
Besides the huge volume, the so-called �big data� carries many heterogeneity levels �including provenance, quality, structure and semantics. To try to deal with these require-ments, new database models and technologies emerge aiming at scalability, availabilityand �exibility. The term NoSQL was coined to describe a broad class of databases charac-terized by non-adherence to properties of traditional relational databases [50]. It encom-passes di�erent attempts to propose data models to solve a particular data managementissue.
Geospatial big data (i.e., big data with a geographic location component) faces evenmore challenges � it requires speci�c storage, retrieval, processing and analysis mecha-nisms [2]. In addition, it demands improved tools to handle knowledge discovery tasks.
The more widely accepted kinds of NoSQL databases include key-value, document,column-family and graph models. Of these, graph databases are the most suitable choiceto handle geospatial big data [3]. Indeed, graphs are the only data structure that nativelydeals with highly connected data, without extra index structures or joins. No indexlookups are needed for traversing data, since every node has links to its neighbors. Besides,in GIS, topological relationships play an important role. These relationships can benaturally modeled with graphs, providing �exibility in traversing geospatial data basedon diverse aspects.
29
Chapter 3. Exploring Geographic Data In Graph Databases 30
Geospatial data about water resources �ts these graph connectivity criteria � e.g.,watersheds or drainage networks. Owing to the shortage of drinking water, reliable in-formation about volume and quality in each watershed is important for management andproper planning of their use. A watershed is usually represented as drainage network, withcon�uences, start and end points connected by drainage stretches (the network edges).
This paper presents an ongoing work that explores geospatial watershed data takingadvantage of graph databases. The goal is to show that this scenario provides addi-tional opportunities for knowledge discovery tasks through classical graph algorithms.The Brazilian Watershed database is used as a case study. The mapping between geospa-tial and graph models is based on the natural network that emerges from the topologicalrelationships among geographic entities.
The rest of this paper is organized as follows. Section 3.2 contains a brief descriptionof the main concepts involved and gives an overview of the Brazilian Watershed relationaldatabase. Section 3.3 presents the process of loading watersheds to a graph databaseand presents results of important and recurrent queries over watersheds. Some researchchallenges involved are presented in section 3.4. Finally, section 3.5 presents conclusionsand ongoing work.
3.2 Research Scenario and Theoretical Foundations
3.2.1 Brazilian Water Resources Database
Brazil is a privileged country in the water-shortage scenario: it holds 12% of the worldtotal and the largest reserve of fresh water on Earth [18]. Its distribution, however, isuneven across the country. Amazonas, for instance, is the state with the largest watershedand one of the less populous in Brazil. Furthermore, some rivers are being contaminatedby waste of illegal mining activities (such as mercury), agricultural pesticides, domesticand industrial sewage leak and garbage.
Reliable information about volume and quality in water resources is extremely impor-tant to management and proper planning of their use. To this end, the Brazilian FederalGovernment approved in 1997 the National Water Law [17] aiming to adopt modern prin-ciples of management of water resources and created in 2000 the National Water Agency(ANA), legally responsible for accomplishing this goal and ensuring the sustainable useof fresh water.
To organize the required data and support management tasks, ANA adopts the water-shed classi�cation proposed by Otto Pfafstetter [69], constructing a database that coversthe entire country, named Brazilian Ottocoded Watershed. This database represents thehydrography as a drainage network: a set of drainage points and stretches. This networkis represented as a binary tree-graph, connected and acyclic, whose edges � the drainagestretches � go from the leaves to the root, i.e., upstream to downstream.
The Brazilian drainage network is composed by 620.280 drainage points (vertices, ingraph terms) and 620.279 drainage stretches (edges). Drainage points represent diversegeographic entities:
Chapter 3. Exploring Geographic Data In Graph Databases 31
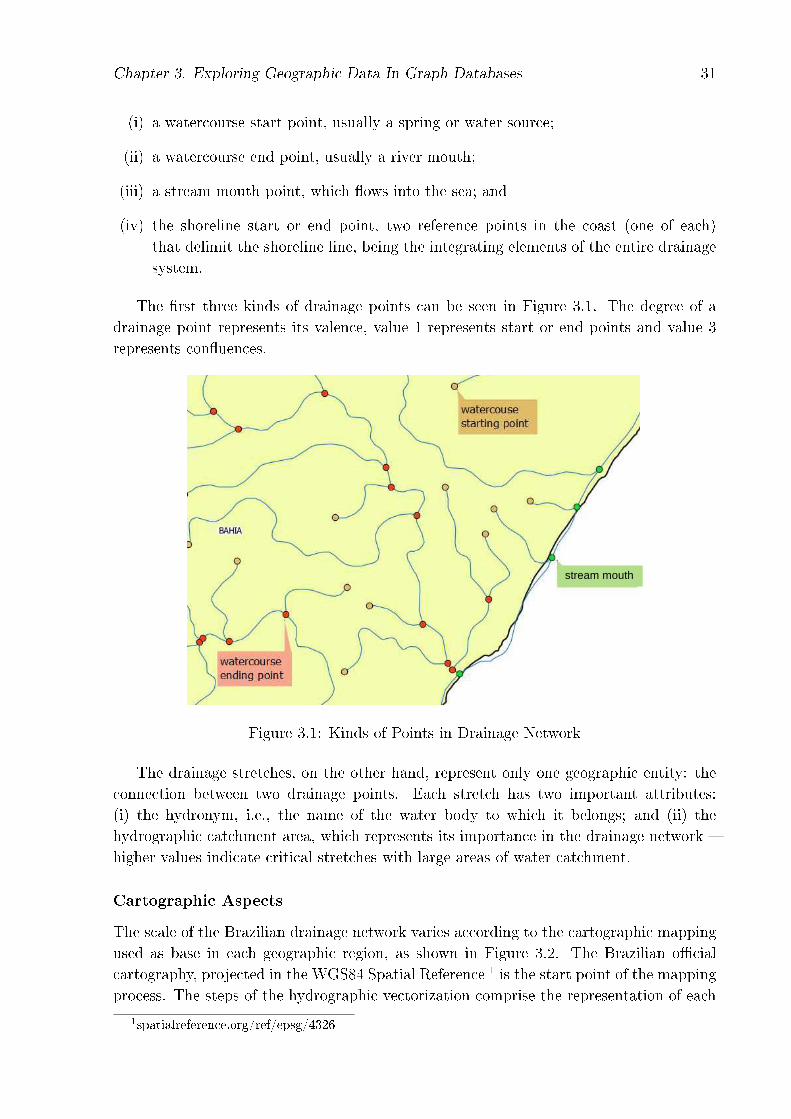
(i) a watercourse start point, usually a spring or water source;
(ii) a watercourse end point, usually a river mouth;
(iii) a stream mouth point, which �ows into the sea; and
(iv) the shoreline start or end point, two reference points in the coast (one of each)that delimit the shoreline line, being the integrating elements of the entire drainagesystem.
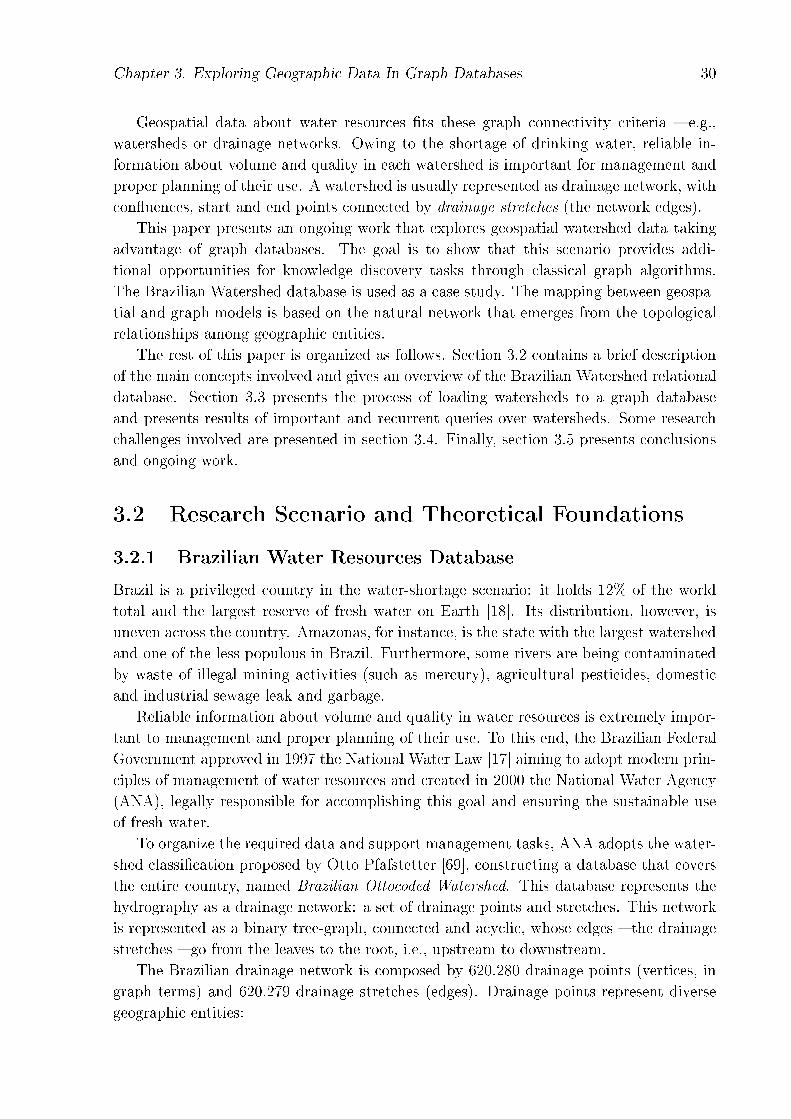
The �rst three kinds of drainage points can be seen in Figure 3.1. The degree of adrainage point represents its valence, value 1 represents start or end points and value 3represents con�uences.
Figure 3.1: Kinds of Points in Drainage Network
The drainage stretches, on the other hand, represent only one geographic entity: theconnection between two drainage points. Each stretch has two important attributes:(i) the hydronym, i.e., the name of the water body to which it belongs; and (ii) thehydrographic catchment area, which represents its importance in the drainage network �higher values indicate critical stretches with large areas of water catchment.
Cartographic Aspects
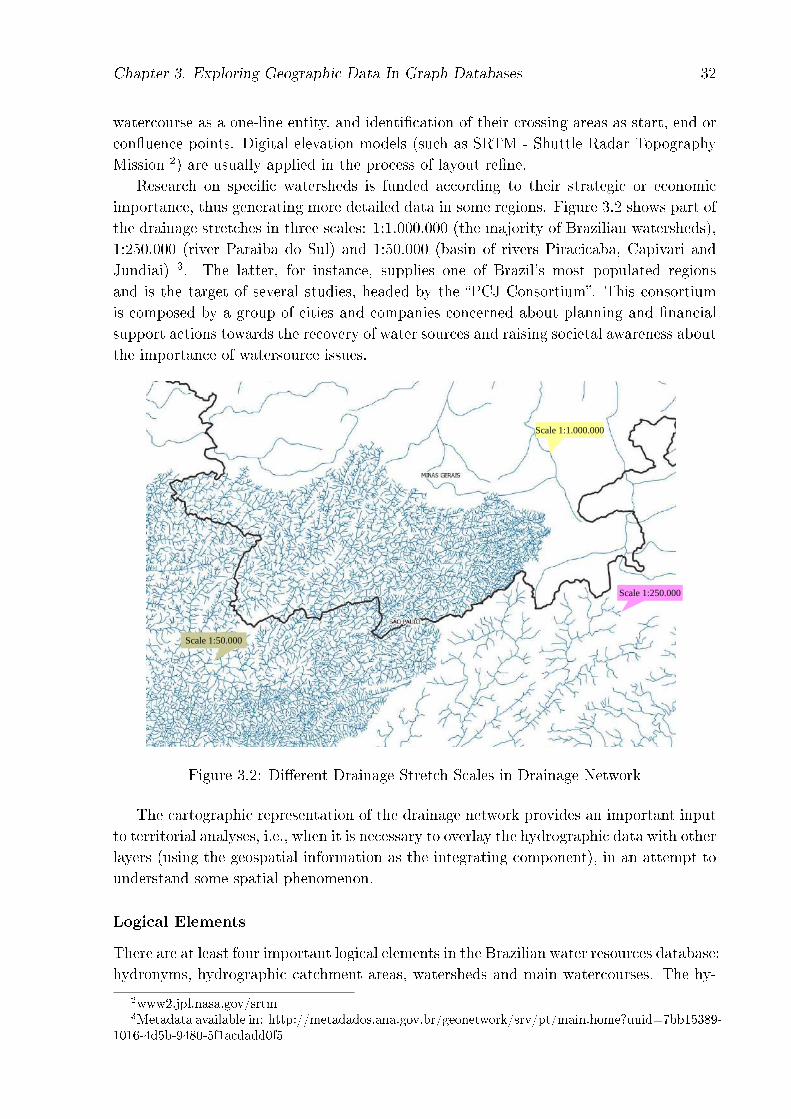
The scale of the Brazilian drainage network varies according to the cartographic mappingused as base in each geographic region, as shown in Figure 3.2. The Brazilian o�cialcartography, projected in the WGS84 Spatial Reference 1 is the start point of the mappingprocess. The steps of the hydrographic vectorization comprise the representation of each
1spatialreference.org/ref/epsg/4326
Chapter 3. Exploring Geographic Data In Graph Databases 32
watercourse as a one-line entity, and identi�cation of their crossing areas as start, end orcon�uence points. Digital elevation models (such as SRTM - Shuttle Radar TopographyMission 2) are usually applied in the process of layout re�ne.
Research on speci�c watersheds is funded according to their strategic or economicimportance, thus generating more detailed data in some regions. Figure 3.2 shows part ofthe drainage stretches in three scales: 1:1.000.000 (the majority of Brazilian watersheds),1:250.000 (river Paraiba do Sul) and 1:50.000 (basin of rivers Piracicaba, Capivari andJundiai) 3. The latter, for instance, supplies one of Brazil's most populated regionsand is the target of several studies, headed by the �PCJ Consortium�. This consortiumis composed by a group of cities and companies concerned about planning and �nancialsupport actions towards the recovery of water sources and raising societal awareness aboutthe importance of watersource issues.
Figure 3.2: Di�erent Drainage Stretch Scales in Drainage Network
The cartographic representation of the drainage network provides an important inputto territorial analyses, i.e., when it is necessary to overlay the hydrographic data with otherlayers (using the geospatial information as the integrating component), in an attempt tounderstand some spatial phenomenon.
Logical Elements
There are at least four important logical elements in the Brazilian water resources database:hydronyms, hydrographic catchment areas, watersheds and main watercourses. The hy-
2www2.jpl.nasa.gov/srtm3Metadata available in: http://metadados.ana.gov.br/geonetwork/srv/pt/main.home?uuid=7bb15389-
1016-4d5b-9480-5f1acdadd0f5
Chapter 3. Exploring Geographic Data In Graph Databases 33
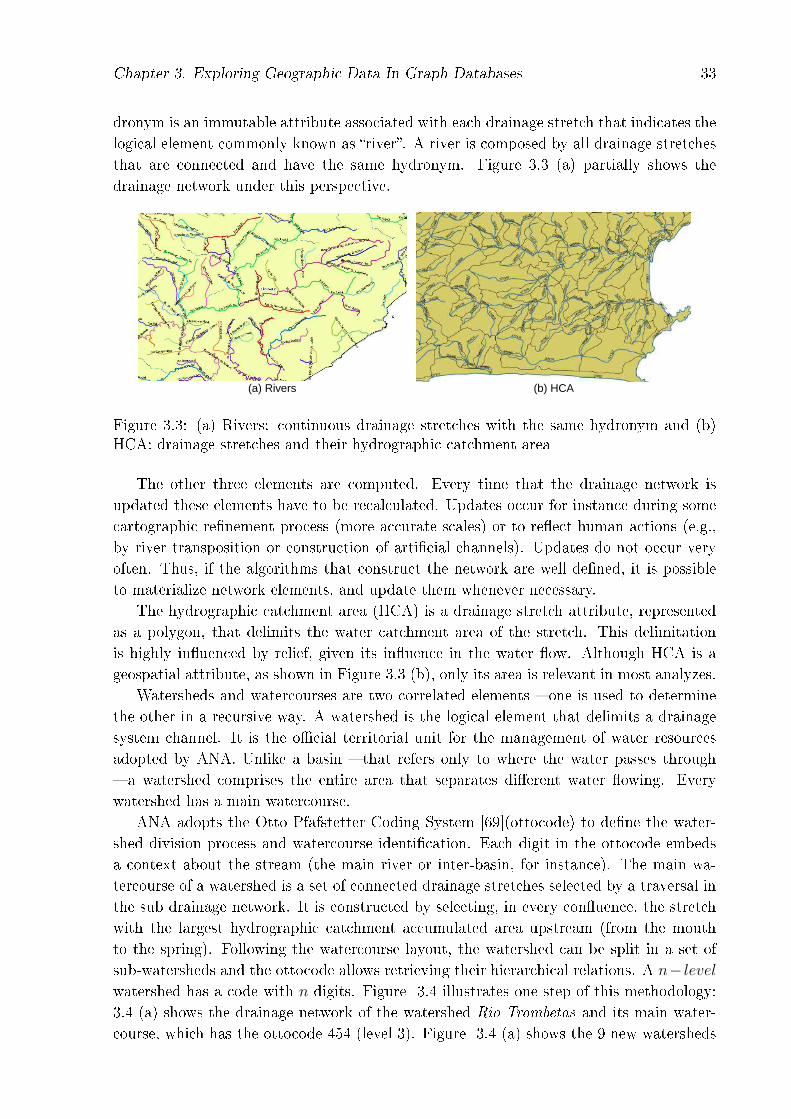
dronym is an immutable attribute associated with each drainage stretch that indicates thelogical element commonly known as �river�. A river is composed by all drainage stretchesthat are connected and have the same hydronym. Figure 3.3 (a) partially shows thedrainage network under this perspective.
Figure 3.3: (a) Rivers: continuous drainage stretches with the same hydronym and (b)HCA: drainage stretches and their hydrographic catchment area
The other three elements are computed. Every time that the drainage network isupdated these elements have to be recalculated. Updates occur for instance during somecartographic re�nement process (more accurate scales) or to re�ect human actions (e.g.,by river transposition or construction of arti�cial channels). Updates do not occur veryoften. Thus, if the algorithms that construct the network are well de�ned, it is possibleto materialize network elements, and update them whenever necessary.
The hydrographic catchment area (HCA) is a drainage stretch attribute, representedas a polygon, that delimits the water catchment area of the stretch. This delimitationis highly in�uenced by relief, given its in�uence in the water �ow. Although HCA is ageospatial attribute, as shown in Figure 3.3 (b), only its area is relevant in most analyzes.
Watersheds and watercourses are two correlated elements � one is used to determinethe other in a recursive way. A watershed is the logical element that delimits a drainagesystem channel. It is the o�cial territorial unit for the management of water resourcesadopted by ANA. Unlike a basin � that refers only to where the water passes through� a watershed comprises the entire area that separates di�erent water �owing. Everywatershed has a main watercourse.
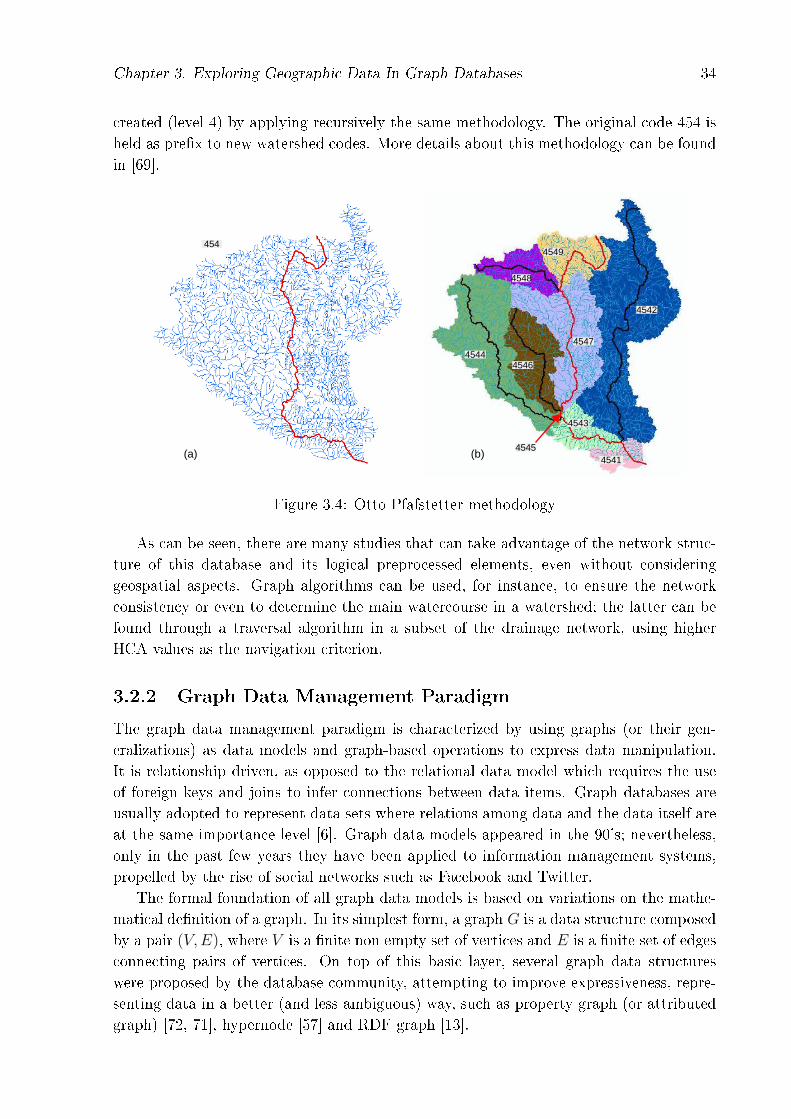
ANA adopts the Otto Pfafstetter Coding System [69](ottocode) to de�ne the water-shed division process and watercourse identi�cation. Each digit in the ottocode embedsa context about the stream (the main river or inter-basin, for instance). The main wa-tercourse of a watershed is a set of connected drainage stretches selected by a traversal inthe sub drainage network. It is constructed by selecting, in every con�uence, the stretchwith the largest hydrographic catchment accumulated area upstream (from the mouthto the spring). Following the watercourse layout, the watershed can be split in a set ofsub-watersheds and the ottocode allows retrieving their hierarchical relations. A n− levelwatershed has a code with n digits. Figure 3.4 illustrates one step of this methodology:3.4 (a) shows the drainage network of the watershed Rio Trombetas and its main water-course, which has the ottocode 454 (level 3). Figure 3.4 (a) shows the 9 new watersheds
Chapter 3. Exploring Geographic Data In Graph Databases 34
created (level 4) by applying recursively the same methodology. The original code 454 isheld as pre�x to new watershed codes. More details about this methodology can be foundin [69].
Figure 3.4: Otto Pfafstetter methodology
As can be seen, there are many studies that can take advantage of the network struc-ture of this database and its logical preprocessed elements, even without consideringgeospatial aspects. Graph algorithms can be used, for instance, to ensure the networkconsistency or even to determine the main watercourse in a watershed; the latter can befound through a traversal algorithm in a subset of the drainage network, using higherHCA values as the navigation criterion.
3.2.2 Graph Data Management Paradigm
The graph data management paradigm is characterized by using graphs (or their gen-eralizations) as data models and graph-based operations to express data manipulation.It is relationship driven, as opposed to the relational data model which requires the useof foreign keys and joins to infer connections between data items. Graph databases areusually adopted to represent data sets where relations among data and the data itself areat the same importance level [6]. Graph data models appeared in the 90's; nevertheless,only in the past few years they have been applied to information management systems,propelled by the rise of social networks such as Facebook and Twitter.
The formal foundation of all graph data models is based on variations on the mathe-matical de�nition of a graph. In its simplest form, a graph G is a data structure composedby a pair (V,E), where V is a �nite non empty set of vertices and E is a �nite set of edgesconnecting pairs of vertices. On top of this basic layer, several graph data structureswere proposed by the database community, attempting to improve expressiveness, repre-senting data in a better (and less ambiguous) way, such as property graph (or attributedgraph) [72, 71], hypernode [57] and RDF graph [13].
Chapter 3. Exploring Geographic Data In Graph Databases 35
Considering the edges, a graph can be directed (i.e., there is a tail and head to eachedge); single relational or multi-relational (i.e., multiple relationships can exist betweentwo vertices). The connection structure a�ects the traversal. An edge can have di�erentmeanings, such as attributes, hierarchies or neighborhood relations. Despite their �exibil-ity and e�cient management of heavily linked data, there is no consensual data structureand query language for graph databases.
One of the most popular graph structures is the property graph (or attributed graph) [72,71]. It tries to arrange vertex and edge features in a �exible structure through key-valuepairs (e.g., type, label or direction).
3.3 Implementation
3.3.1 Original Relational Database: pgHydro
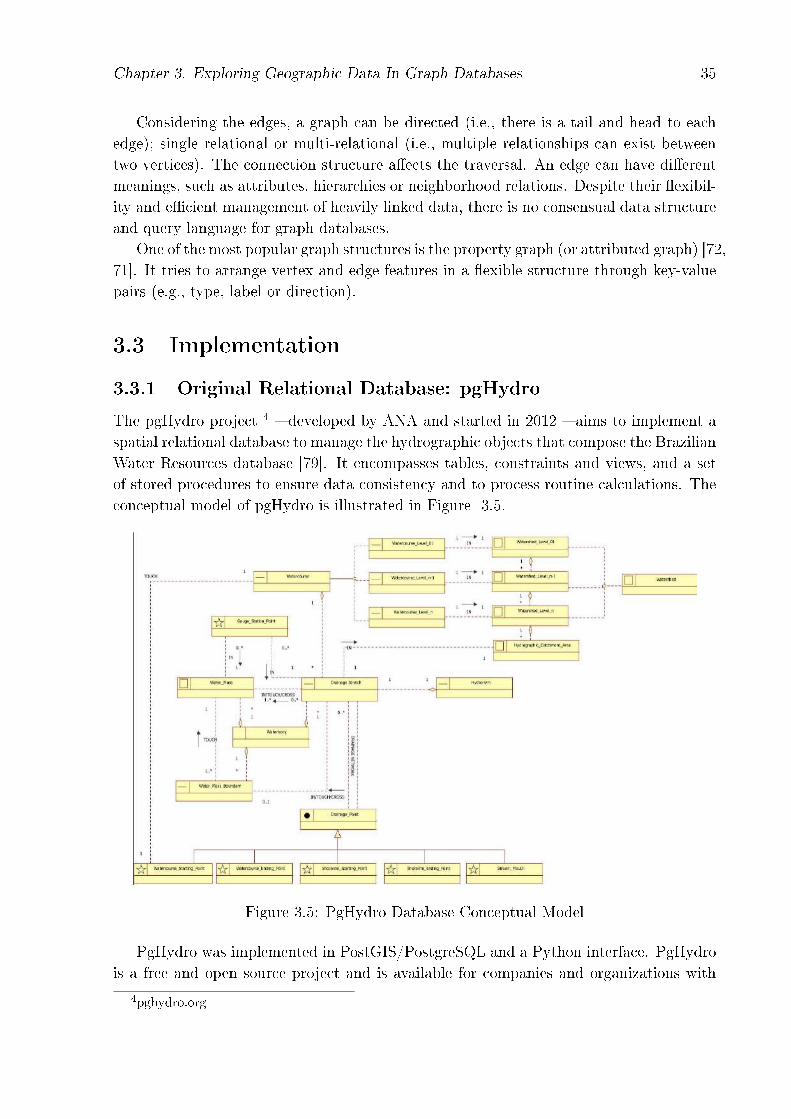
The pgHydro project 4 � developed by ANA and started in 2012 � aims to implement aspatial relational database to manage the hydrographic objects that compose the BrazilianWater Resources database [79]. It encompasses tables, constraints and views, and a setof stored procedures to ensure data consistency and to process routine calculations. Theconceptual model of pgHydro is illustrated in Figure 3.5.
Figure 3.5: PgHydro Database Conceptual Model
PgHydro was implemented in PostGIS/PostgreSQL and a Python interface. PgHydrois a free and open source project and is available for companies and organizations with
4pghydro.org
Chapter 3. Exploring Geographic Data In Graph Databases 36
an interest in management and decision making in water resources. More spatial analysiscan be done using GIS, such as ArcGIS 5 or QuantumGIS 6.
3.3.2 Proposal Graph Database: HydroGraph
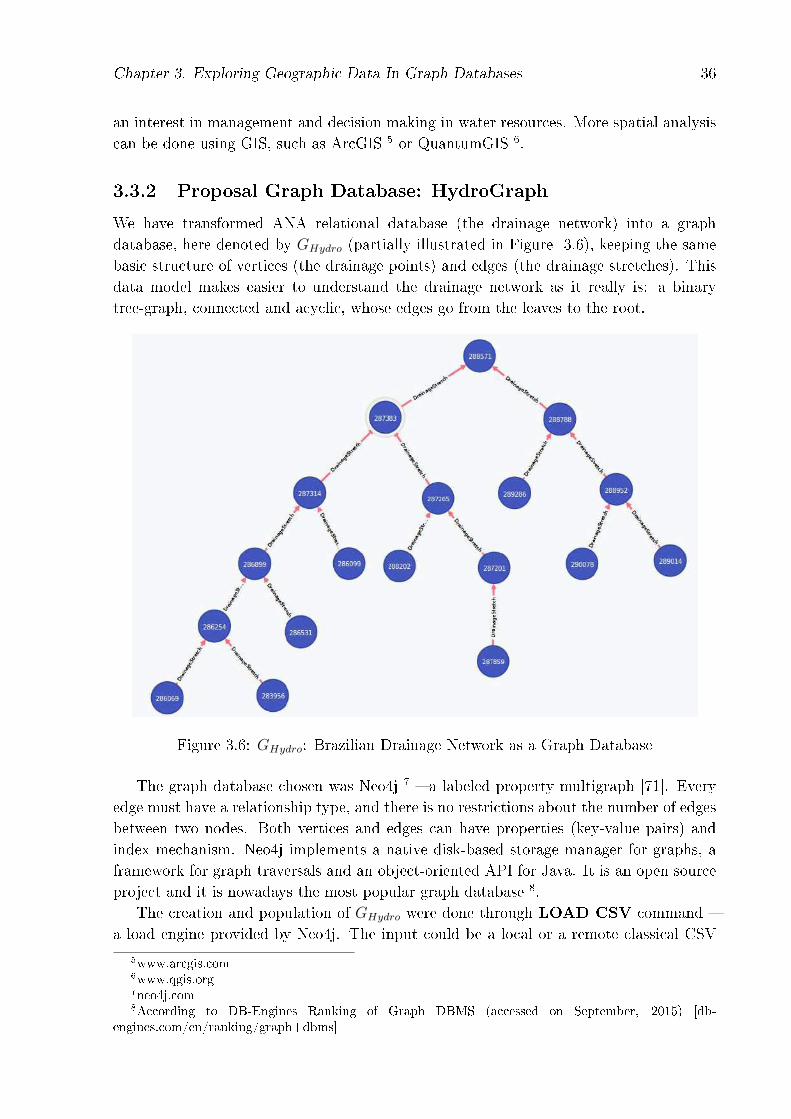
We have transformed ANA relational database (the drainage network) into a graphdatabase, here denoted by GHydro (partially illustrated in Figure 3.6), keeping the samebasic structure of vertices (the drainage points) and edges (the drainage stretches). Thisdata model makes easier to understand the drainage network as it really is: a binarytree-graph, connected and acyclic, whose edges go from the leaves to the root.
Figure 3.6: GHydro: Brazilian Drainage Network as a Graph Database
The graph database chosen was Neo4j 7 � a labeled property multigraph [71]. Everyedge must have a relationship type, and there is no restrictions about the number of edgesbetween two nodes. Both vertices and edges can have properties (key-value pairs) andindex mechanism. Neo4j implements a native disk-based storage manager for graphs, aframework for graph traversals and an object-oriented API for Java. It is an open sourceproject and it is nowadays the most popular graph database 8.
The creation and population of GHydro were done through LOAD CSV command �a load engine provided by Neo4j. The input could be a local or a remote classical CSV
5www.arcgis.com6www.qgis.org7neo4j.com8According to DB-Engines Ranking of Graph DBMS (accessed on September, 2015) [db-
engines.com/en/ranking/graph+dbms]
Chapter 3. Exploring Geographic Data In Graph Databases 37
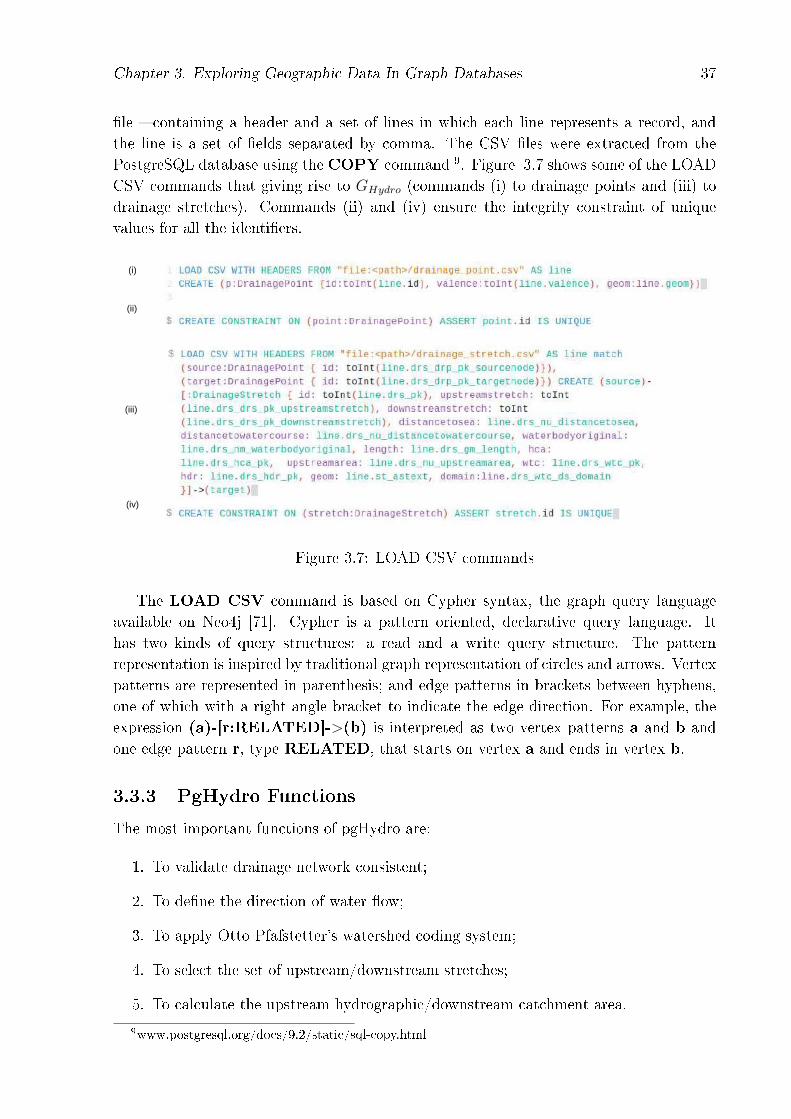
�le � containing a header and a set of lines in which each line represents a record, andthe line is a set of �elds separated by comma. The CSV �les were extracted from thePostgreSQL database using the COPY command 9. Figure 3.7 shows some of the LOADCSV commands that giving rise to GHydro (commands (i) to drainage points and (iii) todrainage stretches). Commands (ii) and (iv) ensure the integrity constraint of uniquevalues for all the identi�ers.
Figure 3.7: LOAD CSV commands
The LOAD CSV command is based on Cypher syntax, the graph query languageavailable on Neo4j [71]. Cypher is a pattern oriented, declarative query language. Ithas two kinds of query structures: a read and a write query structure. The patternrepresentation is inspired by traditional graph representation of circles and arrows. Vertexpatterns are represented in parenthesis; and edge patterns in brackets between hyphens,one of which with a right angle bracket to indicate the edge direction. For example, theexpression (a)-[r:RELATED]->(b) is interpreted as two vertex patterns a and b andone edge pattern r, type RELATED, that starts on vertex a and ends in vertex b.
3.3.3 PgHydro Functions
The most important functions of pgHydro are:
1. To validate drainage network consistent;
2. To de�ne the direction of water �ow;
3. To apply Otto Pfafstetter's watershed coding system;
4. To select the set of upstream/downstream stretches;
5. To calculate the upstream hydrographic/downstream catchment area.
9www.postgresql.org/docs/9.2/static/sql-copy.html
Chapter 3. Exploring Geographic Data In Graph Databases 38
As can be readily seen, most of these functions can be solved applying to graphalgorithms on GHydro. Execute these tasks over relational databases would require manyjoin operations � one of the most computationally expensive processes in SQL databases.Another possibility would be to build an in-memory network representation on top of therelational storage model and to use APIs and programming languages. Graph databasesexempt the need of intermediate models from storage to application logic layer.
Consistency tests over the drainage network concern mainly two aspects: connectiv-ity of all stretches and the binary tree structure. In graph terms � considering GHydro
implementation � we can apply the connected component analysis solution. A connectedcomponent in a graph G is a subgraph H of G in which, for each pair of vertices u andv, there is a path connecting u and v. If more than one connected component is foundin GHydro, the database is inconsistent. The binary tree structure, on the other hand, ischecked selecting all vertices whose degree value are di�erent from 1 (start or end points)or 3 (con�uences).
The selection of the upstream stretches can be done applying to Depth-First Search,starting on the stretch of interest and ending on the watershed root. To calculate theupstream hydrographic catchment area, we sum the HCA from each drainage stretchreturned in the previous selection. The same approach can be applied to downstreamstretches, using the opposite navigation direction and aggregating all subtrees.
The calculation of the Otto Pfafstetter watershed coding is a more complex task, butit is still a graph traversal. The base task is to de�ne the main watercourse. Here, unlikethe previous computations we need to establish graph traversal criteria on each node:selecting, at every con�uence, the stretch with the largest HCA accumulated upstream.
Among all these functions, only the de�nition of water �ow direction is actually aGIS task and depends on the geospacial information. This calculation involves solvingequations that examine the relationship among several variables such as stream length,water depth, resistance of the surface and relief.
3.4 Research Challenges
There are at least three important challenges involved in our approach. The �rst isrelated to the incompleteness of graph data models. According to the classical de�nition, acomplete data model should be composed by three main elements: (i) data structure types,(ii) operators to retrieve or derive data and (iii) integrity rules to de�ne consistent thedatabase states [25]. Related work on graph data models shows that they are incompleteconcerning on least one of these aspects. Most of them concern only data structures �hypergraphs, RDF or property graphs. Others describe only query languages or APIsto manipulate or retrieve data. There are few attempts to discuss consistency or ACIDproperties over graph data models. This scenario hampers the formalizing of a completegraph data model. Besides, most implementations of graph databases do not adhere tothe theoretical models.
Second, traditional Relational Database Management Systems (RDBMS) are the mostmature solution to data persistence and usually the best option when strong consistency
Chapter 3. Exploring Geographic Data In Graph Databases 39
is required. Besides, there are many spatial extensions over RDBMS current used as foun-dation to geospatial systems and services. Therefore, in some cases there is need for thecoexistence of both models � relational and graph � dividing tasks of management andanalysis according to their specialties. This requires the development of hybrid architec-ture to enable the integration of relational and graph databases, as proposed by [22].
Finally, the task of network-driven analysis is not completely solved once the graphdatabase is available. The graph data design (i.e., which data is represented as vertices,which is represented as edges and what kind of properties they have) can streamline oreven render non-viably the extraction of topological or graph properties. There is nosimple way to crossing through di�erent designs in graph databases. This challenge isalso goal of our research, as described in [35]. The idea is to specify and implement anextension of the concept of view (from relational databases) to graph database, therebyallowing managing and analyze a graph database under arbitrary perspectives. Considerthis speci�c database, it would be possible to explore not only the drainage network, butalso the network among the logical elements � rivers, watersheds and watercourses.
3.5 Conclusions
This paper presented our ongoing work to construct a graph database infrastructure tosupport analysis operations on the Brazilian Water Resources database. Our researchshows the importance of graph driven analysis over the drainage network, rather than thecomputationally expensive process of relational databases for such analysis. It presentedGHydro � a version of the original relational database implemented on Neo4j, composedby 620.280 drainage points (vertices) and 620.279 drainage stretches (edges).
Our research takes advantage of graph structures to model and navigate throughrelationships across the network and its logical elements � watersheds and watercourses.This helps analysts' work in analysis and forecast. However, given the complexity ofgeospatial data � mainly on big data proportions � there is still no single solution to solveall persistence, management and analysis issues. Hybrid architecture approaches seem tobe the most �exible and complete choice.
Chapter 4
Graph-Kaleidoscope: A Framework to
Handle Multiple Perspectives in Graph
Databases
4.1 Introduction
Increasingly, the world of science is being changed. Data is being produced and collectedat an unprecedented scale and outpaces the speed with which it can be analyzed andunderstood [41]. Data - intensive science emerged as a new paradigm for scienti�c explo-ration [51, 53]. Computer science has become a key element in scienti�c research in manyareas, such as bioinformatics [28], social network sciences [15] and health [61].
One important requirement of data-intensive science is to support multiple perspec-tives on large and complex datasets. Many research scenarios require dealing with asubset of data of interest, under multiple aggregation / generalization levels, for givenperspectives and a speci�c vocabulary. This problem is addressed by [73], who de�ne afocus as a perspective of study of a given problem, in which data can be restricted to onespeci�c scale or representation, or where objects from distinct scales can be put together.
Environmental research, which relies heavily on geographic data, is a prime exampleof multi-focus work in which experts from multiple domains must collaborate at distinctspatial and temporal scales. Besides demanding tools to handle knowledge discoverytasks [2], geographic data deal with wide coverage area datasets, in multiple geographicscales and composed by many geographic logical entities that interpret the same data indi�erent ways. Typically, experts need to build �what-if� scenarios, in which a wide varietyof factors interact through many kinds of relationships. Though many data managementmechanisms have been proposed to deal with such requirements, appropriate handling ofperspectives and relationships is still an open problem.
Our research is motivated by this scenario, for environmental research concerned withwater resources. This provides a data-rich, problem-rich scenario, in which distinct groupsneed to investigate problems such as pollution, health or erosion, to name but a few ex-amples of projects that are based on the same set of (water) data, which is analyzed andcombined with other speci�c data sources. These applications have a few requirements in
40
Chapter 4. A Framework to Handle Multiple Perspectives in Graph Databases 41
common. First, they need to provide �multiple perspectives� of the water resource net-work, for any given project, or even across projects, so that experts can perform distinctanalyses. Second, despite the additional semantics provided by geospatial information,a large number of such analyses rely on the underlying network structure, which is sub-sequently used to create new (logical) geographic entities. Third, water resources arenaturally structured and represented through a drainage network, which can be naturallymodelled using graphs, thereby supporting many kinds of analyses via graph algorithms� e.g, to �nd out connectivity between rivers (and thus identify a focus of pollutant �ow).
Given these characteristics, we have designed and partially implemented a computingframework that allows environmental applications that involve water resource manage-ment to build multiple perspectives, and correlate these perspectives and resources usinggraphs as the main underlying representation. This framework, called Graph - Kaleido-scope 1, allows users to build multiple perspectives over graph databases. Perspectives arede�ned through an adaptation of the concept of views in relational databases � i.e., eachperspective is handled as a view in the graph database. As such, Graph-Kaleidoscopeextends the concept of view from relational databases to graph databases � for which, sofar, little has been done in terms of views (either as a needed feature, or de�nition).
While graph systems are being increasingly adopted in cases where relationships amongdata elements are �rst-class citizens, graph database systems are at the same overall levelof maturity as object-oriented database systems were in the early to mid-90's. To thate�ect, we explicitly paraphrased two sentences of the classical �Object-Oriented Mani-festo� [8], concerning the state of the art of OO databases in 1989, when that paper �rstappeared, and which we repeat here.�Three points characterize the �eld at this stage: (i)
the lack of a common data model, (ii) the lack of formal foundations and (iii) strong
experimental activity. Whereas Codd's original paper [25] gave a clear speci�cation of a
relational database system (data model and query language), no such speci�cation exists
for object-oriented database systems� (Manifesto page 2). If we now replace the term�object-oriented� by �graph�, the entire sentence holds.
The �rst challenge addressed by our research was to formalize the operators for graphdata that underpins our framework. As a result, we de�ne PGDM � a property graph datamodel � together with its operators. Though geared towards environmental applications,Graph-Kaleidoscope has been speci�ed in a generic way, so that it can be extended andadopted by other kinds of application domains with similar analysis requirements. Oursecond contribution lies in the de�nition of the framework itself, based on the use ofPGDM, and for which we have developed a �rst prototype, also described in this paper.
The rest of this paper is organized as follows. Section 4.2 contains a brief description ofour motivation scenario. Theoretical foundations are described in section 4.3. Sections 4.4and 4.5 respectively present the speci�cation of Graph-Kaleidoscope � our property graphdata model (PGDM) and the framework architecture. A real case study for analysis ofenvironmental water resource data is presented in section 4.6. Related work is describedin section 4.7 and section 4.8 commenting on research challenges and lessons learned.Finally, section 4.9 concludes the paper, presenting ongoing work.
1Thus named because a Kaleidoscope allows to merge parts of an underlying structure to provide adistinct perspective of the parts.
Chapter 4. A Framework to Handle Multiple Perspectives in Graph Databases 42
4.2 Motivation Scenario - Brazilian Water Resources
Database
Reliable information about volume and quality in water resources is extremely importantfor management and proper planning of their use. To this end, the Brazilian FederalGovernment created in 2000 the National Water Agency (ANA), legally responsible foraccomplishing this goal and ensuring the sustainable use of fresh water. With droughtsbrought about by global warming, this has become even more critical � even though Brazilis considered to be the country with the largest supply of fresh water resources.
To organize the required data and support management tasks, ANA constructed arelational database to support the e�ective management of Brazilian water resources,representing the hydrography as a drainage network, i.e., a set of drainage points andstretches. The Brazilian drainage network is currently composed by 620.280 drainagepoints and 620.279 drainage stretches. Drainage points represent diverse geographic en-tities, such as a watercourse start/end point or a stream mouth point. The drainagestretches represent the connection between two drainage points.
This relational database, called pgHydro2, encompasses tables, constraints, views anda set of stored procedures to ensure data consistency and to process routine calculations.An excerpt of the conceptual model of pgHydro is illustrated in Figure 4.1, extracted from3. Attributes were omitted for legibility. The database is public domain and availablevia ANA o�cial website 4. Figure 4.2 shows part of the current drainage stretches.It comprises three di�erent cartographic scales: 1:1.000.000 (available for the majorityof Brazilian watersheds), 1:250.000 (river Paraiba do Sul) and 1:50.000 (basin of riversPiracicaba, Capivari and Jundiai).
While the core storage element is the stretch, the o�cial territorial unit for the manage-ment of water resources adopted by ANA is a watershed. A watershed delimits a drainagesystem channel and comprises a set of drainage stretches and points. The drainage net-work can be repeatedly split, giving rise to watershed and sub-watersheds. Anotherelement in this database is rivers � connected drainage stretches that have the samewaterbody name.
Rivers and watersheds are only examples of the many useful elements that need to bederived from pgHydro and which are not supported by the database. These elements arecalculated based on drainage network attributes. Network data is constantly updated, e.g.,re�ecting natural or anthropogenic interventions. This further complicates data analysis,given the mismatch between analysis requirements and the underling data model.
Many routine calculations adopted by ANA to retrieve information (e.g. watersheds,drainage network) depend on �reachability�. Such calculations repeatedly check if two el-ements are connected and how. However, since the data is stored in a relational database,such calculations are computationally costly, performed using several recursive join op-erators. These queries are extremely complex, unreadable, and with a high maintenance
2pghydro.org3http://pghydro.org/downloads4Available in: metadados.ana.gov.br/geonetwork/srv/pt/ main.home?uuid=7bb15389-1016-4d5b-
9480-5f1acdadd0f5
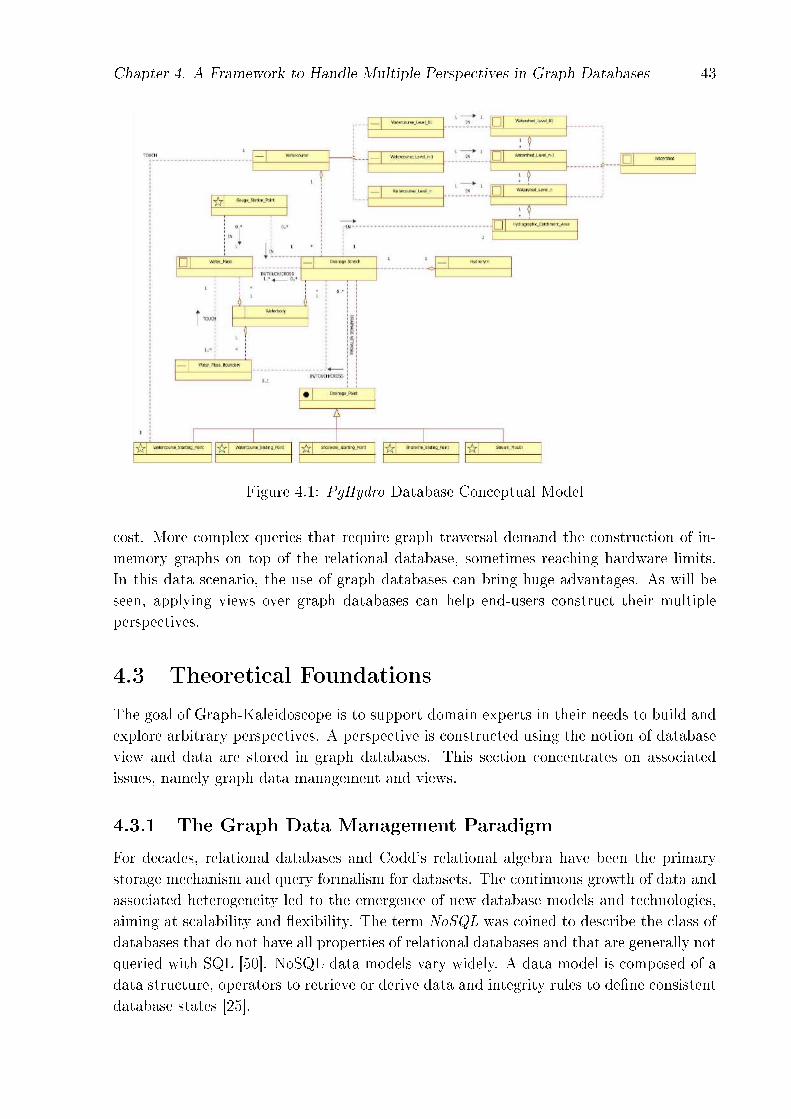
Chapter 4. A Framework to Handle Multiple Perspectives in Graph Databases 43
Figure 4.1: PgHydro Database Conceptual Model
cost. More complex queries that require graph traversal demand the construction of in-memory graphs on top of the relational database, sometimes reaching hardware limits.In this data scenario, the use of graph databases can bring huge advantages. As will beseen, applying views over graph databases can help end-users construct their multipleperspectives.
4.3 Theoretical Foundations
The goal of Graph-Kaleidoscope is to support domain experts in their needs to build andexplore arbitrary perspectives. A perspective is constructed using the notion of databaseview and data are stored in graph databases. This section concentrates on associatedissues, namely graph data management and views.
4.3.1 The Graph Data Management Paradigm
For decades, relational databases and Codd's relational algebra have been the primarystorage mechanism and query formalism for datasets. The continuous growth of data andassociated heterogeneity led to the emergence of new database models and technologies,aiming at scalability and �exibility. The term NoSQL was coined to describe the class ofdatabases that do not have all properties of relational databases and that are generally notqueried with SQL [50]. NoSQL data models vary widely. A data model is composed of adata structure, operators to retrieve or derive data and integrity rules to de�ne consistentdatabase states [25].
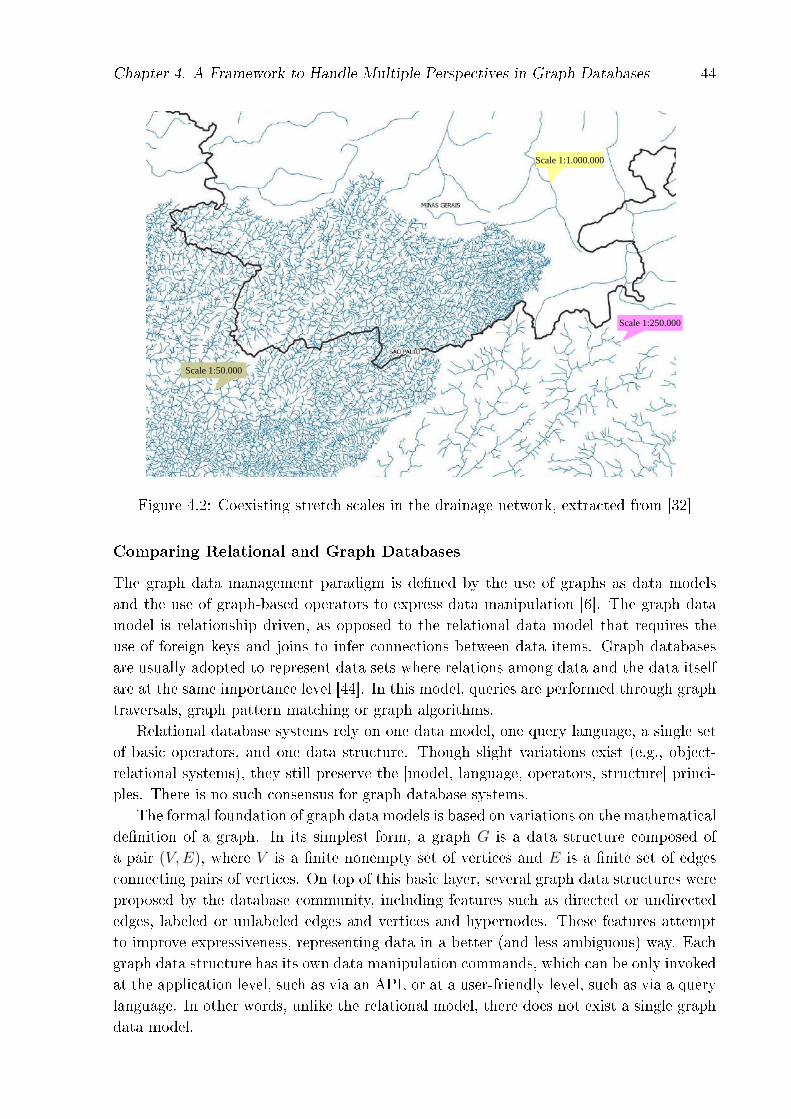
Chapter 4. A Framework to Handle Multiple Perspectives in Graph Databases 44
Figure 4.2: Coexisting stretch scales in the drainage network, extracted from [32]
Comparing Relational and Graph Databases
The graph data management paradigm is de�ned by the use of graphs as data modelsand the use of graph-based operators to express data manipulation [6]. The graph datamodel is relationship driven, as opposed to the relational data model that requires theuse of foreign keys and joins to infer connections between data items. Graph databasesare usually adopted to represent data sets where relations among data and the data itselfare at the same importance level [44]. In this model, queries are performed through graphtraversals, graph pattern matching or graph algorithms.
Relational database systems rely on one data model, one query language, a single setof basic operators, and one data structure. Though slight variations exist (e.g., object-relational systems), they still preserve the [model, language, operators, structure] princi-ples. There is no such consensus for graph database systems.
The formal foundation of graph data models is based on variations on the mathematicalde�nition of a graph. In its simplest form, a graph G is a data structure composed ofa pair (V,E), where V is a �nite nonempty set of vertices and E is a �nite set of edgesconnecting pairs of vertices. On top of this basic layer, several graph data structures wereproposed by the database community, including features such as directed or undirectededges, labeled or unlabeled edges and vertices and hypernodes. These features attemptto improve expressiveness, representing data in a better (and less ambiguous) way. Eachgraph data structure has its own data manipulation commands, which can be only invokedat the application level, such as via an API, or at a user-friendly level, such as via a querylanguage. In other words, unlike the relational model, there does not exist a single graphdata model.
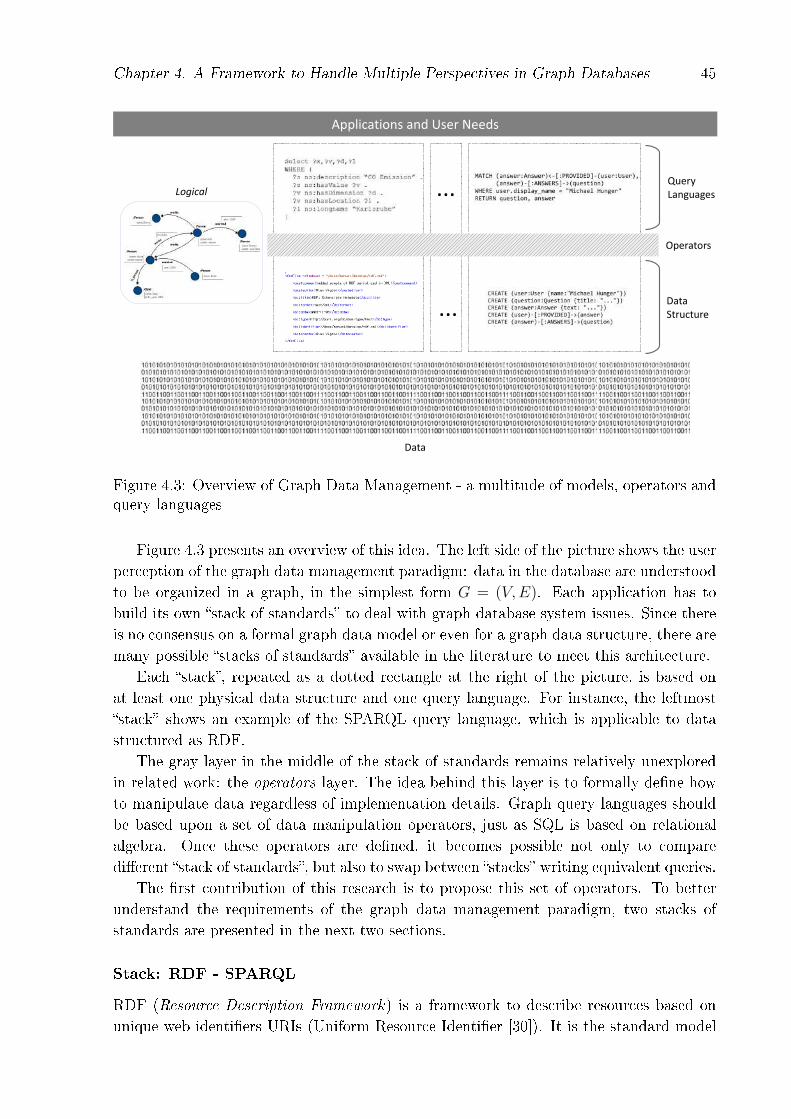
Chapter 4. A Framework to Handle Multiple Perspectives in Graph Databases 45
Figure 4.3: Overview of Graph Data Management - a multitude of models, operators andquery languages
Figure 4.3 presents an overview of this idea. The left side of the picture shows the userperception of the graph data management paradigm: data in the database are understoodto be organized in a graph, in the simplest form G = (V,E). Each application has tobuild its own �stack of standards� to deal with graph database system issues. Since thereis no consensus on a formal graph data model or even for a graph data structure, there aremany possible �stacks of standards� available in the literature to meet this architecture.
Each �stack�, repeated as a dotted rectangle at the right of the picture, is based onat least one physical data structure and one query language. For instance, the leftmost�stack� shows an example of the SPARQL query language, which is applicable to datastructured as RDF.
The gray layer in the middle of the stack of standards remains relatively unexploredin related work: the operators layer. The idea behind this layer is to formally de�ne howto manipulate data regardless of implementation details. Graph query languages shouldbe based upon a set of data manipulation operators, just as SQL is based on relationalalgebra. Once these operators are de�ned, it becomes possible not only to comparedi�erent �stack of standards�, but also to swap between �stacks� writing equivalent queries.
The �rst contribution of this research is to propose this set of operators. To betterunderstand the requirements of the graph data management paradigm, two stacks ofstandards are presented in the next two sections.
Stack: RDF - SPARQL
RDF (Resource Description Framework) is a framework to describe resources based onunique web identi�ers URIs (Uniform Resource Identi�er [30]). It is the standard model
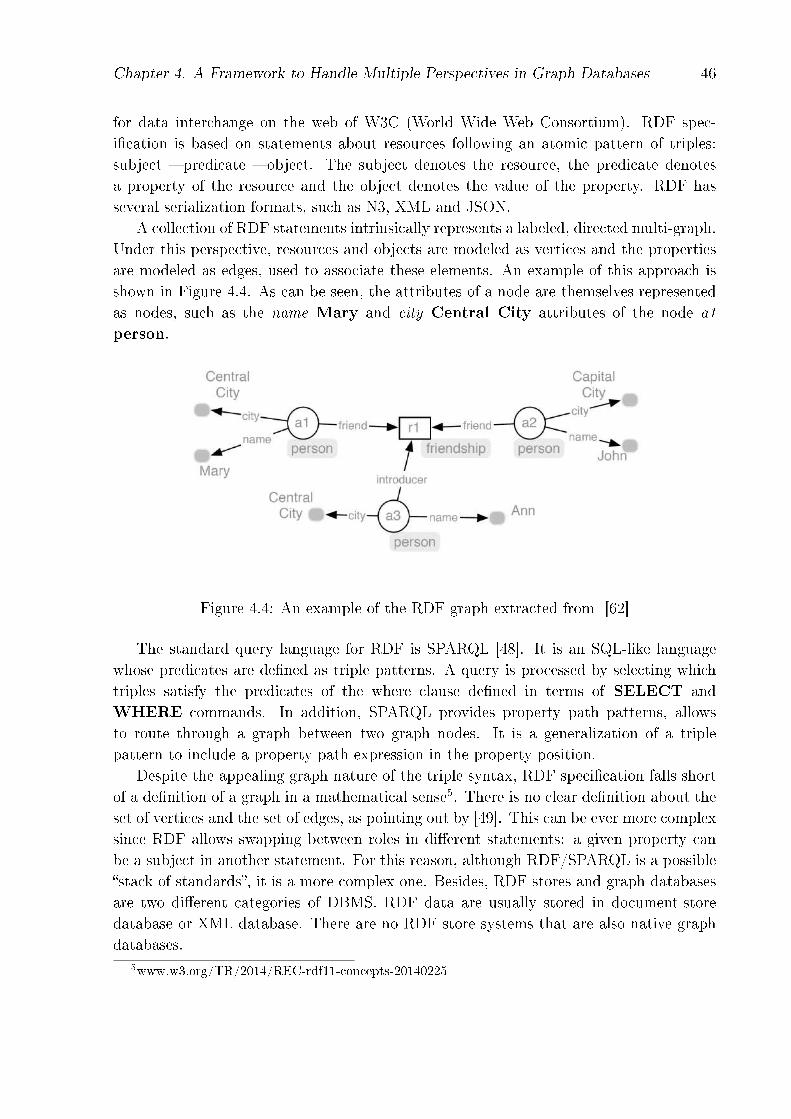
Chapter 4. A Framework to Handle Multiple Perspectives in Graph Databases 46
for data interchange on the web of W3C (World Wide Web Consortium). RDF spec-i�cation is based on statements about resources following an atomic pattern of triples:subject � predicate � object. The subject denotes the resource, the predicate denotesa property of the resource and the object denotes the value of the property. RDF hasseveral serialization formats, such as N3, XML and JSON.
A collection of RDF statements intrinsically represents a labeled, directed multi-graph.Under this perspective, resources and objects are modeled as vertices and the propertiesare modeled as edges, used to associate these elements. An example of this approach isshown in Figure 4.4. As can be seen, the attributes of a node are themselves representedas nodes, such as the name Mary and city Central City attributes of the node a1
person.
Figure 4.4: An example of the RDF graph extracted from [62]
The standard query language for RDF is SPARQL [48]. It is an SQL-like languagewhose predicates are de�ned as triple patterns. A query is processed by selecting whichtriples satisfy the predicates of the where clause de�ned in terms of SELECT andWHERE commands. In addition, SPARQL provides property path patterns, allowsto route through a graph between two graph nodes. It is a generalization of a triplepattern to include a property path expression in the property position.
Despite the appealing graph nature of the triple syntax, RDF speci�cation falls shortof a de�nition of a graph in a mathematical sense5. There is no clear de�nition about theset of vertices and the set of edges, as pointing out by [49]. This can be ever more complexsince RDF allows swapping between roles in di�erent statements: a given property canbe a subject in another statement. For this reason, although RDF/SPARQL is a possible�stack of standards�, it is a more complex one. Besides, RDF stores and graph databasesare two di�erent categories of DBMS. RDF data are usually stored in document-storedatabase or XML database. There are no RDF store systems that are also native graphdatabases.
5www.w3.org/TR/2014/REC-rdf11-concepts-20140225
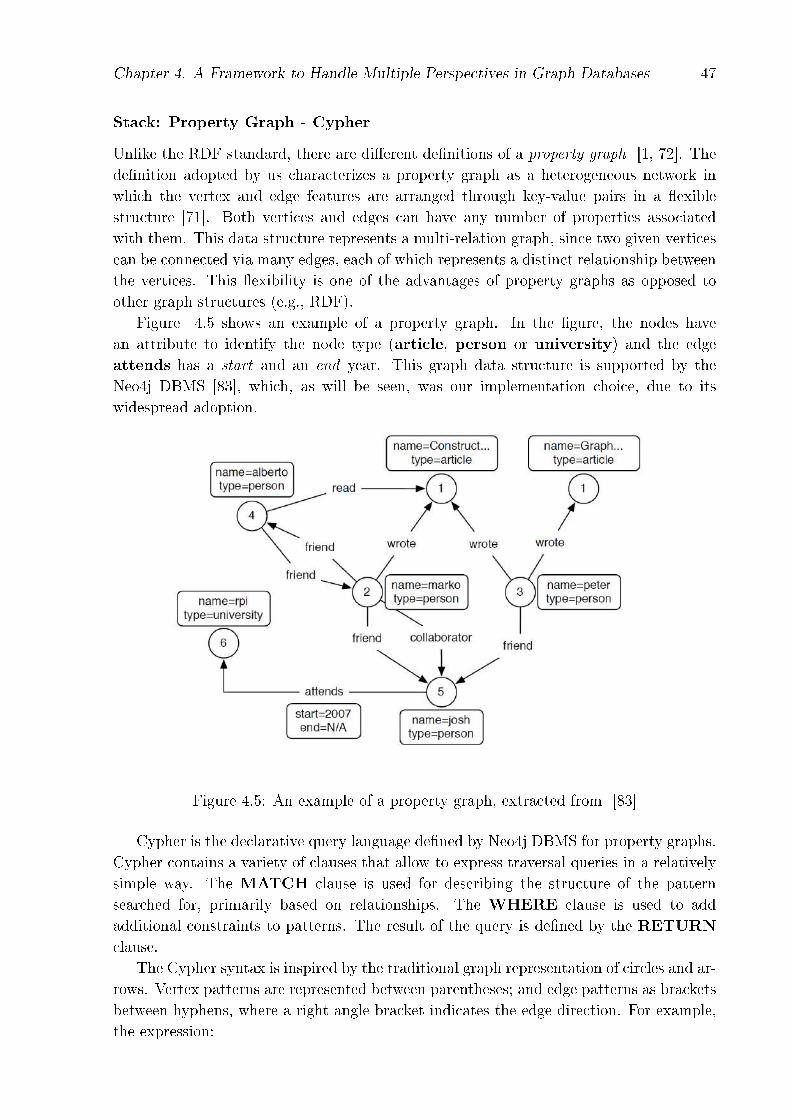
Chapter 4. A Framework to Handle Multiple Perspectives in Graph Databases 47
Stack: Property Graph - Cypher
Unlike the RDF standard, there are di�erent de�nitions of a property graph [1, 72]. Thede�nition adopted by us characterizes a property graph as a heterogeneous network inwhich the vertex and edge features are arranged through key-value pairs in a �exiblestructure [71]. Both vertices and edges can have any number of properties associatedwith them. This data structure represents a multi-relation graph, since two given verticescan be connected via many edges, each of which represents a distinct relationship betweenthe vertices. This �exibility is one of the advantages of property graphs as opposed toother graph structures (e.g., RDF).
Figure 4.5 shows an example of a property graph. In the �gure, the nodes havean attribute to identify the node type (article, person or university) and the edgeattends has a start and an end year. This graph data structure is supported by theNeo4j DBMS [83], which, as will be seen, was our implementation choice, due to itswidespread adoption.
Figure 4.5: An example of a property graph, extracted from [83]
Cypher is the declarative query language de�ned by Neo4j DBMS for property graphs.Cypher contains a variety of clauses that allow to express traversal queries in a relativelysimple way. The MATCH clause is used for describing the structure of the patternsearched for, primarily based on relationships. The WHERE clause is used to addadditional constraints to patterns. The result of the query is de�ned by the RETURNclause.
The Cypher syntax is inspired by the traditional graph representation of circles and ar-rows. Vertex patterns are represented between parentheses; and edge patterns as bracketsbetween hyphens, where a right angle bracket indicates the edge direction. For example,the expression:
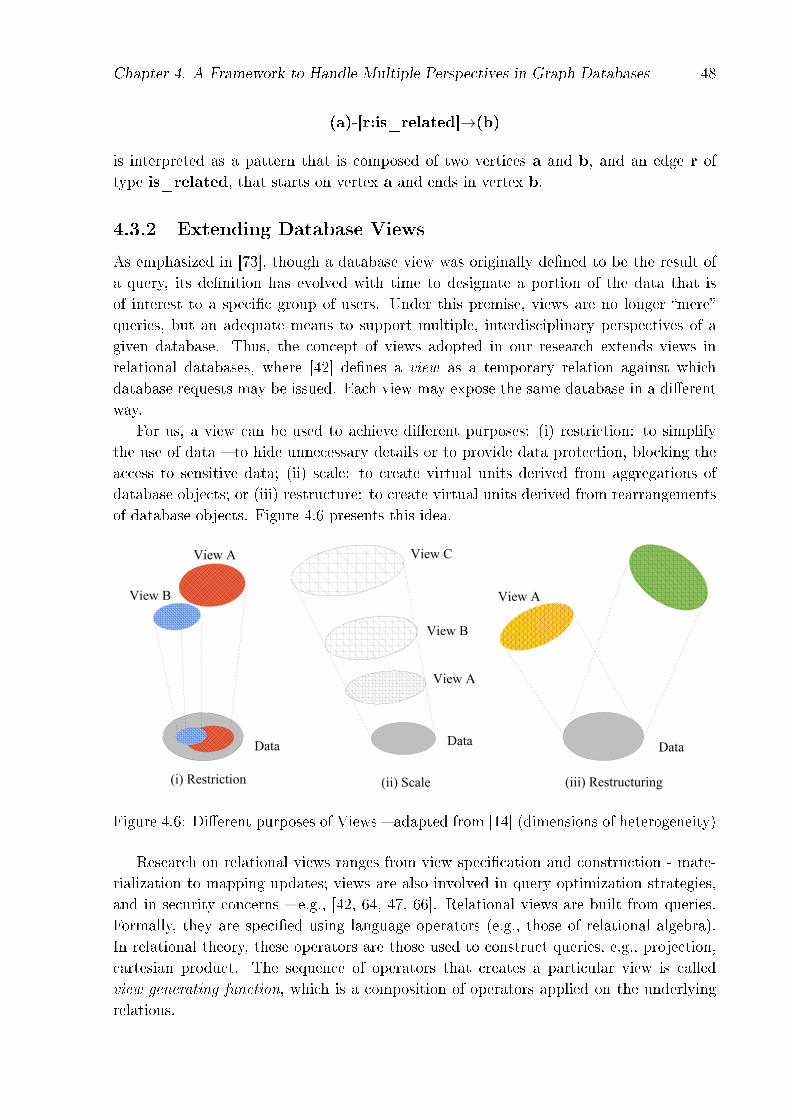
Chapter 4. A Framework to Handle Multiple Perspectives in Graph Databases 48
(a)-[r:is_related]→(b)
is interpreted as a pattern that is composed of two vertices a and b, and an edge r oftype is_related, that starts on vertex a and ends in vertex b.
4.3.2 Extending Database Views
As emphasized in [73], though a database view was originally de�ned to be the result ofa query, its de�nition has evolved with time to designate a portion of the data that isof interest to a speci�c group of users. Under this premise, views are no longer �mere�queries, but an adequate means to support multiple, interdisciplinary perspectives of agiven database. Thus, the concept of views adopted in our research extends views inrelational databases, where [42] de�nes a view as a temporary relation against whichdatabase requests may be issued. Each view may expose the same database in a di�erentway.
For us, a view can be used to achieve di�erent purposes: (i) restriction: to simplifythe use of data � to hide unnecessary details or to provide data protection, blocking theaccess to sensitive data; (ii) scale: to create virtual units derived from aggregations ofdatabase objects; or (iii) restructure: to create virtual units derived from rearrangementsof database objects. Figure 4.6 presents this idea.
Figure 4.6: Di�erent purposes of Views � adapted from [14] (dimensions of heterogeneity)
Research on relational views ranges from view speci�cation and construction - mate-rialization to mapping updates; views are also involved in query optimization strategies,and in security concerns � e.g., [42, 64, 47, 66]. Relational views are built from queries.Formally, they are speci�ed using language operators (e.g., those of relational algebra).In relational theory, these operators are those used to construct queries, e.g., projection,cartesian product. The sequence of operators that creates a particular view is calledview generating function, which is a composition of operators applied on the underlyingrelations.
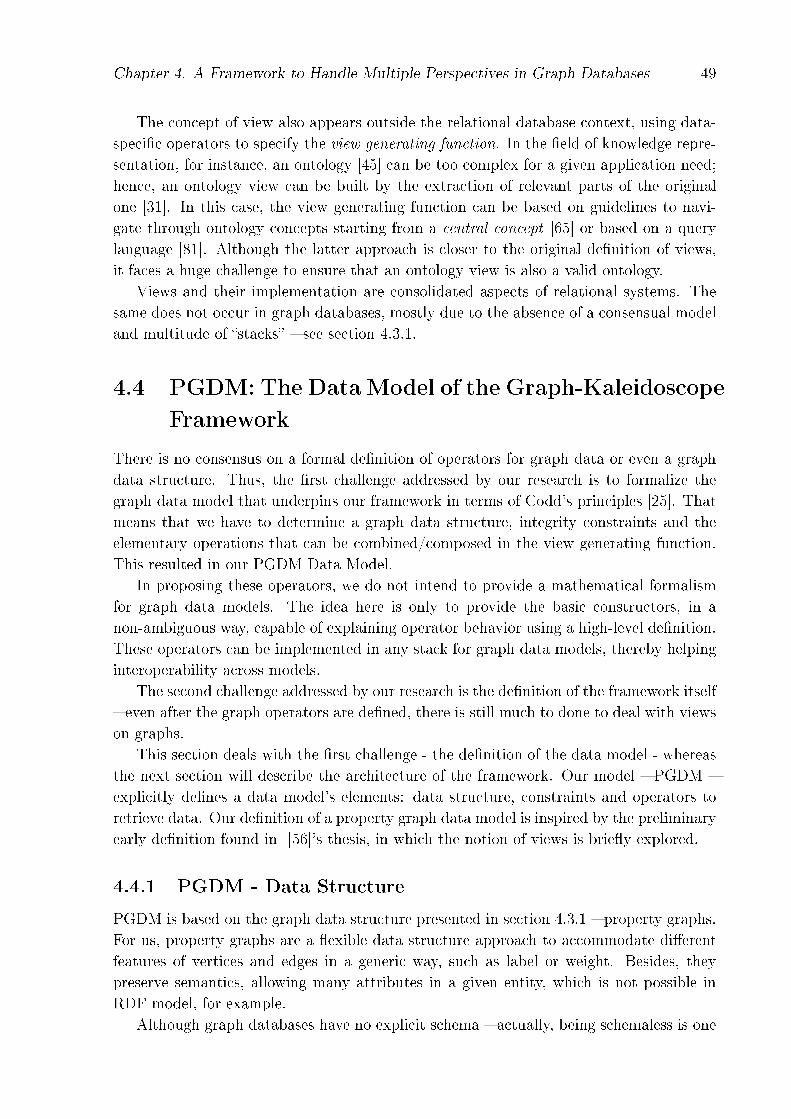
Chapter 4. A Framework to Handle Multiple Perspectives in Graph Databases 49
The concept of view also appears outside the relational database context, using data-speci�c operators to specify the view generating function. In the �eld of knowledge repre-sentation, for instance, an ontology [45] can be too complex for a given application need;hence, an ontology view can be built by the extraction of relevant parts of the originalone [31]. In this case, the view generating function can be based on guidelines to navi-gate through ontology concepts starting from a central concept [65] or based on a querylanguage [81]. Although the latter approach is closer to the original de�nition of views,it faces a huge challenge to ensure that an ontology view is also a valid ontology.
Views and their implementation are consolidated aspects of relational systems. Thesame does not occur in graph databases, mostly due to the absence of a consensual modeland multitude of �stacks� � see section 4.3.1.
4.4 PGDM: The Data Model of the Graph-Kaleidoscope
Framework
There is no consensus on a formal de�nition of operators for graph data or even a graphdata structure. Thus, the �rst challenge addressed by our research is to formalize thegraph data model that underpins our framework in terms of Codd's principles [25]. Thatmeans that we have to determine a graph data structure, integrity constraints and theelementary operations that can be combined/composed in the view generating function.This resulted in our PGDM Data Model.
In proposing these operators, we do not intend to provide a mathematical formalismfor graph data models. The idea here is only to provide the basic constructors, in anon-ambiguous way, capable of explaining operator behavior using a high-level de�nition.These operators can be implemented in any stack for graph data models, thereby helpinginteroperability across models.
The second challenge addressed by our research is the de�nition of the framework itself� even after the graph operators are de�ned, there is still much to done to deal with viewson graphs.
This section deals with the �rst challenge - the de�nition of the data model - whereasthe next section will describe the architecture of the framework. Our model � PGDM �explicitly de�nes a data model's elements: data structure, constraints and operators toretrieve data. Our de�nition of a property graph data model is inspired by the preliminaryearly de�nition found in [56]'s thesis, in which the notion of views is brie�y explored.
4.4.1 PGDM - Data Structure
PGDM is based on the graph data structure presented in section 4.3.1 � property graphs.For us, property graphs are a �exible data structure approach to accommodate di�erentfeatures of vertices and edges in a generic way, such as label or weight. Besides, theypreserve semantics, allowing many attributes in a given entity, which is not possible inRDF model, for example.
Although graph databases have no explicit schema � actually, being schemaless is one
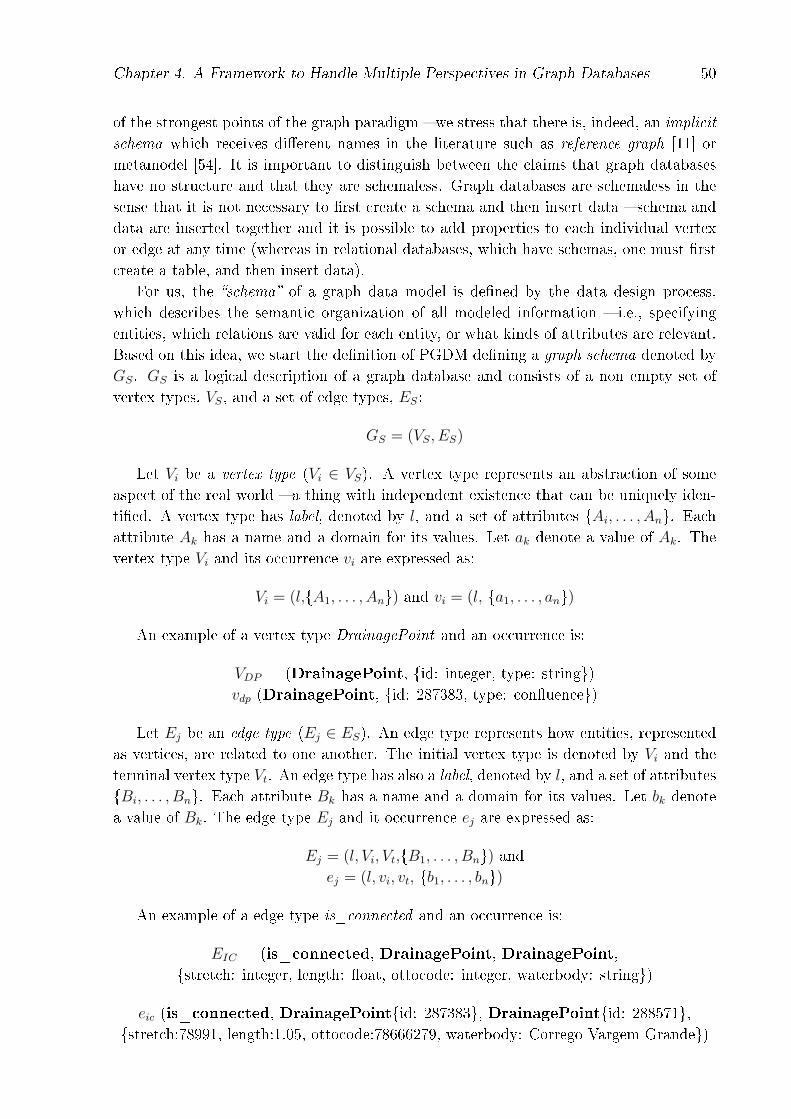
Chapter 4. A Framework to Handle Multiple Perspectives in Graph Databases 50
of the strongest points of the graph paradigm � we stress that there is, indeed, an implicit
schema which receives di�erent names in the literature such as reference graph [11] ormetamodel [54]. It is important to distinguish between the claims that graph databaseshave no structure and that they are schemaless. Graph databases are schemaless in thesense that it is not necessary to �rst create a schema and then insert data � schema anddata are inserted together and it is possible to add properties to each individual vertexor edge at any time (whereas in relational databases, which have schemas, one must �rstcreate a table, and then insert data).
For us, the �schema� of a graph data model is de�ned by the data design process,which describes the semantic organization of all modeled information � i.e., specifyingentities, which relations are valid for each entity, or what kinds of attributes are relevant.Based on this idea, we start the de�nition of PGDM de�ning a graph schema denoted byGS. GS is a logical description of a graph database and consists of a non empty set ofvertex types, VS, and a set of edge types, ES:
GS = (VS, ES)
Let Vi be a vertex type (Vi ∈ VS). A vertex type represents an abstraction of someaspect of the real world � a thing with independent existence that can be uniquely iden-ti�ed. A vertex type has label, denoted by l, and a set of attributes {Ai, . . . , An}. Eachattribute Ak has a name and a domain for its values. Let ak denote a value of Ak. Thevertex type Vi and its occurrence vi are expressed as:
Vi = (l,{A1, . . . , An}) and vi = (l, {a1, . . . , an})
An example of a vertex type DrainagePoint and an occurrence is:
VDP = (DrainagePoint, {id: integer, type: string})vdp (DrainagePoint, {id: 287383, type: con�uence})
Let Ej be an edge type (Ej ∈ ES). An edge type represents how entities, representedas vertices, are related to one another. The initial vertex type is denoted by Vi and theterminal vertex type Vt. An edge type has also a label, denoted by l, and a set of attributes{Bi, . . . , Bn}. Each attribute Bk has a name and a domain for its values. Let bk denotea value of Bk. The edge type Ej and it occurrence ej are expressed as:
Ej = (l, Vi, Vt,{B1, . . . , Bn}) andej = (l, vi, vt, {b1, . . . , bn})
An example of a edge type is_connected and an occurrence is:
EIC = (is_connected, DrainagePoint, DrainagePoint,{stretch: integer, length: �oat, ottocode: integer, waterbody: string})
eic (is_connected, DrainagePoint{id: 287383}, DrainagePoint{id: 288571},{stretch:78991, length:1.05, ottocode:78666279, waterbody: Corrego Vargem Grande})
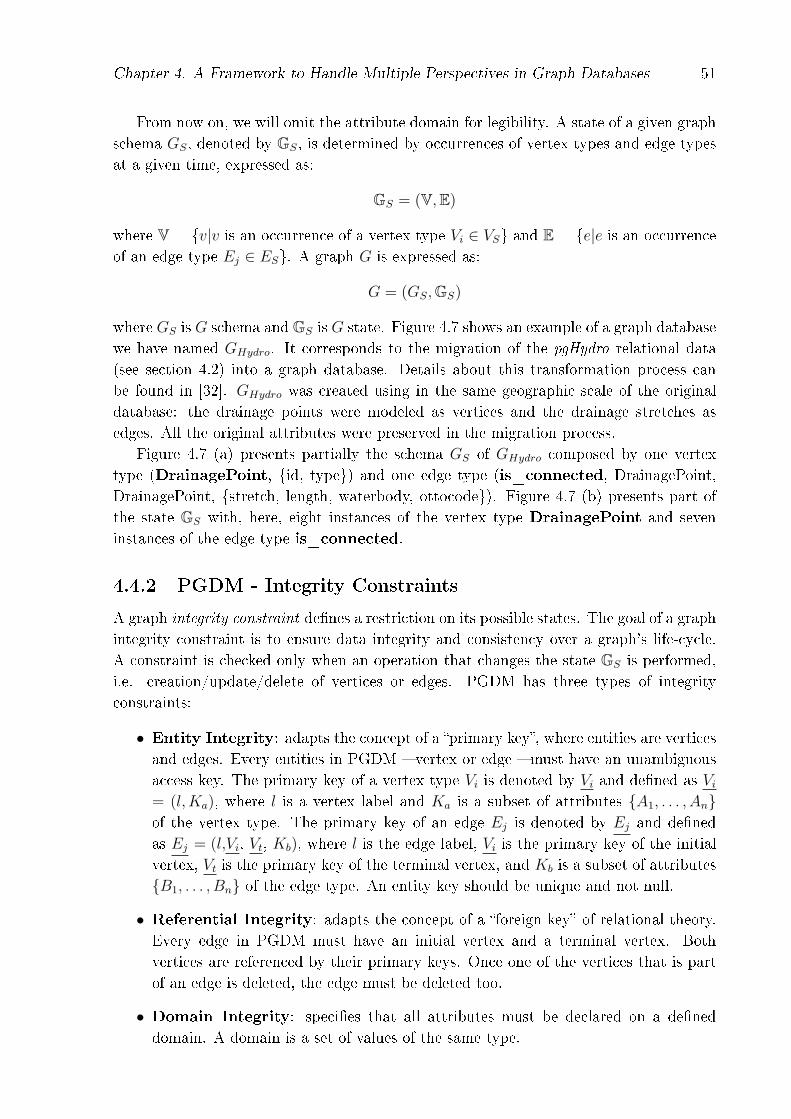
Chapter 4. A Framework to Handle Multiple Perspectives in Graph Databases 51
From now on, we will omit the attribute domain for legibility. A state of a given graphschema GS, denoted by GS, is determined by occurrences of vertex types and edge typesat a given time, expressed as:
GS = (V,E)
where V = {v|v is an occurrence of a vertex type Vi ∈ VS} and E = {e|e is an occurrenceof an edge type Ej ∈ ES}. A graph G is expressed as:
G = (GS,GS)
where GS is G schema and GS is G state. Figure 4.7 shows an example of a graph databasewe have named GHydro. It corresponds to the migration of the pgHydro relational data(see section 4.2) into a graph database. Details about this transformation process canbe found in [32]. GHydro was created using in the same geographic scale of the originaldatabase: the drainage points were modeled as vertices and the drainage stretches asedges. All the original attributes were preserved in the migration process.
Figure 4.7 (a) presents partially the schema GS of GHydro composed by one vertextype (DrainagePoint, {id, type}) and one edge type (is_connected, DrainagePoint,DrainagePoint, {stretch, length, waterbody, ottocode}). Figure 4.7 (b) presents part ofthe state GS with, here, eight instances of the vertex type DrainagePoint and seveninstances of the edge type is_connected.
4.4.2 PGDM - Integrity Constraints
A graph integrity constraint de�nes a restriction on its possible states. The goal of a graphintegrity constraint is to ensure data integrity and consistency over a graph's life-cycle.A constraint is checked only when an operation that changes the state GS is performed,i.e. creation/update/delete of vertices or edges. PGDM has three types of integrityconstraints:
• Entity Integrity: adapts the concept of a �primary key�, where entities are verticesand edges. Every entities in PGDM � vertex or edge � must have an unambiguousaccess key. The primary key of a vertex type Vi is denoted by Vi and de�ned as Vi= (l,Ka), where l is a vertex label and Ka is a subset of attributes {A1, . . . , An}of the vertex type. The primary key of an edge Ej is denoted by Ej and de�nedas Ej = (l,Vi, Vt, Kb), where l is the edge label, Vi is the primary key of the initialvertex, Vt is the primary key of the terminal vertex, and Kb is a subset of attributes{B1, . . . , Bn} of the edge type. An entity key should be unique and not null.
• Referential Integrity: adapts the concept of a �foreign key� of relational theory.Every edge in PGDM must have an initial vertex and a terminal vertex. Bothvertices are referenced by their primary keys. Once one of the vertices that is partof an edge is deleted, the edge must be deleted too.
• Domain Integrity: speci�es that all attributes must be declared on a de�neddomain. A domain is a set of values of the same type.
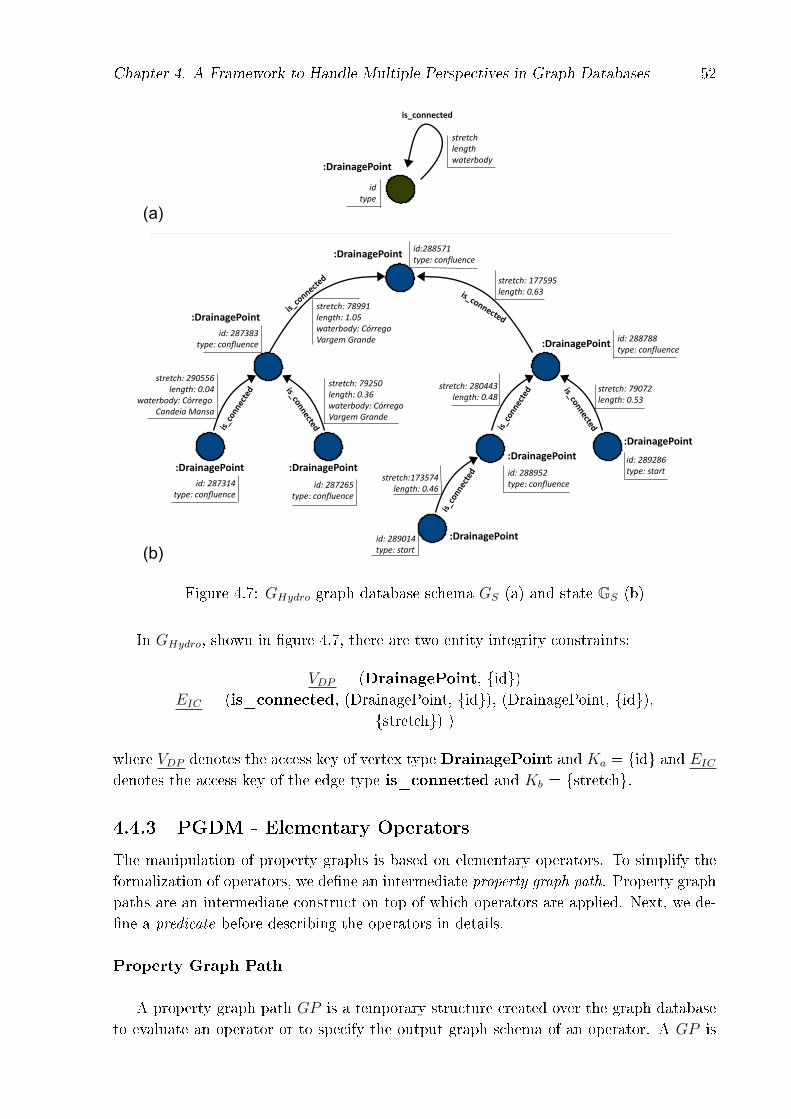
Chapter 4. A Framework to Handle Multiple Perspectives in Graph Databases 52
Figure 4.7: GHydro graph database schema GS (a) and state GS (b)
In GHydro, shown in �gure 4.7, there are two entity integrity constraints:
VDP = (DrainagePoint, {id})EIC = (is_connected, (DrainagePoint, {id}), (DrainagePoint, {id}),
{stretch}) )
where VDP denotes the access key of vertex type DrainagePoint and Ka = {id} and EIC
denotes the access key of the edge type is_connected and Kb = {stretch}.
4.4.3 PGDM - Elementary Operators
The manipulation of property graphs is based on elementary operators. To simplify theformalization of operators, we de�ne an intermediate property graph path. Property graphpaths are an intermediate construct on top of which operators are applied. Next, we de-�ne a predicate before describing the operators in details.
Property Graph Path
A property graph path GP is a temporary structure created over the graph databaseto evaluate an operator or to specify the output graph schema of an operator. A GP is
Chapter 4. A Framework to Handle Multiple Perspectives in Graph Databases 53
the representation of a linear path connecting vertices and the edges involved in theseconnections. The GP schema is composed by vertex and edge types of GS. Analogously,the graph schema of a GP is also composed by vertex and edge types of GS. In otherwords, a GP schema is indicating that a graph path cuts across a certain set of verticesand edges, de�ning the types of interest. A state of a GP , denoted by gp is determinedby occurrences of these elements in the graph data.
Two vertices can only be neighbours in a GP in one of two cases:
1. There is a connection between them (an edge). In this case, GP schema is a pathin GS, starting and ending in vertices, de�ned as: GP = (Vi, Eij, Vj, Ejk, . . . , Vn)where Vi, Vj, Vn are vertex types in VS and Eij, Ejk are edge types in ES. GP stateis the occurrences of this path in the graph GS. An example of a simple GP inFigure 4.7 is: {DrainagePoint, is_connected, DrainagePoint}.
2. They have the same vertex type. In this case, there is no path to consider and GPschema is de�ned as: GP = (Vi, Vi) where Vi is a vertex type in VS. GP state isthe cartesian product of all occurrences of this vertex type in GS. An example inFigure 4.7 is: {DrainagePoint, DrainagePoint}.
Predicate
Many of our elementary operators apply predicates to retrieve subsets of the originalgraph data. A predicate is a statement that may be TRUE or FALSE depending onthe values of its variables. In PGDM, a predicate is used to evaluate attributes of theoccurrences of vertex/edge types.
Predicate ϕ(x) is written as {x|ϕ(x)}, de�ned as collection of all the instances forwhich ϕ(x) is TRUE. A predicate can be atomic or composite. An atomic predicate isde�ned as:
x 〈op〉 literal or x 〈op〉 y
where 〈op〉 is a standard binary operator =, 6=, <,≤, > and ≥. Composite predicatescombine atoms by logical operators ∧ (and), ∨ (or) and ¬ (negation).
Table 4.1 presents an overview of the elementary operators of PGDM. As can be seen,PGDM has seven unary operators and three binary operators. These operators can beprogressively composed to create complex operators. Except for rename and conditionaltraversal operators, all operators require the creation of a property graph path GP tosupport predicate evaluation and de�ne the graph schema of the result. The table showsthe output of each operator in two ways: the output graph schema and the output graphoccurrences. The notation of the operators are:
〈 symbol 〉 (〈 parameters 〉) 〈 input 〉
Notation G.GP indicates a GP created on top of original graph G. To help under-standing and clarify the details of the operators, we illustrate them using our mappingGHydro of the Brazilian water network database.
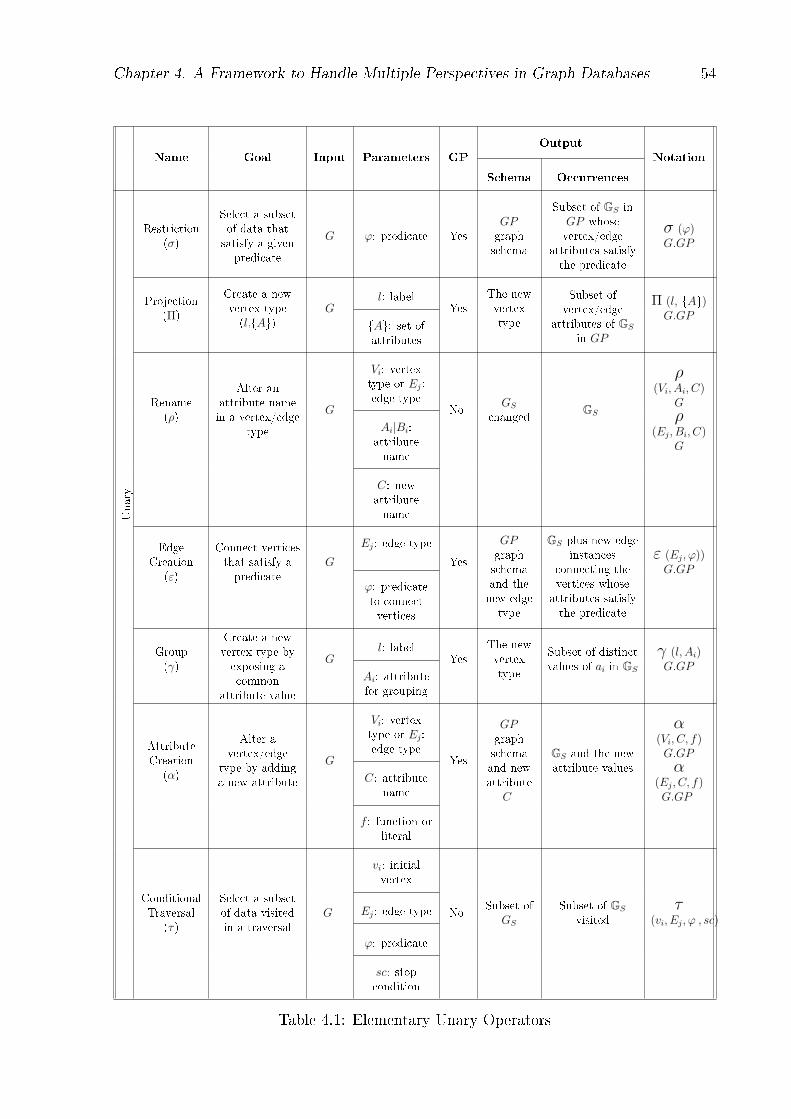
Chapter 4. A Framework to Handle Multiple Perspectives in Graph Databases 54
Name Goal Input Parameters GPOutput
Notation
Schema Occurrences
Unary
Restriction(σ)
Select a subsetof data thatsatisfy a given
predicate
G ϕ: predicate YesGPgraphschema
Subset of GS inGP whosevertex/edge
attributes satisfythe predicate
σ (ϕ)G.GP
Projection(Π)
Create a newvertex type(l,{A})
Gl: label
YesThe newvertextype
Subset ofvertex/edge
attributes of GS
in GP
Π (l, {A})G.GP
{A}: set ofattributes
Rename(ρ)
Alter anattribute namein a vertex/edge
type
G
Vi: vertextype or Ej:edge type
NoGS
changedGS
ρ(Vi, Ai, C)
Gρ
(Ej, Bi, C)G
Ai|Bi:attributename
C: newattributename
EdgeCreation
(ε)
Connect verticesthat satisfy apredicate
G
Ej: edge type
Yes
GPgraphschemaand thenew edgetype
GS plus new edgeinstances
connecting thevertices whose
attributes satisfythe predicate
ε (Ej, ϕ))G.GP
ϕ: predicateto connectvertices
Group(γ)
Create a newvertex type byexposing acommon
attribute value
Gl: label
YesThe newvertextype
Subset of distinctvalues of ai in GS
γ (l, Ai)G.GP
Ai: attributefor grouping
AttributeCreation
(α)
Alter avertex/edge
type by addinga new attribute
G
Vi: vertextype or Ej:edge type
Yes
GPgraphschemaand newattribute
C
GS and the newattribute values
α(Vi, C, f)G.GPα
(Ej, C, f)G.GP
C: attributename
f : function orliteral
ConditionalTraversal
(τ)
Select a subsetof data visitedin a traversal
G
vi: initialvertex
NoSubset of
GS
Subset of GS
visitedτ
(vi, Ej, ϕ , sc)Ej: edge type
ϕ: predicate
sc: stopcondition
Table 4.1: Elementary Unary Operators
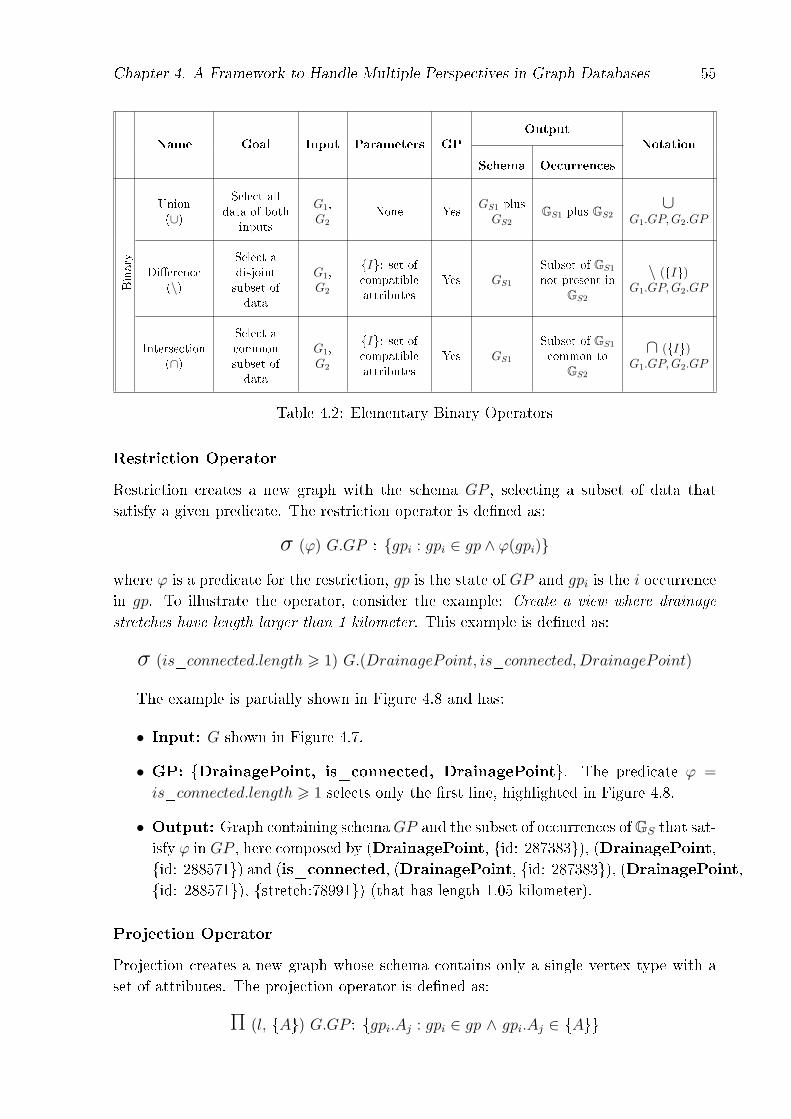
Chapter 4. A Framework to Handle Multiple Perspectives in Graph Databases 55
Name Goal Input Parameters GPOutput
Notation
Schema Occurrences
Binary
Union(∪)
Select alldata of both
inputs
G1,G2
None YesGS1 plusGS2
GS1 plus GS2∪
G1.GP,G2.GP
Di�erence(\)
Select adisjointsubset ofdata
G1,G2
{I}: set ofcompatibleattributes
Yes GS1
Subset of GS1
not present inGS2
\ ({I})G1.GP,G2.GP
Intersection(∩)
Select acommonsubset ofdata
G1,G2
{I}: set ofcompatibleattributes
Yes GS1
Subset of GS1
common toGS2
∩ ({I})G1.GP,G2.GP
Table 4.2: Elementary Binary Operators
Restriction Operator
Restriction creates a new graph with the schema GP , selecting a subset of data thatsatisfy a given predicate. The restriction operator is de�ned as:
σ (ϕ) G.GP : {gpi : gpi ∈ gp ∧ ϕ(gpi)}
where ϕ is a predicate for the restriction, gp is the state of GP and gpi is the i occurrencein gp. To illustrate the operator, consider the example: Create a view where drainage
stretches have length larger than 1 kilometer. This example is de�ned as:
σ (is_connected.length > 1) G.(DrainagePoint, is_connected,DrainagePoint)
The example is partially shown in Figure 4.8 and has:
• Input: G shown in Figure 4.7.
• GP: {DrainagePoint, is_connected, DrainagePoint}. The predicate ϕ =
is_connected.length > 1 selects only the �rst line, highlighted in Figure 4.8.
• Output: Graph containing schemaGP and the subset of occurrences ofGS that sat-isfy ϕ in GP , here composed by (DrainagePoint, {id: 287383}), (DrainagePoint,{id: 288571}) and (is_connected, (DrainagePoint, {id: 287383}), (DrainagePoint,{id: 288571}), {stretch:78991}) (that has length 1.05 kilometer).
Projection Operator
Projection creates a new graph whose schema contains only a single vertex type with aset of attributes. The projection operator is de�ned as:
Π (l, {A}) G.GP : {gpi.Aj : gpi ∈ gp ∧ gpi.Aj ∈ {A}}
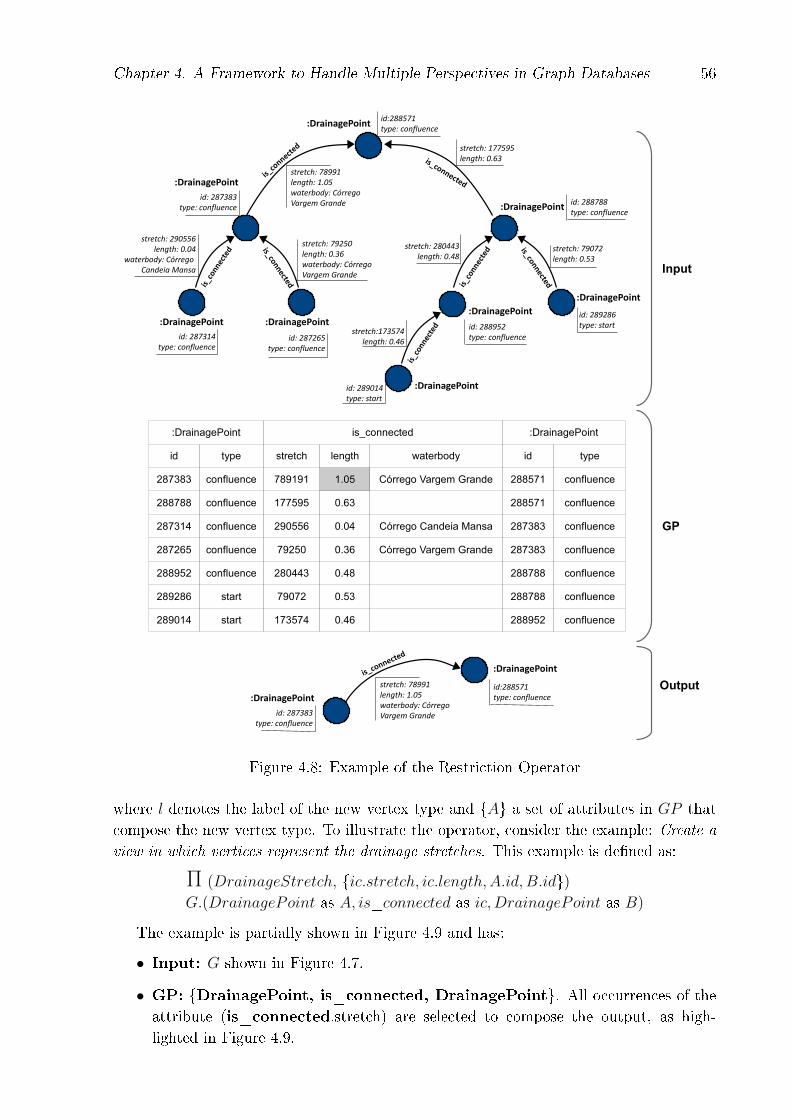
Chapter 4. A Framework to Handle Multiple Perspectives in Graph Databases 56
Figure 4.8: Example of the Restriction Operator
where l denotes the label of the new vertex type and {A} a set of attributes in GP thatcompose the new vertex type. To illustrate the operator, consider the example: Create aview in which vertices represent the drainage stretches. This example is de�ned as:
Π (DrainageStretch, {ic.stretch, ic.length,A.id, B.id})
G.(DrainagePoint as A, is_connected as ic,DrainagePoint as B)
The example is partially shown in Figure 4.9 and has:
• Input: G shown in Figure 4.7.
• GP: {DrainagePoint, is_connected, DrainagePoint}. All occurrences of theattribute (is_connected.stretch) are selected to compose the output, as high-lighted in Figure 4.9.
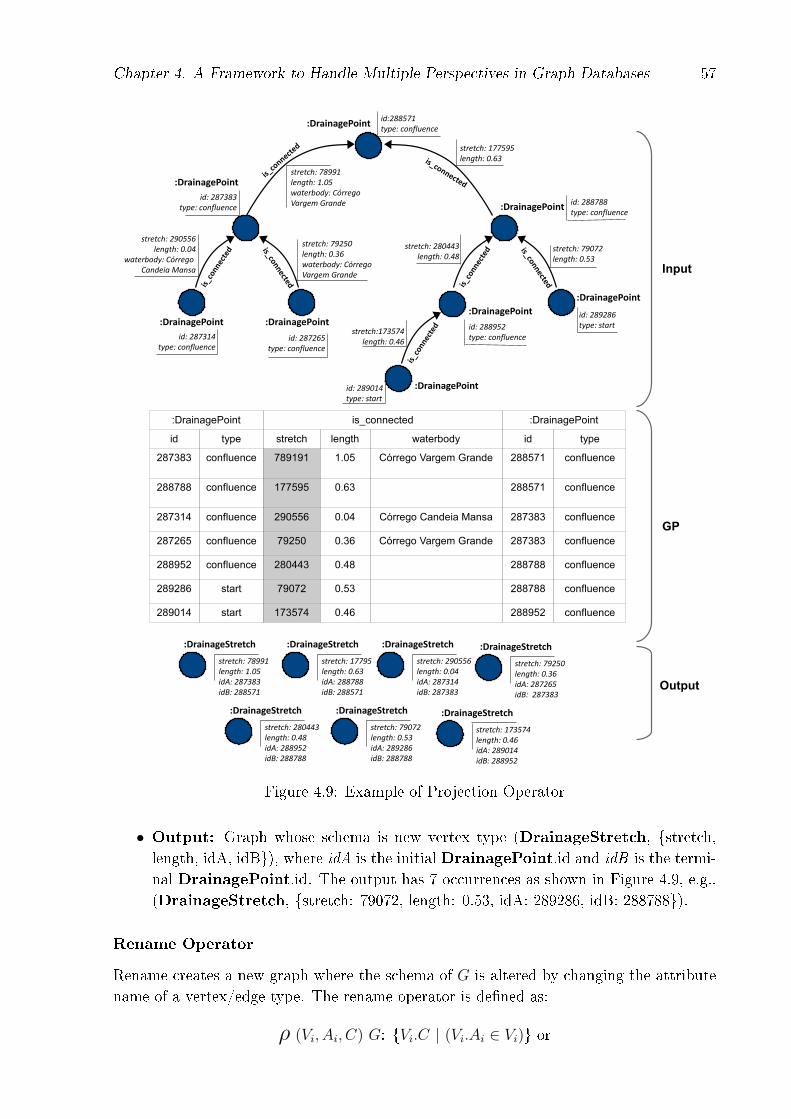
Chapter 4. A Framework to Handle Multiple Perspectives in Graph Databases 57
Figure 4.9: Example of Projection Operator
• Output: Graph whose schema is new vertex type (DrainageStretch, {stretch,length, idA, idB}), where idA is the initial DrainagePoint.id and idB is the termi-nal DrainagePoint.id. The output has 7 occurrences as shown in Figure 4.9, e.g.,(DrainageStretch, {stretch: 79072, length: 0.53, idA: 289286, idB: 288788}).
Rename Operator
Rename creates a new graph where the schema of G is altered by changing the attributename of a vertex/edge type. The rename operator is de�ned as:
ρ (Vi, Ai, C) G: {Vi.C | (Vi.Ai ∈ Vi)} or
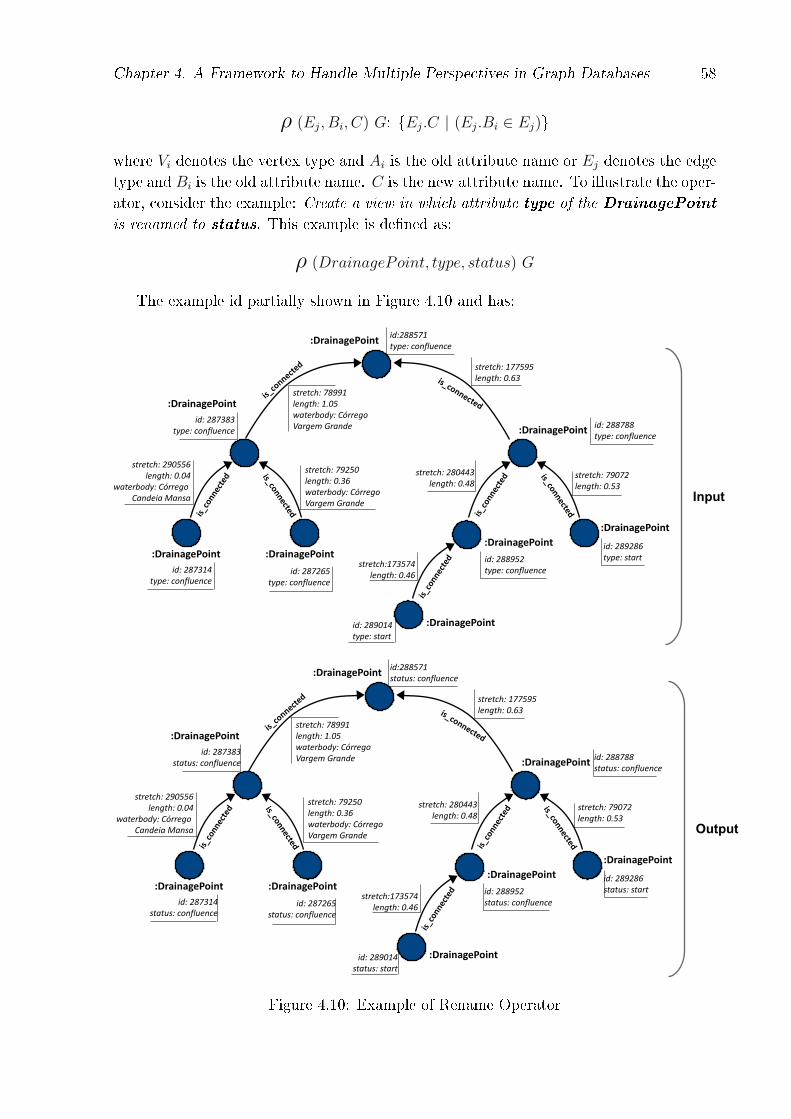
Chapter 4. A Framework to Handle Multiple Perspectives in Graph Databases 58
ρ (Ej, Bi, C) G: {Ej.C | (Ej.Bi ∈ Ej)}
where Vi denotes the vertex type and Ai is the old attribute name or Ej denotes the edgetype and Bi is the old attribute name. C is the new attribute name. To illustrate the oper-ator, consider the example: Create a view in which attribute type of the DrainagePoint
is renamed to status. This example is de�ned as:
ρ (DrainagePoint, type, status) G
The example id partially shown in Figure 4.10 and has:
Figure 4.10: Example of Rename Operator
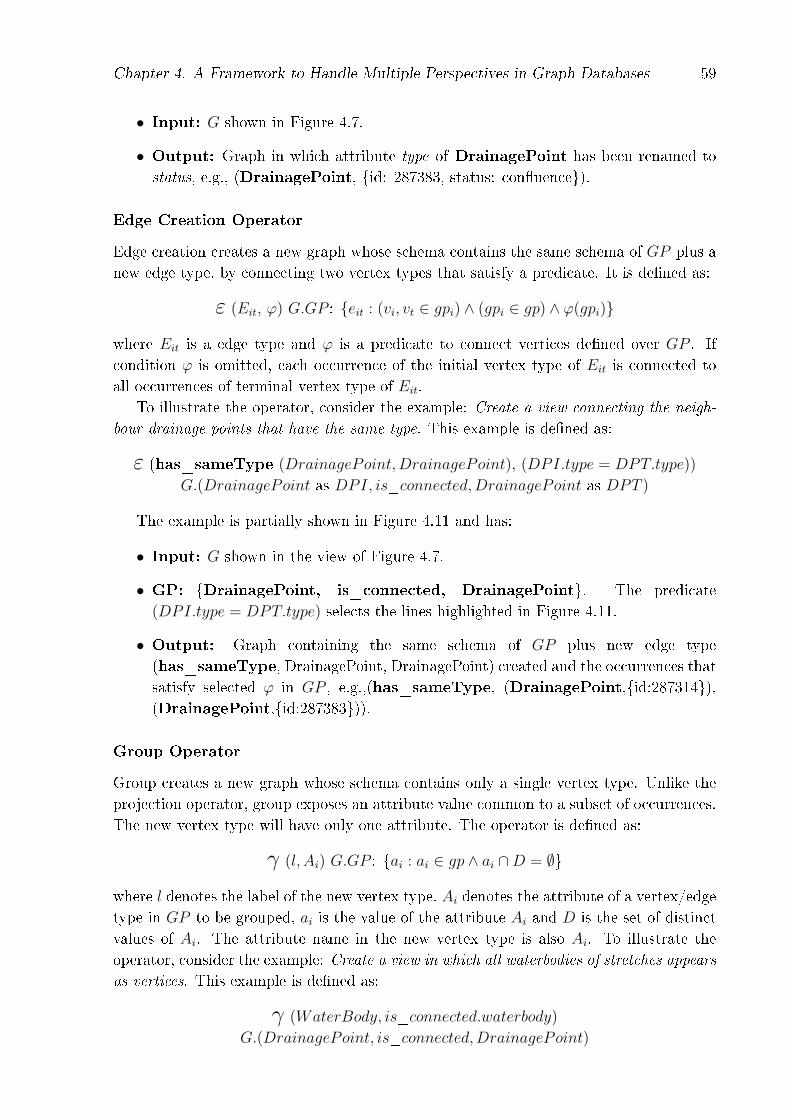
Chapter 4. A Framework to Handle Multiple Perspectives in Graph Databases 59
• Input: G shown in Figure 4.7.
• Output: Graph in which attribute type of DrainagePoint has been renamed tostatus, e.g., (DrainagePoint, {id: 287383, status: con�uence}).
Edge Creation Operator
Edge creation creates a new graph whose schema contains the same schema of GP plus anew edge type, by connecting two vertex types that satisfy a predicate. It is de�ned as:
ε (Eit, ϕ) G.GP : {eit : (vi, vt ∈ gpi) ∧ (gpi ∈ gp) ∧ ϕ(gpi)}
where Eit is a edge type and ϕ is a predicate to connect vertices de�ned over GP . Ifcondition ϕ is omitted, each occurrence of the initial vertex type of Eit is connected toall occurrences of terminal vertex type of Eit.
To illustrate the operator, consider the example: Create a view connecting the neigh-
bour drainage points that have the same type. This example is de�ned as:
ε (has_sameType (DrainagePoint,DrainagePoint), (DPI.type = DPT.type))
G.(DrainagePoint as DPI, is_connected,DrainagePoint as DPT )
The example is partially shown in Figure 4.11 and has:
• Input: G shown in the view of Figure 4.7.
• GP: {DrainagePoint, is_connected, DrainagePoint}. The predicate(DPI.type = DPT.type) selects the lines highlighted in Figure 4.11.
• Output: Graph containing the same schema of GP plus new edge type(has_sameType, DrainagePoint, DrainagePoint) created and the occurrences thatsatisfy selected ϕ in GP , e.g.,(has_sameType, (DrainagePoint,{id:287314}),(DrainagePoint,{id:287383})).
Group Operator
Group creates a new graph whose schema contains only a single vertex type. Unlike theprojection operator, group exposes an attribute value common to a subset of occurrences.The new vertex type will have only one attribute. The operator is de�ned as:
γ (l, Ai) G.GP : {ai : ai ∈ gp ∧ ai ∩D = ∅}
where l denotes the label of the new vertex type, Ai denotes the attribute of a vertex/edgetype in GP to be grouped, ai is the value of the attribute Ai and D is the set of distinctvalues of Ai. The attribute name in the new vertex type is also Ai. To illustrate theoperator, consider the example: Create a view in which all waterbodies of stretches appears
as vertices. This example is de�ned as:
γ (WaterBody, is_connected.waterbody)
G.(DrainagePoint, is_connected,DrainagePoint)
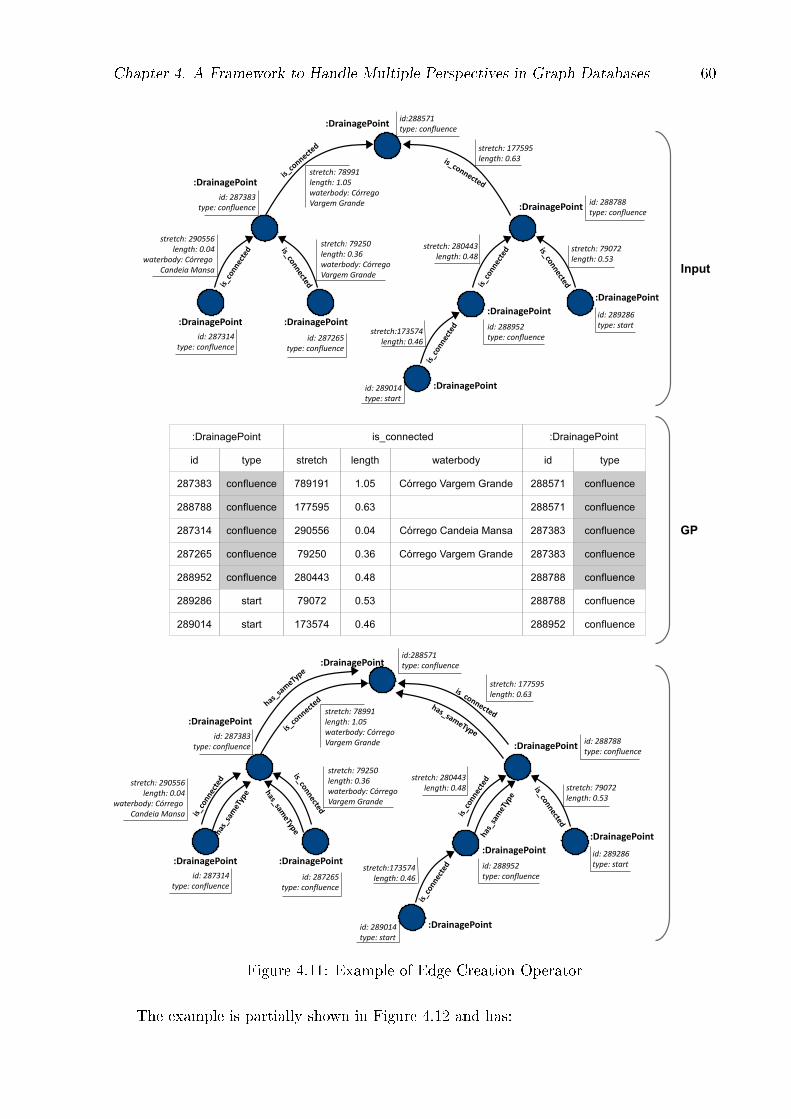
Chapter 4. A Framework to Handle Multiple Perspectives in Graph Databases 60
Figure 4.11: Example of Edge Creation Operator
The example is partially shown in Figure 4.12 and has:
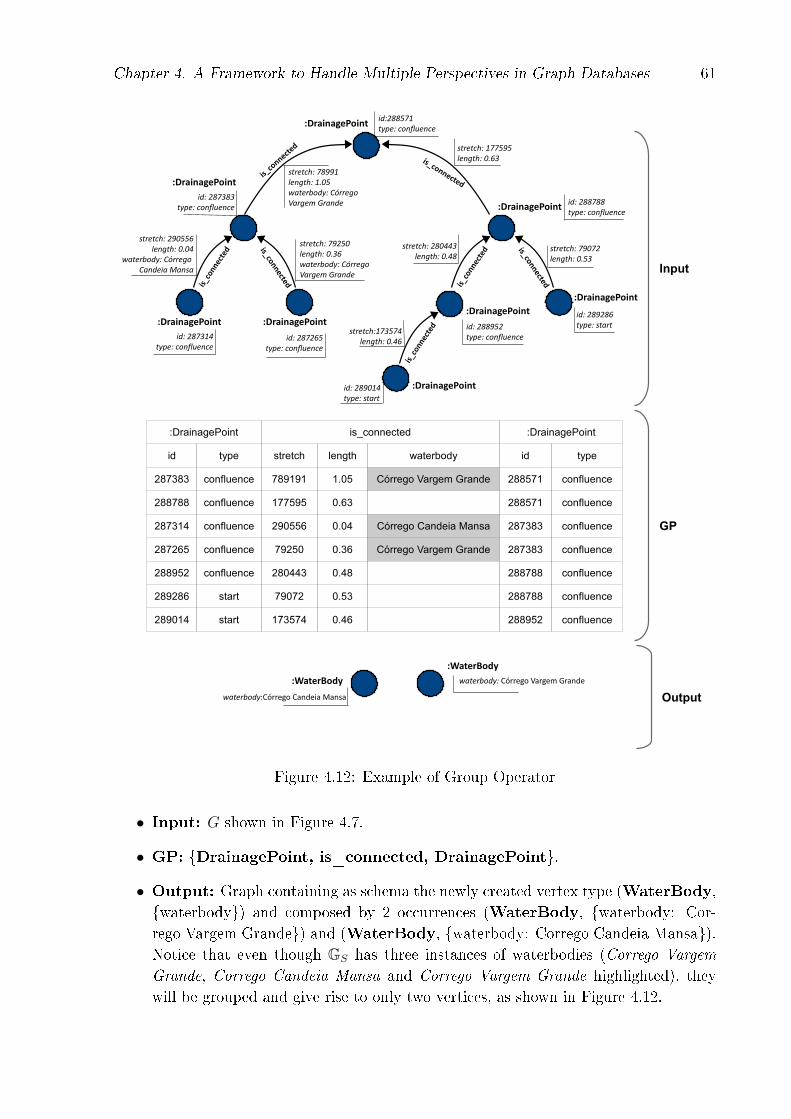
Chapter 4. A Framework to Handle Multiple Perspectives in Graph Databases 61
Figure 4.12: Example of Group Operator
• Input: G shown in Figure 4.7.
• GP: {DrainagePoint, is_connected, DrainagePoint}.
• Output: Graph containing as schema the newly created vertex type (WaterBody,{waterbody}) and composed by 2 occurrences (WaterBody, {waterbody: Cor-rego Vargem Grande}) and (WaterBody, {waterbody: Corrego Candeia Mansa}).Notice that even though GS has three instances of waterbodies (Corrego Vargem
Grande, Corrego Candeia Mansa and Corrego Vargem Grande highlighted), theywill be grouped and give rise to only two vertices, as shown in Figure 4.12.
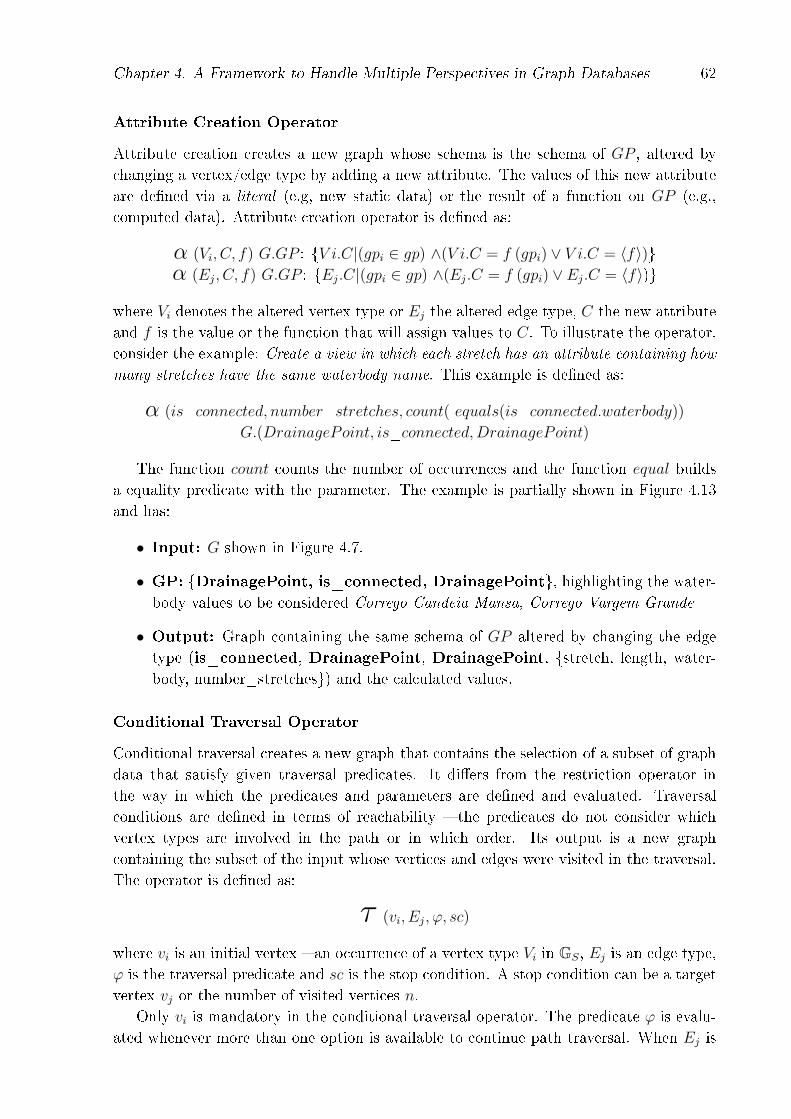
Chapter 4. A Framework to Handle Multiple Perspectives in Graph Databases 62
Attribute Creation Operator
Attribute creation creates a new graph whose schema is the schema of GP , altered bychanging a vertex/edge type by adding a new attribute. The values of this new attributeare de�ned via a literal (e.g, new static data) or the result of a function on GP (e.g.,computed data). Attribute creation operator is de�ned as:
α (Vi, C, f) G.GP : {V i.C|(gpi ∈ gp) ∧(V i.C = f (gpi) ∨ V i.C = 〈f〉)}α (Ej, C, f) G.GP : {Ej.C|(gpi ∈ gp) ∧(Ej.C = f (gpi) ∨ Ej.C = 〈f〉)}
where Vi denotes the altered vertex type or Ej the altered edge type, C the new attributeand f is the value or the function that will assign values to C. To illustrate the operator,consider the example: Create a view in which each stretch has an attribute containing how
many stretches have the same waterbody name. This example is de�ned as:
α (is_connected, number_stretches, count( equals(is_connected.waterbody))
G.(DrainagePoint, is_connected,DrainagePoint)
The function count counts the number of occurrences and the function equal buildsa equality predicate with the parameter. The example is partially shown in Figure 4.13and has:
• Input: G shown in Figure 4.7.
• GP: {DrainagePoint, is_connected, DrainagePoint}, highlighting the water-body values to be considered Corrego Candeia Mansa, Corrego Vargem Grande
• Output: Graph containing the same schema of GP altered by changing the edgetype (is_connected, DrainagePoint, DrainagePoint, {stretch, length, water-body, number_stretches}) and the calculated values.
Conditional Traversal Operator
Conditional traversal creates a new graph that contains the selection of a subset of graphdata that satisfy given traversal predicates. It di�ers from the restriction operator inthe way in which the predicates and parameters are de�ned and evaluated. Traversalconditions are de�ned in terms of reachability � the predicates do not consider whichvertex types are involved in the path or in which order. Its output is a new graphcontaining the subset of the input whose vertices and edges were visited in the traversal.The operator is de�ned as:
τ (vi, Ej, ϕ, sc)
where vi is an initial vertex � an occurrence of a vertex type Vi in GS, Ej is an edge type,ϕ is the traversal predicate and sc is the stop condition. A stop condition can be a targetvertex vj or the number of visited vertices n.
Only vi is mandatory in the conditional traversal operator. The predicate ϕ is evalu-ated whenever more than one option is available to continue path traversal. When Ej is
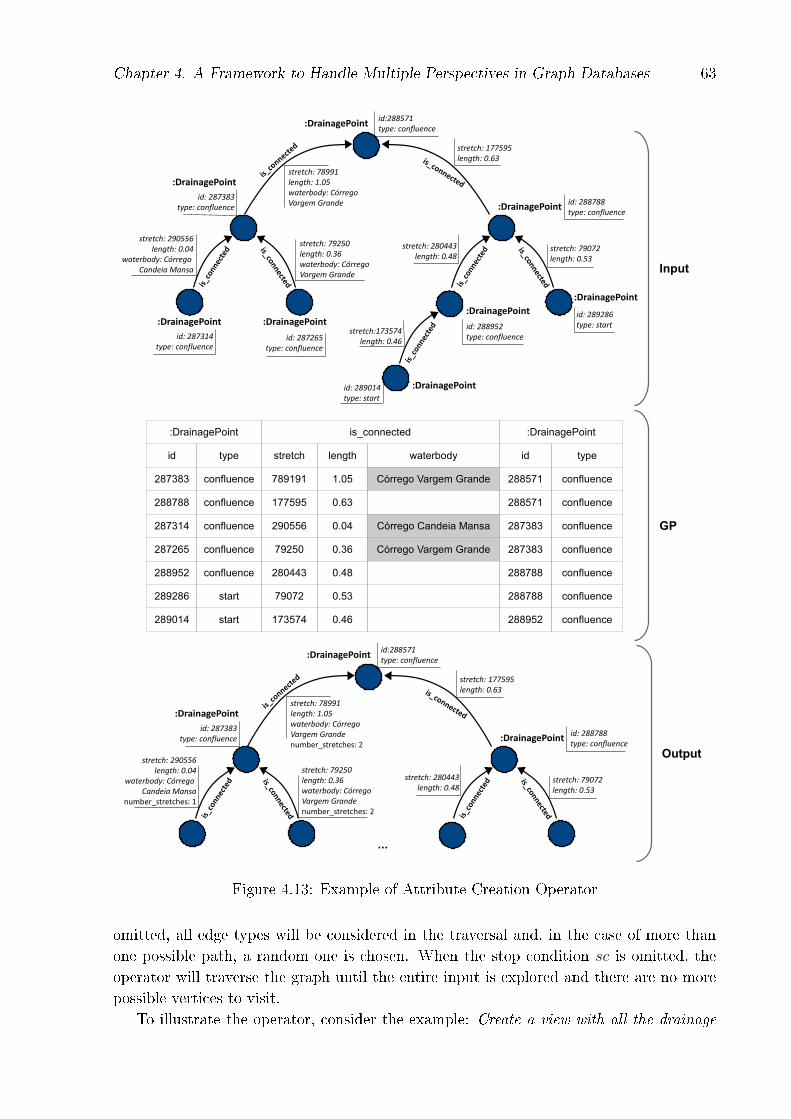
Chapter 4. A Framework to Handle Multiple Perspectives in Graph Databases 63
Figure 4.13: Example of Attribute Creation Operator
omitted, all edge types will be considered in the traversal and, in the case of more thanone possible path, a random one is chosen. When the stop condition sc is omitted, theoperator will traverse the graph until the entire input is explored and there are no morepossible vertices to visit.
To illustrate the operator, consider the example: Create a view with all the drainage
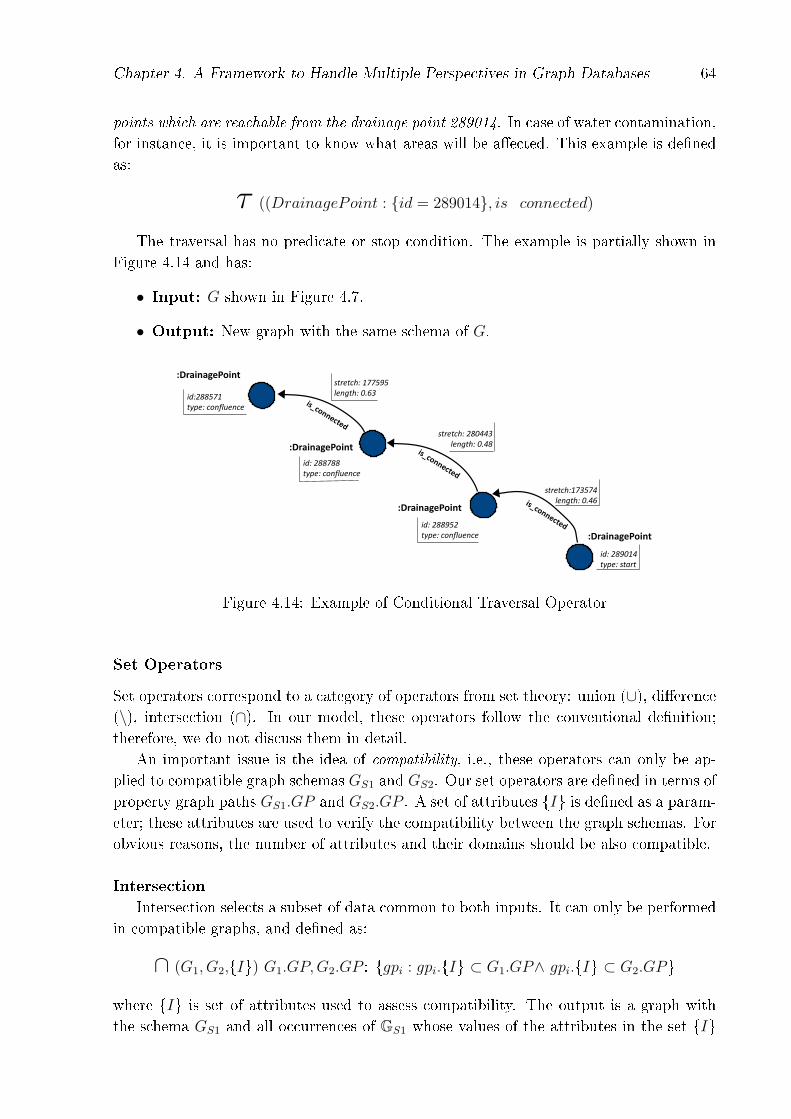
Chapter 4. A Framework to Handle Multiple Perspectives in Graph Databases 64
points which are reachable from the drainage point 289014. In case of water contamination,for instance, it is important to know what areas will be a�ected. This example is de�nedas:
τ ((DrainagePoint : {id = 289014}, is_connected)
The traversal has no predicate or stop condition. The example is partially shown inFigure 4.14 and has:
• Input: G shown in Figure 4.7.
• Output: New graph with the same schema of G.
Figure 4.14: Example of Conditional Traversal Operator
Set Operators
Set operators correspond to a category of operators from set theory: union (∪), di�erence(\), intersection (∩). In our model, these operators follow the conventional de�nition;therefore, we do not discuss them in detail.
An important issue is the idea of compatibility, i.e., these operators can only be ap-plied to compatible graph schemas GS1 and GS2. Our set operators are de�ned in terms ofproperty graph paths GS1.GP and GS2.GP . A set of attributes {I} is de�ned as a param-eter; these attributes are used to verify the compatibility between the graph schemas. Forobvious reasons, the number of attributes and their domains should be also compatible.
Intersection
Intersection selects a subset of data common to both inputs. It can only be performedin compatible graphs, and de�ned as:
∩ (G1, G2,{I}) G1.GP,G2.GP : {gpi : gpi.{I} ⊂ G1.GP∧ gpi.{I} ⊂ G2.GP}
where {I} is set of attributes used to assess compatibility. The output is a graph withthe schema GS1 and all occurrences of GS1 whose values of the attributes in the set {I}
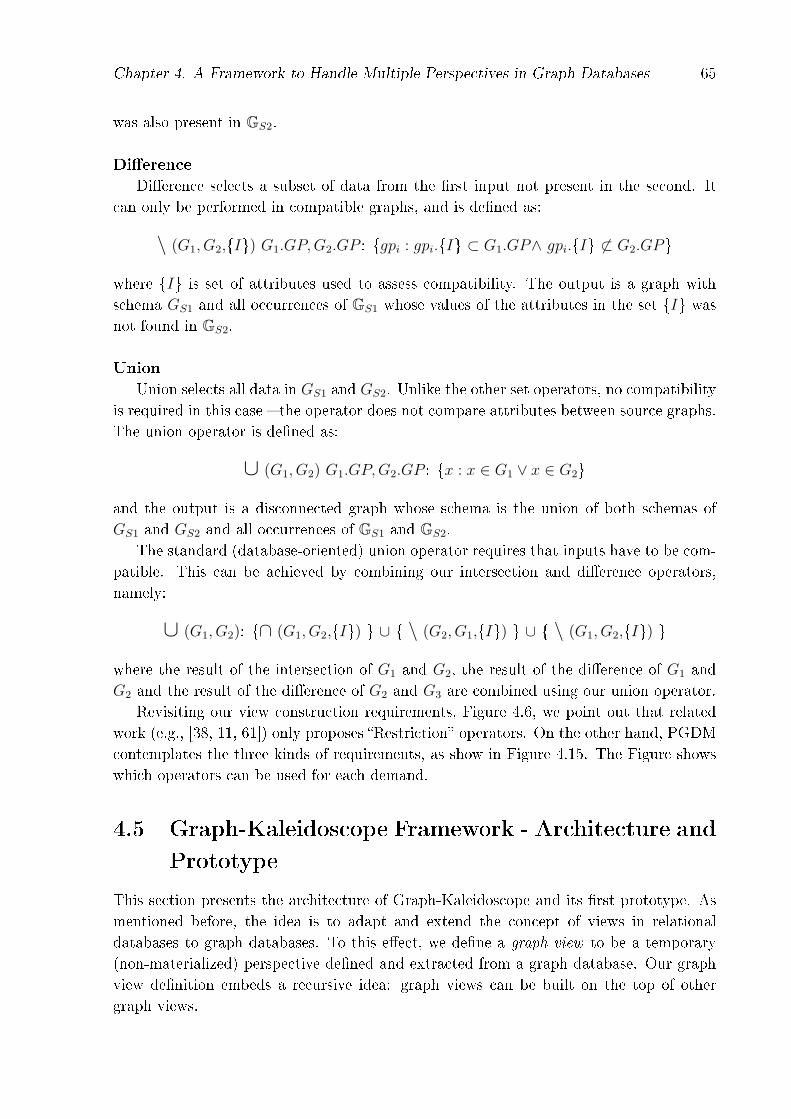
Chapter 4. A Framework to Handle Multiple Perspectives in Graph Databases 65
was also present in GS2.
Di�erence
Di�erence selects a subset of data from the �rst input not present in the second. Itcan only be performed in compatible graphs, and is de�ned as:
\ (G1, G2,{I}) G1.GP,G2.GP : {gpi : gpi.{I} ⊂ G1.GP∧ gpi.{I} 6⊂ G2.GP}
where {I} is set of attributes used to assess compatibility. The output is a graph withschema GS1 and all occurrences of GS1 whose values of the attributes in the set {I} wasnot found in GS2.
Union
Union selects all data in GS1 and GS2. Unlike the other set operators, no compatibilityis required in this case � the operator does not compare attributes between source graphs.The union operator is de�ned as:
∪ (G1, G2) G1.GP,G2.GP : {x : x ∈ G1 ∨ x ∈ G2}
and the output is a disconnected graph whose schema is the union of both schemas ofGS1 and GS2 and all occurrences of GS1 and GS2.
The standard (database-oriented) union operator requires that inputs have to be com-patible. This can be achieved by combining our intersection and di�erence operators,namely:
∪ (G1, G2): {∩ (G1, G2,{I}) } ∪ { \ (G2, G1,{I}) } ∪ { \ (G1, G2,{I}) }
where the result of the intersection of G1 and G2, the result of the di�erence of G1 andG2 and the result of the di�erence of G2 and G3 are combined using our union operator.
Revisiting our view construction requirements, Figure 4.6, we point out that relatedwork (e.g., [38, 11, 61]) only proposes �Restriction� operators. On the other hand, PGDMcontemplates the three kinds of requirements, as show in Figure 4.15. The Figure showswhich operators can be used for each demand.
4.5 Graph-Kaleidoscope Framework - Architecture and
Prototype
This section presents the architecture of Graph-Kaleidoscope and its �rst prototype. Asmentioned before, the idea is to adapt and extend the concept of views in relationaldatabases to graph databases. To this e�ect, we de�ne a graph view to be a temporary(non-materialized) perspective de�ned and extracted from a graph database. Our graphview de�nition embeds a recursive idea: graph views can be built on the top of othergraph views.
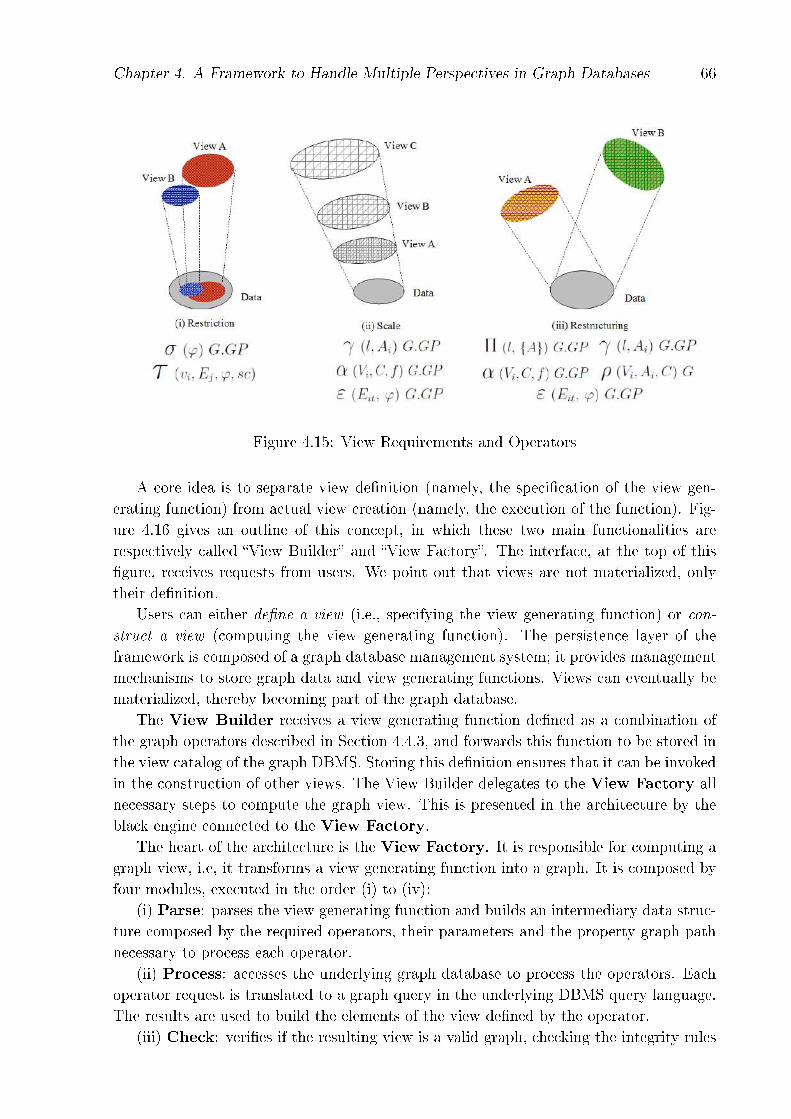
Chapter 4. A Framework to Handle Multiple Perspectives in Graph Databases 66
Figure 4.15: View Requirements and Operators
A core idea is to separate view de�nition (namely, the speci�cation of the view gen-erating function) from actual view creation (namely, the execution of the function). Fig-ure 4.16 gives an outline of this concept, in which these two main functionalities arerespectively called �View Builder� and �View Factory�. The interface, at the top of this�gure, receives requests from users. We point out that views are not materialized, onlytheir de�nition.
Users can either de�ne a view (i.e., specifying the view generating function) or con-struct a view (computing the view generating function). The persistence layer of theframework is composed of a graph database management system; it provides managementmechanisms to store graph data and view generating functions. Views can eventually bematerialized, thereby becoming part of the graph database.
The View Builder receives a view generating function de�ned as a combination ofthe graph operators described in Section 4.4.3, and forwards this function to be stored inthe view catalog of the graph DBMS. Storing this de�nition ensures that it can be invokedin the construction of other views. The View Builder delegates to the View Factory allnecessary steps to compute the graph view. This is presented in the architecture by theblack engine connected to the View Factory.
The heart of the architecture is the View Factory. It is responsible for computing agraph view, i.e, it transforms a view generating function into a graph. It is composed byfour modules, executed in the order (i) to (iv):
(i) Parse: parses the view generating function and builds an intermediary data struc-ture composed by the required operators, their parameters and the property graph pathnecessary to process each operator.
(ii) Process: accesses the underlying graph database to process the operators. Eachoperator request is translated to a graph query in the underlying DBMS query language.The results are used to build the elements of the view de�ned by the operator.
(iii) Check: veri�es if the resulting view is a valid graph, checking the integrity rules
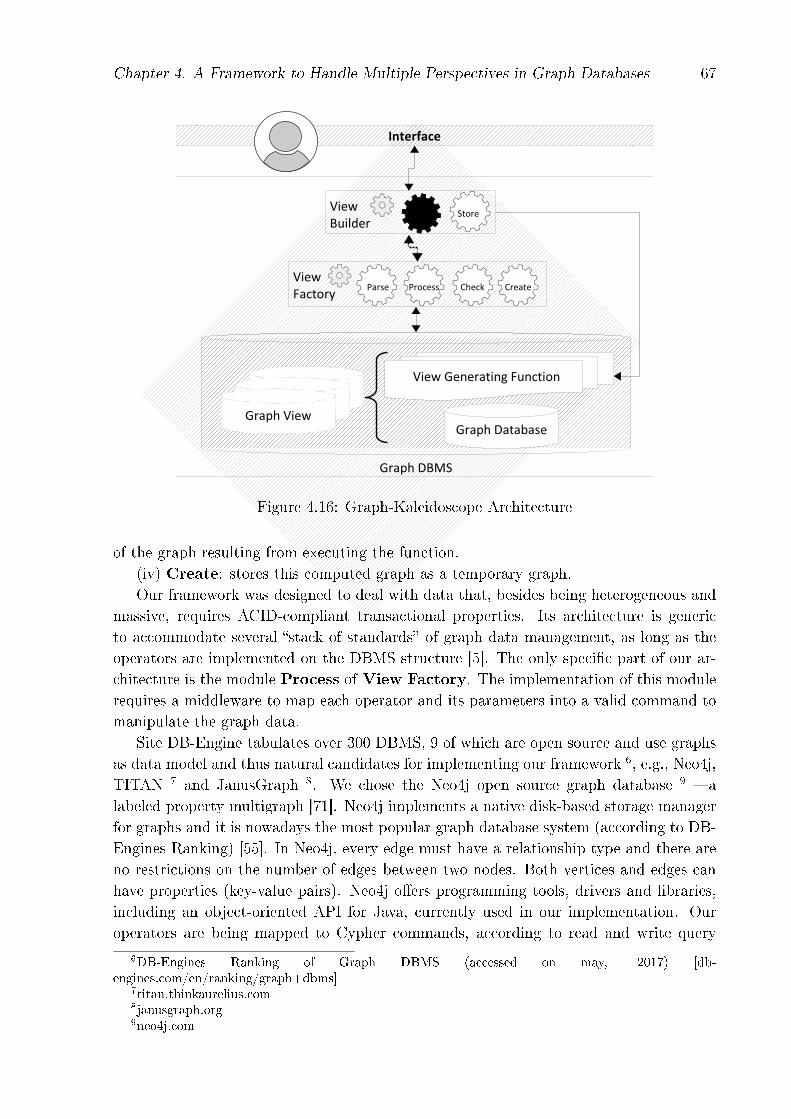
Chapter 4. A Framework to Handle Multiple Perspectives in Graph Databases 67
Figure 4.16: Graph-Kaleidoscope Architecture
of the graph resulting from executing the function.(iv) Create: stores this computed graph as a temporary graph.Our framework was designed to deal with data that, besides being heterogeneous and
massive, requires ACID-compliant transactional properties. Its architecture is genericto accommodate several �stack of standards� of graph data management, as long as theoperators are implemented on the DBMS structure [5]. The only speci�c part of our ar-chitecture is the module Process of View Factory. The implementation of this modulerequires a middleware to map each operator and its parameters into a valid command tomanipulate the graph data.
Site DB-Engine tabulates over 300 DBMS, 9 of which are open source and use graphsas data model and thus natural candidates for implementing our framework 6, e.g., Neo4j,TITAN 7 and JanusGraph 8. We chose the Neo4j open source graph database 9 � alabeled property multigraph [71]. Neo4j implements a native disk-based storage managerfor graphs and it is nowadays the most popular graph database system (according to DB-Engines Ranking) [55]. In Neo4j, every edge must have a relationship type and there areno restrictions on the number of edges between two nodes. Both vertices and edges canhave properties (key-value pairs). Neo4j o�ers programming tools, drivers and libraries,including an object-oriented API for Java, currently used in our implementation. Ouroperators are being mapped to Cypher commands, according to read and write query
6DB-Engines Ranking of Graph DBMS (accessed on may, 2017) [db-engines.com/en/ranking/graph+dbms]
7titan.thinkaurelius.com8janusgraph.org9neo4j.com
Chapter 4. A Framework to Handle Multiple Perspectives in Graph Databases 68
structures.To allow the temporary creation of user-speci�ed perspectives (i.e., views), we in-
troduce the notion of session. This allows the construction of several what-if scenarios,without the need to permanently store them, so that experts can explore alternatives. Asession is an interactive information interchange between users and our framework. It isinitiated upon request at a certain point in time, and then closed at some later point.Our framework identi�es each session by a session id created by the framework at sessionbegin. Sessions allow users to interact independently with their own views.
To illustrate view generation in the prototype, the next section presents a real envi-ronmental management case study based on analysis of water resources, in which userdemands are translated into di�erent views.
4.6 Case Study: Providing Perspectives of the Water
Resources Database for Environmental Resource
Applications
We return to our motivating scenario, of environmental analysis centered on managementof water resources. This section discusses some of the computational analyses requiredby ANA experts, many of which have proved to be hard to develop on top of the existing(relational) database pgHydro (see Figure 4.1), and explains how such analyses can beeasily represented in GHydro (see Figure 4.7) or through views over GHydro.
Once our prototype was implemented in Neo4j, the queries presented in this sectionare expressed in Cypher � the native graph query language of Neo4j. The goal is notto compare performance, but to emphasize the �reachability� issue intrinsic to these rou-tines, explicitness and readability of queries and low maintenance cost. There are manyrepeated e�orts in literature that compare the performance between graph and relationaldatabases [80, 63].
First of all, it is important to deal with data consistency. The water resources databaseis organized according to Otto Pfafstetter methodology [69]. That organization impliesthat the drainage network must be represented as a binary tree-graph, connected andacyclic, whose edges go from the leaves to the root. Hence, to execute data consistencytests over GHydro, there are at least two important features to check: connectivity of allstretches and the binary tree-graph structure. The �rst feature can be ensured verifying ifthere are unconnected vertices. To check that, we perform the Cypher query, that returnsthe unconnected vertices:
START n = node(*)MATCH n-[r?]-()WHERE r IS NULLRETURN n
If at least one vertex is found, the database is inconsistent. The second constraint,the binary tree structure, is checked selecting all vertices whose degree value is di�erent
Chapter 4. A Framework to Handle Multiple Perspectives in Graph Databases 69
from 1 (start or end points) or 3 (river con�uences), provided there are no cycles (sincethe real world problem assumes mapping to trees). If at least one such vertex is found,the database is inconsistent. To check that, we perform the Cypher query:
START n = node(*)MATCH n-[r]-()WITH count(r) as cWHERE c 〈 〉 1 AND c 〈 〉 3RETURN n, c
Next, we present some computational analyses that require to build views over GHydro
and how to solve them using Graph-Kaleidoscope.All examples that follow are based on requirements by ANA experts. In the relational
database implementation of ANA, they either require queries with many recursive selfjoins or long stored procedure code. Since the DBMS query system did not supportthe computation of our examples, instead, are based on two steps. Step (1) consists inconstructing a view that rearranges the underlying graph into a new graph. Step (2)poses a Cypher query on this new graph.
Moreover, we selected situations in our case study in which we can illustrate views asdepicted in Cypher. Example 4.6.1 shows graph views in a restriction role. Example 4.6.2illustrate how our views can be used to restructure data. Finally, 4.6.3 portrays the roleof views in support multiscale analysis.
4.6.1 View GVHydro454: Determining the Longer Drainage Stretch
of Watershed 454
The o�cial territorial unit for the management of water resources adopted by ANA is awatershed. A watershed is composed by a set of drainage points and stretches. It delimitsa drainage system channel and comprises the entire area that separates di�erent water�ows. Every watershed has one main watercourse; following its layout, the watershed canbe split into a set of sub-watersheds and the process is applied recursively, as shown inFigure 4.17.
Each watershed receives a numeric ottocode10 and the sub-watersheds have the sameottocode as pre�x (e.g., as shown in Figure 4.17, watershed 454 has 9 sub-watershedsottocoded as 4542, 4543,..., 4549). More details about this methodology can be foundin [69].
Two steps are needed to determine the longer drainage stretch of the watershed withottocode 454 in GHydro by constructing a view that restrict data. The view correspondingto step (1), here called GVHydro454, creates a graph which is a subset of GHydro, contain-ing vertex type DrainagePoint and edge type is_connected and only the occurrencesof is_connected whose attribute ottocode starts with the value 454. This can be con-structed using the operator restriction, de�ned as:
10Thus called because of the Otto Pfafstetter methodology adopted
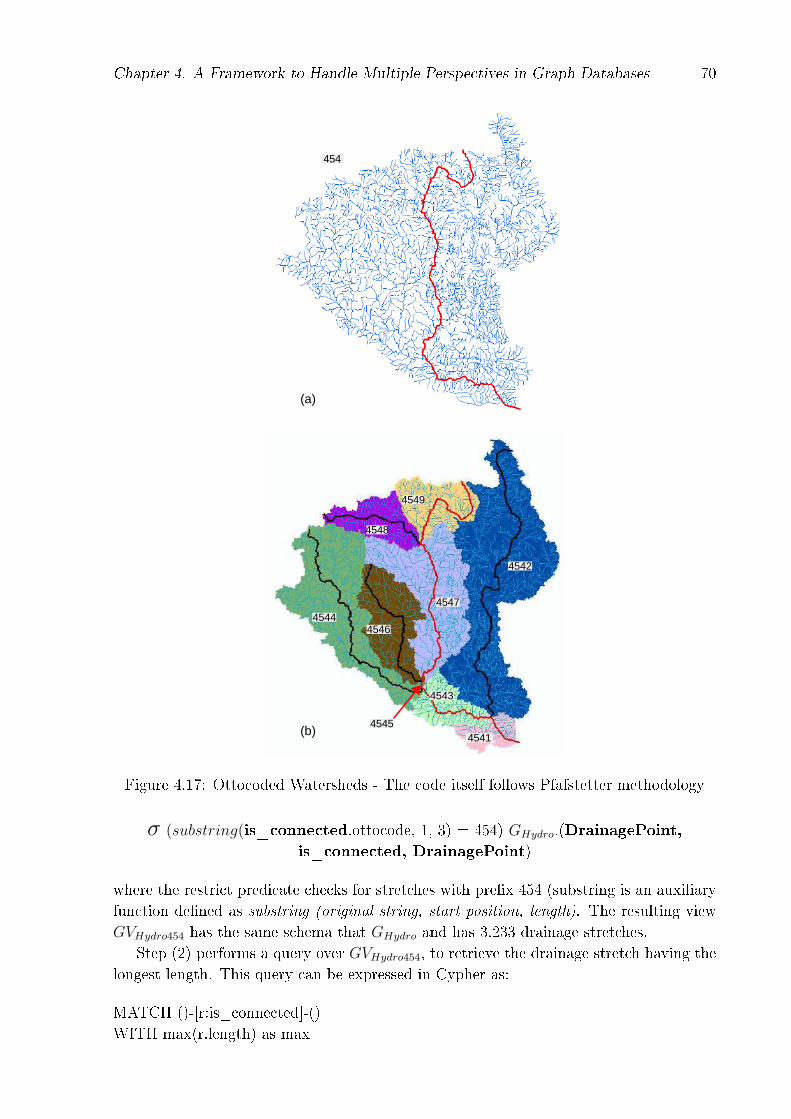
Chapter 4. A Framework to Handle Multiple Perspectives in Graph Databases 70
Figure 4.17: Ottocoded Watersheds - The code itself follows Pfafstetter methodology
σ (substring(is_connected.ottocode, 1, 3) = 454) GHydro.(DrainagePoint,is_connected, DrainagePoint)
where the restrict predicate checks for stretches with pre�x 454 (substring is an auxiliaryfunction de�ned as substring (original string, start position, length). The resulting viewGVHydro454 has the same schema that GHydro and has 3.233 drainage stretches.
Step (2) performs a query over GVHydro454, to retrieve the drainage stretch having thelongest length. This query can be expressed in Cypher as:
MATCH ()-[r:is_connected]-()WITH max(r.length) as max
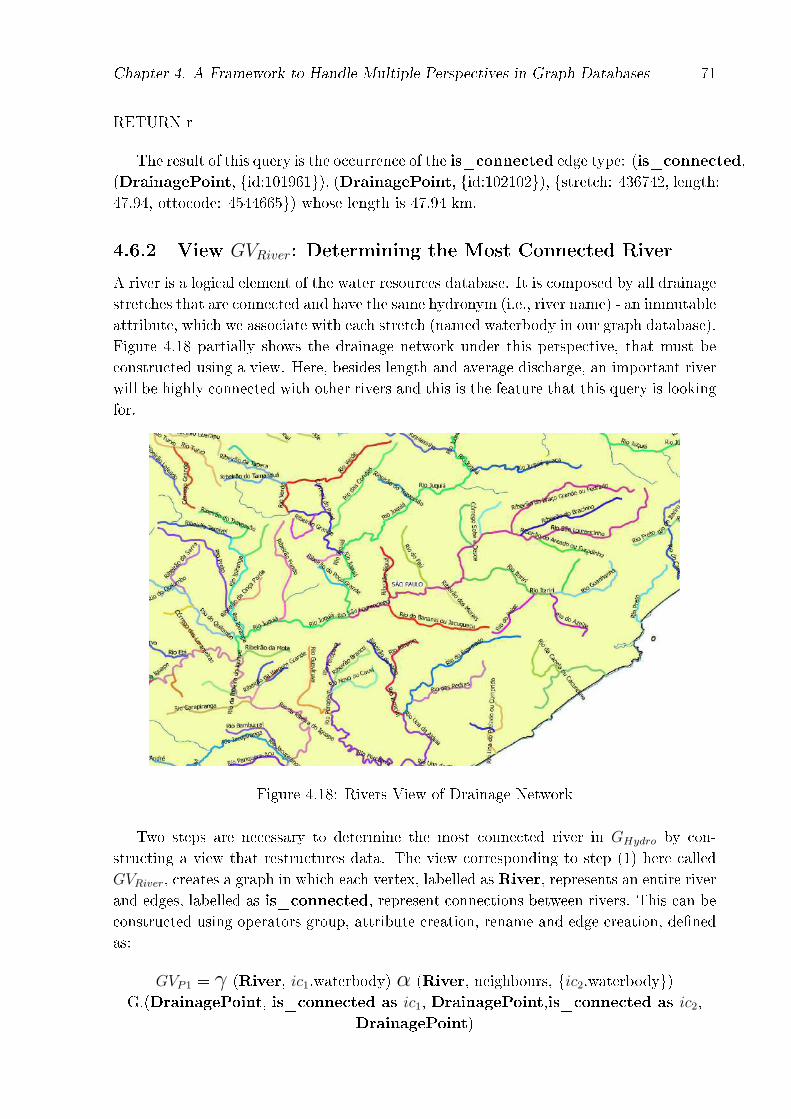
Chapter 4. A Framework to Handle Multiple Perspectives in Graph Databases 71
RETURN r
The result of this query is the occurrence of the is_connected edge type: (is_connected,(DrainagePoint, {id:101961}), (DrainagePoint, {id:102102}), {stretch: 436742, length:47.94, ottocode: 4544665}) whose length is 47.94 km.
4.6.2 View GVRiver: Determining the Most Connected River
A river is a logical element of the water resources database. It is composed by all drainagestretches that are connected and have the same hydronym (i.e., river name) - an immutableattribute, which we associate with each stretch (named waterbody in our graph database).Figure 4.18 partially shows the drainage network under this perspective, that must beconstructed using a view. Here, besides length and average discharge, an important riverwill be highly connected with other rivers and this is the feature that this query is lookingfor.
Figure 4.18: Rivers View of Drainage Network
Two steps are necessary to determine the most connected river in GHydro by con-structing a view that restructures data. The view corresponding to step (1) here calledGVRiver, creates a graph in which each vertex, labelled as River, represents an entire riverand edges, labelled as is_connected, represent connections between rivers. This can beconstructed using operators group, attribute creation, rename and edge creation, de�nedas:
GVP1 = γ (River, ic1.waterbody) α (River, neighbours, {ic2.waterbody})G.(DrainagePoint, is_connected as ic1, DrainagePoint,is_connected as ic2,
DrainagePoint)

Chapter 4. A Framework to Handle Multiple Perspectives in Graph Databases 72
GVP2 = ρ (River, waterbody, name) GVP1
GVRiver = ε ((is_connected, River, River), (Ra.name ∈ Rb.neighbours))
GVP2.(River as Ra, River as Rb)
View GVP1 was created by composing operators group and attribute creation. Thisview is a graph having the vertex type River with two attributes: waterbody, the name ofthe river, and neighbours, a set of the river names that share a drainage point with thatwaterbody. GVP1 is the input for the rename operator, which in turn creates the viewGVP2. GVP2 is next used by the edge creation operator to create GVRiver, which connectstwo rivers Ra and Rb if the name of Ra is on the list of neighbours of Rb. The resultingview GVRiver is partially shown in Figure 4.19. GHydro has 54.267 rivers.
Figure 4.19: GVRiver graph view schema (a) and state (b)
Step (2) performs a query over GVRiver to retrieve the vertex with most connections(higher degree). This query can be expressed in Cypher as:
START n = node(*)MATCH n-[r]-()RETURN n, count(r) as cORDER BY c descLIMIT 1
The result of this query is �Rio Sao Francisco�, the fourth longest river in Brazil thatcrosses 5 states. Our query shows that �Rio Sao Francisco� is connected with 303 otherrivers.
4.6.3 View GVWatershed: Determining the Most In�uential Sub-
watershed of a Given Watershed
As shown in Figure 4.17, every watershed has one main watercourse that divides it into aset of sub-watersheds, building a watershed hierarchy. Each drainage stretch, part of the
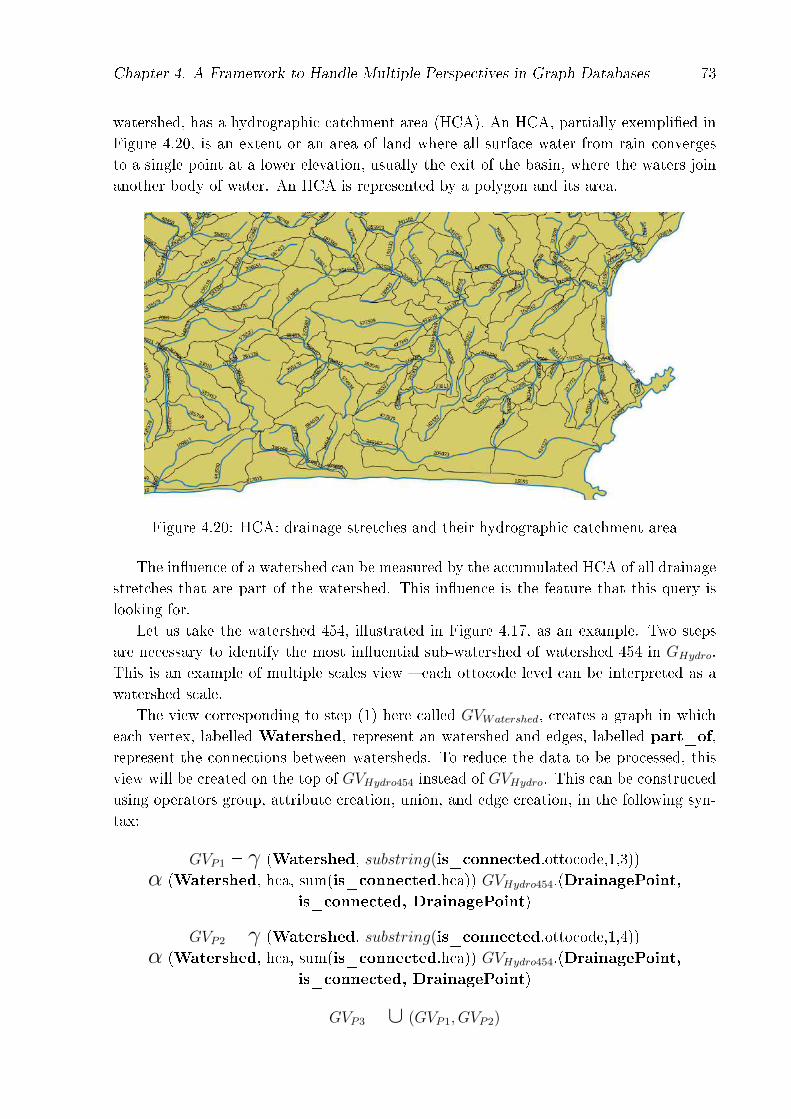
Chapter 4. A Framework to Handle Multiple Perspectives in Graph Databases 73
watershed, has a hydrographic catchment area (HCA). An HCA, partially exempli�ed inFigure 4.20, is an extent or an area of land where all surface water from rain convergesto a single point at a lower elevation, usually the exit of the basin, where the waters joinanother body of water. An HCA is represented by a polygon and its area.
Figure 4.20: HCA: drainage stretches and their hydrographic catchment area
The in�uence of a watershed can be measured by the accumulated HCA of all drainagestretches that are part of the watershed. This in�uence is the feature that this query islooking for.
Let us take the watershed 454, illustrated in Figure 4.17, as an example. Two stepsare necessary to identify the most in�uential sub-watershed of watershed 454 in GHydro.This is an example of multiple scales view � each ottocode level can be interpreted as awatershed scale.
The view corresponding to step (1) here called GVWatershed, creates a graph in whicheach vertex, labelled Watershed, represent an watershed and edges, labelled part_of,represent the connections between watersheds. To reduce the data to be processed, thisview will be created on the top of GVHydro454 instead of GVHydro. This can be constructedusing operators group, attribute creation, union, and edge creation, in the following syn-tax:
GVP1 = γ (Watershed, substring(is_connected.ottocode,1,3))α (Watershed, hca, sum(is_connected.hca)) GVHydro454.(DrainagePoint,
is_connected, DrainagePoint)
GVP2 = γ (Watershed, substring(is_connected.ottocode,1,4))α (Watershed, hca, sum(is_connected.hca)) GVHydro454.(DrainagePoint,
is_connected, DrainagePoint)
GVP3 = ∪ (GVP1, GVP2)
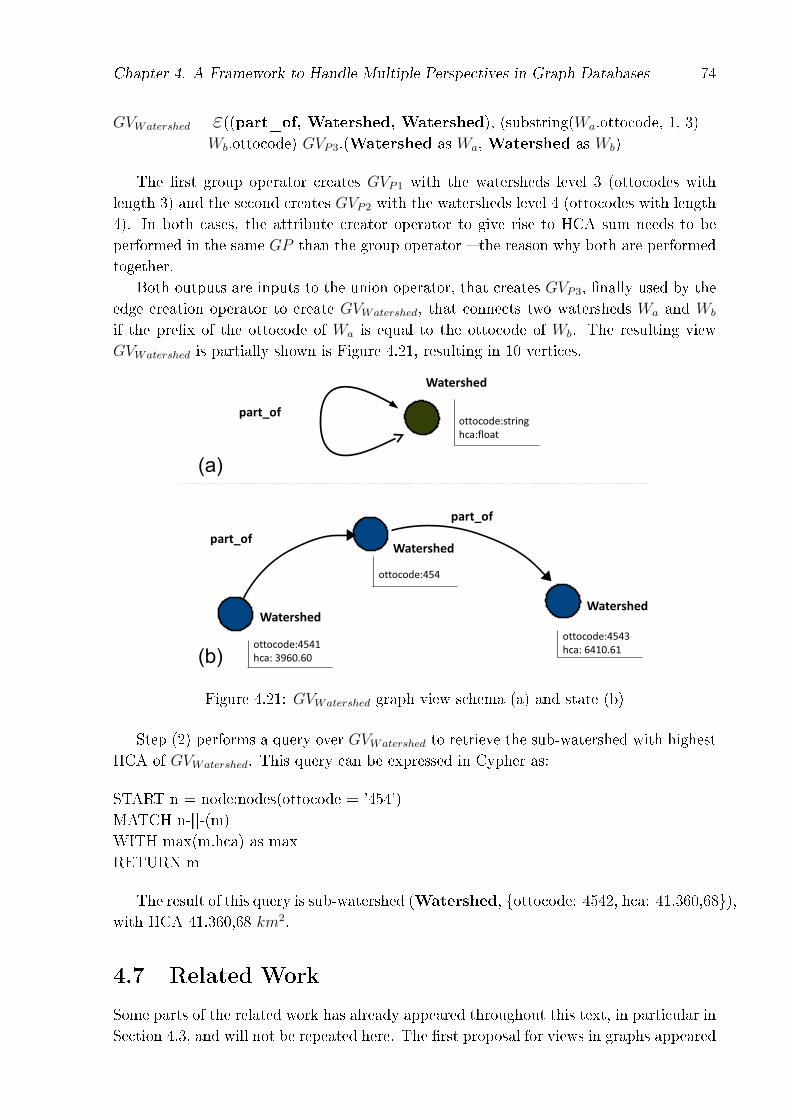
Chapter 4. A Framework to Handle Multiple Perspectives in Graph Databases 74
GVWatershed = ε((part_of, Watershed, Watershed), (substring(Wa.ottocode, 1, 3) =Wb.ottocode) GVP3.(Watershed as Wa, Watershed as Wb)
The �rst group operator creates GVP1 with the watersheds level 3 (ottocodes withlength 3) and the second creates GVP2 with the watersheds level 4 (ottocodes with length4). In both cases, the attribute creator operator to give rise to HCA sum needs to beperformed in the same GP than the group operator � the reason why both are performedtogether.
Both outputs are inputs to the union operator, that creates GVP3, �nally used by theedge creation operator to create GVWatershed, that connects two watersheds Wa and Wb
if the pre�x of the ottocode of Wa is equal to the ottocode of Wb. The resulting viewGVWatershed is partially shown is Figure 4.21, resulting in 10 vertices.
Figure 4.21: GVWatershed graph view schema (a) and state (b)
Step (2) performs a query over GVWatershed to retrieve the sub-watershed with highestHCA of GVWatershed. This query can be expressed in Cypher as:
START n = node:nodes(ottocode = '454')MATCH n-[]-(m)WITH max(m.hca) as maxRETURN m
The result of this query is sub-watershed (Watershed, {ottocode: 4542, hca: 41.360,68}),with HCA 41.360,68 km2.
4.7 Related Work
Some parts of the related work has already appeared throughout this text, in particular inSection 4.3, and will not be repeated here. The �rst proposal for views in graphs appeared
Chapter 4. A Framework to Handle Multiple Perspectives in Graph Databases 75
in the 80's, together with the �rst graph data models. Kunii's research [56] very brie�yapproaches graph views in her thesis, proposing a view de�nition composed by a list ofvertex type de�nitions and list of link type de�nitions. Each de�nition consists of twoelements: a speci�cation of its structure and a speci�cation of mappings that describehow they are derived from a schema. The main limitation of this proposal was to assumethat only select expressions (with �lters) are enough to create graph views. This work wasnot followed by others, and as far as we know views on graphs were not further exploitedas such in related work.
With the arrival of graph database management systems, some view mechanisms havestarted to appear in the last 3 years. An example of construction of views in graphdatabases appears in [38]. The research concerns the development of e�cient algorithmsto answer graph queries using a set of graph views. Here, a graph view is a graph patternquery, i.e., a subgraph with a set of pattern nodes and a set of pattern edges. This wasproposed to support handling data in large and distributed databases.
Another example is found in [11], for optimization of view maintenance over graphdatabases; this concentrates on e�ciency issues, for deductive graph databases. A viewde�nition speci�es the graph patterns used to derive views. For each match of the graphpattern, an annotation is created to mark the match. A view graph consists of a set ofannotations that references all nodes that participate in a certain match. This approachallows to deal with multiple graphs in a single view.
Similar to us, [43] proposes a graph data model. The authors de�ne a graph datastructure, integrity rules and a set operators to deal with graph data based on propertygraphs and hypernodes. The main di�erence from our approach is in the set of opera-tors and the kind of graph restructuring allowed. The operators of [43] are based onGraphQL11 and UML builders, separating the vertex on classes and instances and classi-fying the edges as generalization, aggregation or composition. There is the idea of bindgraph patterns with graph templates, however it does not properly de�ne or formalize theoperators.
Last but not least, the notion of graph views is also proposed for domains in whichrelationships are analyzed under the so-called complex networks, which are sometimesmaterialized in graph databases (e.g., [61]). The analysis of complex networks, however, isnot geared towards database-related issues; rather, the focus is on extracting and miningrelationships and patterns of connections across data elements. In this context, view-like mechanisms are proposed to extract a portion of a network for analysis, but theconstruction of such views is based on invoking queries using the database language.
Figure 4.22 presents a comparative table of these proposals and our framework in termsof the di�erent purposes of views presented in Figure 4.6. As can be seen, the generalidea of views in graphs is present in all approaches � they all deal with graph data andadopt some kind of view de�nition mechanism/paradigm to describe how to derive graphdata from other data graphs. The main di�erence is the approach adopted: many employgraph patterns to formulate graph queries. We, instead, de�ne generic operators that canbe used to construct views over generic graph databases. Our operators allow to achieveall purposes of a view presented in Figure 4.6, mainly aggregation and restructuring not
11graphql.org
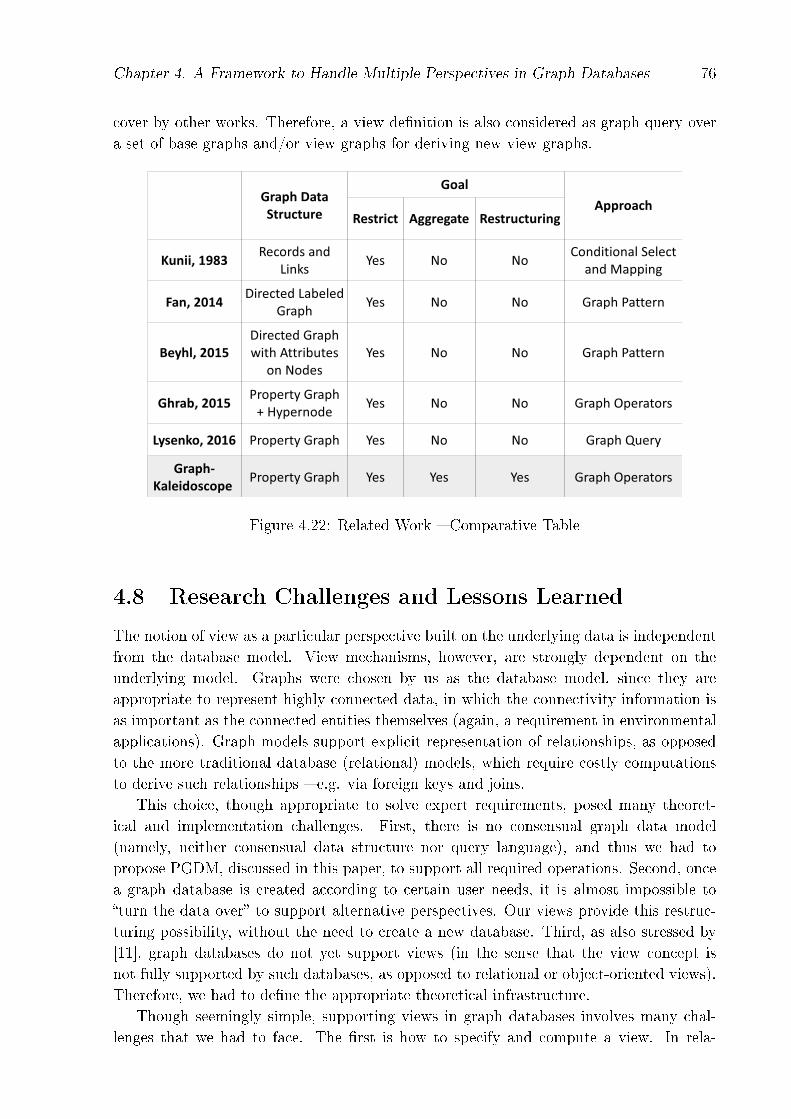
Chapter 4. A Framework to Handle Multiple Perspectives in Graph Databases 76
cover by other works. Therefore, a view de�nition is also considered as graph query overa set of base graphs and/or view graphs for deriving new view graphs.
Figure 4.22: Related Work � Comparative Table
4.8 Research Challenges and Lessons Learned
The notion of view as a particular perspective built on the underlying data is independentfrom the database model. View mechanisms, however, are strongly dependent on theunderlying model. Graphs were chosen by us as the database model, since they areappropriate to represent highly connected data, in which the connectivity information isas important as the connected entities themselves (again, a requirement in environmentalapplications). Graph models support explicit representation of relationships, as opposedto the more traditional database (relational) models, which require costly computationsto derive such relationships � e.g. via foreign keys and joins.
This choice, though appropriate to solve expert requirements, posed many theoret-ical and implementation challenges. First, there is no consensual graph data model(namely, neither consensual data structure nor query language), and thus we had topropose PGDM, discussed in this paper, to support all required operations. Second, oncea graph database is created according to certain user needs, it is almost impossible to�turn the data over� to support alternative perspectives. Our views provide this restruc-turing possibility, without the need to create a new database. Third, as also stressed by[11], graph databases do not yet support views (in the sense that the view concept isnot fully supported by such databases, as opposed to relational or object-oriented views).Therefore, we had to de�ne the appropriate theoretical infrastructure.
Though seemingly simple, supporting views in graph databases involves many chal-lenges that we had to face. The �rst is how to specify and compute a view. In rela-
Chapter 4. A Framework to Handle Multiple Perspectives in Graph Databases 77
tional databases, views are de�ned through database queries, using SQL. Unlike thesedatabases, there is no consensual query language for graph databases. Thus, to specifyGraph-Kaleidoscope, we had to analyze and compare several graph representations. Asa result, we concluded that we could not choose �the most adequate� model, given thateach proposal is geared towards distinct goals.
Another important issue, still connected with view generation, is the type of theresult returned. Queries in relational databases return tables (or values, in speci�c cases)- and thus a view is always a table. Most graph query languages, however, can returngraphs, tables, or values. Since for us views have to be graphs, this posed the challengeof de�ning appropriate operators, so that the result would always be a graph. All theseproblems related to view generating functions were solved by us through the de�nition ofour elementary operators, all of which receive a graph as input, and produce a graph asoutput. Their implementation in graph query languages is still an open problem, sincethis will depend on each language.
We also had to choose between materializing views, or maintaining them as temporarystructures. Each of these options has pros and cons, discussed in relational database viewliterature. We solved this through the de�nition of �sessions�, thereby allowing temporaryviews, and at the same time supporting materialization when needed. A discussion of theadvantages and disadvantages of these options is outside the scope of our work, since itinvolves, among others, performance issues, which we are not concerned with.
Last but not least, the choice of the framework persistence layers was a research chal-lenge. NOSQL databases are a �eld in which there is much debate � e.g., are they reallydatabase solutions or just products that are being developed to meet performance needsthat cannot be satis�ed by relational databases ? To this end, which kind of features arebeing disregard [77]? Related work shows that graph databases bring �exibility to manyapplications, being moreover inspired by a robust mathematical model, and centuries ofalgorithms that have been thoroughly studied. Many real world problems can be directlymapped to graphs. However, from an implementation point of view, there is still muchto be done before graph databases can be directly compared with relational databases.
4.9 Conclusions and Ongoing Work
This paper presented Graph-Kaleidoscope, a computational framework that supportsmanagement of views in graph databases. Views, here, are provided to let experts exploitmultiple perspectives from the underlying data. This research was motivated by the needsfrom researchers that deal with environmental, geographic data, characterized by a wideheterogeneity of data that are highly related across multiple spatial and temporal scales.This paper contributes therefore towards solving problems of multi-perspective researchin applications that are characterized by inter-disciplinarity (and thus multiple ways ofanalyzing a problem). Graph-Kaleidoscope is characterized by: (1) use of graph databasesto store and analyze datasets of highly connected data; (2) adapting the concept of viewsfrom relational databases to represent the idea of focus; and (3) speci�cation and imple-mentation of a graph view framework to support views over graph databases � views that
Chapter 4. A Framework to Handle Multiple Perspectives in Graph Databases 78
are themselves graphs.Though we take advantage of work published on relational databases, our work dis-
tinguishes itself in at least two points. First, though view mechanisms are recognizedas useful, no such mechanisms exist in graph databases, for lack of a consensual model.Second, unlike other proposals, our graph view operators allow creation of graphs with atopology that is completely di�erent from that of the underlying data, to accommodatedistinct semantic needs on top of stored data.
This notwithstanding, our speci�cation is general enough so that Graph-Kaleidoscopecan be used in other research contexts, in which data present the same kind of charac-teristics (e.g., for domains that deal with complex multi-scale networks, such as healthor biodiversity). Our paper also presents a preliminary prototype of our framework, usedto solve needs of researchers in water resource management, for a real life case study,covering Brazil's entire water network resources. The database used is public domain andit is available in the o�cial website of the Brazil National Water Agency.
Ongoing work covers both theoretical and implementation issues. Implementatione�orts require improvement in the framework's code, in particular considering the under-lying data catalogue, and generating function storage and indexing. Another directioninvolves designing and developing a user-friendly interactive interface, to help users de-�ne and explore views. Still another issue is to try to (re)implement the framework usinganother �stack� of graph representation and technology, e.g., RDF-SPARQL. From a the-oretical point of view, we might think of considering other operators, e.g., de�ned as acombination of our elementary operators, and to explore geographic features of data.
Chapter 5
Conclusions and Extensions
5.1 Overview
The research presented in this thesis concerns challenges in data-intensive science, inparticular to overcome the problem of supporting multiple perspectives on heterogeneousdatasets. Our motivation came from interdisciplinary and multifocus research, where eachstakeholder has a particular perspective on a given problem, e.g. dealing with a subset ofdata, adopting speci�c vocabularies or considering objects from distinct domains together.This scenario usually requires complex data transformation processes to create multiplerepresentations of the same real work phenomena.
The main tenet veri�ed of this PhD research is that graph databases are a suitableapproach for handling a wide range of demands for managing heterogeneous data. More-over, the concept of views, from relational databases, can be applied to provide multipleperspectives, as proposed by [73].
The unstructured nature of data and the high level of importance of data connectionsled the research to adopt the graph data management paradigm, a schemaless relationship-driven NoSQL solution. Our de�nition of views is based on view generating functions, forus a composition of graph operators. These operators are part of our PGDM model, theproperty graph data model de�ned in this research. Based on this approach, we specifyand implement a prototype of a framework to handle views over graph databases, namedGraph-Kaleidoscope. The speci�cation of our operators and framework are as generic aspossible and they can be implemented in di�erent graph database engines.
Two di�erent real world datasets � in biodiversity and in environmental resources �were analyzed to gather the requirements of view mechanisms and to validate our research.Both case studies can clearly bene�t from our framework to perform complex queries. Wealso believe that our solution can be extended and adopted by other kinds of applicationdomains with similar management and analysis requirements.
5.2 Main Contributions
Our �rst contribution, presented in Chapter 2, was to present the case for the use of graphdatabases in multifocus research. From a study of data management requirements, we
79
Chapter 5. Conclusions and Extensions 80
justify the use of graph databases as a suitable persistence layer to meet these requirementsand to store/analyze datasets of highly connected data.
The second contribution of this thesis, presented in Chapter 4, is to propose a propertygraph data model (PGDM) with a set of operators to manipulate and retrieve graph data.Ours is a �exible approach, to be incorporated in any graph data structure and querylanguage. This is the main contribution of our thesis, proposed to �ll the gap of theabsence of a full-�edged data model for graph databases.
The third contribution, introduced in Chapter 2 and formalized in Chapter 4, is tode�ne views for graph databases to support the need for multiple perspectives in inter-disciplinary research. Views are speci�ed through view generating functions, consideringgraph data manipulation, classical algorithms and traversal tasks.
Our fourth contribution, presented in Chapters 2, 3 and 4, is to analyze real life exam-ples of interdisciplinary research and how they can bene�t from our proposal. We presenthow biodiversity and environmental resource datasets can be modeled and explored byexperts using graph databases and multiple perspectives, pointing out the advantages ofthis approach.
The last contribution is presented in Chapter 4: the speci�cation and implementationof a prototype of Graph-Kaleidoscope to support views over graph databases using agraph database engine.
5.3 Extensions
This research can be extended to di�erent practical/implementation and theoretical as-pects. Some possibilities are listed below.
• Document the prototype source code and make it available in a software repository.This action will help disseminate our ideas and results outside the academic �eld tothe graph database community and start a practical discussion about how they canbring new bene�ts to users and applications.
• Investigate performance issues to perform adaptations in our framework to improveperformance, i.e., to use less computational resources and to reduce execution time.Index structures are usually adopted in conventional relational databases to improveperformance in data manipulation.
• Develop a graphical user interface to our prototype. The graph data structureis often better understood in a visual way. Analogously, to provide a graphicalinterface for view de�nition and exploration would improve our prototype, make itmore interesting to stakeholders.
• Include graph database con�gurations in our prototype to allow other graph databasemanagement systems besides Neo4j. DB-Engine Ranking1 indicates the existenceof 26 graph databases engines, of which 9 are open source native graph databasesystems and strong candidates to be used as persistence layer of our prototype.
1db-engines.com/en/ranking/graph+dbms
Chapter 5. Conclusions and Extensions 81
• Implement a new prototype using another stack of standards of graphs. As presentedin the thesis, RDF is a possible option, but a more complex one. The graph natureof RDF triple syntax (subject-predicate-object) is indeed appealing, but the RDFspeci�cation2 falls short of a de�nition of a graph in a mathematical sense � e.g., thede�nition of the set of vertices and edges, as pointed out by [49]. Consider a RDFstructure in which some resource p occurs as a predicate of some statements and asthe subject of others - should p be considered a vertex or an edge? Work with RDFas a graph model will demand additional formalisms to mapping RDF statementsin graphs to base our framework. On the other hand, our framework would bene�tfrom the well established SPARQL query language to implement our operators.
• Gather new requirements of multifocus research. Due to the complexity involvingheterogeneous datasets, our thesis delimits a scope and a list of research problems todeal with. Indeed, many other requirements can arise outside this initial scope, forexample, the need to dis aggregate a data record in smaller pieces of data. In Graph-Kaleidoscope, this requirement may result in a new operator capable of splitting avertex or to create multiple edges between two vertices with a di�erent meaning,for instance.
• Design adaptations in our framework to explore semantic aspects of data. Connec-tivity of data can refer to some semantic relation and it is possible to formalize thecontext of a dataset through ontologies [45]. An initial approach is the edge creationoperator, which could consider as a possible predicate the existence of a semanticrelation between two attribute values, for instance.
• Design adaptations in our framework to explore geographic aspects of data. Asshown by our environmental resources case study, connectivity can also expresssome kind of spatial correlation about data records. Thus, to consider geographiccoordinates in vertices, for instance, could be helpful in aggregation tasks or evento restrict or project data based on topological relations. Another related extensionwould be to include temporal predicates, e.g., temporal algebra.
• Design adaptations in our framework to accommodate classical graph algorithms.Many analyses can be done �nding a minimum spanning tree or a clique. Some casesare mappable to our traversal operator, while other would be better performed withspeci�c algorithms. The proposal is centered on the adapting relational operatorsto graph databases. Other graph analytical operators could also be examined.
• Analyze other multidisciplinary domains and datasets to validate the appropriate-ness and �exibility of our solution. The health care domain, for instance, is com-posed of many unstructured and highly connected data and requires interpretationsin many complexity levels, such as patients, drug, diseases, medical treatment pro-tocols.
2www.w3.org/TR/2014/REC-rdf11-concepts-20140225
Chapter 5. Conclusions and Extensions 82
• Improve the integrity rules of PGDM. By de�nition schemaless, graph databasesand data models usually do not support constraints and integrity rules. The factthat is not necessary to �rst create a graph schema and then use it leads to integritybeing frequently forgotten. Investigate this topic would bring more reliability to ourdata model and therefore to our framework, e.g., adding business rules.
• Investigate issues motivated with view materialization, e.g., for performance issues.This would also require conducting research on update propagation, view updata-biliting and refresh mechanisms.
Bibliography
[1] S. Amer-Yahia, L. V. S. Lakshmanan, and C. Yu. Socialscope: Enabling informationdiscovery on social content sites. CoRR, abs/0909.2058, 2009.
[2] P. Amirian, A. Basiri, and A. Winstanley. E�cient online sharing of geospatial bigdata using nosql xml databases. In Proceedings of the 2013 Fourth International
Conference on Computing for Geospatial Research and Application, COMGEO '13,pages 152�, Washington, DC, USA, 2013. IEEE Computer Society.
[3] P. Amirian, A. Basiri, and A. Winstanley. Evaluation of data management systemsfor geospatial big data. In Computational Science and Its Applications - ICCSA
2014, volume 8583 of Lecture Notes in Computer Science, pages 678�690. SpringerInternational Publishing, 2014.
[4] J. C. Anderson, J. Lehnardt, and N. Slater. CouchDB: The De�nitive Guide Time
to Relax. O'Reilly Media, Inc., 1st edition, 2010.
[5] R. Angles. A comparison of current graph database models. In Proceedings of the
2012 IEEE 28th International Conference on Data Engineering Workshops, ICDEW'12, pages 171�177, Washington, DC, USA, 2012. IEEE Computer Society.
[6] R. Angles and C. Gutierrez. Survey of graph database models. ACM Comput. Surv.,40(1):1:1�1:39, February 2008.
[7] M. Ashburner, C. A. Ball, J. A. Blake, D. Botstein, H. Butler, J. M. Cherry, A. P.Davis, K. Dolinski, S. S. Dwight, J. T. Eppig, M. A. Harris, D. P. Hill, L. Issel-Tarver,A. Kasarskis, S. Lewis, J. C. Matese, J. E. Richardson, M. Ringwald, G. M. Rubin,and G. Sherlock. Gene ontology: tool for the uni�cation of biology. the gene ontologyconsortium. Nature Genetics, 25(1):25�29, May 2000.
[8] M. Atkinson, D. DeWitt, D. Maier, F. Bancilhon, K. Dittrich, and S. Zdonik. Theobject-oriented database system manifesto. In François Bancilhon, Claude Delobel,and Paris Kanellakis, editors, Building an Object-oriented Database System, pages1�20. Morgan Kaufmann Publishers Inc., San Francisco, CA, USA, 1992.
[9] P. G. Baker, A. Brass, S. Bechhofer, C. Goble, N. Paton, and R. Stevens. TAMBIS�Transparent Access to Multiple Bioinformatics Information Sources. In Int Conf
Intelligent Systems for Molecular Biology, volume 6, pages 25�34, Montreal, Canada,June 1998.
83
BIBLIOGRAPHY 84
[10] P. Barcelo, C. Hurtado, L. Libkin, and P. Wood. Expressive languages for pathqueries over graph-structured data. In Proceedings of the twenty-ninth ACM
SIGMOD-SIGACT-SIGART symposium on Principles of database systems, PODS'10, pages 3�14, New York, NY, USA, 2010. ACM.
[11] T. Beyhl and H. Giese. E�cient and Scalable Graph View Maintenance for De-ductive Graph Databases based on Generalized Discrimination Networks. TechnicalReport 99, Hasso Plattner Institute at the University of Potsdam, 2015. TechnicalReport No. 99.
[12] C. Bizer. D2rq - treating non-rdf databases as virtual rdf graphs. In In Proceedings
of the 3rd International Semantic Web Conference, 2004.
[13] V. Bonstrom, A. Hinze, and H. Schweppe. Storing rdf as a graph. In Web Congress,
2003. Proceedings. First Latin American, pages 27�36, Nov 2003.
[14] P. Bouquet, M. Ehrig, J. Euzenat, E. Franconi, P. Hitzler, M. Krötzsch, L. Sera�ni,G. Stamou, Y. Sure, and S. Tessaris. Speci�cation of a common framework for char-acterizing alignment. Knowledge Web Deliverable 2.2.1v2, University of Karlsruhe,DEC 2004.
[15] D. M. Boyd and N. B. Ellison. Social network sites: De�nition, history, and scholar-ship. Journal of Computer-Mediated Communication, 13(1):210�230, 2007.
[16] U. Brandes and T. Erlebach. Network Analysis: Methodological Foundations (LNCS).Springer-Verlag New York, Inc., Secaucus, USA, 2005.
[17] Brazil. Lei federal de recursos hídricos (9.433). Diário O�cial [da] República Fed-erativa do Brasil, Poder Executivo, Brasília, 9 jan. 1997. Seção 1, p. 470, january1997.
[18] C.A. Brebbia and V. Popov. Water Resources Management VI. WIT transactionson ecology and the environment. WIT Press, 2011.
[19] D. Calvanese, G. Giacomo, M. Lenzerini, and M. Y. Vardi. Containment of conjunc-tive regular path queries with inverse. In Anthony G. Cohn, Fausto Giunchiglia, andBart Selman, editors, KR, pages 176�185. Morgan Kaufmann, 2000.
[20] D. Calvanese, G. De Giacomo, M. Lenzerini, and M. Y. Vardi. Rewriting of regularexpressions and regular path queries. Journal of Computer and System Sciences,64(3):443 � 465, 2002.
[21] C. Caracciolo, A. Stellato, A. Morshed, G. Johannsen, S. Rajbhandari, Y. Jaques,and J. Keizer. The agrovoc linked dataset. Semantic Web, 4(3):341�348, 2013.
[22] P. Cavoto and A. Santanche. Fishgraph: A network-driven data analysis. In Pro-
ceedings of the 11th IEEE International Conference on eScience, pages 1�10, Munich,Germany, 2015.
BIBLIOGRAPHY 85
[23] F. Chang, J. Dean, S. Ghemawat, W. C. Hsieh, D. A. Wallach, M. Burrows, T. Chan-dra, A. Fikes, and R. E. Gruber. Bigtable: A distributed storage system for struc-tured data. ACM Trans. Comput. Syst., 26(2):4:1�4:26, June 2008.
[24] C.L. Philip Chen and Chun-Yang Zhang. Data-intensive applications, challenges,techniques and technologies: A survey on big data. Information Sciences, 275:314 �347, 2014.
[25] E. F. Codd. Data models in database management. SIGMOD Rec., 11(2):112�114,June 1980.
[26] D. Colazzo and C. Sartiani. Typing query languages for data graphs. I. W. on Graph
Data Management: Techniques and Applications, 2014.
[27] M. P. Consens and A. O. Mendelzon. Low complexity aggregation in graphlog anddatalog. In Proceedings of the third international conference on database theory on
Database theory, ICDT '90, pages 379�394, New York, NY, USA, 1990. Springer-Verlag New York, Inc.
[28] The International Genome Sequencing Consortium. Initial sequencing and analysisof the human genome. Nature, 409(6822):860�921, February 2001.
[29] D. C. Cugler, C. B. Medeiros, and L. F. Toledo. An architecture for retrieval ofanimal sound recordings based on context variables. Concurrency and Computation:
Practice and Experience, pages 1�17, 2011.
[30] R. Cyganiak, D. Wood, and M. Lanthaler. RDF 1.1 concepts and abstract syntax.W3C recommendation, W3C, February 2014. http://www.w3.org/TR/2014/REC-rdf11-concepts-20140225/.
[31] J. Daltio and C. B. Medeiros. Aondê: An ontology web service for interoperabilityacross biodiversity applications. Information Systems, 33(7-8):724�753, 2008.
[32] J. Daltio and C. B. Medeiros. HydroGraph: Exploring Geographic Data in GraphDatabases. In Proc XVI Brazilian Symposium on Geoinformatics, pages 44�55, 2015.
[33] J. Daltio and C. B. Medeiros. Hydrograph: Exploring geographic data in graphdatabases (extended version). Brazilian Journal of Cartography, 68(6):1181�1189,2016.
[34] J. Daltio and C. B. Medeiros. Graph-kaleidoscope: A framework to handle mul-tiple perspectives in graph databases). International Journal of data Science and
Analytics, 2017.
[35] J. Daltio and C. Ba. Medeiros. Handling multiple foci in graph databases. In SpringerInternational Publishing Switzerland, editor, Lecture Notes in Bioinformatics (LNBI)
- Proceedings of 10th International Conference on Data Integration in the Life Sci-
ences, volume 8574, pages 58�65, Lisboa, Portugal, 2014.
BIBLIOGRAPHY 86
[36] V. Dhar. Data science and prediction. Commun. ACM, 56(12):64�73, December2013.
[37] N. Dimiduk and A. Khurana. HBase in action. Manning Publications, 1st edition,2012.
[38] W. Fan, W. Wang, and Y. Wu. Answering Graph Pattern Queries Using Views. InProc. 30th International Conference Data Engineering - ICDE, pages 167�176, 2014.
[39] D. Florescu, A. Levy, and D. Suciu. Query containment for conjunctive queries withregular expressions. In Proceedings of the seventeenth ACM SIGACT-SIGMOD-
SIGART symposium on Principles of database systems, PODS '98, pages 139�148,New York, NY, USA, 1998. ACM.
[40] P. Fox and J. Hendler. Changing the equation on scienti�c data visualization. Science(New York, N.Y.), 331(6018):705�708, February 2011.
[41] B. J. Fry. Computational Information Design. PhD thesis, Massachusetts Instituteof Technology, 2004. AAI0806331.
[42] A. Furtado, K. Sevcik, and C. Santos. Permitting updates through views of databases.Informations Systems, 4:269�283, 1979.
[43] A. Ghrab, O. Romero, S. Skhiri, A. A. Vaisman, and E. Zimányi. Grad: On graphdatabase modeling. CoRR, abs/1602.00503, 2015.
[44] T. Goodwin and S. M. Harabagiu. Automatic generation of a quali�ed medicalknowledge graph and its usage for retrieving patient cohorts from electronic medicalrecords. In Semantic Computing (ICSC), 2013 IEEE Seventh International Confer-
ence on, pages 363�370, 2013.
[45] T. Gruber. Towards Principles for the Design of Ontologies Used for KnowledgeSharing. International Journal of Human-Computer Studies, 43(5-6):907�928, 1995.
[46] N. Guarino. Formal ontology and information systems. In Proceedings of Formal
Ontology in Information System, pages 3�15. IOS Press, 1998.
[47] A. Halevy. Answering Queries using Views: a Survey. The VLDB Journal, 10:270�294, 2001.
[48] S. Harris and A. Seaborne. SPARQL 1.1 query language. W3C recommendation,W3C, March 2013. http://www.w3.org/TR/2013/REC-sparql11-query-20130321/.
[49] J. Hayes and C. Gutierrez. Bipartite Graphs as Intermediate Model for RDF, pages47�61. Springer Berlin Heidelberg, Berlin, Heidelberg, 2004.
[50] R. Hecht and S. Jablonski. Nosql evaluation: A use case oriented survey. In Cloud
and Service Computing (CSC), 2011 International Conference on, pages 336�341,2011.
BIBLIOGRAPHY 87
[51] T. Hey, S. Tansley, and K. Tolle, editors. The Fourth Paradigm: Data-Intensive
Scienti�c Discovery. Microsoft Research, Redmond, Washington, 2009.
[52] I. Horrocks. Ontologies and the semantic web. Commun. ACM, 51(12):58�67, 2008.
[53] H. V. Jagadish, J. Gehrke, A. Labrinidis, Y. Papakonstantinou, J. M. Patel, R. Ra-makrishnan, and C. Shahabi. Big data and its technical challenges. Commun. ACM,57(7):86�94, July 2014.
[54] F. Jouault and J. Bézivin. KM3: A DSL for Metamodel Speci�cation, pages 171�185.Springer Berlin Heidelberg, Berlin, Heidelberg, 2006.
[55] P. Kivikangas and M. Ishizuka. Improving semantic queries by utilizing unl ontologyand a graph database. In Semantic Computing (ICSC), 2012 IEEE Sixth Interna-
tional Conference on, pages 83�86, Sept 2012.
[56] H. Kunii. Graph data language : a high level access-path oriented language. PhDthesis, University of Texas at Austin, 1983.
[57] M. Levene and G. Loizou. A graph-based data model and its rami�cations. IEEE
Trans. Knowl. Data Eng., 7(5):809�823, 1995.
[58] M. Levene and A. Poulovassilis. The hypernode model and its associated querylanguage. In Proceedings of the �fth Jerusalem conference on Information technology,JCIT, pages 520�530, Los Alamitos, CA, USA, 1990. IEEE Computer Society Press.
[59] L. Libkin and D. Vrgo£. Regular path queries on graphs with data. In Proceedings of
the 15th International Conference on Database Theory, ICDT '12, pages 74�85, NewYork, NY, USA, 2012. ACM.
[60] J. S. C. Longo and C. B. Medeiros. Providing multi-scale consistency for multi-scalegeospatial data. In Proceedings of the 25th International Conference on Scienti�c
and Statistical Database Management, SSDBM, pages 8:1�8:12, New York, NY, USA,2013. ACM.
[61] A. Lysenko, I. A. Roznov �, M. Saqi, A. Mazein, C. J. Rawlings, and C. Au�ray.Representing and querying disease networks using graph databases. BioData Mining,9(1):23, 2016.
[62] M. S. Martin, C. Gutierrez, and P. T. Wood. Snql: A social networks query andtransformation language. In Pablo Barceló and Val Tannen, editors, AMW, volume749 of CEUR Workshop Proceedings. CEUR-WS.org, 2011.
[63] R. C. McColl, D. Ediger, J. Poovey, D. Campbell, and D. A. Bader. A performanceevaluation of open source graph databases. In Proceedings of the First Workshop on
Parallel Programming for Analytics Applications, PPAA '14, pages 11�18, New York,NY, USA, 2014. ACM.
BIBLIOGRAPHY 88
[64] C. B. Medeiros, M. J. Bellosta, and G. Jomier. Multiversion Views: ConstructingViews in a Multiversion Database. Data & Knowledge Engineering, 33:277�306, 2000.
[65] N. F. Noy and M. A. Musen. Specifying ontology views by traversal. In International
Semantic Web Conference, volume 3298 of LNCS, pages 713�725, 2004.
[66] B. Olivier, S. Cohen-Boulakia, S. Davidson, and C. Hara. Querying and Manag-ing Provenance through User Views in Scienti�c Work�ows. In Proc. International
Conference Data Engineering - ICDE. IEEE, 2008.
[67] C. Parent, S. Spaccapietra, and E. Zimányi. Conceptual Modeling for Traditional
and Spatio-Temporal Applications: The MADS Approach. Springer-Verlag New York,Inc., Secaucus, NJ, USA, 2006.
[68] Y. Park, M. Shankar, B. Park, and J. Ghosh. Graph databases for large-scale health-care systems: A framework for e�cient data management and data services. I. W.
on Graph Data Management: Techniques and Applications, 2014.
[69] O. Pfafstetter. Classi�cação de bacias hidrográ�cas: metodologia de codi�cação.Departamento Nacional de Obras de Saneamento (DNOS). Rio de Janeiro, RJ, 1989.
[70] A. Poulovassilis and M. Levene. A nested-graph model for the representation andmanipulation of complex objects. ACM Trans. Inf. Syst., 12(1):35�68, January 1994.
[71] I. Robinson, J. Webber, and E. Eifrem. Graph Databases. O'Reilly Media, Incorpo-rated, 2013.
[72] M. A. Rodriguez and P. Neubauer. Constructions from dots and lines. Bulletin of
the American Society for Information Science and Technology, 36(6):35�41, 8 2010.
[73] A. Santanche, J. Longo, G. Jomier, M. Zam, and C. B. Medeiros. Multi-focus researchand geospatial data - Anthropocentric concerns. JIDM, 5(2):146�160, 2014.
[74] A. Santanche, C. B. Medeiros, J. Jomier, and M. Zam. Challenges of the Anthro-pocene epoch - Supporting multi-focus research. In Proc XIII Brazilian Symposium
on Geoinformatics, 2012.
[75] A. Silberschatz, H. F. Korth, and S. Sudarshan. Data models. ACM Computing
Surveys, 28(1):105�108, March 1996.
[76] S. Spaccapietra, C. Parent, and C. Vangenot. Gis databases: From multiscale tomultirepresentation. In Proceedings of the 4th International Symposium on Abstrac-
tion, Reformulation, and Approximation, SARA '02, pages 57�70, London, UK, UK,2000. Springer-Verlag.
[77] M. Stonebraker. Sql databases v. nosql databases. Commun. ACM, 53(4):10�11,April 2010.
BIBLIOGRAPHY 89
[78] R. Sumbaly, J. Kreps, L. Gao, A. Feinberg, C. Soman, and S. Shah. Servinglarge-scale batch computed data with project voldemort. In Proceedings of the 10th
USENIX conference on File and Storage Technologies, FAST'12, pages 18�18, Berke-ley, CA, USA, 2012. USENIX Association.
[79] A. A. Teixeira, A. M. Silva, G. S. F. Molleri, F. V. Ferreira, and A. J. Borelli. Pghydro- hydrographic objects in geographical database (in portugueses). In Proceedings of
the 2013 Brazilian Symposium on Water Resources, pages 1�8, 2013.
[80] C. Vicknair, M. Macias, Z. Zhao, X. Nan, Y. Chen, and D. Wilkins. A comparisonof a graph database and a relational database: A data provenance perspective. InProceedings of the 48th Annual Southeast Regional Conference, ACM SE '10, pages42:1�42:6, New York, NY, USA, 2010. ACM.
[81] R. Volz, D. Oberle, and R. Studer. Implementing Views for Light-Weight WebOntologies. In Proc. of Int. Database Engineering and Application Symposium -
IDEAS, Hong Kong, China, 07 2003.
[82] F. Y. Wang, K. M. Carley, D. Zeng, and W. Mao. Social computing: From socialinformatics to social intelligence. IEEE Intelligent Systems, 22(2):79�83, March 2007.
[83] J. Webber. A programmatic introduction to neo4j. In Proceedings of the 3rd an-
nual conference on Systems, programming, and applications: software for humanity,SPLASH '12, pages 217�218, New York, NY, USA, 2012. ACM.
[84] P. T. Wood. Query languages for graph databases. SIGMOD Rec., 41(1):50�60, April2012.
[85] S. Zhou and C. B. Jones. A multi-representation spatial data model. In I. S. on
Advances in Spatial and Temporal DBs, volume 2750 of LNCS, pages 394�411, 2003.