Embed Size (px)
Citation preview
Gest. Prod., São Carlos http://dx.doi.org/10.1590/0104-530X2222-15
Resumo: Com o grande número de empresas certificadas na norma ISO 9001, cresce a demanda por métodos de mensuração e evolução da Maturidade dos Sistemas de Gestão da Qualidade (SGQs). O presente trabalho teve por objetivo identificar quais são os construtos e os principais pontos de transição na Maturidade de SGQs por meio de uma investigação empírica utilizando análise fatorial e análise de cluster. A coleta de dados foi realizada a partir de pesquisa tipo survey com a participação de 179 empresas de diversos portes, segmentos e estados brasileiros que demonstram que, além daqueles construtos identificados na literatura, identificou-se a presença de um novo, a “Agilidade e Integração por Meio da Tecnologia da Informação”. Os construtos, bem como os pontos de transição identificados por análise de cluster podem ser úteis para gestores e pesquisadores interessados na temática de gestão e maturidade de processos, ainda que estes sistemas sejam tão difundidos na indústria. Especificamente, para profissionais, consultores e gerentes, este estudo pode ser útil, de modo a orientar seus esforços por melhores resultados de desempenho nas operações em suas empresas.Palavras-chave: ISO 9001; Sistemas de gestão da qualidade; Gestão de processos.
Abstract: The demand for measurement and evolution methods of Quality Management System (QMS) Maturity has grown due to the great number of companies certified at ISO 9001. This paper aimed to identify the constructs and key transition points in the Maturity of QMSs through an empirical research using factorial and cluster analyses. Data was collected from a sample composed of 179 Brazilian companies of several sizes, segments and geographical positions. In addition to the constructs found in the literature, the empirical results identified a new construct - “Agility and Integration by Information Technology”. Although QMSs are widespread in industry, the identification of constructs and their transition points by cluster analysis can be useful to managers and researchers interested in the maturity management process. This study can be especially useful to guide the efforts of experts, consultants and managers in increasing company operational performance.Keywords: ISO 9001; Quality management systems; Process management.
Key transition points: the climbing to Quality Management System maturity
Pontos de transição: a escalada rumo à maturidade de Sistemas de Gestão da Qualidade
Adelson Pereira do Nascimento1* Marcos Paulo Valadares de Oliveira2
Marcelo Bronzo Ladeira3
Hélio Zanquetto Filho4
1 Instituto Federal do Espírito Santo – IFES, Universidade Federal do Espírito Santo – UFES, Rodovia ES-010, Km 6,5, Manguinhos, CEP 29173-087, Serra, ES, Brazil, e-mail: [email protected]
2 Universidade Federal do Espírito Santo – UFES, Av. Fernando Ferrari, 514, Goiabeiras, CEP 29075-910, Vitória, ES, Brazil, e-mail: [email protected]
3 Universidade Federal de Minas Gerais – UFMG, Rua Curitiba, 832, 6 andar, Centro, CEP 30170-120, Belo Horizonte, MG, Brazil, e-mail: [email protected]
4 Universidade Federal do Espírito Santo – UFES, Av. Fernando Ferrari, 514, Goiabeiras, CEP 29075-910, Vitória, ES, Brazil, e-mail: [email protected]
Received Apr. 16, 2015 - Accepted Nov. 26, 2015Financial support: None.
1 IntroductionAlthough it is possible to find in the literature
several contributions on quality maturity and its approaches, the related literature over the design and operationalization of measurement instruments for Quality Management Systems (QMS) Maturity are still scarce. Purushothama (2010) points out that at
the beginning of the 1990s the implementation of a quality management programs, that achieved ISO 9001 certification in a company had been considered a great achievement. Nowadays at the current market, the ISO 9001 implementation and certification has been seen as enablers or basic requirements for an

Nascimento, A. P. et al.2 Gest. Prod., São Carlos
organization to be competitive. While there has been more than one million certified companies, it has become difficult to differentiate them and the consumers have been facing difficulties to identify suppliers which may have mature processes beyond certification (Rosnah et al., 2010). This paper has the ambitions to contribute for the development of a reference model that allows the systematic measurement for companies´ quality management system’s maturity level.
The maturity models has begun with the Quality Management Maturity grid, also known as the Crosby’s Maturity Grid (Crosby, 1979), which purpose would have been to create an evaluation methodology or gauge for the maturity degree in the management of several quality processes. This model is considered the predecessor of current models by its generic and intrinsic nature of maturity (Oliveira, 2009; Silveira, 2009), and guided to many emergency tools for assessing the quality management practices maturity.
While maturity is formally defined as “complete state of development” (Merriam-Webster, 2013), the literature allows synthesize the concept of maturity into three perspectives:
- Maturation time - Development of an initial state to a more advanced stage over the years. Here it is implied the temporal notion or aging (Souza & Voss, 2001; Fraser et al., 2002);
- Capability - Complete development or perfect condition of any process or activity (Urdang & Flexner, 1968) thus ensuring their inclusion into a cycle of continuous improvement;
- Evolution - Lahti et al. (2009), argue that the concept of maturity in processes is related to the evolutionary concept, combining the environment adaptation and the good practices adoption o.
Those different maturity definitions complement each other and denote the use of metrics that drive organizational change from an early stage to a more advanced one, usually established into a maturity model. Maturity models have been used as tools for improvement, describing the evolution process stages or levels, allowing them to be clearly defined, managed, and monitored over time. For each level of maturity it is provided a text description, listing the performance characteristics with greater complexity at each level. Silveira (2009) points out that these models show a gradual development of logical training path in managerial processes, in which the important thing is not to define at what
level a particular company is, but what must be done to ensure the continuity of its development and the controlled continuous improvement of its processes.
The main objective of a maturity model is to describe the typical behavior exhibited by an organization on a number of levels or degrees from a consolidation established practices for each criterion under study, encoding which could be considered as good practice, and ways to transition from one level to another. Thus, maturity models enable managers to identify a logical and progressive path for organizational development (Silveira, 2009).
Given this context involving issues arising from the business and conceptual practice, this paper will present the identified constructs and key transition points in Quality Management Maturity, using cluster analysis. In order to evaluate the conceptual and empirical validity of the adopted model, it has used the psychometric method (Nunnally, 1978) in which includes literature review, variables and associated constructs identification. In addition, for the scales selection, the collected data validation and statistical tests to empirical survey research had been conducted.
The collected data have been conducted by organizations certified by PRODFOR - Integrated Program for Development and Suppliers Qualification. The program is maintained by FINDES - Federation of Espírito Santo Industries and with the participation of large companies as sponsors of PRODFOR and 296 suppliers spread through Espírito Santo, Bahia, Minas Gerais, Rio de Janeiro and São Paulo states, in which QMS’s are certified based on ISO 9001 requirements (Prodfor, 2011).
The paper is organized as follows. Section 2 presents a summary of the main results for Quality Systems maturity and explains how the model had been developed from the theoretical framework. Section 3 presents the methodological procedures adopted and section 4 shows the analysis performed on data from 179 participants on the proposed model. Finally, section 5 presents the final considerations on this work and recommendations for future work.
2 Literature reviewThe maturity of a quality management program
can be interpreted in several ways: Souza & Voss (2001) established that the maturity occurs based on the quality management system implementation and certification years, while Patti et al. (2001) and Fok et al. (2003) argue that maturity is related to the best used practices and cannot be assessed based only on quantitative aspects. Furthermore, the maturity

Key transition points… 3
of quality management can also be measured by the use of a perceived quality and the effectiveness and the process management efficiency (Grandzol & Gershon, 1998; Rosnah et al., 2010).
In the early stages of empirical research on Quality Management area, it had been created instruments capable of measuring the management practices and its performance through constructs (Saraph et al., 1989; Flynn et al., 1994; Ahire et al., 1996). These constructs are present in the structures used in the Quality National Awards such as the Malcolm Baldridge and the European Quality Award (Souza & Voss, 2001; Nair, 2005).
The literature review has indicated that the studies differ in terms of the quality management construct design. Some studies define it as a multidimensional construct (Saraph et al., 1989; Flynn et al., 1994; Mohrman et al., 1995; Ahire et al., 1996; Grandzol & Gershon, 1998; Forza & Flippini, 1998; Rungtusanatham, 1998; Dow et al., 1999; Samson & Terziovski, 1999; Wilson & Collier, 2000; Douglas & Judge, 2001; Kaynak, 2003; Singh & Smith, 2006; Dellana & Kros, 2014), while others define quality management as a first-order construct composed by only one dimension (Hendricks & Singhal, 1997, 1997; Choi & Eboch, 1998; Douglas & Judge, 2001; Kenyon & Sen, 2015).
Singh & Smith (2006) recommend an effort to not “reinvent the wheel” in order to improve existing instruments. This recommendation has been taken into account while preparing the instrument for collecting data, resulting from the relevant instruments limitations in the literature and recommendation characteristics evaluation (Chart 1). Such data collection tool subsequently served as the basis for the development of the conceptual model to evaluate the maturity of Quality Management Systems.
The first instrument to recognize maturity as a higher-order construct consisting from first order constructs for quality management practices measuring within organizations had been proposed by Saraph et al. (1989), who developed a form in order to measure the quality management by evaluating the reliability. These authors evaluated the managers perception in eight first-order constructs, based on the definitions of so-called “quality gurus” as Juran, Crosby, Ishikawa and Deming. Stand out in this study the external validity of the instrument and the inclusion of several manufacturing companies and various industries services.
Subsequently, Flynn et al. (1994) present a proposal for the evolution of Saraph et al instrument. Incorporating American and Japanese quality practices management, this time submitting the survey also at the operational level, because the authors believed that quality management is maintained
by this level. The questionnaire provided separate issues for direct employees, plant manager, quality manager, production manager, supervisors, process engineers, human resource managers and operational area employees. The instrument has been applied to 42 US industries, transport components, electronics and machinery, totaling 716 respondents.
Ahire et al. (1996) analyzed the instruments devised by Flynn et al. (1994) groups, proposing a questionnaire focused on the operational level, incorporating constructs Malcolm Baldridge Award based on the (United States). This questionnaire had been tested on a sample of 371 companies in the automotive parts field using, according to the authors, valid statistic techniques which were “more comprehensive and extensive”. These authors suggested future work using combined models, in order to minimize for just a vision quality and its application to management and operational levels, into identifying the quality status in a systemic way of the studied organizations.
Grandzol & Gershon (1998) conducted another relevant quantitative study found in the literature, which evaluated 273 companies from the American naval and aeronautical industries. In this research, the proposed instrument had been based on Deming (1982) studies and pointed out important actions to prevent failures in the TQM implementation. These authors separated the identified constructs in endogenous (results - based on Brown et al. (1993). studies.) and exogenous (quality management practices - based on Deming’s studies).
Later, Singh & Smith (2006) contributed to the QMS’s maturity themes evolution and organizational performance, summarizing the previous approach, and proposing an instrument composed of quality management items, performance and business environment. This study addressed 418 manufacturing companies from Australia. The instrument had been developed based on three quality management approaches (standards, quality awards and distinguished scholars).
The methodology used by Singh & Smith (2006) to assess the constructs had been considered robust (it was the first to use structural equation modeling) and the authors concluded that among the 13 identified constructs, those which were related to National Quality Award and standards approaches have been better established than those related to the elementary approach (“quality gurus”). As criticism to this model, it has been observed that the formulation of the quality maturity construct, Singh & Smith (2006) used as a reference, the ISO 9001 management requirements, which according to JIS 9005 (JIS, 2005) would only basis the management quality for certified companies. In practice, if companies do not meet

Nascimento, A. P. et al.4 Gest. Prod., São Carlos
Chart 1. Assessment of relevant instruments in quality management measurement through constructs. Source: Authors based on Singh & Smith (2006).
Instrument Saraph et al.(1989)
Flynn et al. (1994)
Ahire et al. (1996)
Grandzol & Gershon (1998)
Singh & Smith (2006)
Domain
Quality management prescribed
by gurus and prominent academics.
Quality management
as part of World Class
Manufacturing (American
and Japanese practices)
Quality Management
Malcolm Baldridge award
assessed by
Quality Management
implementation prescribed
by gurus and prominent academics.
Quality Management
and Performance
with reference to ISO 9001,
Quality Awards and prominent
academics.
Population (number)
Companies in Minneapolis / St. Paul - USA (20)
Japanese and American
companies - Production of
machinery, electronics and transportation
(45)
Automotive industry - USA
(1002)
Shipbuilding and aeronautics -
USA (581)
Australian Industry
Certified (1053)
Sample (% response)
162 respondents (35%)
716 respondents (60%)
371 respondents (37%)
273 respondents (47%)
418 respondents (42%)
RespondentsGeneral
managers and quality managers
Managers, supervisors and operational level
Plant managers CEO
Managers and representatives
of the High direction
Scale 5-point Likert 5-point Likert 7-point Likert 6-point Likert 5-point LikertPretest? Yeah Yes - Pre-
test and pilot combined
Yes - Pre-test and pilot combined
Yeah Yeah
Pilot test? No Yes Yes
Pilot test data analysis Not applicable Qualitative
improvementsQualitative
improvements
Validity and reliability analysis
Validity and reliability analysis
Validation contentLiterature search
and expert review
Wide review of the literature
Wide review of the literature
Literature search and expert
review
Search content and expert
review
Reliability analysis Cronbach’s Αlfa
Cronbach’s Αlfa and
intercorrelation of items
Cronbach’s Αlfa coefficient and deWerts-Linn-
Jorsekog
Cronbach’s Αlfa Cronbach’s Αlfa
Strong points
It includes in its sample
manufacturing companies and various industries services.
Managerial and operational
participation
Used techniques most comprehensive and extensive
validation statistics.
Assesses the maturity and the relationship with
Performance
Uses multiple approaches to the instrument construction.
Recommendations of the authors /
Limitations
Observed only managerial perspective
No correlation was made
between items.
It uses only premium-based
approach. Recommendation of the combined use of models to extend the
quality of vision.
Participation of senior
management only
Use of ISO 9001 as a reference. According to JIS 9005 (JIS, 2005) would be
only the basis of quality
management.

Key transition points… 5
these requirements may receive non-conformities classified as, critical (higher grade) or even lose certification. To certified companies maturity, it is necessary to consider additional requirements that demonstrate the evolution of QMS’s.
Singh & Smith (2006) believe that the evaluation of the relationship between quality management and organizational performance should follow three dominant approaches: standards-based, Quality awards and conceptual. Based on this guidance, the literature review enabled various approaches recognition to identify maturity indicators in quality management programs that were structured into three distinct classes: Maturity Models, National Quality Awards and Standards (Chart 2).
2.1 The Crosby maturity Grid
In the model proposed by Crosby (1979) are defined five successive phases for quality maturation: uncertainty, awakening, enlightenment, wisdom and certainty. In the first stage, the cost of quality is about 20 percent of sales and administration has no understanding of quality as a management tool. The intermediate stages are characterized by a transformation in the understanding of management and attitude to quality, as quality appears within the organization, such as organizational issues are treated, the cost of quality as a percentage of sales, quality improvement actions taken by management, as well as a summary of the organization’s management quality problems. In the final step, as estimated by
Chart 2. Classification proposal to maturity approaches.
Class Approaches Short description Authors
Maturity models
- Crosby’s Quality Management Maturity;
- Maturity continuous improvement Bressant, Caffyn and Gallagher;
- Erasmus University (Netherlands);- Montgomery control model;- CMM-Capability Maturity Model;- Documentation Process Maturity;- Human Factors Integration
Capability Maturity Model;- SCPM3 (Supply Chain Process
Management Maturity Model);- OPM3 (Organizational Project
Management Maturity Model);- PMMM (Project Management
Maturity Model);- MMGP (Maturity Model Project
Management).
They use the concept of Maturity. Although the models differ in many ways, all of them are composed of:- Setting the number of levels to reach
maturity;- A name for each level;- A summary of features and an
indication of what the organization should focus on each at each level;
- A method for determining the positioning of the organization within the model.
- Most models presents a range of maturity going 3-6 levels and are distinguished by the method used to determine the result of the maturity levels, evaluated dimensions and content of each level.
Bessant et al. (2001) Crosby (1979)Garrett & Rendon, (2005) Lockamy & McCormack (2004McCormack et al. (2009) Oliveira (2009)PMI (2003)
National Quality Awards
- Deming Prize (Japan);- Award Malcolm Baldrige National
Quality Award (USA);- National Quality Award (PNQ -
Brazil);- European Foundation Quality
Management (EFQ - European Community)
- German National Quality Award (German Society for Quality - Germany)
Based on criteria and evidence used to assess an organization and refer to management excellence. Set parameters, which reflect excellence:- Leadership, people, policy and
strategy, partnerships and resources, processes, human resources, information analysis, market focus and customer, results for people, for clients, for society and for business.
Bemowski (1996)EFQM (2006)FNQ (2011)Wilson & Collier (2000).
Standards
- ISO 9004 - Managing for the sustained success of an organization - A quality management approach (2010);
- JIS Q 9005 - Quality Management System - guidelines for sustainable growth (2005);
These standards provide guidance to organizations for the achievement of sustained success by a quality management approach - an evolution of the model prescribed by ISO 9001 - are applicable to any organization, regardless of size, type and activity.
ABNT (2010)JIS (2005)Moura (2009)
Source: elaborated by the authors.

Nascimento, A. P. et al.6 Gest. Prod., São Carlos
Crosby (1979), the cost of quality falls to about 2.5% and quality management is considered as an essential part of the organization. According to the author’s estimates, an organization could reduce their quality from 20% of sales for the ideal of 2.5% within five years.
The Crosby’s Grid considers the use of the 14-step Quality Improvement Program:
Step 1: Management Commitment; Step 2: Quality Improvement along the company; Step 3: Quality Measurement and monitoring; Step 4: Quality Cost Evaluation; Step 5: Quality Awareness; Step 6: Corrective Action for Process; Step 7: Establish an Ad Hoc Committee for the Zero Defects Program; Step 8: Supervisor Training Step 9: Zero Defects Day; Step 10: Goal Setting ; Step 11: Error Cause Removal; Step 12: Recognition ; Step 13: Quality Councils; Step 14: Do It Over Again
According to Fraser et al. (2002), the maturity measurement proposed by Crosby can be used as an internal metric, helping the company to identify gaps in their processes, formulate actions to mitigate their limitations and articulate performance comparisons between companies (benchmarking) and may offer even, the following advantages: The monitoring of organizational performance and its alignment with the business strategy; The availability of reliable parameters which can be used to compare similar companies and their different sectors; The identification of critical aspects detrimental to performance, (threats and weaknesses of their processes and operations); The consistently orientation on processes developments in order to be documented, measured, and controlled the continuously improveing; The reduction of rework and costs, for directing the action priorities and management; Non-financial dimensions of the introduction and consolidation as competitive criteria such as customer and employee satisfaction, vendor performance, innovation and intellectual capital of the company, among others.
The Crosby Grid (Crosby, 1979) has been selected for the questions composition about the maturity to be considered in reference maturity approaches and represent the temporal maturity perspective.
2.2 The National Quality Award (PNQ)The National Quality Awards have been widely
disseminated worldwide through the TQM practices. These awards aim to disseminate successful management practices and are used to stimulate the development of corporate culture, giving public recognition to organizations that demonstrate results comparable to world class (FNQ, 2011). These awards have a peculiar structure and resemble much due to the
fact that they inspired each other with differences in the primary focus, or as to the scope.
Currently, the best known National Quality Awards are the Deming (established in Japan in 1951), Malcolm Baldrige Award (created in the US in 1987) and the European Quality Award (created in 1991). In Brazil, the National Quality Award (PNQ) is fairly disclosed. For this work, the Brazilian model was taken into account when considering your criteria presented updated than the other when it made the literature. Considered an instrument to encourage improvements in the quality management and increase organizations competitiveness, the PNQ has its awards methodology based on Malcolm Baldrige National Quality Award American, which originally was based on the Deming Japanese Prize.
Established in 1991 by the National Quality Foundation (FNQ), the PNQ recognizes the results achieved by companies that have implemented an ongoing program of improvement in pursuit of excellence in management from the use of the Management Excellence Model - MEG (FNQ, 2011). The PNQ is founded on principles that shape the Management Model Excellence (MEG), which adopts internationally recognized concepts and that are found in World Class leading organizations (FNQ, 2011).
The grounds of the Management Model Excellence (FNQ, 2011):
1. Systemic Thinking;
2. Organizational Learning;
3. Innovation Culture;
4. Leadership and Constancy Purpose
5. Guidance by information and processes;
6. Future Vision;
7. Value Creation;
8. Valuing People;
9. Customer and Market Knowledge;
10. Partnership Development; and
11. Social Responsibility.
2.3 Standard JIS Q 2005 - Quality Management System - guidelines for sustainable growth
The standards for excellence have in common the based requirements determination, continuous improvement cycle, known as PDCA cycle (Deming, 1982), and are not specific to a sector or organization. From a basic prescribed model, each organization sets

Key transition points… 7
its own specific management system, which depends on the business nature, the market in which it operates, the particular forms of its internal organizatio, among other factors. One of these standards is the Quality Management System - guidelines for sustainable growth, model developed in Japan by the Japanese Industrial Standards (JIS, 2005) which provides for the systematic quality management for an even more comprehensively way, from the concept of a sustainable growth.
For the JIS Q 9005, an organization of excellence is one that adapts to any changes in the business environment and is endowed with the ability to innovate using technological resources as the necessary basis for learning, and ability to recognize changes and needs of the external business environment. This standard has been selected due to the innovative aspect and tradition of the deployment of Japanese concepts in quality. According to JIS Q 9005, the quality is supported by the adoption of 12 principles:
1. Creating value for the customer
2. Focus on value
3. Visionary leadership
4. Understanding of key skills
5. Involvement of people
6. Collaboration with partners
7. Total Optimization
8. Process approach
9. Factual Approach
10. Organizational Learning
11. Agility
12. Autonomy
3 Methodological proceduresThe study’s analysis units were composed by
a group of 296 companies certified on ISO 9001 requirements (ABNT, 2008) participants from the PRODFOR program (intentional sample). The Suppliers filled a survey from an available electronically questionnaire. Within 13 weeks the questionnaire responses were received from 179 suppliers, totaling 60.5% of the study population. Thus, the minimum requirement statistical sample of 133 respondents was fully met.
For the survey preparation, it has been considered the Ahire et al. (1996) and Singh & Smith (2006) recommendations, who advised the use of combined approaches to assess the maturity of Quality
Management Systems. So it has been selected the references for each class (Maturity Models, National Awards for Quality and Standards). This selection offered the advantage of ensuring that all important aspects of maturity and the quality management system’s performance were evaluated, and allowed that current issues were presents in the survey. The approaches selected were:
• The Crosby Grid Maturity (Crosby, 1979) - linked to the concept of maturation time;
• National Quality Award - PNQ (FNQ, 2011) - linked to the concept of Capability; and
• The Standard JIS Q 9005 - Quality Management System guidelines for sustainable growth (JIS, 2005) - linked to the concept of Evolution.
These approaches have been used, by being devised exclusively for quality. While the Crosby’s grid presents the traditional view of so-called quality gurus and is related to the concept of maturity, the national award presents a comprehensive proposal and brings with it the notion of excellence and capability. Finally, the JIS standard inserts new concepts such as innovation, learning and sustainability, which are related to the evolutionary maturity approach. Following are the main features of each selected approach.
The literature review allowed the identification and understanding of the variables that demonstrate the maturity of the QMS adopting three distinct classes (maturity models, national and Standards Awards). For each class was selected an approach and the whole was assessed by structural analysis. This technique is a search methodology used to describe and interpreted a class of documents and text, through the analysis of the set of small units, forming a larger structure.
Given the general aim of this research were listed various constituent elements of the QMS Maturity’s for the questionnaire preparation. Reading every perspective - the time, the capability and evolutionist, allowed the delimitation of the construct “Quality Management Systems Maturity”, so that the assessment of commonalities and distinct from the theoretical approach resulted in 66 matters relating to maturity. The questionnaire was submitted to a group of five experienced auditors in the implementation and evaluation of QMS’s (auditors leaders with graduate degrees in the areas of quality management, Production Engineering and Project Management) and two doctors, noting if it had three important elements in its construction: reliability, validity and operability. This analysis allowed eliminate overlapping themes, resulting in the definition of 27 questions, all with
Nascimento, A. P. et al.8 Gest. Prod., São Carlos
Likert scale of 5 points, similar to surveys used as a reference. Complementarily were prepared five questions that could help the sectoral analysis and the results classification, totaling 32 questions to be answered by the suppliers.
For the questionnaires validation it has been carried out a pilot test in order to check the understanding by the respondents and ensure the quality of it on the form and structure so that it would reduce the problems. Were available Electronically 50 questionnaires, and 30 responders replies (60%). As a complement, we contacted five respondents to assess in more detailed way, the possible difficulties to answer the questionnaire, and they all said that the questionnaire was easy understanding. Aiming to assess the understanding of the questionnaire, this step allowed us to estimate the standard deviation of the study population, as this value was unknown.
According to Barnett (1991), when the population standard deviation is unknown, one of the alternatives to adopt is to replace it with a sample standard deviation of a pilot study of a preliminary sample. For the sample size setting, a sampling error of 5% was established for a security level of 95% (Z = 1.96), and is considered the standard deviation of 15.64 obtained in the pilot test. The value of the sample obtained by using Barnett (1991) formula, it had a minimum result for the above-defined patterns, the total of 133 respondents (45% of the population) for the survey application. The pilot also enabled analysis of the questionnaire reliability through alpha
Cronbach, which can vary from 0 to 1, in which 1 demonstrates presence of internal consistency of 100% and zero means complete lack of consistency among the items (Hayes, 2001). The reliability value of 0.940 validated the questionnaire, indicating that it is likely the discovery of relationships between variables.
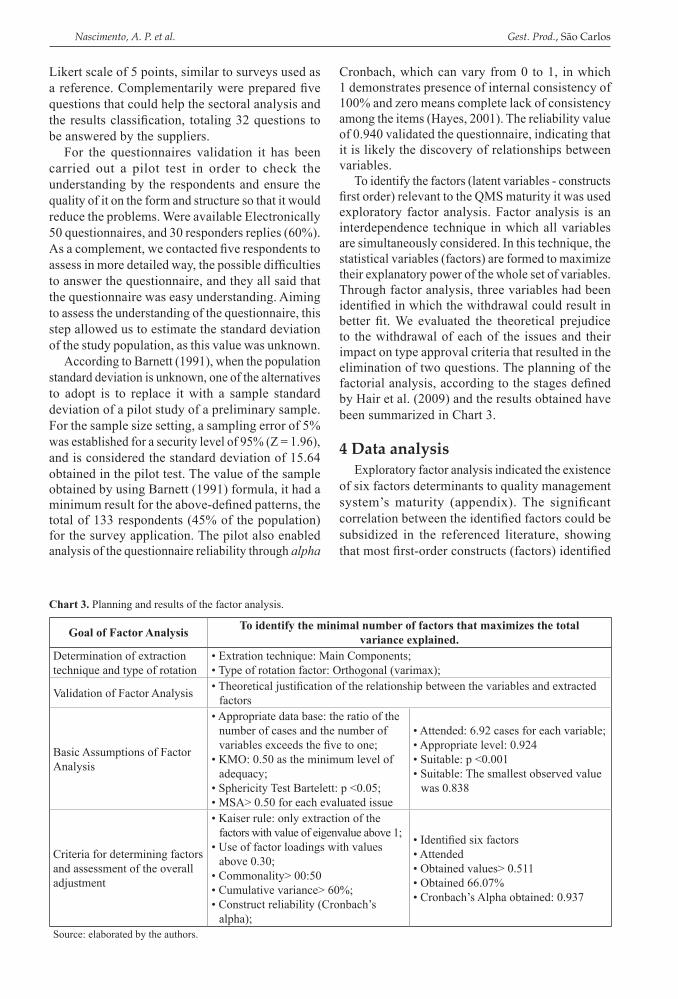
To identify the factors (latent variables - constructs first order) relevant to the QMS maturity it was used exploratory factor analysis. Factor analysis is an interdependence technique in which all variables are simultaneously considered. In this technique, the statistical variables (factors) are formed to maximize their explanatory power of the whole set of variables. Through factor analysis, three variables had been identified in which the withdrawal could result in better fit. We evaluated the theoretical prejudice to the withdrawal of each of the issues and their impact on type approval criteria that resulted in the elimination of two questions. The planning of the factorial analysis, according to the stages defined by Hair et al. (2009) and the results obtained have been summarized in Chart 3.
4 Data analysisExploratory factor analysis indicated the existence
of six factors determinants to quality management system’s maturity (appendix). The significant correlation between the identified factors could be subsidized in the referenced literature, showing that most first-order constructs (factors) identified
Chart 3. Planning and results of the factor analysis.
Goal of Factor Analysis To identify the minimal number of factors that maximizes the total variance explained.
Determination of extraction technique and type of rotation
• Extration technique: Main Components;• Type of rotation factor: Orthogonal (varimax);
Validation of Factor Analysis • Theoretical justification of the relationship between the variables and extracted factors
Basic Assumptions of Factor Analysis
• Appropriate data base: the ratio of the number of cases and the number of variables exceeds the five to one;
• KMO: 0.50 as the minimum level of adequacy;
• Sphericity Test Bartelett: p <0.05;• MSA> 0.50 for each evaluated issue
• Attended: 6.92 cases for each variable;• Appropriate level: 0.924• Suitable: p <0.001• Suitable: The smallest observed value
was 0.838
Criteria for determining factors and assessment of the overall adjustment
• Kaiser rule: only extraction of the factors with value of eigenvalue above 1;
• Use of factor loadings with values above 0.30;
• Commonality> 00:50• Cumulative variance> 60%;• Construct reliability (Cronbach’s
alpha);
• Identified six factors• Attended• Obtained values> 0.511• Obtained 66.07%• Cronbach’s Alpha obtained: 0.937
Source: elaborated by the authors.

Key transition points… 9
are consistent with the literature, we (Crosby, 1979; JIS, 2005; FNQ, 2011). The names of the following factors were held down by the authors of this study from the delimitation of the constructs and empirical results.
Factor 1 (loading factor 0.424): “Leadership and Communication” demonstrates the interdisciplinary context of the exercise of leadership, which includes effective forms of communication and sets labor standards that motivate the search results. The first four variables that have the highest factor loadings show that the support of senior management and the broad discussion of plans between leaders and other employees are key to the diffusion of indicators and understanding the role of each employee to the achievement of company goals.
Factor 2 (loading factor 0.179), “Agility and Integration by Information Technology”, demonstrated innovative dimensions that favor the quality management system’s maturity. It is the intensive use of information technology as means of integration between suppliers and customers and as means to prevent a problem recurrence. It is emphasized here that these are variables that have not been identified in previous research and refers the need for reflection and its insertion in this new conceptual contribution.
Factor 3 (loading factor 0.157): The “Efficient Management Processes” is directly related to value creation in the organization’s processes. It is understood that the optimization in processes can be developed with the active participation of customers and suppliers, leading to significant changes in the attitudes of all employees, which leads to the promotion of safety and the reduction of pollution sources.
Factor 4 (loading factor 0.239): The “Valuing of employees” is seen traditionally as one of the quality management pillars. This construct was designed based on participation, appreciation and encouragement to goals achievement. In this construct the factual approach to decision making
is also seen as means of evaluation and stimulation to achieve results.
Factor 5 (loading factor 0.099): “information availability” shows that the correct understanding of the customer’s needs and the availability of such information to employees have marked importance in the maturity of the QMS. This construct has presented a factor related to an efficient management processes and demonstrates that customer requirements of translation for employees is a part important for the organization.
Factor 6 (loading factor 0.129): “Management costs” allows us to understand through its variable with higher factor loadings, that approval of resources based on their implementation costs is seen as essential for the maintenance of the maturity of the QMS. This construct also has evidence showing that top management understands that spending on the Quality Management System reduce operating costs, including those defined as non-quality costs (flaws and claims).
Possession of such factors, considered as latent variables of first order maturity, it proceeded with the structural model composition. It has evaluated the relationship between the maturity groupings and performance and the identification of transitions key points, aiming to identify the structural composition of the maturity model and the definition of maturity levels of QMS’s from surveyed suppliers.
Based on a factorial analysis, an indicator for each construct had been generated by summing the score of their respective latent variables. Additionally, the sum score of the constructs were used to create a new variable called “QMS Maturity” (Chart 1), containing the maturity score for each of the 179 surveyed suppliers. For each of the latent variables was assessed the minimum and maximum scores, as well as the average and standard deviation, as part of the descriptive statistics. Maturity scale has been set, which the values are between 25 and 125 points (Table 1).
Table 1. Descriptive statistics of the latent variable Maturity QMS’s.
Latent Variables Number of indicators
Points Average Standard deviationMinimum Maximum
Leadership and Communication 9 9 45 37.22 6.05Agility and Integration by IT 3 3 15 11.48 2.28Efficient Management Processes 4 4 20 16.7 2.46Valuing employees 4 4 20 13.41 3.43Information Availability 2 2 10 8.23 1.42Cost Valuing management 3 3 15 12.6 1.79Maturity points 25 25 125 99.65 14.11Source: research data.

Nascimento, A. P. et al.10 Gest. Prod., São Carlos
As a result, the data had been submitted to a cluster analysis trying to identify homogeneous subgroups of cases from the studied population, based on their score in each latent variable. It used the cluster analysis Two Step, available in SPSS, considering the maturity score as a continuous variable, with the establishment of five clusters representing five distinct levels of maturity. This choice was based on the classification of maturity models used in the literature review, also using five levels of evolution.
The cluster analysis, also called segmentation analysis or taxonomic analysis, seeks to identify homogeneous subgroups of cases in a population. That is, the cluster analysis is to identify a set of groups that aims to minimize the variation within the group and maximizing the variation between groups. This methodology was used in the relevant work processes maturity literature, especially in the work McCormack et al. (2009) .This is a useful method to identify key transition points (turning key points) for each class using the Euclidian distance to determine centroid.
Despite being a very complex phenomenon representation, the transition key points can be used to direct a way for the organization to follow, prioritizing a set of targeted efforts to achieve continuous improvement in the management of their processes, being naturally very wide and quite useful to use in case management efforts in contexts of supply chains (Oliveira, 2009; McCormack et al., 2009). The transition points were defined based Macintosh (1993), which defines five levels of maturity in processes: a) initial; b) repeatable; c) defined; d) managed; e) optimized. For this author, business models processes can be explicitly used to provide decision support in terms of analysis, planning and reengineering.
The algorithm Two-Step has two procedures. At first, the data is analyzed individually and homogeneous groups are formed taking into account the distance measured. Each group is assigned a set of statistics that summarize information about the group formed. In the second step, groups obtained in the previous
step are treated as individual observations and a hierarchical algorithm is used to create the array. Thus, the 179 reviews by suppliers have been classified according to each of the 5 cluster positions, that is, according to each of the five maturity levels, shown in Table 2:
According to Andersson et al. (2006), a transition is a key point of maturity component in business processes that stabilizes in an organization and leads to the establishment and expansion of other factors that the move to a higher level of maturity. A key transition point can also be characterized by a peak and a transition from expansion to recession or vice versa (Andersson et al., 2006), and a clear change in the behavior of business processes (Andersson, 2002; McCormack et al., 2009).
The transition points for each level of maturity were set taking as a basis for the first level minimum score value (25 points) and the average value between two centroids. For others, it had been considered the midpoint between the centroid of the previous level and the level centroid concerned for each construct. Based on these groupings, the analysis of K-means clustering was applied, resulting in the following points of transition SGQ’s maturity levels considering the constructs Leadership and Communication, mobility and integration for IT Processes Efficient Management, Valuing employed, availability of information and management costs, as illustrated in Figure 1.
The research results showed five different centroids. By considering each cluster as a distinguished maturity level, with a centroid determined for each cluster, maturity scores, i.e. maturity turning points, were identified taking into consideration the average value between two centroids, as shown in Figure 2.
White (2001), who defends the same idea, which stresses that each organization must establish the appropriate level or minimum maturity for the desired return is achieved and set your goals to achieve it,. Maturity becomes the metric of continuous improvement of the organization’s QMS. Lockamy & McCormack (2004) as an energy that maintains
Table 2. Transition Points of the maturity levels of QMS’s.
Maturity Level (Cluster)
N % of total Centroid at maturity score
Standard deviation
Transition points
1 10 5.6% 61.70 11.06 742 32 17.9% 86.19 3.99 923 55 30.7% 97.55 3.00 1034 53 29.6% 107.49 2.66 1125 29 16.2% 117.31 3.07 117
Total 179 100 - - -Source: research data.

Key transition points… 11
and advances the maturity of processes to new levels of maturity define this continuous improvement.
It was observed that the identified transition points are aligned to literature (JIS, 2005), which states that will measure quality processes achieve higher levels of maturity, move to an internally focused perspective to a systemic perspective externally focused, as can be seen in Chart 4.
The five stages of maturity model as shown in Figure 1, represents practices groups which are employed in different process maturity levels, building on one another and producing increasing levels of performance in the quality management system. With each level of maturity will occur increasing degree of predictability, capacity, control, effectiveness and efficiency. Level 1 is characterized by ill-defined and contains unstructured practices resulting in unpredictable performance and high costs.
Functional cooperation and customer satisfaction levels are low. On the second level, set, basic quality management systems, processes are defined and documented and performance is more predictable. Normally at this stage it is ISO 9001, resulting in better customer satisfaction, albeit at a high cost.
At the third level, the processes have become more oriented by assigning authority over various functional units, with greater cooperation between intra-organizational functions, suppliers and customers, resulting in performance improvements and increased customer satisfaction.
In the fourth level, suppliers and customers strategically cooperate with the organization and drives to largely performance measurement activities, resulting in better monitoring and drastic reduction in cost. Customer satisfaction and team spirit, it becomes a competitive advantage. In the
Figure 1. Transition Key points in the quality management system’s maturity scale. Source: elaborated by the authors.
Figure 2. QMS maturity transition Key points based on cluster analysis. Source: elaborated by the authors based on McCormack et al. (2009).

Nascimento, A. P. et al.12 Gest. Prod., São Carlos
final level, the company’s quality management becomes a reference for competitors. Efficiency and effectiveness are supported by the organization, which can adapt to the changes imposed by the organizational environment.
The identified constructs were analyzed in the light of the references in which it was observed that the first construct “Leadership and Communication” is quite debated in the three selected approaches (Crosby, 1979; JIS, 2005; FNQ, 2011) and refers to the role of leaders, especially the management, recognition of the values of a quality management system and dissemination of these values to employees. The literature points out that investigated the leadership not only acts in establishing the vision and policies, but also in directing the resources that drive the organization to respond immediately to changes in the business environment.
The second construct “Agility and Integration through Information Technology”, is present only in more recent approaches (JIS, 2005; FNQ, 2011) and demonstrates that computer technology maximizes integration and speed in decisions, making the recurrence of problems a rare indeed.
The “Efficient Management Processes”, which is also defined as the base of a QMS shows that the process approach and continual improvement, by participating, customers and suppliers, proves effectiveness for reducing sources pollution and industrial accidents. Efficient management of operational processes is advocated in the literature
(Crosby, 1979; JIS, 2005) as a value creation tool for the customer.
The fourth construct, called “Employee Appreciation” is also quite debated and always set to one of the quality management pillars. This construct has been designed based on participation and appreciation, which are considered drivers of the quality management system’s maturity. The involvement and appreciation to the employees are appointed by the literature as a source of organizational identity (JIS, 2005) and means of reaching the goals set by senior management.
The construct “availability of information” reinforces that access to information; both the customers and the employees have marked importance in the maturity of the QMS. It is important for the organization to making management decisions based on facts clearly understood, not in speculation (JIS, 2005). It is observed that the variables of this construct are also related to the constructs “Leadership and Communication” and “Cost Management”, which shows the role of leadership in information sharing.
Finally, the “Management Costs” well advocated by Crosby (Crosby, 1979) shows that actions such as approval of projects based on their costs and investments in the QMS lead to the reduction of non-quality costs (flaws and claims). It is Crosby (1979) who claims that the measure of an organization performance is the quality costs and the efficient management costs relates to requirements compliance (Crosby, 1979, p. 31). Crosby also argues that “management costs” is considered as a catalyst of a quality system in the
Chart 4. Maturity levels of QMS’s.
Maturity Level Planning Results
1 There are flaws in the design or plan is not executed as planned.
The expected results are not produced. Lower results than competitors.
2 Procedures for ISO 9001 requirements are established and implemented.
The expected results are usually achieved. Similar results to competitors. The company is certified to ISO 9001.
3The organizational profile is clearly established, and planning is effective, facing identified as actually needed items.
Expected results are always achieved. Similar results to competitors.
4
The organizational profile is clearly set against the competition. Planning is effective and efficient, facing important and necessary and fully implemented items.
Expected results are achieved efficiently. Better results than the competition.
5Innovative planning able to adapt to environmental changes. Lessons learned are shared by everyone in the organization.
The expected results are produced efficiently and sustained in the organization, regardless of management and the environment. Considered a model of excellence by competitors and customers.
Source: elaborated by the authors based on JIS Q 9005 (JIS, 2005)

Key transition points… 13
organization (Crosby, 1979, p. 221), which is very evident in the identified construct, which relates the role of leadership in managing costs.
As a complement, it also investigated if the maturity level is higher in manufacturing companies than in service companies. In this case there has been the assumption that manufacture maturity levels should be higher than in service companies, since the quality management systems had its origin in manufacturing companies, i.e. in theory being more mature QMS. Table 3 it can see that none of the manufacturing companies is at the lowest level of maturity. However, it appears that the total of 38.5% of manufacturing companies around 18% of them (about 50% of that total) has its maturity level 2 or 3. Considering the classification presented in Table 3, it appears these two levels are not enough to expect better results than the competition. Thus, it is inconsistent to state that manufacturing companies in the maturity of the QMS is concentrated at the highest levels. As a complement you can see that the total of 61.5% of service companies, only approximately 36% (almost 60% of that total) are at levels 1, 2 and 3. However, in the case of service companies the percentage belonging levels 1 and 2 are higher than those presented in the manufacturing companies. Finally it should be noted that the sum total of less than 20% of companies are at level 5 of maturity, that is, by the classification made in Table 3, this is the percentage of companies that are considered as excellent by competitors.
5 ConclusionsThe aim of this paper is to present a model capable
for measuring the Quality Management Maturity, using transition key point’s logic for determining its levels.
In the discussion presented in the literature, Quality Management Systems (QMS) maturity is considered a second-order construct, i.e., comprising a set of first-order constructs. Six factors has been conceptually identified in the literature, as a first-order constructs, for the second-order construct QMS
maturity. Five of them were empirically confirmed by factor analysis. Our first contribution for the literature is the empirical validation of these first order constructs. Besides we identify the manifest variables (Appendix A), which contribute for theoretical development of questionnaire’s in QMS maturity researches.
Specifically regarding construct “Agility and Integration by Means of Information Technology” was unable to reflect the academic rigor of their appearance, because it was not found in any of the surveyed benchmarks up to date. Preliminarily we can work with two possibilities. The first option is that this is a factor that carries the characteristics from the surveyed suppliers, since they belong to a specific program of developed suppliers. The second is that, in the case of “integration through information technology” that can be effectively a new construct that has its motivation directly related to the widespread use of information technology by organizations in recent decades. But as I said, still fit reflections and a new research.
The transition points identified by cluster analysis help determine that the achievement of a maturity level institutionalizes a necessary view of the system to achieve a performance result set in processes and this finding had been shown to be consistent with the literature. From a practical point of view, maturity models in processes provide managers mechanisms that enable them to identify what needs to be done to the progress of cases.
Finally, analyzing the level of maturity differences between manufacturing and services companies, we could not observe differences in maturity levels, namely the fact that the QMS have their origin in the manufacturing companies, is not a determining factor for the maturity.
The concept of maturity adopted in this research has been based on three perspectives: maturation time (age), capability and evolution. Although the adoption of multiple perspectives has provided a scope not glimpsed in previous researches, new studies may address the maturity in compliance perspective. In this perspective, maturity levels may be associated with the number of non-compliances obtained by certified organizations, and the degree of these findings and the requirements identified in its internal audits. In this sense, it is suggested that future research expand the investigation of QMS maturity, making sure the level of organizational performance is related to QMS maturity level achieved.
Advantages and limitations of the method used: The strength of this method lies in the fact of providing relatively simple and straightforward form a support for the definition of transition key
Table 3. % of companies in each maturity level.Maturity
Level (Cluster)
NType of Operation
Service Manufacture Total
1 10 5.6% - 5.6%2 32 12.3% 5.6% 17.9%3 55 18.4% 12.3% 30.7%4 53 17.9% 11.7% 29.6%5 29 7.3% 8.9% 16.2%
Total 179 61.5% 38.5% 100%

Nascimento, A. P. et al.14 Gest. Prod., São Carlos
to superior quality performance? Production and Operations Management, 8, 1-27.
European Foundation for Quality Management – EFQM. (2006). Modelo EFQM de excelência. Brussels: European Foundation for Quality Management.
Flynn, B. B., Shroeder, R. G., & Sakakibara, S. (1994). A framework for quality management research and an associated measurement instrument. Journal of Operations Management, 11, 339-366.
Fok, W. M., Li, J., Hartman, S. J. & Fok, L. Y. (2003). Customer relationship management and QM maturity: an examination of impacts in the health-care and non-health-care setting. International Journal of Health Care Quality Assurance, 16, 234-247.
Forza, C., & Flippini, R. (1998). TQM-impact on quality conformance and customer satisfaction: a causal model. International Journal of Production Economics, 55, 1-20.
Fraser, P., Moultrie, J., & Gregory, M. (2002). The use of maturity models / grids as a tool in assessing product development capability. In IEEE International Engineering Management Conference (pp. 244-249). Cambridge: IEEE.
Fundação Nacional da Qualidade – FNQ. (2011). Modelo de excelência da gestão – MEG. Recuperado em 10 de abril de 2011, de http://www.fnq.org.br.
Garrett, G. A., & Rendon, R. G. (2005). Managing contracts in turbulent times: the contract management maturity model. Contract Management, Sept. 2005, 48-57.
Grandzol, J. R., & Gershon, M. (1998). A survey instrument for standardizing TQM modeling research. International Journal of Quality Science, 3(1), 80-105.
Hair, J. F., Anderson, R. E., Tatham, R. L., & Black, W. C. (2009). Análise multivariada de dados. 6. ed. Porto Alegre: Bookman.
Hayes, B. E. (2001). Medindo a satisfação do cliente: desenvolvimento e uso de questionários. Rio de Janeiro: Qualitymark.
Hendricks, K. B., & Singhal, V. R. (1997). Does implementing an effective TQM program actually improve operating performance? Empirical evidence from firms that have won quality awards. Management Science, 43(9), 1258-1274.
Japanese Industrial Standards – JIS. (2005). Quality Management System: guidelines for sustainable growth. Tokyo: JIS.
Kaynak, H. (2003). The relationship between total quality management practices and their effects on firm performance. Journal of Operations Management, 21, 405-435.
Kenyon, G. N., & Sen, K. C. (2015). The aspects of quality. In the perception of quality (pp. 51-60). London: Springer.
Lahti, M., Shamsuzzoha, A. H. M., & Helo, P. (2009). Developing a maturity model for Supply Chain
points clearly under a nomothetic perspective, and establish a priority relationship between the constructs, raising important contributions on how to facilitate the management and continuous improvement of business processes over time.
ReferencesAhire, S. L., Golhar, D. Y., & Waller, M. A. (1996).
Development and validation of TQM implementation constructs. Decision Sciences, 27(1), 23-56.
Andersson, E. (2002). Monitoring cyclical processes. A nonparametric approach. Journal of Applied Statistics, 29(7), 973-990.
Andersson, E., Bock, D., & Frisén, M. (2006). Some statistical aspects of methods for detection of turning points in business cycles. Journal of Applied Statistics, 33(3), 257-278.
Associação Brasileira de Normas Técnicas – ABNT. (2008). NBR ISO 9001: Sistema de Gestão da Qualidade - Requisitos. Rio de Janeiro: ABNT.
Associação Brasileira de Normas Técnicas – ABNT. (2010). NBR ISO 9004: Gestão para o sucesso sustentado de uma organização: uma abordagem da gestão da qualidade. Rio de Janeiro: ABNT.
Barnett, V. (1991). Sample survey: principles and methods. London: Hodder Arnold Publication.
Bemowski, K. (1996). Baldrige award celebrates its 10th birthday with a new look. Quality Progress, 29(12), 49.
Bessant, J., Caffyn, S., & Gallagher, M. (2001). An evolutionary model of continuous improvement behaviour. Technovation, 21(2), 67-77.
Brown, T. J., Churchill, G. A., & Peter, J. P. (1993). Improving the measurement of service quality. Journal of retailing, 69(1), 127-139.
Choi, T. Y., & Eboch, K. (1998). The TQM paradox: relations among tqm practices, plant performance, and customer satisfaction. Journal of Operations Management, 17, 59-75.
Crosby, P. B. (1979). Quality is free: the art of making quality certain. New York: McGraw-Hill Companies.
Dellana, A. S., & Kros, F. J. (2014). An exploration of quality management practices, perceptions and program maturity in the supply chain. International Journal of Operations & Production Management, 34(6), 786-806.
Deming, E. (1982). Quality, productivity, and competitive position. Cambridge: Massachusetts Institute of Technology.
Douglas, T. J., & Judge, W. Q., Jr. (2001).Total quality management implementation and competitive advantage: the role of structural control and exploration. Academy of Management Journal, 44, 158-169.
Dow, D., Samson, D., & Ford, S. (1999). Exploding the myth: do all quality management practices contribute

Key transition points… 15
Project Management Institute – PMI. (2003). Organizational Project Management Maturity Model (OPM3). Philadelphia: Project Management Institute Inc.
Purushothama, B. (2010). Measuring maturity in QMS implementation. Cambridge: Woodhead Publishing Limited. Recuperado em 20 de dezembro de 2010, de http://www.woodheadpublishing.com
Rosnah, M. Y., Wan, N. K. W. A., & Zulkifli, N. (2010). Quality management maturity and its relationship with human resource development strategies in manufacturing industry. Asian International Journal of Science and Technology in Production and Manufacturing Engineering., 3(4), 2010.
Rungtusanatham, M. (1998). Let’s not overlook content validity. Decision Line, 29(4), 10-13.
Samson, D., & Terziovski, M. (1999). The relationship between total quality management practices and operational performance. Journal of Operations Management, 17, 393-409.
Saraph, J. V., Benson, P. G., & Schroeder, R. G. (1989). An instrument for measuring the critical factors of quality management. Decision Sciences, 20, 810-829.
Silveira, V. N. S. (2009). Modelos multiestágios de maturidade: um breve relato de sua história, sua difusão e sua aplicação na gestão de pessoas por meio do People CapabilityMaturityModel (P-CMM). Revista de Administração Contemporânea, 13(2), 228-246.
Singh, P. J., & Smith, A. (2006). An empirically validated quality management measurement instrument. Benchmarking International Journal (Toronto, Ont.), 13(4), 493-522.
Souza, R., & Voss, C. A. (2001). Quality management: universal or context dependent? An empirical investigation across the manufacturing strategy spectrum. Production and Operations Management, 10, 383-404.
Urdang, L., & Flexner, S. B. (1968). The random house dictionary of the English language: college edition. New York: Random House.
White, K. R. (2001). Describing project management maturity. In J. K. Crawford. Describing project management maturity (pp. 139-145). Pennsylvania: PMSolutions.
Wilson, D. D., & Collier, D. A. (2000). An empirical investigation of the Malcolm Baldrige national quality award causal model. Decision Sciences, 31, 361-390.
Management. International Journal of Logistics Systems and Management, 5(6), 654-678.
Lockamy, A., & McCormack, K. (2004). The development of a supply chain management process maturity model using the concepts of business process orientation. Supply Chain Management International Journal (Toronto, Ont.), 9(4), 272-278.
Macintosh, A. L. (1993). The need for enriched knowledge representation for enterprise. Artificial Intelligence in Enterprise Modelling: IEE Colloquium (pp. 3/1-3/3). Cambridge: IEEE
McCormack, K., Willems, J., Van Den Bergh, J., Deschoolmeester, D., Willaert, P., Indihar Štemberger, M., & Bosilj Vuksic, V. (2009). A global investigation of key turning points in business process maturity. Business Process Management Journal, 15(5), 792-815.
Merriam-Webster. (2013). Recuperado em 01 de janeiro de 2012, de www.webster.com
Mohrman, S. A., Tenkasi, R. V., Lawler Iii, E. E., Ledford, G. G., Jr. (1995). Total quality management: practice and outcomes in the largest US firms. Employee Relations, 17(3), 26-41.
Moura, L. R. (2009). Gestão do relacionamento com fornecedores: análise da eficácia de programa para desenvolvimento e qualificação de fornecedores para grandes empresas (Tese de Doutorado). Escola Politécnica, Universidade de São Paulo, São Paulo.
Nair, A. (2005). Meta-analysis of the relationship between quality management practices and firm performance: implications for quality management theory development. Journal of Operations Management 24, 948-975.
Nunnally, J. C. (1978). Psychometric theory. New York: McGraw-Hill.
Oliveira, M. P. V. (2009). Modelo de maturidade de processos em cadeias de suprimentos: precedências e os pontos-chave de transição (Tese de Doutorado). Universidade Federal de Minas Gerais, Belo Horizonte.
Patti, A. L., Hartman, S. J., & Fok, L. Y. (2001). Investigating organizational quality management maturity: an instrument validation study. International Journal of Quality & Reliability Management, 18(9), 882-899.
Prodfor. (2011). PRODFOR em números. Recuperado em 11 de janeiro 2011, de http://www.prodfor.com.br/

Nascimento, A. P. et al.16 Gest. Prod., São Carlos
Appendix A. Matrix of rotated components - Refined analysis factor. Source: elaborated by the authors based on survey data.Component
1 2 3 4 5 6 Questions Construct (commonality) alpha
Q1 0.710Top management directly supports the Quality Management System.
Leadership and communication
(0.9535)0.919
Q2 0.584 0.473The company prepares its employees for management positions.
Q5 0.701
The objectives of the QMS are reviewed periodically to meet the needs and expectations of our customers.
Q7 0.782
The plans are widely discussed with the employees before being implemented.
Q8 0.792Performance indicators of processes are known, clear and objective.
Q10 0.560Best practices obtained in the market are disseminated to employees.
Q13 0.673
The resources for implementation of the QMS are quickly allocated as needed.
Q19 0.742It is clear to employees their importance to the company’s objectives are achieved.
Q20 0.646 0.314
The proposed solutions to customer requests are quickly communicated to all involved.
Q11 0.352 0.421 -0.314 The recurrence of problems in business is a rare event.
Agility and integration through IT(0.9614)
0.716Q14 0.829
Information technology is used to promote the integration of the company with customers.
Q15 0.817Integration with the company’s suppliers is made using high-grade IT.
Q6 0.726 0.341The company considers the audit carried out by clients a routine process.
Efficient management of
processes(0.9740)
0.711
Q22 0.375 0.552
Suppliers have an active role in the development and improvement of business processes.
Q23 0.638 0.328
The company improves its processes in order to reduce systematically the sources of pollution.
Q24 0.423 0.348 0.383 0.318The company develops actions to continuously reduce work-related accidents.

Key transition points… 17
Component
1 2 3 4 5 6 Questions Construct (commonality) alpha
Q9 0.317 0.611 0.349
They are used mathematical / statistical methods (such as zip code, FMEA, probability, etc.) to manage processes.
Valuing employees(0.9233)
0.773Q16 0.398 0.469 0.372 0.321
The company is able to attract and retain people considered key to the critical processes.
Q17 0.834
The company has an awards program for employees to suggest process improvements.
Q18 0.566 0.555The company encourages the achievement of performance targets.
Q4 0.452 0.555 0.333The customer has active role in the development of business processes. Information
Availability(0.9055)
0.601
Q21 0.741
The company ensures the adequate availability of information necessary to conduct the activities.
Q25 0.412 0.416 0.420
The company develops actions that are reducing non-quality costs (defects and claims).
Cost management(0.9800) 0.674Q26 0.576 0.306 0.339 0.318
It can be argued that top management understands that spending on the Quality Management System reduce operating costs.
Q27 0.730
Projects to improve processes are initially set based on their implementation costs
Appendix A. Continued...