Embed Size (px)
Citation preview
KÁTIA EMÍDIO DA SILVA
FLORÍSTICA E ESTRUTURA ESPACIAL: 15 HECTARES DE PARCELAS PERMANENTES NA FLORESTA DENSA DE TERRA
FIRME NA AMAZÔNIA CENTRAL
Tese apresentada à Universidade Federal de Viçosa, como parte das exigências do Programa de Pós-Graduação em Ciência Florestal, para obtenção do título de Doctor Scientiae.
VIÇOSA MINAS GERAIS-BRASIL
2010
KÁTIA EMÍDIO DA SILVA
FLORÍSTICA E ESTRUTURA ESPACIAL: 15 HECTARES DE PARCELAS PERMANENTES NA FLORESTA DENSA DE TERRA
FIRME NA AMAZÔNIA CENTRAL
Tese apresentada à Universidade Federal de Viçosa, como parte das exigências do Programa de Pós-Graduação em Ciência Florestal, para obtenção do título de Doctor Scientiae.
,
APROVADA: 27 de setembro de 2010.
________________________________ ______________________________ Prof. Dr. Carlos Antônio A. S. Ribeiro Prof. Dr. Nerilson Terra Santos (Coorientador) (Coorientador)
________________________________ ______________________________ Dr.Celso Paulo Azevedo Prof. Dr. José Marinaldo Gleriani
__________________________________
Prof. Dr. Sebastião Venâncio Martins (Orientador)
ii
AGRADECIMENTOS
A Deus, que tem tornado possíveis todas as coisas em minha vida: “Tem
enchido nossas lâmpadas com o óleo do Espírito, e tem feito Sua Vide florescer!”
Meu reconhecimento pela Sua infinita misericórdia!
Aos meus Pais Sebastião e Nilda, pelo exemplo de luta e perseverança, e ao
meu irmão, irmãs, sobrinho e sobrinhas, com seus pares, pelos bons momentos em
família e pelo suporte emocional durante o curso de doutorado.
À Francisca e Ieda do INPA/Manaus pela amizade, apoio e incentivo.
Em Toronto/Canadá em 2009, durante o doutorado sanduíche, tive a
oportunidade de conviver com os Brasileiros Francisca, Milton, Keila, Camilinho,
Michelle, Michel, Andressa, dentre outros, e com alguns cidadãos de Toronto como
Marie-Josee, Aleksandra, Bronwin, Ilona, Ricardo, Josie, Patrick, Allan e Dennis, os
quais contribuíram sobremaneira para que minha estada no Canadá fosse proveitosa
e agradável! Obrigada a todos!!!!
Mais uma vez meus agradecimentos ao Milton, que compartilhou comigo sua
experiência profissional, contribuindo muito para o desenvolvimento da tese!
À Embrapa pela oportunidade do aprendizado no Brasil e no Canadá-
Toronto! Agradeço à minha unidade de pesquisa em Manaus (Embrapa Amazônia
Ocidental) pela disponibilização de dados e apoio para a coleta de informações
complementares, em especial aos colegas da área florestal, Celso Paulo, Roberval,
Cíntia e Marcelo. Agradeço ao pesquisador Wenceslau Teixeira pelo apoio nas
análises de solos e pelas muitas trocas de informação relativa à área de solos no
Campo Experimental da Embrapa. Quero agradecer ao SGP/Embrapa-Manaus e em
especial à Darciley pelo apoio administrativo em todas as fases do curso!
À Universidade Federal de Viçosa e ao Dep. Engenharia Florestal por terem
me recebido para a realização do curso de doutorado, em especial ao meu orientador
Prof. Sebastião Venâncio por ter aceitado o desafio de fazermos uma abordagem
diferenciada no trabalho, relacionada aos estudos da estrutura espacial dos dados.
Obrigada pela confiança e orientação! Aos meus coorientadores Prof. Carlos Ribeiro
(Charles)-DEF e Prof. Nerilson do dep. de Estatística que foram importantes durante
iii
todo o processo de desenvolvimento da tese, contribuindo com sugestões e
orientações aos artigos produzidos. Meus agradecimentos aos funcionários da
secretaria da Pós-, Rita e Alexandre, pela competência e apoio em todos os
momentos!
À Dra. Marie-Josee Fortin da Universidade de Toronto pela colaboração na
análise espacial dos dados. A convivência com estudantes e profissionais da área de
ecologia foi extremamente importante para meu aprendizado profissional! Jamais
esquecerei este período de minha vida!
A todos que de alguma maneira contribuíram para o desenvolvimento e
conclusão desta tese!
iv
SUMÁRIO PáginaLISTA DE FIGURAS.................................................................................... vi
LISTA DE TABELAS................................................................................... viii
RESUMO........................................................................................................ ix
ABSTRACT................................................................................................... xi
INTRODUÇÃO GERAL.............................................................................. 1
Artigo 1
Floristic composition and similarity of 15 hectares plots of a terra firme dense forest in Central Amazon, state of Amazonas, Brazil...............................................................................................................
7
Abstract................................................................................................ 7
Introduction......................................................................................... 8
Materials and Methods........................................................................ 9
Results................................................................................................. 12
Discussion............................................................................................ 18
Acknowledgments............................................................................... 21
References........................................................................................... 21
Annex 1............................................................................................... 25
Artigo 2
Estrutura do componente arboreo em 15 ha de parcelas permanentes de floresta densa de terra firme na Amazônia Central.............................
32
Resumo................................................................................................ 32
Abstract................................................................................................ 32
Introdução............................................................................................ 33
Material e Método............................................................................... 34
Resultado e Discussão......................................................................... 35
Conclusões........................................................................................... 39
Bibliografia.......................................................................................... 39
v
Artigo 3
Spatial structure of tree species community in a “terra firme” Amazon
forest near Manaus, Brazil...........................................................................
Página
42
Abstract............................................................................................... 42
Introduction…………………………….…………………………… 43
Methods………………………….........…………………………….. 44
Results………………………………………………………………. 48
Discussion…………………………………………………………… 54
Conclusion........................................................................................... 57
Acknowledgments……...…………………………………………… 57
References........................................................................................... 58
Online Resource 1............................................................................... 61
Artigo 4
Neighbour`s Identity of Commercial Tropical Tree Species in a Tropical Rainforest Near Manaus, Brazil...............................................
63
Abstract................................................................................................ 63
Introduction......................................................................................... 64
Methods............................................................................................... 66
Results................................................................................................. 69
Discussion............................................................................................ 78
Conclusions......................................................................................... 80
Acknowledgments............................................................................... 81
References........................................................................................... 81
Appendix............................................................................................. 84
CONCLUSÕES GERAIS.............................................................................
88
vi
LISTA DE FIGURAS
Página Artigo 1
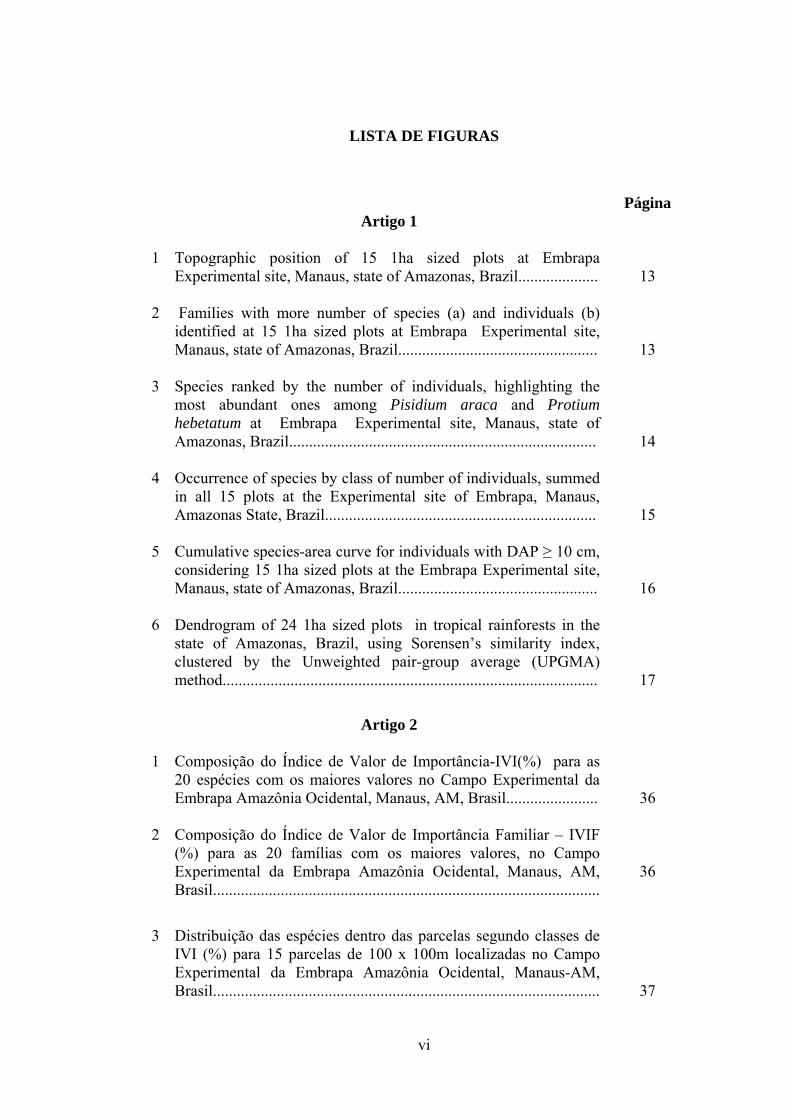
1 Topographic position of 15 1ha sized plots at Embrapa Experimental site, Manaus, state of Amazonas, Brazil....................
13
2 Families with more number of species (a) and individuals (b) identified at 15 1ha sized plots at Embrapa Experimental site, Manaus, state of Amazonas, Brazil..................................................
13
3 Species ranked by the number of individuals, highlighting the most abundant ones among Pisidium araca and Protium hebetatum at Embrapa Experimental site, Manaus, state of Amazonas, Brazil.............................................................................
14
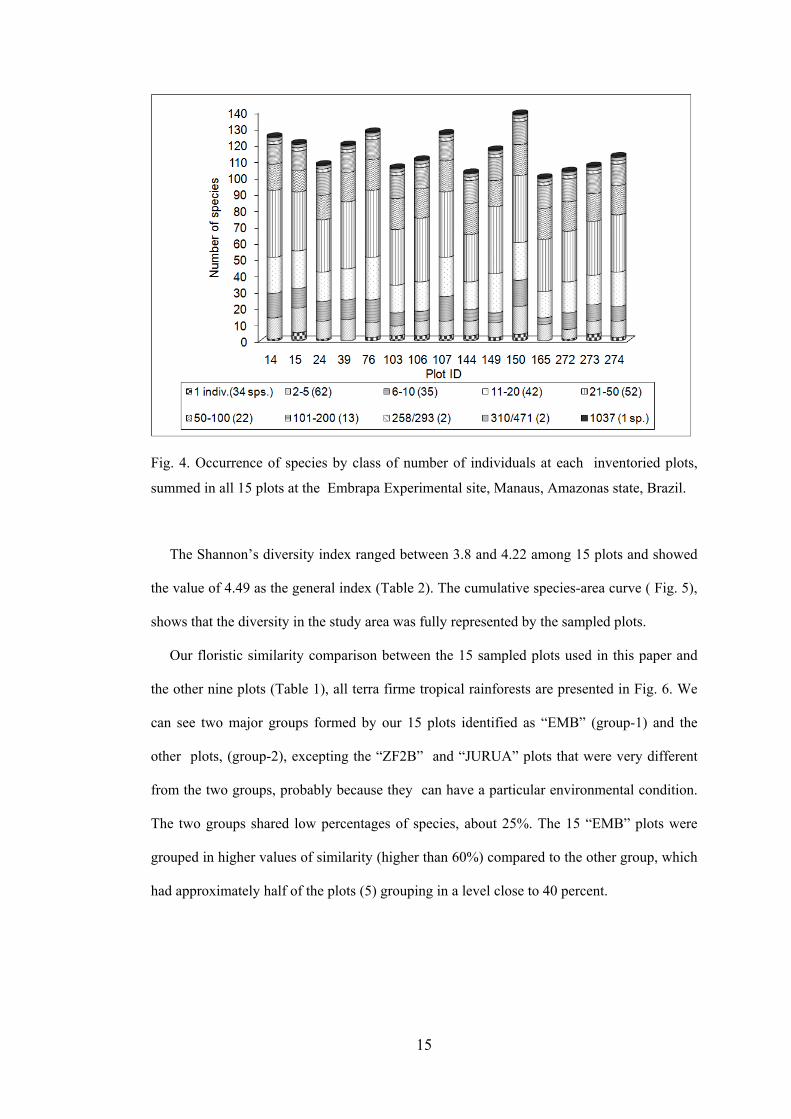
4 Occurrence of species by class of number of individuals, summed in all 15 plots at the Experimental site of Embrapa, Manaus, Amazonas State, Brazil....................................................................
15
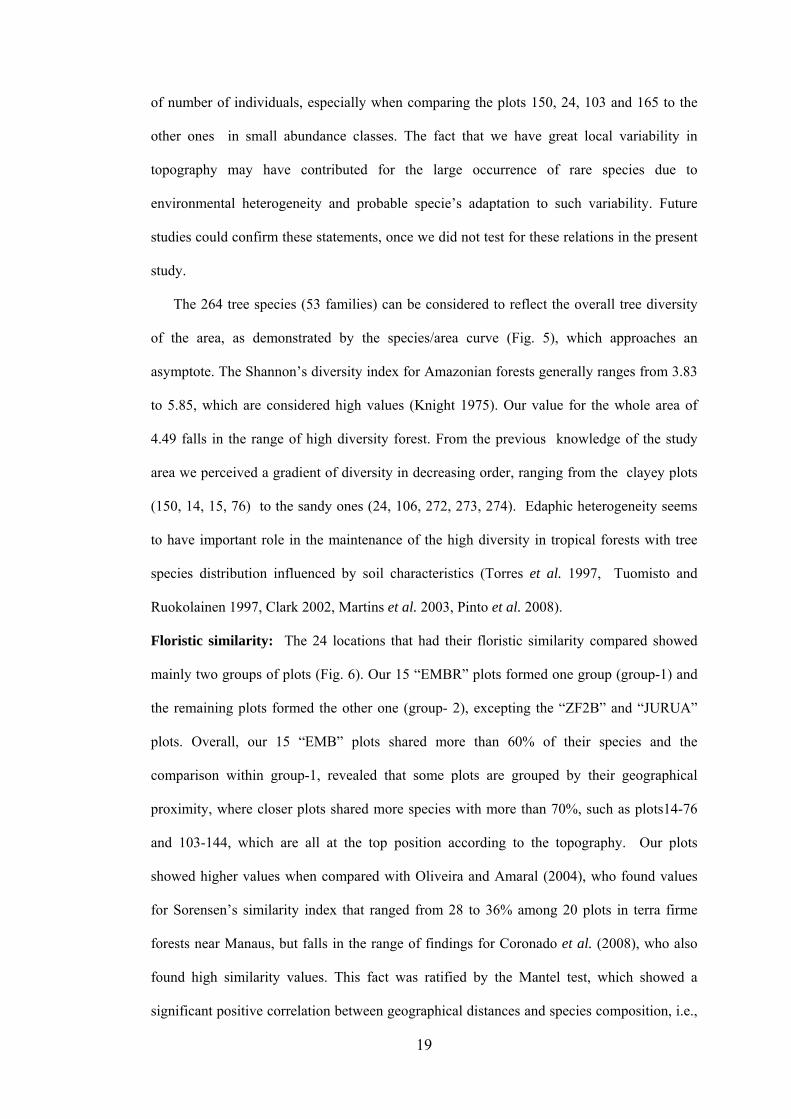
5 Cumulative species-area curve for individuals with DAP ≥ 10 cm, considering 15 1ha sized plots at the Embrapa Experimental site, Manaus, state of Amazonas, Brazil..................................................
16
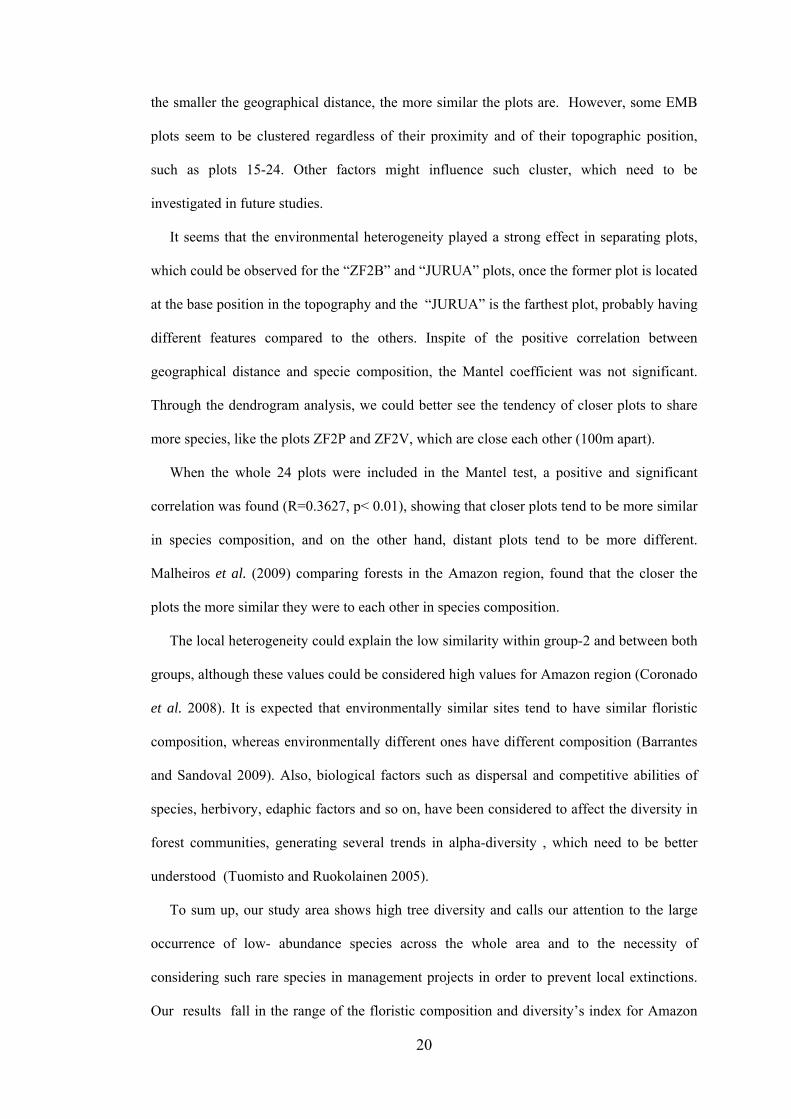
6 Dendrogram of 24 1ha sized plots in tropical rainforests in the state of Amazonas, Brazil, using Sorensen’s similarity index, clustered by the Unweighted pair-group average (UPGMA) method..............................................................................................
17
Artigo 2
1 Composição do Índice de Valor de Importância-IVI(%) para as 20 espécies com os maiores valores no Campo Experimental da Embrapa Amazônia Ocidental, Manaus, AM, Brasil.......................
36
2 Composição do Índice de Valor de Importância Familiar – IVIF (%) para as 20 famílias com os maiores valores, no Campo Experimental da Embrapa Amazônia Ocidental, Manaus, AM, Brasil.................................................................................................
36
3 Distribuição das espécies dentro das parcelas segundo classes de IVI (%) para 15 parcelas de 100 x 100m localizadas no Campo Experimental da Embrapa Amazônia Ocidental, Manaus-AM, Brasil.................................................................................................
37

vii
Página 4 Número total de indivíduos por classes de diâmetro de amplitude
10 cm, no Campo Experimental da Embrapa Amazônia Ocidental, Manaus, AM, Brasil.........................................................................
38 Artigo 3
1 Location of sample units at different sizes across study area: (a) fifteen plots of 2,500 m2 where soil samples were collected. (b) Six plots of sizes ranging from ~ 4,000 to 5,800 m2........................
46
2 Location of sampling units of different sizes: (1) nine plots of 10,000 m2; (2) one plot of 14,000 m2 and one plot of 20,000 m2....
47
3 CCA triplot based on 68 species, 15 plots and nine soil variables, for upland tropical rain forest data, at the Embrapa Experimental Site, Manaus, Amazonas, Brazil.......................................................
49
4 Ripley`s function “L(r)-r”, univariate analysis at 10,000 m2 plots in the Embrapa Experimental Site....................................................
52
5 Ripley`s function “L(r)-r”, univariate/bivariate analysis at ~14,000 m2......................................................................................
53
6 Ripley`s function “L(r)-r”, for the plot with 20,000 m2 .................. 53
Artigo 4
1 Number of individuals per species at the 2-ha study area, highlighting the four commercial species studied............................
67
2 Ripley`s function “L(r)-r” to the four species studied. (A) Brosimum spp.; (B) Eschweilera coriacea, (C) Ocotea cernua, and (D) Protium hebetatum..............................................................
69 3 Mean distance from focal trees of the four commercial tree
species up to the 20th nearest neighbour at 2-ha study area. ............
70
4 Frequency of occurrence of neighbour species of Brosimum spp. up to the 20-k nearest neighbour.......................................................
71
5 Number of species by the mean distance registered up to the 20-knearest neighbours of four focal species at the study area..............
72
6 Frequency of occurrence of neighbour species of Eschweilera coriacea along the 20 nearest neighbours........................................
74
7 Frequency of occurrence of neighbour species of Ocotea cernua along the 20 nearest neigbours.........................................................
74

viii
8 Frequency of occurrence of neighbour species of Protium hebetatum along the 20 nearest neighbours......................................
77
ix
LISTA DE TABELAS
Artigo 1 Página
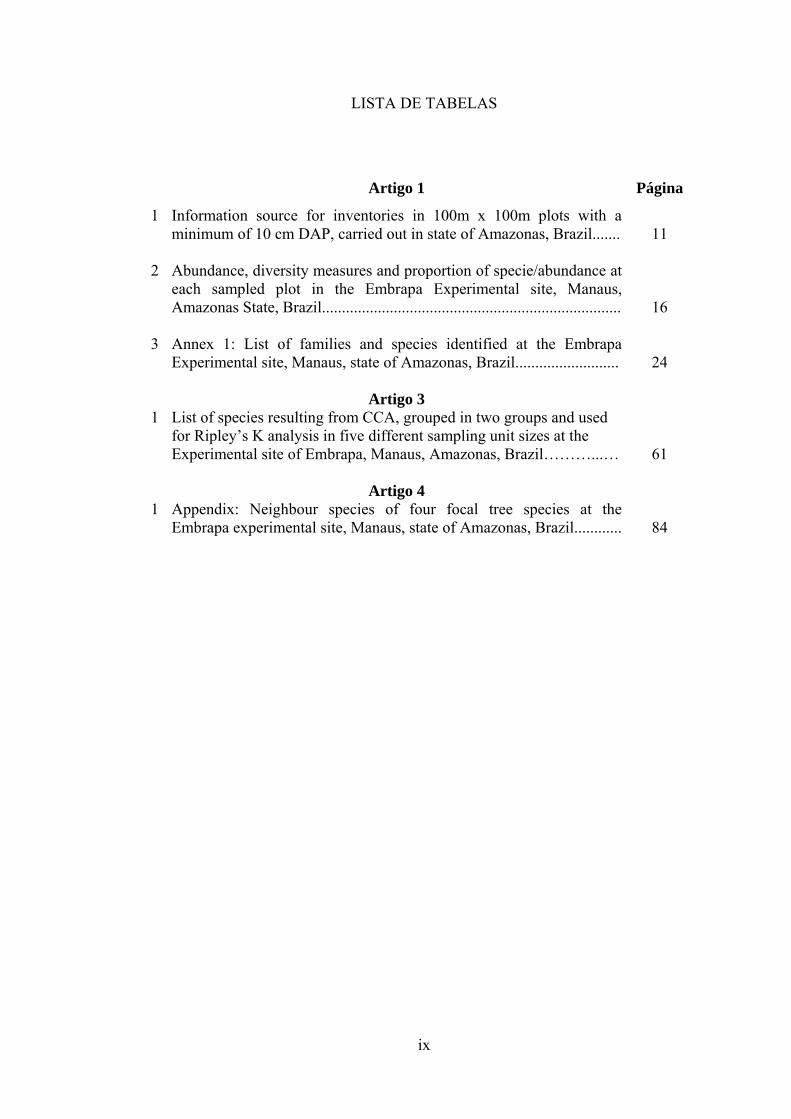
1 Information source for inventories in 100m x 100m plots with a minimum of 10 cm DAP, carried out in state of Amazonas, Brazil.......
11
2 Abundance, diversity measures and proportion of specie/abundance at each sampled plot in the Embrapa Experimental site, Manaus, Amazonas State, Brazil...........................................................................
16
3 Annex 1: List of families and species identified at the Embrapa Experimental site, Manaus, state of Amazonas, Brazil..........................
24
Artigo 3 1 List of species resulting from CCA, grouped in two groups and used
for Ripley’s K analysis in five different sampling unit sizes at the Experimental site of Embrapa, Manaus, Amazonas, Brazil………...…
61
Artigo 4 1 Appendix: Neighbour species of four focal tree species at the
Embrapa experimental site, Manaus, state of Amazonas, Brazil............
84
x
RESUMO
Silva, Kátia Emídio da, DSc., Universidade Federal de Viçosa, setembro de 2010. Florística e estrutura espacial: 15 hectares de parcelas permanentes na Floresta Densa de Terra Firme na Amazônia Central. Orientador: Sebastião Venâncio Martins. Coorientadores: Carlos Antônio Alvares S. Ribeiro e Nerilson Terra Santos.
Entender os mecanismos responsáveis pela manutenção da alta diversidade
biológica nos trópicos, resultante das interações das espécies com o ambiente natural
e entre si, é fundamental para minimizar a escassez de informações no setor florestal,
e contribuir para a restauração, conservação e uso múltiplo sustentável das florestas.
Esta tese objetivou descrever e analisar a composição florística e estrutura de 15
hectares de uma floresta densa de terra firme, localizada no campo experimental da
Embrapa Amazônia Ocidental, Manaus, AM, Brasil. Dois principais tópicos foram
desenvolvidos: i. Composição florística, e similaridade comparada a outras nove
áreas inventariadas no estado do Amazonas; ii. Estrutura horizontal, incluindo
análises espaciais explícitas da comunidade arbórea empregando a função K de
Ripley, e, análises de vizinhança de quatro espécies arbóreas de interesse comercial
no estado do Amazonas. Foram identificados 8771 indivíduos, distribuídos em 264
espécies e 53 famílias. As famílias com maior riqueza de espécies foram: Fabaceae-
Faboideae (22sps.), Fabaceae-Mimosoideae (22), Sapotaceae (22) e Lecythidaceae
(15). A família Burseraceae, com a menor diversidade de espécies (07), dentre as 10
primeiras famílias, é a que possui maior número de indivíduos registrados. As dez
espécies mais abundantes, as quais possuem 40% do número de indivíduos
indentificados foram Protium hebetatum (1037 individuals), Eschweilera coriacea
(471), Licania oblongifolia (310), Pouteria minima (293), Ocotea cernua (258),
Scleronema micranthum (197), Eschweilera collina (176), Licania apelata (172),
Naucleopsis caloneura (170) e Psidium araca (152). Há uma grande ocorrência de
espécies raras na área, com aproximadamente 36% ocorrendo com apenas um (01)
indivíduo por hectare, bem como de espécies com baixa abundância e de ocorrência
restrita a algumas parcelas, especialmente aquelas ocorrendo nas menores classes de
IVI. A estrutura diamétrica é similar à encontrada em outros estudos, apresentando
xi
distribuição dos diâmetros na forma de J-invertido, com 80% dos indivíduos
concentrados nas classes de DAP de 10-30 cm. Observou-se alta similaridade
florística (> 60%) entre as parcelas da área de estudo, e de modo geral, a comparação
com outras áreas no estado do Amazonas observou-se que quanto maior a distância
geográfica, menor a similaridade florística entre as mesmas. As variáveis de solo
(fertilidade, umidade e textura) e topografia exerceram forte influencia no arranjo
espacial da comunidade de espécies arbóreas, observando-se dependência espacial
entre as espécies e as variáveis ambientais. Entretanto, os padrões espaciais somente
foram visualizados em parcelas com tamanho mínimo de 10.000 m2, sendo mais
evidente a partir de 14.000 m2, sugerindo que a heterogeneidade ambiental e área
mínima de estudo devem ser consideradas nos estudos de dinâmica das florestas de
terra firme na Amazônia. Os resultados da análise das relações de vizinhança das
quatro espécies arbóreas de interesse comercial no estado do Amazonas, Brosimum
spp., Eschweilera coriacea, Ocotea cernua e Protium hebetatum, demonstraram
grande ocorrência de vizinhos conspecíficos das espécies focais, principalmente a
curtas distancias, mostrando que as espécies focais estão mais sob interações intra-
específicas, apresentando um padrão taxonômico associado às espécies focais. A
estrutura espacial, mais do que a abundância das espécies focais Brosimum spp. e
Ocotea cernua contribuiu para os encontros de conspecíficos nas duas espécies,
evidenciando a importância da estrutura espacial nas interações ecológicas. Espécies
raras ocorreram associadas às espécies focais, principalmente a Protium hebetatum,
ressaltando mais uma vez a importância da definição de estratégias de manejo que
evitem extinções locais de espécies raras. Esta tese contribuiu para o conhecimento
sobre a composição florística e estrutura espacial das espécies arbóreas da floresta
densa de terra firme na Amazônia, subsidiando, assim, as ações de manejo,
conservação e restauração das florestas tropicais.
xii
ABSTRACT
Silva, Kátia Emídio da, DSc., Universidade Federal de Viçosa, September, 2010. Floristic and spatial structure: 15 hectares of permanent plots in a Terra Firme Dense Forest in Central Amazonia. Advisor: Sebastião Venâncio Martins. Coadvisors: Carlos Antônio Alvares S. Ribeiro and Nerilson Terra Santos.
In order to understand the mechanisms responsible for maintaining the high
biological diversity in the tropics, resulting from the interactions between the species
and the natural environment and among each other, it is essential to minimize the
shortage of information in the forestry sector, and to contribute to the restoration,
conservation, and sustainable multiple use of the forests. This thesis aimed to
describe and analyze the floristic composition and structure of 15 hectares of a dense
terra firme forest, located in the experimental site of Embrapa Western Amazonia,
Manaus, Amazonas, Brazil. Two main topics were developed: i. Floristic
composition and similarity compared to nine other areas inventoried in the state of
Amazonas; ii. Horizontal structure, including explicit spatial analyses of the tree
community, using the Ripley K function, and neighbor analyses of four tree species
of commercial interest in the state of Amazonas. A total of 8771 individuals were
identified, representing 264 species and 53 families. The families with the highest
species richness were: Fabaceae-Faboideae (22 species), Fabaceae-Mimosoideae
(22), Sapotaceae (22), and Lecythidaceae (15). The family Burseraceae, with the
lowest species diversity (7), had the highest number of individuals. The ten most
abundant species, which comprised 40% of the number of individuals identified,
were Protium hebetatum (1037 individuals), Eschweilera coriacea (471), Licania
oblongifolia (310), Pouteria minima (293), Ocotea cernua (258), Scleronema
micranthum (197), Eschweilera collina (176), Licania apelata (172), Naucleopsis
caloneura (170), and Psidium araca (152). There was a high incidence of rare
species in the area, with approximately 36% having only 1 individual per hectare; as
well as of species with low abundance and occurrence that were limited to some
parcels, especially those occurring in the smallest Importance Value Index- IVI
classes. The structure of trunk diameters is similar to that found in other studies, with
the distribution of diameters having an inverted-J-shaped profile, and 80% of the
xiii
individuals concentrated in the 10-30 cm DBH classes. The floristic similarity was
high (> 60%) among the parcels of the study area, and in general, considering all the
plots analyzed, the greater the geographical distance, the lower was the floristic
similarity among them. The variables of soil (fertility, moisture, and texture) and
topography exerted a strong influence on the spatial arrangement of the tree
community, and a spatial dependence was observed between the species and the
environmental variables. However, the spatial patterns were only perceived in
parcels with a minimum size of 10,000 m2, and were most evident at parcel sizes
above 14,000 m2, suggesting that environmental heterogeneity and minimum size of
the study area should be taken into account in studies of the dynamics of the terra
firme forest in Amazonia. The results of the analysis of the neighbor relationships of
the four tree species of commercial interest in the state of Amazonas, Brosimum spp.,
Eschweilera coriacea, Ocotea cernua, and Protium hebetatum, demonstrated a high
occurrence of conspecific neighbors of the focal species, principally at short
distances, showing that the focal species are more subject to intraspecific
interactions, showing a taxonomic pattern associated with the focal species. The
spatial structure, more than the abundance of the focal species Brosimum spp. and
Ocotea cernua, contributed to the encounters of conspecifics of the two species,
evidencing the importance of spatial structure for ecological interactions. Rare
species occurred associated with the focal species, principally with Protium
hebetatum, once more emphasizing the importance of defining management
strategies to prevent local extinctions of rare species. This thesis contributed to
knowledge of the floristic composition and spatial structure of the tree species of the
terra firme dense forest in Amazonia, thus supporting actions for the management,
conservation, and restoration of tropical forests.
1
INTRODUÇÃO GERAL
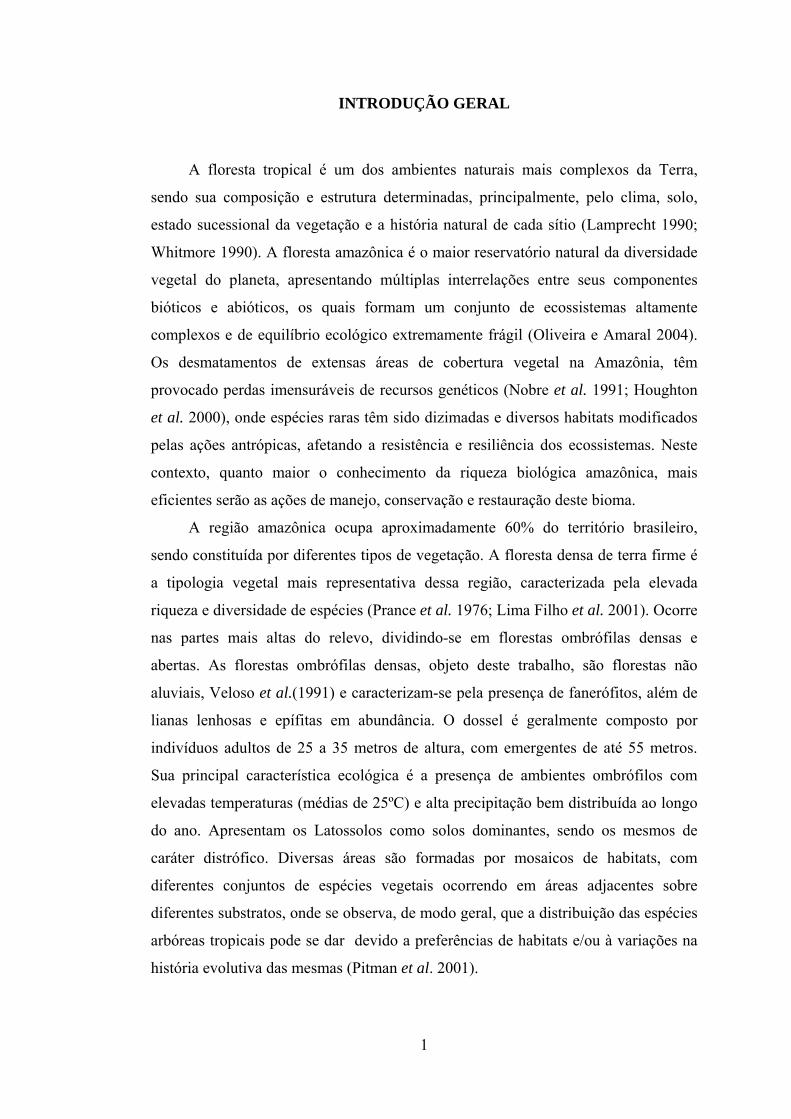
A floresta tropical é um dos ambientes naturais mais complexos da Terra,
sendo sua composição e estrutura determinadas, principalmente, pelo clima, solo,
estado sucessional da vegetação e a história natural de cada sítio (Lamprecht 1990;
Whitmore 1990). A floresta amazônica é o maior reservatório natural da diversidade
vegetal do planeta, apresentando múltiplas interrelações entre seus componentes
bióticos e abióticos, os quais formam um conjunto de ecossistemas altamente
complexos e de equilíbrio ecológico extremamente frágil (Oliveira e Amaral 2004).
Os desmatamentos de extensas áreas de cobertura vegetal na Amazônia, têm
provocado perdas imensuráveis de recursos genéticos (Nobre et al. 1991; Houghton
et al. 2000), onde espécies raras têm sido dizimadas e diversos habitats modificados
pelas ações antrópicas, afetando a resistência e resiliência dos ecossistemas. Neste
contexto, quanto maior o conhecimento da riqueza biológica amazônica, mais
eficientes serão as ações de manejo, conservação e restauração deste bioma.
A região amazônica ocupa aproximadamente 60% do território brasileiro,
sendo constituída por diferentes tipos de vegetação. A floresta densa de terra firme é
a tipologia vegetal mais representativa dessa região, caracterizada pela elevada
riqueza e diversidade de espécies (Prance et al. 1976; Lima Filho et al. 2001). Ocorre
nas partes mais altas do relevo, dividindo-se em florestas ombrófilas densas e
abertas. As florestas ombrófilas densas, objeto deste trabalho, são florestas não
aluviais, Veloso et al.(1991) e caracterizam-se pela presença de fanerófitos, além de
lianas lenhosas e epífitas em abundância. O dossel é geralmente composto por
indivíduos adultos de 25 a 35 metros de altura, com emergentes de até 55 metros.
Sua principal característica ecológica é a presença de ambientes ombrófilos com
elevadas temperaturas (médias de 25ºC) e alta precipitação bem distribuída ao longo
do ano. Apresentam os Latossolos como solos dominantes, sendo os mesmos de
caráter distrófico. Diversas áreas são formadas por mosaicos de habitats, com
diferentes conjuntos de espécies vegetais ocorrendo em áreas adjacentes sobre
diferentes substratos, onde se observa, de modo geral, que a distribuição das espécies
arbóreas tropicais pode se dar devido a preferências de habitats e/ou à variações na
história evolutiva das mesmas (Pitman et al. 2001).
2
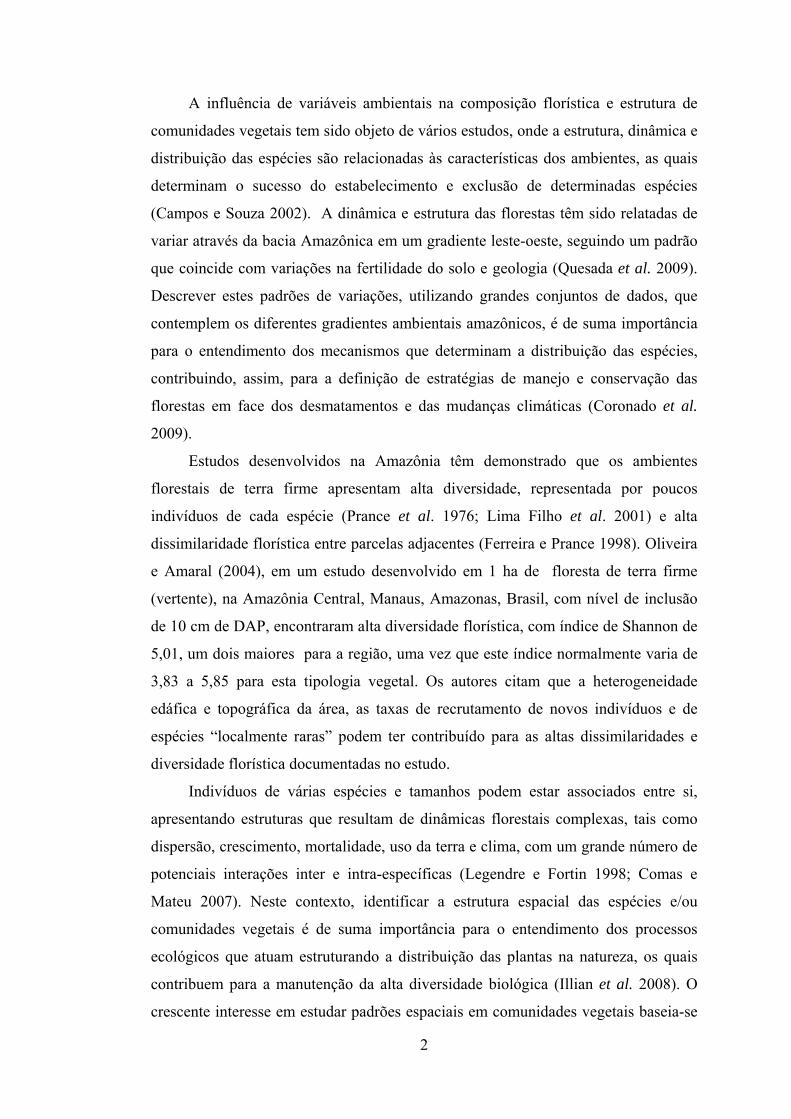
A influência de variáveis ambientais na composição florística e estrutura de
comunidades vegetais tem sido objeto de vários estudos, onde a estrutura, dinâmica e
distribuição das espécies são relacionadas às características dos ambientes, as quais
determinam o sucesso do estabelecimento e exclusão de determinadas espécies
(Campos e Souza 2002). A dinâmica e estrutura das florestas têm sido relatadas de
variar através da bacia Amazônica em um gradiente leste-oeste, seguindo um padrão
que coincide com variações na fertilidade do solo e geologia (Quesada et al. 2009).
Descrever estes padrões de variações, utilizando grandes conjuntos de dados, que
contemplem os diferentes gradientes ambientais amazônicos, é de suma importância
para o entendimento dos mecanismos que determinam a distribuição das espécies,
contribuindo, assim, para a definição de estratégias de manejo e conservação das
florestas em face dos desmatamentos e das mudanças climáticas (Coronado et al.
2009).
Estudos desenvolvidos na Amazônia têm demonstrado que os ambientes
florestais de terra firme apresentam alta diversidade, representada por poucos
indivíduos de cada espécie (Prance et al. 1976; Lima Filho et al. 2001) e alta
dissimilaridade florística entre parcelas adjacentes (Ferreira e Prance 1998). Oliveira
e Amaral (2004), em um estudo desenvolvido em 1 ha de floresta de terra firme
(vertente), na Amazônia Central, Manaus, Amazonas, Brasil, com nível de inclusão
de 10 cm de DAP, encontraram alta diversidade florística, com índice de Shannon de
5,01, um dois maiores para a região, uma vez que este índice normalmente varia de
3,83 a 5,85 para esta tipologia vegetal. Os autores citam que a heterogeneidade
edáfica e topográfica da área, as taxas de recrutamento de novos indivíduos e de
espécies “localmente raras” podem ter contribuído para as altas dissimilaridades e
diversidade florística documentadas no estudo.
Indivíduos de várias espécies e tamanhos podem estar associados entre si,
apresentando estruturas que resultam de dinâmicas florestais complexas, tais como
dispersão, crescimento, mortalidade, uso da terra e clima, com um grande número de
potenciais interações inter e intra-específicas (Legendre e Fortin 1998; Comas e
Mateu 2007). Neste contexto, identificar a estrutura espacial das espécies e/ou
comunidades vegetais é de suma importância para o entendimento dos processos
ecológicos que atuam estruturando a distribuição das plantas na natureza, os quais
contribuem para a manutenção da alta diversidade biológica (Illian et al. 2008). O
crescente interesse em estudar padrões espaciais em comunidades vegetais baseia-se
3
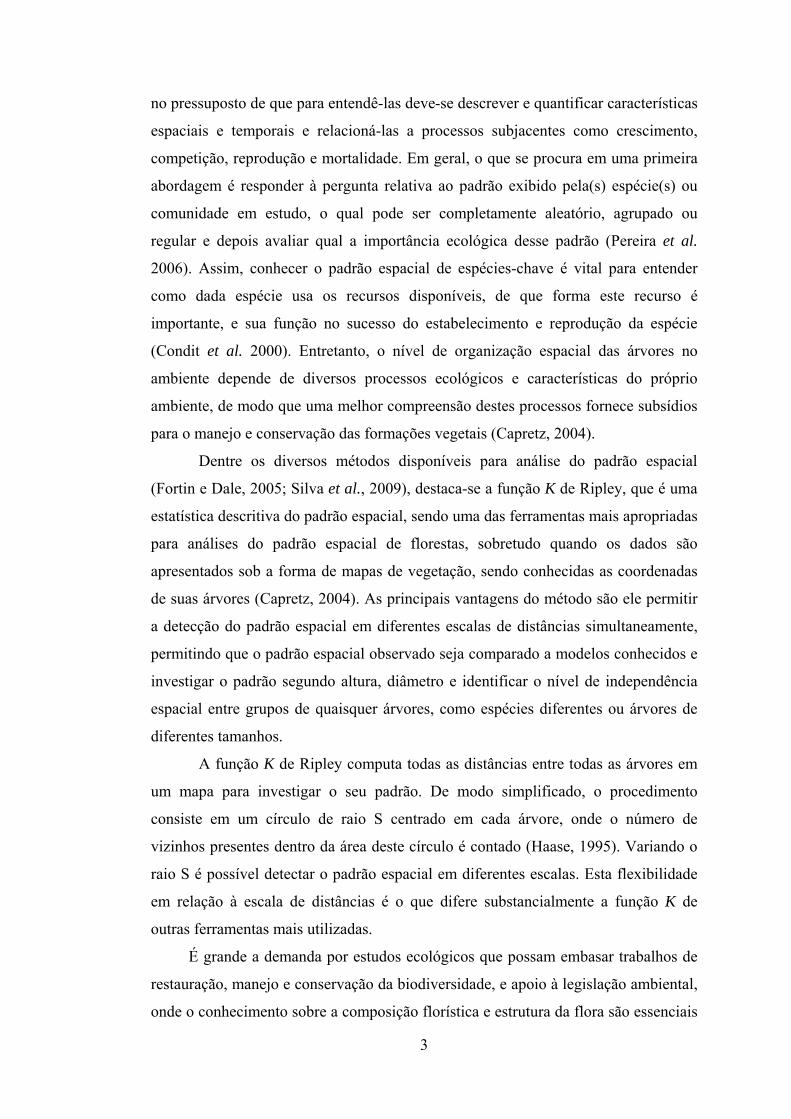
no pressuposto de que para entendê-las deve-se descrever e quantificar características
espaciais e temporais e relacioná-las a processos subjacentes como crescimento,
competição, reprodução e mortalidade. Em geral, o que se procura em uma primeira
abordagem é responder à pergunta relativa ao padrão exibido pela(s) espécie(s) ou
comunidade em estudo, o qual pode ser completamente aleatório, agrupado ou
regular e depois avaliar qual a importância ecológica desse padrão (Pereira et al.
2006). Assim, conhecer o padrão espacial de espécies-chave é vital para entender
como dada espécie usa os recursos disponíveis, de que forma este recurso é
importante, e sua função no sucesso do estabelecimento e reprodução da espécie
(Condit et al. 2000). Entretanto, o nível de organização espacial das árvores no
ambiente depende de diversos processos ecológicos e características do próprio
ambiente, de modo que uma melhor compreensão destes processos fornece subsídios
para o manejo e conservação das formações vegetais (Capretz, 2004).
Dentre os diversos métodos disponíveis para análise do padrão espacial
(Fortin e Dale, 2005; Silva et al., 2009), destaca-se a função K de Ripley, que é uma
estatística descritiva do padrão espacial, sendo uma das ferramentas mais apropriadas
para análises do padrão espacial de florestas, sobretudo quando os dados são
apresentados sob a forma de mapas de vegetação, sendo conhecidas as coordenadas
de suas árvores (Capretz, 2004). As principais vantagens do método são ele permitir
a detecção do padrão espacial em diferentes escalas de distâncias simultaneamente,
permitindo que o padrão espacial observado seja comparado a modelos conhecidos e
investigar o padrão segundo altura, diâmetro e identificar o nível de independência
espacial entre grupos de quaisquer árvores, como espécies diferentes ou árvores de
diferentes tamanhos.
A função K de Ripley computa todas as distâncias entre todas as árvores em
um mapa para investigar o seu padrão. De modo simplificado, o procedimento
consiste em um círculo de raio S centrado em cada árvore, onde o número de
vizinhos presentes dentro da área deste círculo é contado (Haase, 1995). Variando o
raio S é possível detectar o padrão espacial em diferentes escalas. Esta flexibilidade
em relação à escala de distâncias é o que difere substancialmente a função K de
outras ferramentas mais utilizadas.
É grande a demanda por estudos ecológicos que possam embasar trabalhos de
restauração, manejo e conservação da biodiversidade, e apoio à legislação ambiental,
onde o conhecimento sobre a composição florística e estrutura da flora são essenciais
4
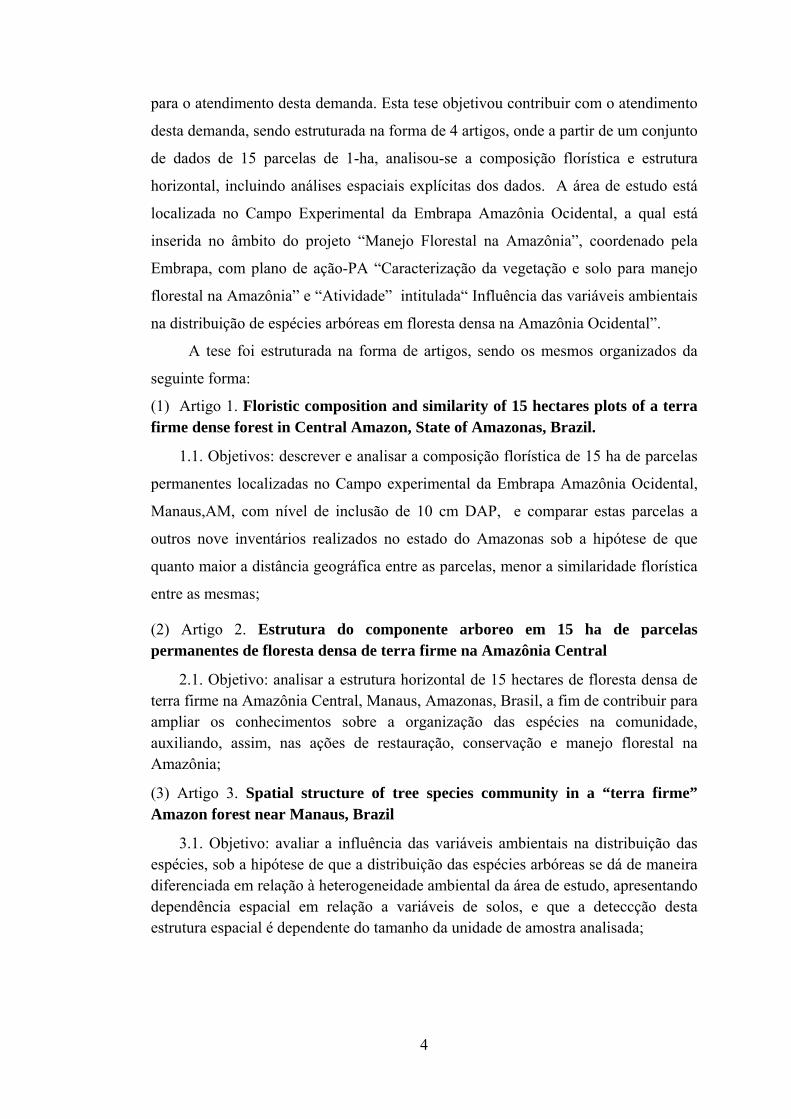
para o atendimento desta demanda. Esta tese objetivou contribuir com o atendimento
desta demanda, sendo estruturada na forma de 4 artigos, onde a partir de um conjunto
de dados de 15 parcelas de 1-ha, analisou-se a composição florística e estrutura
horizontal, incluindo análises espaciais explícitas dos dados. A área de estudo está
localizada no Campo Experimental da Embrapa Amazônia Ocidental, a qual está
inserida no âmbito do projeto “Manejo Florestal na Amazônia”, coordenado pela
Embrapa, com plano de ação-PA “Caracterização da vegetação e solo para manejo
florestal na Amazônia” e “Atividade” intitulada“ Influência das variáveis ambientais
na distribuição de espécies arbóreas em floresta densa na Amazônia Ocidental”.
A tese foi estruturada na forma de artigos, sendo os mesmos organizados da
seguinte forma:
(1) Artigo 1. Floristic composition and similarity of 15 hectares plots of a terra firme dense forest in Central Amazon, State of Amazonas, Brazil.
1.1. Objetivos: descrever e analisar a composição florística de 15 ha de parcelas
permanentes localizadas no Campo experimental da Embrapa Amazônia Ocidental,
Manaus,AM, com nível de inclusão de 10 cm DAP, e comparar estas parcelas a
outros nove inventários realizados no estado do Amazonas sob a hipótese de que
quanto maior a distância geográfica entre as parcelas, menor a similaridade florística
entre as mesmas;
(2) Artigo 2. Estrutura do componente arboreo em 15 ha de parcelas permanentes de floresta densa de terra firme na Amazônia Central
2.1. Objetivo: analisar a estrutura horizontal de 15 hectares de floresta densa de terra firme na Amazônia Central, Manaus, Amazonas, Brasil, a fim de contribuir para ampliar os conhecimentos sobre a organização das espécies na comunidade, auxiliando, assim, nas ações de restauração, conservação e manejo florestal na Amazônia;
(3) Artigo 3. Spatial structure of tree species community in a “terra firme” Amazon forest near Manaus, Brazil
3.1. Objetivo: avaliar a influência das variáveis ambientais na distribuição das espécies, sob a hipótese de que a distribuição das espécies arbóreas se dá de maneira diferenciada em relação à heterogeneidade ambiental da área de estudo, apresentando dependência espacial em relação a variáveis de solos, e que a deteccção desta estrutura espacial é dependente do tamanho da unidade de amostra analisada;
5
(4) Artigo 4. Neighbour`s Identity of Commercial Tree Species in a Tropical Rainforest Near Manaus, Brazil.
4.1. Objetivo: analisar as relações de vizinhança de quatro espécies arbóreas de interesse comercial no estado do Amazonas (Brosimum spp., Eschweilera coriacea, Ocotea cernua e Protium hebetatum), sob a hipótese de que há um padrão taxonômico na ocorrência dos 20 vizinhos mais próximos destas espécies focais, caracterizado principalmente pela ocorrência de vizinhos conspecíficos, onde o conhecimento deste padrão contribui para o manejo e manutenção da estrutura dos ecossistemas e das interações entre as espécies.
Referências
Campos, J.B., Souza, M.C. 2002. Arboreous vegetation of an alluvial riparian forest
and their soil relatons. Porto Rico Island, Paraná River, Brazil. Brazilian
Archives of Biology and Technology, 45: 137-149.
Capretz, R.L. 2004. Análise dos padrões espaciais de árvores em quatro formações
florestais do estado de São Paulo, através de análises de segunda ordem, com a
função K de Ripley. Piracicaba-ESALQ. 93p. (Dissertação de Mestrado).
Comas C., Mateu J. 2007. Modelling forest dynamics: a perspective from point
process methods. Biometrical Journal, 49:176-196.
Condit, R.; Ashton, P.; Baker, P. 2000. Spatial patterns in the distribution of tropical
tree species. Science, 288:1414-1418.
Coronado E.N.H. et al. 2009. Multi-scale comparisons of tree composition in
Amazonian terra firme forests. Biogeosciences Discussions, 6: 2719-2731.
Ferreira, L.V., Prance, G.T. 1998. Species richness and floristic composition in four
hectares in the Jaú National Park in upland forests in Central Amazonia.
Biodiversity and Conservation, 7: 1349-1364.
Houghton, R.A., Skole, D.L., Nobre, C.A., Hackler, J.L., Lawrence, K.T.,
Chomentowski, W.H. 2000. Annual fluxes of carbon from deforestation and
regrowth in the Brazilian Amazon. Nature, 301-304.
Illian J., Penttinen A., Stoyan H., Stoyan D. 2008. Statistical Analysis and Modelling
of Spatial Point Patterns. Wiley, England.534pp.
Lamprecht, H. 1990. Silvicultura nos Trópicos: ecossistemas florestais e respectivas
espécies arbóreas: possibilidades e métodos de aproveitamento. Rossforf: TZ-
verl.-Ges., -GTZ. 343pp.
6
Legendre P, Fortin M-J. 1989. Spatial pattern and ecological analysis. Vegetatio 80:
107-138
Lima filho, D.A., Matos, F.D.A., Amaral, I.L., Revilla, J., Coelho, L.S., Ramos, J.F.,
Santos, J.L. 2001. Inventário florístico de floresta ombrófila densa de terra
firme, na região do Rio Urucu-Amazonas, Brasil. Acta Amazônica, 31: 565-579.
Nobre, C.A., Sellers, P., Shukla, J. 1991. Amazonian deforestation and regional
climate change. Journal of Climate, 4: 957-988.
Oliveira, A.N., Amaral, I.L. 2004. Florística e fitossociologia de uma floresta de
vertente na Amazônia Central, Amazonas, Brasil. Acta Amazônica, 34: 21-34.
Pereira, A.A., Netto, S.P., Carvalho, L.M.T. 2006. Análise da distribuição especial
de jequitibá rosa em uma floresta estacional sub-montana. Rev. Acad., 2: 21-34.
Pitman, N.C.M., Terborg, J.W., Silvan, S.R., Nunes, P.V., Neil, D.A., Ceron, C.E.,
Palacios, W.A. 2001. Dominance and distribution of tree species in upper
Amazonia terra firme. Ecology 82: 2101-2117.
Prance, G.T., Rodrigues, W.A., Silva, M.F. 1976. Inventário florestal de um hectare
de mata de terra firme, km 30 da estrada Manaus-Itacoatiara. Acta Amazônica,
6: 9-35.
Quesada, C.A. et al. 2009. Regional and large-scale patterns in Amazon forest
structure and function are mediated by variations in soil physical and chemical
properties. Biogeosciences Discussions, 6: 3993-4057.
Silva, K.E. et al. 2009. Padrões espaciais de espécies arbóreas tropicais, p. 217-244.
In S.V. Martins (ed). Ecologia de florestas tropicais do Brasil. Editora UFV.
Universidade Federal de Viçosa, Viçosa, Brasil.
Veloso, H.P., Rangel-Filho, A.L.R., Lima, J.C.A. 1991.Classificação da vegetação
brasileira adaptada a um sistema universal. Rio de Janeiro, IBGE. 124pp.
Whitmore, T.C. 1990. An introduction to tropical rain forests. Oxford: Clarendon,
226pp.
7
Artigo 1
Floristic composition and similarity of 15 hectares plots of a terra firme dense forest in Central Amazon, state of Amazonas, Brazil.
Abstract: Investigating the high diversity in tropical forests brings up relevant
contributions to the understanding of mechanisms that allow and maintain such diversity. In
the present study we described the species composition and diversity of 15 1-ha plots in the
Amazonian “terra firme” dense forest in Brazil, and compared the floristic similarity of this
plots with nine others 1ha size, hypothesizing that the smaller the geographic distance the
more similar they are. The 15 plots were randomly selected in 2005 from permanent plots at
the Embrapa Experimental site, State of Amazonas. The floristic composition and diversity
were analysed by using species/area curve and Shannon’s index, and the similarity analysis
was done by applying the Sorensen’s index for similarity and Unweighted pair-group
average (UPGMA) as clustering method. Mantel test was performed to study if the
differences in species composition between sites could be explained by the geographic
distance among them. Overall, we identified 8,771 individuals distributed into 264 species
and 53 families. The majority of species were concentrated in few families and few species
have large number of individuals. The families with more species richness were: Fabaceae-
Faboideae (22sps.), Fabaceae-Mimosoideae (22), Sapotaceae (22), Lecythidaceae (15) and
Lauraceae (13), but Burseraceae was the one with more number of individuals, with 11.8%
of the total. The ten most abundant species were: Protium hebetatum Daly (1037
individuals), Eschweilera coriacea (DC.) S.A. Mori (471), Licania oblongifolia Standl.
(310), Pouteria minima T.D.Penn. (293), Ocotea cernua (Nees) Mez s.l. (258), Scleronema
micranthum Ducke (197), Eschweilera collina Eyma (176), Licania apelata (E.Mey.) Fritsch
(172), Naucleopsis caloneura (Huber) Ducke (170) and Psidium araca Raddi (152), which
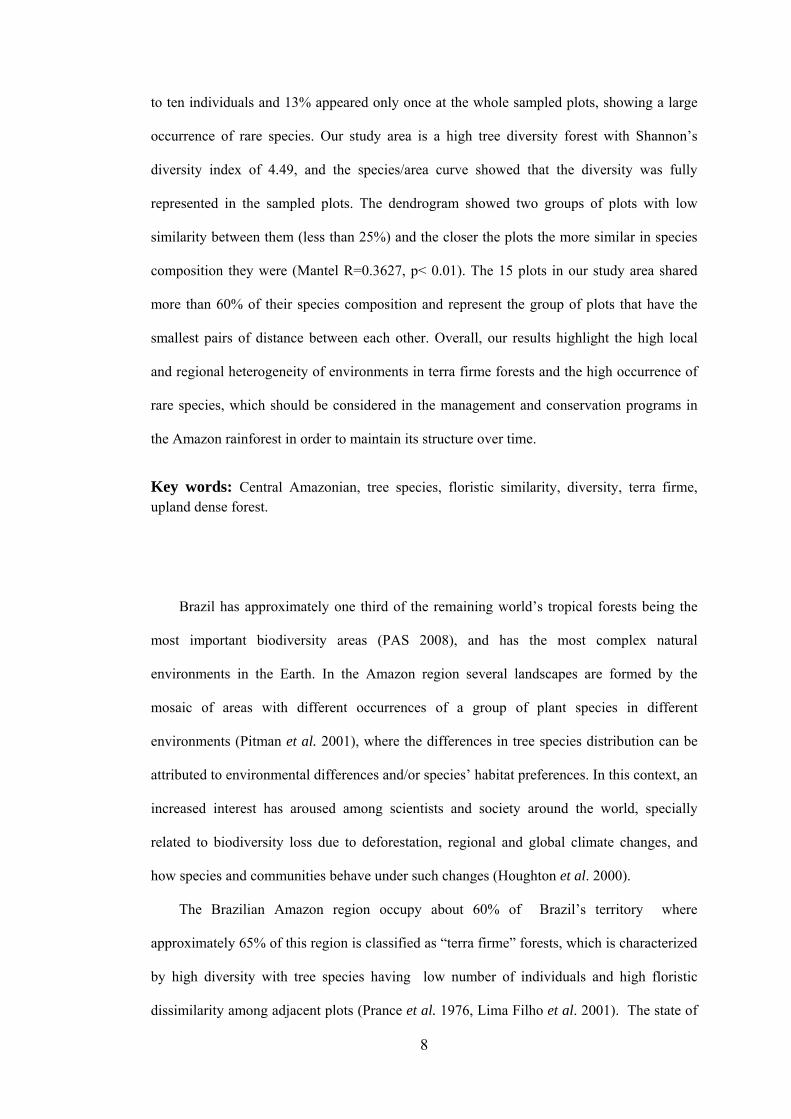
represented 36.5% of the total number of individuals. Approximately 49% of species had up
8
to ten individuals and 13% appeared only once at the whole sampled plots, showing a large
occurrence of rare species. Our study area is a high tree diversity forest with Shannon’s
diversity index of 4.49, and the species/area curve showed that the diversity was fully
represented in the sampled plots. The dendrogram showed two groups of plots with low
similarity between them (less than 25%) and the closer the plots the more similar in species
composition they were (Mantel R=0.3627, p< 0.01). The 15 plots in our study area shared
more than 60% of their species composition and represent the group of plots that have the
smallest pairs of distance between each other. Overall, our results highlight the high local
and regional heterogeneity of environments in terra firme forests and the high occurrence of
rare species, which should be considered in the management and conservation programs in
the Amazon rainforest in order to maintain its structure over time.
Key words: Central Amazonian, tree species, floristic similarity, diversity, terra firme, upland dense forest.
Brazil has approximately one third of the remaining world’s tropical forests being the
most important biodiversity areas (PAS 2008), and has the most complex natural
environments in the Earth. In the Amazon region several landscapes are formed by the
mosaic of areas with different occurrences of a group of plant species in different
environments (Pitman et al. 2001), where the differences in tree species distribution can be
attributed to environmental differences and/or species’ habitat preferences. In this context, an
increased interest has aroused among scientists and society around the world, specially
related to biodiversity loss due to deforestation, regional and global climate changes, and
how species and communities behave under such changes (Houghton et al. 2000).
The Brazilian Amazon region occupy about 60% of Brazil’s territory where
approximately 65% of this region is classified as “terra firme” forests, which is characterized
by high diversity with tree species having low number of individuals and high floristic
dissimilarity among adjacent plots (Prance et al. 1976, Lima Filho et al. 2001). The state of

9
Amazonas has 1.5 million square kilometers in extension and large heterogeneity in natural
ecosystems. Oliveira and Amaral (2004), studying a terra firme forest near Manaus,
Amazon State, found in 1-ha plot with minimum diameter of 10 cm, 239 species and
Shannon’s diversity index of 5.01, revealing a high diversity in such forests.
Edaphic and climate factors, such as precipitation and drought regimes are regarded as
the most important factors responsible for high plant diversity in Amazon, resulting in high
dissimilarity between plant communities, which in some cases has also been associated to
topographic variations (Gentry 1988, Tuomisto et al.1995, Coronado et al. 2009). Then, it
has been documented that, even in closer plots, low similarity in terra firme forests can be
observed (Ferreira and Prance 1998). Other authors associated the increased species richness
to the natural dynamics of mortality and recruitment (Phillips et al. 1994).
There is an increased demand for ecological studies, specially about the floristic
composition and structure of tropical rainforests, which can base actions for restoration,
conservation and management of natural resources, that can prevent the extinction of rare
and low- abundant species and could contribute to the maintenance of the high diversity of
species and habitat in the several areas around this vast and complex Amazon region.
The aim of this paper is to describe and analyse the floristic composition and diversity
in the large survey of 15 1-ha plots in terra firme tropical rainforest at the Embrapa
Experimental site, situated in Western Amazon, Manaus, state of Amazonas, Brazil and
compare the floristic composition of these 15 plots with other nine plots spread over the
Amazonas State, hypothesizing that higher similarities are observed in geographically closer
plots.
MATERIALS AND METHODS
Study site: The study area is located in a terra firme dense forest of Central Amazon, at
the Embrapa Experimental site, Western Amazon, Manaus, state of Amazonas, Brazil,
measuring 15-ha. The study area was randomly selected from 400 permanent 1-ha plots,
10
belonging to the forest management project, which is being developed at Amazon region in
Brazil.
The climate is tropical, type “Am” (Koppen classification), with a mean annual rainfall
ranging from 1355 to 2839 mm. The mean annual temperature ranges from 25.6°C to 27.6
°C, with relative humidity from 84 to 90% (RADAM 1978). On a broad scale, soils are fairly
homogeneous throughout the stands; heavy-textured dystrophic yellow latosol predominates,
covered mainly by dense forest with emergent trees (IBGE 1999), but with a degree of local
variation in topographic and edaphic conditions. The upland areas are plateaus formed by
Tertiary sediments that cover the largest portion of the Amazon sedimentary basin, shaped
by landforms dissected in extensive interfluvial plateaus and hills (Regis 1993).
Field sampling: From the area of 400 1-ha sized plots, 15 plots were randomly chosen in
order to investigate the diversity, floristic composition, and similarity among nine other terra
firme forests in the same Amazonas state. The 15 plots measure 100 x100m and had their
topographic position recorded as top, slope and base. All trees ≥ 10 cm dbh (diameter at
breast height) were tagged in 2005 and botanically classified according to species level. The
botanical material was identified by specialist at the herbarium of the Instituto Nacional de
Pesquisas da Amazonia, Manaus (INPA) and by experts and specialized literature (Ribeiro et
al. 1999). The names were checked with the database from the Missouri Botanical Garden.
For the floristic similarity analysis, 24 plots were used (Table 1), consisting of 15 plots
from our present study, called “EMB” plus the plot number and nine other plots coming
from different surveys at the Amazonas State, located in the same forest typology, i.e., terra
firme tropical rainforests, measuring . All plots are1ha sized (100 x 100 m) and had trees
with dbh ≥ 10 cm inventoried. Of the nine plots used, all are positioned at the top position
(plateaus) according to topography, excepting “ZF2B and ZF2V”, located in the base and
slope position, respectively. The list of species from the nine plots was obtained from
published and unpublished surveys done by INPA’s researchers and others. The coordinates
of the all plots were defined by their centroid.

11
TABLE 1
Information source for inventories in 100m x 100m plots with a minimum of 10 cm DAP, carried out in state of Amazonas, Brazil.
Site Lat. Long. Source EEST -2º 35’ 53.77” -60º 02’ 52.69” (Matos 2006)
IPIR -2º 58’ 09.8” -59º 54’ 18.0” (Matos 2006) ITAP -2° 33' 30" -58° 23' (Amaral et al. 2000)
JURUA -6º 36’ -67º 19’ 30” Not published-INPA/CPBO*
ZFkm14 -2º 35’ 32,2” -60º 06’ 40” (Sposito et al. 2007) ZF2B -2° 35' 45" -60° 12' 40" (Formiga 2004) ZF2P -2° 35' 45" -60° 12' 40" (Oliveira et al. 2008)
ZF2V -2° 35' 45" -60° 12' 40" (Oliveira and Amaral 2004)
ZFkm37 -2º 26’ 22.6” -59º 47’ 48.5” (Sposito et al. 2007) EMB14 -2° 31.99' -60° 0.25' This paper EMB15 -2° 31.94' -60° 0.26' This paper EMB24 -2° 32.52' -60° 0.09' This paper EMB39 -2° 31.71' -60° 0.25' This paper EMB76 -2° 31.85' -60° 0.11' This paper EMB103 -2° 32.53' -59° 59.86' This paper EMB106 -2° 32.37' -59° 59.9' This paper EMB107 -2° 32.31' -59° 59.91' This paper EMB144 -2° 32.45' -59° 59.77' This paper EMB149 -2° 32.18' -59° 59.82' This paper EMB150 -2° 32.13' -59° 59.83' This paper EMB165 -2° 32.39' -59° 59.73' This paper EMB272 -2° 31.96' -59° 59.53' This paper EMB273 -2° 31.91' -59° 59.54' This paper EMB274 -2° 31.85' -59° 59.55' This paper * INPA/CPBO(Instituto Nacional de Pesquisas da Amazonia/Coordenação de Pesquisas em Botânica)
Data analyses: The floristic diversity was estimated by the species richness and by the
Shannon-Wiener’s index (Magurran 1988). The data diversity and floristic composition was
analysed by using Mata Nativa software (Cientec 2006). The species/area curve was drawn
by crossing the cumulative number of species by area size, and the floristic similarity
analyses was done by using the Sorensen’s similarity index, clustered by the Unweighted
pair-group average (UPGMA) method (Legendre and Legendre 1998). The PAST 1.94
software was used for these analyses (Hammer et al. 2009). To measure the influence of
12
geographical distance on floristic composition among 24 sites, and within 15 EMB plots and
within the nine plots alone, Mantel test (r) (Fortin and Dale 2005) was applied. The test was
based on two matrixes; one of geographical distance (Euclidean distance) and another
generated by converting the similarity matrix previously cited, on distance (dissimilarity),
where the values were subtracted from one. Permutation test was applied to verify the
significance of Mantel coefficients. The Mantel test was performed by using Passage 1
software (Rosenberg 2005).
RESULTS
A total of 8,771 individuals distributed into 264 species and 53 families were identified in 15
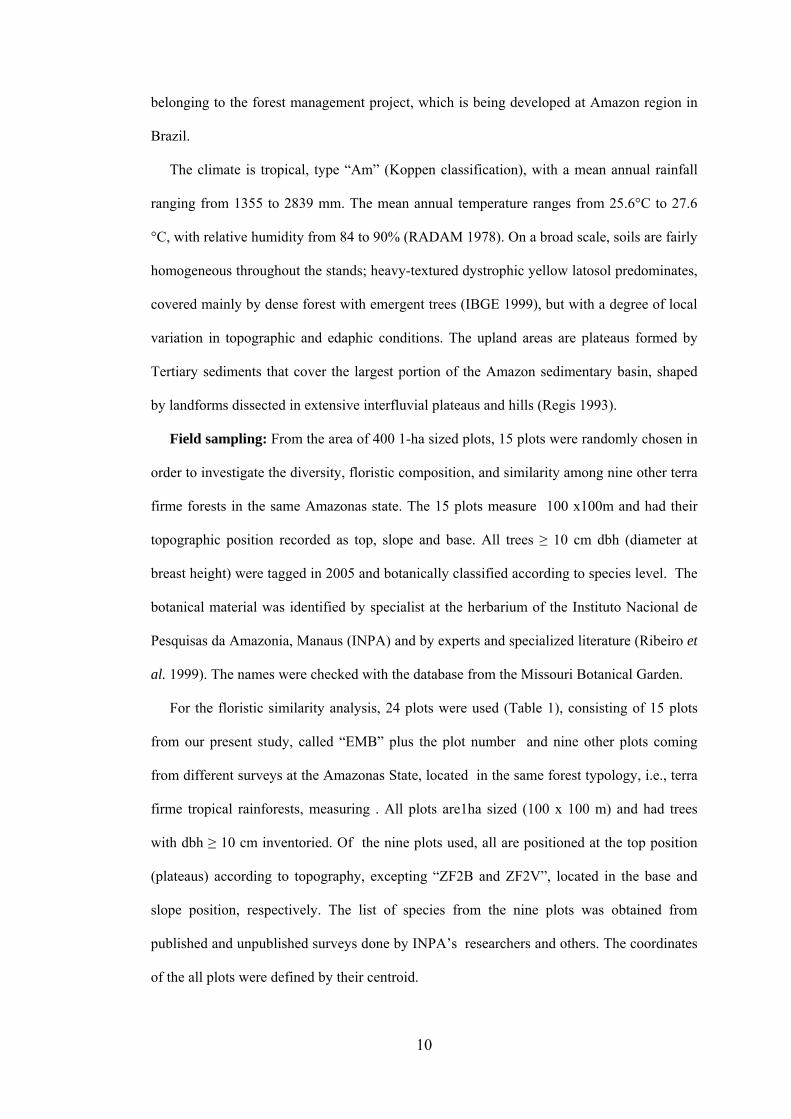
1-ha sized plots, at Embrapa Experimental site (Annex 1). The majority number of plots
(66%) was completely positioned in top position according to topography.Three of them
presented a gradient in top and slope, another one of them is completely in a base position
and other is in the slope and base (Fig.1).
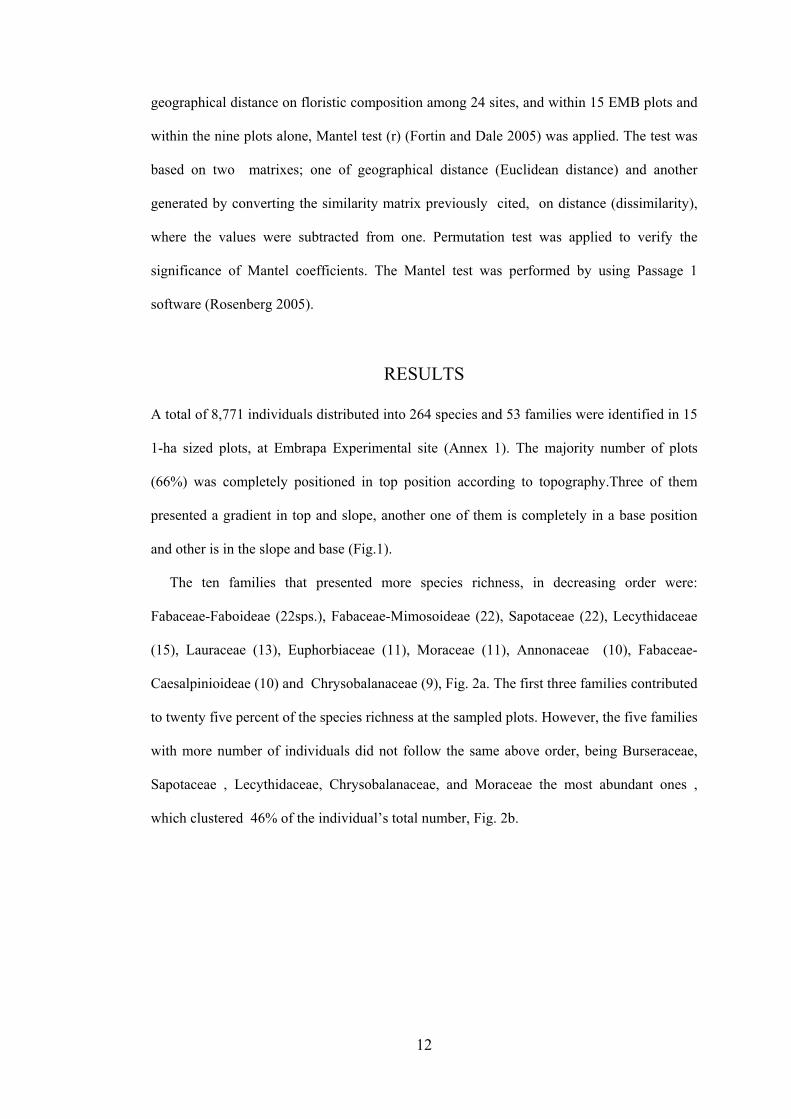
The ten families that presented more species richness, in decreasing order were:
Fabaceae-Faboideae (22sps.), Fabaceae-Mimosoideae (22), Sapotaceae (22), Lecythidaceae
(15), Lauraceae (13), Euphorbiaceae (11), Moraceae (11), Annonaceae (10), Fabaceae-
Caesalpinioideae (10) and Chrysobalanaceae (9), Fig. 2a. The first three families contributed
to twenty five percent of the species richness at the sampled plots. However, the five families
with more number of individuals did not follow the same above order, being Burseraceae,
Sapotaceae , Lecythidaceae, Chrysobalanaceae, and Moraceae the most abundant ones ,
which clustered 46% of the individual’s total number, Fig. 2b.
13
Fig. 1.Topographic position of 15 1ha sized plots at Embrapa Experimental site, Manaus,
state of Amazonas, Brazil.
Fig. 2. Families with more number of species (a) and individuals (b) identified at 15 1ha
sized plots at Embrapa Experimental site, Manaus, state of Amazonas, Brazil.
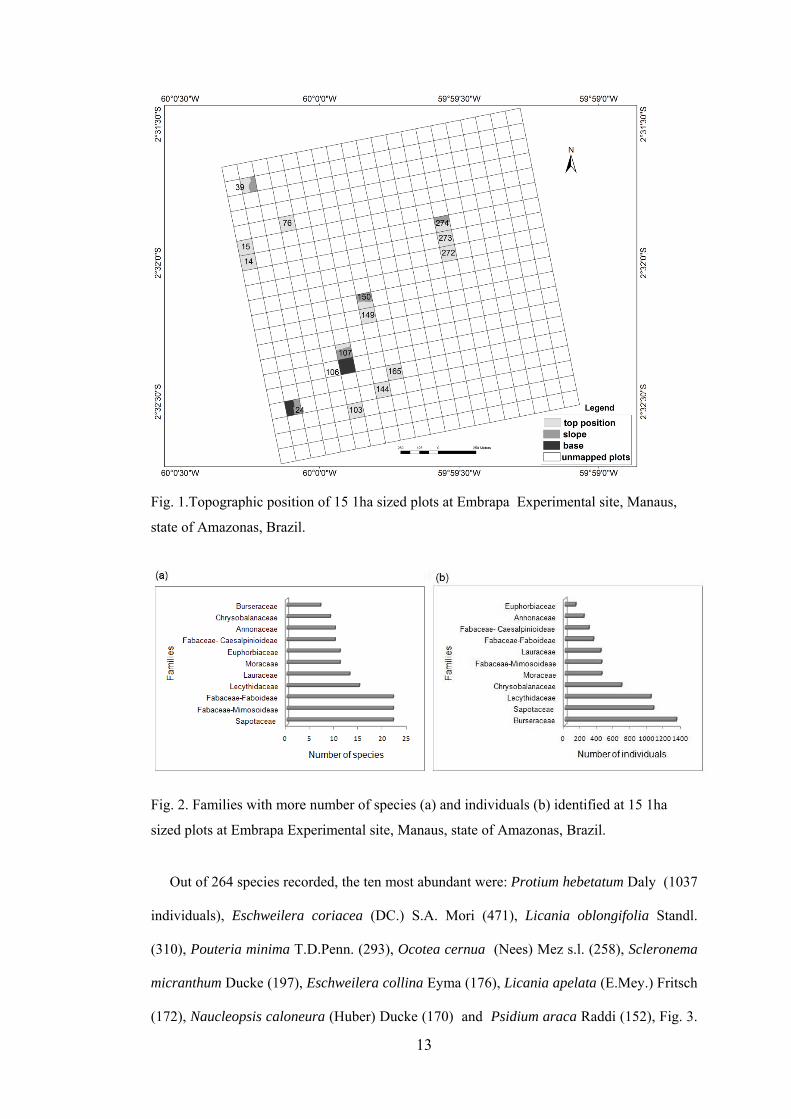
Out of 264 species recorded, the ten most abundant were: Protium hebetatum Daly (1037
individuals), Eschweilera coriacea (DC.) S.A. Mori (471), Licania oblongifolia Standl.
(310), Pouteria minima T.D.Penn. (293), Ocotea cernua (Nees) Mez s.l. (258), Scleronema
micranthum Ducke (197), Eschweilera collina Eyma (176), Licania apelata (E.Mey.) Fritsch
(172), Naucleopsis caloneura (Huber) Ducke (170) and Psidium araca Raddi (152), Fig. 3.
14
These species represent 36.5% of the total number of individuals, and only Protium
hebetatum, Burseraceae family has 11.8% of the relative abundance.
Fig.3. Species ranked by the number of individuals, highlighting the most abundant ones
among Pisidium araca and Protium hebetatum at Embrapa Experimental site, Manaus, state
of Amazonas, Brazil.
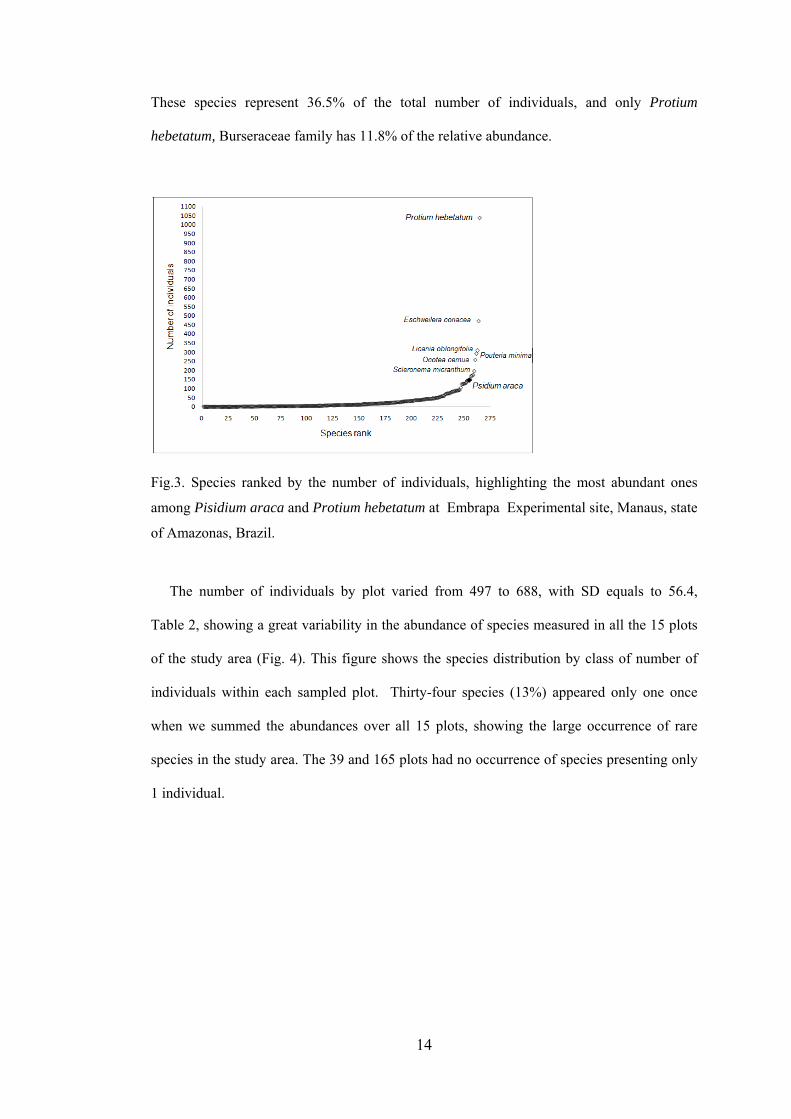
The number of individuals by plot varied from 497 to 688, with SD equals to 56.4,
Table 2, showing a great variability in the abundance of species measured in all the 15 plots
of the study area (Fig. 4). This figure shows the species distribution by class of number of
individuals within each sampled plot. Thirty-four species (13%) appeared only one once
when we summed the abundances over all 15 plots, showing the large occurrence of rare
species in the study area. The 39 and 165 plots had no occurrence of species presenting only
1 individual.
15
Fig. 4. Occurrence of species by class of number of individuals at each inventoried plots,
summed in all 15 plots at the Embrapa Experimental site, Manaus, Amazonas state, Brazil.
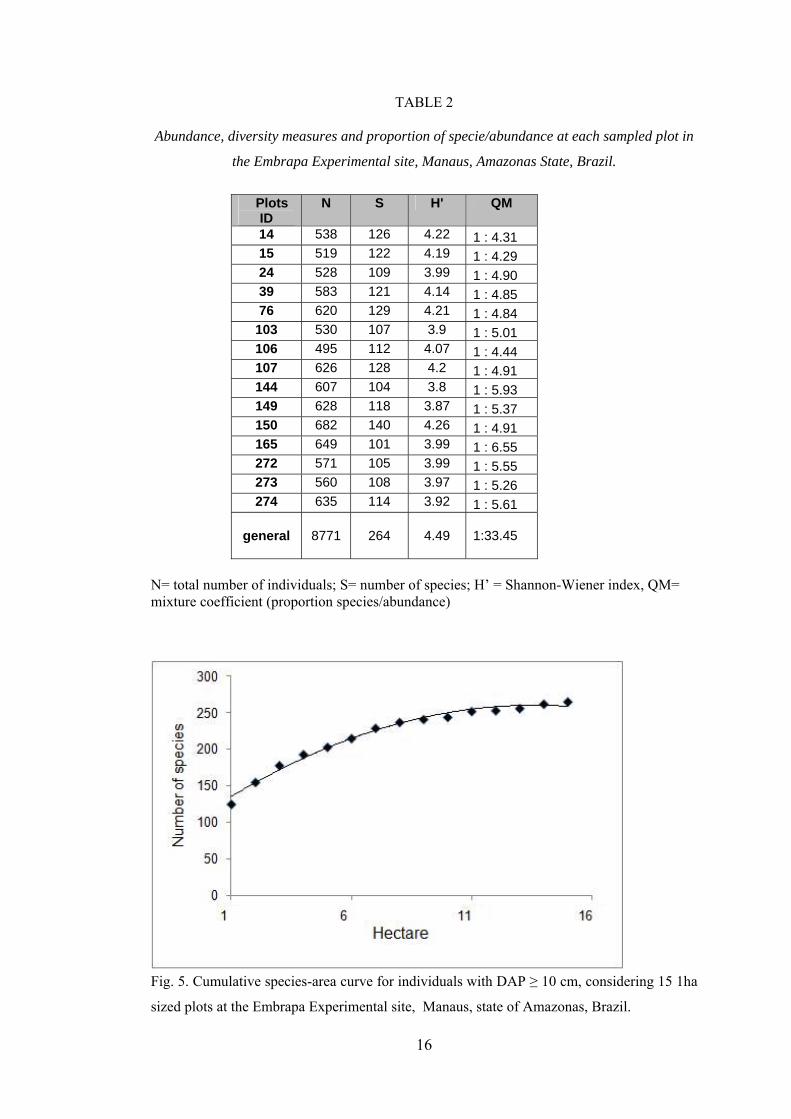
The Shannon’s diversity index ranged between 3.8 and 4.22 among 15 plots and showed
the value of 4.49 as the general index (Table 2). The cumulative species-area curve ( Fig. 5),
shows that the diversity in the study area was fully represented by the sampled plots.
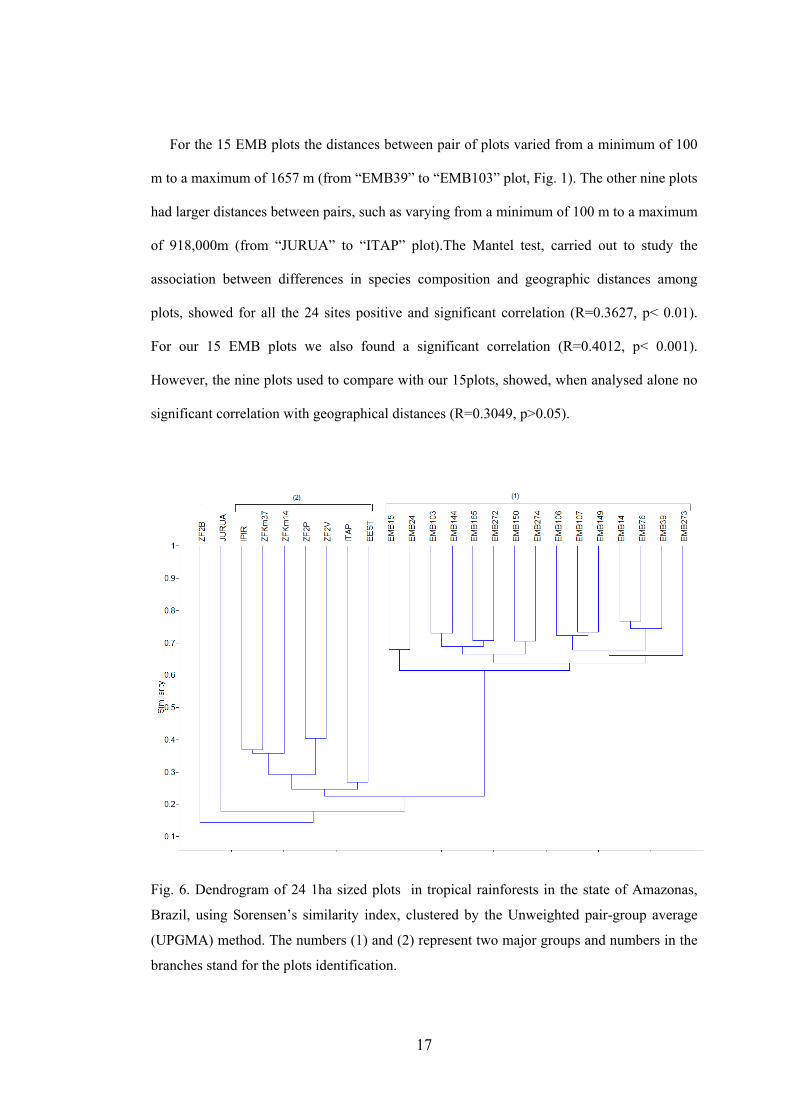
Our floristic similarity comparison between the 15 sampled plots used in this paper and
the other nine plots (Table 1), all terra firme tropical rainforests are presented in Fig. 6. We
can see two major groups formed by our 15 plots identified as “EMB” (group-1) and the
other plots, (group-2), excepting the “ZF2B” and “JURUA” plots that were very different
from the two groups, probably because they can have a particular environmental condition.
The two groups shared low percentages of species, about 25%. The 15 “EMB” plots were
grouped in higher values of similarity (higher than 60%) compared to the other group, which
had approximately half of the plots (5) grouping in a level close to 40 percent.
16
TABLE 2
Abundance, diversity measures and proportion of specie/abundance at each sampled plot in
the Embrapa Experimental site, Manaus, Amazonas State, Brazil.
Plots
ID N S H' QM
14 538 126 4.22 1 : 4.31 15 519 122 4.19 1 : 4.29 24 528 109 3.99 1 : 4.90 39 583 121 4.14 1 : 4.85 76 620 129 4.21 1 : 4.84
103 530 107 3.9 1 : 5.01 106 495 112 4.07 1 : 4.44 107 626 128 4.2 1 : 4.91 144 607 104 3.8 1 : 5.93 149 628 118 3.87 1 : 5.37 150 682 140 4.26 1 : 4.91 165 649 101 3.99 1 : 6.55 272 571 105 3.99 1 : 5.55 273 560 108 3.97 1 : 5.26 274 635 114 3.92 1 : 5.61
general
8771
264
4.49
1:33.45
N= total number of individuals; S= number of species; H’ = Shannon-Wiener index, QM= mixture coefficient (proportion species/abundance)
Fig. 5. Cumulative species-area curve for individuals with DAP ≥ 10 cm, considering 15 1ha
sized plots at the Embrapa Experimental site, Manaus, state of Amazonas, Brazil.
17
For the 15 EMB plots the distances between pair of plots varied from a minimum of 100
m to a maximum of 1657 m (from “EMB39” to “EMB103” plot, Fig. 1). The other nine plots
had larger distances between pairs, such as varying from a minimum of 100 m to a maximum
of 918,000m (from “JURUA” to “ITAP” plot).The Mantel test, carried out to study the
association between differences in species composition and geographic distances among
plots, showed for all the 24 sites positive and significant correlation (R=0.3627, p< 0.01).
For our 15 EMB plots we also found a significant correlation (R=0.4012, p< 0.001).
However, the nine plots used to compare with our 15plots, showed, when analysed alone no
significant correlation with geographical distances (R=0.3049, p>0.05).
Fig. 6. Dendrogram of 24 1ha sized plots in tropical rainforests in the state of Amazonas,
Brazil, using Sorensen’s similarity index, clustered by the Unweighted pair-group average
(UPGMA) method. The numbers (1) and (2) represent two major groups and numbers in the
branches stand for the plots identification.
18
DISCUSSION
Floristic composition and diversity: As many studies recorded for Amazonian terra
firme forests, our study area has the majority of species concentrated in few families. Also,
the larger number of individuals was concentrated in a few number of species, Fig.2 and
Fig.3 (Rankin-de-Merona 1987, Milliken 1998, Amaral et al. 2000; Lima Filho et al. 2001,
Oliveira and Amaral, 2004, Oliveira et al. 2008). This could be confirmed for the ten most
abundant species, which had 36.5% of the total number of individuals identified and were
found along the 15 sampled plots, with 100% of frequency (Fig. 4). Approximately 49% of
species had up to ten individuals at the whole area (Fig.3 and 4), which is expected for the
Amazonian region. Also, the families with the largest species richness were not the ones
which had the greatest number of individuals, Amaral et al. (2000). Burseraceae family had
small specie richness, not have been included among the species richest families, and had the
largest number of individuals. However, we have found other studies showing that there
might be a relation between richness and abundance in families (Tello 1995, Oliveira et al.
2008). It is noteworthy that there is a predominant group of families in terra firme tropical
rainforests; a fact that was also observed in our present study, and has been proved helpful in
dynamic studies aiming to measure the changes in composition and structure in forest
communities by several sources of changes.
It is also important to highlight the occurrence of 36% of the species having up to five
individuals considering the whole 15 sampled plots. If this occurrence is measured within
each plot, this value could increase. The occurrence of rare species has been recorded by
several studies (Prance et al. 1976, Oliveira and Amaral 2004, Caiafa et al. 2009). Hubbell
et al. (2001) cite that one possible reason for the rarity in tropical forests may be that rare
tree species suffer stronger density-dependent effects than common species do, resulting in a
low number of individuals. Also, in the presence of a resources gradient, species can evolve
in order to occupy different positions in these gradients, resulting in variations on the
abundance distribution (Alves et al. 2008). In the present paper, we saw some degree of
variability amongst plots, (Fig. 4), when we analysed the species distribution by their classes
19
of number of individuals, especially when comparing the plots 150, 24, 103 and 165 to the
other ones in small abundance classes. The fact that we have great local variability in
topography may have contributed for the large occurrence of rare species due to
environmental heterogeneity and probable specie’s adaptation to such variability. Future
studies could confirm these statements, once we did not test for these relations in the present
study.
The 264 tree species (53 families) can be considered to reflect the overall tree diversity
of the area, as demonstrated by the species/area curve (Fig. 5), which approaches an
asymptote. The Shannon’s diversity index for Amazonian forests generally ranges from 3.83
to 5.85, which are considered high values (Knight 1975). Our value for the whole area of
4.49 falls in the range of high diversity forest. From the previous knowledge of the study
area we perceived a gradient of diversity in decreasing order, ranging from the clayey plots
(150, 14, 15, 76) to the sandy ones (24, 106, 272, 273, 274). Edaphic heterogeneity seems
to have important role in the maintenance of the high diversity in tropical forests with tree
species distribution influenced by soil characteristics (Torres et al. 1997, Tuomisto and
Ruokolainen 1997, Clark 2002, Martins et al. 2003, Pinto et al. 2008).
Floristic similarity: The 24 locations that had their floristic similarity compared showed
mainly two groups of plots (Fig. 6). Our 15 “EMBR” plots formed one group (group-1) and
the remaining plots formed the other one (group- 2), excepting the “ZF2B” and “JURUA”
plots. Overall, our 15 “EMB” plots shared more than 60% of their species and the
comparison within group-1, revealed that some plots are grouped by their geographical
proximity, where closer plots shared more species with more than 70%, such as plots14-76
and 103-144, which are all at the top position according to the topography. Our plots
showed higher values when compared with Oliveira and Amaral (2004), who found values
for Sorensen’s similarity index that ranged from 28 to 36% among 20 plots in terra firme
forests near Manaus, but falls in the range of findings for Coronado et al. (2008), who also
found high similarity values. This fact was ratified by the Mantel test, which showed a
significant positive correlation between geographical distances and species composition, i.e.,
20
the smaller the geographical distance, the more similar the plots are. However, some EMB
plots seem to be clustered regardless of their proximity and of their topographic position,
such as plots 15-24. Other factors might influence such cluster, which need to be
investigated in future studies.
It seems that the environmental heterogeneity played a strong effect in separating plots,
which could be observed for the “ZF2B” and “JURUA” plots, once the former plot is located
at the base position in the topography and the “JURUA” is the farthest plot, probably having
different features compared to the others. Inspite of the positive correlation between
geographical distance and specie composition, the Mantel coefficient was not significant.
Through the dendrogram analysis, we could better see the tendency of closer plots to share
more species, like the plots ZF2P and ZF2V, which are close each other (100m apart).
When the whole 24 plots were included in the Mantel test, a positive and significant
correlation was found (R=0.3627, p< 0.01), showing that closer plots tend to be more similar
in species composition, and on the other hand, distant plots tend to be more different.
Malheiros et al. (2009) comparing forests in the Amazon region, found that the closer the
plots the more similar they were to each other in species composition.
The local heterogeneity could explain the low similarity within group-2 and between both
groups, although these values could be considered high values for Amazon region (Coronado
et al. 2008). It is expected that environmentally similar sites tend to have similar floristic
composition, whereas environmentally different ones have different composition (Barrantes
and Sandoval 2009). Also, biological factors such as dispersal and competitive abilities of
species, herbivory, edaphic factors and so on, have been considered to affect the diversity in
forest communities, generating several trends in alpha-diversity , which need to be better
understood (Tuomisto and Ruokolainen 2005).
To sum up, our study area shows high tree diversity and calls our attention to the large
occurrence of low- abundance species across the whole area and to the necessity of
considering such rare species in management projects in order to prevent local extinctions.
Our results fall in the range of the floristic composition and diversity’s index for Amazon
21
terra firme forests and the comparison amongst our 15 plots in the present study and other
nine in the state of Amazonas showed that the closer the plots more similar they are in
species composition. Also, we point out that the mosaic of environments in Amazon terra
firme forests, with regional and local variations, coupled with the biological process can be
responsible for the low similarity observed between some plots compared in this study,
showing once more the importance of studies that can keep such variability, helping to
understand the mechanisms that allow and maintain the high tree diversity in tropical
rainforests.
ACKNOWLEDGMENTS
We thank the Brazilian Agricultural Research Corporation (EMBRAPA) for the financial support, and the Federal University of Viçosa for the opportunity to accomplish the study and the data analysis.
REFERENCES
Alves, J.C.Z.O. & I.S. Miranda. Analise da estrutura de comunidades arbóreas de uma
floresta amazônica de terra firme aplicada ao manejo florestal. Acta Amaz. 38: 657-
666.
Amaral, I.L., F.D.A. Matos & J. Lima. 2000. Composição florística e parâmetros estruturais
de um hectare de floresta densa de terra firme no rio Uatumã, Amazonia, Brazil. Acta
Amaz. 30: 377-392.
Barrantes, G. & L. Sandoval. 2009. Conceptual and statistical problems associated with the
use of diversity indices in ecology. Rev. Biol. Trop. 57: 451-460.
Caiafa, A.N., S.B. Martins, J.A. Nunes & P.V. Eisenlohr. 2009. Espécies arbóreas raras, p.
245-261. In S.V. Martins (ed). Ecologia de florestas tropicais do Brasil. Editora
UFV. Universidade Federal de Viçosa, Viçosa, Brasil.
Clark, D.B. 2002. Los factores edáficos y la distribución de las plantas, p. 192-221. In M.R.
Guariguatta & G.H. Kattan (eds.). Ecología y conservación de bosques neotropicales.
LUR, San Jose, Costa Rica.
Cientec. 2006. Software Mata Nativa 2: Sistema para Análise Fitossociológica, Elaboração
de Inventários e Planos de Manejo de Florestas Nativas. Viçosa – MG.
22
Coronado, E.N.H., T.R. Baker, O.L. Phillips, N.C.A. Pitman, R.T. Pennington, R.V.
Martınez, A. Monteagudo, H. Mogollón, N.D. Cardozo, M. Ríos, R. García-Villacorta,
E. Valderrama, M. Ahuite, I. Huamantupa, D.A. Neill, W.F. Laurance, H.E.M.
Nascimento, S. S. de Almeida, T. J. Killeen, L. Arroyo, P. Núnez & L.F. Alvarado.
2009. Integrating regional and continental scale comparisons of tree composition in
Amazonian terra firme forests. Biog. Discuss. 6: 1421–1451.
Ferreira, L.V. & G.T. Prance. 1998. Species richness and floristic composition in four
hectares in the Jaú National Park in upland forests in Central Amazonia. Biod. and
Cons. 7: 1349-1364.
Formiga, K.M. 2004. Avaliação dos parâmetros estruturais, diversidade e similaridade
florística de uma floresta de baixio, na ZF2, reserva do Cuieiras, Amazonas, Brasil.
Instituto de Tecnologia do Amazonas/UEA.(Monography), Manaus,AM, Brasil
Fortin M-J & M.R.T. Dale. 2005. Spatial Analysis: A Guide for Ecologists Cambridge
University Press. Cambridge.
Gama, J.R.V., A.L. Souza, S.V. Martins & D.R. Souza. 2005. Comparação entre florestas de
várzea e de terra firme do Estado do Pará. Rev. Árvore 29: 607-616.
Gentry, A.H. 1988. Changes in plant community diversity and floristic composition on
environmental and geographical gradients. Ann. Miss. Bot. Garden 75: 1-34.
Hammer, O., D.A.T. Harper & P.D. Ryan. 2001. PAST: Paleontological Statistics Software
Package for Education and Data Analysis. Palaeontologia Eletronic. V. 1.92.
http://folk.uio.no/ohammer/past.
Houghton, R.A., D.L. Skole, C.A Nobre, J.L. Hackler, K.T. Lawrence & W.H.
Chomentowski. 2000. Annual fluxes of carbon from deforestation and regrowth in the
Brazilian Amazon. Nature: 301-304.
Hubbell, S.P., J.A. Ahumada, R. Condit &R.B. Foster. 2001. Local neighborhood effects on
long-term survival of Individual trees in a neotropical forest. Ecol. Res.16: 859-875.
IBGE-Instituto Brasileiro de Geografia e Estatística. 1999. Mapa digital temático de
vegetação, Banco de dados Sipam, Brasil.
Knight, D.H. 1975. A phytosociological analysis of species-rich tropical forest on Barro
Colorado Island, Panama. Ecol. Monog. 45: 259-28.
Legendre, P. & L. Legendre.1998. Numerical Ecology. Elsevier. Amsterdam.
23
Lima filho, D.A., F.D.A. Matos, I.L. Amaral, J. Revilla, L.S. Coêlho, J.F. Ramos & J.L.
Santos. 2001. Inventário florístico de floresta ombrófila densa de terra firme, na região
do Rio Urucu-Amazonas, Brasil. Acta Amaz. 31: 565-579.
Magurran, A.E. 1988. Ecological diversity and its measurement. Cambridge University
Press, New Jersey.
Malheiros, A.F., N.Higuchi, J.Santos. 2009. Análise estrutural da floresta tropical úmida do
município de Alta Floresta, Mato Grosso, Brasil. Acta Amaz. 39: 539-548.
Martins, S.V., N.R.S. Silva, A.L. Souza & J.A.A. Meira Neto. 2003. Distribuição de
espécies arbóreas em um gradiente topográfico de Floresta Estacional Semidecidual
em Viçosa, MG. Scie. For. 64: 172-181
Matos, F.D.A. 2006. Estimativa de biomassa e carbono em floresta ombrófila densa de terra
firme na Amazônia Central, Manaus-AM, Brasil, por meio de dados de satélites de
média e alta resolução espacial.Tese de Doutorado, Universidade Federal do Paraná,
Curitiba-PR, Brasil.
Milliken, W. 1998. Structure and composition of one hectare of central Amazonian terra
firme Forest. Biotropica 30: 530-537.
Oliveira, A.A., S.A. Mori.1999. A central Amazonian terra firme forest. I. High tree species
richness on poor soils. Biod. and Cons. 8: 1219-1244.
Oliveira, A.N. & I.L. Amaral. 2004. Florística e fitossociologia de uma floresta de vertente
na Amazônia Central, Amazonas, Brasil. Acta Amaz. 34: 21-34.
Oliveira, A.N., I.L.Amaral, M.B.P. Ramos, A.D.Nobre, L.B. Couto & R.M.Sahdor.
2008. Composição e diversidade florístico-estrutural de um hectare de floresta
densa de terra firme na Amazonia Central, Amazonas, Brasil. Acta Amaz. 38:
627-642.
PAS. 2008. Plano Amazônia Sustentável. Governo Federal.- Available in:
http://www.mma.gov.br
Phillips, O.L., P. Hall, A.H. Gentry, S.A. Sawyer & R. Vásquez. 1994. Dynamics and
species richness of tropical rain forests. Proc. Nat. Acad. Sci. USA 91: 2805-2809.
Pinto, S.I.C., S.V. Martins, N.F. Barros, H.C.T. Dias & S.H. Kunz. 2008. Influence of
environmental variables on the shrub and tree species distribution in two
Semideciduous Forest sites in Viçosa, Minas Gerais, Brazil. Rev. Biol. Trop. 56:
1557- 1569.
24
Pitman, N.C.M., J.W. Terborg, S.R. Silvan, P.V. Nunes, D.A. Neil, C.E. Ceron & W.A.
Palacios. 2001. Dominance and distribution of tree species in upper Amazonia terra
firme.Ecology 82: 2101-2117.
Prance, G.T., W.A. Rodrigues & M.F. Silva. 1976. Inventário florestal de um hectare de
mata de terra firme, km 30 da estrada Manaus-Itacoatiara. Acta Amaz. 6: 9-35.
RADAM. 1978. Programa de Integração Nacional. Levantamentos de Recursos Naturais.
Manaus. DNPM, Ministério das Minas e Energia. Brazil.
Rankin-de-Merona, J.M. 1987. Estudos populacionais de árvores em florestas fragmentadas
e as implicações para a conservação In Situ das mesmas na floresta tropical da
Amazonia central. IPEF 35: 47-59.
Regis, W.D.E. 1993. Unidades de Relêvo, p.39-45. In S.S. Caldeiron (ed.). Recursos
Naturais e Meio Ambiente: Uma visão do Brasil. Fundação Instituto Brasileiro de
Geografia e Estatística-IBGE, Rio de Janeiro, Brasil.
Ribeiro, J.E.L.S., B.W. Nelson, M.F. Silva, L.S.S. Martins & M. Hopkins. 1994. Reserva
florestal ducke- diversidade e composição da flora vascular. Acta Amaz. 24: 19-30.
Rosenberg, M.S. 2005. Passage 1 (Pattern Analysis, Spatial Statistics, and Geographic
Exegesis). V.1.1. Arizona State University. http://www.passagesoftware.net
Sposito, T.C., T.I. Matzer, I.L. Amaral, A.C. Oliveira, M. Horta, D.A. Clark and D.B.
Clark. 2007. Dynamic and structure of tropical forest in South and Central América:
an across-site analyses of one hectare plots. In: The third TEAM network science
meeting. Panamá. The tropical ecology assessment and monitoring network. Panamá.
Tello, J.C.R. 1995. Aspectos fitossociológicos das comunidades vegetais de uma
toposseqüência da Reserva Florestal Ducke do INPA. Tese de Doutorado, Instituto
Nacional de Pesquisas da Amazônia/Universidade Federal do Amazonas, Manaus,
Amazonas.
Torres, R.B., F.R. Martins & L.S. Kinoshita. 1997. Climate, soil and tree flora relationships
in forests in the state of São Paulo, southeastern Brazil. Rev. Bras. Bot. 20: 41-49.
Tuomisto, H. & K. Ruokolainen. 1997. The role of ecological knowledge in explaining
biogeography and biodiversity in Amazonia. Biod. and Cons. 6: 347-357.
Tuomisto, H. & K. Ruokolainen. 2005. Environmental heterogeneity and the diversity of
pteridophytes and Melastomataceae in Western Amazonia. Biol. Skr. 55: 37-56.
25
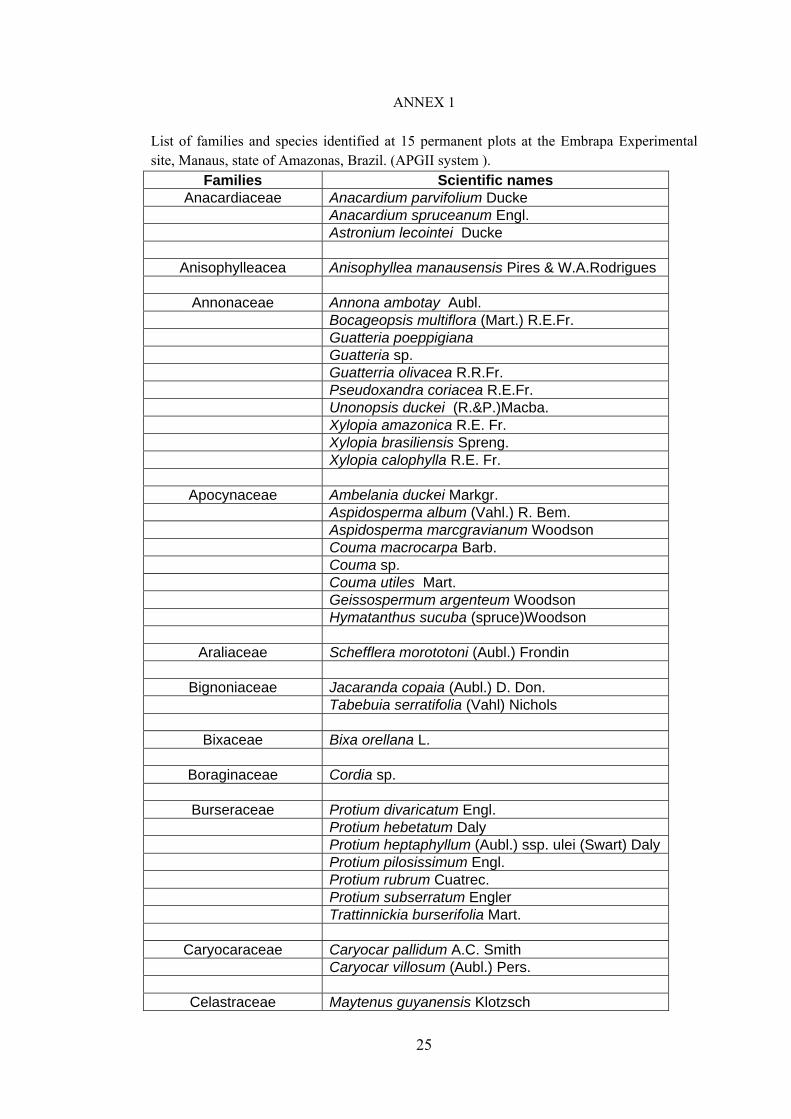
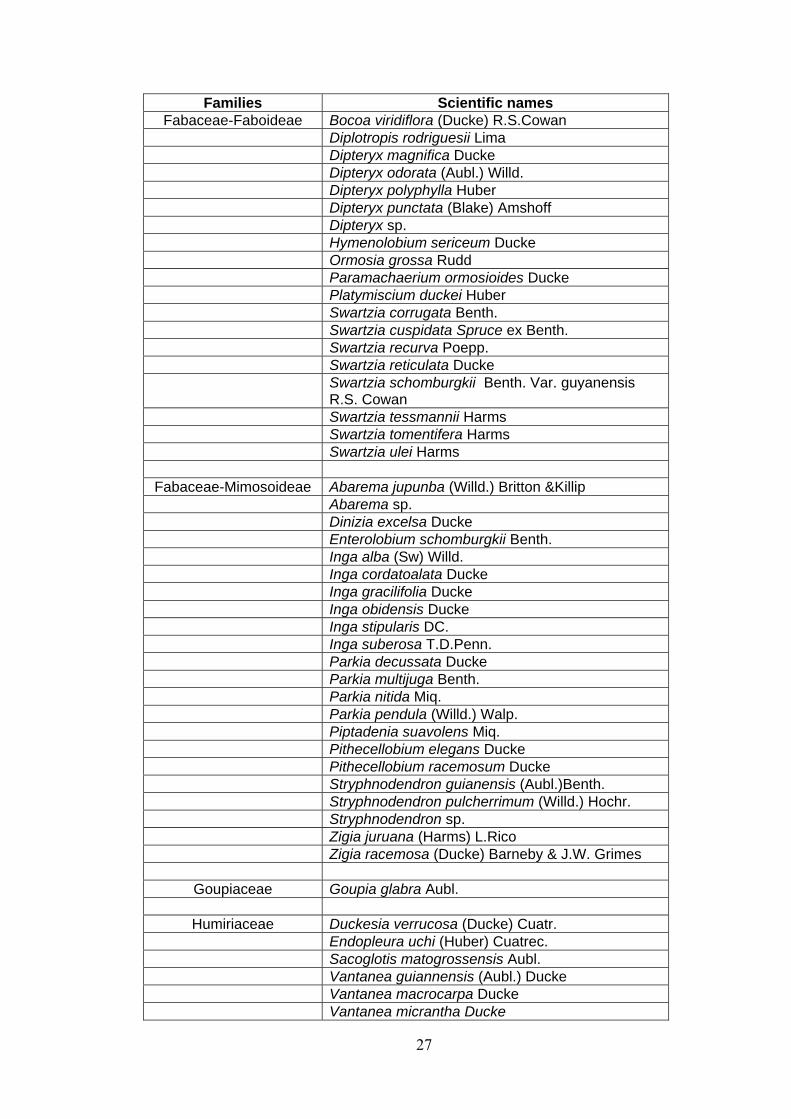
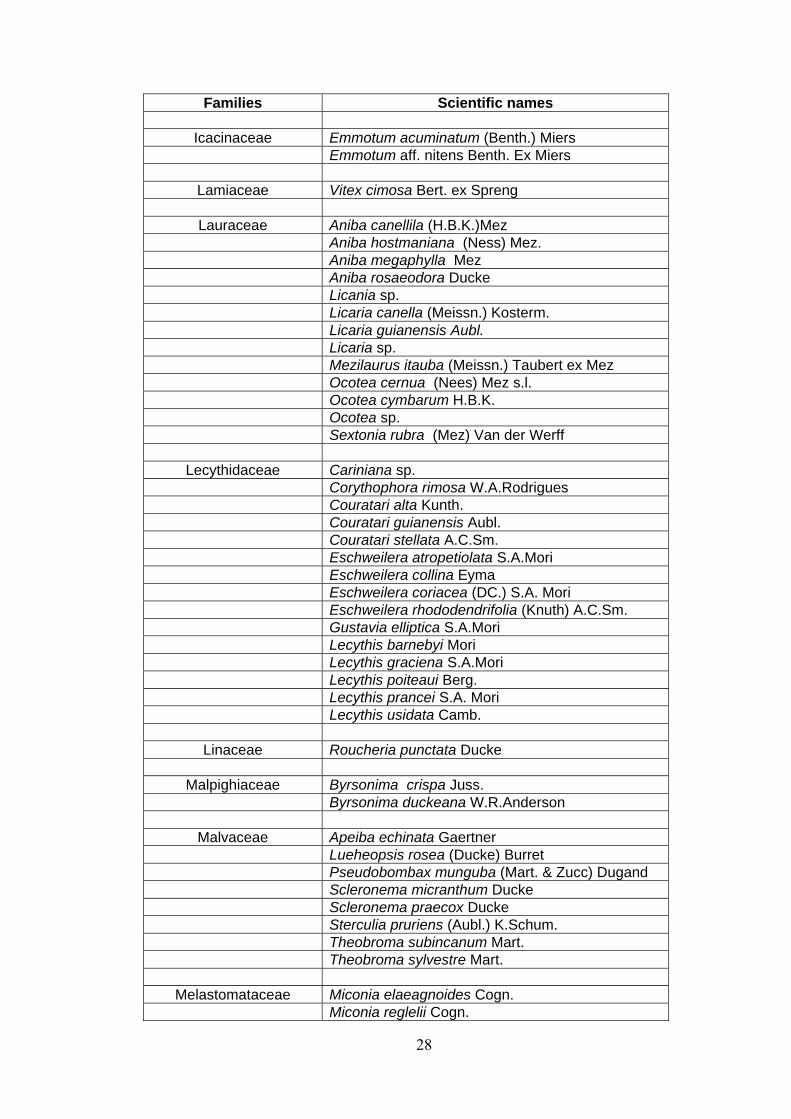
ANNEX 1 List of families and species identified at 15 permanent plots at the Embrapa Experimental site, Manaus, state of Amazonas, Brazil. (APGII system ).
Families Scientific names Anacardiaceae Anacardium parvifolium Ducke
Anacardium spruceanum Engl. Astronium lecointei Ducke
Anisophylleacea Anisophyllea manausensis Pires & W.A.Rodrigues
Annonaceae Annona ambotay Aubl. Bocageopsis multiflora (Mart.) R.E.Fr. Guatteria poeppigiana Guatteria sp. Guatterria olivacea R.R.Fr. Pseudoxandra coriacea R.E.Fr. Unonopsis duckei (R.&P.)Macba. Xylopia amazonica R.E. Fr. Xylopia brasiliensis Spreng. Xylopia calophylla R.E. Fr.
Apocynaceae Ambelania duckei Markgr. Aspidosperma album (Vahl.) R. Bem. Aspidosperma marcgravianum Woodson Couma macrocarpa Barb. Couma sp. Couma utiles Mart. Geissospermum argenteum Woodson Hymatanthus sucuba (spruce)Woodson
Araliaceae Schefflera morototoni (Aubl.) Frondin
Bignoniaceae Jacaranda copaia (Aubl.) D. Don. Tabebuia serratifolia (Vahl) Nichols
Bixaceae Bixa orellana L.
Boraginaceae Cordia sp.
Burseraceae Protium divaricatum Engl. Protium hebetatum Daly Protium heptaphyllum (Aubl.) ssp. ulei (Swart) Daly Protium pilosissimum Engl. Protium rubrum Cuatrec. Protium subserratum Engler Trattinnickia burserifolia Mart.
Caryocaraceae Caryocar pallidum A.C. Smith Caryocar villosum (Aubl.) Pers.
Celastraceae Maytenus guyanensis Klotzsch
26
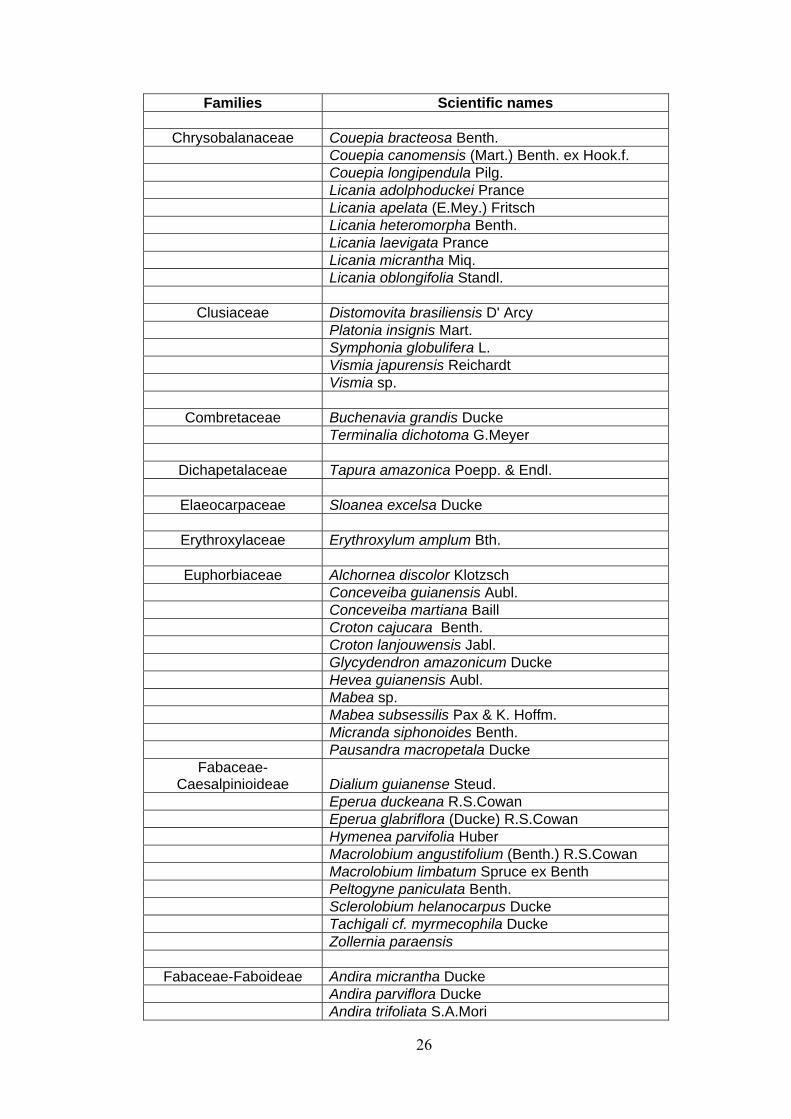
Families Scientific names
Chrysobalanaceae Couepia bracteosa Benth. Couepia canomensis (Mart.) Benth. ex Hook.f. Couepia longipendula Pilg. Licania adolphoduckei Prance Licania apelata (E.Mey.) Fritsch Licania heteromorpha Benth. Licania laevigata Prance Licania micrantha Miq. Licania oblongifolia Standl.
Clusiaceae Distomovita brasiliensis D' Arcy Platonia insignis Mart. Symphonia globulifera L. Vismia japurensis Reichardt Vismia sp.
Combretaceae Buchenavia grandis Ducke Terminalia dichotoma G.Meyer
Dichapetalaceae Tapura amazonica Poepp. & Endl.
Elaeocarpaceae Sloanea excelsa Ducke
Erythroxylaceae Erythroxylum amplum Bth.
Euphorbiaceae Alchornea discolor Klotzsch Conceveiba guianensis Aubl. Conceveiba martiana Baill Croton cajucara Benth. Croton lanjouwensis Jabl. Glycydendron amazonicum Ducke Hevea guianensis Aubl. Mabea sp. Mabea subsessilis Pax & K. Hoffm. Micranda siphonoides Benth. Pausandra macropetala Ducke
Fabaceae- Caesalpinioideae Dialium guianense Steud.
Eperua duckeana R.S.Cowan Eperua glabriflora (Ducke) R.S.Cowan Hymenea parvifolia Huber Macrolobium angustifolium (Benth.) R.S.Cowan Macrolobium limbatum Spruce ex Benth Peltogyne paniculata Benth. Sclerolobium helanocarpus Ducke Tachigali cf. myrmecophila Ducke Zollernia paraensis
Fabaceae-Faboideae Andira micrantha Ducke Andira parviflora Ducke Andira trifoliata S.A.Mori
27
Families Scientific names Fabaceae-Faboideae Bocoa viridiflora (Ducke) R.S.Cowan
Diplotropis rodriguesii Lima Dipteryx magnifica Ducke Dipteryx odorata (Aubl.) Willd. Dipteryx polyphylla Huber Dipteryx punctata (Blake) Amshoff Dipteryx sp. Hymenolobium sericeum Ducke Ormosia grossa Rudd Paramachaerium ormosioides Ducke Platymiscium duckei Huber Swartzia corrugata Benth. Swartzia cuspidata Spruce ex Benth. Swartzia recurva Poepp. Swartzia reticulata Ducke
Swartzia schomburgkii Benth. Var. guyanensis R.S. Cowan
Swartzia tessmannii Harms Swartzia tomentifera Harms Swartzia ulei Harms
Fabaceae-Mimosoideae Abarema jupunba (Willd.) Britton &Killip Abarema sp. Dinizia excelsa Ducke Enterolobium schomburgkii Benth. Inga alba (Sw) Willd. Inga cordatoalata Ducke Inga gracilifolia Ducke Inga obidensis Ducke Inga stipularis DC. Inga suberosa T.D.Penn. Parkia decussata Ducke Parkia multijuga Benth. Parkia nitida Miq. Parkia pendula (Willd.) Walp. Piptadenia suavolens Miq. Pithecellobium elegans Ducke Pithecellobium racemosum Ducke Stryphnodendron guianensis (Aubl.)Benth. Stryphnodendron pulcherrimum (Willd.) Hochr. Stryphnodendron sp. Zigia juruana (Harms) L.Rico Zigia racemosa (Ducke) Barneby & J.W. Grimes
Goupiaceae Goupia glabra Aubl.
Humiriaceae Duckesia verrucosa (Ducke) Cuatr. Endopleura uchi (Huber) Cuatrec. Sacoglotis matogrossensis Aubl. Vantanea guiannensis (Aubl.) Ducke Vantanea macrocarpa Ducke Vantanea micrantha Ducke
28
Families Scientific names
Icacinaceae Emmotum acuminatum (Benth.) Miers Emmotum aff. nitens Benth. Ex Miers
Lamiaceae Vitex cimosa Bert. ex Spreng
Lauraceae Aniba canellila (H.B.K.)Mez Aniba hostmaniana (Ness) Mez. Aniba megaphylla Mez Aniba rosaeodora Ducke Licania sp. Licaria canella (Meissn.) Kosterm. Licaria guianensis Aubl. Licaria sp. Mezilaurus itauba (Meissn.) Taubert ex Mez Ocotea cernua (Nees) Mez s.l. Ocotea cymbarum H.B.K. Ocotea sp. Sextonia rubra (Mez) Van der Werff
Lecythidaceae Cariniana sp. Corythophora rimosa W.A.Rodrigues Couratari alta Kunth. Couratari guianensis Aubl. Couratari stellata A.C.Sm. Eschweilera atropetiolata S.A.Mori Eschweilera collina Eyma Eschweilera coriacea (DC.) S.A. Mori Eschweilera rhododendrifolia (Knuth) A.C.Sm. Gustavia elliptica S.A.Mori Lecythis barnebyi Mori Lecythis graciena S.A.Mori Lecythis poiteaui Berg. Lecythis prancei S.A. Mori Lecythis usidata Camb.
Linaceae Roucheria punctata Ducke
Malpighiaceae Byrsonima crispa Juss. Byrsonima duckeana W.R.Anderson
Malvaceae Apeiba echinata Gaertner Lueheopsis rosea (Ducke) Burret Pseudobombax munguba (Mart. & Zucc) Dugand Scleronema micranthum Ducke Scleronema praecox Ducke Sterculia pruriens (Aubl.) K.Schum. Theobroma subincanum Mart. Theobroma sylvestre Mart.
Melastomataceae Miconia elaeagnoides Cogn. Miconia reglelii Cogn.
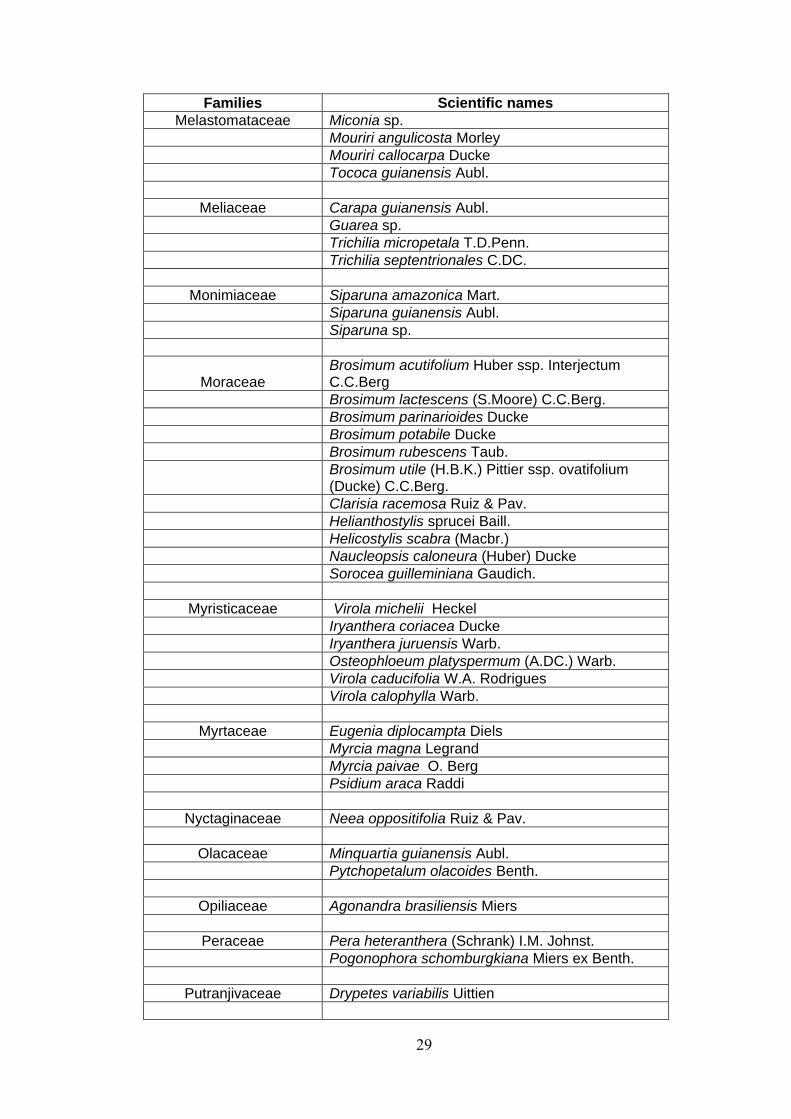
29
Families Scientific names Melastomataceae Miconia sp.
Mouriri angulicosta Morley Mouriri callocarpa Ducke Tococa guianensis Aubl.
Meliaceae Carapa guianensis Aubl. Guarea sp. Trichilia micropetala T.D.Penn. Trichilia septentrionales C.DC.
Monimiaceae Siparuna amazonica Mart. Siparuna guianensis Aubl. Siparuna sp.
Moraceae Brosimum acutifolium Huber ssp. Interjectum C.C.Berg
Brosimum lactescens (S.Moore) C.C.Berg. Brosimum parinarioides Ducke Brosimum potabile Ducke Brosimum rubescens Taub.
Brosimum utile (H.B.K.) Pittier ssp. ovatifolium (Ducke) C.C.Berg.
Clarisia racemosa Ruiz & Pav. Helianthostylis sprucei Baill. Helicostylis scabra (Macbr.) Naucleopsis caloneura (Huber) Ducke Sorocea guilleminiana Gaudich.
Myristicaceae Virola michelii Heckel Iryanthera coriacea Ducke Iryanthera juruensis Warb. Osteophloeum platyspermum (A.DC.) Warb. Virola caducifolia W.A. Rodrigues Virola calophylla Warb.
Myrtaceae Eugenia diplocampta Diels Myrcia magna Legrand Myrcia paivae O. Berg Psidium araca Raddi
Nyctaginaceae Neea oppositifolia Ruiz & Pav.
Olacaceae Minquartia guianensis Aubl. Pytchopetalum olacoides Benth.
Opiliaceae Agonandra brasiliensis Miers
Peraceae Pera heteranthera (Schrank) I.M. Johnst. Pogonophora schomburgkiana Miers ex Benth.
Putranjivaceae Drypetes variabilis Uittien
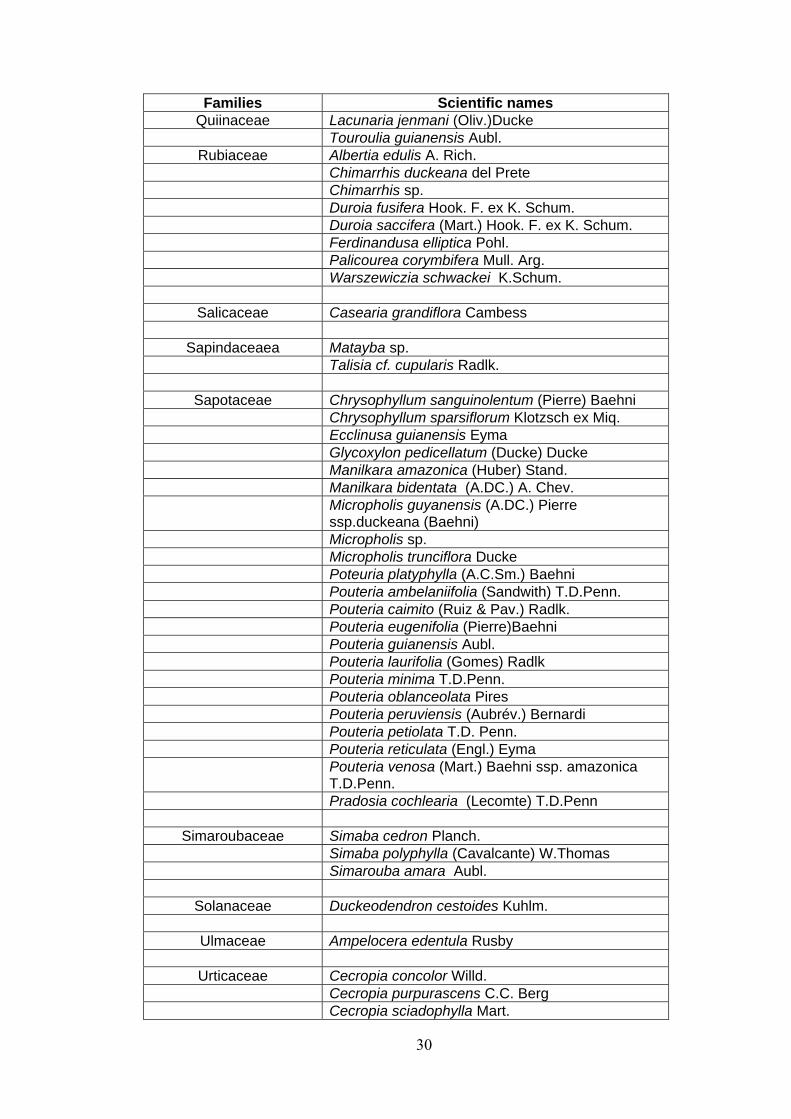
30
Families Scientific names Quiinaceae Lacunaria jenmani (Oliv.)Ducke
Touroulia guianensis Aubl. Rubiaceae Albertia edulis A. Rich.
Chimarrhis duckeana del Prete Chimarrhis sp. Duroia fusifera Hook. F. ex K. Schum. Duroia saccifera (Mart.) Hook. F. ex K. Schum. Ferdinandusa elliptica Pohl. Palicourea corymbifera Mull. Arg. Warszewiczia schwackei K.Schum.
Salicaceae Casearia grandiflora Cambess
Sapindaceaea Matayba sp. Talisia cf. cupularis Radlk.
Sapotaceae Chrysophyllum sanguinolentum (Pierre) Baehni Chrysophyllum sparsiflorum Klotzsch ex Miq. Ecclinusa guianensis Eyma Glycoxylon pedicellatum (Ducke) Ducke Manilkara amazonica (Huber) Stand. Manilkara bidentata (A.DC.) A. Chev.
Micropholis guyanensis (A.DC.) Pierre ssp.duckeana (Baehni)
Micropholis sp. Micropholis trunciflora Ducke Poteuria platyphylla (A.C.Sm.) Baehni Pouteria ambelaniifolia (Sandwith) T.D.Penn. Pouteria caimito (Ruiz & Pav.) Radlk. Pouteria eugenifolia (Pierre)Baehni Pouteria guianensis Aubl. Pouteria laurifolia (Gomes) Radlk Pouteria minima T.D.Penn. Pouteria oblanceolata Pires Pouteria peruviensis (Aubrév.) Bernardi Pouteria petiolata T.D. Penn. Pouteria reticulata (Engl.) Eyma
Pouteria venosa (Mart.) Baehni ssp. amazonica T.D.Penn.
Pradosia cochlearia (Lecomte) T.D.Penn
Simaroubaceae Simaba cedron Planch. Simaba polyphylla (Cavalcante) W.Thomas Simarouba amara Aubl.
Solanaceae Duckeodendron cestoides Kuhlm.
Ulmaceae Ampelocera edentula Rusby
Urticaceae Cecropia concolor Willd. Cecropia purpurascens C.C. Berg Cecropia sciadophylla Mart.
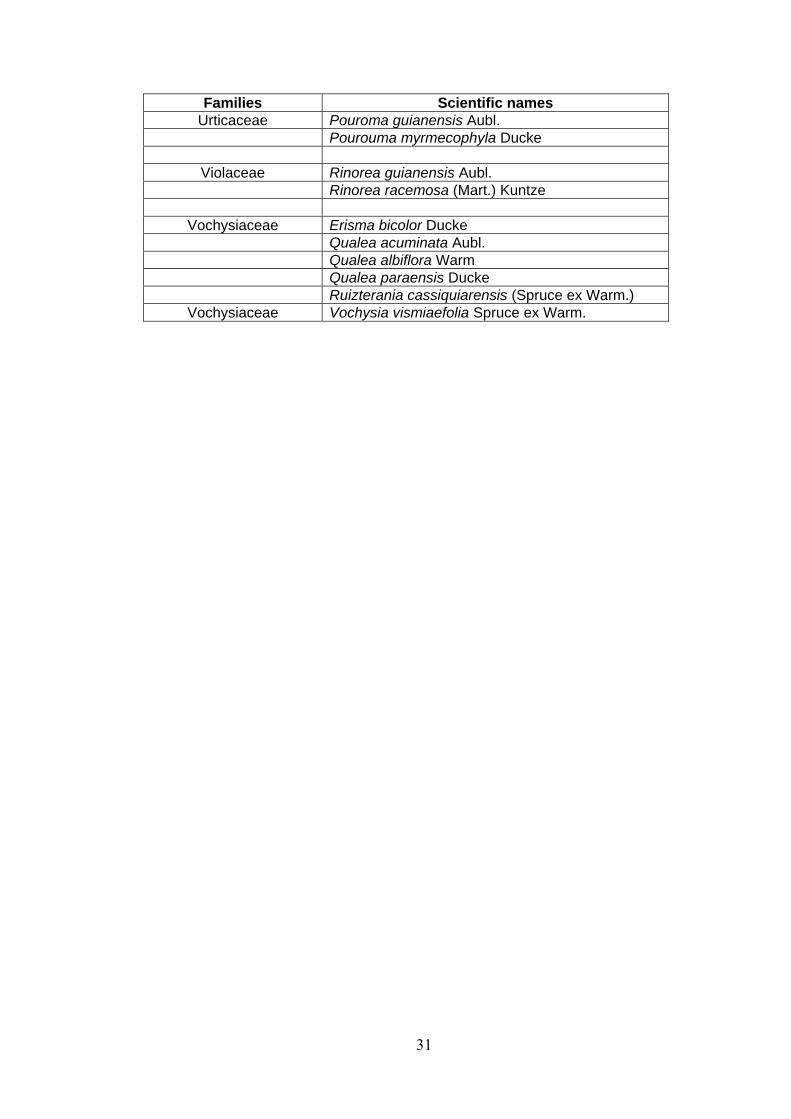
31
Families Scientific names Urticaceae Pouroma guianensis Aubl.
Pourouma myrmecophyla Ducke
Violaceae Rinorea guianensis Aubl. Rinorea racemosa (Mart.) Kuntze
Vochysiaceae Erisma bicolor Ducke Qualea acuminata Aubl. Qualea albiflora Warm Qualea paraensis Ducke Ruizterania cassiquiarensis (Spruce ex Warm.)
Vochysiaceae Vochysia vismiaefolia Spruce ex Warm.
32
Artigo 2
ESTRUTURA DO COMPONENTE ARBÓREO EM
15 HA DE PARCELAS PERMANENTES DE FLORESTA DENSA DE
TERRA FIRME NA AMAZÔNIA CENTRAL
HORIZONTAL STRUCTURE OF 15 HECTARES OF TERRA FIRME DENSE
FOREST IN CENTRAL AMAZONIAN
RESUMO
A floresta densa de terra firme ocorre em 65% da região Amazônica e é caracterizada por possuir alta diversidade de espécies vegetais e elevada ocorrência de espécies raras. Este trabalho analisou a estrutura horizontal de 15 ha de parcelas aleatoriamente selecionadas de um conjunto de 400 ha de parcelas permanentes, localizadas no Campo Experimental da Embrapa Amazônia Ocidental, Manaus, AM, Brasil. Todos os indivíduos com DAP ≥ 10 cm foram marcados e identificados em nível de espécie em 2005. Os valores de IVI (Índice de Valor de Importância) foram separados em classes de amplitude de um (01) desvio padrão e os indivíduos distribuídos segundo classes de DAP de amplitude de 10 cm. Ao todo foram identificados 8771 indivíduos, distribuídos em 264 espécies e 53 famílias. Um maior número de indivíduos concentra-se em poucas espécies, tais como Protium hebetatum Daly, Eschweilera coriacea (DC.) S.A. Mori e Licania oblongifolia Standl. que somaram 21% do número total de indivíduos e 12% do IVI. Há elevada ocorrência de espécies raras (36%) e as famílias Sapotaceae, Lecythidaceae e Burseraceae somaram 39% do número total de indivíduos. A estrutura diamétrica em forma de J-invertido mostra que 80% dos indivíduos estão concentrados nas primeiras classes de 10-30 cm de DAP. Os resultados são similares aos de outros estudos desenvolvidos em florestas de terra firme na região e chamam a atenção para a elevada ocorrência de espécies raras e daquelas com baixa densidade, mas com distribuição restrita a algumas parcelas, principalmente aquelas pertencentes às menores classes de IVI e que devem merecer atenção especial nas ações de conservação da biodiversidade e manejo florestal. Palavras-chave: Estrutura de florestas; Amazônia Central; Fitossociologia; Floresta
de terra firme.
ABSTRACT
Amazonian forests are characterized by the high biological diversity with high occurrence of rare plant species in a very diversity of environments. This paper aimed to analyze the horizontal structure of 15 hectares of plots, randomly chosen from a set of 400 ha of permanent plots situated at the Experimental Site of Embrapa Amazônia Ocidental, Manaus, Amazonas State, Brazil. All individuals with DAP ≥ 10 cm were stem mapped and botanically identified in 2005. The IVI values were cut in classes with one (01) standard deviation range and the diameters into classes of 10 cm in range. Overall, 8771 individuals were identified, distributed into 264 species and 53 families. A larger number of individuals are concentrated in a few
33
number of species, such as Protium hebetatum Daly, Eschweilera coriacea (DC.) S.A. Mori and Licania oblongifolia Standl, which sum up 21% of the total number of individuals and 12% of the IVI. There is a high occurrence of rare species (36%) and just the families Sapotaceae, Lecythidaceae and Burseraceae together accounted for 39% of the total number of individuals. The diametric structure has a J-inverse shape, common in tropical forests, with 80% of individuals concentrated in the first classes ranging between 10-30 cm. Our results are similar to other studies developed in terra firme tropical forests in Amazon and call our attention to the high occurrence of rare species and those with low density that show restricted occurrence to some plots, which deserve special attention in actions for biodiversity conservation and forest management.
Keywords: Phytosociology, diversity, Central Amazon, terra firme tropical
rainforests.
INTRODUÇÃO
O Brasil, com aproximadamente um terço das florestas tropicais remanescentes do mundo, é um dos mais importantes locais da biodiversidade mundial (PAS, 2008). Porém, o impacto das ações antrópicas sobre os ambientes tem feito com que importantes ecossistemas sejam descaracterizados sem que se tenha conhecimento da sua estrutura fitossociológica e composição florística das espécies nos diferentes ambientes. Na Amazônia, muitas áreas são formadas por mosaicos de habitats, com diferentes conjuntos de espécies vegetais ocorrendo em áreas adjacentes sobre diferentes substratos, onde se observa, de modo geral, que a distribuição das espécies arbóreas tropicais pode se dar devido a preferências de habitats e/ou à variações na história evolutiva das mesmas (PITMAN et al., 2001; NOVAES FILHO et al., 2007). A dinâmica e estrutura das florestas têm sido relatadas de variar através da bacia Amazônica em um gradiente leste-oeste, seguindo um padrão que coincide com variações na fertilidade do solo e geologia (QUESADA et al., 2009). Descrever estes padrões de variações, utilizando grandes conjuntos de dados, que contemplem os diferentes gradientes ambientais amazônicos é de suma importância para o entendimento dos mecanismos que determinam a distribuição das espécies, contribuindo, assim, para a definição de estratégias de manejo e conservação das florestas em face dos desmatamentos e das mudanças climáticas (CORONADO et al., 2009). Cerca de 65% da região Amazônica é coberta por um tipo florestal denominado floresta de terra firme, caracterizada principalmente pela elevada riqueza e diversidade de espécies, representada por poucos indivíduos de cada espécie e em geral mostrando alta dissimilaridade florística entre parcelas adjacentes, ocorrendo através de platôs e áreas de terras baixas associadas com vales de pequenos rios (PRANCE et al., 1976; VELOSO et al., 1991; FERREIRA e PRANCE, 1998; OLIVEIRA e MORI, 1999; LIMA FILHO et al., 2001; ANDERSON et al., 2009). Fatores climáticos e edáficos como climas mais chuvosos e menos sazonais, e solos relativamente mais férteis em nutrientes, têm sido citados como possíveis responsáveis por uma maior diversidade de plantas na Amazônia Ocidental (GENTRY, 1988; QUESADA et al. 2009). Phillips et al. (1994) relacionam a maior riqueza de espécies à dinâmica natural de mortalidade de árvores,
34
onde florestas com altas taxas de mortalidade e recrutamento seriam mais diversificadas. O conhecimento das características e estrutura das comunidades vegetais contribui para resultados mais eficientes das atividades de conservação e manejo florestal, evitando mudanças significativas na composição florística e estrutura dessas vegetações, prevenindo extinções locais e mantendo, assim, o ambiente mais estável, preservando sua identidade ecológica. Neste contexto, este trabalho objetivou descrever e analisar a estrutura horizontal de 15 hectares de floresta densa de terra firme na Amazônia Central, Manaus, Amazonas, Brasil a fim de contribuir para ampliar os conhecimentos sobre a organização das espécies na comunidade, auxiliando, assim, nas ações de conservação e manejo florestal na Amazônia.
MATERIAL E MÉTODO
Área de estudo
A área de estudo está localizada em uma floresta densa de terra firme na Amazônia Central, no Campo Experimental da Embrapa Amazônia Ocidental, Manaus, Amazonas, Brasil. A área integra projeto desenvolvido no âmbito da Rede de Monitoramento da Dinâmica de Florestas da Amazônia Brasileira-REDEFLOR com 400 ha de parcelas permanentes demarcadas. O clima da área é do tipo "Am" na classificação de Köppen, com precipitação anual de 1.355 a 2.839 mm. A temperatura média anual é de 27,6 °C, com umidade relativa do ar variando de 84 a 90% ao longo do ano; os meses mais chuvosos vão de dezembro a maio, e os mais secos de julho a outubro, com estes meses recebendo normalmente menos do que 100 mm de chuva (RADAM, 1978). A altitude média varia de 60 a 160 m (REGIS, 1993; ANDERSON et al., 2009). Os solos predominantes na área são o latossolo amarelo com textura variando de mais argilosa nos platôs a arenosa nas partes baixas, sendo ácidos e pobres em nutrientes, cobertos predominantemente pela vegetação da floresta densa de terras baixas, com dossel emergente IBGE (1999), consituídas por árvores que variam de médio a grande porte, atingindo até 55 m de altura (REGIS, 1993). Coleta e análise de dados Quinze parcelas de 100 x 100m foram aleatoriamente selecionadas do conjunto de 400 ha de parcelas permanentes, sendo que a maioria das parcelas (9), está situada nas áreas de platô, quatro contemplam platô e encosta, uma (01) contempla encosta e baixio e uma (01) está completamente situada no baixio. Nas 15 parcelas, todos os indivíduos com diâmetro a altura do peito (DAP) ≥ 10 cm foram plaqueteados e identificados botanicamente em nível de espécie em 2005. O material botânico foi identificado por meio de comparações a exsicatas disponíveis no herbário do Instituto Nacional de Pesquisas da Amazônia (INPA), bem como por meio de consulta a literatura especializada em espécies florestais nativas da Amazonia (RIBEIRO et al., 1999). Os nomes botânicos foram conferidos na página da Web do Missouri Botanical Garden (http:// mobot.mobot.orgw3t/search/vas.htm). O cálculo dos parâmetros estruturais da vegetação, como área basal (AB), dominância absolulta e relativa (DoA, DoR), abundância (N), densidade absoluta e relativa(DA,DR) e frequencia absoluta e relativa (FA,FR) para a composição do
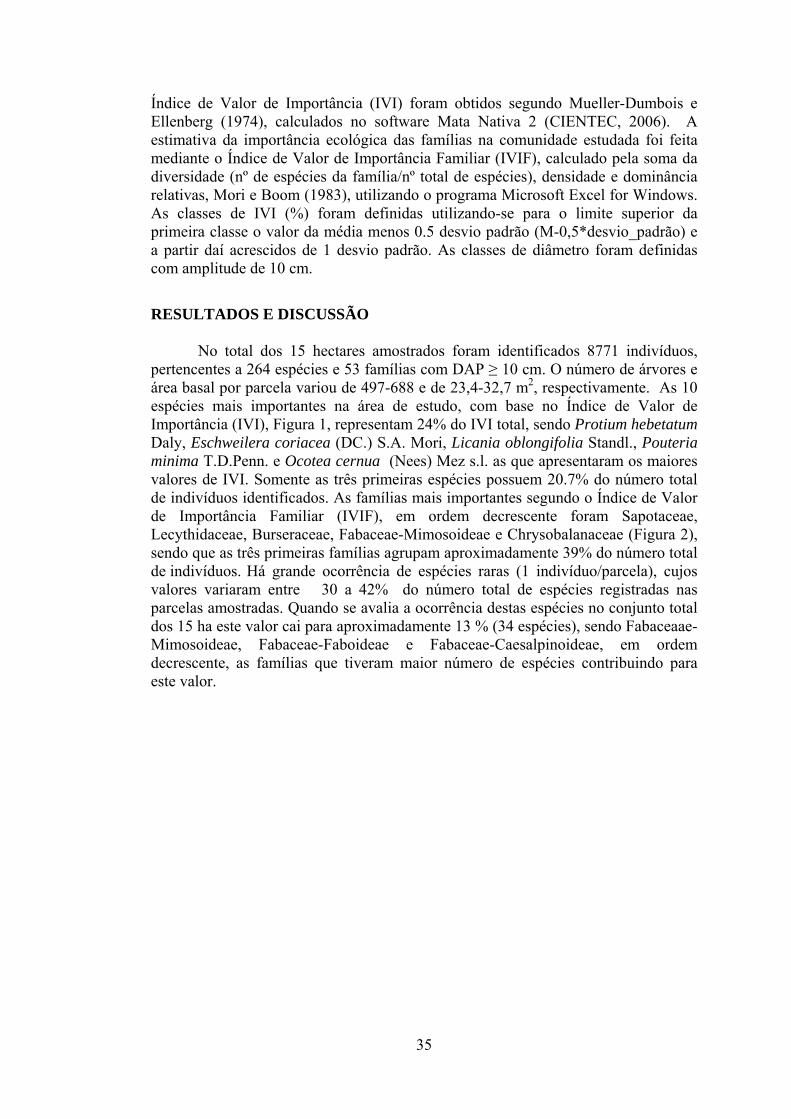
35
Índice de Valor de Importância (IVI) foram obtidos segundo Mueller-Dumbois e Ellenberg (1974), calculados no software Mata Nativa 2 (CIENTEC, 2006). A estimativa da importância ecológica das famílias na comunidade estudada foi feita mediante o Índice de Valor de Importância Familiar (IVIF), calculado pela soma da diversidade (nº de espécies da família/nº total de espécies), densidade e dominância relativas, Mori e Boom (1983), utilizando o programa Microsoft Excel for Windows. As classes de IVI (%) foram definidas utilizando-se para o limite superior da primeira classe o valor da média menos 0.5 desvio padrão (M-0,5*desvio_padrão) e a partir daí acrescidos de 1 desvio padrão. As classes de diâmetro foram definidas com amplitude de 10 cm.
RESULTADOS E DISCUSSÃO
No total dos 15 hectares amostrados foram identificados 8771 indivíduos, pertencentes a 264 espécies e 53 famílias com DAP ≥ 10 cm. O número de árvores e área basal por parcela variou de 497-688 e de 23,4-32,7 m2, respectivamente. As 10 espécies mais importantes na área de estudo, com base no Índice de Valor de Importância (IVI), Figura 1, representam 24% do IVI total, sendo Protium hebetatum Daly, Eschweilera coriacea (DC.) S.A. Mori, Licania oblongifolia Standl., Pouteria minima T.D.Penn. e Ocotea cernua (Nees) Mez s.l. as que apresentaram os maiores valores de IVI. Somente as três primeiras espécies possuem 20.7% do número total de indivíduos identificados. As famílias mais importantes segundo o Índice de Valor de Importância Familiar (IVIF), em ordem decrescente foram Sapotaceae, Lecythidaceae, Burseraceae, Fabaceae-Mimosoideae e Chrysobalanaceae (Figura 2), sendo que as três primeiras famílias agrupam aproximadamente 39% do número total de indivíduos. Há grande ocorrência de espécies raras (1 indivíduo/parcela), cujos valores variaram entre 30 a 42% do número total de espécies registradas nas parcelas amostradas. Quando se avalia a ocorrência destas espécies no conjunto total dos 15 ha este valor cai para aproximadamente 13 % (34 espécies), sendo Fabaceaae-Mimosoideae, Fabaceae-Faboideae e Fabaceae-Caesalpinoideae, em ordem decrescente, as famílias que tiveram maior número de espécies contribuindo para este valor.
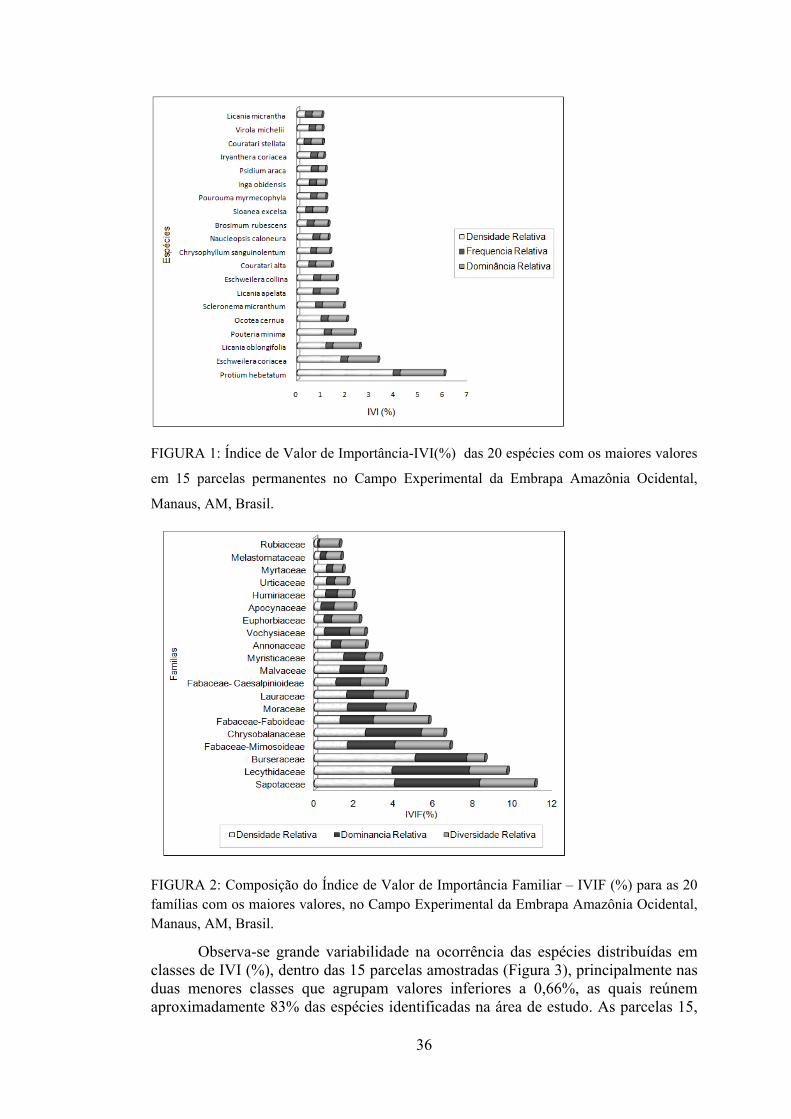
36
FIGURA 1: Índice de Valor de Importância-IVI(%) das 20 espécies com os maiores valores
em 15 parcelas permanentes no Campo Experimental da Embrapa Amazônia Ocidental,
Manaus, AM, Brasil.
FIGURA 2: Composição do Índice de Valor de Importância Familiar – IVIF (%) para as 20 famílias com os maiores valores, no Campo Experimental da Embrapa Amazônia Ocidental, Manaus, AM, Brasil.
Observa-se grande variabilidade na ocorrência das espécies distribuídas em classes de IVI (%), dentro das 15 parcelas amostradas (Figura 3), principalmente nas duas menores classes que agrupam valores inferiores a 0,66%, as quais reúnem aproximadamente 83% das espécies identificadas na área de estudo. As parcelas 15,
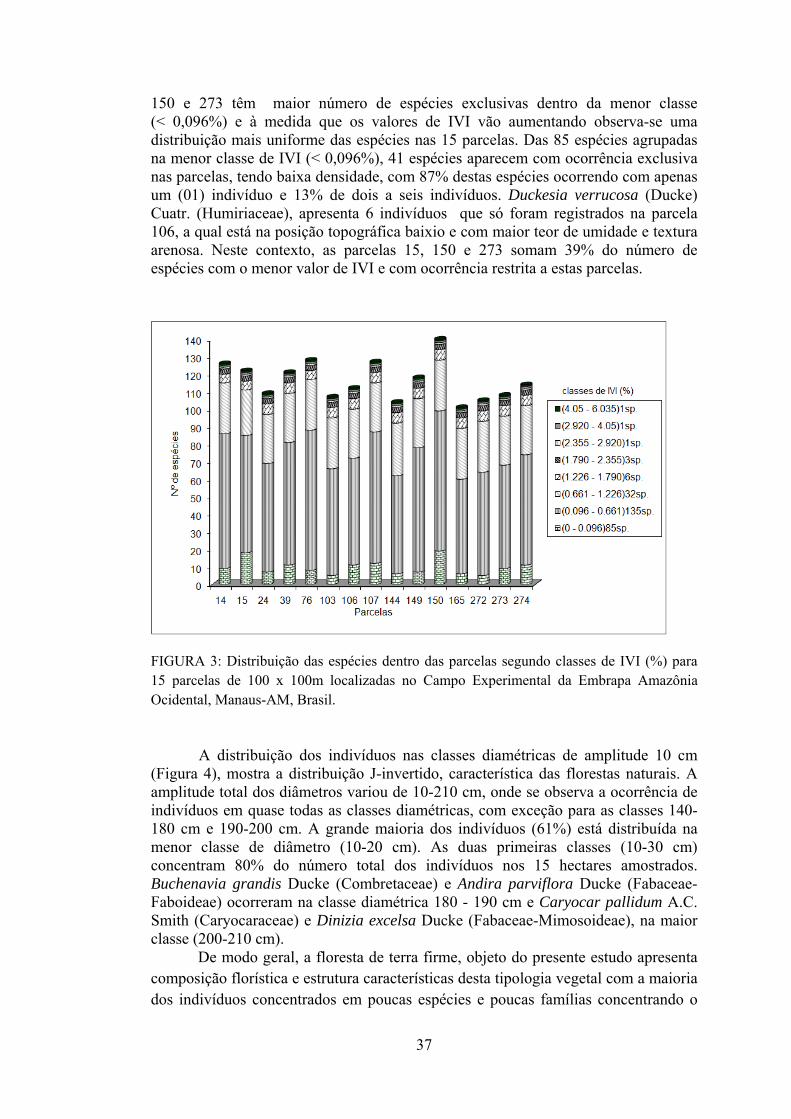
37
150 e 273 têm maior número de espécies exclusivas dentro da menor classe (< 0,096%) e à medida que os valores de IVI vão aumentando observa-se uma distribuição mais uniforme das espécies nas 15 parcelas. Das 85 espécies agrupadas na menor classe de IVI (< 0,096%), 41 espécies aparecem com ocorrência exclusiva nas parcelas, tendo baixa densidade, com 87% destas espécies ocorrendo com apenas um (01) indivíduo e 13% de dois a seis indivíduos. Duckesia verrucosa (Ducke) Cuatr. (Humiriaceae), apresenta 6 indivíduos que só foram registrados na parcela 106, a qual está na posição topográfica baixio e com maior teor de umidade e textura arenosa. Neste contexto, as parcelas 15, 150 e 273 somam 39% do número de espécies com o menor valor de IVI e com ocorrência restrita a estas parcelas.
FIGURA 3: Distribuição das espécies dentro das parcelas segundo classes de IVI (%) para 15 parcelas de 100 x 100m localizadas no Campo Experimental da Embrapa Amazônia Ocidental, Manaus-AM, Brasil.
A distribuição dos indivíduos nas classes diamétricas de amplitude 10 cm (Figura 4), mostra a distribuição J-invertido, característica das florestas naturais. A amplitude total dos diâmetros variou de 10-210 cm, onde se observa a ocorrência de indivíduos em quase todas as classes diamétricas, com exceção para as classes 140-180 cm e 190-200 cm. A grande maioria dos indivíduos (61%) está distribuída na menor classe de diâmetro (10-20 cm). As duas primeiras classes (10-30 cm) concentram 80% do número total dos indivíduos nos 15 hectares amostrados. Buchenavia grandis Ducke (Combretaceae) e Andira parviflora Ducke (Fabaceae-Faboideae) ocorreram na classe diamétrica 180 - 190 cm e Caryocar pallidum A.C. Smith (Caryocaraceae) e Dinizia excelsa Ducke (Fabaceae-Mimosoideae), na maior classe (200-210 cm). De modo geral, a floresta de terra firme, objeto do presente estudo apresenta composição florística e estrutura características desta tipologia vegetal com a maioria dos indivíduos concentrados em poucas espécies e poucas famílias concentrando o
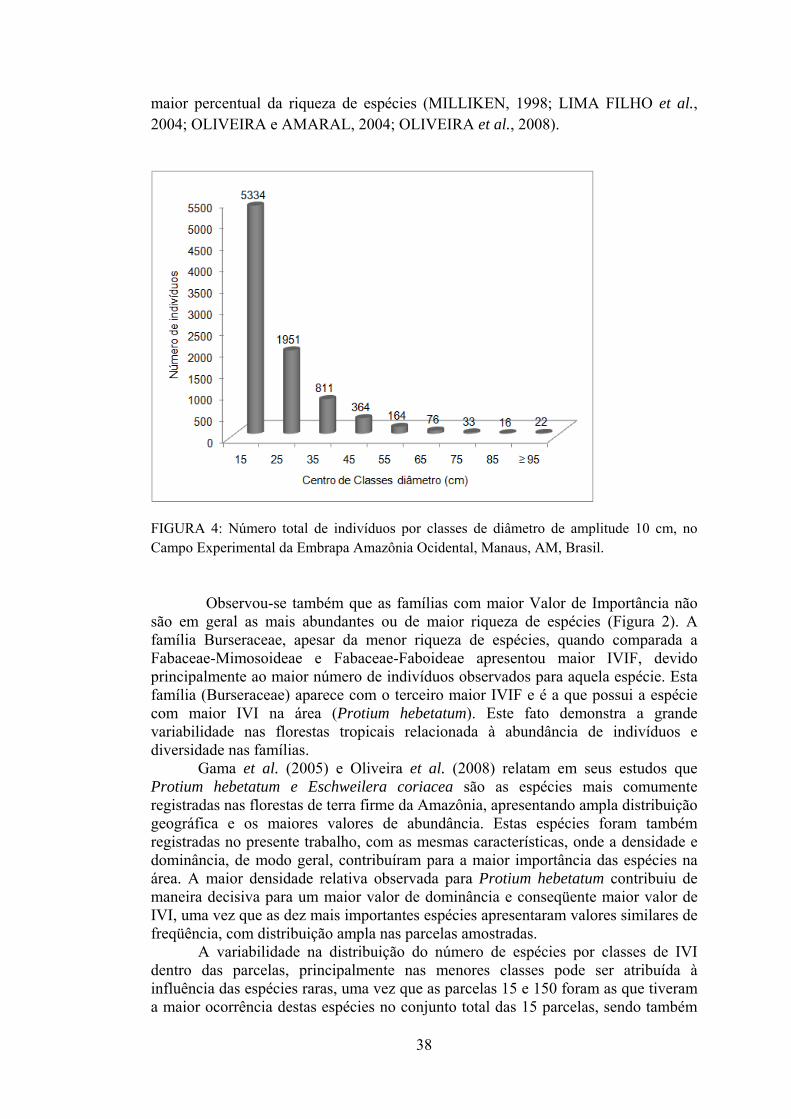
38
maior percentual da riqueza de espécies (MILLIKEN, 1998; LIMA FILHO et al., 2004; OLIVEIRA e AMARAL, 2004; OLIVEIRA et al., 2008).
FIGURA 4: Número total de indivíduos por classes de diâmetro de amplitude 10 cm, no Campo Experimental da Embrapa Amazônia Ocidental, Manaus, AM, Brasil.
Observou-se também que as famílias com maior Valor de Importância não são em geral as mais abundantes ou de maior riqueza de espécies (Figura 2). A família Burseraceae, apesar da menor riqueza de espécies, quando comparada a Fabaceae-Mimosoideae e Fabaceae-Faboideae apresentou maior IVIF, devido principalmente ao maior número de indivíduos observados para aquela espécie. Esta família (Burseraceae) aparece com o terceiro maior IVIF e é a que possui a espécie com maior IVI na área (Protium hebetatum). Este fato demonstra a grande variabilidade nas florestas tropicais relacionada à abundância de indivíduos e diversidade nas famílias. Gama et al. (2005) e Oliveira et al. (2008) relatam em seus estudos que Protium hebetatum e Eschweilera coriacea são as espécies mais comumente registradas nas florestas de terra firme da Amazônia, apresentando ampla distribuição geográfica e os maiores valores de abundância. Estas espécies foram também registradas no presente trabalho, com as mesmas características, onde a densidade e dominância, de modo geral, contribuíram para a maior importância das espécies na área. A maior densidade relativa observada para Protium hebetatum contribuiu de maneira decisiva para um maior valor de dominância e conseqüente maior valor de IVI, uma vez que as dez mais importantes espécies apresentaram valores similares de freqüência, com distribuição ampla nas parcelas amostradas. A variabilidade na distribuição do número de espécies por classes de IVI dentro das parcelas, principalmente nas menores classes pode ser atribuída à influência das espécies raras, uma vez que as parcelas 15 e 150 foram as que tiveram a maior ocorrência destas espécies no conjunto total das 15 parcelas, sendo também
39
as que apresentaram o maior percentual de espécies exclusivas, ocorrendo com baixa abundância. Diversos estudos relatam a ocorrência de um número expressivo de espécies raras nas florestas de terra firme da Amazônia, valores estes que se assemelham aos encontrados neste estudo, em média 34% do número total de espécies (GENTRY, 1988; FERRERIA e PRANCE, 1998; OLIVERIA et al., 2008). No contexto das classes de IVI, nossos resultados mostram que algumas espécies com baixa abundância têm ocorrência restrita nas parcelas e merecem atenção especial junto com as espécies raras (1 indivíduo/parcela), no sentido de se evitar extinções locais quando das ações de manejo. Excetuando-se a primeira menor classe de IVI, pode-se considerar de modo geral, que todas as parcelas possuem espécies de todas as classes de IVI, sugerindo que com base nesta classificação, a estrutura horizontal observada encontra-se bem representada no conjunto das parcelas. A forma da curva de distribuição dos diâmetros em J-invertido no presente estudo é típica das florestas tropicais, com alta proporção de árvores com DAP < 30cm ( FERREIRA e PRANCE, 1988a; LIMA FILHO et al., 2001; HAUGAASEN et al., 2006). A estrutura diamétrica observada sugere que a área não tem sofrido grandes distúrbios e que a dinâmica natural de mortalidade e recrutamento de novos indivíduos, devido a ocorrência de pequenas clareiras naturais pode ser responsável pela distribuição observada (OLIVEIRA e MORI, 1999; OLIVEIRA et al., 2008). A ocorrência de alguns indivíduos em classes de diâmetro maior que 80 cm também sugere que a floresta não tem sido afetada por grandes distúrbios, onde observa-se por exemplo indivíduos de Dinizia excelsa com DAP de aproximadamente 200 cm. CONCLUSÕES
A floresta densa de terra firme estudada apresenta grande ocorrência espécies raras e de espécies com baixa densidade e de distribuição restrita a algumas parcelas. De modo geral há um número pequeno de espécies concentrando a maior proporção do número de indivíduos observados e poucas famílias concentrando um maior número de espécies. A variabilidade no número de espécies nas menores classes de valores de IVI, ao longo das parcelas, aliado às características acima citadas ressaltam a importância do estabelecimento de estratégias diferenciadas de manejo e conservação para as florestas densas de terra firme na Amazônia Central, a fim de se evitar alterações que comprometam sua composição e estrutura, prevenindo extinções locais de espécies.
BIBLIOGRAFIA
ANDERSON, L. O. et al. Influence of landscape heterogeneity on spatial patterns of wood productivity, wood specific density and above ground biomass in Amazonia. Biogeosciences Discussions, v. 6, p. 2039-2083, 2009.
CIENTEC. Software Mata Nativa 2: Sistema para Análise Fitossociológica, Elaboração de Inventários e Planos de Manejo de Florestas Nativas. Viçosa , 2006.
CORONADO E. N. H. et al. (2009) Multi-scale comparisons of tree composition in Amazonian terra firme forests. Biogeosciences Discussions, v.6, p. 2719-2731.
40
FERREIRA, L. V.; PRANCE, G. T. Species richness and floristic composition in four hectares in the Jaú National Park in upland forests in Central Amazonia. Biodiversity and Conservation, v.7, n. 10, p. 1349-1364, 1998a.
GAMA, J. R. V. et al. Comparação entre florestas de várzea e de terra firme do Estado do Pará. Revista Árvore, Viçosa, v. 29, n.4, p. 607-616, 2005.
GENTRY, A. H. Changes in plant community diversity and floristic composition on environmental and geographical gradients. Annals of the Missouri Botanical Garden, v.75, p.1-34, 1988.
HAUGAASEN, T.; PERES, C.A. Floristic, edaphic and structural characteristics of flooded and unflooded forests in the lower Rio Purús region of central Amazonia, Brazil. Acta Amazonica, v. 36, n. 1, p. 25-36, 2006.
IBGE-Instituto Brasileiro de Geografia e Estatística. Mapa digital temático de vegetação. - Banco de dados Sipam, Brasil. 1999.
LIMA FILHO, D. A. et al. Inventário florístico de floresta ombrófila densa de terra firme, na região do Rio Urucu-Amazonas, Brasil. Acta Amazônica, Manaus, v. 31, n.3, p. 565-579, 2001.
LIMA FILHO, D. A. et al. Aspectos florísticos de 13 hectares da área de Cachoeira Porteira-PA. Acta Amazônica, v. 34, n. 3, p. 415-423, 2004.
LONGHI, S. J. et al. Classificação e caracterização de estágios sucessionais em remanescentes de Floresta Ombrófila Mista na FLONA de São Francisco de Paula, RS, Brasil. Ciência Florestal, Santa Maria, v.16, n. 2, p.113-125, 2006.
MILLIKEN, W. Structure and composition of one hectare of central Amazonian terra firme Forest. Biotropica, v. 30,n. 4, p. 530-537, 1998.
MORI, A. S.; BOOM, B. Ecological importance of Myrtaceae in an eastern Brazilian wet forest. Biotropica, v.15, n.1, p. 68-70, 1983.
MÜLLER-DOMBOIS, D.; ELLEMBERG, H. Aims and methods for vegetation ecology. John Wiley & Sons, New York, 1974. 547p.
NOVAES FILHO, J. P. et al. Distribuição espacial de carbono em solo sob floresta primária na Amazonia Meridional. Revista Árvore, v. 31 , n. 1, p. 83-92, 2007.
OLIVEIRA, A. A.; MORI, S. A. A central Amazonian terra firme forest. I. High tree species richness on poor soils. Biodiversity and Conservation, v. 8, p. 1219-1244, 1999.
OLIVEIRA, A. N.; AMARAL, I. L. Florística e fitossociologia de uma floresta de vertente na Amazônia Central, Amazonas, Brasil. Acta Amazônica, v. 34, n. 1, p. 21-34, 2004.
OLIVEIRA, A.N. et al. Composição e diversidade florístico-estrutural de um hectare de floresta densa de terra firme na Amazônia Central, Amazonas, Brasil. Acta Amazônica, v. 38, n. 4, p. 627-642, 2008.
PAS. Plano Amazônia Sustentável. Governo Federal. 2008, Disponível em: http://www.mma.gov.br
PHILLIPS, O. L. et al. Dynamics and species richness of tropical rain forests. Proceedings of the National Academy of Sciences of the USA, v.91, p. 2805-2809, 1994.
41
PITMAN, N.C.M. et al. Dominance and distribution of tree species in upper Amazonia terra firme. Ecology, v. 82, n.11, p. 2101-2117, 2001.
PRANCE, G. T. et al. Inventário florestal de um hectare de mata de terra firme, km 30 da estrada Manaus-Itacoatiara. Acta Amazônica, v. 6, n.1, p. 9-35, 1976.
QUESADA, C. A. et al. Regional and large-scale patterns in Amazon forest structure and function are mediated by variations in soil physical and chemical properties. Biogeosciences Discussions, v. 6, p. 3993-4057, 2009.
RADAM. Programa de Integração Nacional. Levantamentos de Recursos Naturais. Manaus. DNPM, Ministério das Minas e Energia. Brazil, v. 21, 1978. 180p.
REGIS, W.D.E. Unidades de Relêvo. In: CALDEIRON, S. S. (Ed.) Recursos Naturais e Meio Ambiente: Uma visão do Brasil. Fundação Instituto Brasileiro de Geografia e Estatística-IBGE, Rio de Janeiro, Brasil, 1993. p.39-45.
RIBEIRO, J. E .L. S. et al. Flora da Reserva Ducke. Guia de Identificação das Plantas Vasculares de uma Floresta de Terra-firme na Amazônia Central. Instituto Nacional de Pesquisas da Amazônia, Manaus, 1999, 793p.
VELOSO, H. P. et al. Classificação da vegetação brasileira adaptada a um sistema universal. Rio de Janeiro, IBGE, 1991. 124p.
42
Artigo 3
Spatial structure of tree species community in a “terra firme” Amazon forest near Manaus, Brazil
Abstract The role of species-environment relationships in structuring the spatial
distribution of tree species communities at different sampling unit sizes were investigated in
a “terra firme” tropical rainforest in the Brazilian Amazon. We stem-mapped all trees with
diameter at breast height ≥ 10.0 cm in 2005 at the Embrapa Experimental Site, Manaus,
Amazonas State. Specifically, we determined the relationships of tree species with soil
properties using canonical correspondence analysis based on nine soil variables and 68 tree
species. From the canonical correspondence analysis, we group the species into two groups:
one where species occur mainly in wet and sandy sites; and another where species occur
mainly in dry and clay sites. Then, to determine whether each group presents some spatial
aggregation, we used Ripley`s K uni- and bivariate functions, analyzing 32 plots ranging in
size from 2,500 m2 to 20,000 m2. For the two groups, a significant spatial aggregation was
found only at sampling unit sizes larger than 10,000 m2, particularly for those species found
in clay soils and drier environments, and when the sampling units investigated seemed to
meet the species requirements. Soil variables, topographic position and plant dispersal types
influenced the spatial aggregation of species in a varied range of mainly intermediate to large
distances (≥20m). Based on our findings, we conclude that environmental heterogeneity and
the minimum sample unit sizes of 10,000 m2 should be considered in forest dynamic studies
to characterize patterns and understand the spatial processes structuring the “terra firme”
tropical rainforest in the Brazilian Amazon.
Keywords: Canonical correspondence analysis, Ripley`s K, Spatial point patterns, Species diversity, Amazon forest, Soil nutrients.
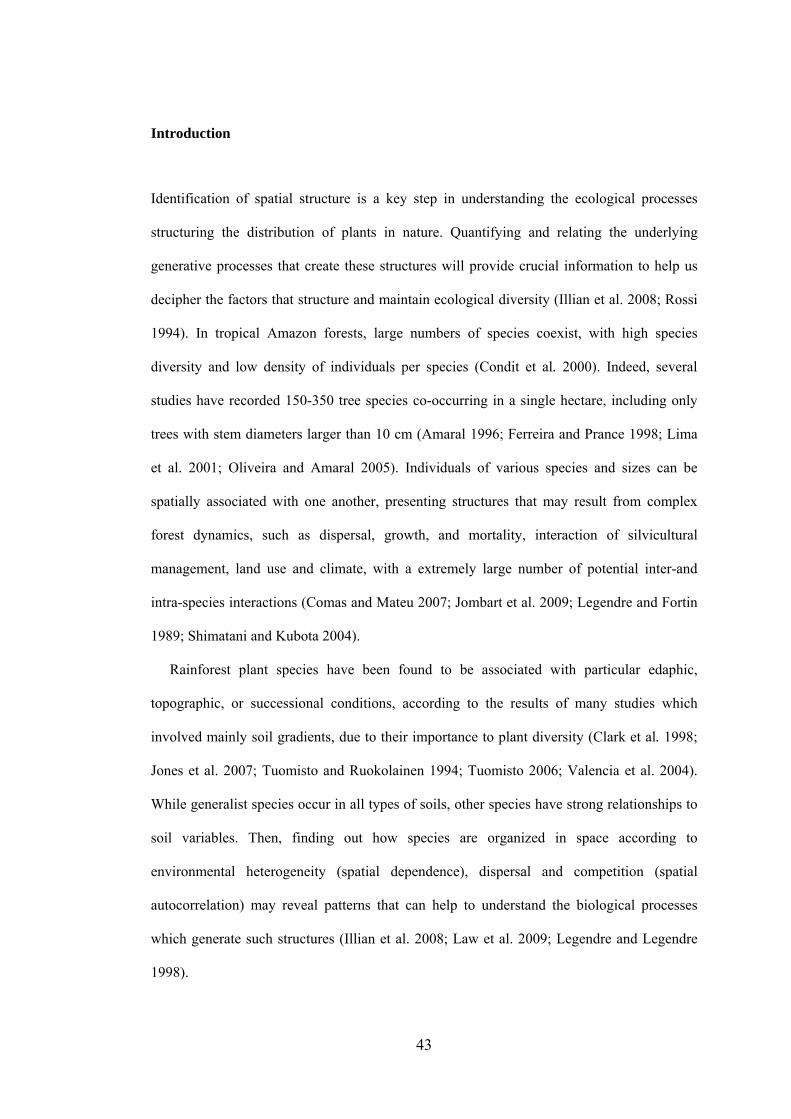
43
Introduction
Identification of spatial structure is a key step in understanding the ecological processes
structuring the distribution of plants in nature. Quantifying and relating the underlying
generative processes that create these structures will provide crucial information to help us
decipher the factors that structure and maintain ecological diversity (Illian et al. 2008; Rossi
1994). In tropical Amazon forests, large numbers of species coexist, with high species
diversity and low density of individuals per species (Condit et al. 2000). Indeed, several
studies have recorded 150-350 tree species co-occurring in a single hectare, including only
trees with stem diameters larger than 10 cm (Amaral 1996; Ferreira and Prance 1998; Lima
et al. 2001; Oliveira and Amaral 2005). Individuals of various species and sizes can be
spatially associated with one another, presenting structures that may result from complex
forest dynamics, such as dispersal, growth, and mortality, interaction of silvicultural
management, land use and climate, with a extremely large number of potential inter-and
intra-species interactions (Comas and Mateu 2007; Jombart et al. 2009; Legendre and Fortin
1989; Shimatani and Kubota 2004).
Rainforest plant species have been found to be associated with particular edaphic,
topographic, or successional conditions, according to the results of many studies which
involved mainly soil gradients, due to their importance to plant diversity (Clark et al. 1998;
Jones et al. 2007; Tuomisto and Ruokolainen 1994; Tuomisto 2006; Valencia et al. 2004).
While generalist species occur in all types of soils, other species have strong relationships to
soil variables. Then, finding out how species are organized in space according to
environmental heterogeneity (spatial dependence), dispersal and competition (spatial
autocorrelation) may reveal patterns that can help to understand the biological processes
which generate such structures (Illian et al. 2008; Law et al. 2009; Legendre and Legendre
1998).
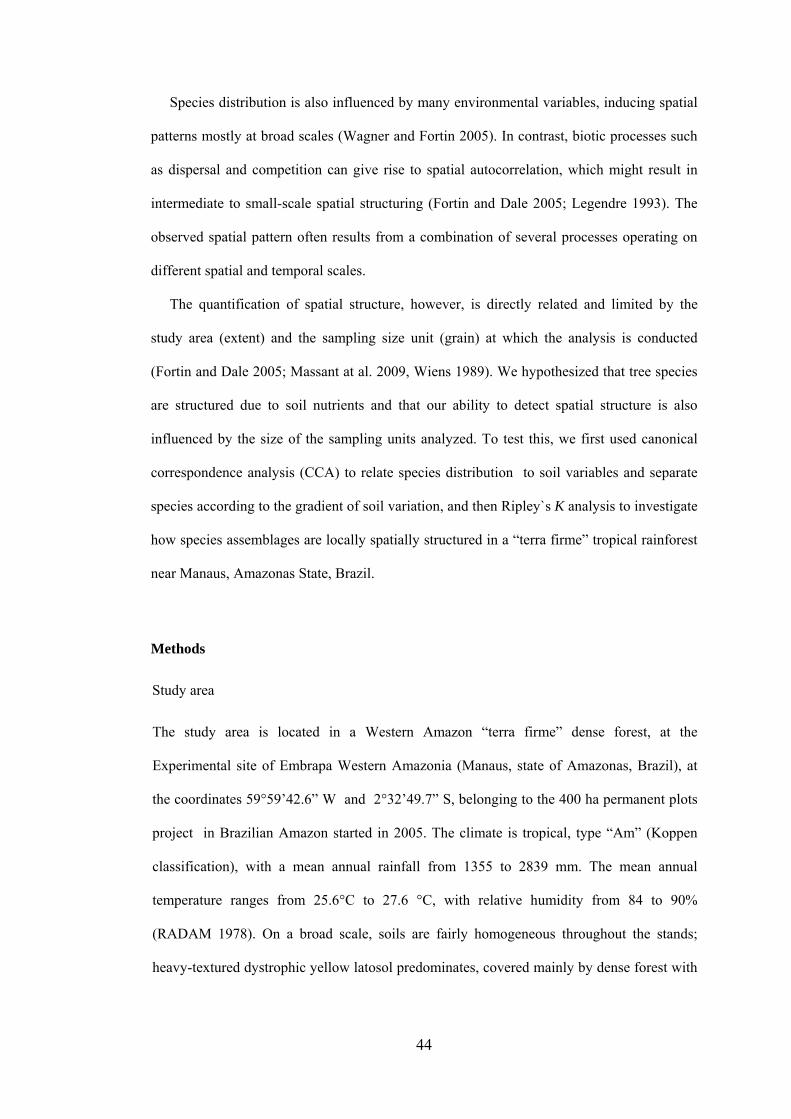
44
Species distribution is also influenced by many environmental variables, inducing spatial
patterns mostly at broad scales (Wagner and Fortin 2005). In contrast, biotic processes such
as dispersal and competition can give rise to spatial autocorrelation, which might result in
intermediate to small-scale spatial structuring (Fortin and Dale 2005; Legendre 1993). The
observed spatial pattern often results from a combination of several processes operating on
different spatial and temporal scales.
The quantification of spatial structure, however, is directly related and limited by the
study area (extent) and the sampling size unit (grain) at which the analysis is conducted
(Fortin and Dale 2005; Massant at al. 2009, Wiens 1989). We hypothesized that tree species
are structured due to soil nutrients and that our ability to detect spatial structure is also
influenced by the size of the sampling units analyzed. To test this, we first used canonical
correspondence analysis (CCA) to relate species distribution to soil variables and separate
species according to the gradient of soil variation, and then Ripley`s K analysis to investigate
how species assemblages are locally spatially structured in a “terra firme” tropical rainforest
near Manaus, Amazonas State, Brazil.
Methods
Study area
The study area is located in a Western Amazon “terra firme” dense forest, at the
Experimental site of Embrapa Western Amazonia (Manaus, state of Amazonas, Brazil), at
the coordinates 59°59’42.6” W and 2°32’49.7” S, belonging to the 400 ha permanent plots
project in Brazilian Amazon started in 2005. The climate is tropical, type “Am” (Koppen
classification), with a mean annual rainfall from 1355 to 2839 mm. The mean annual
temperature ranges from 25.6°C to 27.6 °C, with relative humidity from 84 to 90%
(RADAM 1978). On a broad scale, soils are fairly homogeneous throughout the stands;
heavy-textured dystrophic yellow latosol predominates, covered mainly by dense forest with
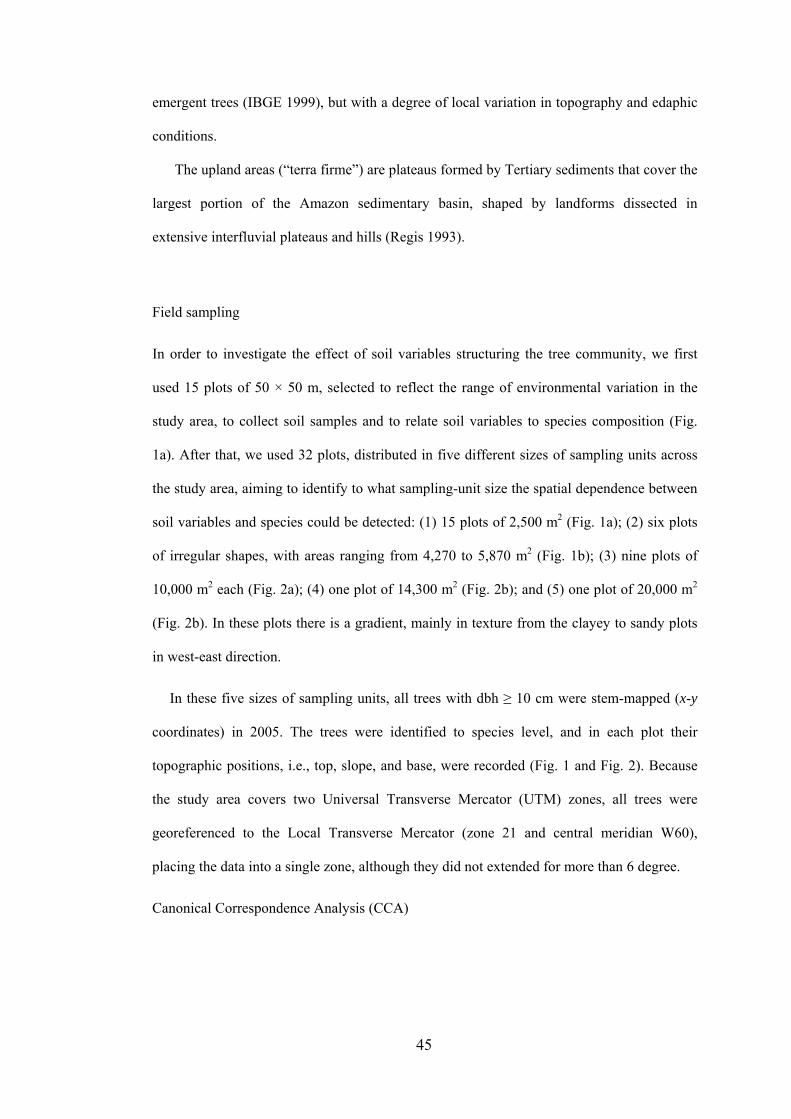
45
emergent trees (IBGE 1999), but with a degree of local variation in topography and edaphic
conditions.
The upland areas (“terra firme”) are plateaus formed by Tertiary sediments that cover the
largest portion of the Amazon sedimentary basin, shaped by landforms dissected in
extensive interfluvial plateaus and hills (Regis 1993).
Field sampling
In order to investigate the effect of soil variables structuring the tree community, we first
used 15 plots of 50 × 50 m, selected to reflect the range of environmental variation in the
study area, to collect soil samples and to relate soil variables to species composition (Fig.
1a). After that, we used 32 plots, distributed in five different sizes of sampling units across
the study area, aiming to identify to what sampling-unit size the spatial dependence between
soil variables and species could be detected: (1) 15 plots of 2,500 m2 (Fig. 1a); (2) six plots
of irregular shapes, with areas ranging from 4,270 to 5,870 m2 (Fig. 1b); (3) nine plots of
10,000 m2 each (Fig. 2a); (4) one plot of 14,300 m2 (Fig. 2b); and (5) one plot of 20,000 m2
(Fig. 2b). In these plots there is a gradient, mainly in texture from the clayey to sandy plots
in west-east direction.
In these five sizes of sampling units, all trees with dbh ≥ 10 cm were stem-mapped (x-y
coordinates) in 2005. The trees were identified to species level, and in each plot their
topographic positions, i.e., top, slope, and base, were recorded (Fig. 1 and Fig. 2). Because
the study area covers two Universal Transverse Mercator (UTM) zones, all trees were
georeferenced to the Local Transverse Mercator (zone 21 and central meridian W60),
placing the data into a single zone, although they did not extended for more than 6 degree.
Canonical Correspondence Analysis (CCA)
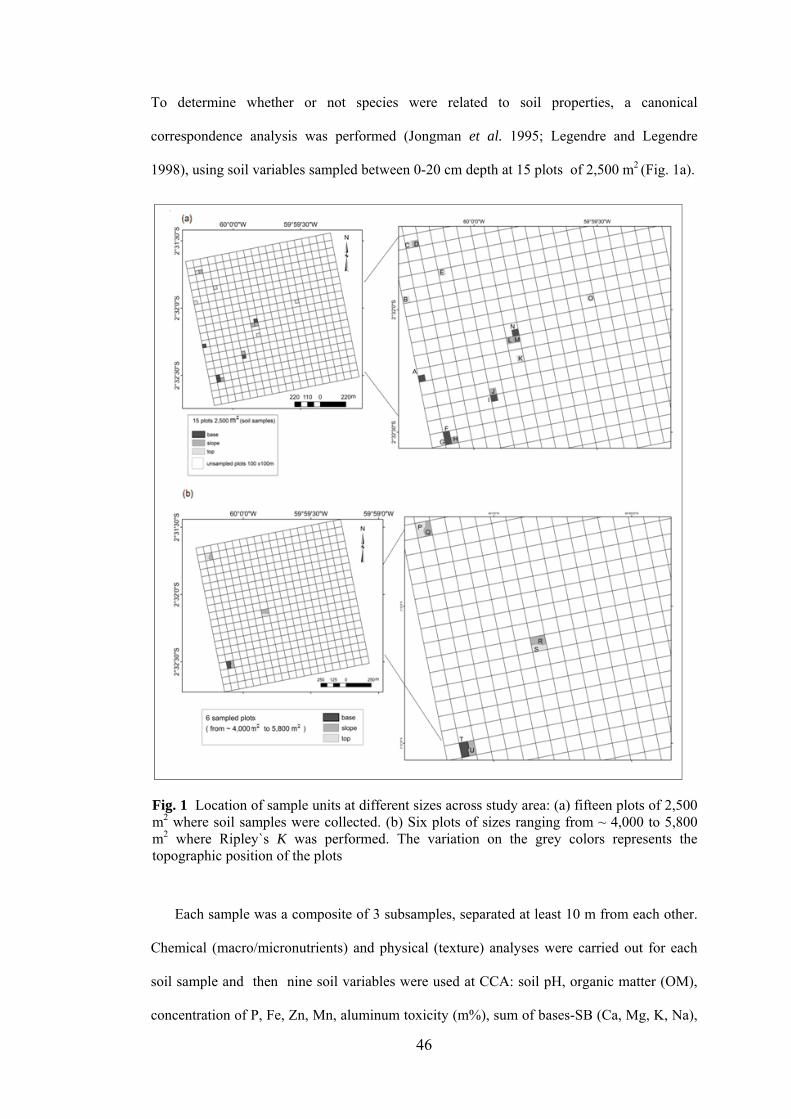
46
To determine whether or not species were related to soil properties, a canonical
correspondence analysis was performed (Jongman et al. 1995; Legendre and Legendre
1998), using soil variables sampled between 0-20 cm depth at 15 plots of 2,500 m2 (Fig. 1a).
Fig. 1 Location of sample units at different sizes across study area: (a) fifteen plots of 2,500 m2 where soil samples were collected. (b) Six plots of sizes ranging from ~ 4,000 to 5,800 m2 where Ripley`s K was performed. The variation on the grey colors represents the topographic position of the plots
Each sample was a composite of 3 subsamples, separated at least 10 m from each other.
Chemical (macro/micronutrients) and physical (texture) analyses were carried out for each
soil sample and then nine soil variables were used at CCA: soil pH, organic matter (OM),
concentration of P, Fe, Zn, Mn, aluminum toxicity (m%), sum of bases-SB (Ca, Mg, K, Na),
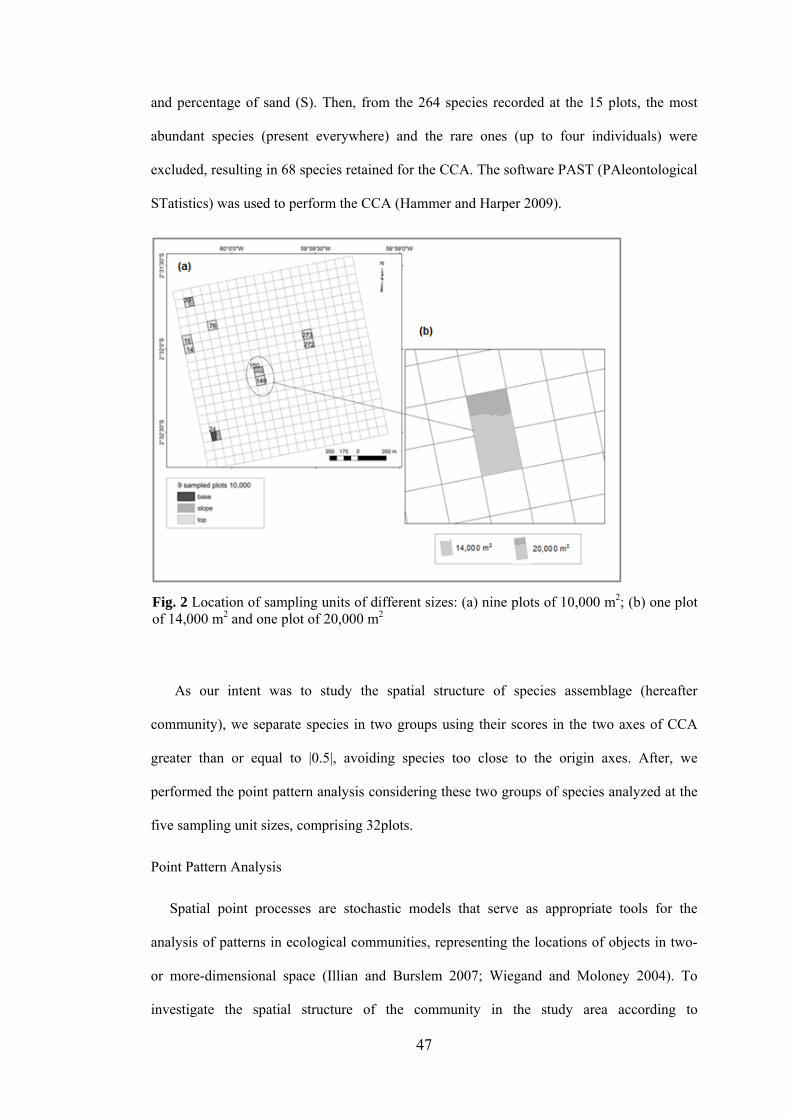
47
and percentage of sand (S). Then, from the 264 species recorded at the 15 plots, the most
abundant species (present everywhere) and the rare ones (up to four individuals) were
excluded, resulting in 68 species retained for the CCA. The software PAST (PAleontological
STatistics) was used to perform the CCA (Hammer and Harper 2009).
Fig. 2 Location of sampling units of different sizes: (a) nine plots of 10,000 m2; (b) one plot of 14,000 m2 and one plot of 20,000 m2
As our intent was to study the spatial structure of species assemblage (hereafter
community), we separate species in two groups using their scores in the two axes of CCA
greater than or equal to |0.5|, avoiding species too close to the origin axes. After, we
performed the point pattern analysis considering these two groups of species analyzed at the
five sampling unit sizes, comprising 32plots.
Point Pattern Analysis
Spatial point processes are stochastic models that serve as appropriate tools for the
analysis of patterns in ecological communities, representing the locations of objects in two-
or more-dimensional space (Illian and Burslem 2007; Wiegand and Moloney 2004). To
investigate the spatial structure of the community in the study area according to
48
environmental factors (soil variables), we used the uni- and bivariate Ripley`s K analyses,
applied to the species selected from the CCA (Fortin and Dale 2005; Illian et al. 2008;
Shimatani and Kubota 2004; Wiegand and Moloney 2004). The study was conducted across
the five sampling unit sizes, and the results were plotted as “L(r) – r” instead of K, which is
a transformation of the Poisson K function to the straight line, with a constant value=0,
making it easier to assess the deviation from the theoretical function. The bivariate case was
used to compare Group 1 and Group 2 of species identified from the CCA, testing for
dependence or independence of the process affecting the distribution of species in each
group (Franklin and Rey 2007).
Monte Carlo tests were carried out, with a probability level of 5%, to test the empirical
functions against the theoretical one, constructing simultaneous envelopes for the critical
values under the null hypothesis of Complete Spatial Randomness (CSR). The test rejects
the null hypothesis if the graph of the observed function lies outside the linearized envelope
at any value of “r” distance (Baddeley 2008). The spatial analysis was performed by using
the Spatstat package, in R software.
Results
The CCA, based on the 15 plots of 50 × 50 m, separated the species scores into two groups
along the first two axes, which accounted for 52% of the composition variation (Fig. 3 and
Table 1-online Resource1). Group 1 related 21 species to areas having sandy soil, higher P
concentration, higher moisture content, lower Fe concentration, less organic matter and less
acidity, and in general at the lowest position (base) according to the topography. Group 2
related 31 species to areas with lower moisture, higher clay, and higher organic-matter (OM)
content.
The first CCA axis showed that the composition of species is correlated mainly with the
concentration of Mn, OM, Zn, and sand. The second one axis indicated species correlated
with the P and Fe concentrations and aluminum toxicity (m). Laurance et al. (1999) studied
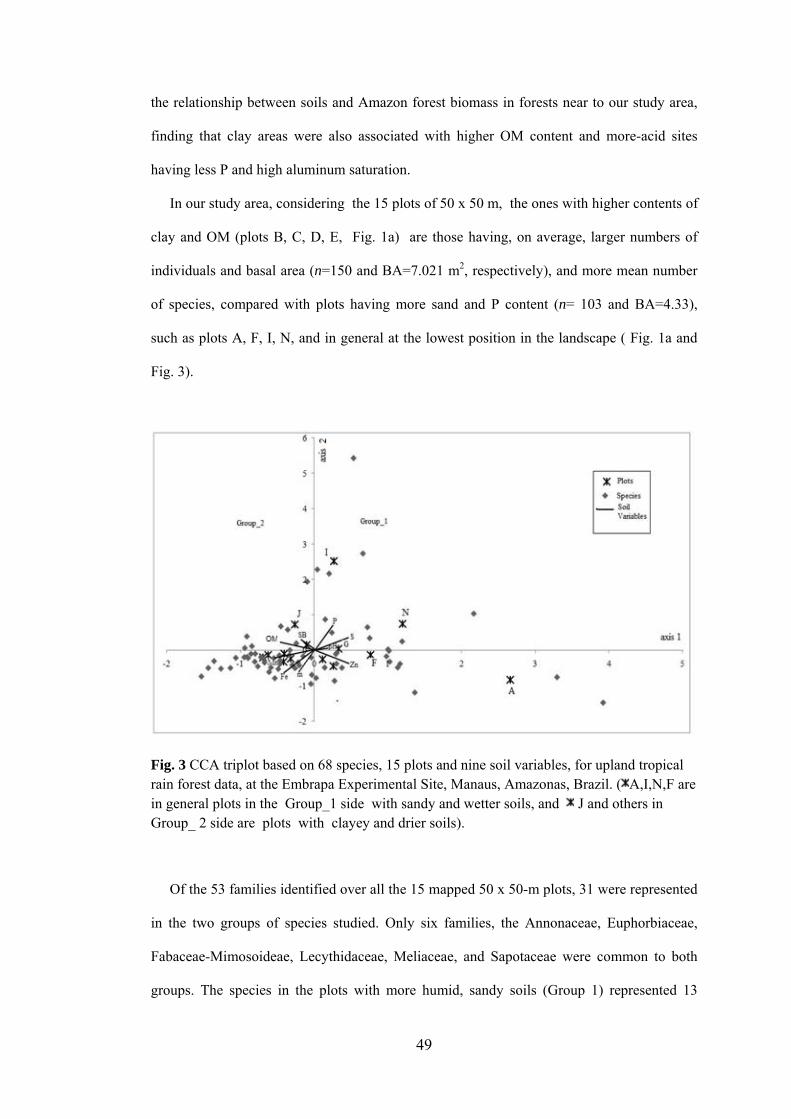
49
the relationship between soils and Amazon forest biomass in forests near to our study area,
finding that clay areas were also associated with higher OM content and more-acid sites
having less P and high aluminum saturation.
In our study area, considering the 15 plots of 50 x 50 m, the ones with higher contents of
clay and OM (plots B, C, D, E, Fig. 1a) are those having, on average, larger numbers of
individuals and basal area (n=150 and BA=7.021 m2, respectively), and more mean number
of species, compared with plots having more sand and P content (n= 103 and BA=4.33),
such as plots A, F, I, N, and in general at the lowest position in the landscape ( Fig. 1a and
Fig. 3).
Fig. 3 CCA triplot based on 68 species, 15 plots and nine soil variables, for upland tropical rain forest data, at the Embrapa Experimental Site, Manaus, Amazonas, Brazil. ( A,I,N,F are in general plots in the Group_1 side with sandy and wetter soils, and J and others in Group_ 2 side are plots with clayey and drier soils).
Of the 53 families identified over all the 15 mapped 50 x 50-m plots, 31 were represented
in the two groups of species studied. Only six families, the Annonaceae, Euphorbiaceae,
Fabaceae-Mimosoideae, Lecythidaceae, Meliaceae, and Sapotaceae were common to both
groups. The species in the plots with more humid, sandy soils (Group 1) represented 13
50
families, of which Burseraceae, Sapotaceae, Malvaceae, Fabaceae-Caesalpinioideae, and
Fabaceae-Mimosoideae comprised 69% of the total number of individuals in this group.
Species in the plots with drier and more-acid soils with higher clay and OM contents (Group
2) represented 18 families, with Sapotaceae, Lecythidaceae, Annonaceae, Moraceae, and
Lauraceae comprising 55% of the total number of individuals.
Some species were well separated in both groups by the CCA axes, occurring in plots
with different soil conditions. Within Group 1, species such as Abarema jupunba (Willd.)
Britton & Killip, Eperua duckeana R.S. Cowan, Erythroxylum amplum Bth., Macrolobium
limbatum Spruce ex Benth, and Carapa guianensis Aubl. were found mainly near plots with
more sand, P, and OM (plot I, Fig. 3), and more moisture content (Silva, 2010, personal
communication). In the same Group 1, the soil variation, mainly in OM and moisture,
seemed to favor different arrangements of species in plots having less-humid soils with less
OM (plots N and F), but similar sand content, such as Theobroma subincanum Mart.,
Guatterria olivacea R.R.Fr., Simarouba amara Aubl., Trattinnickia burserifolia Mart.,
Tapura amazonica Poepp. & Endl., Protium pilosissimum Engl., Chrysophyllum
sanguinolentum (Pierre) Baehni, Inga alba (Sw) Willd., and Sterculia pruriens (Aubl.) K.
Schum. Within Group 2, we observed that Xylopia calophylla R.E. Fr., Manilkara bidentata
(A.DC.) A. Chev., Goupia glabra Aubl., Lecythis graciena S.A. Mori and Distomovita
brasiliensis D'Arcy, among others, occurred in drier, clayey soils with more OM (plots C and
D, mainly), compared with the species in Group 1. In general, the more humid and sandy
plots were in the lowest topographic position, along stream valleys, and the drier clayey plots
were on plateaus (top position).
The largest proportion of species (68%) growing in the sandy and wetter plots (Group 1)
have small, light seeds, followed by 18% with large-sized seeds (Camargo et al. 2008;
Martinez et al. 1997; Roosmalen 1985). Forty-seven percent of species occurring in the
more-acid, clay, and drier plots (Group 2) have small seeds, followed by twenty-eight
percent of species with medium-sized seeds. These traits may have an important influence on
the spatial patterns displayed by the two groups of species, related to their seed dispersal.
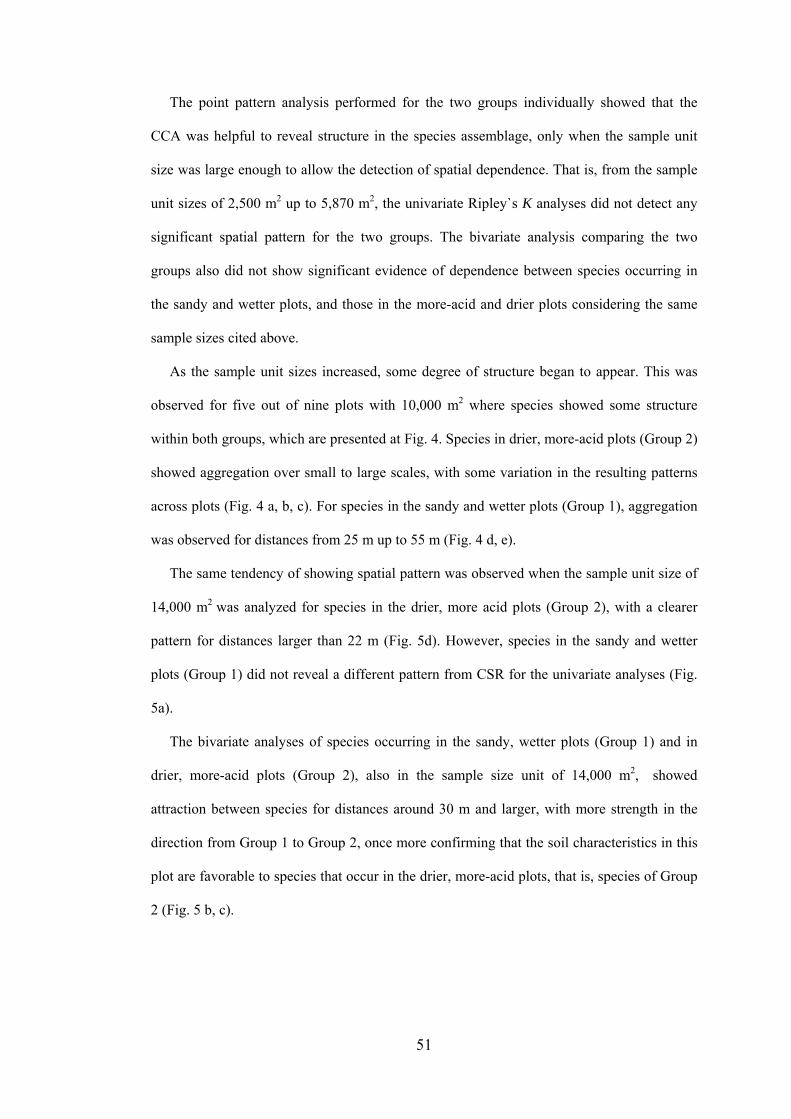
51
The point pattern analysis performed for the two groups individually showed that the
CCA was helpful to reveal structure in the species assemblage, only when the sample unit
size was large enough to allow the detection of spatial dependence. That is, from the sample
unit sizes of 2,500 m2 up to 5,870 m2, the univariate Ripley`s K analyses did not detect any
significant spatial pattern for the two groups. The bivariate analysis comparing the two
groups also did not show significant evidence of dependence between species occurring in
the sandy and wetter plots, and those in the more-acid and drier plots considering the same
sample sizes cited above.
As the sample unit sizes increased, some degree of structure began to appear. This was
observed for five out of nine plots with 10,000 m2 where species showed some structure
within both groups, which are presented at Fig. 4. Species in drier, more-acid plots (Group 2)
showed aggregation over small to large scales, with some variation in the resulting patterns
across plots (Fig. 4 a, b, c). For species in the sandy and wetter plots (Group 1), aggregation
was observed for distances from 25 m up to 55 m (Fig. 4 d, e).
The same tendency of showing spatial pattern was observed when the sample unit size of
14,000 m2 was analyzed for species in the drier, more acid plots (Group 2), with a clearer
pattern for distances larger than 22 m (Fig. 5d). However, species in the sandy and wetter
plots (Group 1) did not reveal a different pattern from CSR for the univariate analyses (Fig.
5a).
The bivariate analyses of species occurring in the sandy, wetter plots (Group 1) and in
drier, more-acid plots (Group 2), also in the sample size unit of 14,000 m2, showed
attraction between species for distances around 30 m and larger, with more strength in the
direction from Group 1 to Group 2, once more confirming that the soil characteristics in this
plot are favorable to species that occur in the drier, more-acid plots, that is, species of Group
2 (Fig. 5 b, c).
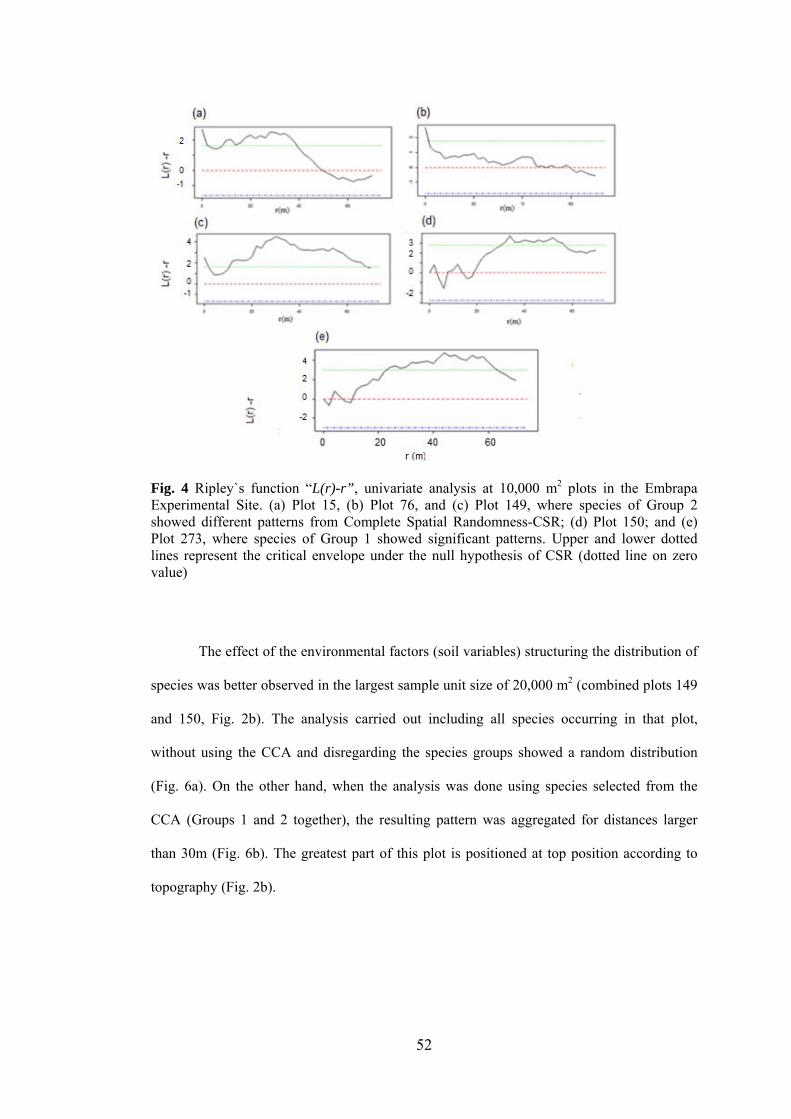
52
Fig. 4 Ripley`s function “L(r)-r”, univariate analysis at 10,000 m2 plots in the Embrapa Experimental Site. (a) Plot 15, (b) Plot 76, and (c) Plot 149, where species of Group 2 showed different patterns from Complete Spatial Randomness-CSR; (d) Plot 150; and (e) Plot 273, where species of Group 1 showed significant patterns. Upper and lower dotted lines represent the critical envelope under the null hypothesis of CSR (dotted line on zero value)
The effect of the environmental factors (soil variables) structuring the distribution of
species was better observed in the largest sample unit size of 20,000 m2 (combined plots 149
and 150, Fig. 2b). The analysis carried out including all species occurring in that plot,
without using the CCA and disregarding the species groups showed a random distribution
(Fig. 6a). On the other hand, when the analysis was done using species selected from the
CCA (Groups 1 and 2 together), the resulting pattern was aggregated for distances larger
than 30m (Fig. 6b). The greatest part of this plot is positioned at top position according to
topography (Fig. 2b).
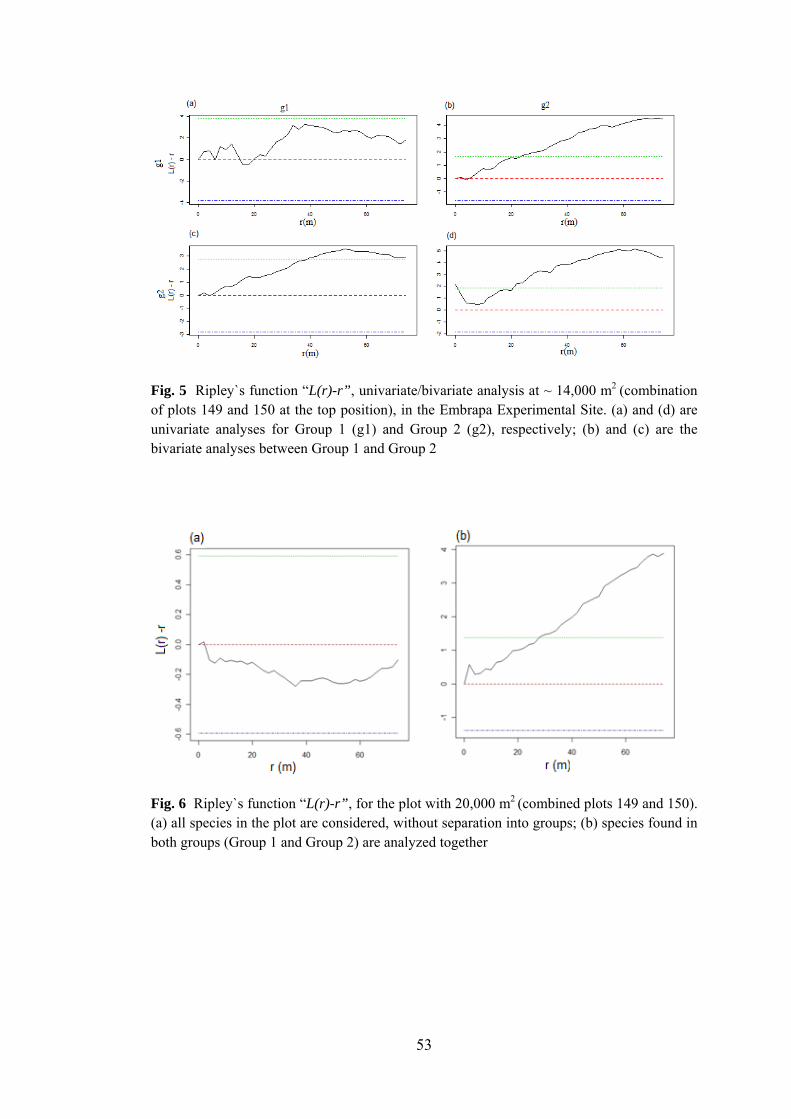
53
Fig. 5 Ripley`s function “L(r)-r”, univariate/bivariate analysis at ~ 14,000 m2 (combination of plots 149 and 150 at the top position), in the Embrapa Experimental Site. (a) and (d) are univariate analyses for Group 1 (g1) and Group 2 (g2), respectively; (b) and (c) are the bivariate analyses between Group 1 and Group 2
Fig. 6 Ripley`s function “L(r)-r”, for the plot with 20,000 m2 (combined plots 149 and 150). (a) all species in the plot are considered, without separation into groups; (b) species found in both groups (Group 1 and Group 2) are analyzed together
54
Discussion
Direct gradient analysis-CCA identifies the compositional gradient in vegetation as a
response to measured environmental factors, which are often spatially structured (Wagner
2003). The interactions between living communities and their environment, and among the
organisms themselves, occur at definite spatial and temporal scales, and give rise to spatial
patterns that must be assessed in order to better understand the processes structuring these
communities (Bocard et al. 2004; Jombart et al. 2009).
The results found in our study have shown that environmental and ecological factors are
driving the way that tree species are organized in this forest, with a strong effect of spatial
dependence among species and soil variables, which could be identified at the intermediate
sample unit size (10,000 m2) and more obviously for the sizes larger than or equal to 14,000
m2. Poulsen et al. (2006) found that differences in elevation and soil factors were highly
correlated with floristic differences within a 1-ha plot in a tropical rainforest in Ecuador,
indicating that soil factors may have played an important role for distribution and beta
diversity of plants, even at the local scale. Also, Coronado et al. (2009) found that soil
fertility was a good predictor for studies on floristic patterns in the Amazon Basin.
Observed spatial patterns often result from a combination of several processes operating
on different spatial and temporal scales (Fortin and Dale 2005). In the present study, the
observed variation in the patterns, especially associated with species growing in drier, clayey
soils, Group 2 (Fig. 4 a, b, c) could also be explained by ecological processes: a high
proportion (60%) of the species in this group are canopy species with small and medium-
sized seeds, which might have their seeds dispersed over wide distances. Processes
generating aggregation at short distances, such as dispersal and competition, should be better
investigated in future studies, using stem diameters smaller than 10 cm.
Many studies conducted in tropical rainforests have indicated that species respond
differently to environmental factors, and soil variables are commonly studied because of
their importance in explaining variations in the distribution and performance of species
(Baltzer et al. 2007; Jones et al. 2006; Tuomisto 2006). Forest structure and dynamics have
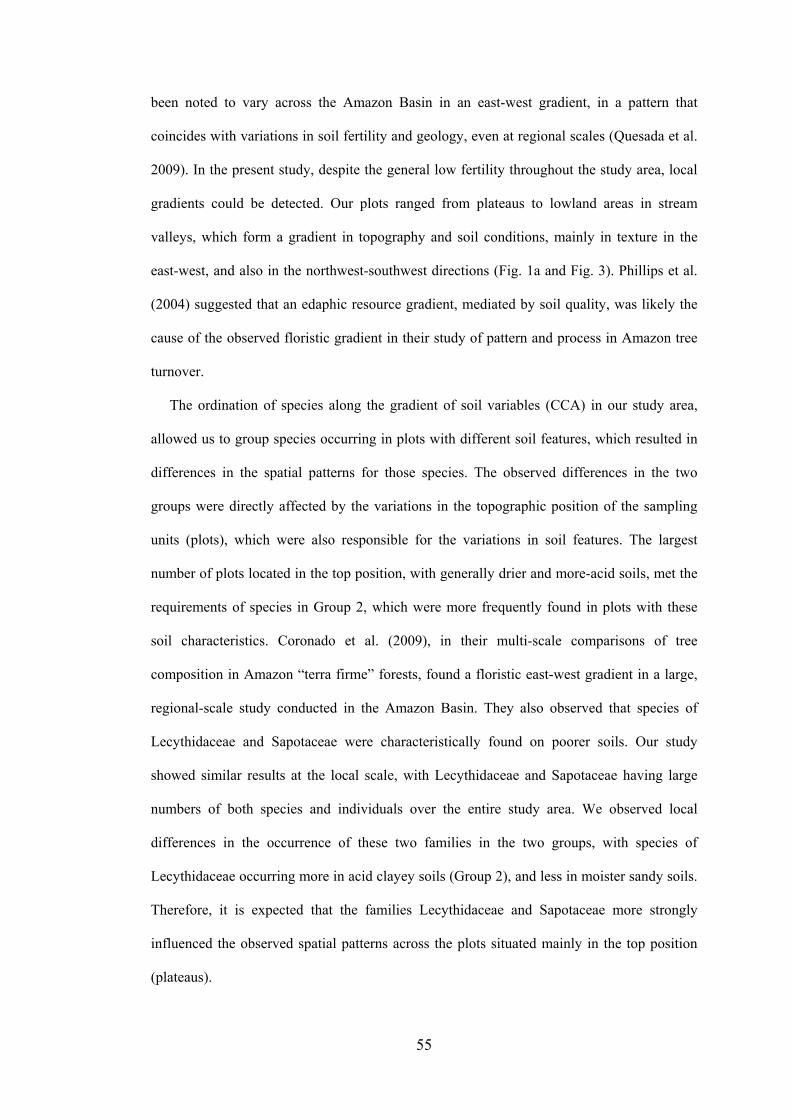
55
been noted to vary across the Amazon Basin in an east-west gradient, in a pattern that
coincides with variations in soil fertility and geology, even at regional scales (Quesada et al.
2009). In the present study, despite the general low fertility throughout the study area, local
gradients could be detected. Our plots ranged from plateaus to lowland areas in stream
valleys, which form a gradient in topography and soil conditions, mainly in texture in the
east-west, and also in the northwest-southwest directions (Fig. 1a and Fig. 3). Phillips et al.
(2004) suggested that an edaphic resource gradient, mediated by soil quality, was likely the
cause of the observed floristic gradient in their study of pattern and process in Amazon tree
turnover.
The ordination of species along the gradient of soil variables (CCA) in our study area,
allowed us to group species occurring in plots with different soil features, which resulted in
differences in the spatial patterns for those species. The observed differences in the two
groups were directly affected by the variations in the topographic position of the sampling
units (plots), which were also responsible for the variations in soil features. The largest
number of plots located in the top position, with generally drier and more-acid soils, met the
requirements of species in Group 2, which were more frequently found in plots with these
soil characteristics. Coronado et al. (2009), in their multi-scale comparisons of tree
composition in Amazon “terra firme” forests, found a floristic east-west gradient in a large,
regional-scale study conducted in the Amazon Basin. They also observed that species of
Lecythidaceae and Sapotaceae were characteristically found on poorer soils. Our study
showed similar results at the local scale, with Lecythidaceae and Sapotaceae having large
numbers of both species and individuals over the entire study area. We observed local
differences in the occurrence of these two families in the two groups, with species of
Lecythidaceae occurring more in acid clayey soils (Group 2), and less in moister sandy soils.
Therefore, it is expected that the families Lecythidaceae and Sapotaceae more strongly
influenced the observed spatial patterns across the plots situated mainly in the top position
(plateaus).
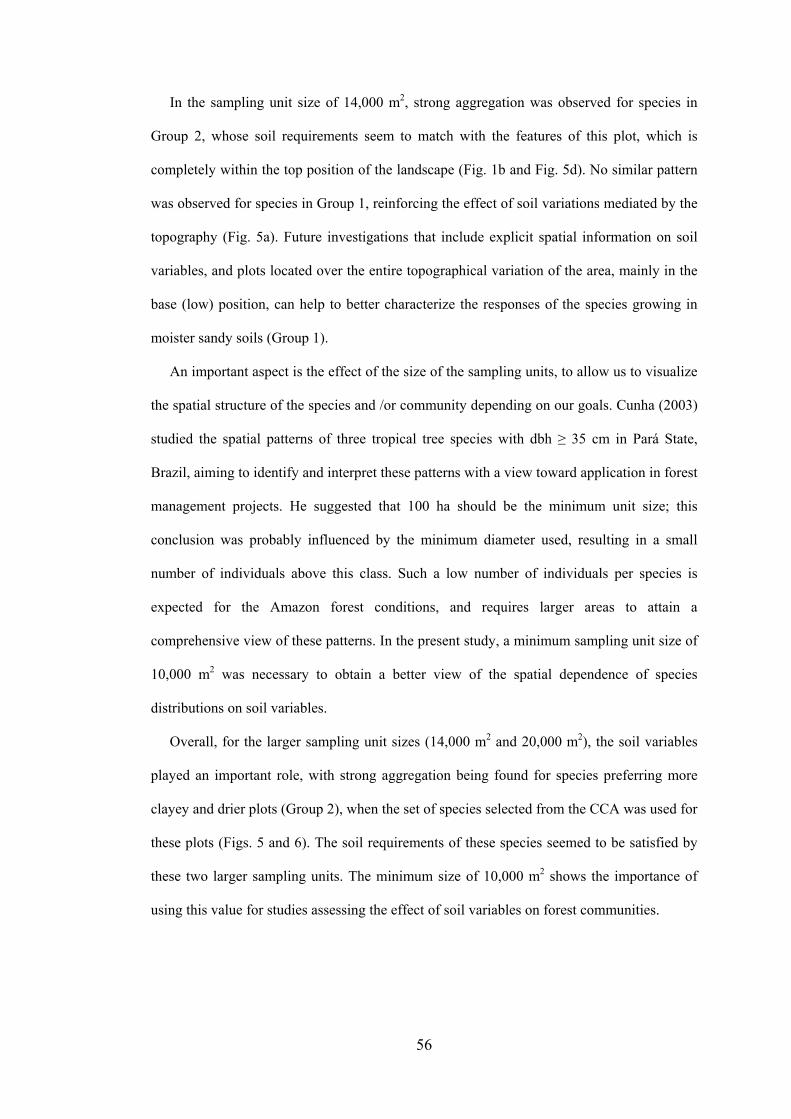
56
In the sampling unit size of 14,000 m2, strong aggregation was observed for species in
Group 2, whose soil requirements seem to match with the features of this plot, which is
completely within the top position of the landscape (Fig. 1b and Fig. 5d). No similar pattern
was observed for species in Group 1, reinforcing the effect of soil variations mediated by the
topography (Fig. 5a). Future investigations that include explicit spatial information on soil
variables, and plots located over the entire topographical variation of the area, mainly in the
base (low) position, can help to better characterize the responses of the species growing in
moister sandy soils (Group 1).
An important aspect is the effect of the size of the sampling units, to allow us to visualize
the spatial structure of the species and /or community depending on our goals. Cunha (2003)
studied the spatial patterns of three tropical tree species with dbh ≥ 35 cm in Pará State,
Brazil, aiming to identify and interpret these patterns with a view toward application in forest
management projects. He suggested that 100 ha should be the minimum unit size; this
conclusion was probably influenced by the minimum diameter used, resulting in a small
number of individuals above this class. Such a low number of individuals per species is
expected for the Amazon forest conditions, and requires larger areas to attain a
comprehensive view of these patterns. In the present study, a minimum sampling unit size of
10,000 m2 was necessary to obtain a better view of the spatial dependence of species
distributions on soil variables.
Overall, for the larger sampling unit sizes (14,000 m2 and 20,000 m2), the soil variables
played an important role, with strong aggregation being found for species preferring more
clayey and drier plots (Group 2), when the set of species selected from the CCA was used for
these plots (Figs. 5 and 6). The soil requirements of these species seemed to be satisfied by
these two larger sampling units. The minimum size of 10,000 m2 shows the importance of
using this value for studies assessing the effect of soil variables on forest communities.
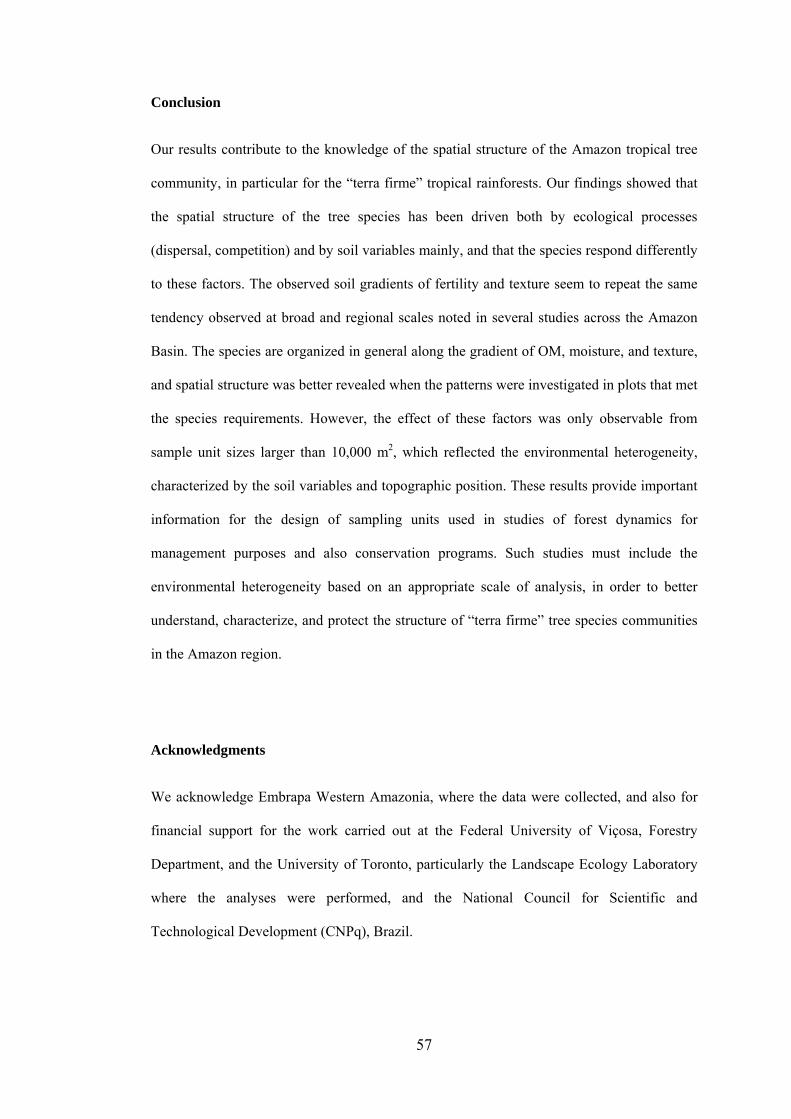
57
Conclusion
Our results contribute to the knowledge of the spatial structure of the Amazon tropical tree
community, in particular for the “terra firme” tropical rainforests. Our findings showed that
the spatial structure of the tree species has been driven both by ecological processes
(dispersal, competition) and by soil variables mainly, and that the species respond differently
to these factors. The observed soil gradients of fertility and texture seem to repeat the same
tendency observed at broad and regional scales noted in several studies across the Amazon
Basin. The species are organized in general along the gradient of OM, moisture, and texture,
and spatial structure was better revealed when the patterns were investigated in plots that met
the species requirements. However, the effect of these factors was only observable from
sample unit sizes larger than 10,000 m2, which reflected the environmental heterogeneity,
characterized by the soil variables and topographic position. These results provide important
information for the design of sampling units used in studies of forest dynamics for
management purposes and also conservation programs. Such studies must include the
environmental heterogeneity based on an appropriate scale of analysis, in order to better
understand, characterize, and protect the structure of “terra firme” tree species communities
in the Amazon region.
Acknowledgments
We acknowledge Embrapa Western Amazonia, where the data were collected, and also for
financial support for the work carried out at the Federal University of Viçosa, Forestry
Department, and the University of Toronto, particularly the Landscape Ecology Laboratory
where the analyses were performed, and the National Council for Scientific and
Technological Development (CNPq), Brazil.
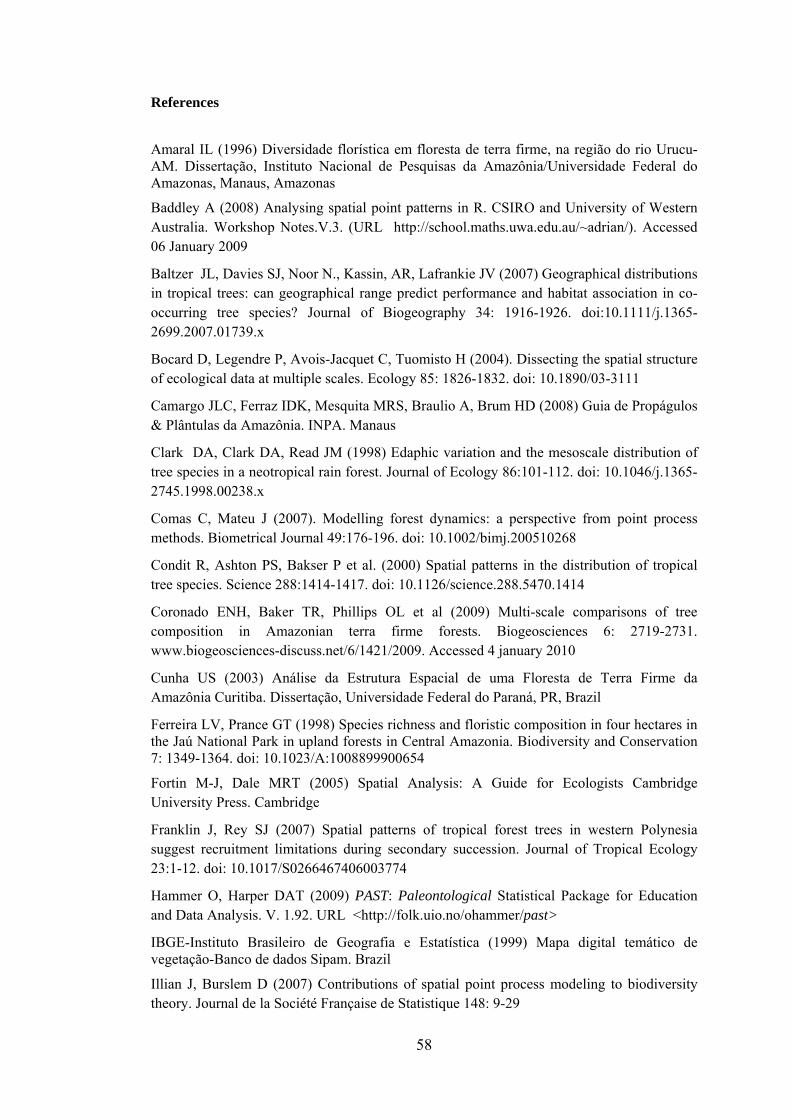
58
References
Amaral IL (1996) Diversidade florística em floresta de terra firme, na região do rio Urucu- AM. Dissertação, Instituto Nacional de Pesquisas da Amazônia/Universidade Federal do Amazonas, Manaus, Amazonas
Baddley A (2008) Analysing spatial point patterns in R. CSIRO and University of Western Australia. Workshop Notes.V.3. (URL http://school.maths.uwa.edu.au/~adrian/). Accessed 06 January 2009
Baltzer JL, Davies SJ, Noor N., Kassin, AR, Lafrankie JV (2007) Geographical distributions in tropical trees: can geographical range predict performance and habitat association in co-occurring tree species? Journal of Biogeography 34: 1916-1926. doi:10.1111/j.1365-2699.2007.01739.x
Bocard D, Legendre P, Avois-Jacquet C, Tuomisto H (2004). Dissecting the spatial structure of ecological data at multiple scales. Ecology 85: 1826-1832. doi: 10.1890/03-3111
Camargo JLC, Ferraz IDK, Mesquita MRS, Braulio A, Brum HD (2008) Guia de Propágulos & Plântulas da Amazônia. INPA. Manaus
Clark DA, Clark DA, Read JM (1998) Edaphic variation and the mesoscale distribution of tree species in a neotropical rain forest. Journal of Ecology 86:101-112. doi: 10.1046/j.1365-2745.1998.00238.x
Comas C, Mateu J (2007). Modelling forest dynamics: a perspective from point process methods. Biometrical Journal 49:176-196. doi: 10.1002/bimj.200510268
Condit R, Ashton PS, Bakser P et al. (2000) Spatial patterns in the distribution of tropical tree species. Science 288:1414-1417. doi: 10.1126/science.288.5470.1414
Coronado ENH, Baker TR, Phillips OL et al (2009) Multi-scale comparisons of tree composition in Amazonian terra firme forests. Biogeosciences 6: 2719-2731. www.biogeosciences-discuss.net/6/1421/2009. Accessed 4 january 2010
Cunha US (2003) Análise da Estrutura Espacial de uma Floresta de Terra Firme da Amazônia Curitiba. Dissertação, Universidade Federal do Paraná, PR, Brazil
Ferreira LV, Prance GT (1998) Species richness and floristic composition in four hectares in the Jaú National Park in upland forests in Central Amazonia. Biodiversity and Conservation 7: 1349-1364. doi: 10.1023/A:1008899900654
Fortin M-J, Dale MRT (2005) Spatial Analysis: A Guide for Ecologists Cambridge University Press. Cambridge
Franklin J, Rey SJ (2007) Spatial patterns of tropical forest trees in western Polynesia suggest recruitment limitations during secondary succession. Journal of Tropical Ecology 23:1-12. doi: 10.1017/S0266467406003774
Hammer O, Harper DAT (2009) PAST: Paleontological Statistical Package for Education and Data Analysis. V. 1.92. URL <http://folk.uio.no/ohammer/past>
IBGE-Instituto Brasileiro de Geografia e Estatística (1999) Mapa digital temático de vegetação-Banco de dados Sipam. Brazil
Illian J, Burslem D (2007) Contributions of spatial point process modeling to biodiversity theory. Journal de la Société Française de Statistique 148: 9-29
59
Illian J, Penttinen A, Stoyan H, Stoyan D (2008) Statistical Analysis and Modelling of Spatial Point Patterns. Wiley, England
Jombart T, Dray S, Dufour A (2009) Finding essential scales of spatial variation in ecological data: a multivariate approach. Ecography 32: 161-168. doi: 10.1111/j.1600-0587.2008.05567.x
Jones MM, Tuomisto H, Clark DB, Olivas P (2006) Effects of mesoscale environmental heterogeneity and dispersal limitation on floristic variation in rain forest ferns. Journal of Ecology 94: 181-195. doi: 10.1111/j.1365-2745.2005.01071.x
Jones MM, Olivas RP, Tuomisto H, Clark DB (2007) Environmental and neighbourhood effects on tree fern distributions in a neotropical lowland rain Forest. Journal of Vegetation Science 18: 13-24. doi: 10.1111/j.1654-1103.2007.tb02511.x
Jongman RHG, Ter Braak CJF, Tongeren OFR (1995) Data Analysis in Community and Landscape Ecology. Cambridge University Press. Wageningen
Laurance WF, Fearnside PM, Laurance SG et al. (1999) Relationship between soils and Amazon forest biomass: a landscape-scale study. Forest Ecology and Management 118:127-138
Law R, Illian J, Burslem DFRP, Gratzer G, Gunatilleke CVS, Gunatilleke IAUN (2009) Ecological information from spatial patterns of plants: insights from point process theory. Journal of Ecology 97:616-628. doi: 10.1111/j.1365-2745.2009.01510.x
Legendre P (1993) Spatial autocorrelation: trouble or new paradigm? Ecology 74: 1659-1673. doi: 10.2307/1939924
Legendre P, Fortin M-J (1989) Spatial pattern and ecological analysis. Vegetatio 80: 107-138
Legendre P, Legendre L (1998) Numerical Ecology. Elsevier, Amsterdam
Lima Filho DA, Matos FDA, Amaral IL et al. (2001) Inventário florístico de floresta ombrófila densa de terra firme, na região do Rio Urucu-Amazonas, Brasil. Acta Amazonica 31:565-579
Massant W, Godefroid S, Koedam N (2009) Clustering of plant life strategies on meso-scale. Plant Ecology 205:47-56. doi: 10.1007/s11258-009-9597-0
Martinez RV, Lleras AR, Taylon C (1997) Flórula de las Reservas Biológicas de Iquitos, Peru Missouri Botanical Garden
Oliveira NA, Amaral IL (2005) Aspectos florísticos, fitossociológicos e ecológicos de um sub-bosque de terra firme na Amazônia Central, Amazonas, Brasil. Acta Amazonica 35: 1-16
Phillips OL, Bajerm TRM, Arroyo L et al. (2004) Pattern and process in Amazon tree turnover, 1976-2001. Philosophical Transactions of the Royal Society 359:381-407. doi: 10.1098/rstb.2003.1438
Poulsen AD, Tuomisto H, Balslev H (2006). Edaphic and floristic variation within a 1-ha plot of lowland Amazonian Rain Forest. Biotropica 38: 468-478. doi: 10.1111/j.1744-7429.2006.00168.x
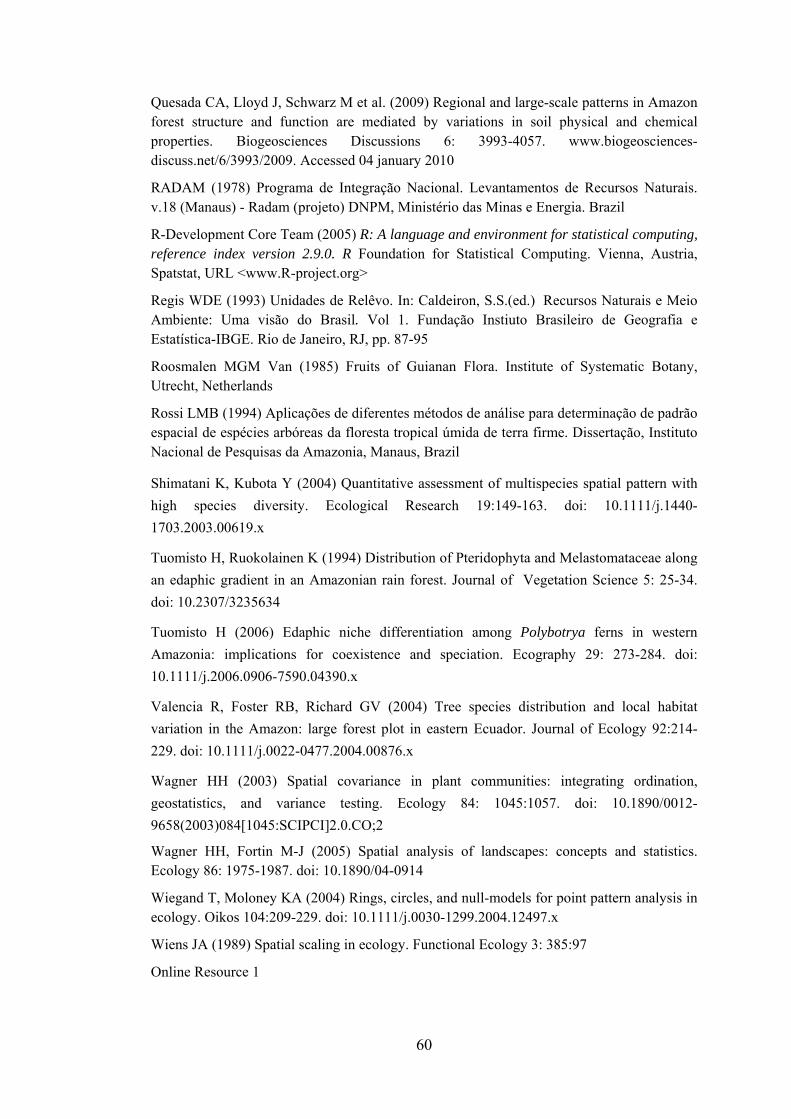
60
Quesada CA, Lloyd J, Schwarz M et al. (2009) Regional and large-scale patterns in Amazon forest structure and function are mediated by variations in soil physical and chemical properties. Biogeosciences Discussions 6: 3993-4057. www.biogeosciences-discuss.net/6/3993/2009. Accessed 04 january 2010
RADAM (1978) Programa de Integração Nacional. Levantamentos de Recursos Naturais. v.18 (Manaus) - Radam (projeto) DNPM, Ministério das Minas e Energia. Brazil
R-Development Core Team (2005) R: A language and environment for statistical computing, reference index version 2.9.0. R Foundation for Statistical Computing. Vienna, Austria, Spatstat, URL <www.R-project.org>
Regis WDE (1993) Unidades de Relêvo. In: Caldeiron, S.S.(ed.) Recursos Naturais e Meio Ambiente: Uma visão do Brasil. Vol 1. Fundação Instiuto Brasileiro de Geografia e Estatística-IBGE. Rio de Janeiro, RJ, pp. 87-95
Roosmalen MGM Van (1985) Fruits of Guianan Flora. Institute of Systematic Botany, Utrecht, Netherlands
Rossi LMB (1994) Aplicações de diferentes métodos de análise para determinação de padrão espacial de espécies arbóreas da floresta tropical úmida de terra firme. Dissertação, Instituto Nacional de Pesquisas da Amazonia, Manaus, Brazil
Shimatani K, Kubota Y (2004) Quantitative assessment of multispecies spatial pattern with high species diversity. Ecological Research 19:149-163. doi: 10.1111/j.1440-1703.2003.00619.x
Tuomisto H, Ruokolainen K (1994) Distribution of Pteridophyta and Melastomataceae along an edaphic gradient in an Amazonian rain forest. Journal of Vegetation Science 5: 25-34. doi: 10.2307/3235634
Tuomisto H (2006) Edaphic niche differentiation among Polybotrya ferns in western Amazonia: implications for coexistence and speciation. Ecography 29: 273-284. doi: 10.1111/j.2006.0906-7590.04390.x
Valencia R, Foster RB, Richard GV (2004) Tree species distribution and local habitat variation in the Amazon: large forest plot in eastern Ecuador. Journal of Ecology 92:214-229. doi: 10.1111/j.0022-0477.2004.00876.x
Wagner HH (2003) Spatial covariance in plant communities: integrating ordination, geostatistics, and variance testing. Ecology 84: 1045:1057. doi: 10.1890/0012-9658(2003)084[1045:SCIPCI]2.0.CO;2
Wagner HH, Fortin M-J (2005) Spatial analysis of landscapes: concepts and statistics. Ecology 86: 1975-1987. doi: 10.1890/04-0914
Wiegand T, Moloney KA (2004) Rings, circles, and null-models for point pattern analysis in ecology. Oikos 104:209-229. doi: 10.1111/j.0030-1299.2004.12497.x
Wiens JA (1989) Spatial scaling in ecology. Functional Ecology 3: 385:97
Online Resource 1

61
Online Resource 1 Spatial structure of tree species community in a “terra firme” Amazon rainforest near Manaus, Brazil Table 1 List of species resulting from CCA, grouped in two groups and used for Ripley’s K analysis in five different sampling unit sizes at the Experimental site of Embrapa, Manaus, Amazonas, Brazil. Group Scientific name Family g1 Abarema jupunba(Willd.) Britton &Killip Fabaceae-Mimosoideae g1 Aparisthmium cordatum Baill. Euphorbiaceae g1 Carapa guianensis Aubl. Meliaceae g1 Chrysophyllum sanguinolentum (Pierre) Baehni Sapotaceae g1 Endopleura uchi (Huber) Cuatrec. Humiriaceae g1 Eperua duckeana R.S.Cowan Fabaceae-
Caesalpinioideae g1 Erythroxylum amplum Bth. Erythroxylaceae g1 Eschweilera truncata A.C.Sm. Lecythidaceae g1 Eschweilera wachenheimii (Benoist) Sandwith Lecythidaceae g1 Guatterria olivacea R.R.Fr. Annonaceae g1 Inga alba (Sw) Willd. Fabaceae-Mimosoideae g1 Inga suberosa T.D.Penn. Fabaceae-Mimosoideae g1 Macrolobium limbatum Spruce ex Benth Fabaceae-
Caesalpinioideae g1 Protium heptaphyllum (Aubl.) ssp. ulei (Swart)
Daly Burseraceae
g1 Protium pilosissimum Engl. Burseraceae g1 Simarouba amara Aubl. Simaroubaceae g1 Sterculia pruriens (Aubl.) K.Schum. Malvaceae g1 Tapura amazonica Poepp. & Endl. Dichapetalaceae g1 Theobroma subincanum Mart. Malvaceae g1 Theobroma sylvestre Mart. Malvaceae g1 Trattinnickia burserifolia Mart. Burseraceae g2 Agonandra brasiliensis Miers Opiliaceae g2 Aspidosperma marcgravianum Woodson Apocynaceae g2 Couratari alta Kunth. Lecythidaceae g2 Distomovita brasiliensis D' Arcy Clusiaceae g2 Eschweilera atropetiolata S.A.Mori Lecythidaceae g2 Geissospermum argenteum Woodson Apocynaceae g2 Goupia glabra Aubl. Goupiaceae g2 Helicostylis scabra (Macbr.) Moraceae g2 Helianthostylis sprucei Baill. Moraceae g2 Hevea guianensis Aubl. Euphorbiaceae g2 Lecythis graciena S.A.Mori Lecythidaceae g2 Lecythis usidata Camb. Lecythidaceae g2 Licaria guianensis Aubl. Lauraceae g2 Licania sp. Lauraceae g2 Mabea sp. Euphorbiaceae g2 Manilkara bidentata (A.DC.) A. Chev. Sapotaceae g2 Micropholis trunciflora Ducke Sapotaceae g2 Mouriri callocarpa Ducke Melastomataceae g2 Neea oppositifolia Ruiz & Pav. Nyctaginaceae g2 Pithecellobium elegans Ducke Fabaceae-Mimosoideae
62
Group Scientific name Family g2 Pouteria caimito (Ruiz & Pav.) Radlk. Sapotaceae g2 Pouteria laurifolia (Gomes) Radlk. Sapotaceae g2 Pouteria venosa (Mart.) Baehni ssp. amazonica
T.D.Penn. Sapotaceae
g2 Pytchopetalum olacoides Benth. Olacaceae
g2 Rinorea racemosa (Mart.) Kuntze Violaceae g2 Stryphnodendron sp. Fabaceae-Mimosoideae g2 Swartzia recurva Poepp. Fabaceae-Faboideae g2 Talisia cf. cupularis Radlk. Sapindaceaea g2 Trichilia micropetala T.D.Penn. Meliaceae g2 Unonopsis duckei (R.&P.)Macba. Annonaceae g2 Xylopia calophylla R.E. Fr. Annonaceae
63
Artigo 4
Neighbour`s Identity of Commercial Tropical Tree Species in a Tropical Rainforest Near Manaus, Brazil.
ABSTRACT
The use of spatially explicit neighbourhood approach helps to understand the
processes which structure and guide tree communities over space and time,
contributing for the conservation and forest management. We investigated the
neighbours of Brosimum spp., Eschweilera coriacea, Ocotea cernua and Protium
hebetatum, hypothesizing that there is a taxonomic pattern around these focal
species, been important information for the maintenance of the forest’s structure
submitted to the management actions. We used a 2-ha plot in a tropical rainforest in
Brazil where all trees with diameter at breast height ≥ 10.0 cm were stem-mapped in
2005. First, we determined how focal species were spatially structured by using
Ripley’s K function. For the neighbourhood analysis, the nearest 20 trees around
focal trees were identified to compute the mean richness, mean proportion of
conspecifics, relative frequency distribution and the number of neighbour species by
distance from focal trees. Our findings demonstrate that conspecific neighbours are
occurring associated with focal trees, mainly at shorter distances for all focal species
with possible more intra-specific interactions as a very few heterospecific neighbours
were associated with focal trees. The spatial structure, more than abundance of focal
species, may have contributed for the conspecific encounters, mainly for Brosimum
spp. and Ocotea cernua. Rare species were found frequently associated with focal
species, calling our attention for the effects of the forest management of commercial
trees on community structure in order to prevent local extinctions.
Key words: neighbourhood analysis; tropical tree species; central Amazonian; terra firme forest.
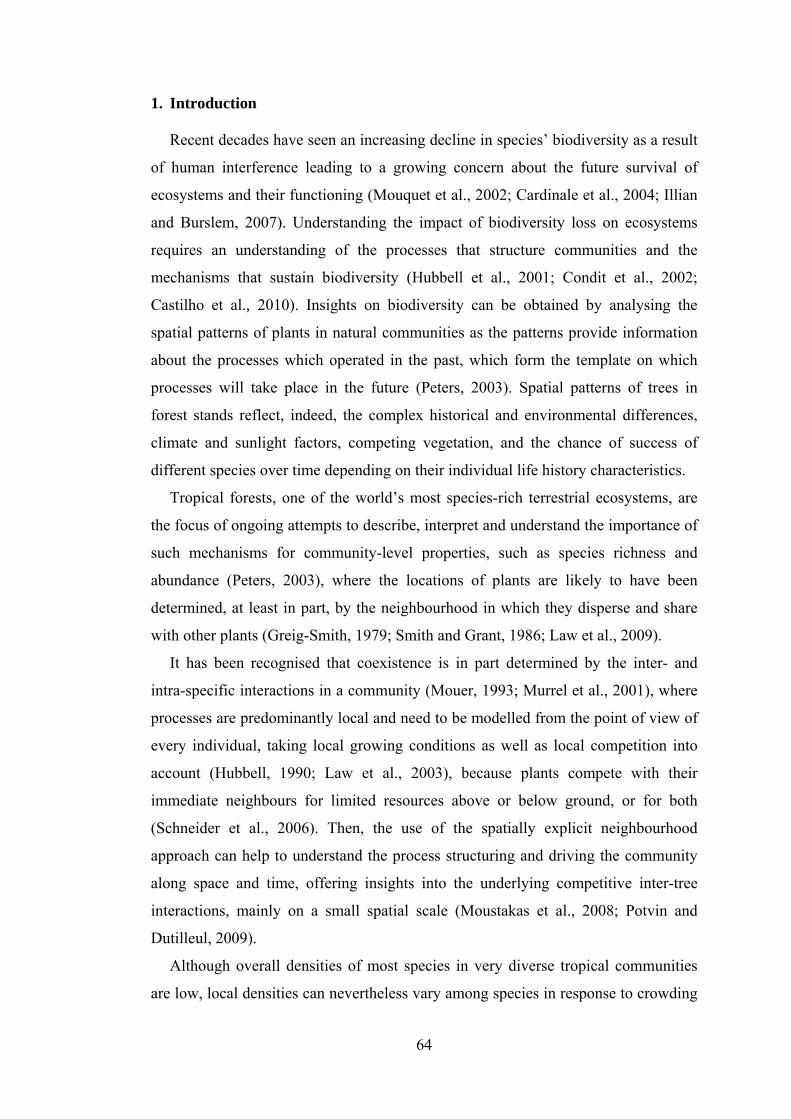
64
1. Introduction
Recent decades have seen an increasing decline in species’ biodiversity as a result
of human interference leading to a growing concern about the future survival of
ecosystems and their functioning (Mouquet et al., 2002; Cardinale et al., 2004; Illian
and Burslem, 2007). Understanding the impact of biodiversity loss on ecosystems
requires an understanding of the processes that structure communities and the
mechanisms that sustain biodiversity (Hubbell et al., 2001; Condit et al., 2002;
Castilho et al., 2010). Insights on biodiversity can be obtained by analysing the
spatial patterns of plants in natural communities as the patterns provide information
about the processes which operated in the past, which form the template on which
processes will take place in the future (Peters, 2003). Spatial patterns of trees in
forest stands reflect, indeed, the complex historical and environmental differences,
climate and sunlight factors, competing vegetation, and the chance of success of
different species over time depending on their individual life history characteristics.
Tropical forests, one of the world’s most species-rich terrestrial ecosystems, are
the focus of ongoing attempts to describe, interpret and understand the importance of
such mechanisms for community-level properties, such as species richness and
abundance (Peters, 2003), where the locations of plants are likely to have been
determined, at least in part, by the neighbourhood in which they disperse and share
with other plants (Greig-Smith, 1979; Smith and Grant, 1986; Law et al., 2009).
It has been recognised that coexistence is in part determined by the inter- and
intra-specific interactions in a community (Mouer, 1993; Murrel et al., 2001), where
processes are predominantly local and need to be modelled from the point of view of
every individual, taking local growing conditions as well as local competition into
account (Hubbell, 1990; Law et al., 2003), because plants compete with their
immediate neighbours for limited resources above or below ground, or for both
(Schneider et al., 2006). Then, the use of the spatially explicit neighbourhood
approach can help to understand the process structuring and driving the community
along space and time, offering insights into the underlying competitive inter-tree
interactions, mainly on a small spatial scale (Moustakas et al., 2008; Potvin and
Dutilleul, 2009).
Although overall densities of most species in very diverse tropical communities
are low, local densities can nevertheless vary among species in response to crowding
65
or to the identity of neighbouring species, which is likely to contribute to the
maintenance of species diversity in tropical forests (Condit et al., 2000; Leigh Jr. et
al., 2004; Vogt et al., 2010). Also, the rarity of the majority of species in tropical
forests demands the grouping of species, using some criteria that capture their
potentially different effects on target species. Historically, forest modellers have
chosen from one of several grouping criteria, including taxonomic affinity,
ecological guilds, similar growth dynamics, among others (Vanclay, 1991). The
knowledge about the interactions between target species and their neighbours is very
important for the forest management, which helps in the maintenance of forest
structure and the ecosystems function.
Taxonomic proximity might be expected to increase overlap in resource
requirements or the likelihood of shared enemies, augmenting the strength of
interactions among neighbouring species, which also could contribute to species
coexistence (Uriarte et al., 2004). These authors found in their studies at the Barro
Colorado Island (BCI), Panamá that families and species differed in the response to
neighbour groupings where for most legumes, the taxonomic identity or light guild of
the neighbours had distinct effects on sapling growth. So, the variation among
species in response to crowding or to the identity of neighbouring species is likely to
contribute to the maintenance of species diversity in tropical forests (Uriarte et al.,
2004; Potvin and Dutilleul, 2009).
In the present study, we hypothesized that there is a taxonomic pattern in the
occurrence of neighbours of four commercial tree species in the Brazilian Amazon
“terra firme” tropical rainforest, characterized mainly by the occurrence of
conspecific neighbour species, which are important features to help forest
management in the maintenance of forest’s structure and interactions among species.
To address this issue, we used the nearest neighbour analysis to investigate the
identity of 20 k-nearest neighbours around each focal tree and the Ripley’s K
function, to identify how species are locally spatially structured.
66
2. Methods
2.1. Study area
The study area is located in a Western Amazon upland “terra firme” dense forest,
at the Embrapa Experimental site, in Manaus, state of Amazonas, Brazil, having an
area of 2-ha, entirely located at the top position according to the local topography, at
the coordinates 60° 2.4’W and 2° 31’ 58.8” S. The climate is tropical, type “Am”
(Koppen classification), with a mean annual rainfall from 1355 to 2839 mm. The
mean annual temperature ranges from 25.6°C to 27.6 °C, with relative humidity from
84 to 90% (RADAM, 1978). On a broad scale, soils are fairly homogeneous
throughout the stands; heavy-textured dystrophic yellow latosol predominates,
covered mainly by dense forest with emergent trees (IBGE, 1999). The upland areas
are plateaus formed by Tertiary sediments that cover the largest portion of the
Amazon sedimentary basin, shaped by landforms dissected in extensive interfluvial
plateaus and hills (Regis, 1993). Rainforests in the area are evergreen and terra firme
(not seasonally flooded), with forest canopy typically 30-40 m tall, with emergents to
55 m (Laurance et al., 2004).
2.2. Field sampling and species information
At the 2-ha study area (100mx200m), all trees with dbh ≥ 10 cm were stem-
mapped (x-y coordinates) in 2005 and botanically classified at species level. A total
of 1,055 individuals, classified into 163 species and 42 families were identified, with
about 30 percent of the species having only one (01) individual and about 68 percent
from 1 to 5 individuals (Fig. 1).
67
Fig.1. Number of individuals per species at the 2-ha study area, highlighting the four commercial species studied.
From the list of species identified at the 2-ha plot, four commercial tree species
largely used by the lumber industries in Amazonas state were selected (Lima Filho et
al., 2005). The species studied were: Brosimum spp. (Bro spp), Eschweilera coriacea
(DC.) S.A. Mori (Esc cor), Ocotea cernua (Nees) Mez (Oco cer) and Protium
hebetatum D.C. Daly (Pro heb), which, from now on, are referenced as focal species
and their individuals, as focal trees. The number of individuals per focal specie is: 19
for (Bro spp), 91 (Esc cor), 19 (Oco cer) and 64 (Pro heb).
The focal species “Bros spp”, combined four species because, according to Lima
Filho et al. (2005), this genus is used by lumber industries without a specific species
preference. The species in this genus and its respective number of individuals are: (1)
Brosimum lactescens (S.Moore) C.C.Berg. (1 individual); (2) Brosimum acutifolium
Huber ssp. Interjectum C.C.Berg (2 individuals); (3) Brosimum utile (H.B.K.) Pittier
ssp. ovatifolium (Ducke) C.C.Berg. (5 individuals) and (4) Brosimum rubescens
Taub. (11 individuals).
The species in the genus “Brosimum”, Moraceae family, are generally 20 to 30
meters tall, present high density wood and small seeds. According to studies of
Marimon et al. (2008), they behave like secondary species, with low growth under
shade environments and faster growth in gaps.
Eschweilera coriacea (Esc cor), Lecythidaceae family, is a common canopy tree
up to 37 m tall, widely distributed in the Amazon basin, with high densities (Nelson
and Oliveira, 2001; Lopes, 2007). The pyxidium fruits are medium size and contain
one to several large seeds that may attract some frugivorous animals, such as large
68
birds and bats. Gravity plays a role in their dispersal and vertebrate consumers, such
as rodents and primates may also disperse seeds (Prance and Mori, 1978).
Ocotea cernua- lauraceae family, produces small fruits and trees occupy the
midstorey and canopy position (Comita et al., 2007). There is little information
available in literature about this species.
Protium hebetatum belongs to the Burseraceae family, which is one of the most
dominant families in the Central Amazon (Ribeiro et al., 1994). It is typical
understory species, medium tall and has medium size fruits and seeds, with mainly
endozoocoric dispersal (Andrade and Higuchi, 2009).
2.3. Nearest neighbour analysis
Twenty nearest neighbour trees of the four focal species were analysed with the
intent of identifying and describing a compositional pattern around focal species and
how conspecifics are distributed over them. The analysis was carried out using the
Spatstat software system in R (Baddeley, 2008), based on the following measures at
each species, separately:
(1) mean distance to each of the 20 nearest neighbours from focal trees, aiming to
know the range of occurrence of the neighbours; (2) Ripley’s K point pattern
analyses, univariate function, with the results presented as “L(r) – r” instead of K,
which is a transformation of the Poisson K function to the straight line, making it
easier to assess the deviation from the theoretical function (Fortin and Dale, 2005);
(3) the mean species richness and mean number of conspecifics, considering all 20
nearest neighbours at each focal tree; (4) the mean proportion of conspecifics,
calculated over all focal trees; (5) the most frequent species occurring along the 20
nearest neighbours measured over all focal trees; (6) the number of species registered
within each k-nearest neighbour investigated, plotted against the mean distance from
the focal tree to the kth-nearest neighbour, and (7) the frequency calculated within
each k-nearest neighbour, which might present a pattern in the occurrence of the
neighbour species.
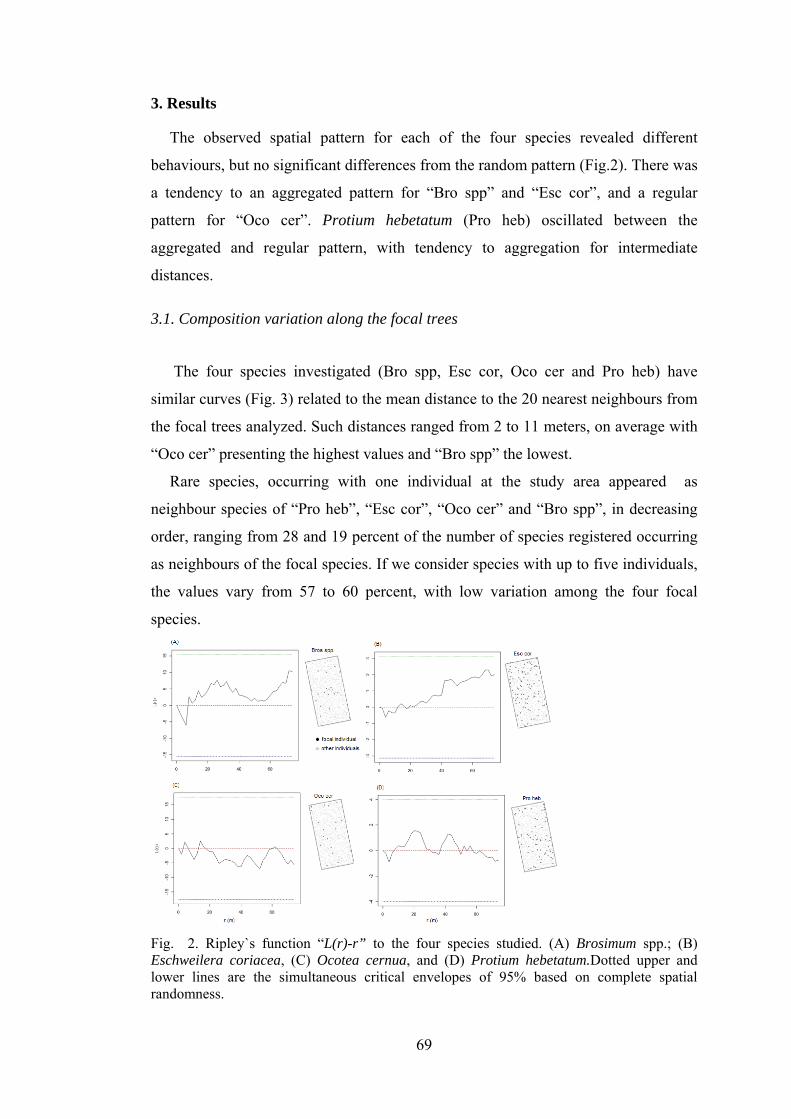
69
3. Results
The observed spatial pattern for each of the four species revealed different
behaviours, but no significant differences from the random pattern (Fig.2). There was
a tendency to an aggregated pattern for “Bro spp” and “Esc cor”, and a regular
pattern for “Oco cer”. Protium hebetatum (Pro heb) oscillated between the
aggregated and regular pattern, with tendency to aggregation for intermediate
distances.
3.1. Composition variation along the focal trees
The four species investigated (Bro spp, Esc cor, Oco cer and Pro heb) have
similar curves (Fig. 3) related to the mean distance to the 20 nearest neighbours from
the focal trees analyzed. Such distances ranged from 2 to 11 meters, on average with
“Oco cer” presenting the highest values and “Bro spp” the lowest.
Rare species, occurring with one individual at the study area appeared as
neighbour species of “Pro heb”, “Esc cor”, “Oco cer” and “Bro spp”, in decreasing
order, ranging from 28 and 19 percent of the number of species registered occurring
as neighbours of the focal species. If we consider species with up to five individuals,
the values vary from 57 to 60 percent, with low variation among the four focal
species.
Fig. 2. Ripley`s function “L(r)-r” to the four species studied. (A) Brosimum spp.; (B) Eschweilera coriacea, (C) Ocotea cernua, and (D) Protium hebetatum.Dotted upper and lower lines are the simultaneous critical envelopes of 95% based on complete spatial randomness.
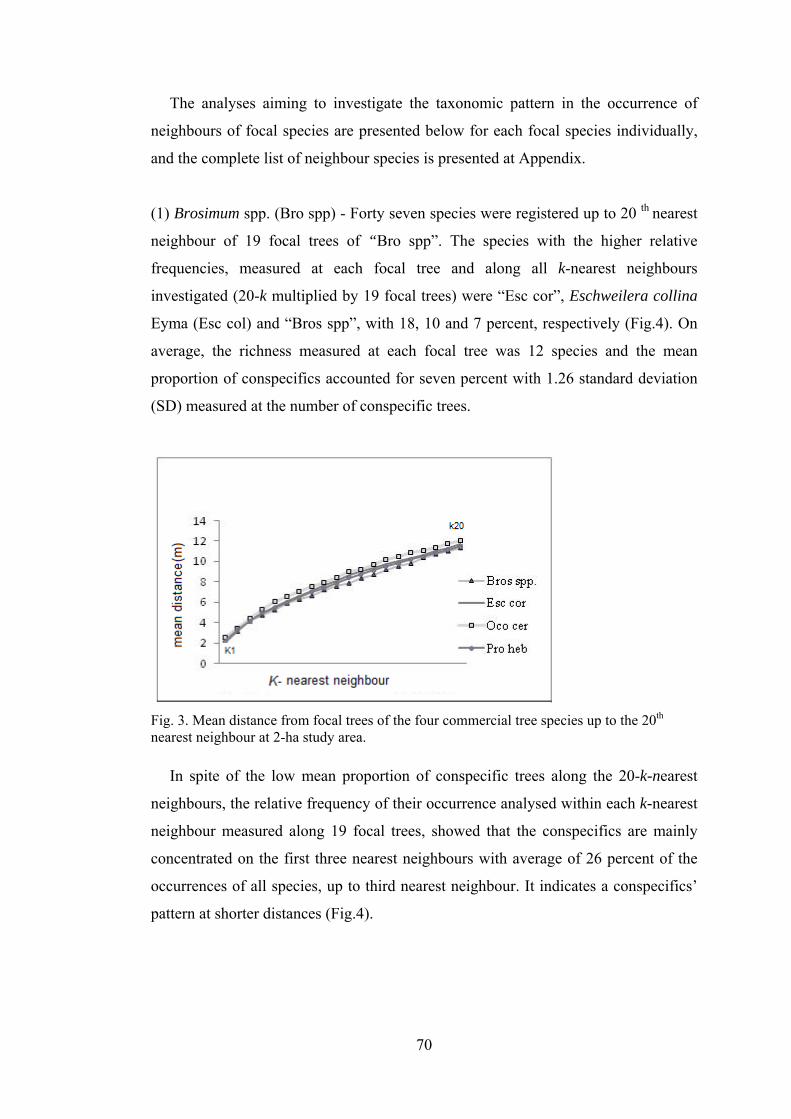
70
The analyses aiming to investigate the taxonomic pattern in the occurrence of
neighbours of focal species are presented below for each focal species individually,
and the complete list of neighbour species is presented at Appendix.
(1) Brosimum spp. (Bro spp) - Forty seven species were registered up to 20 th nearest
neighbour of 19 focal trees of “Bro spp”. The species with the higher relative
frequencies, measured at each focal tree and along all k-nearest neighbours
investigated (20-k multiplied by 19 focal trees) were “Esc cor”, Eschweilera collina
Eyma (Esc col) and “Bros spp”, with 18, 10 and 7 percent, respectively (Fig.4). On
average, the richness measured at each focal tree was 12 species and the mean
proportion of conspecifics accounted for seven percent with 1.26 standard deviation
(SD) measured at the number of conspecific trees.
Fig. 3. Mean distance from focal trees of the four commercial tree species up to the 20th nearest neighbour at 2-ha study area. In spite of the low mean proportion of conspecific trees along the 20-k-nearest
neighbours, the relative frequency of their occurrence analysed within each k-nearest
neighbour measured along 19 focal trees, showed that the conspecifics are mainly
concentrated on the first three nearest neighbours with average of 26 percent of the
occurrences of all species, up to third nearest neighbour. It indicates a conspecifics’
pattern at shorter distances (Fig.4).
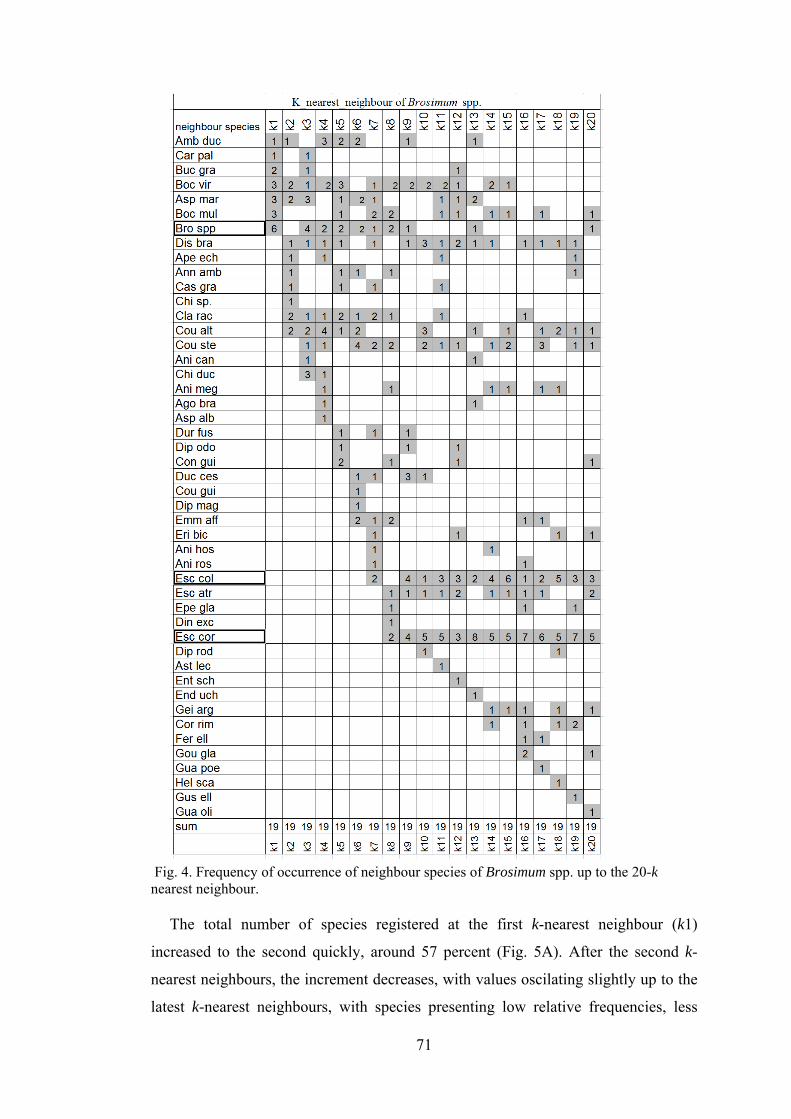
71
Fig. 4. Frequency of occurrence of neighbour species of Brosimum spp. up to the 20-k
nearest neighbour. The total number of species registered at the first k-nearest neighbour (k1)
increased to the second quickly, around 57 percent (Fig. 5A). After the second k-
nearest neighbours, the increment decreases, with values oscilating slightly up to the
latest k-nearest neighbours, with species presenting low relative frequencies, less
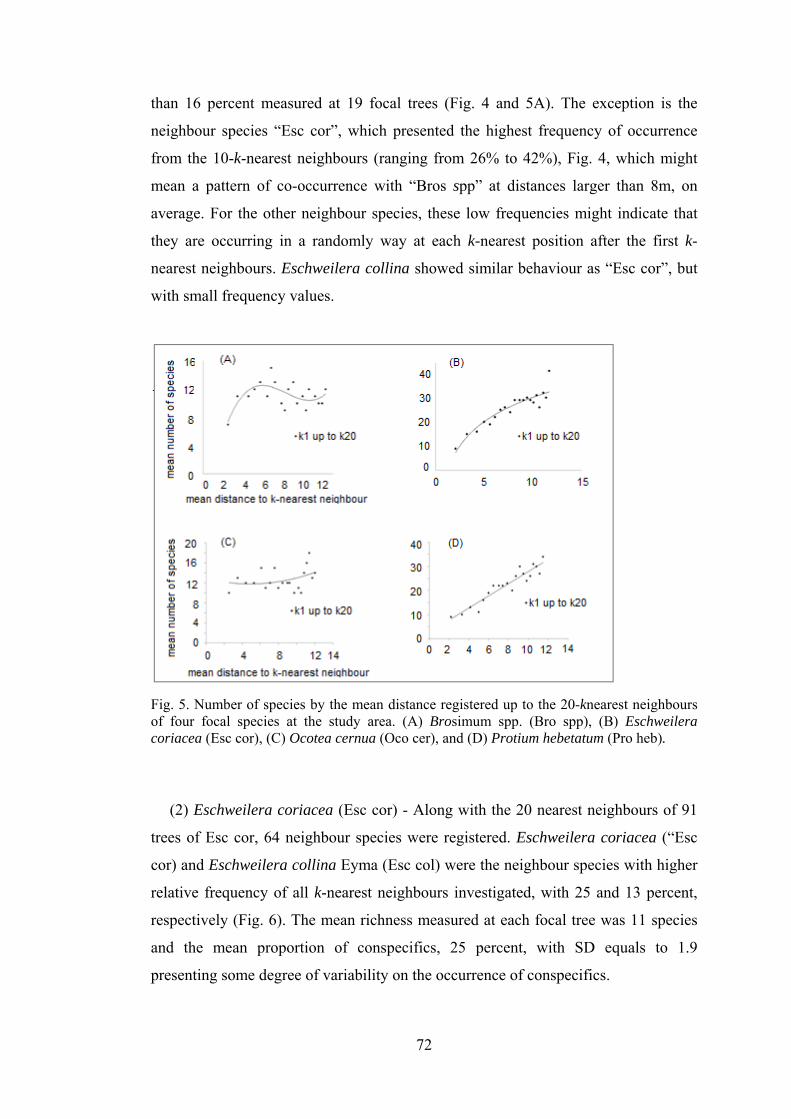
72
than 16 percent measured at 19 focal trees (Fig. 4 and 5A). The exception is the
neighbour species “Esc cor”, which presented the highest frequency of occurrence
from the 10-k-nearest neighbours (ranging from 26% to 42%), Fig. 4, which might
mean a pattern of co-occurrence with “Bros spp” at distances larger than 8m, on
average. For the other neighbour species, these low frequencies might indicate that
they are occurring in a randomly way at each k-nearest position after the first k-
nearest neighbours. Eschweilera collina showed similar behaviour as “Esc cor”, but
with small frequency values.
Fig. 5. Number of species by the mean distance registered up to the 20-knearest neighbours of four focal species at the study area. (A) Brosimum spp. (Bro spp), (B) Eschweilera coriacea (Esc cor), (C) Ocotea cernua (Oco cer), and (D) Protium hebetatum (Pro heb).
(2) Eschweilera coriacea (Esc cor) - Along with the 20 nearest neighbours of 91
trees of Esc cor, 64 neighbour species were registered. Eschweilera coriacea (“Esc
cor) and Eschweilera collina Eyma (Esc col) were the neighbour species with higher
relative frequency of all k-nearest neighbours investigated, with 25 and 13 percent,
respectively (Fig. 6). The mean richness measured at each focal tree was 11 species
and the mean proportion of conspecifics, 25 percent, with SD equals to 1.9
presenting some degree of variability on the occurrence of conspecifics.
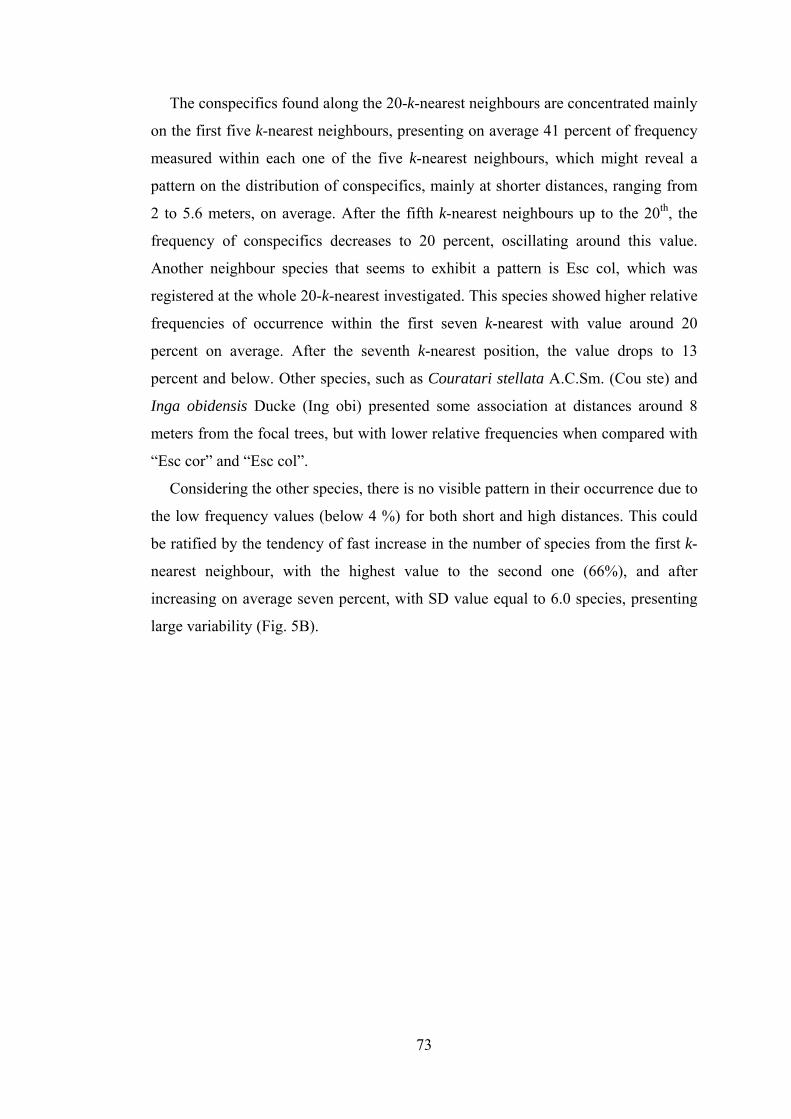
73
The conspecifics found along the 20-k-nearest neighbours are concentrated mainly
on the first five k-nearest neighbours, presenting on average 41 percent of frequency
measured within each one of the five k-nearest neighbours, which might reveal a
pattern on the distribution of conspecifics, mainly at shorter distances, ranging from
2 to 5.6 meters, on average. After the fifth k-nearest neighbours up to the 20th, the
frequency of conspecifics decreases to 20 percent, oscillating around this value.
Another neighbour species that seems to exhibit a pattern is Esc col, which was
registered at the whole 20-k-nearest investigated. This species showed higher relative
frequencies of occurrence within the first seven k-nearest with value around 20
percent on average. After the seventh k-nearest position, the value drops to 13
percent and below. Other species, such as Couratari stellata A.C.Sm. (Cou ste) and
Inga obidensis Ducke (Ing obi) presented some association at distances around 8
meters from the focal trees, but with lower relative frequencies when compared with
“Esc cor” and “Esc col”.
Considering the other species, there is no visible pattern in their occurrence due to
the low frequency values (below 4 %) for both short and high distances. This could
be ratified by the tendency of fast increase in the number of species from the first k-
nearest neighbour, with the highest value to the second one (66%), and after
increasing on average seven percent, with SD value equal to 6.0 species, presenting
large variability (Fig. 5B).
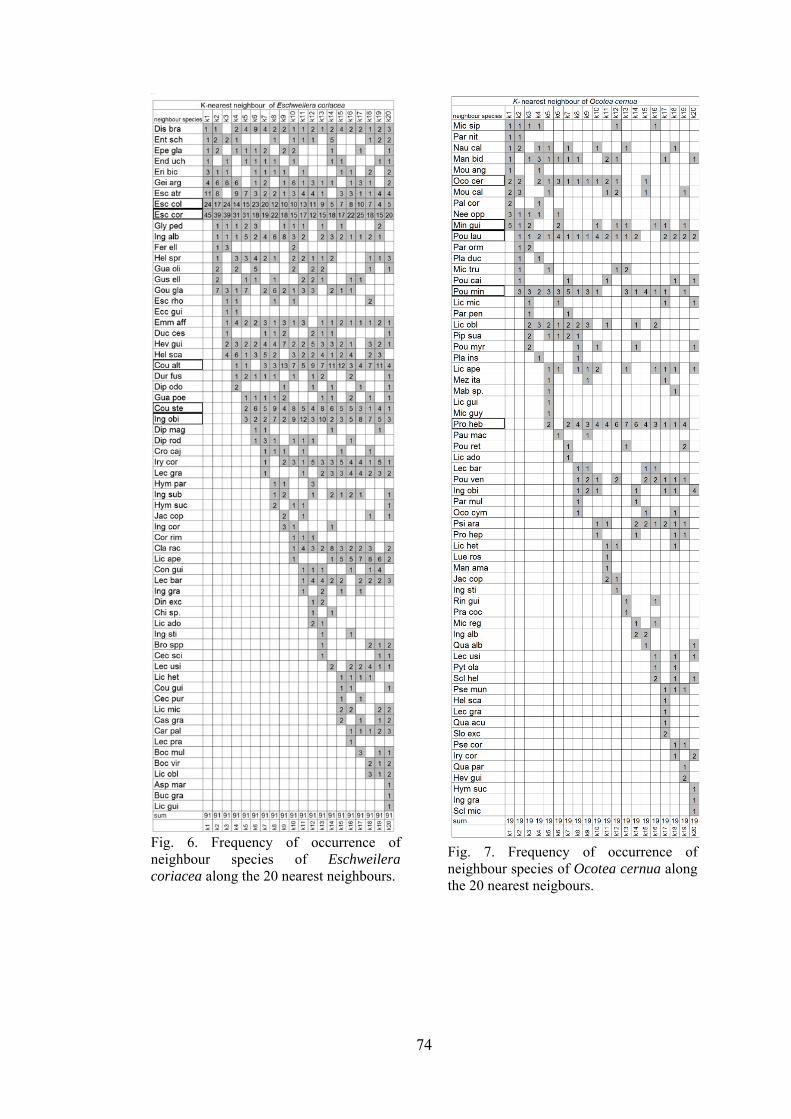
74
Fig. 6. Frequency of occurrence of neighbour species of Eschweilera coriacea along the 20 nearest neighbours.
Fig. 7. Frequency of occurrence of neighbour species of Ocotea cernua along the 20 nearest neigbours.
75
(3) Ocotea cernua (Oco cer) - Sixty-three neighbour species were found along the
20 nearest neighbours of 19 focal trees belonging of this species (Fig. 7). The species
with higher relative frequencies were “Pro heb”, Pouteria minima T.D.Penn. (Pou
min) and Pouteria laurifolia (Gomes) Radlk (Pou lau), with 13, 9 and 6 percent,
respectively, with other 60 species presenting less than five percent of relative
frequency.
The mean richness at each focal tree is 14 species and the mean proportion of
conspecifics 5 percent, with SD equal to 0.90 individuals. At shorter distances,
within the first four nearest, the relative frequency of species is in general below 15
percent, with no tendency of association among species and the focal one, even for
conspecific trees; excepting Minquartia guianensis Aubl. (Min gui) with around 26
percent of occurrence at the first k-nearest (k1).
At the intermediate k-nearest neighbour (6 to 15), which corresponds to 10 meters
on average, only “Pro heb” seem to have some tendency to be associated with the
focal species with 26 percent of the occurrences at these positions, on average (Fig.
7). In general, the number of species, measured within each k-nearest neighbour
tends to increase with the distance, with increases of 30 percent from the first to the
second k-nearest neighbour, and then oscilating in a very low or even negative range,
with species showing low relative frequencies. (Fig. 5C). This indicates, again, the
occurrence by chance for most neighbour species at specific kth nearest neighbour
position.
(4) Protium hebetatum (Pro heb) - Sixty-seven neighbour species were found
within the 20 nearest neighbours over all 64 focal trees. The richness around each
focal tree was equal to 12 species, and the mean conspecific proportion equal to 22
percent with the highest variability on the number of conspecifics at each focal tree,
which presented SD equal to 2.3 individuals.
Protium hebetatum (Pro heb), Pouteria minima (Pou min) and Psidium araca
Raddi (Psi ara), at this order, presented the highest values of relative frequency when
we added up all occurrences along the 20 nearest neighbours investigated, that
represented 22, 12 and 8 percent, respectively (Fig. 8). Yet, the conspecific trees of
“Pro heb” are concentrated mainly at the first four k-nearest with the highest
frequency at the first one (67%). After these four k-nearest neighbour, the frequency
decreased to 15 percent on average, but is still the highest, when compared with
other species. “Pou min” and “Psi ara” were found at all 20ks-nearest, but with low
76
values of frequency when compared with “Pro heb”, concentrating at shorter
distances. Overall, there is no strong evidence of pattern in the distribution of the
other neighbour species, except for “Oco cer”, Pouteria laurifolia (Pou lau), at the
intermediate position and Minquartia guianensis (Min gui) at the latest k-nearest
position (Fig. 8).
The number of species registered within each k-nearest neighbour at each focal
tree presented a positive linear relationship with the distances from the focal trees
(Fig.6d). This positive relation is then followed by the decrease in the conspecific
trees with new species occurring with very low frequency along the 64 focal trees of
“Pro heb” (Fig. 5D).
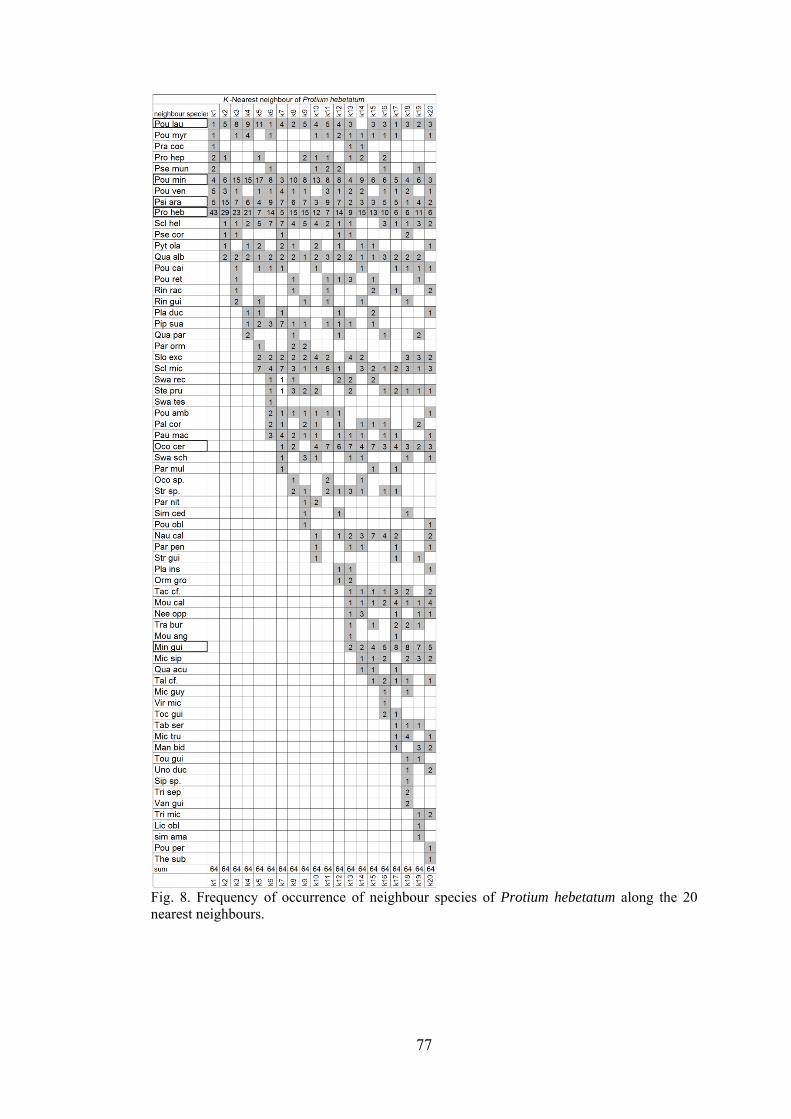
77
Fig. 8. Frequency of occurrence of neighbour species of Protium hebetatum along the 20 nearest neighbours.
78
4. Discussion
In our study, the focal species analyzed presented patterns tending to aggregation
(Bro spp and Esc cor), and to a regular one (Oco cer), although non-significant, (Fig.
2). However, it could be attributed more to the spatial pattern rather than the
abundance, the slight differences in the proprotion of conspecifics observed for focal
species over all k-nearest neighbours, where the tendencies of a more aggregated
pattern might have contributed for more conspecific encounters. The focal species
“Bro spp” has the same number of individuals as “Oco cer”, but presented higher
conspecific value with clearer tendency of spatial aggregation, which could be due to
the configuration of the trees in the field. Condit et al. (2000) and Vogt et al. (2010)
observed in their studies that the frequency with which individuals have other
individuals of the same or different species as their neighbours depended less on the
relative abundance than on the particular spatial pattern, where it is expected that
intraspecific encounters could be much more frequent than interspecific ones when
species exhibit aggregated patterns.
All focal species but “Oco cer” had their conspecifics as one of the most frequent
species measured along the 20 nearest neighbours investigated. Regardless of the
value of occurrence of conspecifics for all four focal species, the conspecifics have
been mainly concentrated near the focal trees, which could be a result of biological
process, such as dispersal at short distances, leading to more intra-specific
interactions.
The focal trees of “Esc cor” and “Pro heb” seem to be currently experiencing
more intra-specific relationships at shorter distances ranging from 2 to 5 meters due
to the more conspecific encounters, (Fig. 6 and 8). However, the above cited species
were also found in the whole range of the 20 nearest neighbours investigated, still
with high frequencies values, showing great plasticity in the occurrence of
conspecifics at larger distances. This could be explained by the fact that “Esc cor” is
a canopy species whose seeds are dispersed by large birds and bats, rodents and
primates, where the secondary dispersal seems to contribute to this behaviour (Lopes,
2007).
Connel et al. (1984) studied the effect of distance to neighbour on mortality of
both seedling and saplings, in a tropical rainforest in Australia, finding that mortality
was significantly higher when conspecific neighbours were closer for the most of the
species investigated. The fact that the focal species “Pro heb” and “Esc cor” were
79
found in the whole range of the neighbours investigated with relative high frequency
might be the result of early weaker intra-specific interactions due to larger distances
among conspecifics, favouring the actual occurrence of a higher number of
individuals of these two species.
The similar number of neighbour species registered for the focal species “Esc
cor”, “Oco cer” and “Pro heb”, around 64 species, highlights the high local diversity
at the study area. “Oco cer” presents the highest richness, also being the species with
the lowest proportion of conspecific neighbours. The fact that two focal species with
the same number of individuals (Bros spp and Oco cer) have a different number of
species around them (47 and 63 species, respectively) demonstrates that focal trees
are affected differently by their neighbour species, due to the biological and/or
environmental differences at the study area. These differences lead to the necessity of
different management strategies aiming to keep the ecosystem’s functionality. So, it
is expected, in general, that a high species-richness of neighbours might lead to
complementary resource use, which could increase the amount of resources
consumed by the neighbours, and thus decrease the amount left available to the target
species. Target performance would therefore decrease as the species-richness of the
neighbours community increases (Milbau et al., 2007). Further studies could ratify
this assumption with the use of repeated measures through time and small diameter
classes.
In a more detailed view of the distribution of neighbour species around focal trees,
within each kth-nearest neighbour as a function of the distance, we found that the
number of species increased with distance, but with different shapes of the curves
(Fig. 5), again highlighting the influence of the high diversity and the rare species,
which probably contributed for the values of richness observed. This could explain
the positive linear tendency of richness and distances for the species, specially for
“Pro heb”, which is the focal species with the highest number of neighbouring rare
species followed by “Esc cor”, “Oco cer” and “Bros spp” at this order. Due to the
occurrence of a large percentage of rare species at the study area, distributed along
the focal species, it is necessary to care about the areas affected by logging in order
to prevent local extinctions of rare species.
Overall, some species appeared more frequently at a specific k-nearest position,
revealing a taxonomic pattern around focal trees. The focal trees of “Bro spp” and
“Esc cor” had trees of “Esc cor” and Eschweilera collina (Esc col), at this order, as
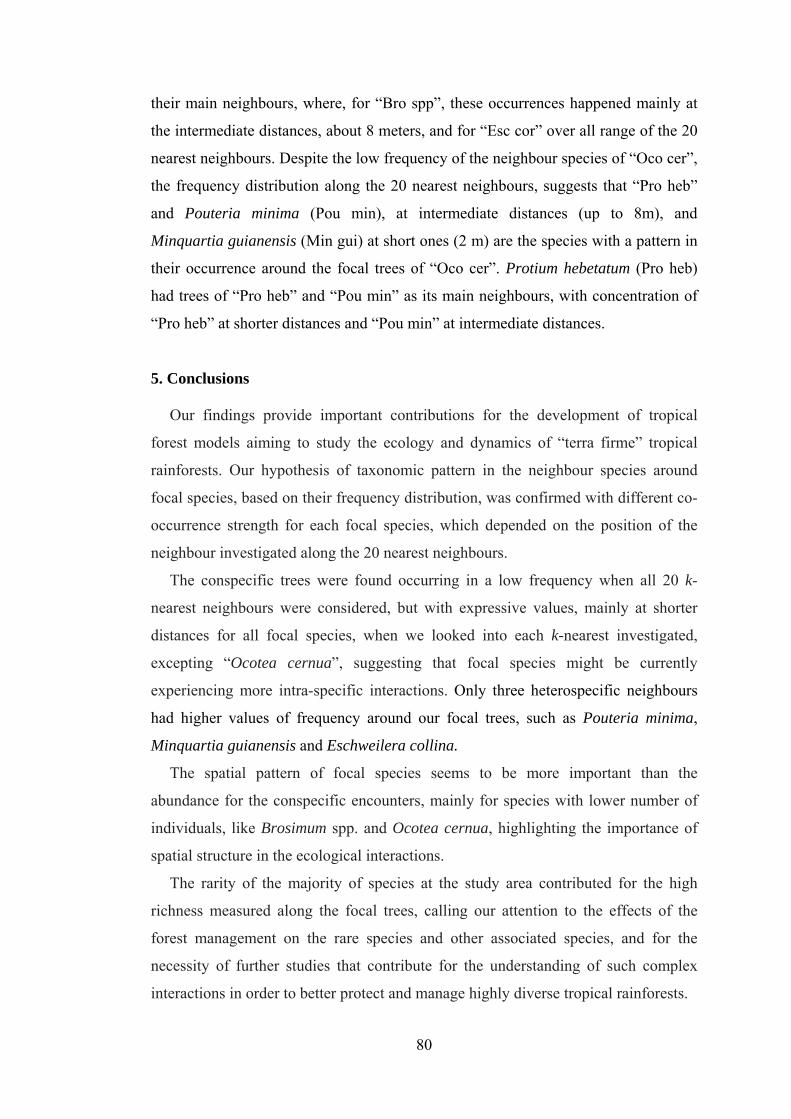
80
their main neighbours, where, for “Bro spp”, these occurrences happened mainly at
the intermediate distances, about 8 meters, and for “Esc cor” over all range of the 20
nearest neighbours. Despite the low frequency of the neighbour species of “Oco cer”,
the frequency distribution along the 20 nearest neighbours, suggests that “Pro heb”
and Pouteria minima (Pou min), at intermediate distances (up to 8m), and
Minquartia guianensis (Min gui) at short ones (2 m) are the species with a pattern in
their occurrence around the focal trees of “Oco cer”. Protium hebetatum (Pro heb)
had trees of “Pro heb” and “Pou min” as its main neighbours, with concentration of
“Pro heb” at shorter distances and “Pou min” at intermediate distances.
5. Conclusions
Our findings provide important contributions for the development of tropical
forest models aiming to study the ecology and dynamics of “terra firme” tropical
rainforests. Our hypothesis of taxonomic pattern in the neighbour species around
focal species, based on their frequency distribution, was confirmed with different co-
occurrence strength for each focal species, which depended on the position of the
neighbour investigated along the 20 nearest neighbours.
The conspecific trees were found occurring in a low frequency when all 20 k-
nearest neighbours were considered, but with expressive values, mainly at shorter
distances for all focal species, when we looked into each k-nearest investigated,
excepting “Ocotea cernua”, suggesting that focal species might be currently
experiencing more intra-specific interactions. Only three heterospecific neighbours
had higher values of frequency around our focal trees, such as Pouteria minima,
Minquartia guianensis and Eschweilera collina.
The spatial pattern of focal species seems to be more important than the
abundance for the conspecific encounters, mainly for species with lower number of
individuals, like Brosimum spp. and Ocotea cernua, highlighting the importance of
spatial structure in the ecological interactions.
The rarity of the majority of species at the study area contributed for the high
richness measured along the focal trees, calling our attention to the effects of the
forest management on the rare species and other associated species, and for the
necessity of further studies that contribute for the understanding of such complex
interactions in order to better protect and manage highly diverse tropical rainforests.
81
Acknowledgments
Our acknowledgments to Embrapa Western Amazonia, where the data were
collected, for the financial support for the work, and to the National Council for
Scientific and Technological Development (CNPq). We also acknowledge the
Department of Forestry of the Federal University of Viçosa, and the University of
Toronto, particularly the Landscape Ecology Laboratory (LE LAB), where the
analyses were performed, and Josie Hughes for the contribution to the analysis.
References
Andrade, E.A., Niro, H., 2009. Produtividade de quatro espécies arbóreas de Terra Firme da amazônia central. Acta amazonica 39, 105-112.
Baddley, A., 2008. Analysing spatial point patterns in R. CSIRO and University of Western Australia. Workshop Notes. (Available at http://school.maths.uwa.edu.au/~adrian/).
Cardinale, B.J., Ives, A., Inchausti, P., 2004. Effects of species diversity on the primary productivity of ecosystems: extending our spatial and temporal scales of inference. Oikos 104, 437-450.
Castilho, C.V., Magnusson, W.E., Araújo, R.N.O, Luizão, F.J., 2010. Short-term temporal changes in tree live biomass in a central Amazonian forest, Brazil. Biotropica 42, 95-103.
Comita, L.S., Condit, R.,Hubbell, S.P., 2007. Developmental changes in habitat associations of tropical trees. Journal of Ecology 95, 482-492.
Condit, R., Pitman, N., Leigh Jr., E.G., Chave, J., Terborgh, J., Foster, R.B., Nunez, P., Aguilar, S., Valencia, R., Villa, G., Muller-Landau, H.C., Losos, Hubbell, S.P., 2002. Beta diversity in tropical forest trees. Science 295, 666-669.
Condit, R.,Ashton, P.S., Bakser, P., Bunyavejchwin, S., Gunatilleke, N.G., Hubbell, S.P., Foster, R.B., Itoh, A., Lafrankie, J.V., Lee, H.S., Losos, E., Manokaran, N.,Sukumar, R., Yamakura, T., 2000. Spatial patterns in the distribution of tropical tree species. Science 288, 1414-1417.
Connell, J.H., Tracey, J.G., Leonard, J., 1984. Compensatory recruitment, growth, and mortality as factors maintaining rain forest tree diversity. Ecological Monographs 54, 141-164.
Fortin, M.-J., Dale, M.R.T., 2005. Spatial Analysis: A Guide for Ecologists. Cambridge University Press, Cambridge.
Greig-Smith, P., 1979. Pattern in vegetation. Journal of Ecology 67, 755–779. Harms, K.E., Wright, J.S., Calderón, O., Hernandez, A., Herre, E.A., 2000. Pervasive
density-dependent recruitment enhances seedling diversity in tropical forests. Nature 404, 493-495.
Hubbell, S.P., Ahumada, J.A., Condit, R., Foster, R.B., 2001. Local neighborhood effects on long-term survival of Individual trees in a neotropical forest. Ecological Research 16, 859-875.
Hubbell, S.P., Condit, R., Foster, R.B., 1990. Presence and absence of density dependence in a neotropical community. Philosophical Transactions of the Royal Society of London 330, 269-281.
IBGE-Instituto Brasileiro de Geografia e Estatística, 1999. Mapa digital temático de vegetação, Banco de dados Sipam, Brasil.
82
Illian, J., Burslem, D., 2007. Contributions of spatial point process modelling to biodiversity theory. Journal de la Société Française de Statistique 148, 9-29.
Laurance, W.F., Nascimento, H.E.M., Laurance, S.G., Condit, R., D’Angelo, S., Andrade, A., 2004. Inferred longevity of Amazonian rainforest trees based on a long-term demographic study. Forest Ecology and Management 190, 131-143.
Law, R., Illian, J., Burslem, D.F.R., Gratzer, G., Gunatilleke, C.V.S., Gunatilleke, I.A.U.N., 2009. Ecological information from spatial patterns of plants: insights from point process theory. Journal of Ecology 97, 616-628.
Law, R., Murrell, D.J., Ulf, D., 2003. Population growth in space and time: spatial logistic equations. Ecology 84, 252-262.
Leigh JR., E.G., 2004. Neutral Theory: a historical perspective. J. Evol. Biol. 20, 2075-2091.
Lima Filho, D.A., Matos, F.D.A., Amaral, I.L., Revilla, J., Coelho, L.S., Ramos, J.F., Santos, J.L., 2001. Inventário florístico de floresta ombrófila densa de terra firme, na região do Rio Urucu-Amazonas, Brasil. Acta Amazonica 31, 565-579.
Lopes, M.A., 2007. Population structure of Eschweilera coriacea (D.C.) S. A.Mori in fores fragments in eastern Brazilian Amazonia. Revista Brasileira de Botânica 30, 509-519.
Marimon, B.S., Felfili, J.M., Marimon Jr., B.H., Franco, A.C., Fagg, C.W., 2008. Desenvolvimento inicial e partição de biomassa de Brosimum rubescens Taub. (Moraceae) sob diferentes níveis de sombreamento. Acta Botanica Brasilica 22, 941-953.
Milbau, A., Reheul, E.D., Cauwer, E.B. Nus, I., 2007. Factors determining plant–neighbour interactions on different spatial scales in young species-rich grassland Communities. Ecol Res 22, 242–247.
Mouer, M., 1993. Characterizing spatial patterns of trees using stem-mapped data. Forest Science 39, 756-775.
Mouquet, N., Moore, J.L., Loreau, M., 2002. Plant species richness and community productivity: why the mechanism that promotes coexistence matters. Ecology Letters 5, 56-65.
Moustakas, A., Wiegand, K., Getzin, S., Ward, D., Meyer, K.M., Guenther, M., Mueller, K.H., 2008. Spacing patterns of an Acacia tree in the Kalahari over a 61-year period: How clumped becomes regular and vice versa. Acta Oecologica 33, 355-364.
Murrel, D.J., Purves, D.W., Law, R., 2001. Uniting pattern and process in plant ecology. Trends in Ecology and Evolution 16, 529-530.
Nelson, B.W., Oliveira, A.A., 2001. Área botânica. in: Veríssimo, A., Moreira, A.,Sawyer, D., Santos, I., Pinto, L.P. (Eds.). Biodiversidade na Amazônia brasileira – avaliação e ações prioritárias para a conservação, uso sustentável e repartição de benefícios, New York Botanical Garden, New York, pp. 132-176.
Peters, H.A., 2003. Neighbour-regulated mortality: the influence of positive and negative density dependence on tree populations in species-rich tropical forests. Ecology Letters 6, 757-765.
Potvin, C., Dutilleul, P., 2009. Neighborhood effects and size-asymmetric competition in a tree plantation varying in diversity. Ecology 90, 321-327.
Prance, G.T., Mori, S.A., 1978. Observations on the fruits and seeds of neotropical Lecythidaceae. Brittonia 30, 21-33.
RADAM, 1978. Programa de Integração Nacional. Levantamentos de Recursos Naturais. Manaus. DNPM, Ministério das Minas e Energia. Brazil.
83
R-Development Core Team., 2005. R: A language and environment for statistical computing, reference index version 2.9.0. R Foundation for Statistical Computing. Vienna, Austria, Spatstat, <www.R-project.org>.
Regis, W.D.E., 1993. Unidades de Relêvo. in: Caldeiron, S. S., (Ed.). Recursos Naturais e Meio Ambiente: Uma visão do Brasil, Fundação Instituto Brasileiro de Geografia e Estatística-IBGE, Rio de Janeiro, Brasil, pp. 39-45.
Ribeiro, J.E.L.S., Nelson, B.W., Silva, M.F., Martins, L.S.S., Hopkins, M., 1994. Reserva florestal ducke- diversidade e composição da flora vascular. Acta Amazonica 24,19-30.
Schneider, M.K., Richard, L., Illian, J., 2006. Quantification of neighbourhood-dependent plant growth by Bayesian hierarchical modelling. Journal of Ecology 94, 310–321.
Smith, M., Grant, K., 1986. The role of competition in the spacing of trees in a Burkea Africana-Terminalia sericea Savana. Biotropica 18, 219-223.
Uriarte, M., Condit, R., Canham, C.D., Hubbell, S.P., 2004. A spatially explicit model of sapling growth in a tropical forest: does the identity of neighbours matter? Journal of Ecology 92, 348-360.
Vanclay, J.K., 1991. Research needs for sustained rainforest resources. in: Goudberg, N., Bonell, M., Benzaken, D., (Eds.). Tropical Rainforest Research in Australia. Institute of Tropical Rainforest Studies, James University, Townsville, Australia, pp.133-143.
Vogt, D.R., Murrell, D.J., Peter, S., 2010. Testing spatial theories of plant coexistence: No consistent differences in intra- and interspecific interaction distances. The American naturalist 175, 73-84.
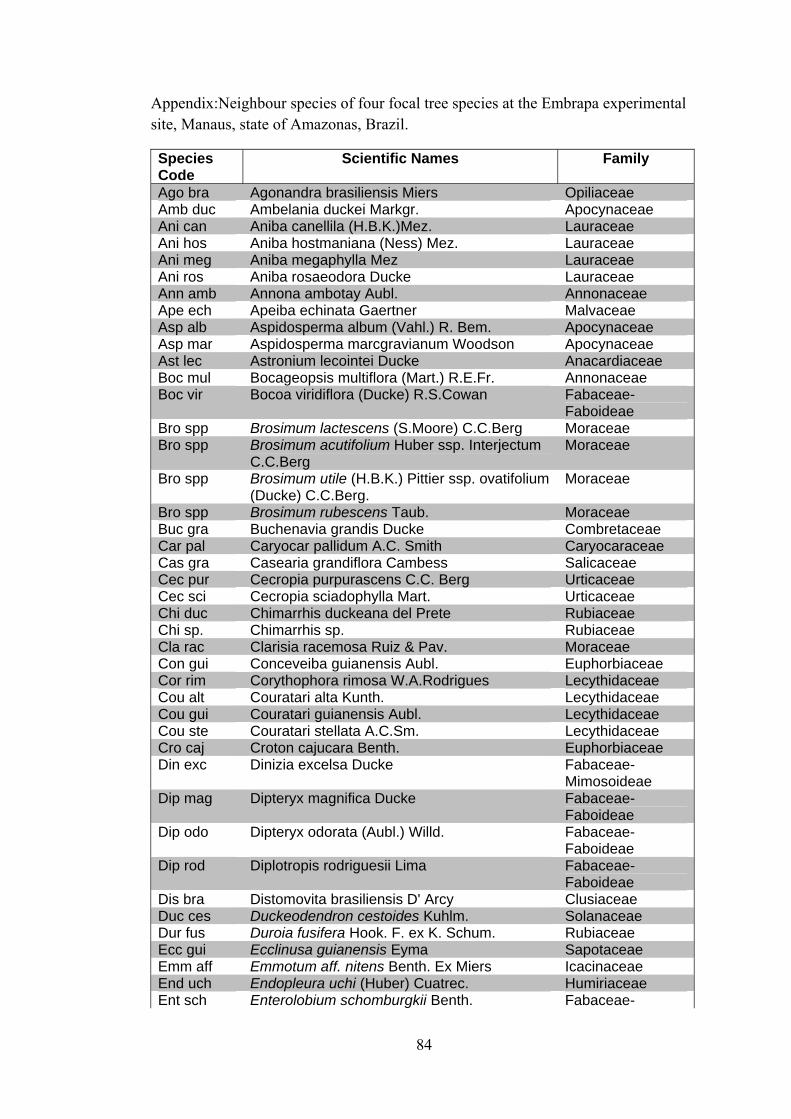
84
Appendix:Neighbour species of four focal tree species at the Embrapa experimental site, Manaus, state of Amazonas, Brazil.
Species Code
Scientific Names Family
Ago bra Agonandra brasiliensis Miers Opiliaceae Amb duc Ambelania duckei Markgr. Apocynaceae Ani can Aniba canellila (H.B.K.)Mez. Lauraceae Ani hos Aniba hostmaniana (Ness) Mez. Lauraceae Ani meg Aniba megaphylla Mez Lauraceae Ani ros Aniba rosaeodora Ducke Lauraceae Ann amb Annona ambotay Aubl. Annonaceae Ape ech Apeiba echinata Gaertner Malvaceae Asp alb Aspidosperma album (Vahl.) R. Bem. Apocynaceae Asp mar Aspidosperma marcgravianum Woodson Apocynaceae Ast lec Astronium lecointei Ducke Anacardiaceae Boc mul Bocageopsis multiflora (Mart.) R.E.Fr. Annonaceae Boc vir Bocoa viridiflora (Ducke) R.S.Cowan Fabaceae-
Faboideae Bro spp Brosimum lactescens (S.Moore) C.C.Berg Moraceae Bro spp Brosimum acutifolium Huber ssp. Interjectum
C.C.Berg Moraceae
Bro spp Brosimum utile (H.B.K.) Pittier ssp. ovatifolium (Ducke) C.C.Berg.
Moraceae
Bro spp Brosimum rubescens Taub. Moraceae Buc gra Buchenavia grandis Ducke Combretaceae Car pal Caryocar pallidum A.C. Smith Caryocaraceae Cas gra Casearia grandiflora Cambess Salicaceae Cec pur Cecropia purpurascens C.C. Berg Urticaceae Cec sci Cecropia sciadophylla Mart. Urticaceae Chi duc Chimarrhis duckeana del Prete Rubiaceae Chi sp. Chimarrhis sp. Rubiaceae Cla rac Clarisia racemosa Ruiz & Pav. Moraceae Con gui Conceveiba guianensis Aubl. Euphorbiaceae Cor rim Corythophora rimosa W.A.Rodrigues Lecythidaceae Cou alt Couratari alta Kunth. Lecythidaceae Cou gui Couratari guianensis Aubl. Lecythidaceae Cou ste Couratari stellata A.C.Sm. Lecythidaceae Cro caj Croton cajucara Benth. Euphorbiaceae Din exc Dinizia excelsa Ducke Fabaceae-
Mimosoideae Dip mag Dipteryx magnifica Ducke Fabaceae-
Faboideae Dip odo Dipteryx odorata (Aubl.) Willd. Fabaceae-
Faboideae Dip rod Diplotropis rodriguesii Lima Fabaceae-
Faboideae Dis bra Distomovita brasiliensis D' Arcy Clusiaceae Duc ces Duckeodendron cestoides Kuhlm. Solanaceae Dur fus Duroia fusifera Hook. F. ex K. Schum. Rubiaceae Ecc gui Ecclinusa guianensis Eyma Sapotaceae Emm aff Emmotum aff. nitens Benth. Ex Miers Icacinaceae End uch Endopleura uchi (Huber) Cuatrec. Humiriaceae Ent sch Enterolobium schomburgkii Benth. Fabaceae-
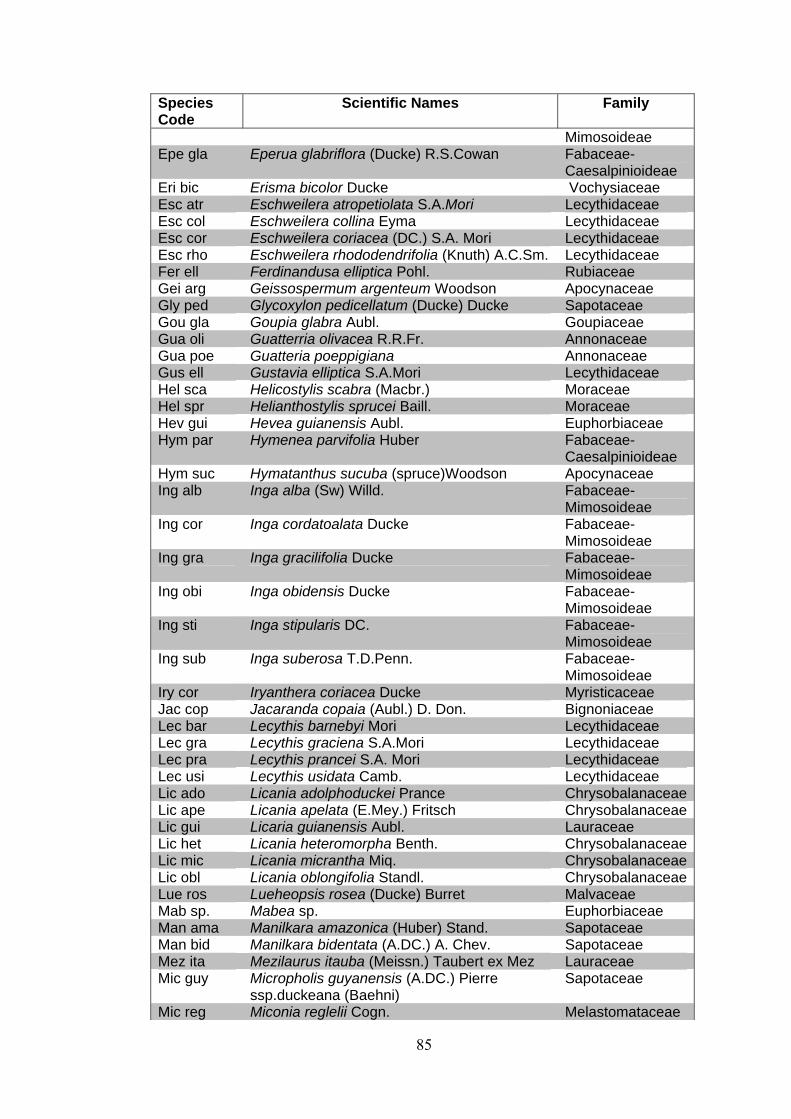
85
Species Code
Scientific Names Family
Mimosoideae Epe gla Eperua glabriflora (Ducke) R.S.Cowan Fabaceae-
Caesalpinioideae Eri bic Erisma bicolor Ducke Vochysiaceae Esc atr Eschweilera atropetiolata S.A.Mori Lecythidaceae Esc col Eschweilera collina Eyma Lecythidaceae Esc cor Eschweilera coriacea (DC.) S.A. Mori Lecythidaceae Esc rho Eschweilera rhododendrifolia (Knuth) A.C.Sm. Lecythidaceae Fer ell Ferdinandusa elliptica Pohl. Rubiaceae Gei arg Geissospermum argenteum Woodson Apocynaceae Gly ped Glycoxylon pedicellatum (Ducke) Ducke Sapotaceae Gou gla Goupia glabra Aubl. Goupiaceae Gua oli Guatterria olivacea R.R.Fr. Annonaceae Gua poe Guatteria poeppigiana Annonaceae Gus ell Gustavia elliptica S.A.Mori Lecythidaceae Hel sca Helicostylis scabra (Macbr.) Moraceae Hel spr Helianthostylis sprucei Baill. Moraceae Hev gui Hevea guianensis Aubl. Euphorbiaceae Hym par Hymenea parvifolia Huber Fabaceae-
Caesalpinioideae Hym suc Hymatanthus sucuba (spruce)Woodson Apocynaceae Ing alb Inga alba (Sw) Willd. Fabaceae-
Mimosoideae Ing cor Inga cordatoalata Ducke Fabaceae-
Mimosoideae Ing gra Inga gracilifolia Ducke Fabaceae-
Mimosoideae Ing obi Inga obidensis Ducke Fabaceae-
Mimosoideae Ing sti Inga stipularis DC. Fabaceae-
Mimosoideae Ing sub Inga suberosa T.D.Penn. Fabaceae-
Mimosoideae Iry cor Iryanthera coriacea Ducke Myristicaceae Jac cop Jacaranda copaia (Aubl.) D. Don. Bignoniaceae Lec bar Lecythis barnebyi Mori Lecythidaceae Lec gra Lecythis graciena S.A.Mori Lecythidaceae Lec pra Lecythis prancei S.A. Mori Lecythidaceae Lec usi Lecythis usidata Camb. Lecythidaceae Lic ado Licania adolphoduckei Prance ChrysobalanaceaeLic ape Licania apelata (E.Mey.) Fritsch ChrysobalanaceaeLic gui Licaria guianensis Aubl. Lauraceae Lic het Licania heteromorpha Benth. ChrysobalanaceaeLic mic Licania micrantha Miq. ChrysobalanaceaeLic obl Licania oblongifolia Standl. ChrysobalanaceaeLue ros Lueheopsis rosea (Ducke) Burret Malvaceae Mab sp. Mabea sp. Euphorbiaceae Man ama Manilkara amazonica (Huber) Stand. Sapotaceae Man bid Manilkara bidentata (A.DC.) A. Chev. Sapotaceae Mez ita Mezilaurus itauba (Meissn.) Taubert ex Mez Lauraceae Mic guy Micropholis guyanensis (A.DC.) Pierre
ssp.duckeana (Baehni) Sapotaceae
Mic reg Miconia reglelii Cogn. Melastomataceae
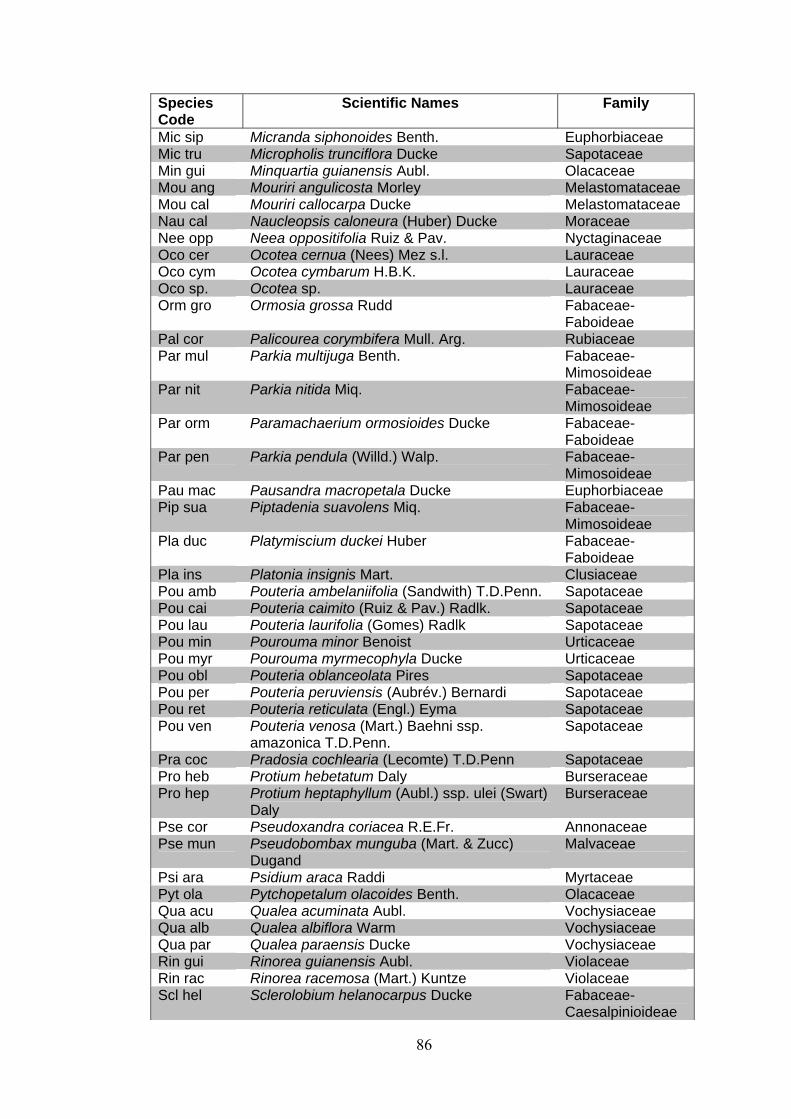
86
Species Code
Scientific Names Family
Mic sip Micranda siphonoides Benth. Euphorbiaceae Mic tru Micropholis trunciflora Ducke Sapotaceae Min gui Minquartia guianensis Aubl. Olacaceae Mou ang Mouriri angulicosta Morley Melastomataceae Mou cal Mouriri callocarpa Ducke Melastomataceae Nau cal Naucleopsis caloneura (Huber) Ducke Moraceae Nee opp Neea oppositifolia Ruiz & Pav. Nyctaginaceae Oco cer Ocotea cernua (Nees) Mez s.l. Lauraceae Oco cym Ocotea cymbarum H.B.K. Lauraceae Oco sp. Ocotea sp. Lauraceae Orm gro Ormosia grossa Rudd Fabaceae-
Faboideae Pal cor Palicourea corymbifera Mull. Arg. Rubiaceae Par mul Parkia multijuga Benth. Fabaceae-
Mimosoideae Par nit Parkia nitida Miq. Fabaceae-
Mimosoideae Par orm Paramachaerium ormosioides Ducke Fabaceae-
Faboideae Par pen Parkia pendula (Willd.) Walp. Fabaceae-
Mimosoideae Pau mac Pausandra macropetala Ducke Euphorbiaceae Pip sua Piptadenia suavolens Miq. Fabaceae-
Mimosoideae Pla duc Platymiscium duckei Huber Fabaceae-
Faboideae Pla ins Platonia insignis Mart. Clusiaceae Pou amb Pouteria ambelaniifolia (Sandwith) T.D.Penn. Sapotaceae Pou cai Pouteria caimito (Ruiz & Pav.) Radlk. Sapotaceae Pou lau Pouteria laurifolia (Gomes) Radlk Sapotaceae Pou min Pourouma minor Benoist Urticaceae Pou myr Pourouma myrmecophyla Ducke Urticaceae Pou obl Pouteria oblanceolata Pires Sapotaceae Pou per Pouteria peruviensis (Aubrév.) Bernardi Sapotaceae Pou ret Pouteria reticulata (Engl.) Eyma Sapotaceae Pou ven Pouteria venosa (Mart.) Baehni ssp.
amazonica T.D.Penn. Sapotaceae
Pra coc Pradosia cochlearia (Lecomte) T.D.Penn Sapotaceae Pro heb Protium hebetatum Daly Burseraceae Pro hep Protium heptaphyllum (Aubl.) ssp. ulei (Swart)
Daly Burseraceae
Pse cor Pseudoxandra coriacea R.E.Fr. Annonaceae Pse mun Pseudobombax munguba (Mart. & Zucc)
Dugand Malvaceae
Psi ara Psidium araca Raddi Myrtaceae Pyt ola Pytchopetalum olacoides Benth. Olacaceae Qua acu Qualea acuminata Aubl. Vochysiaceae Qua alb Qualea albiflora Warm Vochysiaceae Qua par Qualea paraensis Ducke Vochysiaceae Rin gui Rinorea guianensis Aubl. Violaceae Rin rac Rinorea racemosa (Mart.) Kuntze Violaceae Scl hel Sclerolobium helanocarpus Ducke Fabaceae-
Caesalpinioideae
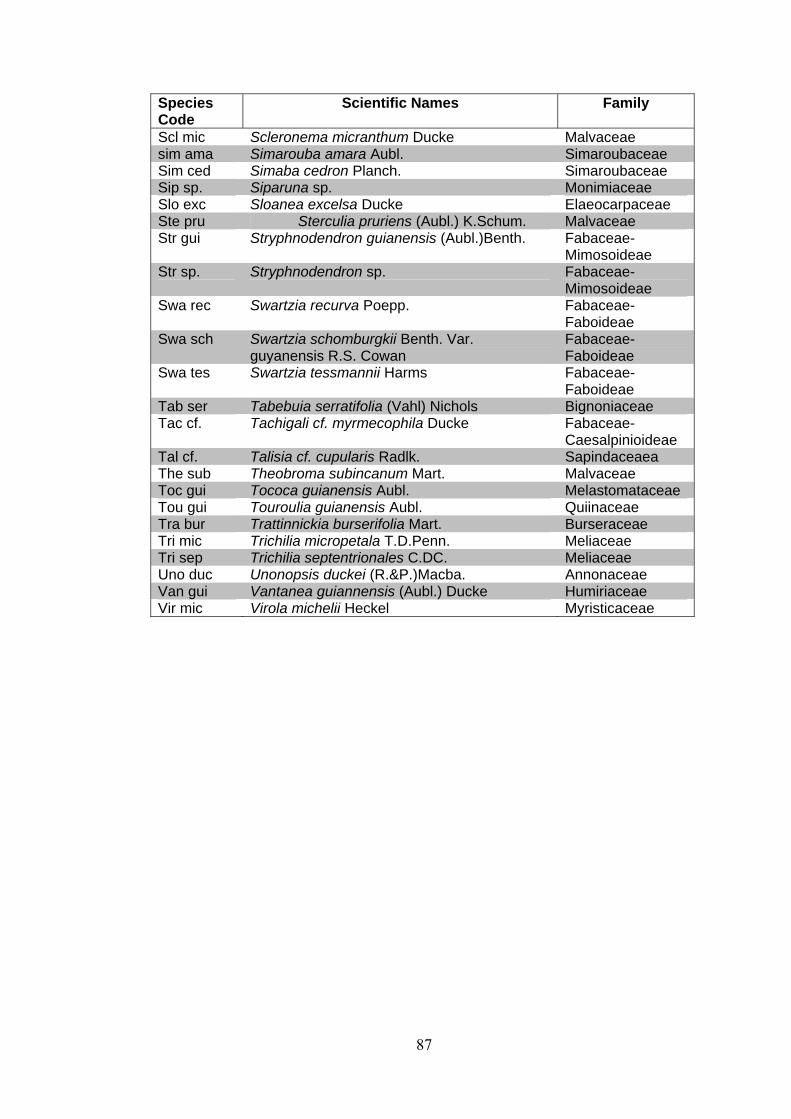
87
Species Code
Scientific Names Family
Scl mic Scleronema micranthum Ducke Malvaceae sim ama Simarouba amara Aubl. Simaroubaceae Sim ced Simaba cedron Planch. Simaroubaceae Sip sp. Siparuna sp. Monimiaceae Slo exc Sloanea excelsa Ducke Elaeocarpaceae Ste pru Sterculia pruriens (Aubl.) K.Schum. Malvaceae Str gui Stryphnodendron guianensis (Aubl.)Benth. Fabaceae-
Mimosoideae Str sp. Stryphnodendron sp. Fabaceae-
Mimosoideae Swa rec Swartzia recurva Poepp. Fabaceae-
Faboideae Swa sch Swartzia schomburgkii Benth. Var.
guyanensis R.S. Cowan Fabaceae-Faboideae
Swa tes Swartzia tessmannii Harms Fabaceae-Faboideae
Tab ser Tabebuia serratifolia (Vahl) Nichols Bignoniaceae Tac cf. Tachigali cf. myrmecophila Ducke Fabaceae-
Caesalpinioideae Tal cf. Talisia cf. cupularis Radlk. Sapindaceaea The sub Theobroma subincanum Mart. Malvaceae Toc gui Tococa guianensis Aubl. Melastomataceae Tou gui Touroulia guianensis Aubl. Quiinaceae Tra bur Trattinnickia burserifolia Mart. Burseraceae Tri mic Trichilia micropetala T.D.Penn. Meliaceae Tri sep Trichilia septentrionales C.DC. Meliaceae Uno duc Unonopsis duckei (R.&P.)Macba. Annonaceae Van gui Vantanea guiannensis (Aubl.) Ducke Humiriaceae Vir mic Virola michelii Heckel Myristicaceae
88
CONCLUSÕES GERAIS
A complexidade das interações bióticas e abióticas que ocorrem nas
comunidades vegetais da Amazônia, ressalta a importância de se ampliar os
conhecimentos acerca destas interações, visando subsidiar, ações de restauração,
manejo florestal e conservação de espécies tropicais. Neste contexto, esta tese traz
importantes contribuições para o conhecimento da composição florística e estrutura
das espécies arbóreas da floresta densa de terra firme na Amazônia, a partir da
análise de um conjunto de 15 hectares de parcelas permanentes, as quais
contemplaram diferentes variações ambientais na área de estudo. Não se obervou
predomínio de uma espécie sobre as demais, apesar das espécies Protium hebetatum
e Eschweilera coriaceae terem apresentado os maiores valores de IVI(%). A
ocorrência de um grande número de espécies raras chama a atenção, principalmente
para as ações de exploração florestal em áreas com semelhantes caracterísitcas a do
presente estudo, a fim de que se evitem extinções locais de espécies.
Observou-se que as variações na composição florística, em escala local,
seguem os padrões observados em outros estudos em escalas regionais e
continentais, em um gradiente de fertilidade e textura que variam no sentido leste-
oeste. As espécies mostraram um nível de organização espacial que foi evidenciado a
partir de uma ordenação das mesmas segundo um gradiente edáfico e topográfico,
que somente começaram a ser visualizados em unidades de amostras de tamanho
igual a 1.0 ha, sendo mais evidente no tamanho amostral de 1.4 ha, o que mostra a
importância do tamanho adequado de unidades amostrais para estudos que objetivam
avaliar processos resultantes do efeito de fatores abióticos e bióticos estruturando
comunidades vegetais.
A análise de vizinhança de espécies de interesse comercial contribuiu para uma
maior compreensão das interações que ocorrem na comunidade do ponto de vista dos
indivíduos das espécies focais. Observou-se que há um padrão taxonômico associado
às espécies estudadas, principalmente relacionado à ocorrência de conspecíficos a
curtas distâncias dos indivíduos focais e também de espécies raras, os quais merecem
atenção especial nas ações de manejo de espécies de interesse, as quais devem
atentar para a redução de danos a indivíduos da espécie de interesse, bem como a

89
espécies raras, procurando-se manter e/ou restaurar a estrutura da floresta e
consequentemente preservar as funções ecológicas das espécies.
A oportunidade de se trabalhar um conjunto maior de dados e o uso de métodos
de análise muitivariada e análise espacial permitiram uma compreensão muito maior
da área de estudo e das possíveis interações entre as espécies, os quais certamente
contribuirão para o avanço no conhecimento ecológico das florestas tropicais e para
o manejo, conservação e restauração das florestas de terra firme na Amazônia.