Embed Size (px)
Citation preview
Network Traversal as an Aid to Plot Analysis and Composition
Edirlei Soares de Lima 1 *
Vinicius M. Gottin 2 Bruno Feijó
2 Antonio L. Furtado
2
Rio de Janeiro State University (UERJ), Department of Computational Modeling, Brazil
1
Pontifical Catholic University of Rio de Janeiro (PUC-RIO), Department of Informatics, Rio de Janeiro, RJ, Brazil 2
ABSTRACT
Narrative and storytelling have become central issues in the new generation of video games. In this paper, we propose a modelling strategy to combine a chosen repertoire of story variants of the same narrative pattern into a network structure. We follow a Computational Narratology orientation and aim at two complementary objectives: (1) the analysis of narrative sub-genres extracted from literary genres; and (2) the interactive composition of new narratives by non-professional writers. We found convenient to partition the network according to the episodes of the narrative, thus allowing to generate summary networks, which are useful to analyse and identify narrative patterns. We developed a prototype tool and applied it to a set of four radically distinct variants of the popular Little Red Riding Hood folktale. The proposed method is of much interest towards the composition of stories in Interactive Storytelling systems, as well as an authoring asset for the construction of game narratives.
Keywords: computational narratology, plot analysis, interactive plot composition, narrative genre, folktale types.
1 INTRODUCTION
In the early days of the video game industry, narrative was not considered the most important element of a successful game. Nowadays, people start appreciating narrative-driven games and the industry is trying to find ways of building and shaping a story along with the player. However, games are far from mastering the rules of narrative as found in the literature, film and television.
The present work aims, as a preliminary objective, at the analysis of operationally-defined narrative sub-genres extracted from literary genres that obey some fixed set of conventions, and next, on the basis of this analysis, at the interactive composition of new narratives by non-professional writers. To pursue these two complementary goals, we shall introduce along this paper a modelling strategy, which involves representing the intended sub-genre by combining a chosen repertoire of distinct versions (variants) of the same narrative pattern into a network structure.
Our work, following a computational narratology orientation [7], was very much influenced by widely-known literary studies. The first is due to Mieke Bal, who distinguished in her book [2] three layers in the process of narrative composition – fabula, story and text. Here we shall focus on the fabula layer, at which what occurs in the true or fictional world of the narrative is expressed by events and plots (understood as sequences of events) characteristic of the given genre.
Secondly, our way to conceptually specify events was inspired on Propp’s seminal proposal [28], according to whom the events that can happen in a Russian folktale are limited to those produced by 31 “functions”. We soon realized that these folktale-oriented functions (or, in general, the functions appropriate to model other genres equally subject to strict conventions) could be cast into the form of logical terms – which we chose to treat as event-
producing operations [9]. We also found that, by defining such operations in terms of their pre-conditions and post-conditions (in consonance with the STRIPS method [13]), one is able to derive the partial-order requirements that well-formed narrative plots pertaining to the chosen genre must obey. Approaching plot-
generation as a plan-generation problem, as we did quite early [10], brings to mind an important aspect of plots: the fact that the required ordering is only partial, plus the fact that more than one operation may have the same main effects, introduce the possibility of finding a variety of different plots (by causing the plan-generation algorithm to backtrack) that lead from a given initial narrative world state to some target state.
Thirdly, an ample illustration of this variety is provided by
another proposal to characterize folktale types, namely the Aarne-Thompson Index, in the original and second versions [1][35], or Aarne-Thompson-Uther Index for the third and broader revision [36] (henceforward simply Index). A tale type presents one or more major actions in the story, which we call episodes. Also, a tale type may have one or more motifs, which are basic elements or details (e.g. a magic object, an ordinary object, a character, an attribute, or a striking occurrence) that distinguishes it from other
tales. Each type corresponds to a basic narrative pattern, which matches innumerable folktales composed along the centuries in different regions of the world. Folktales classified under a given type are called variants. The target state to be reached as the narrative concludes does not have to be exactly the same in all variants of a type, a usually small set of possible outcomes being contemplated as compatible with the type.
The Index describes a large collection of folktale types, such as type AT 333
1 – The Glutton, which comprises what is widely
known as the tale of Little Red Riding Hood (henceforward LRRH), on which we shall concentrate in this paper. Looking at the Index [1, p. 125], one will get the impression that the authors have only considered the brothers Grimm classic variant [15] to define type AT 333. Indeed, from the two episodes that they identify – Wolf’s Feast and Rescue – only the former is present in Perrault’s no less famous variant [27], whose outcome is consequently very much far from a “happy ending”.
The thrust of this paper is to show that, if one wishes to consider more than one variant when defining a type, such linear patterns are not adequate, and that a far better strategy is to combine a chosen set of variants into a network-structured pattern, where alternative sequences of events can be clearly exposed. Over the network, the consequent operationally-defined sub-genre can be appropriately analyzed, and new variants can be obtained by traversing still untried paths consisting of nodes
originating from different variants. To illustrate our approach we chose, after a brief survey of the
literature related to type AT 333 [15][27][11][5][26][34][19][20], four strikingly divergent variants, which tell the little girl’s story
1 AT 333 designates Aarne and Thompson’s original classification [1], now often written ATU 333 to reflect Uther’s revision [36]. *e-mail: [email protected]
with quite different outcomes. Utilizing logic programming (SWI-Prolog), we developed a prototype to examine in practice the problems entailed by constructing a network pattern and by generating novel variants, especially the need to impose constraints, inherent in blending processes as pointed out by
Fauconnier and Turner [12]. Motivated by the growing interest of the game industry on new ways of creating and telling stories [32], the prototype application was designed to work as an authoring tool to assist professional and non-professional writers to compose narrative variants interactively.
The rest of this paper is structured as follows. Section 2 describes the general methods employed to build the networks and to compose new plots. Sections 3 and 4 concern the specific
features of the LRRH example application, section 3 being dedicated to construction and analysis, and section 4 to plot composition. Section 5 presents the architecture of our prototype application and deals with the visual, voice, and template-based textual language generation techniques employed for drawing the network during the plot composition, and used to dramatize the generated stories. Section 6 presents the results of a user evaluation test. Section 7 surveys related work. Section 8 contains
some concluding remarks.
2 COMBINING EVENT SEQUENCES INTO NETWORKS
Given an application domain (folktales, plots in adventure games, or event sequences extracted from a corporate database log), we shall focus on some of the classes of events that may occur in the domain. Event sequences [e1, e2, …, em] pertaining to the chosen domain are time-ordered sets of terms of the form ei(p
i1, p
i2, …,
pin), where each ei denotes one such class of events, and the values
of the pij parameters serve to characterize different instances of the
class. Thus, in a folktale domain, an example of event sequence may be:
[ask_to_take('Mother', 'Little Red Riding Hood',
'cake and butter', 'Grandmother'), go('Little Red
Riding Hood', 'the woods'), meet('Little Red
Riding Hood', 'Wolf'))]
involving three classes of events: ask_to_take, go, and meet. Here, we shall be concerned with different event sequences that
represent entire versions of the same basic story – the so-called
story variants – classified under a folktale type. Starting from section 3, we shall illustrate our network approach by specifically applying it to type AT 333 of the Aarne-Thompson Index [1], which covers the Little Red Riding Hood (LRRH) time-honoured and universally popular tale.
A first visual comparison of any set of variants is often enough to notice sub-sequences that look similar, as well as sub-sequences that converge or diverge at some point. The main claim
of our paper is that sub-sequence similarities, convergences and divergences can best be characterized by combining the variants into a network structure. Similar sub-sequences can be unified, after suitable adaptation. In turn, employing activity diagrams terminology [6], divergences and convergences can be represented, respectively, by way of fork and join nodes. Also, the network connectivity properties promptly suggest the possibility of finding new event sequences, by traversing edges originating
from two or more variants. To combine variants of widely different time period, nationality
and narrative style, the first step is to apply generalization to map similar sub-sequences into some standard format. This preliminary adjustment may involve the name of the events, as well as the names of characters, places and objects that constitute their parameters. Event instances of the same name but different
values for some parameters, such as ingest(Floriel,
pancakes) and ingest(Floriel, bread), can be made
identical, if desirable, either by replacing pancakes and bread by a constant that subsumes them both (e.g. by denoting a species
of which pancakes and bread are sub-species, such as food), or by a variable, or simply by omitting the conflicting parameters
and writing ingest(Floriel). The proposed network is modeled as a directed, connected,
labeled graph G = (N,E,α), where N is a finite set of nodes, E N
N is a finite set of edges, α:N N is a node labeling mapping,
and N is a set of node labels, such that a node is associated to an
event ei(pi1, p
i2, …, pi
n). Sometimes we use ei only (i.e. with no parameters) as the node label for the sake of simplicity.
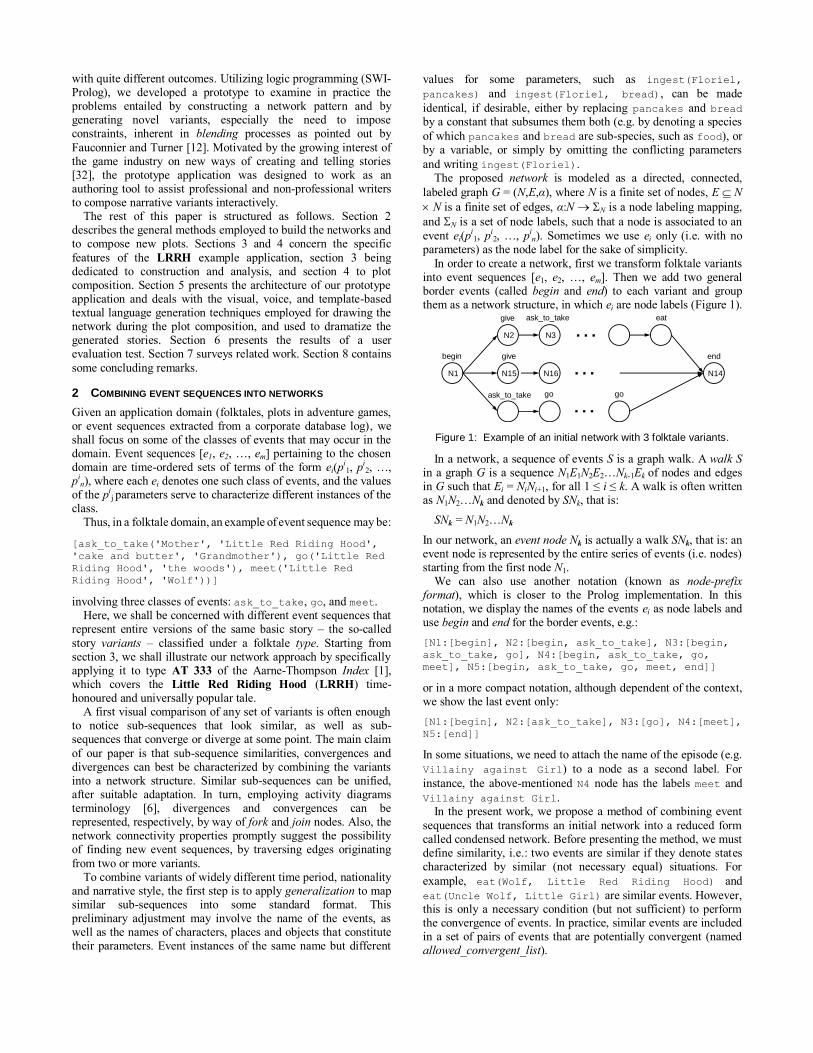
In order to create a network, first we transform folktale variants into event sequences [e1, e2, …, em]. Then we add two general border events (called begin and end) to each variant and group them as a network structure, in which ei are node labels (Figure 1).
N1 N15
N2
N16
N3
N14
…
…
…
begin end
give ask_to_take eat
give
ask_to_take go go
Figure 1: Example of an initial network with 3 folktale variants.
In a network, a sequence of events S is a graph walk. A walk S in a graph G is a sequence N1E1N2E2…Nk-1Ek of nodes and edges in G such that Ei = NiNi+1, for all 1 ≤ i ≤ k. A walk is often written as N1N2…Nk and denoted by SNk, that is:
SNk = N1N2…Nk
In our network, an event node Nk is actually a walk SNk, that is: an event node is represented by the entire series of events (i.e. nodes) starting from the first node N1.
We can also use another notation (known as node-prefix format), which is closer to the Prolog implementation. In this notation, we display the names of the events ei as node labels and use begin and end for the border events, e.g.:
[N1:[begin], N2:[begin, ask_to_take], N3:[begin,
ask_to_take, go], N4:[begin, ask_to_take, go,
meet], N5:[begin, ask_to_take, go, meet, end]]
or in a more compact notation, although dependent of the context, we show the last event only:
[N1:[begin], N2:[ask_to_take], N3:[go], N4:[meet],
N5:[end]]
In some situations, we need to attach the name of the episode (e.g.
Villainy against Girl) to a node as a second label. For
instance, the above-mentioned N4 node has the labels meet and
Villainy against Girl. In the present work, we propose a method of combining event
sequences that transforms an initial network into a reduced form called condensed network. Before presenting the method, we must define similarity, i.e.: two events are similar if they denote states characterized by similar (not necessary equal) situations. For
example, eat(Wolf, Little Red Riding Hood) and
eat(Uncle Wolf, Little Girl) are similar events. However, this is only a necessary condition (but not sufficient) to perform the convergence of events. In practice, similar events are included in a set of pairs of events that are potentially convergent (named allowed_convergent_list).
The proposed method applies two basic cases of condensation repetitively, one by equality and another by similarity:
Let ei and ej denote the last events of the walks S1Ni and S2Nj , and ei+1 and ej+1 denote the last events of the next nodes (Figure 2), that is:
ei = last(S1Ni) ej = last(S2Nj)
and
ei+1 = last(S1Ni+1)
ej+1 = last(S2Nj+1)
then, Ni and Nj are unified if
Fusion Case (by equality): ei = ej; or
Condensation Case (by similarity): (a) (ei, ej) allowed_convergent_list, i.e. ei and ei
are similar events
and
(b) ei+1 = ej+1 or (ei+1, ej+1) allowed_convergent _list, i.e. the sequences S1Ni and S2Nj lead to the
same event or to similar events.
In the condensation case, the condensed node keeps both labels ei and ej, and their respective walks S1 and S2.
begin
end
begin
end
Figure 2: Given two event sequences S1 and S2, Ni and Nj can be
unified if ei and ei are similar events followed by another pair of
similar events ei+1 and ej+1.
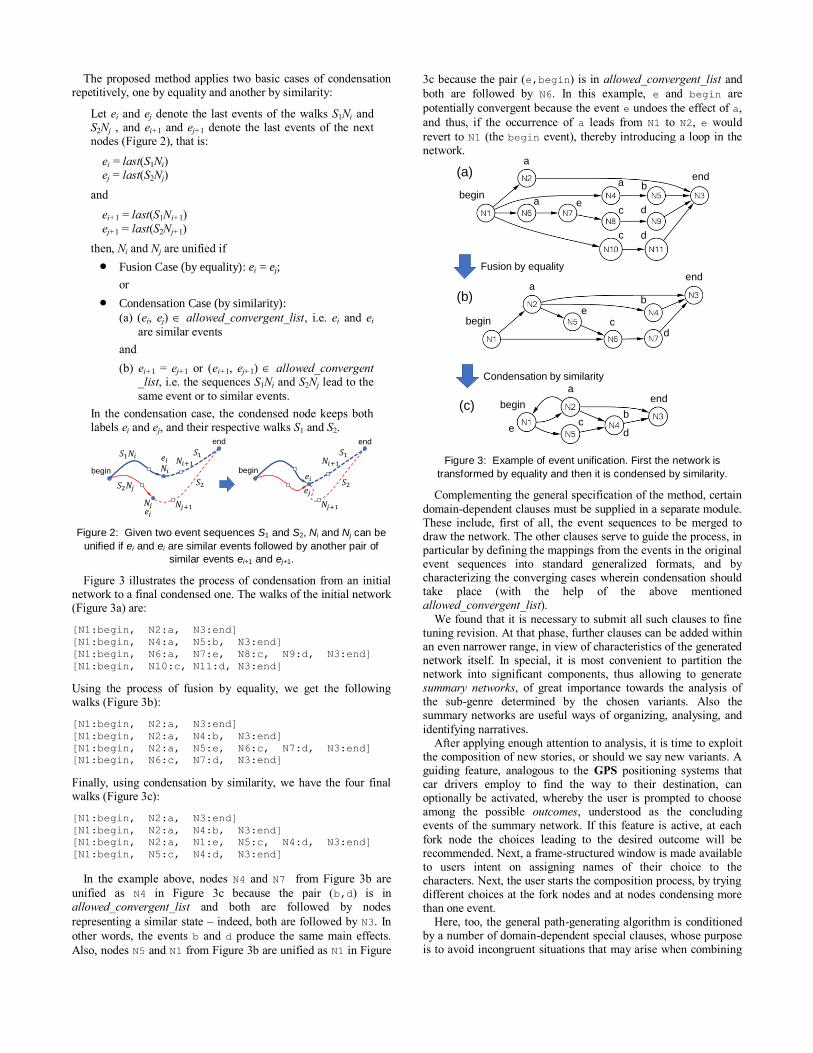
Figure 3 illustrates the process of condensation from an initial network to a final condensed one. The walks of the initial network (Figure 3a) are:
[N1:begin, N2:a, N3:end]
[N1:begin, N4:a, N5:b, N3:end]
[N1:begin, N6:a, N7:e, N8:c, N9:d, N3:end]
[N1:begin, N10:c, N11:d, N3:end]
Using the process of fusion by equality, we get the following walks (Figure 3b):
[N1:begin, N2:a, N3:end]
[N1:begin, N2:a, N4:b, N3:end]
[N1:begin, N2:a, N5:e, N6:c, N7:d, N3:end]
[N1:begin, N6:c, N7:d, N3:end]
Finally, using condensation by similarity, we have the four final walks (Figure 3c):
[N1:begin, N2:a, N3:end]
[N1:begin, N2:a, N4:b, N3:end]
[N1:begin, N2:a, N1:e, N5:c, N4:d, N3:end]
[N1:begin, N5:c, N4:d, N3:end]
In the example above, nodes N4 and N7 from Figure 3b are
unified as N4 in Figure 3c because the pair (b,d) is in allowed_convergent_list and both are followed by nodes
representing a similar state – indeed, both are followed by N3. In
other words, the events b and d produce the same main effects.
Also, nodes N5 and N1 from Figure 3b are unified as N1 in Figure
3c because the pair (e,begin) is in allowed_convergent_list and
both are followed by N6. In this example, e and begin are
potentially convergent because the event e undoes the effect of a,
and thus, if the occurrence of a leads from N1 to N2, e would
revert to N1 (the begin event), thereby introducing a loop in the network.
a
a
a b
d
d
c
c
e
a
be
cd
begin
end
begin
begin
end
enda
ce
b
d
Fusion by equality
Condensation by similarity
(a)
(b)
(c)
Figure 3: Example of event unification. First the network is
transformed by equality and then it is condensed by similarity.
Complementing the general specification of the method, certain
domain-dependent clauses must be supplied in a separate module. These include, first of all, the event sequences to be merged to draw the network. The other clauses serve to guide the process, in particular by defining the mappings from the events in the original event sequences into standard generalized formats, and by characterizing the converging cases wherein condensation should take place (with the help of the above mentioned allowed_convergent_list).
We found that it is necessary to submit all such clauses to fine tuning revision. At that phase, further clauses can be added within an even narrower range, in view of characteristics of the generated network itself. In special, it is most convenient to partition the network into significant components, thus allowing to generate summary networks, of great importance towards the analysis of the sub-genre determined by the chosen variants. Also the summary networks are useful ways of organizing, analysing, and
identifying narratives. After applying enough attention to analysis, it is time to exploit
the composition of new stories, or should we say new variants. A guiding feature, analogous to the GPS positioning systems that car drivers employ to find the way to their destination, can optionally be activated, whereby the user is prompted to choose among the possible outcomes, understood as the concluding events of the summary network. If this feature is active, at each
fork node the choices leading to the desired outcome will be recommended. Next, a frame-structured window is made available to users intent on assigning names of their choice to the characters. Next, the user starts the composition process, by trying different choices at the fork nodes and at nodes condensing more than one event.
Here, too, the general path-generating algorithm is conditioned by a number of domain-dependent special clauses, whose purpose is to avoid incongruent situations that may arise when combining
sequences taken from different variants. These clauses (as will be illustrated through examples in section 4) limit the choices offered to users at fork or condensed nodes and, if only one option remains, the user is not called to intervene and the generation proceeds without interruption. Any faulty nodes encountered
during the application of these clauses are marked as excluded from the generated story.
The reason why such conflicts may occur is that similarity in terms of main effects of events does not mean that secondary effects also fully coincide – hence adaptations need to be done. For the necessity to accommodate potentially conflicting elements, see how the subject of blending is creatively exploited by Fauconnier and Turner [12].
A simple numerical evaluation, to assess to what extent a network enables the composition of a diversity of stories, provides a later phase of analysis. As shown in section 4, this is easily done by elementary graph traversal and counting algorithms, which consider both the network resulting from a combination of variants and the associated summary network.
3 ANALYZING AN LRRH SET OF VARIANTS
Here we shall deal with four variants of the very popular folktale broadly known as Little Red Riding Hood (LRRH for short). In Aarne-Thompson’s Index, the story is classified under type AT
333, characteristically named The Glutton, and is described approximately as follows, noting that the plot comprises two major episodes [1]:
- The wolf or other monster devours human beings until
all of them are rescued alive from his belly. I. Wolf's Feast. By masking as mother or grandmother the wolf deceives and devours a little girl whom he meets on his way to her grandmother's. II. Rescue. The wolf is cut open and his victims rescued alive; his belly is sewed full of stones and he drowns, or he jumps to his death.
The first variant that we chose is the classic Le Petit Chaperon Rouge (Little Red Riding Hood), composed in France in 1697 by Charles Perrault [33], during the reign of Louis XIVth. It consists of the first episode alone, so that there is no happy ending, contrary to what children normally expect from nursery fairy
tales. The little girl, going through the woods to see her grandmother, is accosted by the wolf who reaches the grandmother's house ahead of her. The wolf kills the grandmother and takes her place in bed. When the girl arrives, she is astonished at the "grandmother"'s large, ears, large eyes, etc., until she finally asks about the long teeth, whereat the wolf gobbles her up.
The second, perhaps even more influential classic variant, is that of the brothers Grimm (Jacob and Wilhelm), written in German and entitled Rotkäppchen (Little Red Cap) [15], first
published in 1812. It encompasses the two episodes. Rescue is effected by a hunter, who finds the wolf sleeping and cuts his belly, allowing the girl and her grandmother to escape. The wolf has his belly filled with heavy stones fetched by the girl, wakes up, tries to run away and falls dead, unable to carry the weight.
Whilst in the classic variants considered so far the girl is presented as naive, in contrast to the clever villain, the situation is reversed in the Conte de la Mère-grand (The Story of
Grandmother), collected by folklorist Achille Millien in the French province of Nivernais, circa 1870, and later published by Paul Delarue [17]. In this variant, which some scholars believe to be closer to the primitive oral tradition, the villain is a "bzou", a werewolf. After killing and partly devouring the grandmother's
body, he stores some of her flesh and fills a bottle with her blood. When the girl comes in, he directs her to eat and drink from these ghastly remains. Then he tells her to undress and lie down on the bed. Whenever the girl asks where to put each piece of clothing, the answer is always: "Throw it in the fire, my child; you don't
need it anymore." In the ensuing dialogue about the peculiar physical attributes of the fake grandmother, when the question about her "big mouth" is asked the Bzou gives the conventional reply: "All the better to eat you with, my child!" – but this time the action does not immediately follow the words. What happens instead is that the girl asks permission to go out to relieve herself, which is a ruse whereby she ends up outsmarting the villain and safely going back to her mother’s home.
The deviations from the type paradigm apparent in certain texts can be even more extreme. Can the Uncle Wolf story [5], for instance, collected by Italo Calvino, still be classified as a variant of type AT 333: The Glutton? The trouble is that here the girl is the first to reveal herself as "glutton". She does not resist the temptation to eat and drink all that her mother was sending to Uncle Wolf in return for the loan of a skillet, offering him instead an ugly mess composed of donkey manure, dirty water and lime.
He is not deceived and threatens her: "Tonight I'm coming to eat you!" He sneaks into the house, repeatedly announcing where he is at each moment until reaching the girl's room and eating her, in a frightening ghost-like sequence indicative of type AT 366: The
Man from the Gallows. However we felt justified to include this story as a fourth, somewhat transgressive, variant of the type on hand, since Italo Calvino himself affirms: ‘This extremely simple type – and I followed one of the richest versions – will lead to the
perfect grace of “Little Red Riding Hood”’[5, pp. 725-6]. Several event-mapping rules are applied to allow the
generalization process that will result in the network structure. For example, the different gifts that the girl brings to her grandmother at her mother’s behest, “cake and butter” in Perrault and “cake and wine” in Grimm, are replaced by “food” in both the
ask_to_take and the deliver events. The girl herself is differently called “Little Red Riding Hood”, “Little Red Cap”, and “Little Girl” – since no real difference is implied by this
diversity of names, we chose the last name to designate her in all events. By contrast, we preserved the three surely distinct characterizations of the villain, as “Wolf”, “Bzou”, and “Uncle
Wolf”. The go(X,Y) event, which in general should specify both the agent X and the place Y, is renamed and reduced to a single
parameter, enter(X) when the agent X is the “Hunter”, so that this character will be able to succour the victims no matter where the villain has attacked them. For convenience (cf. the next
paragraph), the event deliver is renamed deliver_false, whenever performed with a misleading purpose.
Among the rules allowing condensation in a single node of
events with similar main effects, a typical example is the
recognition of the two events fool(X,Y) and
deliver_false(X,F,Y), where X is the victim, F is some
adulterated food or beverage, and Y is the villain, as alternative tactics employed by the victim to deceive the villain.
Starting to analyze the resulting network (shown in section 5, at the bottom partition of Figure 6), we found that it comprised more than just the two well-known episodes (‘Wolf’s Feast’ and ‘Rescue’) proposed by the Index, which, as we pointed out before, seems to have exclusively considered Grimm’s narrative. We detected 9 episodes, which we duly registered together with the
node labels corresponding to the events characterizing the sub-walks involved: 'Preparation', 'Villainy against Grandmother', 'Girl's gluttony', 'Girl as cannibal', 'Girl fools villain', 'Villainy against Girl', 'Girl suffers retaliation', 'Safe return home', 'Rescue'.
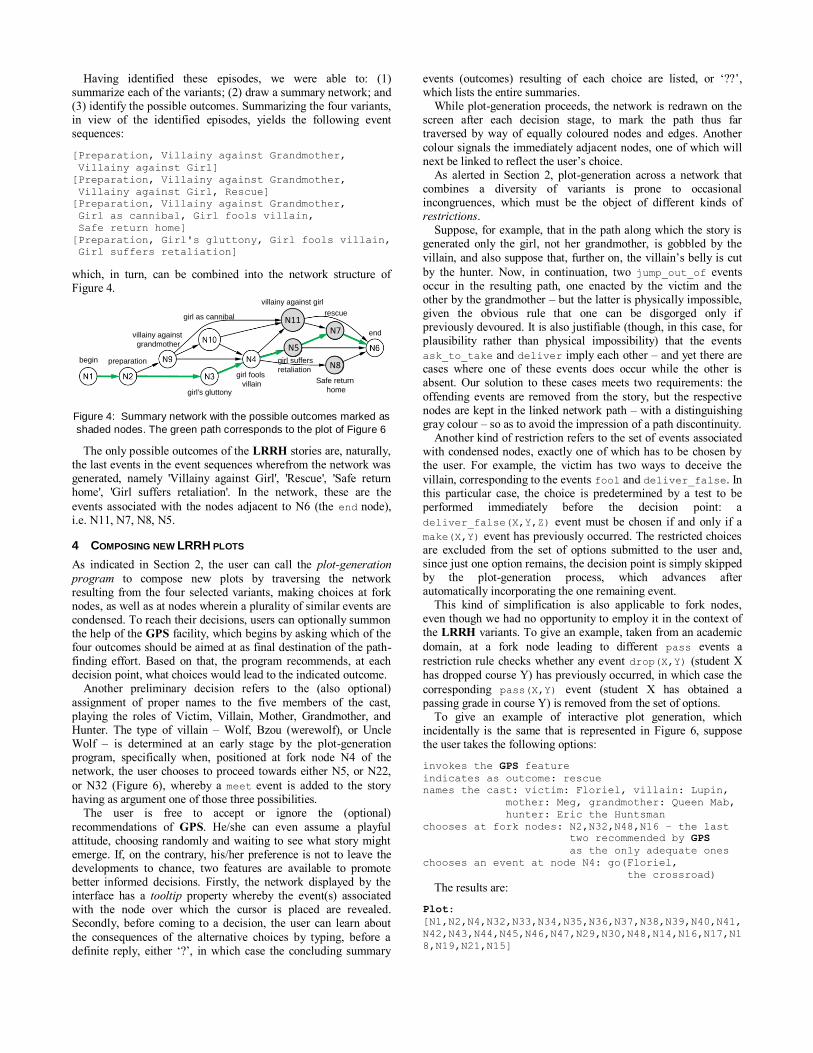
Having identified these episodes, we were able to: (1) summarize each of the variants; (2) draw a summary network; and (3) identify the possible outcomes. Summarizing the four variants, in view of the identified episodes, yields the following event sequences:
[Preparation, Villainy against Grandmother,
Villainy against Girl]
[Preparation, Villainy against Grandmother,
Villainy against Girl, Rescue]
[Preparation, Villainy against Grandmother,
Girl as cannibal, Girl fools villain,
Safe return home]
[Preparation, Girl's gluttony, Girl fools villain,
Girl suffers retaliation]
which, in turn, can be combined into the network structure of Figure 4.
begin
end
preparation
villainy against
grandmother
girl as cannibal
girl's gluttony
girl fools
villain
girl suffers
retaliation
rescue
Safe return
home
villainy against girl
N11N7
N8
N5
Figure 4: Summary network with the possible outcomes marked as
shaded nodes. The green path corresponds to the plot of Figure 6
The only possible outcomes of the LRRH stories are, naturally, the last events in the event sequences wherefrom the network was generated, namely 'Villainy against Girl', 'Rescue', 'Safe return home', 'Girl suffers retaliation'. In the network, these are the
events associated with the nodes adjacent to N6 (the end node), i.e. N11, N7, N8, N5.
4 COMPOSING NEW LRRH PLOTS
As indicated in Section 2, the user can call the plot-generation
program to compose new plots by traversing the network resulting from the four selected variants, making choices at fork nodes, as well as at nodes wherein a plurality of similar events are condensed. To reach their decisions, users can optionally summon the help of the GPS facility, which begins by asking which of the four outcomes should be aimed at as final destination of the path-finding effort. Based on that, the program recommends, at each decision point, what choices would lead to the indicated outcome.
Another preliminary decision refers to the (also optional)
assignment of proper names to the five members of the cast, playing the roles of Victim, Villain, Mother, Grandmother, and Hunter. The type of villain – Wolf, Bzou (werewolf), or Uncle Wolf – is determined at an early stage by the plot-generation program, specifically when, positioned at fork node N4 of the network, the user chooses to proceed towards either N5, or N22,
or N32 (Figure 6), whereby a meet event is added to the story having as argument one of those three possibilities.
The user is free to accept or ignore the (optional)
recommendations of GPS. He/she can even assume a playful attitude, choosing randomly and waiting to see what story might emerge. If, on the contrary, his/her preference is not to leave the developments to chance, two features are available to promote better informed decisions. Firstly, the network displayed by the interface has a tooltip property whereby the event(s) associated with the node over which the cursor is placed are revealed. Secondly, before coming to a decision, the user can learn about
the consequences of the alternative choices by typing, before a definite reply, either ‘?’, in which case the concluding summary
events (outcomes) resulting of each choice are listed, or ‘??’, which lists the entire summaries.
While plot-generation proceeds, the network is redrawn on the screen after each decision stage, to mark the path thus far traversed by way of equally coloured nodes and edges. Another
colour signals the immediately adjacent nodes, one of which will next be linked to reflect the user’s choice.
As alerted in Section 2, plot-generation across a network that combines a diversity of variants is prone to occasional incongruences, which must be the object of different kinds of restrictions.
Suppose, for example, that in the path along which the story is generated only the girl, not her grandmother, is gobbled by the
villain, and also suppose that, further on, the villain’s belly is cut
by the hunter. Now, in continuation, two jump_out_of events occur in the resulting path, one enacted by the victim and the other by the grandmother – but the latter is physically impossible, given the obvious rule that one can be disgorged only if previously devoured. It is also justifiable (though, in this case, for plausibility rather than physical impossibility) that the events
ask_to_take and deliver imply each other – and yet there are cases where one of these events does occur while the other is absent. Our solution to these cases meets two requirements: the
offending events are removed from the story, but the respective nodes are kept in the linked network path – with a distinguishing gray colour – so as to avoid the impression of a path discontinuity.
Another kind of restriction refers to the set of events associated with condensed nodes, exactly one of which has to be chosen by the user. For example, the victim has two ways to deceive the
villain, corresponding to the events fool and deliver_false. In this particular case, the choice is predetermined by a test to be performed immediately before the decision point: a
deliver_false(X,Y,Z) event must be chosen if and only if a
make(X,Y) event has previously occurred. The restricted choices are excluded from the set of options submitted to the user and, since just one option remains, the decision point is simply skipped by the plot-generation process, which advances after automatically incorporating the one remaining event.
This kind of simplification is also applicable to fork nodes, even though we had no opportunity to employ it in the context of the LRRH variants. To give an example, taken from an academic
domain, at a fork node leading to different pass events a
restriction rule checks whether any event drop(X,Y) (student X
has dropped course Y) has previously occurred, in which case the
corresponding pass(X,Y) event (student X has obtained a passing grade in course Y) is removed from the set of options.
To give an example of interactive plot generation, which incidentally is the same that is represented in Figure 6, suppose the user takes the following options:
invokes the GPS feature
indicates as outcome: rescue
names the cast: victim: Floriel, villain: Lupin,
mother: Meg, grandmother: Queen Mab,
hunter: Eric the Huntsman
chooses at fork nodes: N2,N32,N48,N16 – the last
two recommended by GPS
as the only adequate ones
chooses an event at node N4: go(Floriel,
the crossroad)
The results are:
Plot:
[N1,N2,N4,N32,N33,N34,N35,N36,N37,N38,N39,N40,N41,
N42,N43,N44,N45,N46,N47,N29,N30,N48,N14,N16,N17,N1
8,N19,N21,N15]
Events in the plot:
N1:begin
N2:give(Queen Mab,red covering,Floriel)
N4:go(Floriel,the crossroad)
N32:meet(Floriel,Lupin)
N33:ask(Floriel,skillet,Lupin)
N34:give(Lupin,skillet,Floriel)
N35:make(Meg,pancakes)
N36:ask_to_take(Meg,Floriel,pancakes,Lupin)
N37:ask_to_take(Meg,Floriel,bread,Lupin)
N38:ask_to_take(Meg,Floriel,wine,Lupin)
N39:ingest(Floriel,pancakes)
N40:ingest(Floriel,bread)
N41:ingest(Floriel,wine)
N42:make(Floriel,false pancakes)
N43:make(Floriel,false bread)
N44:make(Floriel,false wine)
N45:go(Floriel,Lupin's house)
N46:deliver_false(Floriel,false pancakes,Lupin)
N47:deliver_false(Floriel,false bread,Lupin)
N29:deliver_false(Floriel,false wine,Lupin)
N30:go(Floriel,Meg's house)
N48:go(Lupin,Meg's house)
N14:eat(Lupin,Floriel)
N16:sleep(Lupin)
N17:enter(Eric the Huntsman,Meg's house)
N18:cut(Eric the Huntsman,Lupin,axe)
N19:jump_out_of(Floriel,Lupin)
N21:die(Lupin)
N15:end
Remark: in the network shown at the bottom partition of the user interface (Figure 6), path nodes N3 and N20 are shown in gray, since, although they belong to the path traversed to generate the plot, they were excluded from the plot due to restrictions described in this section:
N3:ask_to_take(Meg,food,Quenn Mab)
N20:jump_out_of(Queen Mab,Lupin)
Additional information displayed:
*** The villain Lupin is of type Uncle Wolf
*** Summary (see green path in Figure 4):
[Preparation, Girl's gluttony, Girl fools villain,
Girl suffers retaliation, Rescue]
The total number of plots that can be thus generated is 243, but
this number should not be taken as an indicator of the variety of possibilities offered by the method. A better, more conservative indicator can be found by first applying the same simple path-traversing algorithm to the summary network to determine the number of different summaries, which turns out to be just 13, and then proceed to group the plots according to their summaries. The 13 different summaries and the number of plots that correspond to each of them, totaling 243 as anticipated, are listed below:
[Preparation, Girl's gluttony, Girl fools villain,
Girl suffers retaliation] - 9
[Preparation, Girl's gluttony, Girl fools villain,
Girl suffers retaliation, Rescue] - 9
[Preparation, Girl's gluttony, Girl fools villain,
Safe return home] - 9
[Preparation, Villainy against Grandmother, Girl
as cannibal, Girl fools villain, Safe return
home] - 18
[Preparation, Villainy against Grandmother, Girl
as cannibal, Girl fools villain, Villainy against
Girl] – 18
[Preparation, Villainy against Grandmother, Girl
as cannibal, Girl fools villain, Villainy against
Girl, Rescue] - 18
[Preparation, Villainy against Grandmother, Girl
as cannibal, Villainy against Girl] - 18
[Preparation, Villainy against Grandmother, Girl
as cannibal, Villainy against Girl, Rescue] - 18
[Preparation, Villainy against Grandmother, Girl
fools villain, Safe return home] - 18
[Preparation, Villainy against Grandmother, Girl
fools villain, Villainy against Girl] - 18
[Preparation, Villainy against Grandmother, Girl
fools villain, Villainy against Girl, Rescue] - 18
[Preparation, Villainy against Grandmother,
Villainy against Girl] - 36
[Preparation, Villainy against Grandmother,
Villainy against Girl, Rescue] - 36
One may additionally want to consider a grouping by different outcomes, which are 4 as explained at the end of section 3:
Girl suffers retaliation - 9
Rescue - 99
Safe return home - 45
Villainy against Girl - 90
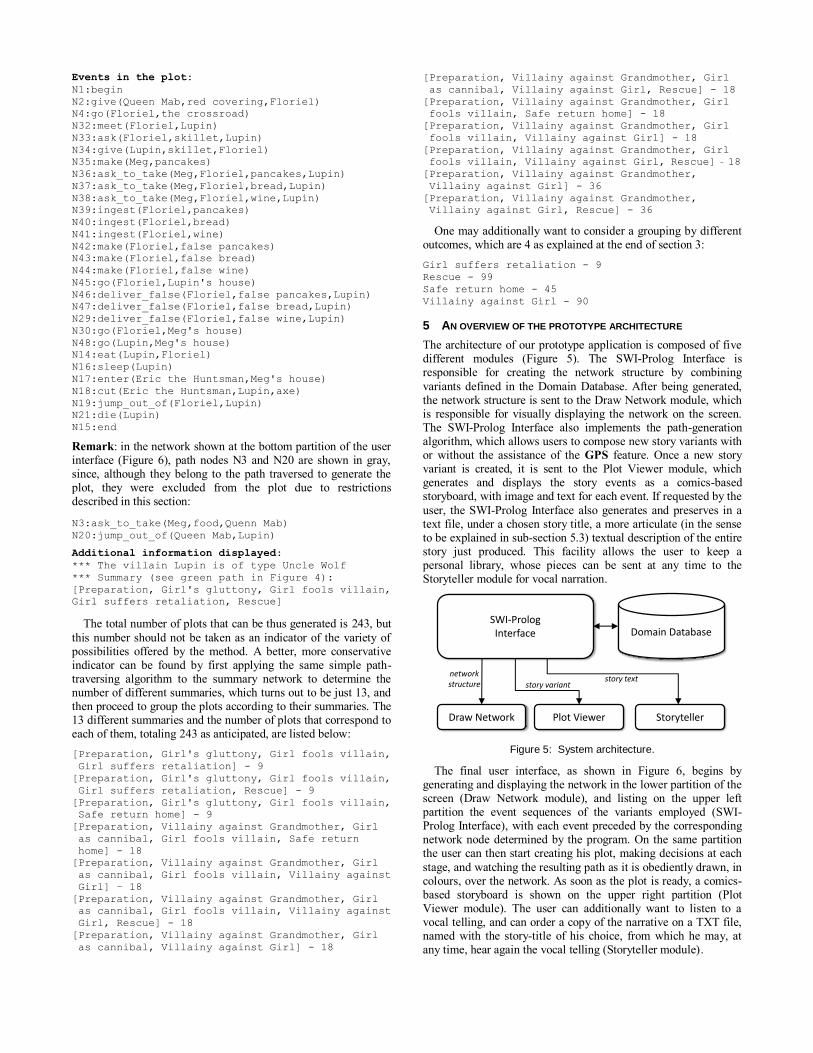
5 AN OVERVIEW OF THE PROTOTYPE ARCHITECTURE
The architecture of our prototype application is composed of five different modules (Figure 5). The SWI-Prolog Interface is responsible for creating the network structure by combining
variants defined in the Domain Database. After being generated, the network structure is sent to the Draw Network module, which is responsible for visually displaying the network on the screen. The SWI-Prolog Interface also implements the path-generation algorithm, which allows users to compose new story variants with or without the assistance of the GPS feature. Once a new story variant is created, it is sent to the Plot Viewer module, which generates and displays the story events as a comics-based storyboard, with image and text for each event. If requested by the
user, the SWI-Prolog Interface also generates and preserves in a text file, under a chosen story title, a more articulate (in the sense to be explained in sub-section 5.3) textual description of the entire story just produced. This facility allows the user to keep a personal library, whose pieces can be sent at any time to the Storyteller module for vocal narration.
Plot ViewerDraw Network Storyteller
SWI-Prolog Interface Domain Database
network structure story variant
story text
Figure 5: System architecture.
The final user interface, as shown in Figure 6, begins by generating and displaying the network in the lower partition of the screen (Draw Network module), and listing on the upper left partition the event sequences of the variants employed (SWI-Prolog Interface), with each event preceded by the corresponding network node determined by the program. On the same partition the user can then start creating his plot, making decisions at each
stage, and watching the resulting path as it is obediently drawn, in colours, over the network. As soon as the plot is ready, a comics-based storyboard is shown on the upper right partition (Plot Viewer module). The user can additionally want to listen to a vocal telling, and can order a copy of the narrative on a TXT file, named with the story-title of his choice, from which he may, at any time, hear again the vocal telling (Storyteller module).
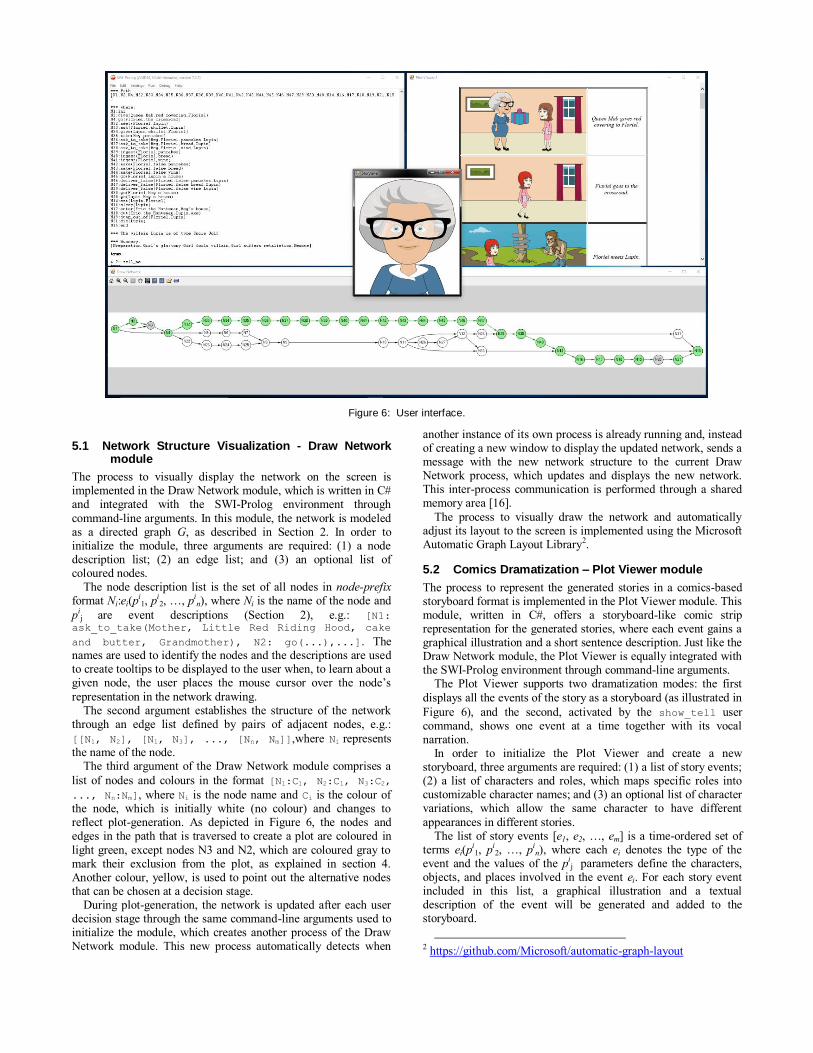
Figure 6: User interface.
5.1 Network Structure Visualization - Draw Network module
The process to visually display the network on the screen is implemented in the Draw Network module, which is written in C# and integrated with the SWI-Prolog environment through
command-line arguments. In this module, the network is modeled as a directed graph G, as described in Section 2. In order to initialize the module, three arguments are required: (1) a node description list; (2) an edge list; and (3) an optional list of coloured nodes.
The node description list is the set of all nodes in node-prefix format Ni:ei(p
i1, p
i2, …, pi
n), where Ni is the name of the node and
pij are event descriptions (Section 2), e.g.: [N1:
ask_to_take(Mother, Little Red Riding Hood, cake
and butter, Grandmother), N2: go(...),...]. The names are used to identify the nodes and the descriptions are used to create tooltips to be displayed to the user when, to learn about a given node, the user places the mouse cursor over the node’s
representation in the network drawing. The second argument establishes the structure of the network
through an edge list defined by pairs of adjacent nodes, e.g.:
[[N1, N2], [N1, N3], ..., [Nn, Nm]],where Ni represents the name of the node.
The third argument of the Draw Network module comprises a
list of nodes and colours in the format [N1:C1, N2:C1, N3:C2,
..., Nn:Nm], where Ni is the node name and Ci is the colour of the node, which is initially white (no colour) and changes to reflect plot-generation. As depicted in Figure 6, the nodes and edges in the path that is traversed to create a plot are coloured in
light green, except nodes N3 and N2, which are coloured gray to mark their exclusion from the plot, as explained in section 4. Another colour, yellow, is used to point out the alternative nodes that can be chosen at a decision stage.
During plot-generation, the network is updated after each user decision stage through the same command-line arguments used to initialize the module, which creates another process of the Draw Network module. This new process automatically detects when
another instance of its own process is already running and, instead of creating a new window to display the updated network, sends a message with the new network structure to the current Draw Network process, which updates and displays the new network. This inter-process communication is performed through a shared memory area [16].
The process to visually draw the network and automatically adjust its layout to the screen is implemented using the Microsoft Automatic Graph Layout Library2.
5.2 Comics Dramatization – Plot Viewer module
The process to represent the generated stories in a comics-based storyboard format is implemented in the Plot Viewer module. This module, written in C#, offers a storyboard-like comic strip representation for the generated stories, where each event gains a graphical illustration and a short sentence description. Just like the Draw Network module, the Plot Viewer is equally integrated with the SWI-Prolog environment through command-line arguments.
The Plot Viewer supports two dramatization modes: the first
displays all the events of the story as a storyboard (as illustrated in
Figure 6), and the second, activated by the show_tell user command, shows one event at a time together with its vocal narration.
In order to initialize the Plot Viewer and create a new storyboard, three arguments are required: (1) a list of story events; (2) a list of characters and roles, which maps specific roles into customizable character names; and (3) an optional list of character variations, which allow the same character to have different
appearances in different stories. The list of story events [e1, e2, …, em] is a time-ordered set of
terms ei(pi1, pi
2, …, pin), where each ei denotes the type of the
event and the values of the pij parameters define the characters,
objects, and places involved in the event ei. For each story event included in this list, a graphical illustration and a textual description of the event will be generated and added to the storyboard.
2 https://github.com/Microsoft/automatic-graph-layout
The second parameter comprises a list that maps character’s roles defined in the story domain into specific character names
assigned by the user. This list has the format [R1:Na1, R2:Na2,
..., Rn:Nan], where Ri is the role name and Nai is the character
name associated with role Ri. This information helps the Plot Viewer to identify proper graphical resources for the character names assigned by the user during the plot-generation phase.
The last argument to initialize the Plot Viewer is a list of character variations used to define distinct characterizations for
specific characters of the story. This list has the format [Na1:C1,
Na2:C2, ..., Nan:Cn], where Nai is the character name and Ci
is the current characterization of Nai. With this information, the same character can be represented by different graphical resources in different stories. For example, the role of villain in the LRRH variants can be played by a Wolf, a Bzou (werewolf), or by an unforgiving Uncle Wolf (strange old man), which have different visual appearances.
The storyboard is created based on a context that defines how
each class of events is visually represented. This context is specified in a XML file, which includes: (1) a set of locations that associates the places where the story events can occur with a specific background image; (2) a set of operators that establishes how each class of events is visually and textually composed; (3) a set of accessories that defines the visual elements that can be used by the characters in certain events, such as the gift carried by the girl to be delivered to her grandmother; (4) a set of propositions
that defines the initial state for characters and objects that are susceptible to changes that affect the way the story events are visually represented, such as the current location of the characters; and (5) a set of options that stablishes the style and the size of the font used to describe the story events textually. More details on the context file can be found in our technical report [21].
To generate graphical illustrations for the story events, the Plot Viewer implements a simple scene compositing algorithm that
combines multiple images of characters, objects and locations in a single image (panel). The process to compose the illustration of a story event comprises seven steps: (1) create an empty image for the panel; (2) identify the location where the event is occurring based on the current state of the characters involved in the event; (3) draw the background illustration of the location over the panel image; (4) identify the generic operator that describes the visual elements necessary to represent the story event; (5) draw all the visual elements over the panel according to the parameters of the
story event and the positions defined in the generic operator; (6) identify the accessories held by characters involved in the story event; and (7) draw all the accessories over the panel according to the positions defined in the story context for the current story event. More details on the generation of comic strips can be found in our previous work on interactive comics [18].
5.3 From templates to meta-templates
Our prototype includes, within its SWI Prolog Interface, a module for generating textual representations of plots that more closely resemble natural language. The module makes use of meta-templates for the compound production of story text.
Meta-templates are templates for combining basic templates.
For example, the event make('Floriel', 'false pancakes')
generates through a basic template the sentence “Floriel
prepares false pancakes.”. Thus, the sequence of events [make('Floriel', 'false pancakes'), make('Floriel',
'false bread'), make('Floriel', 'false wine')]
without any sort of post-processing, yields “Floriel prepares false pancakes. Floriel prepares false bread.
Floriel prepares false wine”.
This piecewise representation is suitable for the comics dramatization, where the art of each panel varies and there is meaning in representing these events in separate sentences. However, when reading an entire story continuously, the desired representation would be one that “weaves” these operations into a
compact form: “Floriel prepares false wine, false
pancakes and false bread.”. This particular result is achieved, in our module, through the
application of meta-templates which recognize that the same operation (make) is performed by the same subject (Floriel) with varying objects (false pancakes, false bread and false wine), resulting in a single operation where the object is a compound term. We have defined meta-templates for dealing with cases such as the above; and also for cases where multiple agents perform the same operation, and for cases where multiple agents perform
operations over multiple objects. We have also defined meta-templates for generating pronoun
references, which are applied in conjunction and combination with the meta-templates above. Thus, one possible resulting story
text for [go('Little Girl', 'Grandmother\'s house'),
deliver('Little Girl',food)] is “Little Girl goes to Grandmother's house. She delivers food.”. This avoids the repetitive use of entity names when narrating the story, which becomes especially important for our audio narration module.
5.4 Audio Narration – Storyteller module
The process to tell the generated stories vocally is implemented in the Storyteller module, which is written in C# and integrated with the SWI-Prolog environment through a command-line argument,
which passes the text of the story. In order to convert the story into speech, the Storyteller module
uses the text-to-speech (TTS) engine that comes integrated with the Windows operational system3. The TTS engine recognizes the story text and, using the standard synthesized female voice, narrates the story. In addition, a simple animation of the grandmother with lip-sync movements is shown while the story is
being narrated in response to a tell_me user command. The same engine is applied for the oral narration of the stories
kept in a personal library, composed with the help of meta-templates as explained in the previous sub-section.
6 USER EVALUATION
To assess the prototype application, we conducted a user test with 21 computer engineering students, 17 male, 4 female. Ages ranged from 18 to 26 years (mean of 21.2). Eight of them expressed interest in writing stories. Six had some previous experience with Interactive Storytelling systems. Fifteen had some previous knowledge about two or more variants of the Little Red Riding Hood folktale. None of them knew all of the four variants used in the prototype application.
Before using the system, the participants received three pages of printed documentation teaching them how to: (1) run the
system; (2) start a new story (new_story operation); (3) set a new cast (characters’ names); (4) choose nodes and check the events in the network; (5) interpret the event’s predicates; (6) view the generated story (list of predicates and comics dramatization); (7) activate the GPS feature; (8) create a story
guided by the GPS; (9) listen to the story narration (tell_me
operation); and (10) listen and view the story (show_tell
operation). While reading the documentation, we allowed the participants to freely use the system and try all the operations and
3 https://support.microsoft.com/en-us/help/306902/
features. On average, the participants spent 14.28 minutes learning how to use the system (standard deviation of 3.53).
After the learning phase, we asked the participants to complete three tasks using the system: (1) create a story where the girl is rescued; (2) create a story where her grandmother dies; and (3)
create a story that best suit their taste. On average, the participants spent 17.21 minutes to complete all tasks (standard deviation of 3.05), which includes: 4.39 minutes to complete task 1 (standard deviation of 1.18), 4.58 minutes to complete task 2 (standard deviation of 1.45), and 8.24 minutes to complete task 3 (standard deviation of 3.16). All participants were able to complete the three tasks successfully.
After completing the tasks, the participants filled in a
questionnaire with 26 questions derived and adapted from the USE Questionnaire [23], concerning the system usefulness, user satisfaction, and how easy was to learn and use the system. Each reply was graded within a 7-point Likert scale ranging from “strongly disagree” (-3) through “neutral” (0) to “strongly agree” (+3). After filling the questionnaire, the participants were interviewed about the experiment.
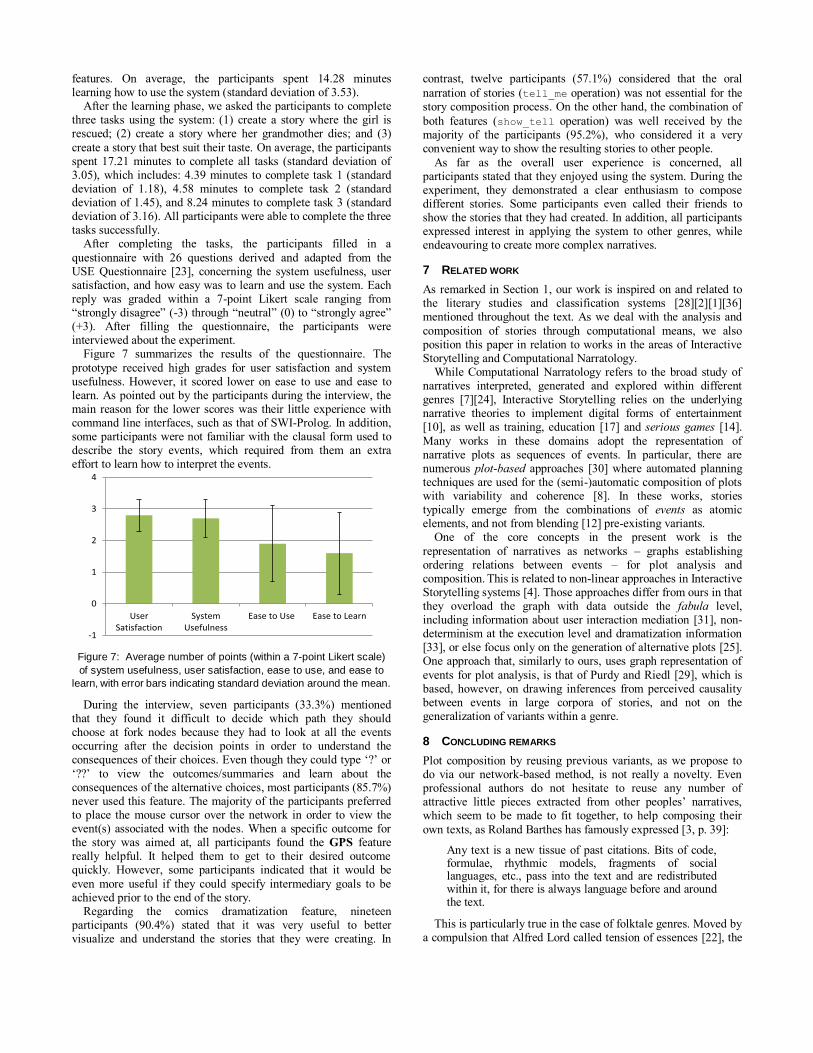
Figure 7 summarizes the results of the questionnaire. The
prototype received high grades for user satisfaction and system usefulness. However, it scored lower on ease to use and ease to learn. As pointed out by the participants during the interview, the main reason for the lower scores was their little experience with command line interfaces, such as that of SWI-Prolog. In addition, some participants were not familiar with the clausal form used to describe the story events, which required from them an extra effort to learn how to interpret the events.
-1
0
1
2
3
4
UserSatisfaction
SystemUsefulness
Ease to Use Ease to Learn
Figure 7: Average number of points (within a 7-point Likert scale)
of system usefulness, user satisfaction, ease to use, and ease to
learn, with error bars indicating standard deviation around the mean.
During the interview, seven participants (33.3%) mentioned that they found it difficult to decide which path they should choose at fork nodes because they had to look at all the events occurring after the decision points in order to understand the consequences of their choices. Even though they could type ‘?’ or
‘??’ to view the outcomes/summaries and learn about the consequences of the alternative choices, most participants (85.7%) never used this feature. The majority of the participants preferred to place the mouse cursor over the network in order to view the event(s) associated with the nodes. When a specific outcome for the story was aimed at, all participants found the GPS feature really helpful. It helped them to get to their desired outcome quickly. However, some participants indicated that it would be
even more useful if they could specify intermediary goals to be achieved prior to the end of the story.
Regarding the comics dramatization feature, nineteen participants (90.4%) stated that it was very useful to better visualize and understand the stories that they were creating. In
contrast, twelve participants (57.1%) considered that the oral
narration of stories (tell_me operation) was not essential for the story composition process. On the other hand, the combination of
both features (show_tell operation) was well received by the majority of the participants (95.2%), who considered it a very convenient way to show the resulting stories to other people.
As far as the overall user experience is concerned, all participants stated that they enjoyed using the system. During the experiment, they demonstrated a clear enthusiasm to compose different stories. Some participants even called their friends to show the stories that they had created. In addition, all participants expressed interest in applying the system to other genres, while endeavouring to create more complex narratives.
7 RELATED WORK
As remarked in Section 1, our work is inspired on and related to the literary studies and classification systems [28][2][1][36] mentioned throughout the text. As we deal with the analysis and
composition of stories through computational means, we also position this paper in relation to works in the areas of Interactive Storytelling and Computational Narratology.
While Computational Narratology refers to the broad study of narratives interpreted, generated and explored within different genres [7][24], Interactive Storytelling relies on the underlying narrative theories to implement digital forms of entertainment [10], as well as training, education [17] and serious games [14].
Many works in these domains adopt the representation of narrative plots as sequences of events. In particular, there are numerous plot-based approaches [30] where automated planning techniques are used for the (semi-)automatic composition of plots with variability and coherence [8]. In these works, stories typically emerge from the combinations of events as atomic elements, and not from blending [12] pre-existing variants.
One of the core concepts in the present work is the
representation of narratives as networks – graphs establishing ordering relations between events – for plot analysis and composition. This is related to non-linear approaches in Interactive Storytelling systems [4]. Those approaches differ from ours in that they overload the graph with data outside the fabula level, including information about user interaction mediation [31], non-determinism at the execution level and dramatization information [33], or else focus only on the generation of alternative plots [25]. One approach that, similarly to ours, uses graph representation of
events for plot analysis, is that of Purdy and Riedl [29], which is based, however, on drawing inferences from perceived causality between events in large corpora of stories, and not on the generalization of variants within a genre.
8 CONCLUDING REMARKS
Plot composition by reusing previous variants, as we propose to do via our network-based method, is not really a novelty. Even professional authors do not hesitate to reuse any number of attractive little pieces extracted from other peoples’ narratives, which seem to be made to fit together, to help composing their
own texts, as Roland Barthes has famously expressed [3, p. 39]:
Any text is a new tissue of past citations. Bits of code, formulae, rhythmic models, fragments of social languages, etc., pass into the text and are redistributed within it, for there is always language before and around the text.
This is particularly true in the case of folktale genres. Moved by a compulsion that Alfred Lord called tension of essences [22], the
popular oral storytellers responsible for their dissemination did faithfully preserve their traditional formulae – types and motifs – thus guaranteeing that any new variant remains within the scope of the genre. Since those storytellers usually dominated an ample repertoire of tales of different types, it should be common practice
among them to combine fragments from different tales to charm even more their audience. For example, it has been noted [34] that Perrault’s variant may represent a more ancient – hence of more “authentic” popular origin – rendering of LRRH than that collected by the Grimm brothers, which may have been the result of blending the former with The Wolf and the Seven Little Kids (type AT 123), also present in the Grimm collection [15, p. 39].
So, for non-professional authors, such as the casual users that
we had in mind in our project, there is even more reason to offer interactive systems that, while encouraging them to compose plots that suit their taste, make recommendations and impose restrictions in order to preserve the conventions of the (sub-)genre on hand. It is important to notice that none of the results found in the literature of Interactive Storytelling (include ours) are completely ready for use in major gaming projects. This is a paramount goal we have in mind for future research. In addition,
we anticipate that the composition of stories made by our prototype can be considered a new form of game, which is not fully exploited by the industry.
The results of the user evaluation test pointed some interesting directions for future research and improvements of our system, such as the need for better ways to visualize the consequences of the alternative choices at fork nodes, the importance of intermediary goals in the GPS feature, as well as the need for a graphical user interface to replace the command-line of the SWI-Prolog. Another future work is related with the specification of the domain, where more research is needed to develop authorial tools – that do not require knowledge of programs and formalisms – to effectively help domain experts to configure specialized modules appropriate to handle their domains. As a final remark, the positive user feedback, especially the enthusiasm demonstrated by the participants during the test, is a welcome stimulus for the continuation of our development efforts.
REFERENCES
[1] A. Aarne, and S. Thompson. The Types of the Folktale. Academia
Scientiarum Fennica, 1961.
[2] M. Bal. Narratology. University of Toronto Press, 1997.
[3] R. Barthes. Theory of the Text. In Untying the Text: a Post-
Structuralist Reader. Routledge & Kegan Paul, 1981.
[4] A. G. Bosser, M. O. Cavazza, R. Champagnat. Linear logic for non-
linear storytelling. IOS Press, pages 713-718, 2010.
[5] I. Calvino. Italian Folktales. Mariner Books, 1992.
[6] S. Bennett, S. McRobb, and R. Farmer. Object-Oriented Systems
Analysis and Design Using UML. McGraw-Hill Education, 2010.
[7] M. Cavazza, and D. Pizzi, Narratology for interactive storytelling: a
critical introduction. In Proceedings of the 3rd International
Conference on Technologies for Interactive Digital Storytelling and
Entertainment, pages 72-83, 2006.
[8] F. Charles, M. Lozano, S. J. Mead, A. F. Bisquerra, M. Cavazza.
Planning formalisms and authoring in interactive storytelling. In
Proceedings of 3rd Technologies for Interactive Digital Storytelling
and Entertainment, pages 216-225, 2006.
[9] A. E. M. Ciarlini, M. A. Casanova, A. L. Furtado, P. A. S. Veloso.
Modeling interactive storytelling genres as application domains.
Journal of Intelligent Information Systems, 35, pages 347-381, 2010.
[10] A. E. M. Ciarlini, C. T. Pozzer, A. L. Furtado, B. Feijó. A logic-
based tool for interactive generation and dramatization of stories. In
Proceedings of the 2005 International Conference on Advances in
Computer Entertainment Technology, pages 133-140, 2005.
[11] P. Delarue. The Story of Grandmother. In Little Red Riding Hood: A
Casebook. Dundes, A. (ed). University of Wisconsin Press, 1989.
[12] G. Fauconnier, and M. Turner. Conceptual projection and middle
spaces. Technical Report 9401, University of California, 1994.
[13] R. E. Fikes, and N. J. Nilsson. STRIPS: A new approach to the
application of theorem proving to problem solving. Artificial
Intelligence, 2 (3), pages 608-620, 1971.
[14] V. M. Gottin, E. S. Lima, A. L. Furtado. Applying Digital
Storytelling to Information System Domains. Proceedings of the XIV
Brazilian Symposium on Computer Games and Digital
Entertainment, pages 192-195, 2015.
[15] J. Grimm, W. Grimm. The Complete Grimm's FairyTales. M. Hunt
and J. Stern (trans.). Pantheon, 1972.
[16] L. Lamport. On interprocess communication. Distributed
Computing, 1(2), pages 77- 85, 1986.
[17] M. Laurent, N. Szilas, D. Lourdeaux, S. A. Bouchardon. A Reflexive
Approach in Learning Through Uchronia. In 9th International
Conference on Interactive Digital Storytelling, pages 411-414, 2016.
[18] E. S. Lima, B. Feijó, A. L. Furtado, S. D. J. Barbosa, C. T. Pozzer,
A. Ciarlini. Non-Branching Interactive Comics. In Proceedings of
the 10th International Conference on Advances in Computer
Entertainment Technology, pp. 230-245, 2013.
[19] E. S. Lima, B. Feijó, M. A. Casanova, A. L. Furtado. Storytelling
Variants Based on Semiotic Relations. Entertainment Computing,
17, pages 31-44, 2016.
[20] E. S. Lima, A. L. Furtado, B. Feijó. Storytelling variants: the case of
Little Red Riding Hood. In Proceedings of the 14th International
Conference on Entertainment Computing, pages 286-300, 2015.
[21] E. S. Lima, V.M. Gottin, A. L. Furtado. Network traversal as an aid
to plot analysis and composition. Technical Report 07/17,
Department of Informatics, PUC-Rio, 2017.
[22] A. Lord. The Singer of Tales. Harvard University Press, 2000.
[23] A. M. Lund. Measuring Usability with the USE Questionnaire. STC
Usability SIG Newsletter, 8(2), 2011.
[24] I. Mani. Computational Narratology. In: Hühn, Peter et al. (eds.): the
living handbook of narratology. Hamburg University Press, 2014.
[25] W. H. Min, E. S. Shim, Y. J. Kim, Y. G. Cheong. Planning-
integrated story graph for interactive narratives. In Proceedings of
the 2nd ACM international workshop on Story representation,
mechanism and context, pages 27-32, 2008.
[26] C. Orenstein. Little Red Riding Hood Uncloaked. Basic Books, 2003.
[27] C. Perrault. Little Red Riding Hood. In Beauties, Beasts and
Enchantment - Classic French Fairy Tales. J. R. Planché and J.
Zipes (trans.). Meridian, 1991.
[28] V. Propp. Morphology of the Folktale. Laurence, S. (trans.),
University of Texas Press, 1968.
[29] C. Purdy, M. Riedl. Reading Between the Lines: Using Plot Graphs
to Draw Inferences from Stories. In Proceedings of the 9th
International Conference on Interactive Digital Storytelling, 2016.
[30] M. Riedl. A. Stern. Believable agents and intelligent story adaptation
for Interactive Storytelling. In Proceedings of the Third International
Conference on Technologias for Interactive Digital Storytelling and
Entertainment, pages 1-12, 2006.
[31] M. Riedl, R. Young. From linear story generation to branching story
graphs. IEEE Computer Graphics and Applications, 26(3), 2006.
[32] B. Sinclair. Game industry coming around on story – Hoyer.
Gamesindustry.biz. Available at: http://goo.gl/vzqS5Y, 2014.
[33] I. Swartjes, and M. A. Theune. Fabula model for emergent narrative.
In International Conference on Technologies for Interactive Digital
Storytelling and Entertainment, pages 49-60, 2006.
[34] J. J. Tehrani. The Phylogeny of Little Red Riding Hood. PLOS ONE,
8 (11), pages 1-11, 2013.
[35] S. Thompson. The Folktale. University of California Press, 1977.
[36] H. J. Uther. The Types of International Folktales. Finish Academy of
Science and Letters, 2011.