Embed Size (px)
Citation preview

i
JULIANA ARAUJO BITTAR-CORTEZ Cirurgiã - Dentista
RADIOGRAFIA DIGITAL E A TÉCNICA DE
SUBTRAÇÃO NO MONITORAMENTO DA
DESMINERALIZAÇÃO E REMINERALIZAÇÃO
DO ESMALTE DENTÁRIO
Tese apresentada à Faculdade de
Odontologia de Piracicaba, da
Universidade Estadual de Campinas,
para obtenção do Título de doutora em
Radiologia Odontológica.
Orientador: Prof. Dr. Francisco Haiter Neto
Co-orientadora: Profª. Drª. Cinthia P. Machado Tabchoury
PIRACICABA
2008

ii
FICHA CATALOGRÁFICA ELABORADA PELA BIBLIOTECA DA FACULDADE DE ODONTOLOGIA DE PIRACICABA
Bibliotecário: Sueli Ferreira Julio de Oliveira – CRB-8a. / 2380
B546r
Bittar-Cortez, Juliana Araujo. Radiografia digital e a técnica de subtração no monitoramento da desmineralização e remineralização do esmalte dentário. / Juliana Araujo Bittar-Cortez. -- Piracicaba, SP : [s.n.], 2008. Orientador: Francisco Haiter Neto. Dissertação (Doutorado) – Universidade Estadual de Campinas, Faculdade de Odontologia de Piracicaba. 1. Cárie dentaria. 2. Flúor. 3. Análise Química. 4. Ruído. 5. Radiologia. 6. Intensificação de imagem radiográfica. I. Haiter Neto, Francisco. II. Universidade Estadual de Campinas. Faculdade de Odontologia de Piracicaba. III. Título.
(sfjo/fop)
Título em Inglês: Digital radiography and the subtraction technique for monitoring dental enamel demineralization and remineralization. Palavras-chave em Inglês (Keywords): 1. Dental carie. 2. Fluorine. 3. Chemical analysis. 4 Noise. 5. Radiology. 6. Radiographic image enhancement. Área de Concentração: Radiologia Odontológica Titulação: Doutora em Radiologia Odontológica Banca Examinadora: Francisco Haiter Neto, Julio Cesar de Melo Castilho, Plauto Christopher Aranha Watanabe, Solange Maria de Almeida, Antonio Carlos Pereira. Data da Defesa: 25-01-2008 Programa de Pós-Graduação em Radiologia Odontologica

iii

����������������������� �� ������������������������������������������������������������������������������ ����
����������
iv
�������������� ��������������������������
������������� ��������������� ��������������� ��������������� ����������������������������
����� ������������������ ��������
�����������������������������������������������������
�����������������������������������������������
�� ����� ���� �� ������ ������ ����� �� ��� ������
����������������������������
����� �� ���� !���� ��� �� "�#�� !���� ��� �� "�#�� !���� ��� �� "�#�� !���� ��� �� "�#�� �� �� �� ������
#�������� � ��� ����� ��� �������� ������������
��������������� ���������������� ��
���������������"�����"�����"�����"������$����������%������
���� ������� ������������� ���� �� ����& �� �����
'� ��� ����� �� ������ (��� � �� ���� ��� ����� ���
���)�
*������� �� ��� ����� �������� �������� ���
�������������#���&�������)��
���������������������� ����+���������������������� ����+���������������������� ����+���������������������� ����+����

����������������������� �� ������������������������������������������������������������������������������ ����
������� �����
v
AGRADECIMENTOS
��� � ����� � ��� � � � � ��� � ���� � ���� ����� � ��� � � � � ��� � ���� � ���� ����� � ��� � � � � ��� � ���� � ���� ����� � ��� � � � � ��� � ���� � ����� � ��� ��� � � ��� � � � � �� � � ��
� �� �� � � �� ��� � � � � � � � � ��� ��� ���� ��� � ����� ���� � � � � � � ��� � ���� � ��� � � ����
��� � ��� � � � �� � � �� �� ��� � � � � � ���� � �� � � � � � � � ��� ��� � � � � � �� �� � � � �� ��
�� � � � �� ��� � � � �� � �� �� ��� � � � � �� �! �� � � ��� � � �� � � � � � � � � " � � � �� � � � ����
� � � � # � ��" �� � ���� � �$ ��� � �� � ��
% �� ���&��� �&��' �� �$ �� ��� � �( �$ � ��) � �$ �� �*� ���&��� �&��' �� �$ �� ��� � �( �$ � ��) � �$ �� �*� ���&��� �&��' �� �$ �� ��� � �( �$ � ��) � �$ �� �*� ���&��� �&��' �� �$ �� ��� � �( �$ � ��) � �$ �� �* ��� �������� �� ���$ � ��� ��
� �� �� � �� ���� ��� � � �� � �� � � ��� � # � � ��� �� � �� �� � � ���� �������� � ��� � �
��+�� �� � � �� ��� � �� � �� � � �� � # � � ��� �� ��� �� � �$ ��� � � � � � � � �� ���� � � � ���
� �� � � # � �� � � � � �� � � ��� � � �� � � � � �� � � � �� ��� � �� � , � ��� �� � �� � �� � ��
� ��- �� # ���
. � � ���&�� � �&�� / �� � � �� ( � � � �� ��� � � � ���&�� � �&�� / �� � � �� ( � � � �� ��� � � � ���&�� � �&�� / �� � � �� ( � � � �� ��� � � � ���&�� � �&�� / �� � � �� ( � � � �� ��� � � �� � ���� � ��� � � �� � � � �� ��
�� � � � �� ��� � � �� � �� ��� � � � � � � �� �� �" � � � � � # � ����� � � � � �� � � � � � �
� ���� � � ���� � � $ ���� � � � �� � ��� � ��� �� �� �� �� ��� ��� � � ��� � �� ��� � � ��
��� � ����� � ��� � � �� ��� �����0 1 � ����� ����� � ��� � � �� ��� �����0 1 � ����� ����� � ��� � � �� ��� �����0 1 � ����� ����� � ��� � � �� ��� �����0 1 � ������ � ���� ��� � � � �� ��� � � ��� ����� � �
� � � � �� � �� � ��� � �� � ����� � �� � ��� ��� � � � 2� � �� ��� � � �� � $ � � ��� �� � � � � � � � ��
�� � � � ����

����������������������� �� ������������������������������������������������������������������������������ ����
������� �����
vi
. �� ���&��� �&� ���&��� �&� ���&��� �&� ���&��� �& ��3 �, � � �( � �0 �� ��� � ��� � ����3 �, � � �( � �0 �� ��� � ��� � ����3 �, � � �( � �0 �� ��� � ��� � ����3 �, � � �( � �0 �� ��� � ��� � ��� �� ���� � ���� ����� �� � � � ��
� ��� � # � � ��� � � , � � ���� � ��� � � ��� � � � � �� �������� �� ��� � � ��� �� �� �� �� ��� �
� � ���� � � � � �� ��
��� � � �� � � � �� ��� �� 4 � # � �� 5# � �4 � # � �� 5# � �4 � # � �� 5# � �4 � # � �� 5# � ��� � ��� �� � ��� � � �� � ��� � ��� �� ��� �
��� � � $ � � ���� � ��� � � � � ����� � � � �� � $ � ���� � � � � ��
��� � � �� � � ����� � � � �� � �� ��� � �� �� �� � �� � � � �� ��� � � �� �� �� � � ���� � � ���� � � ���� � � ��
��* � � ����� � �" ��* � � ����� � �" ��* � � ����� � �" ��* � � ����� � �" ��� � �� ��� �� �� $ ��6 � �� ��( , �� ��7 � $ �����/ " �� ����� � �� ��� �� �� $ ��6 � �� ��( , �� ��7 � $ �����/ " �� ����� � �� ��� �� �� $ ��6 � �� ��( , �� ��7 � $ �����/ " �� ����� � �� ��� �� �� $ ��6 � �� ��( , �� ��7 � $ �����/ " �� ���� ���� �� �� � �
� �� �� ��� �� ����� � � - � � ���
��� , � ��� 8 ���� � 3 � * ��� ( �* , � ��� 8 ���� � 3 � * ��� ( �* , � ��� 8 ���� � 3 � * ��� ( �* , � ��� 8 ���� � 3 � * ��� ( �* �� � ��� � �� ���� ��� � � � � � �� � � � ��� � �� ���
����� � �� ���� � �$ ���� ������� � � $ � � � � ���� �� � � # � ��� � � $ �� ���� ���� �1 � � �� �
� �� �� ��� �� � � � �� �2� � ��� ��
. �� � $ � �� � � �� � � � �� � � � � �� � � � $ ���� " � � � $ ���� " � � � $ ���� " � � � $ ���� " ��� ���� � � ��� � �� ����� � ���
9 ��- � � � �� �� � � � � � �� � ��� � � ��� � ���� � � � # � ��� � �� �� � ��� � �� ��� � ��
� �� � ������ ��� � ���� ��- � ��
. �� �� � � � � � ������ � � ��� �� �� �� ��� ��� �� � � � � �� � ���� � ���� # �� �
�� � � � , � � � :� ; �� � $ �� ; � � �� ( � � 4 � �# �� < � � ���� ( ����; �� � $ �� ; � � �� ( � � 4 � �# �� < � � ���� ( ����; �� � $ �� ; � � �� ( � � 4 � �# �� < � � ���� ( ����; �� � $ �� ; � � �� ( � � 4 � �# �� < � � ���� ( ���� �� 3 � ����� �� � � ��3 � ����� �� � � ��3 � ����� �� � � ��3 � ����� �� � � ��
� � � � � �� ������ � � 2� � ��� ���� �� ��� �� �� �� ��� ��� � � ��� ��� � � ��
��� � �� � � �� , � �� � � � � � ���� �� 3 � ��� �3 � ��� �3 � ��� �3 � ��� � �� ��� � � �� ��� � � �� ��� � � �� ��� � � ��� �� � �� � �� ��� ��
< �� ��= �< �� ��= �< �� ��= �< �� ��= � �� � 7 �� ���� 7 �� ���� 7 �� ���� 7 �� ��� �� �� �� � �" �� ��� � � �� � � �� �1 � �� � �� � � � �� � �� < �� �� �����< �� �� �����< �� �� �����< �� �� �����
������ ������� ������� ������� ���� ������ � �� �� � � � ����� � - � � ��� ������ �� � � ���� 2� � ���� � � � ��

����������������������� �� ������������������������������������������������������������������������������ ����
�������
vii
�
�
�
�
�
,-���������������������������������������������.)�
�����/�����0'�����
,1����������������������������'�� .)�
���������� ����������

����������������������� �� ������������������������������������������������������������������������������ ����
���� �
viii
RESUMO
O objetivo deste estudo in vitro foi comparar dois protocolos de
remineralização em lesões de cárie no esmalte dentário, avaliados por meio de
análises de cálcio (Ca) e fósforo (Pi), dureza do esmalte, microscopia de luz
polarizada e subtração radiográfica digital (SRD); avaliar a viabilidade da utilização
de dois diferentes sistemas de radiografias digitais, placa PSP (photostimulable
storage phosphor) e sensor CMOS (complementary metal oxide semicondutor), no
diagnóstico de desmineralizações, e a acurácia das radiografias digitais
convencionais (RDC) e três métodos de SRD (linear, avançada e logarítmica) no
diagnóstico de mudanças minerais; e comparar o ruído e reprodutibilidade das
imagens de SRD lineares e logarítmicas produzidas a partir de dois sistemas de
radiografias digitais. Para isso, lesões de cárie artificiais foram criadas em 100
superfícies proximais de dentes hígidos. Vinte dentes foram mantidos como
controle e oitenta foram submetidos a dois diferentes protocolos de
remineralização em 4 e 8 semanas, com a contínua imersão em saliva artificial e
um tratamento adicional com flúor. Radiografias digitais foram realizadas antes e
depois dos protocolos de remineralização. Cinco examinadores avaliaram a
desmineralização e as mudanças minerais nas RDC, dispostas lado a lado, e três
métodos da SRD. As análises de Ca / Pi e a colocação dos dentes na solução
remineralizante foram considerados como padrão ouro. A média dos tons de cinza
e o desvio padrão (DP) no histograma foram também mensurados. As
concentrações de Ca e Pi na saliva artificial após os tratamentos foram
significativamente menores do que a solução original (p<0,05); e por meio da SRD
foi possível verificar diferenças entre as imagens. Entretanto, o teste de dureza e a
microscopia de luz polarizada não detectaram nenhuma alteração. O sistema
CMOS foi significativamente mais acurado do que a sistema PSP no diagnóstico
da desmineralização e mudanças minerais, assim como a SRD linear no
diagnóstico de mudanças minerais. Também foram estatisticamente diferentes os
valores da média dos níveis de cinza e do DP entre os dois sistemas. Foi

����������������������� �� ������������������������������������������������������������������������������ ����
���� �
ix
concluído que (a) o tratamento adicional de flúor promoveu valores maiores de
ganho mineral; (b) a análise de Ca / Pi na saliva artificial foi o método mais
sensível na avaliação de alteração mineral; (c) a imagem de SRD linear é um
método válido na detecção do aumento de intensidade, como sinal de ganho
mineral; e (d) as imagens de SRD utilizando as placas PSP tiveram um menor
ruído do que nas imagens geradas pelo sensor CMOS.
Palavras-chave: Cárie dentária, Flúor, Análise química, Ruído, Radiologia,
Intensificação de imagem radiográfica.

����������������������� �� ������������������������������������������������������������������������������ ����
�������
x
ABSTRACT
The aim of this in vitro study was to compare two remineralization
protocols of artificial carious lesions in enamel, evaluated by Calcium (Ca) and
Phosphorus (Pi) analysis, cross-section hardness test, polarized light microscopy
and digital subtraction images (DSR); to assess the feasibility of using two different
systems of digital radiography, photostimulable storage phosphor (PSP) plate and
complementary metal oxide semiconductor (CMOS) sensor on the
demineralization diagnosis, and the accuracy of digital conventional radiographs
(DCR) and three methods of DSI (linear, advanced and logarithmic) on mineral
changes diagnosis; and, to compare noise and reproducibility in linear and
logarithmic DSI produced from two digital radiography systems. Artificial caries-like
lesions on 100 approximal surfaces of sound teeth were produced. Twenty teeth
were kept as control and eighty teeth were subjected to two different
remineralization protocols for 4 and 8 weeks, with continuous immersion in artificial
saliva, and additional fluoride treatment. Digital radiographs were taken before and
after the remineralization protocols. Five examiners assessed demineralization and
mineral changes on DCR, placed side by side, and three methods of DSI. Ca / Pi
analysis and the placement of the teeth on the remineralization solution was the
gold standard. The mean shades of gray and the standard deviation (SD) of the
histogram were also assessed. The concentrations of Ca and Pi in the artificial
saliva after the treatments were significantly lower than the original solution
(p<0.05); and DSR showed differences between the images. However, the
hardness test and polarized light microscopy did not detect any changes. CMOS
system was significantly more accurate than PSP system on demineralization and
mineral changes diagnosis, and also linear DSR on mineral changes diagnosis. It
was also statistically significant different the values of mean shades of gray and SD
between both systems. It was concluded that (a) the additional Fluoride treatment
provided higher values of mineral gained; (b) Ca / Pi analysis in the artificial saliva
were the most sensitive method of mineral change evaluation; (c) linear DSI is a

����������������������� �� ������������������������������������������������������������������������������ ����
�������
xi
valuable method to disclose an intensity increase, as a sign of mineral gained; and
(d) DSR images created from PSP plates had less noise than images produced
from CMOS sensor.
Key Words: Dental caries, Fluoride, Chemical analysis, Noise, Radiology,
Radiographic image enhancement.

����������������������� �� ������������������������������������������������������������������������������ ����
�� ���
xii
SUMÁRIO
INTRODUÇÃO
CAPÍTULO 1: Remineralização in vitro de lesões de cárie artificial por meio de imagens de subtração
“In vitro remineralization of artificial carious lesions assessed by subtraction images”
CAPÍTULO 2: Estudo comparativo de diferentes métodos para quantificar a remineralização do esmalte dentário
“Comparative study of different techniques to quantify dental enamel remineralization”
CAPÍTULO 3: Comparação in vitro de imagens digitais e subtração no diagnóstico de lesões de cárie artificial interproximal e mudanças minerais
“In vitro comparison of digital and subtraction images for approximal artificial caries-like lesions and mineral changes diagnostic accuracy”
CAPÍTULO 4: Ruído em imagens de subtração linear e logarítmica feitas por pares de imagens com sensor CMOS e placa PSP
“Noise in linear and logarithmic subtraction images made from pair of images with CMOS sensor and PSP plate”
CONCLUSÃO
REFERÊNCIAS
ANEXO 1
ANEXO 2
1
12
28
40
58
71
73
79
80

����������������������� �� ������������������������������������������������������������������������������ ����
���������
1
INTRODUÇÃO
O início da lesão de cárie está associado com a desmineralização do
esmalte dentário. A superfície do esmalte perde íons de cálcio (Ca) e fósforo (Pi)
resultando na formação de uma lesão sem cavitação. Neste estágio, a lesão de
cárie é reversível via processos de remineralização envolvendo a difusão destes
íons na superfície restaurando as estruturas perdidas. Este processo de
remineralização usando soluções de Ca e Pi ou um tratamento adicional com flúor
(F) já foi estabelecido (Ingram & Edgar, 1994). Esse processo de reversão da
lesão de cárie pode também ocorrer em altos níveis de perda mineral inicial, onde
já tenha sido considerado que o processo de cárie “passou do ponto de retorno”
(ten Cate, 2001; Mukai & ten Cate, 2002).
Um grande número de métodos tem sido utilizado na mensuração de
mudanças que ocorrem nos tecidos dentários, incluindo testes que avaliam
mudanças quantitativas das propriedades físicas, como o teste de dureza do
esmalte seccionado longitudinalmente, mudanças na composição mineral
(dosagens bioquímicas) ou por meio da microscopia de luz polarizada (Argenta et
al., 2003; Ganss et al., 2005). Entretanto, estes métodos são utilizados em
estudos in vitro e in situ, sendo necessário o estudo de métodos que possam
quantificar a progressão (desmineralização) ou regressão (remineralização) das
lesões de cáries em esmalte in vivo. Algumas técnicas como medida de
resistência elétrica (Wang et al., 2005), fluorescência quantitativa induzida por

����������������������� �� ������������������������������������������������������������������������������ ����
���������
2
luminosidade (Pretty et al., 2003) e fluorescência a laser (Lussi et al., 2001), têm
sido desenvolvidas com este propósito de mensurar as mudanças minerais em
esmalte humano. Contudo, ainda não existe um método aceito, principalmente
para o monitoramento de lesões de cárie interproximais.
Para o diagnóstico da cárie dentária, o exame radiográfico tem sido
apontado como um método ideal (Gröndahl et al., 1982; Espelid & Tveit, 1984;
Pitts & Renson, 1986; Heaven et al., 1990; Wenzel, 1995; Wenzel, 2000; Wenzel
et al., 2000), sendo que no que se concerne às superfícies proximais, a radiografia
constitui-se em um procedimento essencial ao diagnóstico (Gröndahl, 1979). Além
disso, com o monitoramento por meio de radiografias podemos verificar a
progressão ou a paralisação de lesões cariosas. Porém, para se determinar
pequenas alterações minerais que possam ocorrer durante um determinado
período de tempo, são necessários métodos com alto grau de precisão, para que
as mesmas possam ser mensuradas por um ou vários observadores sem grandes
variações.
Embora o exame radiográfico seja um método sensível para o registro
da perda mineral em esmalte e dentina, a interpretação correta das características
radiográficas pode ser uma tarefa difícil, pois a extensão das lesões cariosas pode
ser subestimada ou superestimada nas radiografias convencionais, em
comparação com os achados clínicos e histológicos (Espelid & Tveit, 1984;
Syriopoulos et al. 2000). Esta informação reforça a significância de se desenvolver
técnicas inovadoras e mais precisas para o diagnóstico da cárie, adequando o

����������������������� �� ������������������������������������������������������������������������������ ����
���������
3
plano de tratamento à severidade da lesão.
Basicamente, os erros de posicionamento do filme e do cabeçote de
raios X são as principais fontes de distorção geométrica, que geralmente ocorrem
juntos. Porém, esses erros podem ser minimizados através do uso de
posicionadores e registros de mordida com material de moldagem (Hausmann et
al., 1996). Foram desenvolvidos e estão sendo usados também, meios de
manipulação da imagem onde, através de uma matriz de transformação
algorítmica, pequenas diferenças geométricas de exposição podem ser ajustadas
(Webber et al., 1984; Fisher et al., 1994).
Além disso, mesmo com um perfeito alinhamento da projeção
geométrica, fatores como radiação espalhada e o processamento radiográfico
alteram a densidade e o contraste entre as duas radiografias. Uma variedade de
métodos tem sido utilizada para que esta correção do contraste e densidade seja
feita, com o cuidado de não remover informações de ganho ou perda de tecido
mineral (Ruittmann et al., 1986; Likar & Pernus, 1997).
Os novos sistemas de radiografia digital com aumento da resolução da
imagem e os recursos de manipulação, como ampliação e alteração do contraste
e densidade, podem ser validados como uma alternativa para aumentar a acurácia
no diagnóstico de cárie. Estes sistemas, comparados com radiografias
convencionais proporcionam uma acurácia de diagnóstico semelhante (Wenzel
2006). Por sua vez, recursos tecnológicos como a subtração radiográfica digital
figura como uma técnica que possibilita a detecção de alterações tênues nas
����������������������� �� ������������������������������������������������������������������������������ ����
���������
4
estruturas mineralizadas da boca (Gröndahl et al., 1983; Halse et al., 1990;
Maggio et al., 1990; Wenzel & Halse, 1992; Wenzel et al., 1993; Minah et al.,
1998; Wenzel, 1998; Ferreira et al., 1999; Eberhard et al., 2000; Wenzel et al.,
2000).
A subtração radiográfica digital (SRD) tem sido apontada como uma
eficiente estratégia de processamento de imagens para a detecção de pequenas
mudanças em tecidos duros e também pode se tornar adequada para o uso na
cariologia (Wenzel et al., 2000). No diagnóstico de desmineralizações
interproximais ou oclusais, a SRD obteve valores maiores de acurácia e
sensibilidade (Haiter-Neto et al., 2005; Ricketts et al., 2007). Um aumento de
intensidade em áreas de desmineralizações oclusais e interproximais depois do
uso de soluções de F também foi diagnosticado pela SRD (Halse et al., 1990;
Wenzel & Halse. 1992), mas ainda não existe uma comparação de diferentes
métodos de SRD no diagnóstico de mudanças minerais. Também existem
algumas pesquisas que foram desenvolvidas com o objetivo de avaliar as técnicas
de subtração radiográfica digital como auxiliar para o diagnóstico e proservação
das lesões de cárie (Gröndahl et al., 1982; Halse et al., 1990; Maggio et al., 1990;
Nummikoski et al., 1992; Wenzel & Halse, 1992; Halse et al., 1994; Sousa et al.,
1997; Minah et al., 1998; Eberhard et al., 2000). No entanto, poucos estudos
abordam o monitoramento da progressão de lesões iniciais em esmalte.
A SRD foi introduzida na Odontologia nos anos oitenta (Webber et al.,
1982; Grondahl et al., 1983) com o objetivo de comparar duas radiografias
����������������������� �� ������������������������������������������������������������������������������ ����
���������
5
padronizadas feitas em um intervalo de tempo. Esta técnica consiste em subtrair
as estruturas que não se alteraram entre os dois exames radiográficos resultando
em uma imagem envolta por um fundo cinza neutro. Áreas de perda de tecido
mineral são convencionalmente mostradas por um cinza escuro enquanto áreas
de ganho aparecem como um cinza claro.
Em linguagem computacional, as imagens radiográficas são constituídas
por pixels. O número de degraus ou níveis de cinza é determinado por 2N, onde N
é o número de bits em cada pixel. A representação digital de densidade em cada
pixel é mais comumente representada por 8 bits, onde as numerações variam de 0
a 256, sendo o número 0 a cor preta e o 256 a cor branca (Balter, 1993). Na
subtração radiográfica digital, subtraindo dois pixels iguais resultaria no numero 0,
o que daria uma imagem preta. Para que isso não ocorra, o sistema
automaticamente adiciona a cada subtração, pixel a pixel, o valor 128, o que
resulta em uma imagem com um tom de cinza médio. As áreas em que a
subtração dos pixels não for 0, o valor pode ser acima de 128, resultando em uma
área mais clara, ou abaixo de 128, resultando em uma área mais escura.
A acurácia da técnica da subtração radiográfica digital em revelar
alterações quantitativas de densidade óssea está na dependência da produção de
radiografias padronizadas geometricamente, além de contraste e densidade
semelhantes. Qualquer alteração entre a radiografia inicial e final na mesma
região anatômica irá produzir áreas na imagem de subtração com um aumento ou

����������������������� �� ������������������������������������������������������������������������������ ����
���������
6
diminuição da densidade, o que pode ser interpretado erroneamente como regiões
de ganho ou perda mineral (Benn, 1990).
Teoricamente, o resultado da SRD são imagens que destacam as
diferenças que ocorreram no período de tempo avaliado sobre um fundo
relativamente uniforme. Entretanto, imagens de subtração podem conter uma
variação dos níveis de cinza o qual é independente de mudanças produzidas por
reais diferenças entre as duas imagens subtraídas. Estas diferenças “acidentais”
podem interferir no diagnóstico e são chamados de ruído. Deve ser possível em
subtração digital quantitativa detectar qualquer mudança nos valores dos pixels os
quais realmente se originaram de mudanças no objeto através da eliminação da
variação na sensibilidade dos pixels (ruído) (Yoshioka et al., 1997). Este ruído
pode ser quantificado usando o desvio padrão (DP) do histograma, definindo a
distribuição dos tons de cinza na imagem de subtração (Eraso et al., 2007).
Quanto maior a quantidade de tons de cinza no histograma, mais ruído na imagem
de subtração e maior será o DP (Haiter-Neto & Wenzel, 2005).
Na prática clínica, a utilização de meios de padronização geométrica
como, por exemplo, registros de mordida bem como os meios de correção por
meio de sistemas computadorizados são importantes. Além disso, uma correção
do contraste e densidade entre as duas radiografias deve ser feita, pois variações
no tempo de exposição e tipo de processamento podem contribuir, também, para
uma falta de acurácia da técnica (Jassen et al., 1989; Filder et al., 2000).

����������������������� �� ������������������������������������������������������������������������������ ����
���������
7
Um dos programas de computador utilizados para criar imagens de
subtração radiográfica digital é o EMAGO® (Oral Diagnostic Systems, Louwesweg,
Amsterdam, Holanda). Neste programa, dois comandos (“gamma correction” e
“reconstruction”) foram criados para minimizar estas condições indesejadas e
viabilizar o uso da subtração radiográfica digital como método diagnóstico.
O comando “gamma correction” é utilizado para a realização de uma
correção do contraste e densidade entre as duas radiografias, objetivando a
uniformidade dessas duas imagens. Como já foi dito, a diferença na distribuição
dos tons de cinza das radiografias pode interferir na detecção de pequenas
alterações, gerando um ruído nas imagens, ou seja, produzindo diferenças entre
as imagens que não sejam reais, dificultando o correto diagnóstico.
O comando “reconstruction” é utilizado para que as duas radiografias
tenham a projeção geométrica mais semelhante possível. A reconstrução envolve
o mapeamento da informação contida em uma imagem sobre o plano de projeção
da radiografia inicial. Neste programa a reconstrução é feita por meio da marcação
de quatro pontos posicionados no mesmo local nas duas radiografias, onde
automaticamente é gerada a imagem reconstruída. Estes pontos geralmente são
marcados próximos da área de interesse, sendo que se houver mais de uma área
a ser avaliada, recomenda-se a criação de uma imagem de reconstrução para
cada uma das áreas a serem analisadas.
Em 1998, Byrd et al. avaliaram a acurácia do alinhamento através de
pontos, comparando três e quatro pontos, para minimizar discrepâncias

����������������������� �� ������������������������������������������������������������������������������ ����
���������
8
geométricas, utilizando “chips ósseos” colocados em mandíbulas maceradas.
Também, correlacionaram os dados em um estudo in vivo. Os resultados
indicaram que o alinhamento através de quatro pontos pode aumentar a eficácia
da SRD.
Existem dois tipos de imagens por SRD: linear e logarítmica. Na
primeira, obtêm-se uma imagem com tom de cinza intermediário (Figura 1),
enquanto que no segundo tipo, o contraste radiográfico e a quantidade de ruído
são aumentados (Figura 2). Versteeg & Van der Stelt, em 1995, compararam
estes dois tipos de subtração na avaliação de lesões criadas artificialmente por
meio do computador. A análise foi feita por 20 avaliadores que decidiram em uma
escala de 5 pontos, se existia ou não a presença de uma lesão. Os autores
concluíram que a subtração radiográfica digital logarítmica proporcionou
informações de diagnóstico melhores que a subtração linear, mas afirmaram que
estudos clínicos ainda eram necessários para excluir as limitações de lesões
criadas artificialmente. Na nova versão 5.0.12 do programa EMAGO®, foi criado
uma nova ferramenta denominada “advanced subtraction” onde existe uma
combinação dos comandos “reconstruction”, “gamma correction” e “linear
subtraction”, o que significa que o programa automaticamente subtrai as duas
imagens, rotaciona uma imagem em relação à outra, calibra os níveis de cinza e
cria a imagem de subtração radiográfica digital linear em tempo real.

����������������������� �� ������������������������������������������������������������������������������ ����
���������
9
A lesão de cárie e a remineralização não é uma radioluscência bem
definida com o aumento ou diminuição do nível de calcificação para a periferia da
lesão. Portanto, mensurações da extensão da lesão e monitoramento da
remineralização são difíceis de serem feitas com altos valores de acurácia
(Eberhard et al., 2000). A progressão de descalcificações in vitro tem sido avaliada
e quantificada por meio de técnicas como a micro-radiografia, microscopia de luz
polarizada, teste de dureza do esmalte seccionado longitudinalmente, dosagens
bioquímicas de Ca e Pi e SRD. Entretanto, existe a necessidade de métodos que
monitorem o estado mineral e também correlacionem entre si, para que uma
comparação dos resultados de estudos in vitro, in situ e in vivo possam ser
realizados. O método ideal deve ser capaz de permitir medidas sequencionais e
ser quantitativo para o ganho e perda mineral. Ganss et al. (2005) correlacionaram
Figura 1 - Exemplo de SRD linear Figura 2 - Exemplo de SRD logarítmica

����������������������� �� ������������������������������������������������������������������������������ ����
���������
10
valores de mensurações de perda mineral erosiva por meio de quatro diferentes
métodos: dosagens de Ca e Pi, profilometria de superfície e microradiografia
longitudinal. Como resultado, obteve uma correlação positiva entre estes métodos.
Em imagens radiográficas digitais, para o monitoramento de lesões de
cárie, existem possibilidades de avaliação subjetiva por meio de interpretação e
comparação direta das duas imagens visualizadas; e, uma avaliação objetiva por
meio da densidade radiográfica medida por meio do histograma. Entretanto, ao se
propor um novo método de aquisição de imagem, como os equipamentos de
radiografias digitais e recursos tecnológicos como a SRD, faz-se necessário que
os mesmos sejam avaliados in vitro e correlacionados com técnicas já
estabelecidas para que a comparação de estudos in vitro, in situ e in vivo possam
ser comparados e uma técnica de diagnóstico com uma acurácia satisfatória seja
estabelecida para o seu real uso in vivo.
Diante do exposto esta pesquisa objetiva avaliar:
A - Comparar duas metodologias de remineralização in vitro do esmalte
dentário por meio de solução remineralizante e exposição ao flúor, usando como
métodos de avaliação: dosagem bioquímica, teste de dureza do esmalte,
microscopia de luz polarizada e imagens de subtração radiográfica digital.
B - Comparar as dosagens bioquímicas de cálcio e fósforo, avaliação da
perda mineral por meio do teste de dureza do esmalte e análises de densidade por
meio do histograma em imagens de microscopia de luz polarizada e subtração
radiográfica digital na avaliação quantitativa de mudanças minerais em um modelo

����������������������� �� ������������������������������������������������������������������������������ ����
���������
11
in vitro.
C - Avaliar a viabilidade do uso de dois diferentes equipamentos de
radiografia digital (DIGORA OpTime® / placa PSP e CDR Wireless® / sensor
CMOS) no diagnóstico de desmineralizações do esmalte; e, avaliar a acurácia de
radiografias digitais convencionais e três métodos de subtração radiográfica digital
(linear, avançada e logarítmica) na detecção de mudanças minerais em esmalte in
vitro.
D - Comparar o ruído e a reprodutibilidade de imagens de subtração
radiográfica digital linear e logarítmica produzidas a partir de imagens feitas com
dois diferentes sistemas de imagens digitais em três regiões de interesse, com
variação do tamanho e estrutura.

����������������������� �� ������������������������������������������������������������������������������ ����
���������
12
CAPÍTULO 1
(Artigo enviado para “Caries Research” / Anexo 2)
TITLE PAGE
Title of the paper:
In vitro remineralization of artificial carious lesions
assessed by subtraction images Juliana A Bittar-Cortez a
Cínthia P M Tabchoury b
Francisco H Nociti-Junior c
Francisco Haiter-Neto a
a Oral Diagnosis Department, Oral Radiology Division, Piracicaba Dental School,
State University of Campinas, São Paulo, Brazil. b Physiological Science Department, Biochemistry Division, Piracicaba Dental
School, State University of Campinas, São Paulo, Brazil. c Prosthodontics and Periodontics Department, Periodontics Division, Piracicaba
Dental School, State University of Campinas, São Paulo, Brazil.
Short title: Dental enamel remineralization
Key Words: Fluoride, Artificial saliva, Subtraction radiography, Remineralization
Dental caries, In vitro model
Corresponding author: Francisco Haiter Neto, Piracicaba Dental School/State
University of Campinas. Limeira Avenue, 901, Zip Code: 13.414-903, Piracicaba,
SP, Brazil; Phone: 55 19 2106 5327; Fax: 55 19 2106 53 18. E-mail:

����������������������� �� ������������������������������������������������������������������������������ ����
���������
13
Abstract
The aim of this in vitro study was to compare two remineralization protocols of
artificial carious lesions in enamel, for 4 and 8 weeks, subjected to continuous
immersion in artificial saliva, and additional fluoride treatment. Determination of
calcium (Ca) and phosphorus (Pi) in the saliva solution, subtraction images, cross-
sectional hardness test and polarized light microscopy were used as evaluation
methods. The concentrations of Ca and Pi in the saliva after the treatments were
significantly lower (p<0.05) than the original solution and digital subtraction showed
differences between the images. However, the hardness test and polarized light
microscopy did not detect any changes.

����������������������� �� ������������������������������������������������������������������������������ ����
���������
14
Introduction
Caries initiation is associated with demineralization of subsurface tooth enamel.
Calcium and phosphate are lost from the surface enamel, resulting in the formation
of a subsurface lesion. At this early stage, the caries lesion is reversible via a
remineralization process involving the diffusion of calcium (Ca) and phosphorus
(Pi) ions into the subsurface lesion to restore lost structure. This remineralization
phenomenon, using calcium phosphate solutions only or with additional fluoride (F)
treatment, has been shown to exist [Ingram & Edgar, 1994]. Fluoride, in its several
forms, has been an outstanding means of preventing caries. Indeed,
remineralization is possible even at a high degree of initial mineral loss, where it
might have been considered that the caries process had passed a “point of no
return” [ten Cate, 2001; Mukai & ten Cate, 2002].
A wide range of techniques have been used to measure the changes
occurring in dental tissue, including tests to quantify changes in physical properties
such as hardness test, changes in chemical composition, or polarized light
microscopy [Argenta et al., 2003; Ganss et al., 2005]. In addition, when two
radiographs are recorded with controlled projection angles and then subtracted,
theoretically all unchanged anatomical background structures are cancelled, and
these areas are displayed in a neutral grey shade in the subtraction image; regions
that have changed between the radiographic examinations are displayed in darker
(loss) or lighter (gain) shades of gray. For the detection of caries and monitoring of
remineralization therapy, digital subtraction images have made possible the careful
analysis of time lapse radiographs [Wenzel & Halse, 1992; Halse et al., 1994].
The aim of the current study was to compare an in vitro methodology using
two protocols of dental enamel remineralization by exposure to calcifying and F
fluids. The evaluation methods used were: chemical analysis, cross-sectional
hardness test, polarized light microscopy and digital subtraction images.

����������������������� �� ������������������������������������������������������������������������������ ����
���������
15
Materials and Methods
Tooth preparation and lesion formation
One hundred previously extracted impacted third molars were sterilized by storage
in 10% buffered formalin solution (pH 7.0) for 7 days [Dominici et al., 2001]. They
were rinsed off with deionized water and mounted in an individual acrylic resin
base, except the crowns, giving the teeth a good stability for the radiographs. A
piece of aluminum was also inserted in the acrylic base for use as reference points
during alignment of the radiographs. The crowns were then coated with nail
varnish, except for an exposed window on one of the proximal surfaces of about 7
mm2. Artificial caries-like lesions were induced by immersion of each tooth in 14 ml
of a demineralizing solution, containing 0.05 M acetate buffer, 1.3 mM Ca, 0.77
mM Pi and 0.03 ppm F (pH 4.8) at 37 °C, for 75 days [Haiter-Neto et al., 2005].
After 60 days of incubation, the demineralizing solution was changed in order to
avoid Ca and Pi saturation.
Remineralization of artificial caries-like lesions
After the demineralizing process, 20 teeth were kept as controls. The remaining 80
teeth were randomly assigned into four groups (n=20), subjected to two different
experimental protocols for 4 and 8 weeks. Protocol A involved continuous
remineralization in an artificial saliva solution, and protocol B was as for protocol A
with additional treatment with F. The artificial saliva solution contained 1.5 mM Ca,
0.9 mM Pi, 150 mM KCl in a buffer solution of 20 mM tris (hydroxymethyl)-
aminomethane at pH 7.0 [Featherstone et al., 1986; Serra & Cury, 1992]. The
specimens were individually placed in 7 ml of artificial saliva solution, which was
changed every week, and kept at 37 °C. Three times a day the specimens from
protocol B were taken out of the saliva solution, rinsed with deionized water and
placed, individually, in 7 ml of a F solution for 5 min at 150 rpm of agitation (TE-
140®,Tecnal Equipment, São Paulo, Brazil). The F solution contained 280 ppm F
(NaF) to simulate the dilution that occurs in the oral cavity when fluoridated

����������������������� �� ������������������������������������������������������������������������������ ����
���������
16
toothpaste (1100 µg F/g) is used [Duke & Forward, 1982]. The specimens were
then taken out of the F solution, rinsed with deionized water and replaced in the
original artificial saliva solution.
Analysis
The artificial saliva solution, which was replaced every week, was chemically
analyzed to determine the concentrations of Ca and Pi in the fresh solution and
during the experimental protocols. Phosphorus concentration was determined
using a colorimetric method [Fiske & Subbarow, 1925]. The concentration of Ca
was determined by atomic absorption spectrophotometry, using lanthanum to
suppress phosphate interference [Cury et al., 2003].
Radiographs were taken prior to and after the remineralization period. GE
1000® X-ray equipment (General Electric Co., Milwaukee, WI, USA) was used
operating at 65 kVp, 10 mA and 0.25 s with DIGORA OpTime® (Orion
Corp./Soredex, Helsinque, Finland) photostimulable storage phosphor plates. An
acrylic device was also used to standardize the relationship among the teeth, the x-
ray beam indicator device and the image receptors in a reproducible way. In
addition, 2.5 cm thick acrylic was positioned in front of the tooth to simulate the soft
tissues [Haiter-Neto et al., 2005]. The images were manipulated using
EMAGO®/advanced 5.0.12 software (Oral Diagnosis Systems, Amsterdan, The
Netherlands) and digital subtraction images were obtained.
The enamel areas were submitted to cross-sectional hardness analysis.
The crowns were separated from the roots and cut in half vertically through the
centre of the test areas. Half of each crown was embedded in methylmethacrylate
resin so that the cut section of the test area and the underlying normal enamel
were exposed. This surface was then serially polished. The hardness profile of
each lesion was measured across three positions located at a quarter, half and
three-quarters of the width of the lesion, starting at 10 µm from the enamel surface.
Indentations were made with the long axis of the diamond parallel to the outer
enamel surface, in a total of 18 indentations across the lesion and into the

����������������������� �� ������������������������������������������������������������������������������ ����
���������
17
underlying sound enamel, with 25 g load for 5 s. The values of Knoop hardness
number (KHN) were converted to mineral content (volume % mineral) using the
relation: mineral content=4.3(�KHN)+11.3 [Featherstone et al., 1983]. The data set
representing each artificial carious lesion (in each enamel block) was fitted to a
curve. The area under the lesion tracing was calculated by means of the
trapezoidal rule (in units of volume % mineral x micrometers), and subtracted from
the normal enamel value to give the mineral loss area (parameter �Z)
[Featherstone & Zero, 1992].
After the cross-sectional hardness analysis, the embedded enamel blocks
were sectioned in order to obtain longitudinal slices of 100 µm (±10 µm). These
sections were mounted for examination under a polarizing light microscope at 5x
magnification (DMLSP, Leica, Wetzlar, Germany). Digital images were obtained
with specific software (Image-Pro Plus, Media Cybernetics, Silver Spring, MD,
USA).
The digital images from the polarizing light microscopy and the digital
subtraction images were visually inspected by one of the researchers (J.A.B.C.), by
direct comparison of the treatment groups with the control demineralization group
and the presence of an increased density, respectively. SAS statistical software
was used to conduct the statistical analysis of the inorganic concentration in the
saliva and hardness data. Independent group two-way ANOVA and Dunnet’s test
were performed to ascertain if there were differences between the two treatment
groups, and differences between the treatment groups and the demineralization
control group, respectively.
Results
The inorganic concentration of the artificial saliva solution, during and after the
remineralization period, demonstrated that the enamel incorporated Ca and Pi. A
mean reduction of 19% and 21% in Ca concentration per week in the artificial
saliva solution was observed in protocol A at 4 and 8 weeks, respectively; and for

����������������������� �� ������������������������������������������������������������������������������ ����
���������
18
protocol B the reduction was 43% and 40%. The reduction in Pi concentration was
28% and 26% in protocol B (table 1). Dunnet’s test showed that the concentration
of Ca and Pi in the artificial saliva solution after treatments differed significantly
from the original solution in all groups, except Pi in protocol A. Using ANOVA, a
comparison between the periods (4 and 8 weeks) and the protocols (A and B) was
also conducted, and the differences between them were significant (p<0.05). In
protocol B, independent of the time used, lower values of Ca concentration were
demonstrated compared to protocol A, suggesting higher incorporation by the
enamel; the same pattern was observed for Pi.
Differences in density could be observed by direct visual comparison of
the digital radiographs taken before and after both remineralization protocols and
periods of time, confirmed by an increased density (lighter area) shown on the
subtraction images (figure 1). The magnitude of the recorded alterations varied
from barely visible to quite pronounced in a mean of 7 out of the 20 teeth in all
groups.
In the mineral loss analysis, there were no statistically significant
differences between the groups. In addition, the difference between the
remineralization groups and the demineralization control group was not statistically
significant. From the absolute values, it can be observed that there is a slightly
higher mineral loss area (�Z) in the demineralization group. Similarly, the digital
images from polarizing light microscopy did not demonstrate visual differences
between the remineralization groups and the demineralization control group (figure
2).
Discussion
The demineralization protocol used in the present study has been successfully
evaluated before by Haiter-Neto et al. [2005], who showed that mineral loss can be
detected by digital subtraction. Third molars were immersed in a demineralizing
solution for 60, 75, 90 and 120 days in order to induce subsurface
����������������������� �� ������������������������������������������������������������������������������ ����
���������
19
demineralization. In this study, the period of 75 days was chosen, based on a pilot
study; after this period, demineralization was radiographically visible although not
as deep as after longer periods.
The remineralization process evaluated in this study was validated by the
decrease in the concentrations of Ca and Pi in the artificial saliva solution after
treatments [Al-Khateeb et al., 1997]. Fluoride ions were able to enhance the
percentage of mineral content gained per week, i.e. in protocol B a better recovery
of the mineral content of the pre-formed lesions was obtained [ten Cate et al.,
1985; Yamazaki et al., 2007]. Huysmans & Longbotton [2004] reported that if one
considers the definition of caries progress as de/remineralization imbalance
leading to net mineral loss, it seems most logical to take mineral content as the
preferred parameter to follow this imbalance.
During recent years, digital subtraction images have been established as a
sensitive technique for the detection of small changes in density [Maggio et al.,
1990]. In this study, digital radiographs of the same specimens before and after the
treatment were subtracted and the differences were visualized as lighter shades of
grey, suggesting a mineral gain. However, it could be observed on conventional
digital images that the carious-like lesions did not recovery completely; the
presence of radiolucency was still noted in all treatment groups.
Hardness measurements have been considered to be a valuable method
that reflects physical changes of acid-softened surfaces [Fujimaru et al., 2003].
However, Ganss et al. [2005] stated that with increasing exposure to acids,
hardness decreases to a minimum, whereas the dissolution of mineral increases
further; so this method is limited to the initial stages of erosion. Based on this
concept, it seems that in this study, the mineral loss area (�Z) of the treatment
groups could not reach significance compared to the control demineralization
group, because of the relatively deeper lesions necessary for this study. Thus, a
complete or almost complete re-hardening of the lesion did not occur. In addition,
the images from polarized light microscopy did not demonstrate any difference

����������������������� �� ������������������������������������������������������������������������������ ����
���������
20
between the experimental groups and the demineralizing control group. Hardness
and polarized light measurements of the mineral contents of the same lesion area
before and after the treatment regimen were not possible as these are destructive
analyses. Nevertheless, a control group of a relatively favorable sample size
required for comparison was used in this study, and it must be pointed out that
each tooth may behave uniquely, even though selection criteria were applied.
Greater remineralization could possibly be achieved by using a longer
term remineralization protocol [ten Cate, 2001] and/or reducing solution pH [Alves
et al., 2007]. In the present study, the 8-week remineralization period seemed to be
too short for a significant mineral gain, ten Cate [2001] presented a simple
mechanistic model of remineralization, where either diffusion or precipitation is
considered as the ‘rate-limiting’ step. Care has to be taken to provide a protocol of
‘slow’ precipitation, leading to a constant concentration of calcium and phosphate
within the pores. The rate of mineral deposition also depends on local factors like
pH, the presence of seed crystals or matrix, and the surface area available for
crystal growth. A remineralization solution with low pH may be a good option to test
in a future study.
This in vitro experiment concluded that although the dosages of Ca and Pi
in the artificial saliva showed differences between the groups, suggesting mineral
gain, this was not detected in the evaluation of cross-sectional hardness and
polarized light microscopy. Mineral gain could also be observed in the digital
subtraction images, providing a method to longitudinally monitor the
remineralization of incipient proximal carious lesions; the accuracy of this method
should be the next step to be tested.
Acknowledgements
The authors acknowledge Waldomiro Vieira Filho for laboratory assistance and
Prof. Drª Gláucia Maria Bovi Ambrosano for statistical analysis. This study was
supported by FAPESP (proc. 05/52220-8).

����������������������� �� ������������������������������������������������������������������������������ ����
���������
21
References
Al-Khateeb S, ten Cate JM, Angmar-Mansson B, de josselin de jong E, Sundstrom G,
Exterkate RAM, Oliverby A: Quantification of formation and remineralization of
artificial enamel lesions with a new portable fluorescence device. Adv Dent
Res 1997; 11: 502-506.
Alves KMRP, Pessan JP, Brighenti FL, Franco KS, Oliveira FAL, Buzalaf MAR,
Sassaki KT, Delbem ACB: In vitro evaluation of the effectiveness of acid
fluoride dentiflrices. Caries Res 2007; 41: 263-267.
Argenta RMO, Tabchoury CPM, Cury JA: A modified ph-cycling model to evaluate
fluoride effect on enamel demineralizarion. Pesqui Odontol Bras 2003; 17:
241-246.
Cury JA, Marques AS, Tabachoury CPM, Del Bel Cury AA: Composition of dental
plaque formed in the presence of sucrose and after its interruption. Braz Dent
J 2003; 14: 147-152.
Dominici JT, Eleazer PD, Clark SJ, Staat RH, Scheetz JP:
Desinfection/Sterilization of extracted teeth for dental student use. J Dent
Educ 2001; 65: 1278-1280.
Duke SA, Forward GC: The conditions occurring in vivo when brushing with
toothpastes. Br Dent J 1982; 152: 52-54.
Featherstone JDB, ten Cate JM, Shariati M, Arends J: Comparison of artificial
caries-like lesions by quantitative microradiography and microhardness
profiles. Caries Res 1983; 17: 385-391.
Featherstone JDB, O’Reilly MM, Shariati M, Brugler S: Enhancement of
remineralization in vitro and in vivo. in Leach SA (ed); Factors affecting de-
and remineralization of teeth. Oxford, IRL Press 1986; 23-34.

����������������������� �� ������������������������������������������������������������������������������ ����
���������
22
Featherstone JDB, Zero DT: An in situ model for simultaneous assessment of
inhibition of demineralization and enhancement of remineralization. J Dent
Res 1992; 71(special issue): 804-810.
Fiske CM, Subbarow Y: The colimetric determination of phosphorus. J Biol Chem.
1925; 66: 375-400.
Fujimaru T, Ishizaki T, Hayman RE, Nemoto K: 0519 Microhardness testing to
evaluate remineralization of tooth enamel. J Dent Res 2003; 82 (spec iss B):
B77.
Ganss C, Lussi A, Klimek J: Comparison of calcium/phosphorus analysis,
longitudinal microradiography and profilometry for quantitative assessment of
erosive demineralisation. Caries Res 2005; 39: 178-184.
Haiter-Neto F, Ferreira RI, Tabchoury CPM, Bóscolo FN: Linear and logarithmic
subtraction for detecting enamel subsurface demineralization.
Dentomaxillofac Radiol 2005; 34: 133-139.
Halse A, Espelid I, Tveit AB, White SC: Detection of mineral loss in approximal
enamel by subtraction radiography. Oral Surg Oral Med Oral Pathol 1994; 77:
177-182.
Huysmans MC, Longbottom C: The challenges of validating diagnostic methods
and selecting appropriate gold standards. J Dent Res 2004; 83(Spec Iss C):
C48-C52.
Ingram GS, Edgar WM: Interaction of fluoride and non-fluoride agents with the
caries process: Adv Dent Res 1994; 8: 158-165.
Maggio JJ, Hausmann EM, Allen K, Potts TV: A model for dentinal caries
progression by digital subtraction radiography. J Prostht Dent 1990; 64: 727-
32.
Mukai Y, ten Cate JM: Remineralization of advanced root dentin lesions in vitro.
Caries Res 2002; 36: 275-280.

����������������������� �� ������������������������������������������������������������������������������ ����
���������
23
Serrra MC, Cury JA: The in vitro effect of glass-ionomer cement restouration on
enamel subjected to a demineralization and remineralization model.
Quintessence Int 1992; 23: 143-147.
ten Cate JM, Shariati M, Fetatherstone JDB: Enhancement of (salivary)
remineralization by ‘dipping’ solutions. Caries Res 1985; 19: 335-341.
ten Cate JM: Remineralization of caries lesions extending into dentin. J Dent Res
2001; 80: 1407-1411.
Wenzel A, Halse A: Digital subtraction radiography after stannous fluoride
treatment for occlusal caries diagnosis. Oral Surg Oral Med Oral Pathol 1992;
74: 824-828.
Yamazaki H, Litman A, Margolis HC: Effect of fluoride on artificial caries lesion
progression and repair in human enamel: Regulation of mineral deposition
and dissolution under in vivo-like conditions. Arch Oral Biol 2007; 53: 110-
120.

����������������������� �� ������������������������������������������������������������������������������ ����
���������
24
Legends
Figure 1.
A subtraction image of a tooth presented to protocol B, after 4 weeks of
remineralization. In the zoom image (indicated by the arrow), increased density
(lighter area) on the lesion area and also lighter areas of structural noise can be
seen.
Figure 2.
Polarized light microscope digital images of one tooth on each group: A, control
group; B, protocol A after 4 weeks; C, protocol A after 8 weeks; D, protocol B after
4 weeks; E, protocol B after 8 weeks.

����������������������� �� ������������������������������������������������������������������������������ ����
���������
25
Figures
Figure 1.

����������������������� �� ������������������������������������������������������������������������������ ����
���������
26
Figure 2

����������������������� �� ������������������������������������������������������������������������������ ����
���������
27
Table
Table 1. Calcium and inorganic phosphorus concentration (mM) in artificial saliva solution and mineral loss area ( �Z; mean ± Standard deviation (SD)) of protocol A (continuous remineralization) and protocol B (continuous remineralization + fluoride treatment) after 4 and 8 weeks (n=20).
Protocols Variables Time
(weeks) A B
Calcium 4 1.38 ± 0.04 * Aa 0.98 ± 0.09* Bb
8 1.34 ± 0.05 * Ab 1.02 ± 0.04* Ba
Phosphorus 4 0.85 ± 0.02 Ab 0.62 ± 0.05* Bb
8 0.86 ± 0.02 Aa 0.64 ± 0.03* Ba
Mineral loss 4 5907.2 ± 1054.9 Aa 6132.2 ± 1147.8 Aa
8 6082.9 ± 1303.5 Aa 5883.2 ± 1087.8 Aa
Mean (mM ) ± SD of calcium and phosphorus concentration of the original artificial saliva solution = 1.69 ± 0.05 and 0.86 ± 0.01, respectively. Mean (�Z) ± SD of mineral loss area of the demineralization group (n=20) = 6299.9 ± 1463.9 * Statistically different from the concentration in the original solution by Dunnet’s test (p<0.05). Means with the same letter are not significantly different by ANOVA test, comparing capital letters in the row and small letters in the column (p < 0.05)

����������������������� �� ������������������������������������������������������������������������������ ����
��������
28
CAPÍTULO 2
TITLE PAGE
Title of the paper:
Comparative study of different techniques to
quantify dental enamel remineralization
Juliana A Bittar-Cortez a, Cínthia P M Tabchoury b, Francisco H Nociti-Junior c,
Francisco Haiter-Neto a
a Oral Diagnosis Department, Oral Radiology Division, Piracicaba Dental School,
State University of Campinas, São Paulo, Brazil. b Physiological Science Department, Biochemistry Division, Piracicaba Dental
School, State University of Campinas, São Paulo, Brazil. c Prosthodontics and Periodontics Department, Periodontics Division, Piracicaba
Dental School, State University of Campinas, São Paulo, Brazil.
Short title: Quantification of dental enamel remineralization
Key Words: Digital radiography, Subtraction images, Remineralization
Corresponding author: Francisco Haiter Neto, Piracicaba Dental School/State
University of Campinas. Limeira Avenue, 901, Zip Code: 13.414-903, Piracicaba,
SP, Brazil; Phone: 55 19 2106 5327; Fax: 55 19 2106 53 18. E-mail:
����������������������� �� ������������������������������������������������������������������������������ ����
��������
29
Abstract
The objective of this study was to compare Calcium (Ca)/Phosphorus (Pi) analysis,
mineral loss area calculated from cross-section hardness test, and density
measurements in polarized light microscope (PLM) and digital subtraction images
to quantify in vitro protocols of dental enamel remineralization. Third molars
samples were subjected to two different remineralization protocols for 4 and 8
weeks. Remineralization of each sample was estimated by the five methods. Ca/Pi
analysis and density measurements in PLM images revealed statistically significant
difference between the protocols. Ca and Pi analysis was also highly associated in
all treatment groups, indicating that it was the most sensitive method to
quantitatively monitor mineral changes on dental enamel.

����������������������� �� ������������������������������������������������������������������������������ ����
��������
30
Introduction
A carious lesion and remineralization is not a well-defined radiolucency as the
degree of calcification decrease/increases towards the periphery of the lesion.
Thus, measurements of the extent of a carious lesion and monitoring of
remineralization are difficult to perform accurately [Eberhard et al., 2000].
Progression of in vitro decalcification has been evaluated and quantified by
microradiography, polarized light microscopy, light microscopy using stain
reagents, hardness measurements, calcium / phosphorus analysis and subtraction
radiography. The use of quantitative image comparison and image analysis
promises to give even more information on this process [Klinger & Wiedmann,
1985].
There is a need for methods that can monitor remineralization and mineral
status and also be correlated, to have better comparison of in vitro, in situ and in
vivo studies results, using similar experimental settings. A method meeting all
requirements should be suitable to allow sequentional measurements and be
quantitative for mineral loss as well as mineral gain. Ganss et al. [2005] related
erosive mineral loss values as measured by four different methods: calcium
analysis, phosphorus analysis, surface profilometry and longitudinal
microradiography, a good linear correlation was found between these methods.
The objective of this investigation was to compare calcium (Ca) / phosphorus
(Pi) analysis, mineral loss area calculated from cross-section hardness test, and
density measurements in polarized light microscope and digital subtraction images
on the quantitative assessment of mineral changes in an in vitro model, which
closely simulate natural enamel remineralization.
Materials and Methods
From an in vitro remineralization study, eighty samples were used. The protocol
used has been published earlier and is summarized here. Previously extracted
third molars were selected, mounted in an individual acrylic resin base; the crowns

����������������������� �� ������������������������������������������������������������������������������ ����
��������
31
were coated with nail varnish, except for an exposed window on one of the
proximal surfaces of about 7 mm2. Then, they were individually immersed in a
demineralizing solution for 75 days [Haiter-Neto et al., 2005]. After the
demineralizing process, the 80 samples were randomly assigned in four groups
(n=20), subjected for 4 and 8 weeks to two different experimental protocols, being
either continuous remineralization in artificial saliva solution or remineralization with
additional treatment with Fluoride (F).
Chemical analysis was determined in the artificial saliva solution during the
remineralization process. Calcium (Ca) concentration was determined by atomic
absorption spectrophotometry, which was performed in the presence of lanthanum
to suppress phosphate interference. The solution was also analyzed for
phosphorus (Pi) concentration by a colorimetric method [Fiske & Subbarow, 1925].
Digital radiographs were taken prior to and after remineralization period with
DIGORA OpTime® (Orion Corp./Soredex, Helsinque, Filand) photostimulated
storage phosphor (PSP) plates. An acrylic device was used to standardize the
relationship among teeth, x-ray bean indicator device and image receptor in a
reproducible way. At this time, the images were not manipulated and they were
stored as tagged image file format (TIFF). By EMAGO® / advanced 5.0.12 software
(Oral Diagnosis Systems, Amsterdan, the Netherlands), digital subtraction image
(DSI) were obtained for each tooth. The method of subtraction used was the
advanced subtraction; that allowed a combination of reconstruction, gamma
correction and linear subtraction, i.e. the interactive software which transposed the
two images, translated one image with respect to the other, automatically
calibrates the gray levels, and then performed a subtraction in real time.
Afterwards, the enamel area was submitted to cross-sectional hardness (CH)
analysis. The crowns were separated from the roots and cut in half vertically
through the centre of the test areas. The halves of each crown were embedded in
methylmethacrylate resin so that the cut section of the test area and the underlying
normal enamel were exposed. This surface was then serially polished. The
hardness profile on each lesion was measured across three positions located at ¼,

����������������������� �� ������������������������������������������������������������������������������ ����
��������
32
½ and ¾ of the width of the lesion, starting at 10 µm from the enamel surface.
Indentations were made with the long axis of the diamond parallel to the outer
enamel surface, in a total of 18 indentations across the lesion and into the
underlying sound enamel, with 25 g load for 5 s. The values of knoop hardness
number (KHN) were converted to mineral content (volume % mineral) using the
relation: mineral content = 4.3 (�KHN) + 11.3 [Featherstone et al., 1983]. The data
set representing each artificial carious lesion (in each enamel block) was fitted to a
curve. The area under the lesion tracing was calculated by means of the
trapezoidal rule (in units of volume percent mineral x µm), and subtracted from the
normal enamel value to give the mineral loss area (parameter �Z) [Featherstone &
Zero, 1992].
After the cross-sectional hardness analysis, the embebbed enamel blocks
were sectioned in order to obtain longitudinal slices of 100 µm (± 10). These
sections were mounted for examination under a polarizing light microscope (PLM)
at 10 x magnification (DMLSP, Leica, Wetzlar, Germany). Digital images were
captured with specific software (Image-Pro Plus, Media Cybernetics, Silver Spring
USA), stored as TIFF, black and white 8 bit format.
The mean density value of selected regions of interest (ROI) in DSI and PLM
images were also obtained by EMAGO® / advanced 5.0.12 software (Oral
Diagnosis Systems, Amsterdan, the Netherlands). The histogram command was
used to assess the mean density value of three ROI enclosing the proximal lesion
area and three ROI in sound enamel. The average of the three ROI in the lesion
and in the sound enamel was subtracted and the difference was used as a
parameter for the density change occurring in the DSI and in the PLM image.
Correlation coefficients of Pearson were calculated for the concentration of Ca
and Pi, the mineral loss area (�Z) from the cross-section hardeness test, and the
mean density value differences of the histogram from DSI and PLM images. Also,
Independent group two-way ANOVA was performed to ascertain if there were
differences between the remineralization protocols in all five evaluated methods.

����������������������� �� ������������������������������������������������������������������������������ ����
��������
33
Results
Table 1 shows the r coefficient of Pearson value off all correlated methods,
indicating the strengths of associations between them in each protocol and period
of time. The correlation between Ca and Pi analysis were high and extremely
significant in all groups. The mean density value difference of the histogram in the
PLM image was also significantly correlated to Ca and Pi analysis, and to cross-
section hardness test, only in protocol B / 8 weeks and protocol A / 4 weeks,
respectively.
By ANOVA a comparison between the periods (4 and 8 weeks) and the
protocols (continuous remineralization in artificial saliva solution or remineralization
with additional treatment with F) did not reveal statistically significant difference in
all evaluated methods, except for the Ca and Pi analysis (that has been given in a
different publication) and the mean density difference of the histogram in PLM
images (Table 2).
Discussion
The protocols used in this study produced a dental enamel remineralization
mimicking the radiographic appearance of proximal lesions quite well. However the
progression of this treatment could not be well monitored, quantitatively, by the
mean density value of the histogram in DSI; the method failed to reveal differences
between the two remineralization protocols. These results are consistent with the
findings of Eberhard et al. [2000] who studied a density method of reducing
demineralization in 14 extracted human teeth, and the subtraction images failed to
reveal statistically significant grayscale changes between a control method and a
method of remineralization.
The measurement of the mean pixel value by the histogram as a parameter of
quantitatively measuring the mean density value of selected ROI has been widely
used and is an important aspect of digital imaging, providing a means to make
precise and reliable diagnoses that were not possible in the past. This method can

����������������������� �� ������������������������������������������������������������������������������ ����
��������
34
be applied to conventional radiography and subtraction images [Bittar-Cortez et al.,
2006]. The calculation of the mean density value was limited, in this study, to
subtraction images; the reason for that is the small size of the proximal lesions that
in conventional radiography cannot be well determined.
In this study, this method of calculating the mean density value in selected
ROI was also tested in PLM images. Although the method did not correlate equally
in all remineralization protocols, interpretation of the results must therefore take
into consideration that the absolute values differences in the mean density value in
the PLM images (table 2) demonstrated statistically significant lower values when F
was used, i.e. the mean density value of the lesion where closer to the values of
the sound enamel. Thereby, the introduced method of measuring mean density
value by the histogram in PLM images might facilitate the detection of longitudinal
monitoring of artificial caries-like lesions.
Cross-section hardness analysis could not detect differences between the
remineralization protocols, i.e. that the indentations measurements could not reflect
the difference of mineral gained in the four treatment groups. This could be
expected to a certain extent, since there are statements that this method is limited
to only initial stages of erosion [Ganss et al., 2005], on the other hand, Haiter-Neto
et. al. [2005] have used the CH test as a validation method of the true absence or
presence of enamel subsurface demineralization of lesion varying from 230 to 410
µm, and the method was able to detect differences between the periods of
demineralization.
Results from Ca and Pi analysis showed a strong correlation, which is similar
to the findings of a study assessing methods of erosive mineral loss [Ganss et al.,
2005]. The chemical analysis and density values in PLM images were also the only
methods capable of distinguishing between the two remineralization protocols.
Different result was found by Eraso et al. [2007], where a linear relationship
between subtraction units and calcium loss was obtained.

����������������������� �� ������������������������������������������������������������������������������ ����
��������
35
Within the limitation of this in vitro study, it was concluded that the chemical
analysis is the best method to determine differences between remineralization
protocols, however the mean pixel value measured by the histogram in ROI,
appears to be an alternative for monitoring remineralization protocols.
Acknowledgements
This study was supported by FAPESP (proc. 05 / 52220-8).

����������������������� �� ������������������������������������������������������������������������������ ����
��������
36
References
Bittar-Cortez JA, Passeri LA, Bóscolo FN, Haiter-Neto F: Comparison of hard
tissue density changes around implants assessed in digitized conventional
radiographs and subtraction images. Clin Oral Implants Res 2006; 17(5): 560-
4.
Eberhard J, Hartman B, Lenhard M, Mayer T, Kocher T, Eickholz P: Digital
subtraction radiography for monitoring dental demineralization. Caries Res
2000; 34: 219-224.
Eraso FE, Parks ET, Roberts WE, Hohlt WF, Ofner S: Density value means in the
evaluation of external apical root resorption: an in vitro study for early
detection in orthodontic case simulations. Dentomaxillofac Radiol 2007; 36:
130-137.
Featherstone JDB, ten Cate JM, Shariati M, Arends J: Comparison of artificial
caries-like lesions by quantitative microradiography and microhardness
profiles. Caries Res 1983; 17: 385-391.
Featherstone JDB, Zero DT: An in situ model for simultaneous assessment of
inhibition of demineralization and enhancement of remineralization. J Dent
Res 1992; 71(special issue): 804-810
Fiske CM, Subbarow Y: The colimetric determination of phosphorus. J Biol Chem.
1925; 66: 375-400.
Ganss C, Lussi A, Klimek J: Comparison of calcium/phosphorus analysis,
longitudinal microradiography and profilometry for quantitative assessment of
erosive demineralisation. Caries Res 2005; 39: 178-184.
Haiter-Neto F, Ferreira RI, Tabchoury CPM, Bóscolo FN: Linear and logarithmic
subtraction for detecting enamel subsurface demineralization.
Dentomaxillofac Radiol 2005; 34: 133-139.

����������������������� �� ������������������������������������������������������������������������������ ����
��������
37
Klinger HG, Wiedmann W: A method for radiographic longitudinal study of mineral
content during in-vitro demineralization and remineralization of human tooth
enamel. Archs Oral Biol 1985; 30: 373-375.

����������������������� �� ������������������������������������������������������������������������������ ����
��������
38
Tables
Table 1. Coefficient of Pearson r (p-value) off all correlated techniques.
Protocol /
Period Techniques Pi CH PLM DSI
Calcium analalysis (Ca) 0.603 (p=0.005)
0.217 (p=0.354)
0,366 (p=0.112)
0.021 (p=0.929)
Phosphorus analysis (Pi) 1 -0.269 (p=0.251)
-0,013 (p=0.957)
-0.241 (p=0.305)
Cross-section hardness (CH) 1 0.730 (p=0.000)
0.374 (p=0.105)
A /
4 weeks
Polarized light microscope (PLM) 1 0,176 (p=0.458)
Calcium analalysis (Ca) 0.675 (p=0.002)
-0.122 (p=0.619)
0.190 (p=0.435)
-0.128 (p=0.601)
Phosphorus analysis (Pi) 1 -0.028 (p=0.910)
0.086 (p=0.726)
-0.281 (p=0.244)
Cross-section hardness (CH) 1 0.039 (p=0.878)
0.055 (p=0.822)
A /
8 weeks
Polarized light microscope (PLM) 1 -0.306 (p=0.203)
Calcium analalysis (Ca) 0.924 (p=0.000)
-0.247 (p=0.295)
0.102 (p=0.668)
-0.112 (p=0.628)
Phosphorus analysis (Pi) 1 -0.209 (p=0.375)
0.008 (p=0.972)
0.022 (p=0.927)
Cross-section hardness (CH) 1 -0.115 (p=0.630)
0.090 (p=0.705)
B /
4 weeks
Polarized light microscope (PLM) 1 -0.413 (p=0.070)
Calcium analalysis (Ca) 0.918 (p=0.000)
0.048 (p=0.841)
-0.607 (p=0.005)
0.125 (p=0.600)
Phosphorus analysis (Pi) 1 -0.194 (p=0.411)
-0.635 (p=0.003)
0.017 (p=0.944)
Cross-section hardness (CH) 1 -0.061 (p=0.795)
0.338 (p=0.145)
B /
8 weeks
Polarized light microscope (PLM) 1 -0.337 (p=0.146)
Level of significance was set at 5 %

����������������������� �� ������������������������������������������������������������������������������ ����
��������
39
Table 2. Differences in the mean density value of the histogram ± standard
deviation in the DSI and PLM images of protocol A (continuous
remineralization) and protocol B (continuous remineralization + fluoride
treatment) after 4 and 8 weeks (n=20).
Protocols Methods
Period
(weeks) A B
4 15.14 ± 6.79 Aa 18.54 ± 6.70 Aa Density in DSI
8 17.78 ± 7.53 Aa 16.87 ± 6.53 Aa
4 136.63 ± 23.14 Aa 122.79 ± 21.29 Ba Density in PLM images
8 141.85 ± 25.26 Aa 126.70 ± 26.10 Ba
Means with the same letter are not significantly different by ANOVA test, comparing capital letters in the row and small letters in the column (p < 0.05)

����������������������� �� ������������������������������������������������������������������������������ ����
��������!
40
CAPÍTULO 3
TITLE PAGE
Title of the paper:
In vitro comparison of digital and subtraction images
for approximal artificial caries-like lesions and mineral
changes diagnostic accuracy
Juliana A Bittar-Cortez a
Cínthia P M Tabchoury b
Francisco H Nociti-Junior c
Francisco Haiter-Neto a
a Oral Diagnosis Department, Oral Radiology Division, Piracicaba Dental School,
State University of Campinas, São Paulo, Brazil. b Physiological Science Department, Biochemistry Division, Piracicaba Dental
School, State University of Campinas, São Paulo, Brazil. c Prosthodontics and Periodontics Department, Periodontics Division, Piracicaba
Dental School, State University of Campinas, São Paulo, Brazil.
Short title: Digital and subtraction images in mineral changes diagnosis
Key Words: Digital radiography, Subtraction images, Remineralization, Image
processing, Diagnosis
Corresponding author: Francisco Haiter Neto, Piracicaba Dental School/State
University of Campinas. Limeira Avenue, 901, Zip Code: 13.414-903, Piracicaba,
SP, Brazil; Phone: 55 19 2106 5327; Fax: 55 19 2106 53 18. E-mail:

����������������������� �� ������������������������������������������������������������������������������ ����
��������!
41
Abstract
Considerable research during the past two decades has focused upon the
development of new technologies for the detection and monitoring of dental caries.
The purpose of the present study were twofold: to assess the feasibility of using
two different systems of digital radiography, photostimulable storage phosphor
(PSP) plate and complementary metal oxide semiconductor (CMOS) sensor, for
the diagnosis of approximal enamel demineralization; and the accuracy of digital
conventional radiographs (DCR) and three methods of digital subtraction images
(DSI): linear, advanced and logarithmic, to detect mineral changes on human
enamel in vitro. Artificial caries-like lesions on 100 approximal surfaces of extracted
third molars were produced. Eighty teeth were submitted to two different
remineralization protocols in two periods of time. Digital radiographs were taken
before and after the remineralization protocols. Five examiners assessed
demineralization and mineral changes caused by two remineralization protocols on
DCR placed side by side and three methods of DSI. Intra and inter-examiner
reliability Kappa statistics were calculated. Calcium/phosphorus analysis and the
placement of the teeth on the remineralization solution was the true state of
mineral gained. CMOS sensor was significantly more accurate than PSP plate,
using DCR on demineralization diagnosis, and using DCR and DSI on mineral
changes diagnosis. It was concluded that (a) CMOS sensor was more accurate
than PSP plate on the diagnosis of artificial caries-like lesions and mineral changes
monitoring; and (b) linear DSI can be a valuable method to disclose an intensity
increase, as a sign of mineral gained.

����������������������� �� ������������������������������������������������������������������������������ ����
��������!
42
Introduction
With the advent of remineralization therapies and the new, conservative approach
to restoration placement, interest in detecting and monitoring subclinical,
precavitaded lesions has increased. Nowadays, the caries preventive effect of
fluoride is without any doubt [Ingram and Edgar, 1994]. Fluoride has been shown
to actively affect the formation of lesions as well as their remineralization or
arrestment [Takagi et al., 2000; Lagerweij and ten Cate, 2002]. The increased
understanding of clinicians about the process of primary and secondary prevention
and detection of lesions, to which these therapies may be applied, is one of the
current goals in caries management.
Cariologists and clinicians are currently interested in the detection of early
carious lesions of the kind that can be reversed following fluoride or similar
interventions. Thereby, non-destructive methods for quantitatively investigating
progression (demineralization) or recovery (remineralization) of carious lesions in
enamel could be very useful to monitor the changes related to preventive
measures over time. Several techniques such as electrical resistance [Wang et al.,
2005], quantitative light-induced fluorescence [Pretty et al., 2003] and laser
fluorescence [Lussi et al., 2001] have been developed in recent years to measure
mineral changes on human enamel. However, there is still no generally accepted
method of measuring mineral changes over remineralization protocols [Wang et al.,
2005], especially in approximal surface lesions.
Digital radiographic systems, compared to conventional radiography,
shows possibilities for equally diagnostic accuracy of caries lesions [Wenzel 2006].
These systems also make easier the use of another digital imaging method, such
as digital subtraction images (DSI), that has been established as a sensitive
technique for the detection of small changes in hard tissues, and can also
represent an effective tool for the cariology community [Wenzel et al., 2000]. In the
diagnosis of proximal or occlusal demineralization, DSI was found to be more
accurate with higher values of sensibility [Haiter-Neto et al., 2005; Ricketts et al.,

����������������������� �� ������������������������������������������������������������������������������ ����
��������!
43
2007]. An increase of radiographic density in areas of occlusal and approximal
demineralization after the use of fluoride solution has been also disclosed by DSI
[Halse et al., 1990; Wenzel & Halse, 1992], but there was not a comparison of
different methods of subtraction images on mineral changes diagnosis.
The purpose of the present study were twofold: to assess the feasibility of
using two different equipments of digital radiography, DIGORA OpTime® (Orion
Corp./Soredex, Helsinque, Finlândia) PSP plate; and CDR Wireless® (Schick
Technologies, NY, USA), CMOS sensor, for diagnosis of approximal enamel
demineralization; and the accuracy of DCR and three methods of DSI (linear,
advanced and logarithmic) to detect mineral changes on human enamel in vitro.
The null hypothesis is that DCR is less accurate than DSI in mineral changes
detection of approximal artificial caries-like lesions. The technical description of the
remineralization methodology is outside the scope of this article.
Materials and Methods
Preparation of tooth
A detailed account of the materials and methods of sample preparation has been
given in a different publication. Therefore, only a relevant summary is provided
here.
Caries-like lesions were formed on one of the proximal surfaces in the
enamel of 100 extracted human molars by means of a pH 4.8 demineralizing
solution, for 75 days [Haiter-Neto et al., 2005]. Twenty teeth were kept as control
(demineralization group) and the remaining 80 teeth were randomly divided into
four groups (n=20) subjected for 4 and 8 weeks to two different experimental
protocols, being either continuous remineralization in an artificial saliva solution
(procedure A) or remineralization as for A with additional immersion in a fluoride
solution (procedure B). Chemical analysis of calcium (Ca) and phosphorus (Pi) in
the artificial saliva solution after the treatments demonstrated a mineral reduction,

����������������������� �� ������������������������������������������������������������������������������ ����
��������!
44
indicating that all 80 teeth have gained mineral. The protocol B obtained a higher
mineral reduction in the artificial saliva than in protocol A.
Before the demineralization, the teeth were mounted in individual acrylic
resin base, except the crowns, giving the teeth a proper stability to take the
radiographs. A peace of aluminum was also inserted in the acrylic base to be used
as reference points during alignment of longitudinal radiographs.
Radiographic Technique
Standardized radiographs were taken prior to and after remineralization period.
Two systems of digital radiographs were used: DIGORA OpTime® (Orion
Corp./Soredex, Helsinque, Filand) photostimulable storage phosphor (PSP) plate;
and CDR Wireless® (Schick Technologies, NY, USA), complemetary metal oxide
semiconductor (CMOS) sensor. A GE 1000® X-ray equipment (General Electric
Co., Milwaukee, WI, USA) was used operating at 65 kVp, 10 mA and 0.1 s for the
CMOS sensor and 0.25 s for the PSP plates. An acrylic device was used to
standardize the relationship between teeth, x-ray beam indicator device and image
receptors in a reproducible way. Additionally, 2.5 cm thick acrylic was positioned in
front of the tooth to simulate the soft tissues.
Digital subtraction images (DSI)
Before the subtraction procedure, the images were processed using ACDsee® 6.0
software (ACD systems Ltd, British Columbia, Canada) so as to duplicate the
images of the control demineralizing group and to resize the images obtained from
PSP plates. The original matriz size of the CMOS and PSP system was 640 x 900
and 372 x 604 pixels, respectively; hence, to make sure that the matriz size did not
have an effect on the results, the PSP images were resized to 572 x 929 pixels,
keeping the constrain aspect ratio.
Subtraction was conducted in EMAGO® / advanced 5.0.12 software (Oral
Diagnosis Systems, Amsterdan, the Netherlands). Three methods of DSI were
used: linear, logarithmic and advanced subtractions. The first and the second

����������������������� �� ������������������������������������������������������������������������������ ����
��������!
45
subtraction followed the normalization of the density of the two images (gamma
correction command), the creation of a geometric corrected image called
reconstruction image and the subtraction procedure. The third method is a
combination of reconstruction, gamma correction and linear subtraction, i.e., the
interactive software which transposed the two images, translated one image with
respect to the other, automatically calibrates the gray levels, and then performed a
subtraction in real time. Even with control of the exposure geometry, it was found
necessary to perform subpixel translations and small rotation of the images before
they were subtracted.
Image analysis
The data comprised eight digital radiography images of each tooth (80
remineralized approximal caries lesions and 20 control demineralized lesions):
DCR and linear, advanced and logarithmic DSI with both systems (CMOS and
PSP). In total, 800 digital images were coded and randomly organized and
transported in slide presentations (Microsoft Office Power-Point 2003® software,
Microsoft Corp., Redmond, WA). DCR were organized so that the corresponding
paired images could be viewed side by side. The presentation was viewed on a 17
inch monitor (Sansung) with a resolution of 1024 x 768 pixel and a grayscale of 0-
255, in two sections, by 5 radiologists. No adjustment of contrast and brightness
was performed by the examiners. Each presentation was viewed on separate
occasions to reduce examiner fatigue. All images were interpreted two times at
least 2 weeks apart for intra-examiner reliability. Written and verbal instructions
were given and samples images were shown of each modality to familiarize them
with the types of images to be evaluated.
The first DCR displayed on the monitor was recorded by the examiners as
follows: 1 = with demineralization, 0 = without demineralization. If it was decided
that demineralization was present, the second image appears and as all methods
of subtractions images the following decisions was made: 1 = increased intensity or
0 = no change. In the subtraction images, intensity increased (white areas) was

����������������������� �� ������������������������������������������������������������������������������ ����
��������!
46
interpreted as an indicator of the presence of mineral gained. The examiners were
unaware of the ratio between treatment teeth in the sample.
Statistical analysis
The Ca/Pi analysis and the placement of the teeth on the remineralization
solution [Ricketts et al., 2007] was the validation for the true state of mineral gained
in the approximal surface. Diagnostic accuracy was evaluated by the parameters of
sensitivity and specificity. For the evaluation of accuracy differences between the
methods of images and different remineralization protocols, McNemar’s test was
used to test this parameter. To evaluate intra and inter-examiner reliability Kappa
statistics were calculated.
Results
Figure 1 shows the DCR side by side and the corresponding linear, advanced and
logarithmic DSI of a remineralized tooth. The white area seen in the DSI indicates
that the radiolucency of this area has decreased, most likely due to the deposition
of minerals from the artificial saliva and fluoride solution. From the linear and
logarithmic subtractions, it is clear that mineral gain has taken place, as the image
on the approximal surface shows evidence of brighter subtraction shadow;
however, the advanced subtraction and DCR did not demonstrate an easer visible
intensity increase.
The demineralization diagnostic accuracy of DCR taken with PSP and
CMOS systems was compared, there was a statistically significant difference
(p=0.0011) between them, with a sensibility of 64% and 70%, respectively. The
outcome of the remineralization evaluation is summarized in table 1, the sensitivity,
specificity and accuracy values of the DCR and three methods of DSI with both
systems (CMOS and PSP) are listed. The overall diagnostic accuracy of the
methods in the detection of remineralization was higher for the CMOS system,
statistically significant, in all four methods of evaluation, and the linear subtraction
images were statistically more accurate than DCR, advanced and logarithmic DSI,

����������������������� �� ������������������������������������������������������������������������������ ����
��������!
47
by McNemar’s test. In addition, the PSP system also demonstrated higher values
of accuracy, statistically significant when the linear DSI were assessed.
The overall intra-examiner Kappa value was 0.62 (0.48 – 0.78) for CMOS
and 0.43 (0.26 – 0.60) for PSP systems, while the inter-examiner was 0.34 (0.15 –
0.55) and 0.32 (0.16 – 0.51) when the demineralization diagnostic accuracy was
assessed. While the intra and inter-examiner reproducibility, for mineral changes
diagnosis, was found to be 0.50 (0.44 – 0.56) and 0.35 (0.28 – 0.39) for the CMOS
system, and 0.60 (0.56 – 0.63) and 0.45 (0.40 – 0.52) for the PSP system,
respectively.
Two different protocols and periods of remineralization were used, in a
total of four groups, and it was noticed that the fluoride protocol obtained
statistically significant higher values of ascertain answers, indicating that the use of
F solution enhanced the diagnostic accuracy of mineral changes, independent of
the method of image used, by McNemar’s test (Table 2).
Discussion
The null hypothesis was not rejected; viewing paired DCR side by side and
subjectively interpreting them for remineralization was less accurate then DSI.
Thus mineral changes in approximal enamel are likely to be detected by
subtraction images before they would by viewing paired radiographs side by side.
The same outcome was achieved by Ricketts et al. [2007] when assessing
occlusal demineralization progression, where subtraction radiography was found to
be more accurate than visual assessment of paired digital images. Wenzel et al.
[1992] also compared intensity increase as a sign of occlusal caries in subtraction
radiography with the conventional radiolucency in film radiographs; however it was
concluded that although the subtraction method did not provide a higher sensitivity,
the intensity increase could be trusted more than traditional radiolucency as a sign
of dentinal lesion.

����������������������� �� ������������������������������������������������������������������������������ ����
��������!
48
Small alteration within enamel may be difficult to detect because of the
complexity of structures projected over the area of interest, however removing this
“structures” or “anatomic” noise by means of subtraction revealed clearly the
radiographic density changes. In this study, a sensitivity rate of 57% and 46% was
achieved on linear subtraction images assessment with CMOS and PSP systems,
respectively, yielding a statistically significant diagnostic improvement of mineral
changes compared to the other methods evaluated, being a suitable alternative in
the monitoring of mineral changes of approximal caries-like lesions. Similar results
have been demonstrated convincingly that subtraction of dental radiographs has
the capability of providing detailed radiographic density changes within enamel and
dentin that could not be discerned by visual comparison [Halse et al., 1990].
Additionally, Maggio et al. [1990] claimed that the regression of carious lesions in
extracted teeth can be evaluated using digital subtraction images, whereas
increases in radiodensity or radiolucency have been detected in the deepest parts
of carious lesions, depending on the conditions under the teeth were incubated.
Time-lapse radiographs were made using an orienting device that fixed the
position of tooth, x-ray sensor / plate, and x-ray tube collimator. However, when
standardization of projection geometry is provided, still further image manipulation
is necessary to correct minor error. However, a complete lost of noise, unchanged
anatomical structures, is difficult when comparing approximal surfaces. Logarithmic
digital subtraction images have been pointed as a valuable technology, being
either better or as good as linear subtraction [Haiter-Neto et al., 2005]. However, in
this study, it failed to reveal significantly superior on the diagnosis of mineral
changes. The enhancement of structural noise is one of the characteristics of the
logarithmic subtraction and it may be the cause of less accuracy compared to
linear subtraction, i.e. that it made the actually mineral changes diagnosis less
clear for the examiners causing misinterpretation of the logarithmic DSI, disabling
to correctly discriminate between actually mineral changes and structural noise
(Fig. 2). It is important to notice that with these standardization problems of
radiographs the results from this in vitro study simulate clinical trials where

����������������������� �� ������������������������������������������������������������������������������ ����
��������!
49
providing standard projection geometry is even more difficult. Clinical studies are
needed to achieve a better knowledge of the performance of subtraction images in
mineral changes diagnosis, especially logarithmic subtraction.
A comparison of the diagnostic performance on enamel de and
remineralization of both systems (CMOS and PSP) was assessed, and CMOS
system performed better independently of the method used, digital conventional
radiography or subtraction images. Very recent investigations have reported on
caries diagnosis using the CDR Wireless® and Digora OpTime® methods. In
perceived depiction of approximal dental caries, it was demonstrated that CMOS
sensor provided a comparable diagnostic accuracy to charge-couple device (CCD)
detector (Kitagwa et al., 2003) and to conventional film (Castro et al., 2007). In
another study along the same track, comparing caries diagnostic accuracy, no
significant difference was found between PSP plate and CCD-based sensor
system (Hintze, 2006). A point that needs particular attention is that it was
subjectively noted that CMOS system provided images with higher contrast and
with more differences of gray level distribution between the two images used to be
subtracted, that was caused by uncontrolled variation of the battery level and
signal strengths. However, to suppress these problems the gray level distribution of
the first image was used as reference to modify the gray level distribution of the
second image by the “gamma correction” command of the software. But it is true
that some valuable diagnostic information could become suppressed during digital
image formation and disturbing information or noise could have been introduced.
Although there is a clear advantage of subjective methods they have
limitations which are the variability of the lesions and the individual judgment of the
investigator. However, in this study care was taken to eliminate other sources of
interference. All images were prepared and manipulated by one author (J.A.B.C.)
and viewed by other examiners. They were displayed for evaluation in the same
17˝ computer monitor, with similar resolution / matriz size and stored in their
original format with no compression [Wenzel, 2006]. Also, the images were

����������������������� �� ������������������������������������������������������������������������������ ����
��������!
50
displayed at the same image sizes. Haak et al. [2003] have concluded that image
sizes with a display ratio of 1:1 and 1:2 resulted in better diagnostic validity than
those with a ratio of 1:7. Although care was taken to eliminate differences of the
matriz size between the two systems (CMOS and PSP), Prapayasatok et al. [2006]
have concluded that images presented as a PowerPoint slide with different
resolution settings did not have significant difference in diagnostic accuracy of
caries lesions. It is possible that the whole process of manipulation and
interpretation of the images could affect the diagnostic accuracy and
reproducibility. The impact of this requires further investigation so does the effect of
minor alterations in the angulation of the X-ray beam.
Observer agreement is often used as a method of assessing the reliability
of subjective classification or assessment procedures. The reliability of tested
analysis systems, CMOS and PSP, has been assessed, demonstrating levels of
substantial and moderate intra-examiner agreement, for demineralization
diagnostic accuracy, respectively. The opposite value of agreement was obtained
for mineral changes diagnosis. Inter-examiner reliability on demineralization
diagnosis, showed fair agreement for both systems, while the mineral changes
diagnosis showed fair and moderate agreement for CMOS and PSP system,
respectively. Interestingly, observers were able to assess demineralization
correctly with the CMOS system, but express less confidence with this system
regarding their assessment of mineral changes on enamel surface. Also, future
research is required to investigate whether the fair inter-examiners agreement
could have an influence on the outcome of this research.
The present study demonstrated that remineralization protocols,
independent of the use of F solutions or treatment period, resulted in an increased
in radiopacity, obviously caused by mineral gain. In relation to the appearance on
the monitor, this resulted in an intensity increase in both DCR (less radiolucency)
and DSI (a brighter area). However, the use of F solutions was able to spot the
mineral changes correctly more often than they did with the saliva solution alone,

����������������������� �� ������������������������������������������������������������������������������ ����
��������!
51
i.e., that protocol B provided higher values of diagnostic accuracy, tending to make
mineral changes more obvious, and it is also in accordance with the higher values
of Ca an Pi analysis reduction, in the artificial saliva, found in this protocol. Also,
the longer period of time provided slightly lower values of accuracy; future studies
with longer and variables periods of time can be valuable to prove this conclusion.
In order to remineralize early lesions (demineralized enamel) before they
cavitate, early detection and quantification of white-spot lesions are very important.
With these methods of digital radiography, the results showed that they were able
to detect remineralization therapies of early enamel lesions, being useful devices
for longitudinal assessment of mineral changes in the enamel. However, further
studies are needed, where there are no problems that the true-positive diagnoses
are outweighed by false-negative diagnoses. In this study sensibility higher than
50% was only achieved by linear, advanced and logarithmic subtraction with the
CMOS system.
Within the limitation of this study, it was concluded that (a) CMOS was
more accurate than PSP on the diagnosis of artificial caries-like lesions and
mineral changes monitoring; and (b) linear digital subtraction image can be a
valuable method to disclose an intensity increase, as a result of mineral gain.
However, further investigation is needed to identify an imaging system or
enhancement mode to improve the detection and monitoring accuracy of incipient
approximal caries lesions.
Acknowledgements
The authors wish to express their gratitude to Waldomiro Vieira Filho for his
technical assistance and Gláucia Maria Bovi Ambrosano for her statistical advice.
This study was supported by FAPESP (proc. 05 / 52220-8).

����������������������� �� ������������������������������������������������������������������������������ ����
��������!
52
References
Castro VM, Katz JO, Hardman PK, Glaros AG, Spencer P: In vitro comparison of
conventional film and direct digital imaging in the detection of approximal
caries. Dentomaxillofac Radiol 2007; 36: 138-142.
Haak R, Wicht MJ, Nowak G, Hellmich M: Influence of displayed image size on
radiographic detection of approximal caries. Dentomaxillofac Radiol 2003; 32:
242-246.
Haiter-Neto F, Ferreira RI, Tabchoury CPM, Bóscolo FN: Linear and logarithmic
subtraction for detecting enamel subsurface demineralization.
Dentomaxillofac Radiol 2005; 34: 133-139.
Halse A, White SC, Espelid I, Tveit AB: Visualization of stannous fluoride treatment
of carious lesions by subtraction radiography. Oral Surg Oral Med Oral Pathol
1990; 69: 378-81.
Hintze H: Diagnostic accuracy of two software modalities for detection of caries
lesions in digital radiographs from four dental systems. Dentomaxillofac
Radiol 2006; 35: 78-82.
Ingran GS, Edgar WM: Interaction of fluoride and non-fluoride agents with the
caries process: Adv Dent Res 1994; 8: 158-165.
Kitagawa H, Scheetz JP, Farman AG: Comparison of complementary metal oxide
semiconductor and charge-couple device intraoral X-ray detectors using
subjective image quality. Dentomaxillofac Radiol 2003; 32: 408-411.
Lagerweij MD, ten Cate JM: Remineralization of enamel lesions with daily
applications of a high-concentration fluoride gel and fluoridated toothpaste: an
in situ study. Caries Res 2002; 36: 270-274.
Lussi A, Merget B, Longbottom C, Reigh E, Francescut P: Clinical performance of
a laser fluorescence device for detection of occlusal caries lesions. Eur J Oral
Sci 2001; 109: 14-19.

����������������������� �� ������������������������������������������������������������������������������ ����
��������!
53
Maggio JJ, Hausman EM, Allen K, Potts TV: A model for dentinal caries
progression by digital subtraction radiography. J Prostht Dent 1990; 64: 727-
32.
Pretty IA, Pender N, Edgar WM, Higham SM: The in vitro detection of early enamel
de- and re-mineralization adjacent to bonded orthodontic cleats using
quantitative light-induced fluorescence. Eur J Orthod 2003; 25: 217-223.
Prapayasatok S, Janhom A, Verochana K, Pramojanee S: Digital camera
resolution and proximal caries detection. Dentomaxillofac Radiol 2006; 35:
253-257.
Ricketts DN, Ekstrand KR, Martignon S, Ellwood R, Alastsaris M, Nugent Z:
Accuracy and reproducibility of conventional radiographic assessment and
subtraction radiography in detecting demineralization in occlusal surfaces.
Caries Res 2007; 41: 121-128.
Takagi S, Liao H, Chow LC: Effect of tooth-bound fluoride on enamel
demineralization/remineralization in vitro. Caries Res 2000; 34: 281-288.
Wang J, Someya Y, Inaba D, Longbotton C, Miyazaki H: Relationship between
electrical resistance measurements and microradiography variables during
remineralization of softened enamel lesions. Caries Res 2005; 39: 60-64.
Wenzel A, Halse A: Digital subtraction radiography after stannous fluoride
treatment for occlusal caries diagnosis. Oral Surg Oral Med Oral Pathol 1992;
74: 824-828.
Wenzel A, Anthonisen PN, Juul MB: Reproducibility in the assessment of caries
lesion behavior: a comparison between conventional film and subtraction
radiography. Caries Res 2000; 34: 214-217.
Wenzel A: A review of dentists’ use of digital radiography and caries diagnosis with
digital systems. Dentomaxillofac Radiol 2006; 35: 307-314.

����������������������� �� ������������������������������������������������������������������������������ ����
��������!
54
Legends
Figure 1.
A sequentional set of images of DCR before and after remineralization, and linear,
advanced and logarithmic DSI, respectively from left to right, with CMOS system
(on the top) and PSP system (on the bottom) of the same tooth.
Figure 2.
Logarithmic subtraction image of a remineralized tooth showing the mineral gain
(white arrow) and structural noise (black noise)

����������������������� �� ������������������������������������������������������������������������������ ����
��������!
55
Figures
Figure 1

����������������������� �� ������������������������������������������������������������������������������ ����
��������!
56
Figure 2

����������������������� �� ������������������������������������������������������������������������������ ����
��������!
57
Tables
Table 1. Sensibility, especificity and accuracy values of mineral changes diagnosis with both systems and four methods of images
System Image method Sensibility Specificity Accuracy
DCR 0.451 0.795 0.520
Linear DSI 0.576 0.735 0.608
Advanced DSI 0.516 0.750 0.563 CMOS
Logarithmic DSI 0.543 0.690 0.573
DCR 0.292 0.900 0.414
Linear DSI 0.465 0.770 0.526
Advanced DSI 0.365 0.680 0.428 PSP
Logarithmic DSI 0.412 0.785 0.487
Table 2. Accuracy values of mineral changes diagnosis comparing protocol A (continuous remineralization) and protocol B (continuous remineralization + fluoride treatment) after 4 and 8 weeks
Protocols Period (weeks)
Accuracy
4 43.3% A
8 42.5 %
4 48.7 % B
8 46.5 %

����������������������� �� ������������������������������������������������������������������������������ ����
��������"
58
CAPÍTULO 4
TITLE PAGE
Noise in linear and logarithmic subtraction images
made from pair of images with CMOS sensor and PSP
plate
Juliana Araujo Bittar-Cortez*, Cínthia P M Tabchoury†, Francisco Haiter-Neto*
* Oral Diagnosis Department, Oral Radiolody Division, Piracicaba Dental School,
State University of Campinas, São Paulo, Brazil.
† Physiological Science Department, Biochemistry Division, Piracicaba Dental
School, State University of Campinas, São Paulo, Brazil
Corresponding author: Francisco Haiter Neto, Piracicaba Dental School/State
University of Campinas. Limeira Avenue, 901, Zip Code: 13.414-903, Piracicaba,
SP, Brazil; Phone: 55 19 2106 5327; Fax: 55 19 2106 53 18. E-mail:
SHORT TITLE: Noise in subtraction images

����������������������� �� ������������������������������������������������������������������������������ ����
��������"
59
ABSTRACT
Objectives: To compare noise and reproducibility in linear and logarithmic digital
subtraction images (DSI) produced from two digital radiography systems in three
different regions of interest (ROI), varying size and unchanged structures.
Methods: Eighty pairs of digital radiography images were obtained with
photostimulable storage phosphor (PSP) plate and complementary metal oxide
semiconductor (CMOS) sensor. Linear and logarithmic digital subtraction images
(DSI) were produced using EMAGO®/Advanced software with repetitions. Three
ROI were selected with two different sizes and in two different unchanged
structures, and the mean shades of gray and the standard deviation (SD) of the
histogram were assessed. Afterwards, statistical analysis was performed.
Results: All subtraction images from both systems of digital radiography were
reproducible, except logarithmic subtraction using CMOS sensor in ROI of 10.000
pixels. Comparing CMOS sensor and PSP plate, both values of mean shades of
gray and SD, it was statistically significant different by Mann Whitney’s test, PSP
plate presented values of higher mean shades of gray, closer to 128, and lower
values of SD. It was also statistically significant the differences between ROI of
different size and unchanged structures.
Conclusions: Subtraction images from PSP plates had statistically less noise
than images produced from CMOS sensor, however both systems was
reproducible when creating subtraction images. Cautions have to be taken when
assessing quantitatively ROI with different sizes and in different structures.
Key Words: subtraction technique; digital radiography; noise

����������������������� �� ������������������������������������������������������������������������������ ����
��������"
60
INTRODUCTION
Quantitatively evaluation differences occurring over a time interval on digital
radiographs have been done by digital subtraction technique.1 However, a perfect
geometrical match and exposure conditions is required. Some basic characteristics
of the subtraction software are to present algorithms for automatic registrations of
dental radiographs to correct these differences between two images.
The correction of projection geometric differences can be done by manual
registration techniques that are usually based on landmarks which are marked in
both images to be registered. Using deformation algorithms, the corresponding
points are mapped exactly onto each other while the others are interpolated based
on the triangulation of the spatial domain or on energy minimization models.
Thereby, the results registration is extremely dependent on the actual positioning
of the corresponding points and therefore, image warping is highly observer-
dependent. On the other hand the correction of gray levels between the two
images is performed automatically by the software.
When two radiographs are recorded with controlled projection angles and
thereafter subtracted, theoretically all unchanged anatomical background
structures are cancelled, and these areas displayed in a neutral gray shades (pixel
value = 128) in the subtraction image, while regions that have changed between
the radiographic examination are displayed in darker (pixel value < 128) or lighter
(pixel value > 128) shades of gray. The result is an image highlighting the
difference between the subtracted radiographs against a relatively uniform
background. However, subtraction images can contain gray-level variation which is
independent of any changes produced from real differences. These “accidental”
differences can thus interfere with diagnostic accuracy and it is called noise. It
should be possible, in quantitative digital subtraction to detect any change in pixel
value which truly originates from minute change in the object by eliminating the
variation in the sensitivity of the pixels (noise).1 This noise can thus be quantified
by using the SD of the histogram defining the distribution of gray shades in the

����������������������� �� ������������������������������������������������������������������������������ ����
��������"
61
subtraction image.2 The more shades of gray in the histogram, more noise in the
subtraction image, and the larger the SD.3
Based on these, the aim of this study is to compare noise and reproducibility
in linear and logarithmic DSI produced from two digital radiography equipments:
DIGORA OpTime® (Orion Corp./Soredex, Helsinque, Finlândia) PSP plate; and
CDR Wireless® (Schick Technologies, NY, USA), CMOS sensor.
MATERIALS AND METHODS
A set of 80 pairs of in vitro radiographs taken before and after a remineralization
protocol on human teeth was selected for this study. The teeth were mounted in
individual acrylic resin base, except the crowns, giving the teeth a proper stability
to take the radiographs; a peace of aluminum was also inserted in the acrylic base
to be used as reference points during their alignment. The radiographs were taken
using two digital radiography equipments: DIGORA OpTime® (Orion
Corp./Soredex, Helsinque, Finlândia) photostimulable storage phosphor (PSP)
plate; and CDR Wireless® (Schick Technologies, NY, USA) complemetary metal
oxide semiconductor (CMOS) sensor.
In EMAGO® / advanced 3.43 software (Oral Diagnosis Systems, Amsterdan,
the Netherlands) the pair of images were manipulated. The first step of the
subtraction procedure was to modify the gray level distribution of first image using
the gray level distribution of second image as reference, i.e. to calibrate the gray
levels of all pixels in the full image between the first and the second radiograph by
the gamma correction command. An alignment of the images was also performed
by the reconstruction command to correct small geometric misalignments. Then,
two methods of DSI were obtained: linear and logarithmic. The later method is
identical to linear subtraction, except for the fact that it enhances small differences,
but at the same time noise and contrast also increases. To estimate the
reproducibility of the systems, these steps were completed twice, providing four
subtractions for each pair of images.

����������������������� �� ������������������������������������������������������������������������������ ����
��������"
62
Afterwards, three regions of interest (ROI) consisting of two different sizes
were set on two different unchanged structures by the rectangle command also in
EMAGO® software. The unchanged structures were: the crown of the tooth and the
aluminum positioned in the resin base. The ROI consisted of 1.200 and 10.000
pixels (Figure 1-3). Then mean gray shades and standard deviation (SD) values of
the pixels in each ROI were determined by the histogram command. The repeated
subtractions were assessed at the same time to lower the observer error.
Statistical Analysis
The mean pixel value and SD of the histogram defining the distribution of gray
shades in the subtraction image was used as the statistical parameter in the
comparison of the homogeneity of the images created from two digital radiography
systems as described previously.3 Mann Whitney’s test was performed to evaluate
differences between the means and SD in subtraction images from both systems
CMOS sensor and PSP plate. A comparison of the difference between the ROI
were also performed by Friedman’s test. The difference between double
measurements was evaluated by Wiloxon’s pair rank test, probabilities smaller
than 0.05 were regarded as statistically significant.
RESULTS
Tables 1 and 2 show median and range of the mean gray shades and SD (from
linear and logarithmic DSI) in the two digital systems and three evaluated ROI.
Both methods of DSI showed similar outcomes. Both systems, CMOS sensor and
PSP plate obtained good repeatability of mean gray shades and SD values, i.e.,
there was not a statistical significant difference between the mean pixel value and
SD of all ROI in repeated subtracted images; except for a ROI of 10.000 pixels in
logarithmic DSI with CMOS sensor, both mean gray shades and SD were
statistically different by Wilcoxon’s test (p = 0.0002 and 0.0042, respectively).
Comparing subtractions images obtained with CMOS sensor and PSP plate, there

����������������������� �� ������������������������������������������������������������������������������ ����
��������"
63
was a statistically significant difference (p < 0.05) with median values closer to 128
and lower SD in the subtraction obtained from PSP plate.
The different size of ROI and different unchanged structures with the same
size were also statistically significant different in all evaluations values (p < 0.05).
DISCUSSION
To obtain valid quantitative data by digital subtraction radiography, the
methodological error underlying the results should be determined and corrected, so
true changes can be distinguished from changes caused by method error.
Quantification of radiographic density can be done either absolutely by using
reference objects, or relatively, by comparing density changes in defined units with
the changes in areas affected by hard tissue changes.4,5 Even though corrections
for differences in the two radiographs may be performed, it is still needed to take
the level of noise in the image into account. The ROI assessed in this study had as
an aim to establish the variation that can occur in test areas when different
structure and size of the area and also different digital radiographic system are
used.
Since the mean gray shades of the subtraction histogram did not reflect the
closeness of the repositioned images to the original image, the SD of the
subtraction histogram was also considered to measure the ability of the software to
quantitatively perform subtractions; therefore, a comparison of the SD of the three
ROI and the two digital systems were performed.2 In theory, a homogeneous DSI
will consist of pixels with little variation in shades of gray, i.e. in ROI that had not
change during the time interval evaluated, the values of mean gray shades is 128
and the SD is 0, with no noise.
However, these values were not obtained in either of ROI used; i.e differences
are proved by comparing two ROI of the same size in unchanged anatomical
structures (the crown of the teeth and the aluminum inserted in the resin base).
Mean gray-level pixel value difference was observed in this ROI, which were

����������������������� �� ������������������������������������������������������������������������������ ����
��������"
64
obtained under the same exposure conditions. Longitudinally obtained radiographs
present some inherent noise that could possible explains these results, being
difficult to characterize explicitly because there are so many non-linear factors that
can lead to inaccuracies of this sort. Some non-linear factors include changes in
radiographic density caused by beam hardening, radiation scatter and inherent to
various components of the imaging system.6 The smallest SD values were
obtained when PSP plate was used and ROI with areas of 1.200 pixels located in
the crown. It can be concluded that PSP plate was more ideal for the subtraction
procedure; and it is suggested to use as reference, ROI located in structures with
less density and smaller areas to prevent inherent variations on the results. It has
also been shown that although ROI size and shape consistency in longitudinal
studies are important in density analyses, small variations has minimal impact.7 In
spite of this conclusion, higher variations of the ROI size can be a critical factor in
the measurement of noise in test regions by the histogram command.
The quality of adjustment can be affected by the degree of precision in the
positioning of the landmarks. Therefore, the registration depends on the observer
placing the landmarks in both images. However, in this study, the two digital
radiographically systems were reproducible, this indicates that reliable subtraction
can easily be obtained by the two digital imaging systems used. However, the
logarithmic DSI obtained from radiographs taken with the CMOS sensor have to be
used carefully with ROI consisting in 10.000 pixels.
The ability to accurately quantify early changes with subtraction histogram is
valuable and it is suggested, but it is important to take into account characteristics
that can make variations from the basic theory of the mean gray shades and SD of
the histogram. Cautions should be taken for the precise quantification of
differences occurring in a period of time on subtraction images.
ACKNOWLEDGEMENTS
This study was supported by FAPESP (proc. 05 / 52220-8).

����������������������� �� ������������������������������������������������������������������������������ ����
��������"
65
REFERENCES
1 - Yoshioka T, Kobayashi C, Suda H, Sasaki T. Quantitative subtraction with
direct digital dental radiography. Dentomaxillofac Radiol 1997; 26: 286-294.
2 - Eraso FE, Parks ET, Roberts WE, Hohlt WF, Ofner S. Density value means in
the evaluation of external apical root resorption: an in vitro study for early
detection in orthodontic case simulations. Dentomaxillofac Radiol 2007; 36:
130-137.
3 - Haiter-Neto F, Wenzel A. Noise in subtraction images made from pairs of
bitewing radiographs: a comparison between two subtraction programs.
Dentomaxillofac Radiol 2005; 34: 357-361.
4 - Christgau M, Hiller KA, Schmalz G, Kolbeck C, Wenzel A. Quantitative digital
subtraction radiography for the determination of small changes in bone
thickness. Oral Surg Oral Med Oral Phatol Oral Radiol Endod 1998; 85: 462-
472.
5 - Kwon JY, Kim YS, Kim CW. Assessing changes of peri-implant bone using
digital subtraction radiography. J Korean Acad Prosthod 2001; 39: 273-280.
6 - Wenzel A & Severin IP. Sources of noise in digital subtraction radiography. Oral
Surg Oral Med Oral Pathol 1991; 71: 503-508.
7 - Shrout MK, Farley A, Patt SM, Potter BJ, Hildebolt CF, Pilgram TK, Yokoyama-
Crothers N, Dotson M, Hauser J, Cohen S, Kardaris E, Hanes P. The effect of
region of interest variations on morphologic operations data and gray-level
values extracted from digitized dental radiographs. Oral Surg Oral Med Oral
Pathol Oral Radiol Endod 1999; 88: 636-639.

����������������������� �� ������������������������������������������������������������������������������ ����
��������"
66
FIGURES LEGENDS
Figure 1.
Description of ROI A (on the crown consisting of 1.200 pixels) and performed
histogram.
Figure 2.
Description of ROI B (on the crown consisting of 10.000 pixels) and performed
histogram.
Figure 3.
Description of ROI C (on the aluminum consisting of 1.200 pixels) and performed
histogram.

����������������������� �� ������������������������������������������������������������������������������ ����
��������"
67
Figure 1.
FIGURES

����������������������� �� ������������������������������������������������������������������������������ ����
��������"
68
Figure 2.
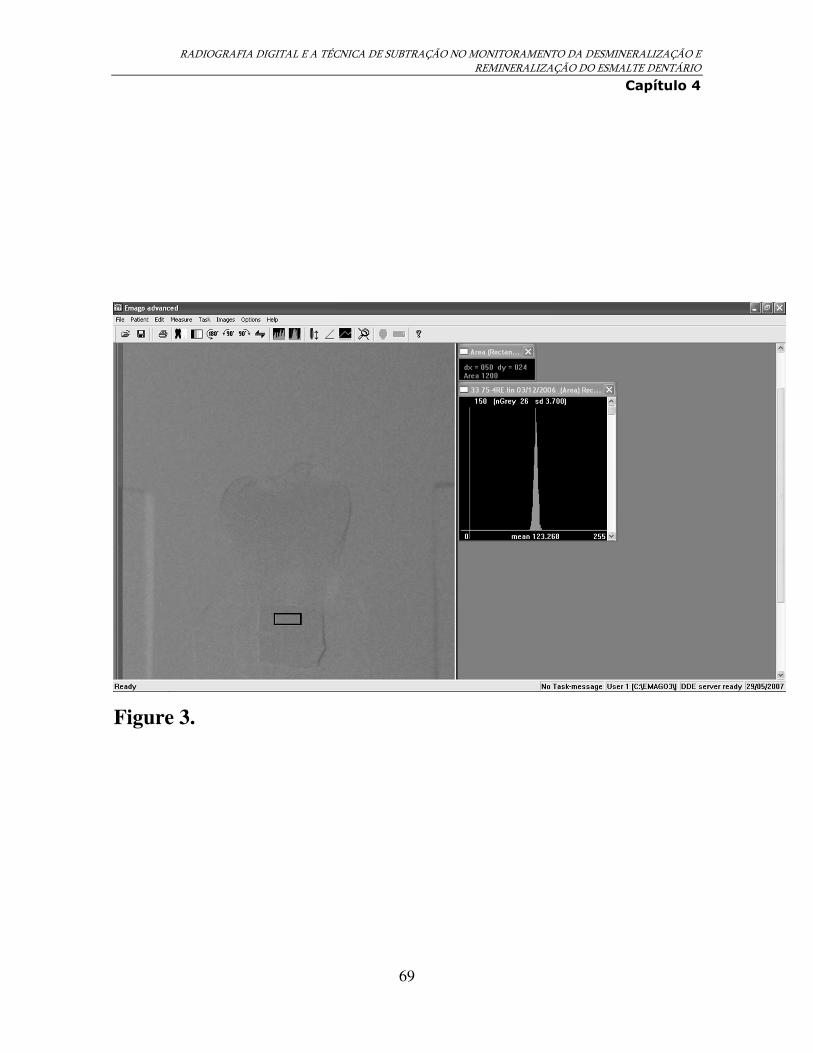
����������������������� �� ������������������������������������������������������������������������������ ����
��������"
69
Figure 3.

����������������������� �� ������������������������������������������������������������������������������ ����
��������"
70
TABLES
Table 1 Median of the mean grey shade (range) and standard deviation (range) for the histograms in the linear subtraction images obtained with two digital radiography systems in three different regions (A – on the crown with 1.200 pixels; B – on the crown with 10.000 pixels; and C – on the aluminum with 1.200 pixels). Values System Areas P-value* A B C
Mean grey shade CMOS sensor 119.5 (115.6-141.6)
120.8 (116.0-125.0)
123.5 (118.3-128.1) 0.000
PSP plate 125.3 (120.9-128.6)
125.5 (121.6-129.1)
126.1 (122.3-132.5) 0.000
Standard deviation CMOS sensor 3.6 (3.2-3.9)
4.0 (3.5-4.7)
3.9 (3.3-5.1) 0.000
PSP plate 2.2 (1.9-3.0)
2.3 (2.1-3.2)
2.2 (2.0-3.3) 0.000
* P-value were calculated using Friedman test (P<0.05).
Table 2 Median of the mean grey shade (range) and standard deviation (range) for the histograms in the logarithmic subtraction images obtained with two digital radiography systems in three different regions (A – on the crown with 1.200 pixels; B – on the crown with 10.000 pixels; and C – on the aluminum with 1.200 pixels). Values System Areas P-value* A B C
Mean grey shade CMOS sensor 95.0 (81.3-115.5)
99.2 (85.2-119.0)
112.0 (89.1-132.3) 0.000
PSP plate 119.6 (100.2-133.3)
120.1 (103.2-135.3)
123.4 (104.8-150.7) 0.000
Standard deviation CMOS sensor 13.4 (11.3-15.9)
15.8 (13.5-18.0)
16.3 (13.4-19.1) 0.000
PSP plate 9.9 (8.2-10.9)
10.5 (9.2-14.2)
10.3 (9.0-16.4) 0.000
* P-value were calculated using Friedman test (P<0.05).

����������������������� �� ������������������������������������������������������������������������������ ����
���������
71
CONCLUSÃO
A partir dos dados estudados pelo presente trabalho, verificou-se que:
A - Os métodos de dureza do esmalte e microscopia de luz polarizada
não foram capazes de detectar o ganho mineral observados pelas dosagens
bioquímicas de Ca e Pi, durante os tratamentos de remineralização dentária.
Entretanto, por meio das imagens de subtração radiográfica digital foi possível
observar este ganho mineral, que mostra poder ser um método para o
monitoramento da remineralização de lesões de cárie interproximal incipiente.
B - As dosagens bioquímicas de Ca e Pi foram fortemente
correlacionadas, indicando ser o método mais sensível para o monitoramento
quantitativo de mudanças minerais no esmalte dentário. E a determinação da
densidade por meio do histograma em regiões de interesse, pode ser uma
alternativa para o monitoramento das mudanças minerais em imagens de
microscopia de luz polarizada.
C - O sistema CMOS obteve maiores valores de acurácia no diagnóstico
de desmineralizações e no monitoramento de mudanças minerais. E o método de
subtração radiográfica digital linear foi o melhor método para a detecção de um
aumento de intensidade como resultado do ganho mineral no esmalte dentário.
D - Imagem de subtração radiográfica digital obtida a partir de pares de
imagens com a placa PSP contém menor quantidade de ruído comparando

����������������������� �� ������������������������������������������������������������������������������ ����
���������
72
imagens obtidas a partir do sensor CMOS, porém as subtrações com os dois
sistemas de radiografias digitais são reprodutíveis. A avaliação quantitativa a partir
do histograma, comparando estruturas e regiões de tamanhos diferentes não é
confiável.

����������������������� �� ������������������������������������������������������������������������������ ����
����#�����
73
REFERÊNCIAS*
Argenta RMO, Tabchoury CPM, Cury JA. A modified ph-cycling model to evaluate
fluoride effect on enamel demineralizarion. Pesqui Odontol Bras. 2003; 17(3):
241-46.
Balter S. Fundamental properties of digital images. Radiographics. 1993; 13(1):
129-41.
Benn DK. Limitations of the digital image subtraction technique in assessing
alveolar bone crestal changes due to misalignment errors during image
capture. Dentomaxillofac Radiol. 1990; 19(1): 97-104.
Bragger U, Pasquali L, Rylander H, Carnes D, Kornman KS. Computer-assisted
densitometric image analysis in periodontal radiography. J Clin Periodontol.
1988; 15(1): 27-37.
Byrd V, Mayfield-Donahoo T, Reddy MS, Jeffcoat K. Semiautomatic image
registration for digital subtraction radiography. Oral Surg Oral Med Oral Pathol
Oral Radiol Endod. 1998; 85(4): 479-86.
Eberhard J, Hartman B, Lenhard M, Mayer T, Kocher T, Eickholz P. Digital
subtraction radiography for monitoring dental demineralization. An in vitro
study. Caries Res. 2000; 34(3): 219-24.
Eraso FE, Parks ET, Roberts WE, Hohlt WF, Ofner S. Density value means in the
evaluation of external apical root resorption: an in vitro study for early
detection in orthodontic case simulations. Dentomaxillofac Radiol. 2007;
36(3): 130-7.
* De acordo com a norma da Unicamp / FOP, baseadas na norma do International Committee of Medical Journal
Editors - Grupo Vancouver. Abreviaturas dos periódicos em conformidade com o Medline.

����������������������� �� ������������������������������������������������������������������������������ ����
����#�����
74
Espelid I, Tveit AB. Radiographic diagnosis of mineral loss in approximal enamel.
Caries Res. 1984; 18(2): 141-8.
Ferreira RI, Arriaga ML, Campos PSF, Panella J. Radiografia de subtração digital.
RPG Rev Pós Grad. 1999; 6(3): 249-52.
Filder A, Likar B, Pernus F, Skaleric U. Influence of developer exhaustion on
accuracy of quantitative digital subtraction radiography. Oral Surg Oral Med
Oral Pathol Oral Radiol Endod. 2000; 90(2): 233-9.
Fisher E, Van Der Stelt PF, Ostuni J, Dunn SM. The effect of independent film and
object rotation on projection geometric standardization of dental radiographs.
Dentomaxillofac Radiol. 1994; 24(1): 5-12.
Ganss C, Lussi A, Klimek J. Comparison of calcium/phosphorus analysis,
longitudinal microradiography and profilometry for quantitative assessment of
erosive demineralisation. Caries Res. 2005; 39(3): 178-84.
Gröndahl HG. Decision strategies in radiographic caries diagnosis. Swed Dent J.
1979; 3(5): 173-80.
Gröndahl HG. et al. Statistical contrast enhancement of subtraction images for
radiographic caries diagnosis. Oral Surg Oral Med Oral Pathol. 1982; 53(2):
219-23.
Grondahl HG, Grondahl K, Webber RL. A digital subtraction technique for dental
radiography. Oral Surg Oral Med Oral Pathol. 1983; 55(1): 96-102.
Haiter-Neto F, Ferreira RI, Tabchoury CPM, Bóscolo FN. Linear and logarithmic
subtraction for detecting enamel subsurface demineralization.
Dentomaxillofac Radiol. 2005; 34(3): 133-9.
Haiter-Neto F, Wenzel A. Noise in subtraction images made from pairs of bitewing
radiographs: a comparison between two subtraction programs.
Dentomaxillofac Radiol. 2005; 34(6): 357-61.

����������������������� �� ������������������������������������������������������������������������������ ����
����#�����
75
Halse A, White SC, Espelid I, Tveit AB. Visualization of stannous fluoride treatment
of carious lesions by subtraction radiography. Oral Surg Oral Med Oral
Pathol. 1990; 69(3): 378-81.
Halse A, Espelid I, Tveit AB, White SC. Detection of mineral loss in approximal
enamel by subtraction radiography. Oral Surg Oral Med Oral Pathol. 1994;
77(2): 177-82.
Hausmann E, Allen K, Loza J, Buchaman W, Cavanaugh PF. Validation of
quantitative subtraction radiography using the electronically guided alignment
device/impression technique. J Periodontol. 1996; 67(9): 895-9.
Heaven TJ, Firestone AR, Feagin FF. Quantitative radiographic measurement of
dentinal lesions. J Dent Res. 1990; 69(1): 51-4.
Ingram GS, Edgar WM. Interaction of fluoride and non-fluoride agents with the
caries process. Adv Dent Res. 1994; 8(2): 158-65.
Jassen PTM, Helderman WHVP, Aken JV. The detection of in vitro produced
periodontal bone lesions by conventional radiography and photographic
subtraction radiography using observers and quantitative digital subtraction
radiography. J Clin Periodontol. 1989; 16(6): 335-41.
Likar B, Pernus F. Evaluation of three contrast correction methods for digital
subtraction in dental radiography: an in vitro study. Med Phys. 1997; 24(2):
299-307.
Lussi A, Merget B, Longbottom C, Reigh E, Francescut P. Clinical performance of
a laser fluorescence device for detection of occlusal caries lesions. Eur J Oral
Sci. 2001; 109(1): 14-9.
Maggio JJ, Hausmann EM, Allen K, Potts TV. A model for dentinal caries
progression by digital subtraction radiography. J Prosthet Dent. 1990; 64(6):
727-32.

����������������������� �� ������������������������������������������������������������������������������ ����
����#�����
76
Minah GE, Vandre RH, Talaksi R. Subtraction radiography of dentinal caries-like
lesions induced in vitro by cariogenic bacteria. Pediatr Dent. 1998; 20(5):
345-9.
Mukai Y, ten Cate JM. Remineralization of advanced root dentin lesions in vitro.
Caries Res. 2002; 36(4): 275-80.
Nummikoski PV, Martinez TS, Matteson SR, McDavid WD, Dove SB. Digital
subtraction radiography in artificial recurrent caries detection.
Dentomaxillofac Radiol. 1992; 21(2): 59-64.
Pitts NB, Renson CE. Further development of a computer-aided image analysis
method of quantifying radiolucencies in approximal enamel. Caries Res.
1986; 20(4): 361-70.
Pretty IA, Pender N, Edgar WM, Higham SM. The in vitro detection of early enamel
de- and re-mineralization adjacent to bonded orthodontic cleats using
quantitative light-induced fluorescence. Eur J Orthod. 2003; 25(3): 217-23.
Ricketts DN, Ekstrand KR, Martignon S, Ellwood R, Alastsaris M, Nugent Z.
Accuracy and reproducibility of conventional radiographic assessment and
subtraction radiography in detecting demineralization in occlusal surfaces.
Caries Res. 2007; 41(2): 121-8.
Ruittimann UE, Webber RL, Schmidt E. A robust digital method for film contrast
correction in subtraction radiography. J Periodont Res. 1986; 21(5): 486-95.
Sousa CJA. Controle da remoção da cárie dental através da subtração de imagem
radiográfica computadorizada. Rev ABO Nac. 1997; 5(6): 313-6.
Syriopoulos K, Sanderink GCH, Velders XL, van der Stelt PF. Radiographic
detection of approximal caries: a comparison of dental films and digital
imaging systems. Dentomaxillofac Radiol. 2000; 29(5): 312-8.
ten Cate JM. Remineralization of caries lesions extending into dentin. J Dent Res.
2001; 80(5): 1407-11.

����������������������� �� ������������������������������������������������������������������������������ ����
����#�����
77
Versteeg KH, Van Der Stelt PF. Effect of logarithmic contrast enhancement on
subtraction images. Oral Surg Oral Med Oral Pathol Oral Radiol Endod. 1995;
80(4): 479-86.
Wang J, Someya Y, Inaba D, Longbotton C, Miyazaki H. Relationship between
electrical resistance measurements and microradiography variables during
remineralization of softened enamel lesions. Caries Res. 2005; 39(1): 60-4.
Webber RL, Ruttimann UE, Grondahl HG. X-ray image subtraction as a basis for
assessment of periodontal changes. J Periodontol Res. 1982; 17(5): 509-11.
Webber RL, Ruttimann UE, Groenhuis RAJ. Computer Correction of Projective
Distortions in Dental Radiographs. J Dent Res. 1984; 63(8): 1032-6.
Wenzel A, Halse A. Digital subtraction radiography after stannous fluoride
treatment for occlusal caries diagnosis. Oral Surg Oral Med Oral Pathol. 1992;
74(6): 824-8.
Wenzel A, Pitts N, Verdonschot EH, Kalsbeek H. Developments in radiographic
caries diagnosis. J Dent. 1993; 21(3): 131-40.
Wenzel A. Current trends in radiographic caries imaging. Oral Surg Oral Med Oral
Pathol Oral Radiol Endod. 1995; 80(5): 527-39.
Wenzel A. Digital radiography and caries diagnosis. Dentomaxillofac Radiol.
1998; 27(1): 3-11.
Wenzel A. Digital imaging for dental caries. Dent Clin North Am. 2000; 44(2): 319-
38.
Wenzel A, Anthonisen PN, Juul MB. Reproducibility in the assessment of caries
lesion behaviour: a comparison between conventional film and subtraction
radiography. Caries Res. 2000; 34(3): 214-8.
Wenzel A. A review of dentists’ use of digital radiography and caries diagnosis with
digital systems. Dentomaxillofac Radiol. 2006; 35(5): 307-14.

����������������������� �� ������������������������������������������������������������������������������ ����
����#�����
78
Yoshioka T, Kobayashi C, Suda H, Sasaki T. Quantitative subtraction with direct
digital dental radiography. Dentomaxillofac Radiol. 1997; 26(5): 286-94.

����������������������� �� ������������������������������������������������������������������������������ ����
���$��
79
ANEXO 1

����������������������� �� ������������������������������������������������������������������������������ ����
���$�
80
ANEXO 2
De: [email protected] Assunto: Ms. No. 200712006, Caries Research Data: Qui, Dezembro 13, 2007 12:20 pm Para: [email protected]
MS: 200712006 Dear Dr. Bittar-Cortez, Thank you for submitting your manuscript entitled "In vitro remineralization of artificial carious lesions assessed by subtraction images" to "Caries Research". It will now be submitted to review and we shall inform you as soon as possible of the decision reached by the editorial board. The manuscript reference number is 200712006. Please use this number on all correspondence about the manuscript, which should be sent to the "Caries Research" editorial office at the address listed below. With kind regards, R P Shellis (Editor-in-Chief, Caries Research) Division of Restorative Dentistry Bristol University Dental School, Bristol BS1 2LY, U.K. Fax. +44 117-928-4778 Tel. +44 117-928-4328 [email protected] ______________________________________________________________________ This email has been scanned by the MessageLabs Email Security System. For more information please visit http://www.messagelabs.com/email ______________________________________________________________________