Embed Size (px)
Citation preview

45
Rafael Amaral Cataldo and Emilson Pereira Leite
REM, Int. Eng. J., Ouro Preto, 71(1), 45-51, jan. mar. | 2018
Rafael Amaral CataldoMestre
Universidade Estadual de Campinas – UNICAMP
Instituto de Geociências
Campinas - São Paulo – Brasil
Emilson Pereira LeiteProfessor-Doutor II
Universidade Estadual de Campinas – UNICAMP
Instituto de Geociências
Campinas - São Paulo – Brasil
Simultaneous prestack seismic inversion in a carbonate reservoir Abstract
We applied a method of Simultaneous Prestack Seismic Inversion (SPSI) in a hydro-carbon field located in the Campos Basin, Brazil. The goal was to study the application of this method to Albian carbonate rocks of the Quissamã Formation. Based on what is found in nearby fields, this Formation potentially contains hydrocarbon accumulations that can be revealed with the inverted models. P-wave velocity (Vp), S-wave velocity (Vs) and density (r) curves along seven wells were used as inputs to construct 3-D initial models of acoustic impedance (Zp), shear impedance (Zs) and r. Wells without Vs and r curves had those values calculated from well-established equations. Final 3-D models were calculated from deviations in linear relationships between the logarithms of Zs and Zp, as well as between r and Zp, which were merged with the initial models. Interpreta-tions of the inversion results were conducted based on patterns found along well logs such as resistivity (ILD), gamma ray (GR), density (RHOB), neutron porosity (NPHI) and sonic (DT). These analyses provided criteria to select the best inverted models. These models show low impedance anomalies that are consistent with previous studies performed with the well logs. One well in particular was interpreted as having high potential to contain hydrocarbons. This well shows an impedance pattern that allowed us to highlight other areas with the same pattern throughout the entire seismic volume.
Keywords: prestack seismic inversion; carbonate reservoir; Campos basin.
http://dx.doi.org/10.1590/0370-44672016710024
GeosciencesGeociências
1. Introduction
In the last few decades the oil industry has been focusing on the im-provement of various methods to solve current geological problems, such as the modeling of pre-salt carbonate reservoirs in Brazil. Postack, prestack and elastic seismic inversions are among those methods that assist the characterization of hydrocarbon reservoirs. Latimer et al. (2000) points out that it is common to find empirical relationships between Zp and rock properties such as lithology and porosity. Even though the Zp model can provide such information, it does not discriminate porosities between carbon-ates and shales (Li et al., 2003). However, when we analyze Zp, Zs and r models together, we can reinforce this hypothesis because the extraction of multiple elastic properties from seismic data enhances the probability of identifying different rock groups (see e.g. Jarvis et al., 2007).
The prestack inversion emerges from
the need for extracting more information from seismic data to solve geological prob-lems that are not answered by poststack inversion. The Vs information used in prestack seismic inversion can solve, e.g, the duality between porosity in carbon-ates and shales, in which Zp alone cannot solve. Therefore, the S-wave information is crucial to discriminate among reservoir and non-reservoir rocks (Li et al., 2003). In this context, SPSI is considered to be the ultimate method that combines AVO data with seismic inversion techniques (Goffey, 2013).
One of the obstacles in applying SPSI to carbonate rocks is that, in contrast with sandstones, these lithotypes are vertically and laterally heterogeneous and represent a complex challenge regarding reservoir characterization. Being mainly of biological origin, carbonates have complex textures and are susceptible to diagenesis modifications, leading to mineralogy and
pore structure changes that make these rocks more difficult to model (Eberli et al., 2003).
Over the past few years several stud-ies were performed in different lithologies proving the effectiveness of prestack seis-mic inversion methods. For example, post-stack analysis on argillaceous carbonates and breccias may not differentiate reservoir from non-reservoir rocks (dolomitic and calcitic shales), but SPSI combined with Vp/Vs analysis may enable the separation of these lithotypes (Liu et al., 2012). Benaben-tos et al. (2007) applied prestack inversion to assist the selection of well locations to drill in Burgos Basin, Mexico, where the targets were sandstones potentially con-taining gas accumulations. AlMuhaidib et al. (2012) used impedance volumes gener-ated from SPSI to estimate porosity values on a jurassic Saudi Arabia carbonate field. The results pointed out to new potential hydrocarbon areas of good quality.

46
Simultaneous prestack seismic inversion in a carbonate reservoir
REM, Int. Eng. J., Ouro Preto, 71(1), 45-51, jan. mar. | 2018
The main goal of this paper is to study the advantages and limitations of recovering petrophysical parameters from a carbonate reservoir using SPSI (Hampson et al., 2006). We have conducted a sensi-bility analysis on parameters required to invert prestack data with this method. We
obtained 3-D models of Zp, Zs and r of a post-salt carbonate reservoir of Macae Group, located in Campos Basin, offshore Brazil. We refer to this oil field as the “A” field. The A field contains albian carbonate rocks of Quissamã Formation that were de-posited in a shallow platform environment.
These rocks have a porosity of ~25% and permeability of ~250md (Spadini, 1992). This reservoir is responsible for 31% of in-place oil volume of the A field, but has a recovery factor of ~15.40% (Horschutz et al., 1992). This is the first application of SPSI for this oil field.
Geological settingCampos Basin has the second most
productive hydrocarbon reservoirs in Brazil, encompassing ~50% of oil and ~22% of natural gas production (ANP, 2017). The A field is located in south-east of Campos Basin, Brazil, covering an area of 32 km² in water depths of ~100 m. Considering our zone of interest at the Quissamã Formation, it is com-posed of oolithic/oncolithic and peloidal calcarenites, calcirudites and calcilutites. In terms of trapping, this reservoir is es-sentially structural-stratigraphic where
calcarenites and calcirudites grade into calcilutites towards west and south-south-west of the field (Horschutz et al., 1992). The carbonate reservoir of interest in this work belongs to the Quissamã Formation of the Macae Group, which contains Al-bian rocks formed from restricted marine depositions with high salinity levels, ac-cording to results obtained from studies with isotopic, minor and trace elements (Robaina et al., 1991). The Quissamã For-mation is represented by moderate to high energy carbonate sediments composed of
oolithic/oncolithic calcarenite banks with a thickness of up to 15 m. These reservoirs generally show high porosities associated to variable values of permeability. The res-ervoirs are composed of carbonate sand banks elongated to northeast, which in turn are composed mainly of grainstones and packstones. The porosity of these carbonates is essentially intergranular and has unexpressive secondary poros-ity formed by dissolution of oncoliths nuclei and vugular porosity (Spadini & Paumer, 1983).
Data and softwareThe inversions were carried out us-
ing the software HRS-9 (CGG-Veritas). The seismic data consists of partially stacked Common Mid Point (CMP) gathers recorded into four angle stack files: 4° to 13°; 13° to 22°; 22° to 31°; and 31° to 40°. The seismic data were previ-
ously processed so that no additional deconvolution or filtering was required before the application of SPSI. Vp, Vs and r were obtained from well logs. These data are needed to build the initial mod-els for all prestack inversions. The area covered by prestack data includes a total
of seven wells containing the following logs: RHOB, GR, ILD, NPHI and DT. Two horizons were extracted based on seismic reflections representing the top of Quis-samã Formation and Lagoa Feia. Table 1 summarizes the main information about the data.
Seismic acquisition sample rate 4 ms
Seismic trace length 2500 ms
Number of samples per seismic trace 625
Number of inlines & xlines 404 & 479
Distance between inlines & xlines 12.50 m
Wells A1, A2, A3, A4, A78, A153 and A156
Horizons Quissamã and Lagoa Feia
Table 1Main information about seismic data acquisition parameters and well logs.
2. Methods
Seismic inversion requires four main steps: (i) create an initial impedance model of low frequencies from elastic properties; (ii) extract wavelet(s) from seismic-well ties; (iii) do a relative inversion and; (iv) merge the relative inversion results with the initial models. Firstly, an “inversion analysis” is carried out by applying step (iv) only along the wells. Then, the SPSI is applied to the complete seismic volume us-ing the optimal parameters selected from the inversion analysis.
Firstly we calculated Vs logs using two formulas. The first is that of Cast-agna et al. (1985) and was used for the external part of Quissamã Formation. For
the internal part of Quissamã Formation we used the formula shown in Greenberg & Castagna (1992). Pinheiro (2005) ob-tained high positive correlations between this formula and experimental results in coquina samples from Lagoa Feia Forma-tion located in Campos Basin. Wells A1, A4 and A153 did not contain the RHOB logs within the reservoir interval and these values were calculated by the Gardner’s equation (Gardner et al., 1974).
To create the initial low-frequency models, we used the Quissamã and Lagoa Feia top horizons as stratigraphic surfaces. Seismic-well ties were conducted with all wells in order to adjust seismic events to
well log markers and to make depth-time conversions. To accomplish this step, we extracted and tested wavelets based on Walden and White (1998) and White & Simm (2003). In our case, the best wavelet has a wavelength of 60 ms and a frequency peak of ~25 Hz. For each well, a Zp log was generated from RHOB and DT in order to obtain reflectivity values. The convolution of a reflectivity series with a wavelet provides a synthetic seismogram which is compared with the original seis-mogram. Having converted wells from depth to time and positioned them cor-rectly within the seismic data volume, the initial Zp, Zs and r models were created.

47
Rafael Amaral Cataldo and Emilson Pereira Leite
REM, Int. Eng. J., Ouro Preto, 71(1), 45-51, jan. mar. | 2018
Simultaneous prestack seismic inversion (SPSI)The SPSI method assumes that the
seismic trace can be modeled by the well-known 1-D convolutional model. For small values, the reflectivity (RP) calculated by a
recursive equation using Zp can be approx-imated by (Russell and Hampson, 1991)
RPi ≈1/2 ∆ ln(ZPi)=1/2 [ln(ZPi+1) - ln(ZPi)]
where i is the ith interface between layers i and i+1. For all layers, equation 1 can be written in matrix form as
where LPi = Ln(ZPi), and the matrix with zeros
and ones is denoted by D. By representing the seismic trace (T) as a convolution between a seismic wavelet (w) and RP, we obtain
where Ti is the ith sample of the seismic
trace, wj is the jth term of w and the wavelet
matrix is denoted by W. By combining equations (2) and (3) we have (Russell and
Hampson, 1991):
Equation 4 represents a zero-offset seismic trace. For prestack data with dif-ferent incident angles (θ ), a modified ver-
sion of the Aki-Richards approximations is used (Fatti et al., 1994), leading to an analogous equation for the prestack trace
T(θ ). Also, the SPSI assumes a linear rela-tionship among the logarithms Lp (ln Zp), Ls (ln Zs) e Ld (ln r) (Russell et al., 2006):
Therefore, the essence of the method is to calculate ΔLs and ΔLd from linear models
fitted to the background values using Zp, Zs and r (Figure 1). Parameters k, kc, m and mc
are fitted coefficients. These deviations may reflect areas where hydrocarbons are present.
Figure 1(a) Ln(Zs) vs. Ln(Zp).
(b) Ln(r) vs. Ln(Zp). Red lines are back-ground linear models. The deviations from these models, ∆Ls and ∆Ld, are hydrocar-
bon anomalies (Russell et al., 2006).
By combining equations (4) to (6) into T(θ), we obtain
T(θ)= ĉ1 W(θ)DLP+ ĉ2 W(θ)DLS+ W(θ) c3 DLD
where ĉ1 = (1/2)c1+(1/2)kc2 + mc3, ĉ2 =(1/2)c2, c1 = 1 + tan² θ, c2 = -8γ tan² θ and
c3 = -0.5tan² θ 2γ sin² θ, γ = Vs/Vp. Equation 7 is a system of linear equations to which
the solution is a vector p = [Lp ΔLs ΔLd] (Russel et al., 2006).
RP1
RP2
RPN
...
...
...
...... ... ...
...
= 12
-1 1 00 -1 10 0 -1
LP1
LP2
LPI
...
T1
T2
TN
...
...
...
...... ... ...
...
= 12
W1 0 0W2 W1 1W3 W2 W1
LP1
LP2
LPI
...
T = (1/2) WDLP
Ls = k Lp + kc + ∆Ls
Ld = m Lp + mc + ∆Ld
(1)
(2)
(3)
(4)
(5)
(6)
(7)
(a) (b)
3. Results and discussion
Seismic-well ties provided cor-relations from 0.622 to 0.739 between synthetic and observed seismic traces.
Two horizons representing the Quissamã and Lagoa Feia top formations were interpreted by picking seismic amplitude
events in all inlines and xlines available. As an example, we present the results near well A153 because they show the highest

48
Simultaneous prestack seismic inversion in a carbonate reservoir
REM, Int. Eng. J., Ouro Preto, 71(1), 45-51, jan. mar. | 2018
Figure 2Comparison between initial (a) and final model (b) for near well A153 at inline 2171.
Figure 3Example of the “inversion analysis” results along well A153. Yellow lines represent top and base of the Quissamã Formation. Blue curves represent derived P-wave (Zp) and S-wave (Zs) impedance and density (r) values. Red and black curves represent initial and final inversion model, respectively.
probability of having oil.It was not possible to directly attach
different values of Zp, Zs and r to the lithotypes of this field, because there were not available cores along the wells to con-strain such kind of interpretation. Thus, all interpretations were conducted only with the log readings from the seven wells.
The reader may ask if the output fre-quencies are being generated only from the initial model, so that the final results have
only log frequencies without information from seismic data. As Figure 2 shows, the initial model is significantly different from the final model denoting that seismic frequencies have a critical impact on the final results.
The “inversion analysis” allowed us to visually and numerically compare the inversion results along the wells before applying the inversion process to all avail-able seismic traces (Figure 3). Correlations
between ln(Zp), ln(Zs) and r, calculated or extracted from the wells, and those generated by the inversion were analyzed. At the same time, correlations between synthetic and real seismic traces were monitored. Figure 3 shows the inversion result for well A153, and although it does not recover all events, it follows the trend of the derived logs and initial models. This is explained by the difference between seismic and log resolution.
(a)
(b)
49
Rafael Amaral Cataldo and Emilson Pereira Leite
REM, Int. Eng. J., Ouro Preto, 71(1), 45-51, jan. mar. | 2018
The final step was to perform the SPSI for all seismic traces using parameters that point to a higher reliability of the process. It is important to notice that several wavelets with distinct features, as well as different filters and pre-whitening values were tested before running the final inversion. Empiri-cally, we have noticed that an initial low frequency model without filter presents better results, meaning this was the only model that results in an anomaly exactly where the well A153 presents favorable indicators of oil presence (Rider, 2004). The influence of the wavelet on the error and correlation is low, but the level of the pre-whitening applied results in significant differences, especially if we look at well A153 for both correlation and error values. This was a key factor to get better results on the final volumes. The wavelet was ex-tracted statistically from the seismic data partially stacked from 4° to 13°. We also
used a pre-whitening of 5% to stabilize the inversion process.
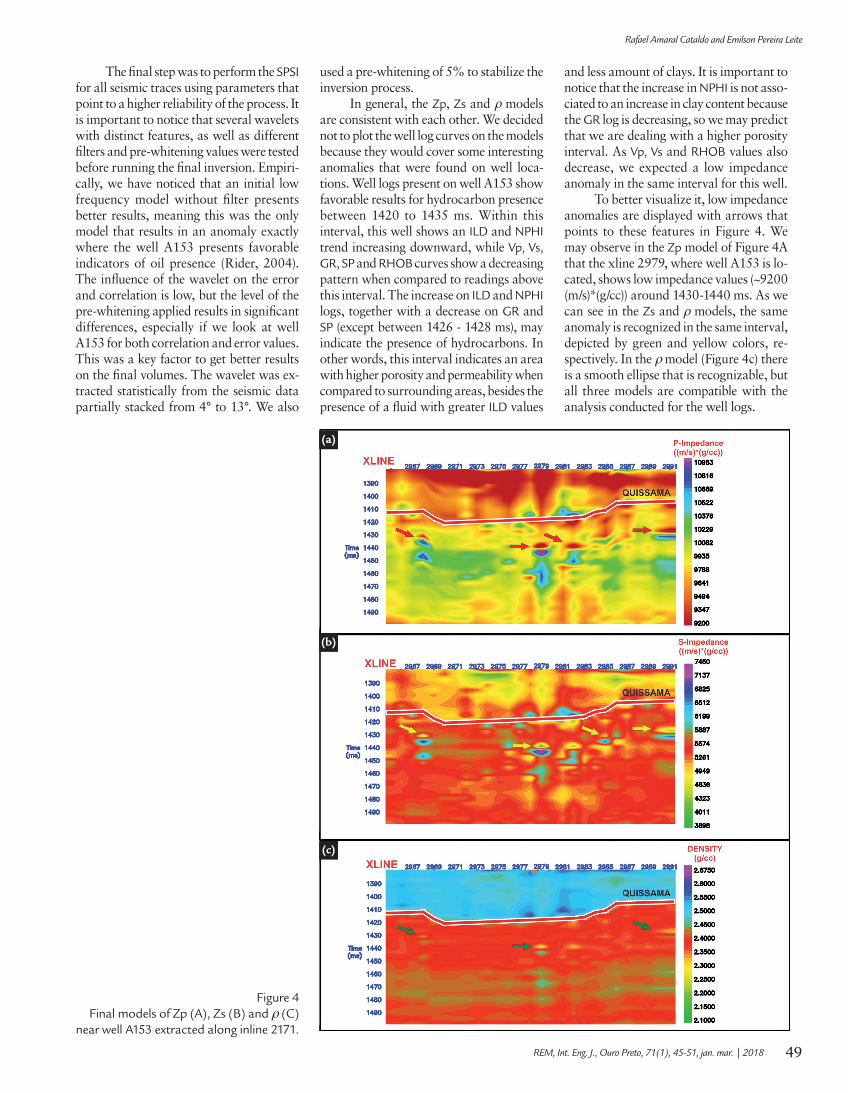
In general, the Zp, Zs and r models are consistent with each other. We decided not to plot the well log curves on the models because they would cover some interesting anomalies that were found on well loca-tions. Well logs present on well A153 show favorable results for hydrocarbon presence between 1420 to 1435 ms. Within this interval, this well shows an ILD and NPHI trend increasing downward, while Vp, Vs, GR, SP and RHOB curves show a decreasing pattern when compared to readings above this interval. The increase on ILD and NPHI logs, together with a decrease on GR and SP (except between 1426 - 1428 ms), may indicate the presence of hydrocarbons. In other words, this interval indicates an area with higher porosity and permeability when compared to surrounding areas, besides the presence of a fluid with greater ILD values
and less amount of clays. It is important to notice that the increase in NPHI is not asso-ciated to an increase in clay content because the GR log is decreasing, so we may predict that we are dealing with a higher porosity interval. As Vp, Vs and RHOB values also decrease, we expected a low impedance anomaly in the same interval for this well.
To better visualize it, low impedance anomalies are displayed with arrows that points to these features in Figure 4. We may observe in the Zp model of Figure 4A that the xline 2979, where well A153 is lo-cated, shows low impedance values (~9200 (m/s)*(g/cc)) around 1430-1440 ms. As we can see in the Zs and r models, the same anomaly is recognized in the same interval, depicted by green and yellow colors, re-spectively. In the r model (Figure 4c) there is a smooth ellipse that is recognizable, but all three models are compatible with the analysis conducted for the well logs.
Figure 4Final models of Zp (A), Zs (B) and r (C)
near well A153 extracted along inline 2171.
(a)
(b)
(c)
50
Simultaneous prestack seismic inversion in a carbonate reservoir
REM, Int. Eng. J., Ouro Preto, 71(1), 45-51, jan. mar. | 2018
References
ALMUHAIDIB, A.M., SEN, M.K., TOKSOZ, M.N. Integration of geology, rock physics, logs, and prestack seismic data for reservoir porosity estimation. AAPG Bulletin, v. 96, n. 7, p. 1235-1251, 2012.
ANP. Boletim da Produção de Petróleo e Gás Natural. Agência Nacional do Petróleo, Gás Natural e Biocombustíveis, Superintendência de Desenvolvimento e Produção – SDP. Ed. n. 85, set. 2017. 33p. Disponível em: <www.anp.gov.br>. Acesso em: 6 nov. 2017.
BENABENTOS, M., SILVA, M., ORTIGOSA, F., MERCADO, V. Reservoir charac-terization in Burgos Basin using simultaneous inversion. The Leading Edge, v. 26, n. 5, p. 556-561, 2007.
EBERLI G.P., BAECHLE, G.T., ANSELMETTI, F.S., INCZE, M.L. Factors con-trolling elastic properties in carbonate sediments and rocks. The Leading Edge, n. 22, p. 654–660, 2003.
FATTI, J.L., SMITH, G.C., VAIL, P.J., STRAUSS, P.J., LEVITT, P.R. Detection of gas in sandstone reservoirs using AVO analysis: a 3-D Seismic Case History Using the Geostack Technique. Geophysics, n. 59, p. 1362-1376, 1994.
GOFFEY, R. AVO, inversion or AVO inversion ? Hampson-Russel´s software solution. GDS Publishing Ltd., 2013.
GARDNER, G.H.F., GARDNER, L.W., GREGORY, A.R. Formation velocity and density - the diagnostic basics for stratigraphic traps. Geophysics, v. 39, n. 6, p. 770-780, 1974.
GREENBERG, M.L., CASTAGNA, J.P. Shear-wave velocity estimation in po-rous rock: theoretical formulation, preliminary verification and applications. Geophysical Prospecting, n. 40, p. 195-209, 1992.
HAMPSON, D., RUSSELL, B.H., BANKHEAD, B. 2006. Simultaneous inversion of pre-stack seismic data. Geohorizons, v. 11, n. 1, p. 13-17, 2006.
HORSCHUTZ, P. M. C., FREITAS, L. C. S., STANK, C. V., BARROSO, A. S., CRUZ, W. M. The Linguado, Carapeba, Vermelho and Marimbá Giant Oil Fields, Campos Basin, Offshore Brazil. In: HALBOUTY, M. T. (Ed.). Giant Oil and Gas Fields of the Decade 1978-1988: AAPG Memoir 54, p. 137–156, 1992.
4. Conclusions
In general, the inverted models present high correlations with the actual logs and may indicate areas with a high probability of finding hydrocarbon ac-cumulations. This conclusion is based on the assumption that the Quissamã Formation contains hydrocarbon res-ervoirs and thus, we looked for low im-pedance anomalies followed downward by high anomalies which are consistent
with well log interpretation.The lowest inversion errors were
obtained for the r model while the Zs model shows the highest errors. How-ever, there is absence of incident angles above 40°. This model should be inter-preted together with the other models, in order to check for consistency and to get a better understanding of the distribution of anomalies.
Based on the favorable results obtained in this work with well A153, we may conclude that the SPSI method applied in this work has the potential of finding anomalies related to hydrocarbon reserves in carbonate rocks of the A field. However, it must be emphasized that, to achieve optimum results, stratigraphic control, petrophysical and core data should be used as constraints.
It is possible to extend these predic-tions from xlines 2967 to 2969, 2981 to 2983 and 2989 to 2991 because they occur in the same interval where we have found the low impedance anomaly along well A153. The reader should notice the pattern of these anomalies at distances approximately constant from the Quis-samã horizon, which may be associated to reservoirs found in other fields of the Campos Basin (see arrows in Figure 4). We also looked for the same anomalies in the same interval throughout the final inversion volumes. This search was carried out for all inverted volumes and we found
significant anomalies from inline 2170 to 2173 and from xlines 2989 to 2994.
Another way to check the inver-sion quality is by cross-plotting the inverted models versus the actual logs. From such cross-plots, we noticed that the errors in the r model are the lowest while the errors in the Zs model are the highest. However, the r model should be interpreted with caution, because the prestack data used in this work does not have incident angles higher than 40°. In most cases, this is not enough to solve r models with reliability. Seismic data has a low signal/noise when registered at
high angles. Shi et al. (2010) points out that the near offset seismic amplitudes are mainly controlled by velocity, and that only the far offset amplitudes may record r information.
We could not compare our inverted models with the geology of the A field more directly, because there were no core samples and petrophysical data available. Particularly, the lack of petrophysical data led to the use of data from analog rocks to estimate, for instance, the veloc-ity of S-wave. Certainly, the acquisition of S-wave and density logs along all wells should improve the SPSI results.

51
Rafael Amaral Cataldo and Emilson Pereira Leite
REM, Int. Eng. J., Ouro Preto, 71(1), 45-51, jan. mar. | 2018
JARVIS, K., FOLKERS, A., SAUSSUS, D. Reservoir compartment prediction of the Simpson field from the geostatistical inversion of AVO seismic data. ASEG, p. 1-3, 2007.
LATIMER, R. B., DAVISON, R., VAN RIEL, P. An interpreter’s guide to un-derstanding and working with seismic-derived acoustic impedance data. The Leading Edge, n. 19, p. 242-256, 2000.
LI, Y., DOWNTON, J., GOODWAY, B. Recent applications of AVO to carbonate reservoirs in the Western Canadian Sedimentary Basin. The Leading Edge, v. 22, n. 7, p. 670-674, 2003.
LIU, Z., SUN, S. Z., WANG, H., LU, H., ZHANG, J. Complex lithological re-servoir prediction through pre-stack simultaneous inversion: a case study from the Leijia Area in Liaohe Oil-field, China. SEG Technical Program Expanded Abstracts, p. 1-6, 2012.
PINHEIRO, J. E. F. Aprendendo a confiar em Greenberg-Castagna. In: INTERNA-TIONAL CONGRESS OF THE BRAZILIAN GEOPHYSICAL SOCIETY, 9. Brazil: 2005.
RIDER, M. The geological interpretation of well logs. (2nd. Ed.). Whittles Publishing Services, 2004. p. 280.
ROBAINA, L. E. S., FORMOSO, M. L. L., SPADINI, A. R. Carbonatos reservatório da Formação Macaé, bacia de Campos, RJ, Brasil (parte 1) – Contribuição à geo-química dos carbonatos. Geochim. Brasil, v. 5, n. 1/2, p. 53-67, 1991.
RUSSELL, B. H., HAMPSON, D. P. A comparison of post-stack seismic inver-sion methods. In: Ann. Mtg. Abstracts, Society of Exploration Geophysicists, p. 876-878, 1991.
RUSSELL, B. H., HAMPSON, D. P., BANKHEAD, B. Simultaneous inversion of pre-stack seismic data. In: INT. CONFERENCE & EXPOSITION OF PETRO-LEUM GEOPHYSICS, 6. p. 371-376, 2006.
SHI, Y. M., YAO, F. C., SUN, H. S., QI, Li. Density inversion and porosity using seismic data. Beijing, China: Research Institute of Exploration and Development, PetroChina, 2010.
SPADINI, A. R. Processo deposicionais e ciclicidade em carbonatos albianos de plataforma rasa da bacia de Campos. Rio de Janeiro: Univ. Fed. do Rio de Janei-ro, Instituto de Geociências, 1992. 139 p. (Dissertação de Mestrado).
SPADINI, A. R., PAUMER, L. M. Os reservatórios Macaé no Campo de Pampo: o meio poroso e sua relação com as fácies deposicionais e a diagênese. Petrobrás/Cenpes: 1983. 53p. (Relatório Interno).
WHITE, R. E., SIMM, R. Tutorial: good practice in well ties. First Break, v. 21, Issue 10, p. 75-83, 2003.
Received 19 February 2016-Accepted 3 November 2017.