Embed Size (px)
Citation preview
Roughness Measurement Methodology according to DIN 4768 Using Optical Coherence Tomography (OCT)
Marcello M. Amarala*, Marcus P. Raelea, José P. Calyb, Ricardo E. Samada, Nilson D. Vieira Jr. a,
Anderson Z. Freitasa
aNuclear and Energy Research Institute, IPEN / CNEN – SP, Av. Prof. Lineu Prestes, 2242, São Paulo, SP, BR 05508-900
bIPT - Instituto de Pesquisas Tecnológicas do Estado de SP - Av. Prof. Almeida Prado, 532. São Paulo, SP, BR 05508-901
ABSTRACT
Measure roughness in some sort of samples can present several problems when it is done in traditional way (with physical contact). For instance, soft samples will present at least two kinds of problem: (a) the value presented by the equipment not represents the sample roughness; (b) the equipment can perform serious damages to the sample. Using a commercial type OCT (Thorlabs Inc.) with 6μm axial resolution (in air) and 6μm lateral resolution, measurements of roughness standards with Ra nominal values of 0.8, 1.6, 3.2, 6.3, 12.5, 25.0 and 50.0 μm. A homemade software analysis the OCT images, and automatically calculates the Ra and Rz values. This procedure was performed to validate this methodology comparing the OCT and roughness standards values.
Keywords: Optical Coherence Tomography, OCT, Roughness, DIN 4768
1. INTRODUCTION In several mechanical components, the surface roughness is an important parameter that determine the lifetime of this component. The DIN 4768 standards establishes the methods to characterize the surface roughness, but the traditional technique to determine this parameter uses a Surface Roughness Testers which use a scanning cantilever in physical contact with the sample to measure the roughness parameter.
For instance, delicate samples like some kinds of ceramics, textile products, papers or biological tissue, for example, could give an erroneous roughness parameter caused by the sample deformation due to the physical contact of the cantilever to the surface sample. The equipment can also perform serious damages to the sample.
Optical Coherence Tomography, also broadly known as OCT, is a technique that uses a Michelson interferometer to provide a cross section image of scattering samples with noninvasive and no contact parts. This technique, known as a biological image technique, can also be used to imaging just the surface sample and using signal processing techniques determine surface roughness.
The aim of this work was to development of a new technique using the OCT technology to determine surface roughness without physical contact, studying for valadation propose, a steel roughness standard where parameters like Ra and Rz are well know as defined in DIN 4768 standard.
1.1 DIN 4768 Ra and Rz roughness parameters
A real surface distinguish from a geometrical surface by macro and micro geometric differences in their shapes, both, results from material processing procedures. DIN 4768 standard established some roughness parameters based on the roughness depth to quantify the surface roughness, they are:
Arithmetic Mean Roughness parameter (Ra):
The Arithmetic Mean Roughness parameter (Ra) specifies the arithmetic mean of the absolute amounts of all variances in the roughness profile from the centre line over the total distance as (equation 1).
Please verify that (1) all pages are present, (2) all figures are acceptable, (3) all fonts and special characters are correct, and (4) all text and figures fit within themargin lines shown on this review document. Return to your MySPIE ToDo list and approve or disapprove this submission.
7390-34 V. 1 (p.1 of 8) / Color: No / Format: A4 / Date: 4/6/2009 5:19:14 PM
SPIE USE: ____ DB Check, ____ Prod Check, Notes:
dxxyL
RaL
∫=0
)(1 (1)
were L is the total sampling length and y is the surface profile height to the center line average (CLA), and it is a function of position.
For a discrete case can be written as:
∑=
=n
iiy
nRa
1
1 (1)
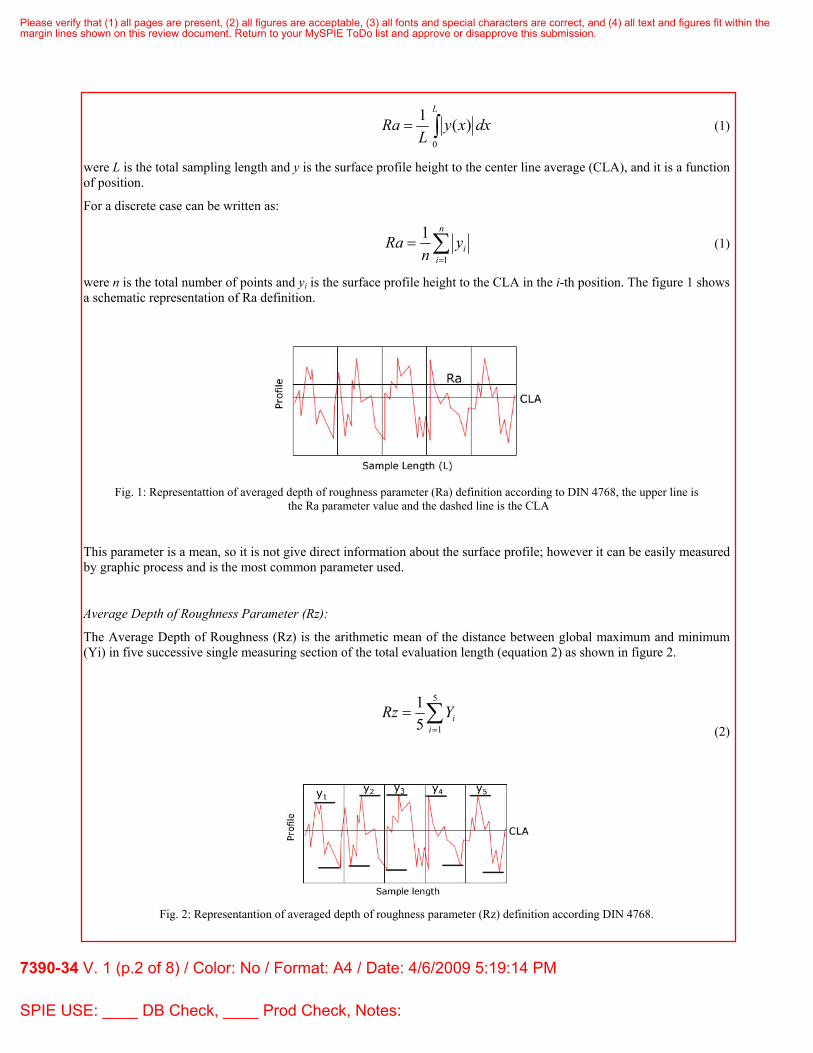
were n is the total number of points and yi is the surface profile height to the CLA in the i-th position. The figure 1 shows a schematic representation of Ra definition.
Fig. 1: Representattion of averaged depth of roughness parameter (Ra) definition according to DIN 4768, the upper line is
the Ra parameter value and the dashed line is the CLA
This parameter is a mean, so it is not give direct information about the surface profile; however it can be easily measured by graphic process and is the most common parameter used.
Average Depth of Roughness Parameter (Rz):
The Average Depth of Roughness (Rz) is the arithmetic mean of the distance between global maximum and minimum (Yi) in five successive single measuring section of the total evaluation length (equation 2) as shown in figure 2.
∑=
=5
151
iiYRz
(2)
Fig. 2: Representantion of averaged depth of roughness parameter (Rz) definition according DIN 4768.
Please verify that (1) all pages are present, (2) all figures are acceptable, (3) all fonts and special characters are correct, and (4) all text and figures fit within themargin lines shown on this review document. Return to your MySPIE ToDo list and approve or disapprove this submission.
7390-34 V. 1 (p.2 of 8) / Color: No / Format: A4 / Date: 4/6/2009 5:19:14 PM
SPIE USE: ____ DB Check, ____ Prod Check, Notes:
This two parameter together Ra and Rz can give a complementary information about the surface profile; e.g., if we have two different surfaces with the same Rz parameter, the changes in the structure profile will be indicated by Ra parameter..
1.2 OCT Technique
OCT is a relatively new technique which relies on low length coherence interferometry [1]. The OCT technique derives from studies of optical fibers faults location [2] in 1987. However, the breakthrough occurred when this methodology was applied to perform tomographic images of delicate live structures, such as eyes structures [3-5] and other biological tissue [6-8]. Despite the fact that OCT can be considered as an established diagnostic tool, especially by biomedical areas, the technique has less than two decades of conception and still are under development. Many researches centers around the world has dedicated groups of OCT studies, which denotes that OCT it is far from technological saturation. These groups (including our) are constantly creating new application or new setup configurations.
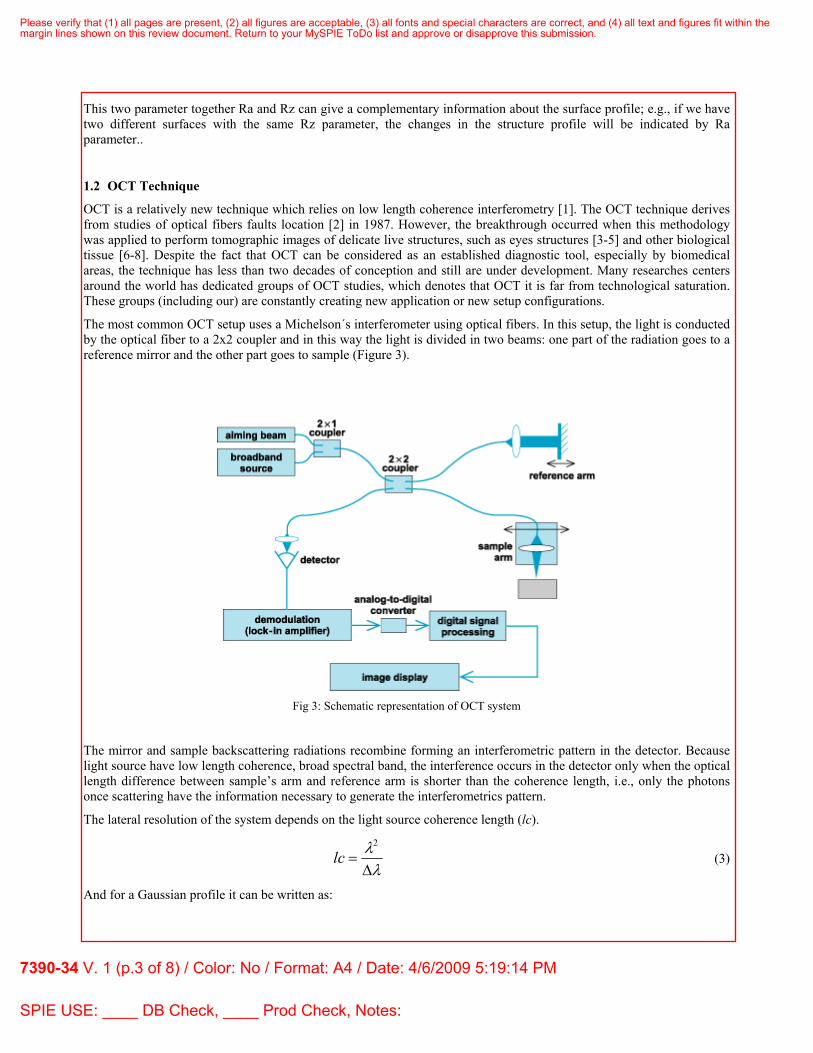
The most common OCT setup uses a Michelson´s interferometer using optical fibers. In this setup, the light is conducted by the optical fiber to a 2x2 coupler and in this way the light is divided in two beams: one part of the radiation goes to a reference mirror and the other part goes to sample (Figure 3).
Fig 3: Schematic representation of OCT system
The mirror and sample backscattering radiations recombine forming an interferometric pattern in the detector. Because light source have low length coherence, broad spectral band, the interference occurs in the detector only when the optical length difference between sample’s arm and reference arm is shorter than the coherence length, i.e., only the photons once scattering have the information necessary to generate the interferometrics pattern.
The lateral resolution of the system depends on the light source coherence length (lc).
λ
λΔ
=2
lc (3)
And for a Gaussian profile it can be written as:
Please verify that (1) all pages are present, (2) all figures are acceptable, (3) all fonts and special characters are correct, and (4) all text and figures fit within themargin lines shown on this review document. Return to your MySPIE ToDo list and approve or disapprove this submission.
7390-34 V. 1 (p.3 of 8) / Color: No / Format: A4 / Date: 4/6/2009 5:19:14 PM
SPIE USE: ____ DB Check, ____ Prod Check, Notes:
lczπ
2ln2=Δ (4)
where Δz is the system longitudinal resolution, λ is the central wavelength of light source, and Δλ is FWHM of source spectral band; the lateral resolution is determined by the beam waist after pass through a convergent lens.
Because OCT uses light to construct an image there are no contact parts with the sample, like in traditional way to measure roughness using Surface Roughness Testers. This is the main advantage of use OCT to determine the roughness parameter of a delicate sample.
1.3 Software
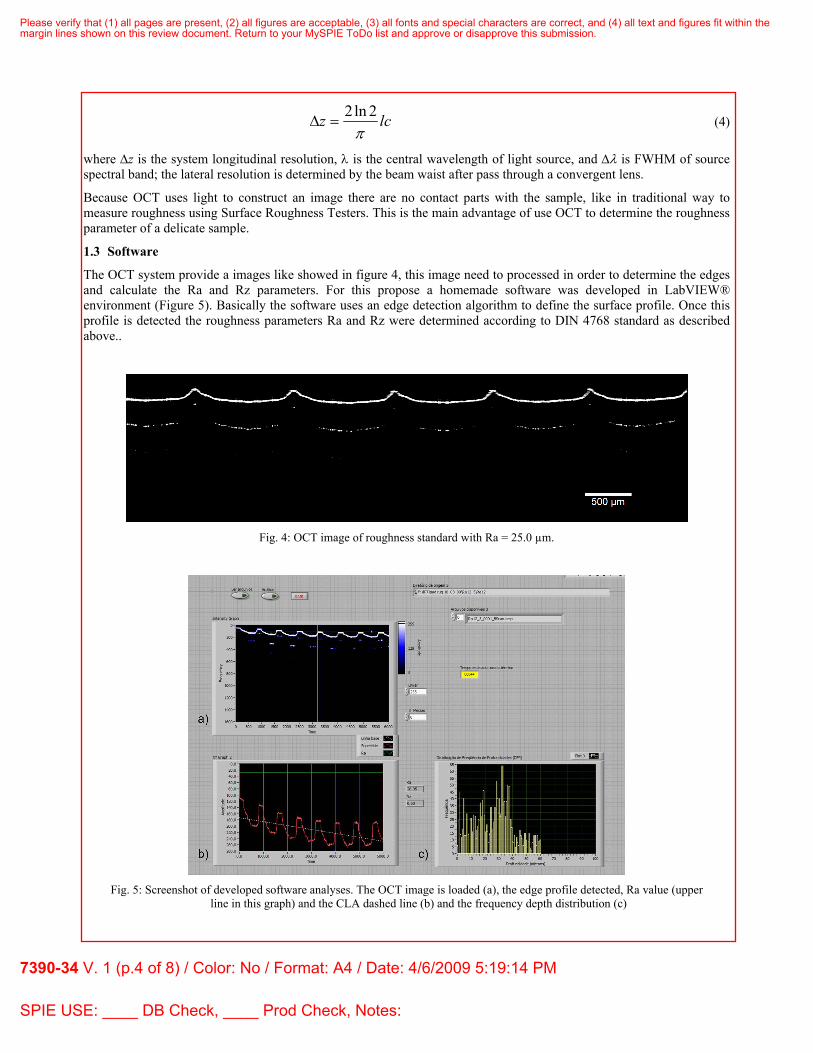
The OCT system provide a images like showed in figure 4, this image need to processed in order to determine the edges and calculate the Ra and Rz parameters. For this propose a homemade software was developed in LabVIEW® environment (Figure 5). Basically the software uses an edge detection algorithm to define the surface profile. Once this profile is detected the roughness parameters Ra and Rz were determined according to DIN 4768 standard as described above..
Fig. 4: OCT image of roughness standard with Ra = 25.0 µm.
Fig. 5: Screenshot of developed software analyses. The OCT image is loaded (a), the edge profile detected, Ra value (upper
line in this graph) and the CLA dashed line (b) and the frequency depth distribution (c)
Please verify that (1) all pages are present, (2) all figures are acceptable, (3) all fonts and special characters are correct, and (4) all text and figures fit within themargin lines shown on this review document. Return to your MySPIE ToDo list and approve or disapprove this submission.
7390-34 V. 1 (p.4 of 8) / Color: No / Format: A4 / Date: 4/6/2009 5:19:14 PM
SPIE USE: ____ DB Check, ____ Prod Check, Notes:
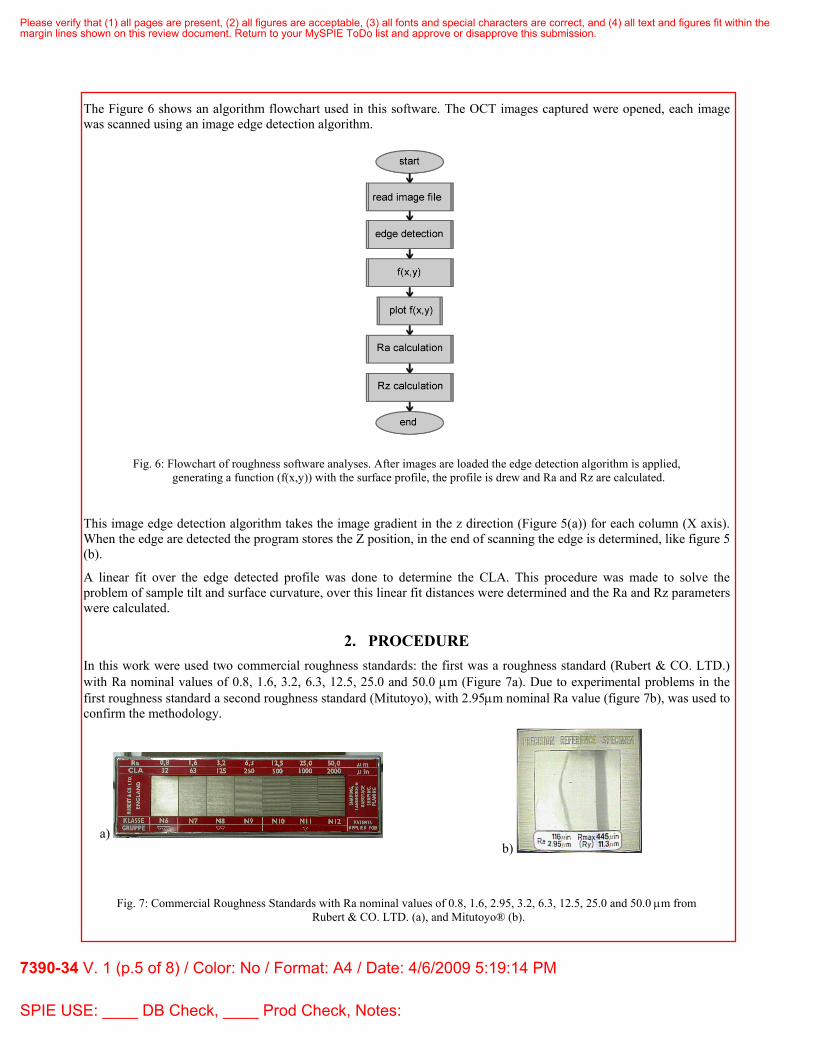
The Figure 6 shows an algorithm flowchart used in this software. The OCT images captured were opened, each image was scanned using an image edge detection algorithm.
Fig. 6: Flowchart of roughness software analyses. After images are loaded the edge detection algorithm is applied,
generating a function (f(x,y)) with the surface profile, the profile is drew and Ra and Rz are calculated.
This image edge detection algorithm takes the image gradient in the z direction (Figure 5(a)) for each column (X axis). When the edge are detected the program stores the Z position, in the end of scanning the edge is determined, like figure 5 (b).
A linear fit over the edge detected profile was done to determine the CLA. This procedure was made to solve the problem of sample tilt and surface curvature, over this linear fit distances were determined and the Ra and Rz parameters were calculated.
2. PROCEDURE In this work were used two commercial roughness standards: the first was a roughness standard (Rubert & CO. LTD.) with Ra nominal values of 0.8, 1.6, 3.2, 6.3, 12.5, 25.0 and 50.0 μm (Figure 7a). Due to experimental problems in the first roughness standard a second roughness standard (Mitutoyo), with 2.95μm nominal Ra value (figure 7b), was used to confirm the methodology.
a)
b)
Fig. 7: Commercial Roughness Standards with Ra nominal values of 0.8, 1.6, 2.95, 3.2, 6.3, 12.5, 25.0 and 50.0 μm from Rubert & CO. LTD. (a), and Mitutoyo® (b).
Please verify that (1) all pages are present, (2) all figures are acceptable, (3) all fonts and special characters are correct, and (4) all text and figures fit within themargin lines shown on this review document. Return to your MySPIE ToDo list and approve or disapprove this submission.
7390-34 V. 1 (p.5 of 8) / Color: No / Format: A4 / Date: 4/6/2009 5:19:14 PM
SPIE USE: ____ DB Check, ____ Prod Check, Notes:
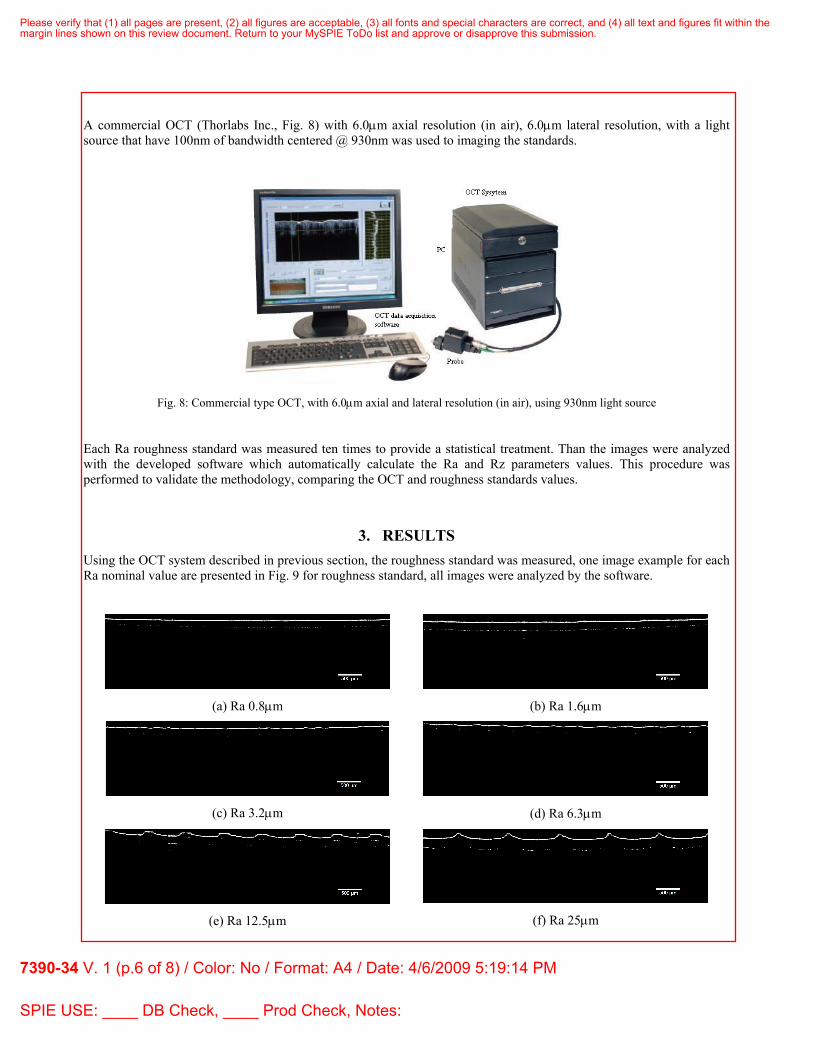
A commercial OCT (Thorlabs Inc., Fig. 8) with 6.0μm axial resolution (in air), 6.0μm lateral resolution, with a light source that have 100nm of bandwidth centered @ 930nm was used to imaging the standards.
Fig. 8: Commercial type OCT, with 6.0μm axial and lateral resolution (in air), using 930nm light source
Each Ra roughness standard was measured ten times to provide a statistical treatment. Than the images were analyzed with the developed software which automatically calculate the Ra and Rz parameters values. This procedure was performed to validate the methodology, comparing the OCT and roughness standards values.
3. RESULTS Using the OCT system described in previous section, the roughness standard was measured, one image example for each Ra nominal value are presented in Fig. 9 for roughness standard, all images were analyzed by the software.
(a) Ra 0.8μm
(b) Ra 1.6μm
(c) Ra 3.2μm
(d) Ra 6.3μm
(e) Ra 12.5μm
(f) Ra 25μm
Please verify that (1) all pages are present, (2) all figures are acceptable, (3) all fonts and special characters are correct, and (4) all text and figures fit within themargin lines shown on this review document. Return to your MySPIE ToDo list and approve or disapprove this submission.
7390-34 V. 1 (p.6 of 8) / Color: No / Format: A4 / Date: 4/6/2009 5:19:14 PM
SPIE USE: ____ DB Check, ____ Prod Check, Notes:
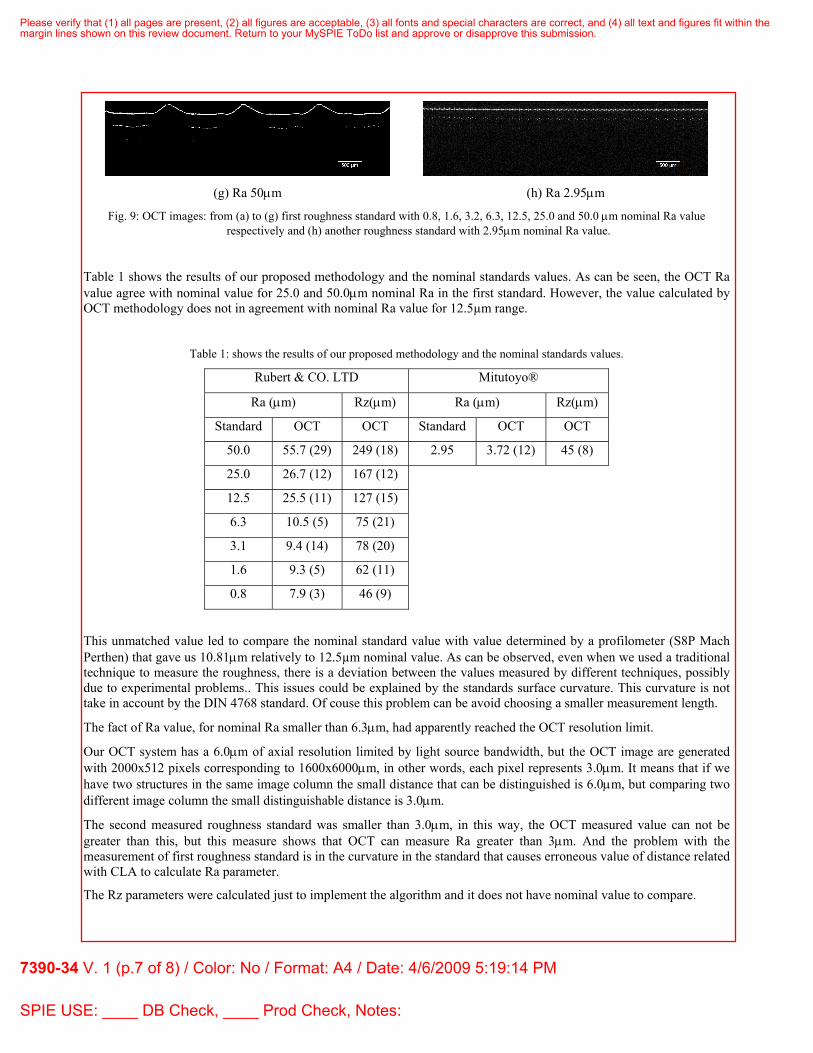
(g) Ra 50μm
(h) Ra 2.95μm
Fig. 9: OCT images: from (a) to (g) first roughness standard with 0.8, 1.6, 3.2, 6.3, 12.5, 25.0 and 50.0 μm nominal Ra value respectively and (h) another roughness standard with 2.95μm nominal Ra value.
Table 1 shows the results of our proposed methodology and the nominal standards values. As can be seen, the OCT Ra value agree with nominal value for 25.0 and 50.0μm nominal Ra in the first standard. However, the value calculated by OCT methodology does not in agreement with nominal Ra value for 12.5µm range.
Table 1: shows the results of our proposed methodology and the nominal standards values.
Rubert & CO. LTD Mitutoyo®
Ra (μm) Rz(μm) Ra (μm) Rz(μm)
Standard OCT OCT Standard OCT OCT
50.0 55.7 (29) 249 (18) 2.95 3.72 (12) 45 (8)
25.0 26.7 (12) 167 (12)
12.5 25.5 (11) 127 (15)
6.3 10.5 (5) 75 (21)
3.1 9.4 (14) 78 (20)
1.6 9.3 (5) 62 (11)
0.8 7.9 (3) 46 (9)
This unmatched value led to compare the nominal standard value with value determined by a profilometer (S8P Mach Perthen) that gave us 10.81μm relatively to 12.5µm nominal value. As can be observed, even when we used a traditional technique to measure the roughness, there is a deviation between the values measured by different techniques, possibly due to experimental problems.. This issues could be explained by the standards surface curvature. This curvature is not take in account by the DIN 4768 standard. Of couse this problem can be avoid choosing a smaller measurement length.
The fact of Ra value, for nominal Ra smaller than 6.3μm, had apparently reached the OCT resolution limit.
Our OCT system has a 6.0μm of axial resolution limited by light source bandwidth, but the OCT image are generated with 2000x512 pixels corresponding to 1600x6000μm, in other words, each pixel represents 3.0μm. It means that if we have two structures in the same image column the small distance that can be distinguished is 6.0μm, but comparing two different image column the small distinguishable distance is 3.0μm.
The second measured roughness standard was smaller than 3.0μm, in this way, the OCT measured value can not be greater than this, but this measure shows that OCT can measure Ra greater than 3μm. And the problem with the measurement of first roughness standard is in the curvature in the standard that causes erroneous value of distance related with CLA to calculate Ra parameter.
The Rz parameters were calculated just to implement the algorithm and it does not have nominal value to compare.
Please verify that (1) all pages are present, (2) all figures are acceptable, (3) all fonts and special characters are correct, and (4) all text and figures fit within themargin lines shown on this review document. Return to your MySPIE ToDo list and approve or disapprove this submission.
7390-34 V. 1 (p.7 of 8) / Color: No / Format: A4 / Date: 4/6/2009 5:19:14 PM
SPIE USE: ____ DB Check, ____ Prod Check, Notes:
4. CONCLUSIONS In this work a non contact roughness measure methodology was established to determine roughness parameter, it is very important mainly for samples that can suffer several problems when it is done in traditional way that uses physical contact. This methodology uses a commercial type OCT (Thorlabs Inc.) with 6.0μm axial resolution (in air) and 6.0μm lateral resolution and a custom made software analysis. This is the resolution when we look at a column of the OCT image, but when we are looking at consecutive columns this resolution is the pixel correspondence size (3μm). To validate this methodology comparison between OCT value and roughness standards values was made. Measurements of roughness standards with nominal Ra values of 0.8, 1.6, 3.2, 6.3, 12.5, 25.0 and 50.0μm were perform, but just the two last ones calculated Ra value agree with nominal value, and the four first ones presents reached the OCT resolution limit value. Than a second roughness standard, with 2.95μm nominal Ra value was measured. The OCT value reaches the resolution give by pixel correspondence size, confirming that the problem in the first roughness standard was that it has a curvature, and the DIN methodology use a straight line to determine the CLA for all the calculations.
REFERENCES
[1] Youngquist, R.C., Carr, S. and Davis, D.E.N. ,“Optical coherence-domain reflectometry: A new optical evaluation technique”, Opt. Lett. 12, 158-160 (1987).
[2] Takada, K., Yokohama, I., Chida, K. and Noda, J. , “New measurement system for fault location in optical waveguide devices based on an interferometric technique”, Appl. Opt. 26, 1603-1606 (1987).
[3] Huang, D., Swanson, E.A., Lin, C.P., et al. , “Optical coherence tomography”, Science, 254, 1178–1181 (1991). [4] Fercher, A. F., Mengedoht, K. and Werner, W. , “Eye-length measurement by interferometry with partial coherent
light”, Opt. Lett. 13, 1867-1869 (1988). [5] Freitas, A.Z., Zezell, D. M., Vieira Jr, N. D., Ribeiro, A. C., Gomes, A. S. L. , “Imaging carious human dental tissue
with optical coherence tomography”, J. of Appl. Physics 99, 2, 024906/1-024906/6 (2006). [6] Clivaz, W., Marquis-Weible, F., Salathe, R. P., Novak, R. P. and Gilgen, H. H. , “High-resolution reflectometry in
biological tissue”, Opt. Lett. 17, 4-6 (1992). [7] Schimitt, J. M., Knüttel, A. and Bonner, R. F. , “Measurement of optical properties of biological tissues by low-
coherence reflectometry”, Appl. Opt. 32, 6032-6042 (1993). [8] Melo, L. S. A., Araujo, R., Freitas, A.Z., Zezell, D. M., Vieira Jr, N. D., Girkin, J, Hall, A, Carvalho, M. T., Gomes,
A. S. L. , “Evaluation of enamel dental restoration interface by optical coherence tomography”. J. of Biom. Opt., 10, 6, 1-5 (2005).
Please verify that (1) all pages are present, (2) all figures are acceptable, (3) all fonts and special characters are correct, and (4) all text and figures fit within themargin lines shown on this review document. Return to your MySPIE ToDo list and approve or disapprove this submission.
7390-34 V. 1 (p.8 of 8) / Color: No / Format: A4 / Date: 4/6/2009 5:19:14 PM
SPIE USE: ____ DB Check, ____ Prod Check, Notes: