Embed Size (px)
Citation preview
Serviços Ambientais na Floresta Amazônica e
o seu Futuro
Ecosystem Services in the Amazon Rain
Forest and its Future
Philip M. Fearnside Instituto Nacional de Pesquisas da Amazônia (INPA)
http://philip.inpa.gov.br
"X Eugen Warming Lectures in Evolutionary Ecology: biodiversity and
ecosystem service in the tropics – now and beyond". Universidade Federal
de Minas Gerais, Belo Horizonte, 02 de dezembro de 2014.

http://inct-servamb.inpa.gov.br/
Instituto Nacional de Ciência e Tecnologia dos Serviços Ambientais da Amazônia – SERVAMB

Foto por Ansell Adams

• “These temple destroyers,
devotees of ravaging
commercialism, seem to have a
perfect contempt for Nature,
and, instead of lifting their eyes
to the God of the mountains, lift
them instead to the Almighty
Dollar.”
John Muir

Forum Mudanças Climáticas e Justiça Social, 2012, p.16.
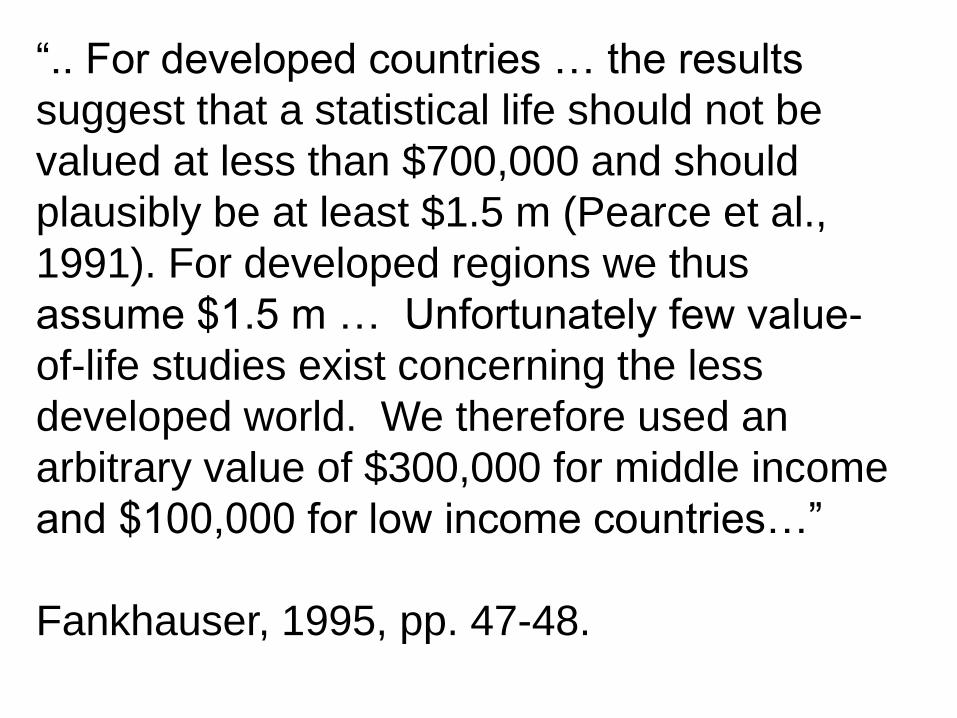
“.. For developed countries … the results
suggest that a statistical life should not be
valued at less than $700,000 and should
plausibly be at least $1.5 m (Pearce et al.,
1991). For developed regions we thus
assume $1.5 m … Unfortunately few value-
of-life studies exist concerning the less
developed world. We therefore used an
arbitrary value of $300,000 for middle income
and $100,000 for low income countries…”
Fankhauser, 1995, pp. 47-48.

Fearnside, P.M. 1989. Forest
management in Amazonia: The need for
new criteria in evaluating development
options. Forest Ecology and Management
27(1): 61-79.
Fearnside, P.M. 1997. Environmental
services as a strategy for sustainable
development in rural Amazonia.
Ecological Economics 20(1): 53-70.
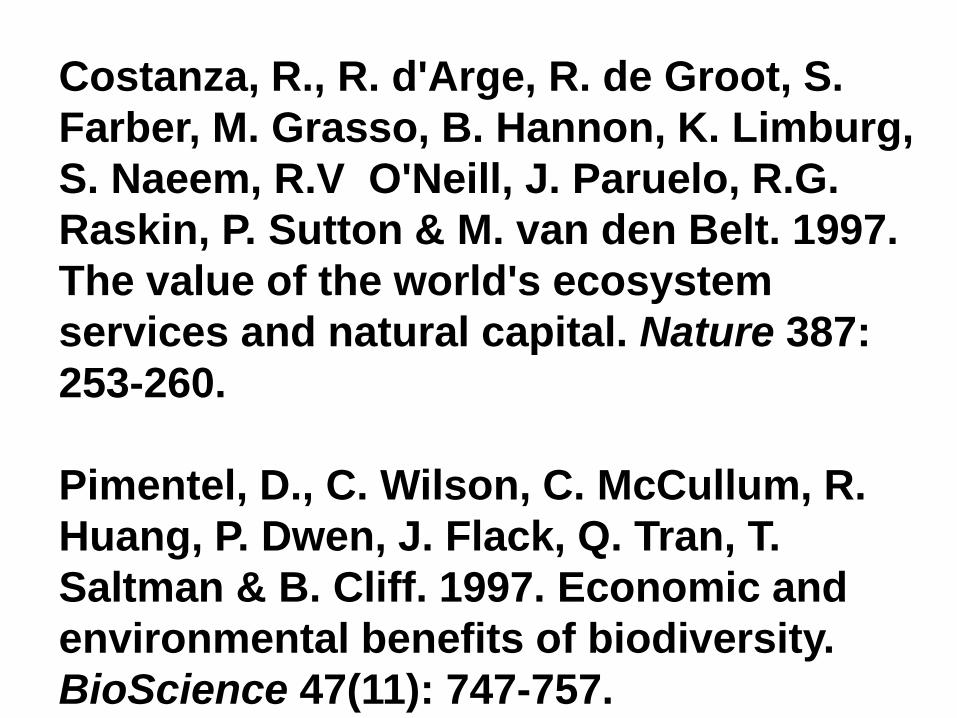
Costanza, R., R. d'Arge, R. de Groot, S.
Farber, M. Grasso, B. Hannon, K. Limburg,
S. Naeem, R.V O'Neill, J. Paruelo, R.G.
Raskin, P. Sutton & M. van den Belt. 1997.
The value of the world's ecosystem
services and natural capital. Nature 387:
253-260.
Pimentel, D., C. Wilson, C. McCullum, R.
Huang, P. Dwen, J. Flack, Q. Tran, T.
Saltman & B. Cliff. 1997. Economic and
environmental benefits of biodiversity.
BioScience 47(11): 747-757.

Nat Geogr. map

.. . . ....


Water fluxes in Amazonia
Description Volume of water
(1012 m3/year)(a)
Comparison with the
discharge of the
Amazon River (%)(b)
Transport (advection) from the Atlantic Ocean
into the region by the NE trade winds 10 ± 1 152%
Mean discharge of the Amazon River at its mouth 6.6 100%
Precipitation in the hydrographic basin of the
Amazon River 15.05 228%
Evapotranspiration 8.43 128%
Water vapor transported by winds to other
regions 3.4 ± 1 52%
(a) Values from review of Salati (2001), except for last item.
(b) Percentage in comparison with the mean flow at the mouth.

Fonte: http://ar.geocities.com/lapaginaderionegroyneuquen/temas/salltej.htm

)outh Ameâcan Low-Level .let )dob6r 2002 RB()O<l
u ,
•
r ,. .. . -·
l ...
PROSUR IAI Prcject CRN OSS
r tJ
-i
r.J~
• ~.'.JS 1
•
1 .lrt

Domínio: (76,2W – 47,6W; 13,2S – 5,5N)
- 184
-184
Correia, 2005
Unidade: 106 kg/s
202 mil toneladas
de vapor de água
por segundo em
uma área de
aproximadamente
6 milhões de
quilômetros
quadrados
Equivalem a
aproximadamente
1 metro de água
líquida no ano


.Ciência Hoje 34(203): 63-65 (2004) .


Governo quer reduzir desmata1mento em 72º/o Ministro ::liz que. até 2017, desmatamento no país deve cair 72%. Brasíl arrecadará cerca de US$ 1 bi por aro com Fundo Amazõnía
B rull11, or - ;i •11· n!strc oo Melo ~mD~nte C3rlo; >.!ínc. anunciou Ol"li.E-111 a
nllVa mef.ã !1e aesmal~ê!J'i· to º' <lOVe·no l•ceral para a Amal-Onia, Que 1!Slab<-lece planos QuaJrienals qce '.O·
talizam 72'lo d~ reàu~ão !las ár•as desm9ta= at~ 2017,
A reoução sena de 40% no P<im?lro Qt.adríênio CO'ltaóo a partir de 2006 e de 31)% em cada um ~óo,;periooos seQointes. r~lat"'°'rnen~ aos [email protected] a nlErior es. A ~S• usada p.;ra se c<t:nr as melas foi o períoao de l9% a 2005. Ja o período da prmeira :t~a doe rKJuçàv. de 2006 a <009. c:ocrE-SponOe ao segundo man· &!J) do ,,,..,id~nl~ lula
"'t"- ,,.. -.... ....., ......... ~ .• , ..... 1.
Mine. ISSO vai depe<>àer ae o governo feoernl fater 3/f<Jul.i· rt:ação lundiária e ~horar J iucal,zação. Va1dapeno•rtôll'" bim aos qovemos •slddua;,;, jt-contribulçôesdepa1.sesam1· qvs Pi'íil o Fundo Am.JZ~nico ~ :a~"' do cioaa~o sab~r .; ;llgemdamadeif!lvinóopara.; suames.a,parao$euarm3rio. ·j1sse o ministro.
Pl•not :J plane. de m~tds i;;mbém
~revê o aumento da partlcipaç~o do etar.ol e d·~ ootros b•OCOmbUSU\~6 na •nàlriz ererqelica ao e·as1I. P•ra o etan0t ~ metõ é um aumen10 de """ ao JOO nos prórlmos 15 anos. o aue resu1tari3 em uma 1 eduç~o df 508 mi t>õe5 ""' 1~r1.=< "!.Oco~ l,-fi.f-.adas

Ministerio do Meio Ambiente (MMA). The Brazilian Redd Strategy. MMA, Brasília,
DF, 29 pp. (2009).

20
,4
20
,4
20
,4
20
,4
20
,4
20
,4
20
,4
20
,4
20
,4
20
,4
20
,4
19
,0
13
,8
11
,1 1
3,8
1
4,9
14
,9
29
,1
18
,2
13
,2
17
,4
17
,3
18
,2
18
,2
21,2
25
,2
27,4
18,8
14
.3
11
.7
12
.9
7.5
7.0
6
.4
4.5
5
.9
0
5
10
15
20
25
30
35
78
81
84
87
90
93
96
99
02
05
08
11
Tax
a d
e d
esm
atm
en
to
(10
3 k
m2/a
no
)
Ano
Taxa anual de desmatamento
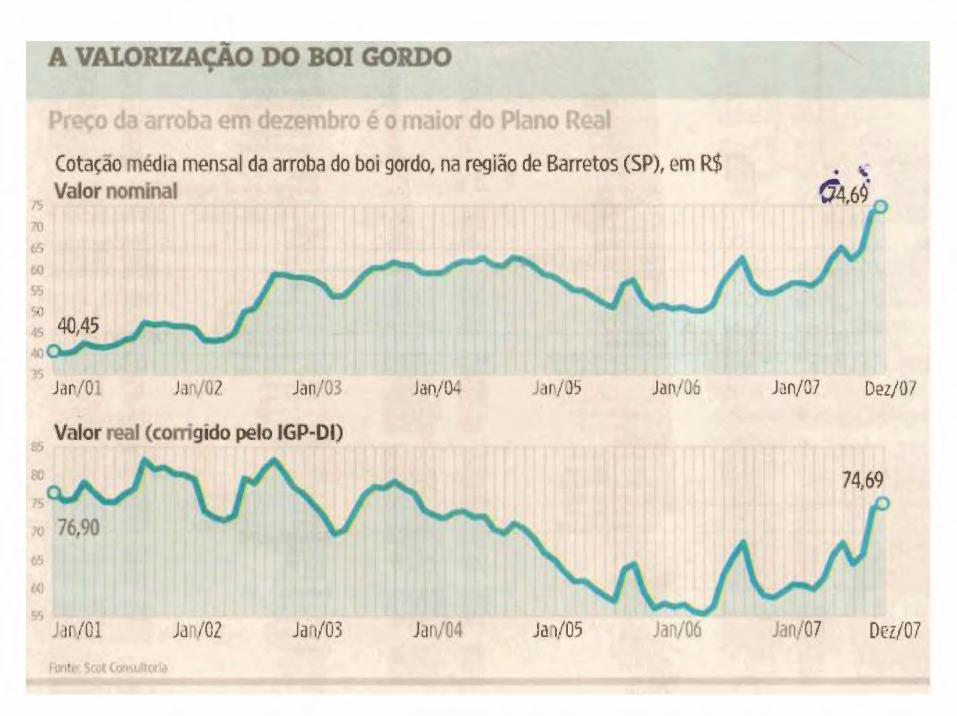
Cotação medi" mensal da arroba do boi gordo, na região de Barretos (SP), em R$ V orno 1
J ar. O J.1 02 J-in/03 Jan/Q. Jan/Ob Jrn/81 Dez/07
76.90
J li /01 )J /02 Ja 1/03 1~1vo Jcl i/05 Jan/06 Jan 07 Dc-z/07

A soja aumenta, a 1--~· A COl
- - -
tmJ desmBladO - - -
-
~~ --._------::;.-,~-...... ·-- - - ---~ l~~--~---- ~
. [p 1 ~

CLIMATE POLICY INITIATIVE RIO DE JANEIRO
Deforestation Slowdown in the Legal Amazon: Prices or Policies?
Climate Policy Initiative / PUC-Rio Juliano Assunção, Clarissa C. e Gandour, Rudi Rocha 6 February 2012

http://climatepolicyinitiative.org/2012/03/28/deforestation-slowdown-in-the-
brazilian-amazon-prices-or-policies/

Resolução BACEN nº 3.545/2008

Folha de S. Paulo, 08/11/14, Cotidiano, p. 10
Desmatamento em agosto e setembr,o 2009 - 2014: DETER
Aumento de
122% em 2014

Folha de S. Paulo, 08/11/14, Cotidiano, p. 1
Focos de desmatamento, agosto-setembro de 2014: DETER

Ciência Hoje 46(273): 66-67 (2010).
Ciência Hoje 28(163): 62-63. (2000)

Amazonas em Tempo

......

~'<?nezucl.:i
:::- !" ., t; r. ,, s
" .. t'
"' .. ~ Peru
" > 3: ... .. (•
"' · ~ ~ ,,
o ,; \ EIOhYla
~ Ç• -........ U1
g '"' .. 70"0'll'W 65'!7tTW
Área desmatada na .Amazô11ia até 2009
f;)"Q'fl''W 5~'0'0"W
<,!:1 CJpital e~tadual
Estrada oficial
Limite esladual
Unidüde de conservação
Terra mdlgena
Dl'Smat~rnento até 2009
Ms'tti~d•Pt'uj~o !i>ionUJA"ld.M. Ml .IJI Cl••1.a. \.AD U6i
Foote
114( hnff<e ti w .... run• ,.,.'" lhJ l .. tl.U
lh~• ,JmJ.d1Jd•.;'•nM1'\'1K'l• ltn.!Cft f1tJJitl'5
lnp• 011m1t~m•••H
Elabor.içáo

dUrlJá Ami;mn River
~~= F)Q;;id
N -- -Plannea Rõãél
A .-....._.. Plver ~O Kilometer;? • Oi\1'

Braga assina hoje Lei do Macrozoneamento·
1~11 •V .......................
... .- ..... •
TERRAS INDIGINA
(l.J.
ECOSSISTEMAS FRÂGJ;IS
<ª·')

Fearnside, P.M. & P.M.L.A. Graça.
2006. BR-319: Brazil’s Manaus-Porto
Velho Highway and the potential
impact of linking the arc of
deforestation to central Amazonia.
Environmental Management 38(5):
705-716. doi: 10.1007/s00267-005-
0295-y.

Introdução
Objetivos
Metodologia
Resultados
Esperados
Cronograma
40
Soares-Filho et al., 2006
DINAMICA-EGO
AGROECO
BAU “Business As Usual “
AGROECO
Conservação
Modelagem do desmatamento na Amazônia

Desmatamento
até 2050
(106 ha)
Percentagem
da ALAP
Emissão
Líquida
Comprometida
(Gt C-CO2)
Business as
Usual
5,1 38% 0,95
Conservação 3,4 22% 0,64
Diferença 1,6 16% 0,31
Cenários simulados para a ALAP da
BR-319 até 2050

Fearnside, P.M., P.M.L.A. Graça,
E.W.H. Keizer, F.D. Maldonado, R.I.
Barbosa & E.M. Nogueira. 2009.
Modelagem de desmatamento e
emissões de gases de efeito
estufa na região sob influência da
Rodovia Manaus-Porto Velho (BR-
319). Revista Brasileira de
Meteorologia 24(2): 208-233. doi:
10.1590/S0102-
77862009000200009

43
ÁREA DE ESTUDO:
• Superfície de 99.320,7
km²;
• Cortada pela BR – 174, BR
– 210, BR – 431 e pela
rodovia Estadual RR – 170;
•Pop. 61.000 habitantes
• Área desmatada: 3.750
Km², até 2007.
PRODES (2008)

44
Arquivos vetoriais de desmatamento do PRODES

Pastagem avança sobre a floresta no sul do Estado de
Roraima, região onde o desmatamento deve aumentar
devido à migração, caso seja ligada ao Arco de
Desmatamento pela proposta reabertura da rodovia BR-319
(Manaus-Porto Velho).

46
Gráfico de desmatamento anual acumulado

Barni, P.E.; P.M. Fearnside &
P.M.L.A. Graça. nd.
Simulating deforestation and
carbon loss in Amazonia:
impacts in Brazil's Roraima
state from reconstructing
Highway BR-319 (Manaus-
Porto Velho). Environmental
Management (in press).

Folha de S. Paulo 19/04/09 p. A-24.

Florestas podem prejudicar mercado de carbono, diz Greenpeace Os preços do mercado de carbono podem despencar
75 por cento se os créditos para a salvaguarda de
florestas forem acrescidos aos mercados para as
emissões industriais, disse a entidade ambientalista
Greenpeace na segunda-feira (30).
Estadão Online 31 Mar. 2009
Total expenditure ($)
Total Carbon (t) = ---------------------
Average price ($/t)

Wunder et al. 2008, p. 32

REDD and the etfort to limit global warriling to 2·c : lmpfications for includlng REDD credits in
the international carbon rnarket
30 March 2 0ID9
Greenpeaee lnterna tional
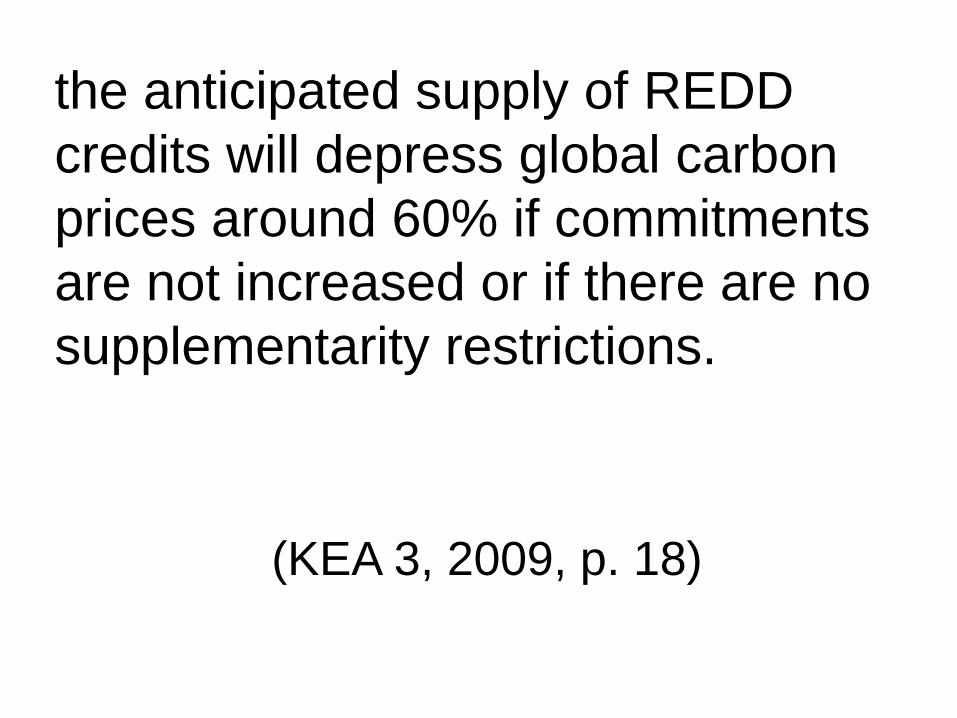
(KEA 3, 2009, p. 18)
the anticipated supply of REDD
credits will depress global carbon
prices around 60% if commitments
are not increased or if there are no
supplementarity restrictions.

B idging the Gap for Real Emission Reductions
Greenpeace views on the developrnent of existi ng and future carbon market mechanisms

Forest credits in the carbon market?
On forest protection, Greenpeace supports the
establishment of a multilateral forest fund replenished
through increased public financial support.
Furthermore, economic analysis shows that countries like
China, India and Brazil could lose tens of billions of dollars
for clean energy investments under the carbon market
mechanisms, if forest protection measures are included in
the carbon market.
Greenpeace calls on all Parties to oppose the
inclusion of REDD in the carbon market mechanisms.
(Greenpeace, 2009. Bridging the Gap for
Real Emission Reductions )

Greenpeace, 2008

Greenpeace, 2008, Forests for Climate, p. 19
In contrast [to carbon credit for REDD] , a
fund for forests could be designed to
compensate countries only for foregone
costs of not deforesting.
The result would be more efficient
expenditure of limited mitigation resources
and lower overall compliance costs for
industrialised countries.

Greenpeace, 2008, Forests for Climate, p. 14
It [REDD] … takes the focus
off of the need for countries
historically responsible for
the climate crisis to reduce
emissions at home.

it is unclear if, in the absence
of the cost-moderating effects
of REDD, the ambitious goals
proposed by the IPCC will be
agreed.
(KEA 3, 2009, p.
21)

Fearnside, P.M. 2013. What is at stake for
Brazilian Amazonia in the climate
negotiations. Climatic Change. 118(3):
509-519. doi: 10.1007/s10584-012-0660-9
Fearnside, P.M. 2012. Brazil's Amazon
Forest in mitigating global warming:
unresolved controversies. Climate
Policy 12(1): 70-81. doi:
10.1080/14693062.2011.581571

70º0'0"W
. pr---~~~~~~~
o o o
UJ . ? o o o ......
Peru
70º0'0"W
60º0'0"W
31
Bolivia l 14
- Mato Grosso -
60º0'0"W
50º0'0"W
Presas planificadas
Presas existentes
Amazonía Legal
7500 11250 15000 .. ::::..:::::1111 .... .:::=====-...... km
18753750
50º0'0"W
. ? o o o
UJ . p o o o ......

http://colunas.globoamazonia.com/philipfearnside/
PHILIP FEARNSIDE
http://amazoniareal.com.br/

COMMENTARY:
Greenhouse-gas emissions from tropical dams Philip M . Fearnside and Salvador Pueyo
Emissions from tropical hydropower are often underestimated and can exceed those of fossil fuel
for decades.
ropícal hydroelectríc darns, such as those in Amazonia, emit significant amounts of greenhouse gases, especíally
methane1-4
• These emíssions have been underestímated or ignored in many global and natíonal greenhouse-gas accounts. If any justification is given for omítting ali or part of these emíssions, ít is usually that they are controversial, uncertaín or wíth no consensus5• However, although uncertainty regarding the quantities emitted is substantial6
, darn emíssions need to be included in all accountíng based on the best
382
available data and calculation methods. Much of the wíde variation ín the emíssions ascríbed to tropical dams stems from omíssions and errors ín accounting, rather than from the physícal measurements that are nevertheless also subject to methodologícal problems.
The fact that substantial emissions are ínvolved can hardly be considered uncertaín, havíng been measured directly at reservoirs such as Balbina in BraziF and Petit Saut ín French Guiana1
• Dam emissions are of two types: reservoir surface or upstream emissions and those from the water that
passes through the turbínes and spillways (degassing or downstream emíssions). Where dam emissions are counted, they often ínclude only the upstream emissions, as in estímates by Centrais Elétricas Brasileiras S.A. (Eletrobrás)7. The recent Intergovernmental Panel on Clímate Change specíal report on renewable energy revíews lífe-cycle assessments for various technologies and, for the typícal case (the SOth percentile), ranks hydro as having half the impact or less compared wíth any other source íncluding solar, wínd and ocean energy5• The basis ín
NATURE CLIMATE CHANGE 1VOL 2 1JUNE2012 I www.natu re.com/ naturecl imatechange

Fearnside & Pueyo, 2012. Nature Climate Change

Oecologia Australis
15(2): 199-212, Junho 2011
doi:10.4257/oeco.2011.1502.02
EMISSÕES DE GASES DE EFEITO ESTUFA DOS RESERVATÓRIOS DE
HIDRELÉTRICAS: IMPLICAÇÕES DE UMA LEI DE POTÊNCIA
Salvador Pueyo1 & Philip M. Fearnside2*
Institut Català de Ciències del Clima (IC3), C/ Doctor Trueta 203, Barcelona,
08005, Catalunha, Espanha.
2 Instituto Nacional de Pesquisas da Amazônia (INPA), Avenida André Araújo,
2936, Caixa postal: 478. Manaus, AM, Brasil. CEP: 69011-970.
E-mails: [email protected], [email protected]

Pueyo & Fearnside, 2011. Oecologia Australis
m Jirau_ The world's largest renewable COM project obtains registration at the.pdf - Adobe Acrobat
File Edit View Window Help
@ 0 / l 1 ~ ô 1 e @ l l3Q% 1T11 [8] ~
OUR REGION OUR GROUP SUSTAINABLE DEVELOPMENT
JIRAU: THE WORLD'S LARGEST RENEWABLE COM PROJECT
OBTAINS REGISTRATION AT TH E UNITED NATIONS
IJ.1

(Grandin 2012, p. 14)
Figure 4 Bubbles in a tributary in Santo
Antônio.

(Grandin 2012, p. 28)

Folha de São Paulo, 23 de março de 2011, p B-6


Art 12

Santo Antônio Jirau
Duration (years) 10 7
Emission claimed 0 0
IRR Benchmark 10.35% 15.7%
IRR calculated 5.63% 7.5%
Annual credit (Mt CO2eq) 5.83 6.18
Total credit (Mt CO2eq) 51.5 43.3
Total credit (Mt C-eq) 14.0 11.8
Total value of credit (US$ billion) 1.32* 1.11
*Assumed to be the value per t CO2eq presented in the Jirau project.
CARBON CREDIT PROJECTS FOR THE
MADEIRA RIVER DAMS

CDM Hydro pipeline as of 30 January 2012[a]
Country Total Installed CO2e[c] % of
projects[b] capacity average/yr total
(MW) (million t) CO2e
China 1,410 61,280 179.7 62.2
Brazil 117 8,495 17.8 6.2
Other non-Annex I[d] 774 88,577 91.4 31.6
Total 2,301 158,352 288.9 100.0
[a] Data from Chu (2012) based on the UNEP Risoe Centre (http://cdmpipeline.org/).
[b] Includes both "large" (defined by the CDM as > 15 MW) and "small" (≤ 15 MW) projects.
[c] 1 ton carbon-dioxide equivalent (CO2e) = 1 certified emissions reduction (CER).
[d]Countries without limits on their emissions under the Kyoto Protocol.

GWP20 GWP100
CH4 No cc fb 84 28
With cc fb 86 34
IPCC WGI Fifth Assessment Report, Final Draft (7 June 2013) Chapter 8, Table 8.7,
p. 8-58.
http://www.climatechange2013.org/images/uploads/WGIAR5_WGI-
12Doc2b_FinalDraft_All.pdf

Tclcs_Pircs_Oam_COM_Mlll,pdf - A/J Rc er
File Ed it View Window Help
@ D 1 • • ~ (3ofll] 1 - + ~ 1 ~ f!j 1
JJi Thc file you havc opened comphes wft:h thc PDF/A standard and l'las bcen opened read·only to prevent modif1c11tion.
LO Bookma..-lu [õ]
[] ~-
B O' Carbon credit for
~
.g hydroelectric dams as a source of
t1 greenhouse-gas emissions: the
D' Abstract
O' lntroduction
O' The Teles Pires proj ect
O' Hydroclcctric emissions and the IPCC
O' Conclusions
O' References
Mitig Adapt Strateg Glob Change (20 13) 18:691-699 001 10. 1007/sl 1027-012-9382-6
ORIGINAL ARTICLE
copy
Carbon credit for hydroelectric dams as a source of greenhouse-gas emissions: the example of Brazil 's Teles Pires Dam
PhiJip M. Fcarnsidc
Received: 25 February 20 12 / Accepted: 9 April 2012 / Published online: 3 May 2012 © Springer Science+Business Media B.V. 2012
Toais Sign Comment
" - Chck on T ools to convert • ~~1documcnts to Word or
:!. • • •• 1 • u . • • • 1 • • ~- • • 1 • 1 1 1 li: • • ~ 1 •
"i' V. . 111>) ~ m1I ,. ..,.. E!""' . 1· · 1;:i ~ " 16.28 ' .,_ ..._, {f;;; ... llil 1
.. 01Jul13
úedit for clitnate tr1itigation by Arn azonian dam s: loopholes and impacts illu strated by Brazil's Jirau Hydroelectric Project


![[Superpartituras.com.Br] Highway to Hell v 2](https://img.document.onl/doc/110x75/55cf8eef550346703b972ab5/superpartiturascombr-highway-to-hell-v-2-569925179b2c4.jpg)