Embed Size (px)
Citation preview

1 1
Corporate Presentation March 2012

100% 100% 100% 100% 100% 100% 51% 100% 51% 20%
25.85%
Light
Energia
S.A.
Light
Serviços de
Eletricidade
S.A.
Light Esco Prestação de
Serviços S.A.
Lightcom Comercializadora
de Energia S.A.
Itaocara
Energia
Ltda.
Light
Soluções em
Eletricidade
Ltda.
Instituto
Light
Lightger
S.A.
Axxiom
Soluções
Tecnológicas
S.A.
CR Zongshen
E-Power Fabricadora de
Veículos Ltda.
Renova
Energia S.A.
Light S.A.
(Holding)
25.5%
Amazônia
Energia
S.A.
33%
EBL
Cia de
Eficiência
Energética
S.A
Distribution Generation Commercialization and Service System Electric
Vehicles
Institutional
Light Holdings
Norte
Energia S.A.
9.77%
2
Guanhães
Energia
51%

3 3
Integrated
Net Revenues 2010 – R$ Billion
52.044
43.737 43.345
30.562
22.384 22.358
Distribution
Energy Consumption in Concession Area (2010) - GWh1
Generation Private-owned Companies
Installed Hydro-generation Capacity (MW) – oct.11
5.630
2.660 2.307
2.150 1.790
866
12,9
12,1
8,9 6,9
6.2 5,1
Rankings
Souce: Companies reports
Note: 1 – Captive market + free clients
2 – It doesn’t consider the consumption of CSN and CSA
Among the largest players in Brazil

CEMIG RME LEPSA BNDESPAR MARKET
FIP LUCE
LUCE LLC
PARATI
CEMIG FIP
REDENTOR
REDENTOR
ENERGIA
26.06% 13.03% 13.03% 15.02% 32.85%
100%
75% 25%
13.03% 13.03% 100%
96.80%
75% 9.77%
6.41% 19.23%
BTG
PACTUAL
SANTANDER
VOTORANTIM
BANCO DO
BRASIL
28.57%
5.49%
28.57%
5.49%
28.57%
5.49%
14.29%
2.75%
25%
MINORITY
SHAREHOLDERS
3.20% 0.42%
Free Float 47.9%
100% 25.64%*
FOREIGN NATIONAL
66.94% 33.06%
Percentage in blue: indirect stake in Light
*12.61% (RME) + 13.03%(LEPSA)
Light S.A.
(Holding)
Controlling Shareholders
52.1%
Shareholders Structure
11 Board members: 8 from the controlling
group, 2 independents e 1 employees
nominated
A qualifying quorum of 7 members to
approve relevant proposals such as: M&A
and dividend policy
Indirect stake in blue
4

5 5
Controller discussion
group
Controller group Minority
General Assembly
Fiscal Council
Board of Directors
Auditors
Committee
Governance and
Sustainability
Committee
Human Resources
Committee
Finances
Committee
Management
Committee
Management
Shareholders
Interface
11 Board members: 2 independent
and 1 employees nominated
2 years term
Fiscal Council
Manual of Corporate Governance
Corporate Governance
LGSXY ADR-OTC

6 6
Distribution Business
• 4.0 million clients (serving 10 million people)
• Energy sales (2011) – 22,932 GWh
• 70% of the consumption of Rio de Janeiro state (Brazil’s
2nd GDP)
5th largest energy distribution company in Brazil
LIGHT

Industrial Residencial Comercial outros Livre
ELECTRICITY CONSUMPTION¹
TOTAL MARKET (GWh) - Year
¹ Note: To preserve comparability in the market approved by ANEEL in the tariff adjustment
process, the billed energy of the free customers Valesul, CSN and CSA were excluded in view
of these customers’ planned migration to the core network.
RESIDENTIAL
35.5%
INDUSTRIAL 8.1% OTHERS
15.3%
FREE
14.0%
COMMERCIAL
27.2%
+2.5%
22.1 ºC 21.7 ºC
22.0 ºC 21.7 ºC
+3.1% a.a
Energy Consumption
Distribution
7
24.5 ºC 23.9 ºC
2011 2010 2009 2008
25.0 ºC 23.8 ºC
15,5
17,5
19,5
21,5
23,5
25,5
27,5
2008 2009 2010 2011
Série1
22,932 22,384 21,491 20,928

2010 20112010 2011 2010 2011 2010 2011 2010 2011
ELECTRICITY CONSUMPTION (GWh)
TOTAL MARKET - YEAR
2011 2010 2011 2010 2011 2010 2011 2010 2011 2010
+2.5%
19,459 19,877
22,384
2.924 3.056
22,932
+2.5%
3,342 3,417
3,516
185
3,603
+4.3%
6,157 6,310
6,679
523
6,967
0.0%
3,945
1,717 1,731
3,944
+2.1%
8,243 8.418
174
657
2,228 2,213
RESIDENTIAL INDUSTRIAL COMMERCIAL OTHERS TOTAL
CAPTIVE FREE
Total Market

9
Prospects for Rio de Janeiro
R$ 181 billion in investments¹
2011-2013
¹Source: Firjan (Industry Federation of Rio de Janeiro)
Oil
R$ 107.9 bn
59.5%
Tourism
R$ 0.9 bn
0.5%
Others
R$ 6.7 bn
29.5%
Transformation Industry
R$ 29.5 bn
16.3%
Infrastructure
R$ 36.3 bn
20.0%

10
-Maracanã (ND)
-Port Maravilha (ND)
-Morar Carioca (ND)
- International Airport (5MW)
- Inhauma Shipyard (ND)
-Atento (2MW)
-Expansion Nova América (4MW)
-Expansion Norteshopping (3MW)
S Ã O
P A U L O
M
I
NA S
G
E R
A
I
S
Be lfordRoxo
S.J .Me riti
Nilópolis
Ca xias
NovaIgua çu
Magé
Niterói
São Gonçalo
Petrópolis
Pati do Alferes
Migu el Pe re ira
Sapuc aia
Sumidouro
Ca rmo
Duas Barras
de FrontinEng. Paulo
Vassouras
Me nde s
Paracambi
Ita gua i
Que imados
Japeri
Qua tisPorto Re alRe send e
Pinhe iral
Volta R edonda
Ba rra d o Piraí
Valença
R es tinga de Mar amba ia
Rio Cla ro
Piraí
Ba rra Mansa
Banan al
Passa Vinte
Santa Rita de Jacutinga
Rio Preto
Rio da s Flores
Chia dor
Santana do De se rto
Além Paraíba
dos R eisAngra
Ma nga ratiba B a í a de S e p e t i b a
ILHA GRANDE
Volta Grande
Seropedica
Paraiba do Sul
Três Rios
Com.Levy Gasparian
Teresópolis
Areal
do Rio PretoSão José do Vale
RIO DE JANEIR O
-Petrobras (15MW)
-CSN (100MW)
-Gerdau (30MW)
-Usiminas (20MW)
-LLX (40MW)
-Base Naval(25MW)
-Hotel Comfort (3MW)
-Gerdau (90MW)
-Shop.CampoGde(3MW)
-Nestlé (3MW)
Rio Janeiro
-Bio Manguinhos (ND)
-Hermes (3MW)
-Votorantin (ND)
-Ongoing (ND)
-Bunge (ND)
-AMBEV (2MW)
-GE (6MW)
-Shop. Metropolitano (10MW)
-RHI (5MW)
-Lavazza (3MW)
-Ajebras (5MW)
-Reluz (ND)
-Embelleze (5MW) -MRS (ND)
-AMBEV (ND)
-Coquepar (42MW)
-Procter & Gamble (10MW)
-Alpargatas (ND)
Economic activity leading to more demand

2009 2010 2011
Total Varejo Grandes Clientes Poder Público
2010 2011
PDD / GROSS REVENUE COLLECTION RATE BY SEGMENT
YEAR
97.9% 97.4% 94.3% 94.1% 100.8% 101.0%
107.1% 102.6%
2010 2011
3.2% 3.2%
2009 2010 2011
3.1%
Total Retail Large
Customers Public Sector
Collection
11

2010 2011
2010 2011
dez/10 mar/11 jun/11 set/11 dez/11
INCORPORATION
GWh
2011 2010
169.3 178.2 -12.0%
RECOVERY
GWh
2011 2010
140.4
67.6
LOSS (12 MONTHS)
41.6%
35.1%
5,278 5,326
2,231
7,493 7,543
41.8%
+107.8% Mar/11 Dec/10
2,215
5,312
41.3%
5,299
2,293
7,619
Jun/11 Sep/11
7,627
40.7%
1S10 1S11
Dec/11
5,256
2,328
7,591
40.5%
1S10 1S11
2,335
% Non-technical losses / Low
voltage market
Technical losses GWh
% Non-technical losses / Low
voltage market - Regulatory
Non-technical losses GWh
Dec/11
Loss prevention
12

13
New Technology Program
Technology used in regions in which conventional measures are not effective
Areas that present high levels of non-technical losses
Light aims to reduce losses through investments in new technologies, integration of operational
activities, increase of public awareness and institutional partnerships with interested agents
Grid shielding projects
75 412
REDE ATUAL
75 412
REDE BLINDADAActual grid Shielded grid
Control room
3 m
9 m
Low
voltage
Mechanical
Meter
Medium
voltage
Display
Low
voltage
Medium
voltage
Centralized
meter

14
New Technology Program
Monitoring, reading, cutting and
reconnection of customers telemetry–
MCC (Measuring Center Centralized)
Prioritization in areas of high losses and
aggressiveness to the network
Technology hindering inappropriate
interference in networks
Meters Installed (as of Dec, 2011)
TOTAL INDIVIDUAL CENTRALIZED
38,000
208,000
160,000
(ITRON) (LANDIS GYR
CAM and
ELSTER)

15
Losses (before): 26%
Losses (current): 5%
New Technology Results - Individual

16 16
New Technology Results - Centralized
Losses (before): 53%
Losses (current): 11%

17
Program Gains – An example
300 kWh
100 kWh
REAL
CONSUMPTION
BILLED
CONSUMPTION
NEW METER
INSTALLATION
200 kWh
LOST ENERGY
ENERGY SAVED
100 kWh
BILLED CONSUMPTION
INCREASE
100 kWh
OTHER EFFECTS (BY-PRODUCTS):
CAPEX GOES TO
THE RAB
BAD DEBT
PROVISION
REDUCTION
OPERATIONAL
COSTS
REDUCTION

18
Transformation of risky areas

19
Outcome of Actions in Pacified Communities
Before After Before After
Clients 80 1.593 Clients 1.054 1.635
Losses 90% 1% Losses 68% 51%
Delinquency 70% 3% Delinquency 79% 36%
Clients 408 600 Clients 295 1.281
Losses 56% 2% Losses 50% -
Delinquency 74% 3% Delinquency 70% 21%
Clients 2.800 3.826 Clients 199 1.673
Losses 61% 7% Losses 50% -
Delinquency 68% 9% Delinquency 70% 22%
Clients 389 1.017 Clients 2.241 3.135
Losses 73% 7% Losses 55% -
Delinquency 54% 13% Delinquency 48% -
Clients 470 807 Clients 199 1.673
Losses 58% 9% Losses 61% -
Delinquency 52% 14% Delinquency 48% -
Clients 0 423
Losses 100% 8%
Delinquency 100% 10%
Formiga
Borel
Community Community
Cantagalo
Tabajaras
Cabritos
Santa Marta
Chapéu
Mangueira
Cidade de
Deus
Babilônia
Casabranca
Batan

20 20
Generation Business

21
Installed Capacity
HPP Santa Branca
56 MW
HPP Ilha dos Pombos
187 MW
HPP Fontes Nova
132 MW
HPP Underground Nilo Peçanha - 380 MW
HPP Pereira Passos 100 MW
SP
RJ
HPP Santa Branca
Paraiba do Sul River
HPP Ilha dos Pombos
Installed Capacity
855 MW
100% 100%
100% 100% 100%
Lajes
Complex

22
Re-pricing of existing energy
2008-2012
27
2013
27
2014
27
510
146
234
130
276
234
Contracted Energy
Uncontracted Energy
New Contracts
Hedge
GENERATION
Assured energy: 537MW average

Capacidade Atual
(+) PCH Paracambi
(+) PCH Lajes
(+) UHE Itaocara
(+) Renova (+) Belo Monte
Capacidade após
expansão
Installed Capacity (MW)
+ 75.4%
866 13 9 74
277
1,519 280
(+) Renova² (+) Belo
Monte³
SHP
Paracambi¹
SHP
Lajes¹
Current
Capacity HPP
Itaocara¹
Capacity
After
Expansion
Investments in Renova and Belo Monte, in line with our strategy of growing
in the generation business
¹ Considering 51% stake
² Considering 25.9% stake
³ Considering 2.5% stake
New Generation Projects
23

24
Co
ntr
act
Sit
es
Term
(years
)
Ind
ex
Op
era
tio
n S
tart
up
(Esti
mate
d)
Insta
lled
Cap
acit
y
(MW
)
Av
era
ge L
oad
Facto
r (%
)
Esti
ma
ted
En
erg
y
(MW
av
era
ge)
To
tal C
AP
EX
(R$ M
N)
Realized
CA
PE
X
(R$ M
N)
Lo
an
Tari
ff
(R$/M
W)
SHPP 3 20 IGPM In operation
since 2008 41.8 61.3 24.2 189 -
BNB
Contracted 185.17
LER 2009 14 20 IPCA Jul - 2012 293.6 50.7 148.9 (*) 1,170 761.7 BNB
Contracted 145.81
LER 2010 6 20 IPCA Sep - 2013 162 53.6 86.8 (*) 599 14.1 BNDES
application 121.25
Y-3 2011 9 20 IPCA Mar - 2014 212.8 50.8 108.1 (*) 702 - BNDES
application 98.53
PPA Light 1 10 (E) 20 IPCA 2015 200 50.0 (E) 100 (E) 660 - - -
PPA Light 2 10 (E) 20 IPCA 2016 200 50.0 (E) 100 (E) 660 - - -
Renova – Contracts
* Does not considered the network basic losses.

25
Belo Monte Overview
51.0% CS
0.0% PS 49.0% CS
100.0% PS
Amazônia Energia
Participações S.A
Norte Energia S.A
(Belo Monte)
9.77%
74.5% of total stock 25.5% of total stock
Technical data on the concession:
Concession period – 35 years
End of concession – August 25, 2045
Technical data on the project:
Installed capacity - 11,233 MW
– Main engine room – 11,000 MW
– Auxiliary engine room – 233 MW
Assured Energy (Average MW) – 4,571 MW
Reservoir – 516 Km²
Flooded area/generation ratio of 0.05 Km²/MW
5,000 families affected
Estimated project cost (April 2010) – R$ 25.8 billion
Other Informations:
Amazônia Energia will own 9.77% of the enterprise.
– Construction works estimated to take 9 years.
– Transaction does not affect Light ‘s dividend flow
BNDES loan ensures leverage at low cost on favorable terms.
– Tender 30 years, fixed installments, 85% of items financiable, PSI line.
Amazônia Energia’s equity in the project estimated at R$ 150 million (Apr.
2010), to be disbursed over 6 years.
Expansion of generation portfolio:
– Increases Light’s total generation portfolio by 280 MW
Terms for sale of electricity generated already set.
− Regulated Market: 70%; Free Market: 20%; Self-producers: 10%.
Public sector
49,98%
Others privates30,25%
Amazônia Energia9,77%
Self prod.10,00%
Norte Energia S.A. – Shareholders Profile

26
Guanhães
TOTAL CAPEX
R$ Million
PCH
Dores de
Guanhães
Senhora do
Pôrto Jacaré Fortuna II Total
Installed Capacity
(MW) 14 12 9 9 44
Assured Energy
(MWaverage) 8 6.77 5.15 5.11 25.03
ANEEL Authorization 11/22/2002 10/08/2002 10/29/2002 12/21/2001
Operation - Start up Dec/13 Dec/13 Feb/14 Oct/13
Authorization Term 30 years (with renewal for 20 years)
269.2
60.2
57.8
151.2
Equity
Debt
Light Energia
Cemig GT
BNDES

27 27
Results

28
NET REVENUE BY SEGMENT (2011)*
NET REVENUE FROM DISTRIBUTION (2011)
Commercial 30.3%
Industrial 8.4%
Others (Captive) 13.5%
Network Use (TUSD) 2.3%
Residential 45.6%
Distribution 91.6%**
Commercialization 3.0% Generation 5.4%
(Free + Concessionaires) 4T10 4T11 2010 2011
NET REVENUE
(R$ MN)
+4.7%
1,733.1
1,815.1
4Q11 4Q10 2011 2010
6,508.6 6,944.8
+6.7%
195.8 237.8
1,537.3 1,577.3
794.6
5,955.8
6,150.1
552.8
91,57%
5,38% 3,05%
2011
2011
3.3%
2.6%
Construction revenue
Revenue w/out construction revenue
*Eliminations not considered ** Construction revenue not considered
Net Revenue

4T10 4T11 2010 2011
Manageable
(distribution): R$ 1,252.7
(23.4%)
Generation and
Commercialization: R$ 323.9
(6.1%)
Non – Manageable
(distribution): R$ 3,772.2
(70.5%)
DISTRIBUTION MANAGEABLE COSTS (R$MN)
COSTS (R$MN)*
2011
4Q11 4Q10 2011 2010
-15.6%
330.1 278.7
1,136.0 1,252.7
+10.3%
R$ MN 4Q10 4Q11 Var. 2010 2011 Var.
PMSO 198.8 149.6 -24.8% 637.4 646.5 1.4%
Provisions 57.2 56.8 -0.8% 208.4 299.4 43.7%
PDD 49.3 35.3 -28.5% 254.8 251.3 -1.4%
Contingencies 7.9 21.5 171.8 -46.4 40.8 -
Depreciation 74.0 72.3 -2.3% 290.2 306.8 5.7%
Total 330.1 278.7 -15.6% 1,136.0 1,252.7 10.3%
Não gerenciáveis; 3.772,2; 70,52%
Gerenciáveis; 1.252,7; 23,42%
Geração e Comercialização;
323,9; 6,06%
2011
*Eliminations not considered
Operating Costs and Expenses
29
Distribuição ; 994,3; 79,29%
Geração; 244,0; 19,46%
Comercialização; 15,7; 1,25%
2011
4T10 4T11 2010 2011
CONSOLIDATED EBITDA
(R$MN) EBITDA BY SEGMENT*
2011
Generation 19,5% (EBITDA Margin: 72,7%)
Commercialization 1,3% (EBITDA Margin: 8,3%)
Distribution 79.3% (EBITDA Margin :17.4%)
339.1 328.1
-3.3%
4Q11 4Q10 2011 2010
1,584.6
1,243.6
-21.5%
*Eliminations not considered
EBITDA
30
EBITDA - 2010 Receita Líquida Custos Não Gerenciáveis
Custos Gerenciáveis
(PMSO)
Provisões EBITDA - 2011
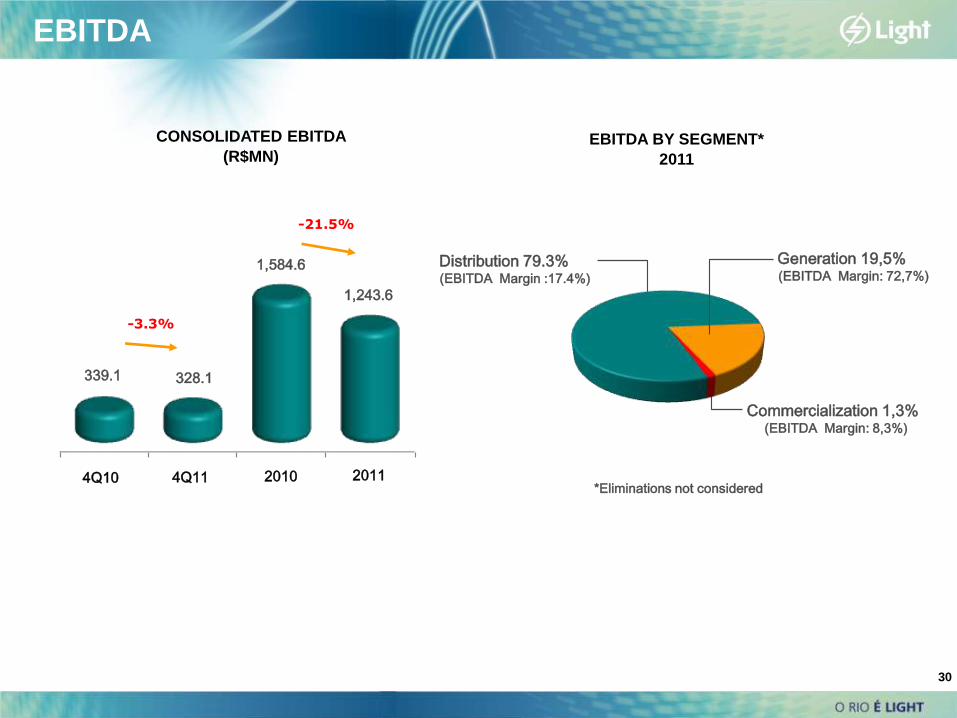
EBITDA - 2011/2010 - R$ Milhões
EBITDA CONSOLIDATED – 2011/2010
R$ Million
EBITDA
2010 Non - Manageable
Costs
Provisions EBITDA
2011
1,585
194
(436) (17) (83)
1,244
Net Revenue Manageable
Costs (PMSO)
31
EBITDA

2010 EBITDA Resultado Financeiro
Impostos Outros 2011
Lucro Líquido - Semestre
R$ MilhõesNET INCOME
R$ MILLION
2010 EBITDA Financial
Result Taxes Others 2011
575
(341)
(138)
243
(28)
311
Net Income
32

2007 2008 2009 2010 2011
33
PAYOUT AND DIVIDEND POLICY
Dividends (R$ MN) Dividend Yield*
DIVIDENDS AND DIVIDEND YIELD
Dividends
•Based on the closing price of the day before the announcement •Based on Net Income of the year, before IFRS adjustments
1H08 2H08 2H09 1H11 1H09 1H10 2H10 2H11
Interest on Equity (R$ MN)
1S08 2S08 1S09 2S09 1S10 2S10 1S11 2S11 1S121H12
203
351 408
187
432
363 351
205
87
118
182
4.2%
8.2%
1.7%
6.1%
9.9% 8.1% 8.1%
3.4% 3.3%
100% 100%
76.3%
2007 2008 2009*
Payout
50%
2010
81.0%
Dividend Policy
2007 2008 2009 2010 9M112011
100%

2007 2008 2009 2010 2011
2007 2008 2009 2010 2011
DL/EBITDA
DL/EBITDA
34
Indebtedness leverage
¹ Net debt = total debt (excludes pension fund liabilities) – cash
² EBITDA Pro Forma, not considering costs of profit sharing costs in 2007.
Net Debt¹ (R$ MM) and Net Debt / EBITDA
Net Debt Net Debt/ EBITDA
Rating
(brA - )
Investment
Grade
(brA)
20072
1,580
2008
1,637
2009
1,947
1,462
2010
1.3 1.1 1.2 1.2
2011
3,383
2.7
Rating
(brA + )
Rating
(Aa2.br)
Rating
(AA-(bra))
Dec/11

2011
2008 2009 2010 2011
Custo Nominal Custo Real
2012 2013 2014 2015 2016 Após 2016
jan/10 jan/11
Maturity: 2.8 years
AMORTIZATION * (R$ MN)
421
541
778
581 680 598
2010 2009 2008
Dec/11 Dec/10
3,383.2
1,947.4
NET DEBT EVOLUTION
1.2 2.7
2007 2008 2009 set/10
Custo Real Custo Nominal
2007 2008 2009 set/10
Custo Real Custo Nominal
2007 2008 2009 set/10
Custo Real Custo Nominal
4.51%
11.01%
7.62%
13.97%
5.30%
9.84%
4.88%
11.08%
COST OF DEBT
2011
US$/Euro
0.7%*
CDI/Selic
69.0%
TJLP
30.3%
After 2016
* Only Principal
Nominal Cost Real Cost
* Considering Hedge
Indebtedness
35

2007 2008 2009 2010 2011
CAPEX BREAKDOWN (R$MM)
2011
2009 2008 2007
563.8 546.7
CAPEX (R$MN)
700.6
2010 2011
+32.5%
354.7
928.6
Transfer of funds (R$MN)
2011
RENOVA 360.0
BELO MONTE 37.7
AXXIOM 1.0
LIGHT SOLUÇÕES 1.3
E-POWER 0.3
ITAOCARA 7.2
LIGHTGER 4.6
TOTAL 412.1
Develop. of Distribution
SystemR$ 390.1
Losses CombatR$ 184.3
Quality Improvements
R$ 200.5
New Generation
Projects
R$ 60.8
Generation Maintenance
R$ 29.0
OthersR$ 63.9
Investments
36

37
This presentation may include declarations that represent forward-looking statements according to Brazilian regulations and
international movable values. These declarations are based on certain assumptions and analyses made by the Company in
accordance with its experience, the economic environment, market conditions and future events expected, many of which
are out of the Company’s control. Important factors that can lead to significant differences between the real results and the
future declarations of expectations on events or business-oriented results include the Company’s strategy, the Brazilian and
international economic conditions, technology, financial strategy, developments of the public service industry, hydrological
conditions, conditions of the financial market, uncertainty regarding the results of its future operations, plain, goals,
expectations and intentions, among others. Because of these factors, the Company’s actual results may significantly differ
from those indicated or implicit in the declarations of expectations on events or future results.
The information and opinions herein do not have to be understood as recommendation to potential investors, and no
investment decision must be based on the veracity, the updated or completeness of this information or opinions. None of the
Company’s assessors or parts related to them or its representatives will have any responsibility for any losses that can
elapse from the use or the contents of this presentation.
This material includes declarations on future events submitted to risks and uncertainties, which are based on current
expectations and projections on future events and trends that can affect the Company’s businesses. These declarations
include projections of economic growth and demand and supply of energy, in addition to information on competitive position,
regulatory environment, potential growth opportunities and other subjects. Various factors can adversely affect the estimates
and assumptions on which these declarations are based on.
Important Notice

38
Annex

39
Highlights
Geographic Distribution
Energy Auctions
Inventaries
Basic projects
Wind projects
1st listed renewables company on
BM&FBovespa
Former prospections assured one of the best
spots for wind projects
1.461 MW in SHPs projects
2.042 MW in Wind projects
Top of the class suppliers and strong
financial sponsors
Origination and organization of project
finance
42 MW operating trough 3 SHPs (2008)
1.096 MW wind energy already contracted
1.096 MW of
wind energy in
implementation
42MW of SHPs
in operation
The largest seller in 2009 reserve
energy auction
Renova
The largest seller in 2010 reserve
energy auction
The second largest seller in 2011
reserve energy auction

Tariff Readjustment
Financial
Additions
2010
Economic
Readjustmen
t
Average
Perception for
Consumers
-1.33%
+7.90% +7.21%
~ +
Financial
Additions
2011
- 0.64%
-
Total
Readjustmen
t
+6.57%
=
Captive 7.79%
HV 4.64%
MV 7.77%
LV 7.98%
Free 8.06%
HV 7.14%
MV 9.65%
LV 11.07%
Gen. 7.27%
Distr. 11.92%
Starting November , 7, consumers will notice, on average, an increase of 7.90% on tariffs
40

3rd Tariff Review – Final Proposal
41
X Factor Formula: X = Pd + Q + T
Formula: Pd (i=Light) = 1.11% + 0.313 x (VarMWh (Light) – 4.25%) – 0.260 x (VarUC (Light) – 3.58%)
Q = Crossing matrix: Quality Index.i = ½ x (ELC realized/ELC limit + EFC realized/EFC limit) – Comparison with peers over quartiles =
general rule, best and worst performance with the annual quality evolution. Result between +1.0% and -1.0%;
T: Trend between the update of the operating costs defined in the second Tariff Review, considering the productivity gains and real
costs updated - Interval = 99% and 119%. Result between +2.0% and -2.0%.
Accounting: Special Obligation account;
Due date: It will be deducted of the RAB (Regulatory Asset Base) from the 4th Tariff Review on, in the case of Light in 2018
Main objective: These revenues would become investment in the concession area with no regulatory remuneration, instead of reducing
the company’s required revenue.
Others Revenues
WACC Component Formula 3rd Tariff Revision 2nd Tariff Revision
Business and financial risk premium b.(rm-rf) 4.31% 4.70%
Country risk rb 4.25% 4.91%
Nominal cost of equity rp 13.43% 16.71%
Real cost of equity 10.72% 13.75%
Cost of Debt
Credit risk rc 2.14% 2.96%
Nominal cost of debt rd 11.26% 14.97%
Real cost of debt 8.60% 12.06%
Weighted Average Cost (with 34% of taxes)
Nominal WACC after tax rwacc 10.13% 12.81%
Real WACC after tax rwacc 7.50% 9.95%
Capital Structure
Equity 45.00% 42.84%
Debt 55.00% 57.16%

42
Contacts
João Batista Zolini
Carneiro CFO and IRO
Gustavo Werneck IR Manager
+ 55 21 2211 2560
www.light.com.br/ri