Embed Size (px)
Citation preview

Revista Brasileira de Ciência do Solo
ISSN: 0100-0683
Sociedade Brasileira de Ciência do Solo
Brasil
Bellinaso, Henrique; Melo Demattê, José Alexandre; Araújo Romeiro, Suzana
SOIL SPECTRAL LIBRARY AND ITS USE IN SOIL CLASSIFICATION
Revista Brasileira de Ciência do Solo, vol. 34, núm. 3, mayo-junio, 2010, pp. 861-870
Sociedade Brasileira de Ciência do Solo
Viçosa, Brasil
Available in: http://www.redalyc.org/articulo.oa?id=180215874026
How to cite
Complete issue
More information about this article
Journal's homepage in redalyc.org
Scientific Information System
Network of Scientific Journals from Latin America, the Caribbean, Spain and Portugal
Non-profit academic project, developed under the open access initiative
SOIL SPECTRAL LIBRARY AND ITS USE IN SOIL CLASSIFICATION 861
R. Bras. Ci. Solo, 34:861-870, 2010
SOIL SPECTRAL LIBRARY AND ITS USE IN SOIL
CLASSIFICATION(1)
Henrique Bellinaso(2), José Alexandre Melo Demattê(3) & Suzana
Araújo Romeiro(4)
SUMMARY
Soil science has sought to develop better techniques for the classification ofsoils, one of which is the use of remote sensing applications. The use of groundsensors to obtain soil spectral data has enabled the characterization of these dataand the advancement of techniques for the quantification of soil attributes. Inorder to do this, the creation of a soil spectral library is necessary. A spectrallibrary should be representative of the variability of the soils in a region. Theobjective of this study was to create a spectral library of distinct soils from severalagricultural regions of Brazil. Spectral data were collected (using a Fieldspecsensor, 350–2,500 nm) for the horizons of 223 soil profiles from the regions of Matão,Paraguaçu Paulista, Andradina, Ipaussu, Mirandópolis, Piracicaba, São Carlos,Araraquara, Guararapes, Valparaíso (SP); Naviraí, Maracajú, Rio Brilhante, TrêsLagoas (MS); Goianésia (GO); and Uberaba and Lagoa da Prata (MG). A PrincipalComponent Analysis (PCA) of the data was then performed and a graphicrepresentation of the spectral curve was created for each profile. The reflectanceintensity of the curves was principally influenced by the levels of Fe2O3, clay, organicmatter and the presence of opaque minerals. There was no change in the spectralcurves in the horizons of the Latossolos, Nitossolos, and Neossolos Quartzarênicos.Argissolos had superficial horizon curves with the greatest intensity of reflectionabove 2,200 nm. Cambissolos and Neossolos Litólicos had curves with greaterreflectance intensity in poorly developed horizons. Gleisols showed a convex curvein the region of 350–400 nm. The PCA was able to separate different data collectionareas according to the region of source material. Principal component one (PC1)was correlated with the intensity of reflectance samples and PC2 with the slopebetween the visible and infrared samples. The use of the Spectral Library as anindicator of possible soil classes proved to be an important tool in profileclassification.
Index terms: remote sensing, principal component analysis, soil classification.
(1) Part of the dissertation submitted by the first author to Escola Superior de Agricultura “Luiz de Queiroz”, University of SãoPaulo – USP. Received for publication in April 2009 and accepted in April 2010.
(2) Agr. M.Sc., Coordenadoria de Assistência Técnica Integral (CATI) – Secretary of Agriculture of São Paulo state São Paulo,USP. E-mail: [email protected]
(3) Professor of Departament of Soil Science of Departamento, Escola Superior de Agricultura “Luiz de Queiroz”, Universidade deSão Paulo. Av. Pádua Dias 11, Caixa Postal 9, CEP 13418-900 Piracicaba (SP). E-mail: [email protected]
(4) Doctorate of PPG in Soils and Plant Nutrition of Escola Superior de Agricultura “Luiz de Queiroz”, USP. E-mail:[email protected]

862 Henrique Bellinaso et al.
R. Bras. Ci. Solo, 34:861-870, 2010
RESUMO: BIBLIOTECA ESPECTRAL E SUA APLICAÇÃO EMCLASSIFICAÇÃO DE SOLOS
A ciência do solo tem buscado desenvolver técnicas que contribuam para a melhor utilizaçãoe caracterização do solo; entre elas encontra-se a aplicação de técnicas de sensoriamento remoto.O uso de sensores terrestres na obtenção de dados espectrais de solos tem possibilitado acaracterização desses e o avanço de técnicas de quantificação de seus atributos. Para isso, amontagem de uma biblioteca espectral de solos se faz necessária. Uma biblioteca espectraldeve ser representativa da variabilidade de solos de uma região. O presente trabalho teve porobjetivo criar uma biblioteca espectral de distintos solos de algumas regiões agrícolas doBrasil. Para isso, foram coletados dados espectrais (sensor Fieldspec, 350–2.500 nm) doshorizontes de 233 perfis de solos das regiões de Matão, Paraguaçu Paulista, Andradina, Ipaussu,Mirandópolis, Piracicaba, São Carlos, Araraquara, Guararapes, Valparaíso (SP); Naviraí,Maracaju, Rio Brilhante, Três Lagoas (MS); Goianésia (GO); e Uberaba e Lagoa da Prata(MG). Posteriormente, foi realizada a análise de componentes principais (PCA) dos dados e arepresentação gráfica das curvas espectrais de cada perfil. A intensidade das curvas foiinfluenciada principalmente pelos teores de Fe2O3, argila, matéria orgânica e presença deminerais opacos. Latossolos, Nitossolos e Neossolos Quartzarênicos não apresentaram mudançano comportamento espectral das curvas de seus horizontes. Argissolos mostraram as curvasdos horizontes superficiais com maior intensidade de reflectância após os 2.200 nm.Cambissolos e Neossolos Litólicos apresentaram curvas de maior intensidade de reflectâncianos horizontes pouco desenvolvidos. Gleissolos mostraram forma convexa de curva na regiãodos 350–400 nm. A PCA foi capaz de separar diferentes regiões de coleta de dados em funçãodo material de origem. A componente principal (PC) 1 correlacionou-se com a intensidade dereflectância das amostras, e a PC2, com a inclinação entre a região do visível e a do infravermelhodas amostras. O uso da biblioteca espectral como indicativo de possíveis classes de um solomostrou ser ferramenta importante para a classificação de perfis.
Termos de indexação: sensoriamento remoto, análise de componentes principais, classificaçãode solos.
INTRODUCTION
The appropriate use of soil in agriculture requiresa good understanding of the soil chemical, physical,mineralogical and biological characteristics. Soilscience has sought to develop techniques that help tobetter characterize soil types. In many recent studies,the application of remote sensing techniques has gainedmuch attention, mainly because these techniqueshave been shown to generate faster and cheapercharacterizations, earning them credibility in thescientific community. The application of remotesensing techniques in soil studies began in the 1960s(Bowers & Hanks, 1965) and expanded to variousapplications, including quick and nondestructivequantification of soil attributes (Janik et al., 1998;Shepherd & Walsh, 2002, Dunn et al., 2002; Viscarra-Rossel, et al., 2006a; Demattê & Nanni, 2006; Brown,et al,. 2006), soil survey and classification (Demattêet al., 2004, Ben-Dor et al., 2008), mineralogicalmeasurements (Madeira-Netto, 1996; Viscarra-Rosselet al., 2006b; Sellito et al., 2009), digital soil mapping(Viscarra-Rossel & McBractney, 2008), precisionagriculture (Thomasson et al., 2001, Maleki et al.,2007; Mouazen et al., 2007) and quantification of heavy
metals (Wu Zhao et al., 2005). Thus, a basic requirementfor their successful application is the creation of aspectral database, or Spectral Library (SL) (Viscarra-Rossel et al., 2008).
Brown et al. (2006) noted that the soil reflectancein the visible and near infrared region is a function ofthe soil composition, including organic material,primary minerals, clay minerals, salts and partiallycrystallized materials. These components are the basicelements of the classes in the North Americanclassification system and the base for soil managementinterpretations.
Dunn et al. (2002) pointed out that, in order forspectroscopy techniques to be commercially applicable,there must be a wide range of data from different soiltypes with variations in their organic and inorganiccomponents. Shepherd & Walsh (2002) reported thatalthough existing spectral libraries include geologicalspectral curves of soils (Clark, 1999), there are notmany examples of spectral libraries that contain ahigh diversity of soils and their physical-chemicalinformation.
Viscarra-Rossel et al. (2008) stated that there areseveral studies about spectral libraries covering

SOIL SPECTRAL LIBRARY AND ITS USE IN SOIL CLASSIFICATION 863
R. Bras. Ci. Solo, 34:861-870, 2010
various soils of different geographical areas, such asthose of Dunn et al. (2002), Shepherd & Walsh (2002)and Brown et al. (2006). According to these authors,there are three basic requirements for developing aspectral library of soil: (a) an SL must contain asufficient number of samples, representing thevariability of soils found in the region to which theSL refers; (b) samples must be carefully sub-sampled,handled, prepared, stored and scanned (anything thathappens to the sample will affect its spectral curve);(c) the analytical reference data from the samples tobe used in calibrations must be acquired throughrecognized and trusted analytical procedures.
In this context, this study aimed to create an SLof soils from agricultural areas in Brazil. The objectivewas to help make quantification models of soilproperties and to construct a modal pattern that willaid in the classification and characterization of soils.It is expected that from the data contained in the BE,a user will be able to determine the class, or possibleclasses, of an unknown soil based on spectralinformation.
MATERIALS AND METHODS
Soil samples from different soil horizons werecollected from the counties of Matão, ParaguaçuPaulista, Andradina, Ipaussu, Mirandópolis,Piracicaba, São Carlos, Araraquara, Guararapes,Valparaíso (SP); Naviraí, Maracajú, Rio Brilhante,Três Lagoas (MS); Goianésia (GO), Uberaba andLagoa da Prata (MG) (Figure 1). Soil samples from233 soil profiles were collected. All profiles weredescribed morphologically (Lemos & Santos, 1996) andclassified up to the 4th categorical level (Embrapa,2006).
The samples were analyzed for particle sizeaccording to the methods of Camargo et al. (1986) andfor fertility using the methods of Raij et al. (2001).The analysis provided the necessary data for thecalculation of the sum of bases (SB), cation exchangecapacity (CEC), base saturation (V %) and Alsaturation (m %). The total Fe (Fe2O3), silica (SiO2),Ti (TiO2) and Mn (MnO) were determined by sulfuricacid digestion (Camargo et al., 1986).
The spectral data were obtained in the laboratorywith the FieldSpec Pro: Analytical Spectral Devices,Boulder, Colorado spectroradiometer using 350–2,500 nm wavelengths (Hatchell, 1999). For thereflectance data collection, the samples were dried inan oven at 45 °C for 24 h (Henderson et al., 1992),ground, processed through a sieve (2 mm mesh) andplaced in Petri dishes. The reflectance of each samplewas calculated by taking the average of 100 scansperformed by the sensor. The light capture device inthe equipment (fiber optic cable input) was placed ina vertical position 8 cm from the sample. The lightsource used was a 50 W halogen lamp with nocollimated beam to the target plane, positioned 35 cmfrom the sample with a zenith angle of 30 degrees. Awhite plate of barium sulfate was used as the referencestandard, with a standard of 100 % reflectance.Graphs for each profile were generated from thespectral data (Figures 2-4), where each graph containsthe spectral curves of the horizons of the respectiveprofile.
In order to reduce the dimensionality ofinformation and the variability of the spectral data, aprincipal components analysis (PCA) was performedusing the program The Unscrambler 9.7. In order todo this, spectral data were preprocessed, thenconverted into absorbance and centered on the mean.Principal component analysis (PCA) is one of the mostcommon methods employed in the analysis ofinformation (Brown, 1995) and is mainly used for itsability to compress data based on the existence ofcorrelation between different measured variables.
Graphs of the spectral curves of 13 soil profiles(class unknown) were descriptively comparedaccording to the contents of the SL. For each profile,the number of possible orders of soil was establishedbased on the similarity between the spectral profileand the SL profiles. The number of possible orders(only until the 1st categorical level) for each soil wasindicated. Each profile shows the number of possibleorders (until the 1st categorical level) from soils. Thismethodology proposes a comparison between theinformation from the spectral curves of the profile(intensity, shape, slope, presence of features andbehavioral variation among curves from the sameprofile) and the information contained in the SL.The methodology was named “Soil classification bythe method of Simplified Descriptive Comparison”(SDC).
Figure 1. Regions where soil profile samples werecollected.
864 Henrique Bellinaso et al.
R. Bras. Ci. Solo, 34:861-870, 2010
RESULTS AND DISCUSSION
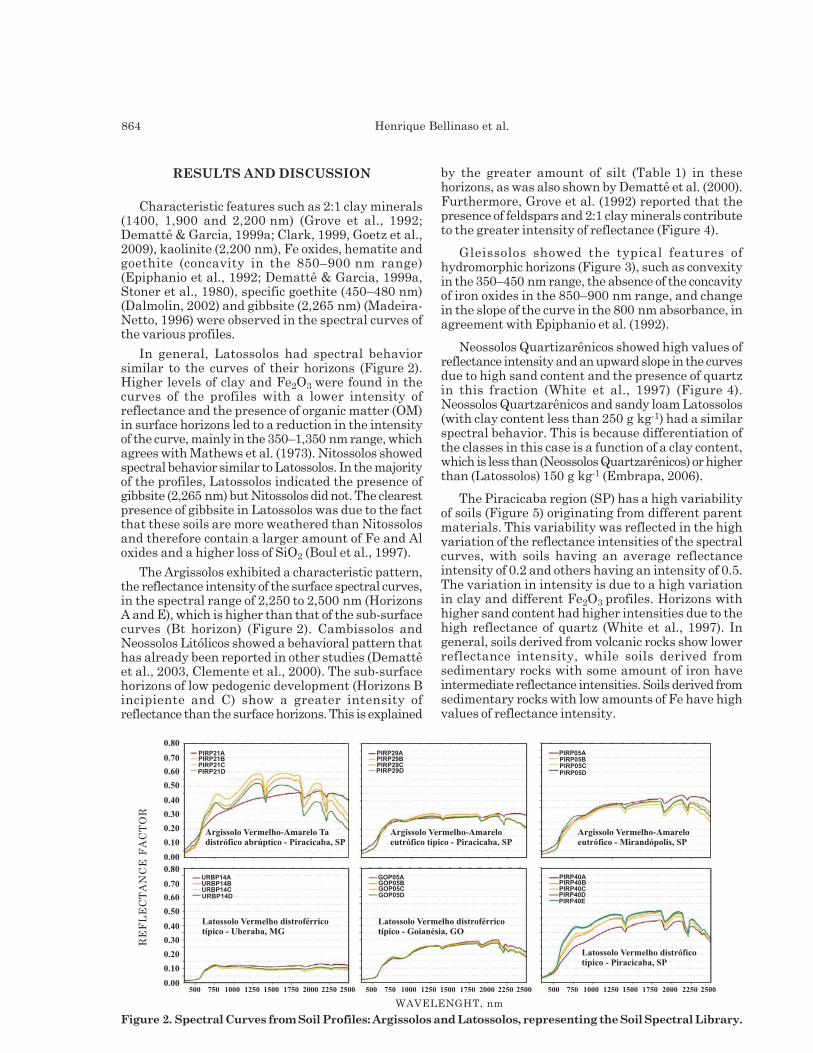
Characteristic features such as 2:1 clay minerals(1400, 1,900 and 2,200 nm) (Grove et al., 1992;Demattê & Garcia, 1999a; Clark, 1999, Goetz et al.,2009), kaolinite (2,200 nm), Fe oxides, hematite andgoethite (concavity in the 850–900 nm range)(Epiphanio et al., 1992; Demattê & Garcia, 1999a,Stoner et al., 1980), specific goethite (450–480 nm)(Dalmolin, 2002) and gibbsite (2,265 nm) (Madeira-Netto, 1996) were observed in the spectral curves ofthe various profiles.
In general, Latossolos had spectral behaviorsimilar to the curves of their horizons (Figure 2).Higher levels of clay and Fe2O3 were found in thecurves of the profiles with a lower intensity ofreflectance and the presence of organic matter (OM)in surface horizons led to a reduction in the intensityof the curve, mainly in the 350–1,350 nm range, whichagrees with Mathews et al. (1973). Nitossolos showedspectral behavior similar to Latossolos. In the majorityof the profiles, Latossolos indicated the presence ofgibbsite (2,265 nm) but Nitossolos did not. The clearestpresence of gibbsite in Latossolos was due to the factthat these soils are more weathered than Nitossolosand therefore contain a larger amount of Fe and Aloxides and a higher loss of SiO2 (Boul et al., 1997).
The Argissolos exhibited a characteristic pattern,the reflectance intensity of the surface spectral curves,in the spectral range of 2,250 to 2,500 nm (HorizonsA and E), which is higher than that of the sub-surfacecurves (Bt horizon) (Figure 2). Cambissolos andNeossolos Litólicos showed a behavioral pattern thathas already been reported in other studies (Demattêet al., 2003, Clemente et al., 2000). The sub-surfacehorizons of low pedogenic development (Horizons Bincipiente and C) show a greater intensity ofreflectance than the surface horizons. This is explained
by the greater amount of silt (Table 1) in thesehorizons, as was also shown by Demattê et al. (2000).Furthermore, Grove et al. (1992) reported that thepresence of feldspars and 2:1 clay minerals contributeto the greater intensity of reflectance (Figure 4).
Gleissolos showed the typical features ofhydromorphic horizons (Figure 3), such as convexityin the 350–450 nm range, the absence of the concavityof iron oxides in the 850–900 nm range, and changein the slope of the curve in the 800 nm absorbance, inagreement with Epiphanio et al. (1992).
Neossolos Quartizarênicos showed high values ofreflectance intensity and an upward slope in the curvesdue to high sand content and the presence of quartzin this fraction (White et al., 1997) (Figure 4).Neossolos Quartzarênicos and sandy loam Latossolos(with clay content less than 250 g kg-1) had a similarspectral behavior. This is because differentiation ofthe classes in this case is a function of a clay content,which is less than (Neossolos Quartzarênicos) or higherthan (Latossolos) 150 g kg-1 (Embrapa, 2006).
The Piracicaba region (SP) has a high variabilityof soils (Figure 5) originating from different parentmaterials. This variability was reflected in the highvariation of the reflectance intensities of the spectralcurves, with soils having an average reflectanceintensity of 0.2 and others having an intensity of 0.5.The variation in intensity is due to a high variationin clay and different Fe2O3 profiles. Horizons withhigher sand content had higher intensities due to thehigh reflectance of quartz (White et al., 1997). Ingeneral, soils derived from volcanic rocks show lowerreflectance intensity, while soils derived fromsedimentary rocks with some amount of iron haveintermediate reflectance intensities. Soils derived fromsedimentary rocks with low amounts of Fe have highvalues of reflectance intensity.
Figure 2. Spectral Curves from Soil Profiles: Argissolos and Latossolos, representing the Soil Spectral Library.

SOIL SPECTRAL LIBRARY AND ITS USE IN SOIL CLASSIFICATION 865
R. Bras. Ci. Solo, 34:861-870, 2010
The regions of Araraquara, São Carlos and Matão(SP) showed lower soil variability, with curvesranging from medium to low intensity. The variationof intensity was due to the greater or lesser presenceof Fe2O3. Soils with greater amounts of Fe2O3presented lower reflectance intensity. Anotheridentifying characteristic of the spectral curves wasthe presence of gibbsite (2,265 nm) (Madeira-Netto,1996) in the majority of the soils, with this featurebeing sharper in Latossolos than in Nitossolos.Kaolinite (2,200 nm), Fe oxides, goethite and hematite(concavity in the region of 850–900 nm) andspecifically goethite (450–480 nm) were also observed.
The Andradina, Mirandópolis, Valparaiso andGuararapes (SP) regions, which also had lower soilvariability, had curves varying from medium to high
reflectance intensity. The regions are located in thewestern plateau of São Paulo and the main parentsoil material is sandstone. This leads to thepredominance of soils with low clay and higher sandcontent, which explains the higher values ofreflectance intensity.
The Ipaussu region (SP) was characterized by soilsvarying from medium to high Fe2O3 content, resultingin curves from medium to low intensities. In general,soils with higher contents of Fe2O3 had lowerreflectance intensity.
The regions of Maracajú and Rio Brilhante (MS)had soils with low reflectance intensity spectralbehavior. This occurs because of high clay content,originating from low levels of sand, and highconcentrations of Fe2O3.
Table 1. Chemical and granulometrical analysis from soil profile samples ARAP09, ARAP11, GOP05, IPAP10,IPAP31,LPP34, MARP18 and MARP24, representing the Soil Spectral Library

866 Henrique Bellinaso et al.
R. Bras. Ci. Solo, 34:861-870, 2010
The Três Lagoas region (MS) had soil spectralbehavior similar to soils from Andradina, Mirandópolis,Valparaiso and Guararapes (SP). This region isgeographically close to the other locations, which areseparated by the Rio Paraná. Similar to the otherregions cited, the parent soil material is sandstone.
The region of Goianésia (GO) had soils withintermediate reflectance intensity. Although thecontent of Fe2O3 in these soils is between mediumand high, the soils showed no spectral curves withlow intensity (less than 0.25). One possible explanationis that even though these soils contain high levels ofFe2O3, they have low amounts of opaque minerals,such as magnetite and ilmenite. Most soils showedfeatures of gibbsite (2,265 nm), Fe oxides, hematiteand goethite (concavity in the 850–900 nm range), andkaolinite (2,200 nm). The presence of specific featuresof goethite (450–480 nm) and 2:1 clay minerals (1,400,1,900 and 2,200 nm) was not verified because theseare highly weathered soils.
The Naviraí region (MS) had soils with high spectralreflectance and an ascendant slope aspect, similar tothe spectral behavior of soils found in the region of
Figure 5. Principal component analysis from soilspectral data in the different regions evaluated,data graph and region by region separation
Figure 3. Spectral curves from soil profiles: Latossolos, Nitossolos and Gleissolos, representing the SoilSpectral Library.
Figure 4. Spectral curves from soil profiles: Cambissolos, Neossolos Litólicos and Neossolos .Quartzarênicos,representing the Soil Spectral Library

SOIL SPECTRAL LIBRARY AND ITS USE IN SOIL CLASSIFICATION 867
R. Bras. Ci. Solo, 34:861-870, 2010
Três Lagoas (MS). The high sand content explainsthe high intensity of reflectance and upward slope ofthe curves. In the region of Três Lagoas (MS), thesandy loam Latossolos also showed similar spectralbehavior to the Neossolos quartzarênicos.
The soils of the Uberaba (MG) region had the lowestintensity spectral curves, most of them with very lowreflectance intensity due to high levels of Fe2O3 andclay. These high levels of Fe2O3 caused smoothing ofmost features. Unlike what was observed in most soilsfrom other regions with similar characteristics, surfacesoil horizons showed higher intensity curves thanthose from the sub-surface. This occurs because theorganic matter has a greater value of reflectanceintensity than opaque minerals such as magnetite(Madeira Netto & Baptista, 2000). Thus, the soils ofthe region have such a high amount of opaque mineralsand the addition of organic matter causes an increasein reflectance intensity. This information confirmsresults found by Fontes and Carvalho Junior (2005).
The Lagoa da Prata (MG) region had the greatestintensity of soil reflectance. However, it was also the
region that had soils with higher clay and lower Fe2O3concentrations, due to the predominant sourcematerials being claystone and siltstone. The absenceof opaque minerals enables the high intensity ofreflectance, although the intensity of reflectance ismedium-high in all profiles, indicating that higherlevels of clay have a lower intensity of reflectance andthose with higher levels of the silt have a higherintensity of reflectance, as shown by Demattê et al.(2000) and Mathews et al. (1973). The region has soilsurface horizons with high organic matter content,resulting in a lower intensity of spectral reflectanceand smoothing the concave feature of iron oxides (850–900 nm). In general, the Latossolos had features ofgibbsite (2,265 nm) while Nitossolos, Cambissolos andNeossolos Litólicos did not. This same observation wasnoted by Sans (1973), in studying the mineralogy ofsoils in the region. All soils showed clear features ofgoethite (450–480 nm).
It was evident that in the Lagoa da Prata (MG)region, where soils are more pedogenically developed(weathered), the spectral curves had a lower intensity
Table 2. Chemical and Granulometrical Analysis from soil profile samples MIRP05, PIRP21, PIRP29,PIRP31,PIRP40,SCP27,TLP22 and UBRP14, representing the Soil Spectral Library

868 Henrique Bellinaso et al.
R. Bras. Ci. Solo, 34:861-870, 2010
of reflectance. In other words, Cambissolos have ahigher reflectance intensity than Nitossolos, whichhave a higher reflectance intensity than Latossolos,which can be explained by the decrease in the amountsof silt and increased presence of 2:1 clay minerals(Mathews et al., 1973; Grove et al., 1992).
The first and the second principal components (PC1and PC2) were able to explain over 95 % of the spectralvariability of soils. The PC1 (Figure 5) showed acorrelation with the intensity of reflectance of thesamples, which agrees with that shown by Galvão etal. (2001). Due to the processing of spectral data forthe PCA (change in absorbance), higher values of PC1indicate a lower intensity reflectance of the sample.The data from the Uberaba (MG) region had the lowestreflectance intensities and the highest values of thePC1 score, while the data from the Lagoa da Prata(MG) region had the highest reflectance intensity andlowest values of PC1.
As reported in the characterization of the spectralcurves of the profiles of the Andradina, Valparaíso,Guararapes, Mirandópolis (SP) and Três Lagoas (MS)regions, there were similarities between the soilclasses and their spectral behaviors. These sameregions were superimposed on the graph between PC1and PC2 (Figure 5).
The regions with soils of higher levels of Fe2O3also overlapped on the charts, because these soilsgenerally appeared to have volcanic rock sourcematerial. This was verified everywhere except forGoianésia (GO), which, as reported in its spectralcharacterization, had soils with high contents ofFe2O3, but a distinct position on the PC1 x PC2 chart.The Goianésia region (GO) is at a different altitudethan the other regions with soil containing a highamount of Fe2O3.
The Lagoa da Prata (MG) region showed a differentspectral characterization than the other regions and wasalso grouped in a different position from other regions.
The Piracicaba region (SP) showed a highvariability of soils of different spectral behaviors,related to the location of this transitional regionbetween the São Paulo depression and westernplateau, generating a great variety of materials fromsources such as soil basalts, diabase, shale, siltstones,mudstones (argillite) and sandstones. This greatvariability is reproduced in the soil and can be viewedfrom the principal component analysis (Figure 5).Henderson et al. (1992) and Demattê & Garcia (1999b)already indicated that spectral data should beevaluated by region, which is consistent with thisstudy.
It was evident that regionalization throughprincipal component analysis showed grouping bysimilarity of soils derived from similar parentmaterials. For example, the Três Lagoas (MS),Mirandópolis and Guararapes (SP) regions primarilycontained sandstone source material and occupied asimilar position in the charts, while the Uberaba(MG), Maracajú and Rio Brilhante (MS) regions hadsoils formed from volcanic rocks and also occupiedsimilar positions in the graphs (Figure 5). This furtherdemonstrated the differentiation of regions withsimilar geology but different altitudes.
A simple descriptive comparison of the spectralcurves of a soil profile with the graphics of the SpectralLibrary demonstrated that the Spectral Library servesas an important auxiliary tool in classification. Table 3demonstrates that in comparing the curves of anunclassified profile with those of the Spectral Library,the Spectral Library did not provide more than threepossible orders. For one of the profiles, the Libraryshowed only one order, whereas for profiles 4 and 8,the Spectral Library gave two and three possibleorders, respectively. Clearly, the descriptivecomparison is not able to pinpoint a precise rating,but is a tool with the ability to reduce possible choices,reducing the time needed for soil surveys. Since thistechnique is fast, inexpensive and non-destructive, it
Table 3. Contents of Fe2O3, SiO2, Al2O3, TiO2, MnO and Ki and Kr indices for soil profile samples representingthe Soil Spectral Library

SOIL SPECTRAL LIBRARY AND ITS USE IN SOIL CLASSIFICATION 869
R. Bras. Ci. Solo, 34:861-870, 2010
can increase the number of samples collected in anarea, improving the quality of soil maps through moreprecise delimitation of mapping units. If increasednumbers of samples are not used, this technique canprovide a cost reduction by ensuring that not allsamples need to be sent for laboratory testing.
CONCLUSIONS
The Spectral Library was able to support theclassification of possible soil orders.
1. The soil reflectance intensity was influenced bythe content of Fe2O3, sand, clay, silt, organic matterand the presence of opaque minerals.
2. Organic matter promoted the reduction ofreflectance intensity and softening of the features.
3. The increase in the levels of Fe2O3 in soilspromoted a decrease in the reflectance.
4. Horizons with lesser degrees of pedogenicdevelopment (incipient B and C) have spectral curveswith higher reflectance intensity.
5. The surface layers of Argissolos presented higherlevels of reflectance intensity than the others, withwavelengths greater than 2,200 nm.
6. The internal comparison of the spectral curvesof the horizons of Latossolos, Nitossolos and NeossolosQuatzarênicos display similar behavior.
7. The principal component analysis grouped soilsoriginating from similar parent materials, with somedifferentiation caused by the altitude.
ACKNOWLEDGEMENTS
The authors thank the Fundação de Amparo aPesquisa do Estado de São Paulo (Bolsa AuxílioPesquisa 07/54976-8), for the financial support, theCoordenação de Aperfeiçoamento de Pessoal de NívelSuperior (CAPES) for the scholarship of the firstauthor, and the National Counsel of Technological andScientific Development (CNPq) for the researchfinancial support of the second author.
LITERATURE CITED
BEN DOR, E.; HELLER, D. & CHUDNOVSKY, A. A novelmethod of classying profiles in the field using opticalmeans. Soil Sci. Soc. Am. J., 72:1113-1123, 2008.
BOUL, S.W.; HOLE, F.D.; McCRACKEN, R.J. & SOUTHARD,R.J. Soil genesis and classification. 4.ed. Ames, Iowa StateUniversity Press, 1997. 527p.
BOWERS, S.A. & HANKS, R.J. Reflectance of radiant energyfrom soils. Soil Sci., 100:130-138, 1965.
BROWN, S.D. Chemical systems under indirect observation:Latent properties and chemometrics. Appl. Spectrosc.,12:14-31, 1995.
BROWN, D.J.; SHEPHERD, K.D.; WALSH, M.G.; MAYS, M.D.& REINSCH., T.G. Global soil characterization with VNIRdiffuse reflectance spectroscopy. Geoderma, 132:273-290,2006.
CAMARGO, A.O.; MONIZ, A.C.; JORGE, J.A. & VALADARES,J.M. Métodos de análise química, mineralógica e física desolos do IAC. Campinas, Instituto Agronômico deCampinas, 1986. 94p. (Boletim Técnico, 106)
CLARK, R.N. Spectroscopy of rocks and minerals, andprinciples of spectroscopy In: RENCZ, A.N., ed. Manualof remote sensing. New York, John Wiley, 1999. p.3-58.
CLEMENTE, C.A.; DEMATTÊ, J.A.M.; MAFRA, A.L. &BENTIVENHA, S.R.P. Reflectância espectral emineralogia de materiais formados sobre diabásio. Sci.Agríc., 57:159-168, 2000.
DALMOLIM, R.S.D. Matéria orgânica e características físicas,químicas, mineralógicas e espectrais de Latossolos dediferentes ambientes. Porto Alegre, Universidade Federaldo Rio Grande do Sul, 2002. 151p. (Tese de Doutorado)
DEMATTÊ, J.A.M. & GARCIA, G.J. Alteration of soil propertiesthrough a weathering sequence as evaluated by spectralreflectance. Soil Sci. Am. J., 63:327-342, 1999a.
DEMATTÊ, J.A.M. & GARCIA, G.J. Avaliação da atributos deLatossolo Bruno e de Terra Bruna Estruturada da regiãode Guarapuava, Paraná, por meio de sua energia refletida.R. Bras. Ci. Solo, 23:343-355, 1999b.
DEMATTÊ, J.A.M.; CAMPOS, R.C. & ALVES, M.C. Avaliaçãoespectral de solos desenvolvidos em uma topossequênciade diabásio e folhelho da região de Piracicaba-SP. Pesq.Agropec. Bras., 35:2447-2460, 2000.
DEMATTÊ, J.A.M.; FIORIO, P.R.; CLEMENTE, C. & NANNI,M.R. Sensoriamento remoto na avaliação da evoluçãointempérica de solos desenvolvidos sobre granodiorito egnaisse porfirítico. Magistra, 15:33-43, 2003.
DEMATTÊ, J.A.M.; CAMPOS, R.C.; ALVES, M.C.; FIORIO,P.R. & NANNI, M.R. Visible-NIR reflectance: A newapproach on soil evaluation. Geoderma, 121:95-112, 2004.
DUNN, B.W.; BEECHER, H.G.; BATTEN, G.D. &CIAVARELLA, S. The potencial of near-infraredreflectance spectroscopy for soil analysis – a case studyfrom the Riverine Plain of south-eastern Australia. Austr.J. Exper. Agric., 42:607-614, 2002.
Table 4. Confounding Index from simplifieddescriptive comparison for 13 profiles with theSpectral Library

870 Henrique Bellinaso et al.
R. Bras. Ci. Solo, 34:861-870, 2010
EMPRESA BRASILEIRA DE PESQUISA AGROPECUÁRIA -EMBRAPA. Sistema brasileiro de classificação de solos.2.ed. Rio de Janeiro, Embrapa Solos, 2006. 306p.
EPIPHANIO, J.C.N.; FORMAGGIO, A.R.; VALERIANO, M. &OLIVEIRA, J.B. Comportamento espectral de solos doEstado de São Paulo. São José dos Campos, INPE, 1992.131p.
FONTES, M.P.F. & CARVALHO JUNIOR, I.A. Color attributesand mineralogical characteristics, evaluated byradiometry, of higly weathered tropical soils. Soil Sci. Soc.Am. J., 69:1162-1172, 2005.
GALVÃO, L.S.; PIZARRO, M.A. & EPIPHANIO, J.C.N.Variations in reflectance of tropical soils: Spectral-chemicalcompositions relationships from AVIRIS data. RemoteSens. Environ., 75:245-255, 2001.
GOETZ, A.F.H.; CURTISS, B. & SHILEY, D.A. Rapid ganguemineral concentration measurament over conveyors byNIR reflectance spectroscopy. Miner. Eng., 22:490-499,2009.
GROVE, C.I.; HOOK, S.J. & TAYLOR, E.D. Laboratoryreflectance of 160 minerals, 0.4 to 2.5 micrometers.Passadena, National Aeronautics and Space Administration,1992. 355p.
HATCHELL, D.C., ed. Analytical spectral devices. 3.ed. Boulder,Analytical Spectral Devices, 1999. 140p.
HENDERSON, T.L.; BAUMGARDNER, M.F.; FRANZMEIER,D.P.; STOTT, D.E. & COSTER, D.C. High dimensionalreflectance analysis of soil organic matter. Soil Sci. Soc.Am. J., 56:865-872, 1992.
JANIK, L.J.; MERRY, R.H. & SKJEMSTAD, J.O. Can midinfrared diffuse reflectance analysis replace soilextractions. Austr. J. Exper. Agric., 38:681-696, 1998.
LEMOS, R.C. & SANTOS, R.D. Manual de descrição e coletade solo no campo. Campinas, Sociedade Brasileira deCiência do Solo, 1996. 84p.
MADEIRA NETTO, J.S. Spectral reflectance properties ofsoils. Photo Interpretation, 34:59-70, 1996.
MADEIRA NETTO, J.S. & BAPTSTA, G.M.M. Reflectânciaespectral de solos. Planaltina, Embrapa Cerrados, 2000.55p.
MALEKI, M.R.; MOUAZEN, A.M.; RAMON, H. &BAERDEMAEKER, J. Optimisation of soil VIS–NIRsensor-based variable rate application system of soilphosphorus. Soil Tillage Res., 94:239-250, 2007.
MATHEWS, H.L; CUNNINGHAM, R.L. & PETERSEN, G.W.Spectral reflectance of selected Pennsylvania soils. SoilSci. Soc. Am. J., 37:421-424, 1973.
MOUAZEN, A.M.; MALEKI, M.R.; BAERDEMAEKER, J. &RAMON, H. On-line measurement of some selected soilpropertiesusing a VIS–NIR sensor. Soil Tillage Res., 93:13-27, 2007.
NANNI, M.R. & DEMATTÊ, J.A.M. Spectral reflectancemethodology in comparison to traditional soil analysis.Soil Sci. Soc. Am. J.,70:393-407, 2006.
RAIJ, B.van.; ANDRADE, J.C.; CANTARELLA, H. &QUAGGIO, J.A. Análise química para avaliação de solostropicais. Campinas, Instituto Agronômico de Campinas,2001. 285p.
SANS, L.M.A. Classificação e mineralogia de solos da regiãode Sete lagoas - MG. Piracicaba, Escola Superior deAgricultura “Luiz de Queiroz”, 1973. 151p. (Tese deMestrado)
SELLITTO V.M.; FERNANDES R.B.A.; BARRÓN, V. &COLOMBO, C. Comparing two different spectroscopictechniques for the characterization of soil iron oxides:Diffuse versus bi-directional reflectance. Geoderma,149:2-9, 2009.
SHEPHERD, K.D. & WALSH, M.G. Development ofreflectance spectral libraries for characterization of soilproperties. Soil Sci. Soc. Am. J., 66:988-998, 2002.
STONER, E.R.; BAUMGARDNER, M.F.; BIEHL, L.L. &ROBINSON, B.F. Atlas of soil reflectance properties.West Lafayette, Purdue University, 1980. 75p.
THOMASSON, J.A.; SUI, R.; COX, M.S. & Al-RAJEHY. Soilreflectance sensing for determining soil properties inprecision agriculture. Trans. Am. Soc. Agron. Eng.,44:1445-1453, 2001.
VISCARRA ROSSEL, R.A.; WALWORT, D.J.J.; McBRATNEY,A.B.; JANIK, L.J. & SKJESMSTAD, J.O. Visible nearinfrared or combined diffuse reflectance spectroscopy forsimultaneous assessment of various soil properties.Geoderma, 131:59-75, 2006a.
VISCARRA ROSSEL, R.A.; McGLYNN, R.N. & McBRATNEY,A.B. Determining the composition of mineral-organicmixes using UV–vis-NIR diffuse reflectance spectroscopy,Geoderma, 137:70-82, 2006b.
VISCARRA ROSSEL, R.A.; JEON, Y.S.; ODEH, I.O.A. &McBRATNEY, A.B. Using a legacy soil sample to developa mid-IR spectral library. Austr. J. Soil Res., 46:1-16, 2008.
VISCARRA ROSSEL, R.A. & McBRATNEY, A.B. Diffusereflectance spectroscopy as a tool for digital soil mapping.In: HARTEMINK, A.E.; McBRATNEY, A.B. &MENDONÇA-SANTOS, L., eds. Digital soil mapping withlimited data. Amsterdam, Elsevier Science, 2008.(Developments in Soil Science Series)
WHITE, K.; WALDEN, J.; DRAKE, N.; ECKARDT, F. &SETTLE, J. Mapping the iron oxide content of dune sands,Namib Sand Sea, Namibia, using Landsat ThematicMapper Data. Remote Sens. Environ., 62:30-39, 1997.
ZHAO WU, Y.Z.; CHEN, J.; FENG, J.; TIAN, Q.J. & MIN WU,X. Feasibility of reflectance spectroscopy for theassessment of soil mercury contamination. Environ. Sci.Technol., 39:873-878, 2005.