Embed Size (px)
Citation preview

8/2/2019 Std08 Maths EM 2
http://slidepdf.com/reader/full/std08-maths-em-2 1/152
4Measurements
4.1 Introduction
4.2 Semi Circles and Quadrants
4.3 Combined Figures
4.1 Introduction
Measuring is a skill. It is required for every individual in his / her
life. Everyone of us has to measure something or the other in our daily
life. For instance, we measure
Fig. 4.1
(i) the length of a rope required for drawing water from a well,
(ii) the length of the curtain cloth required for our doors and
windows,(iii) the size of the floor in a room to be tiled in our house and
(iv) the length of cloth required for school uniform dress.
In all the above situations, the idea of ‘measurements’ comes in.
The branch of mathematics which deals with the measure of lengths,
angles, areas, perimeters in planefigures and surface areas, volumes
in solid figures is called ‘measurement and mensuration’.

8/2/2019 Std08 Maths EM 2
http://slidepdf.com/reader/full/std08-maths-em-2 2/152
Chapter 4
Recall
Let us recall the following denitions which we have learnt in class VII.
(i) Area
Area is the portion inside the closed gure in
a plane surface.
(ii) Per imeter
The perimeter of a closed gure is the total
measure of the boundary.
Thus, the perimeter means measuring around a gure or measuring along a
curve.
Can you identify the shape of the following objects?
Fig. 4.2
The shape of each of these objects is a ‘circle’.
(iii) Circle
Let ‘O’ be the centre of a circle with radius ‘r’ units ( )OA .
Area of a circle, A = r 2
r sq.units.
Perimeter or circumference of a circle,
P = r 2r units,
where 3.14.7
22or -r
Note: The central angle of a circle is 360°.
Take a cardboard
and draw circles of
different radii. Cut the
circles and nd their
areas and perimeters.
The word ‘peri’ in Greek means ‘around’ and ‘meter ’
means ‘measure’.
AO r
Fig. 4.3
Fig. 4.5
Fig. 4.4
AO
C i r c um f e r
e n
c e
360o
AO
S. No. Radius Area Perimeter
1.
2.
3.
140

8/2/2019 Std08 Maths EM 2
http://slidepdf.com/reader/full/std08-maths-em-2 3/152
141
Measurements
Fig. 4.8
Fig. 4.12
4.2 Semi circles and Quadrants
4.2.1 Semicircle
Have you ever noticed the sky during night time after 7 days of new moon day
or full moon day?
What will be the shape of the moon?It looks like the shape of Fig. 4.6.
How do you call this?
This is called a semicircle. [Half part of a circle]
The two equal parts of a circle divided by its diameter are called semicircles.
How will you get a semicircle from a circle?
Take a cardboard of circular shape and cut it
through its diameter .AB
Note: The central angle of the semicircle is 180°.
(a) Perimeter of a semicircle
Perimeter, P = (21 circumference of a circle) 2 unitsr # #+
= r r 21 2 2# r +
P = 2 ( 2)r r r r r + = + units
(b) Area of a semicircle
Area, A = ( )21 Area of a circle#
= r 21 2
# r
A = r
2
2r sq. units.
4.2.2 Quadrant of a circle
Cut the circle through two of its perpendicular diameters. We
get four equal parts of the circle. Each part is called a quadrant of
the circle. We get four quadrants OCA, OAD, ODB and OBC while
cutting the circle as shown in the Fig. 4.11.
Note:The central angle of the quadrant is 90°.
Fig. 4.6
(a) (b)Fig. 4.7
Fig. 4.9
Fig. 4.10
D
A B
C
O
Fig. 4.11
8/2/2019 Std08 Maths EM 2
http://slidepdf.com/reader/full/std08-maths-em-2 4/152
142
Chapter 4
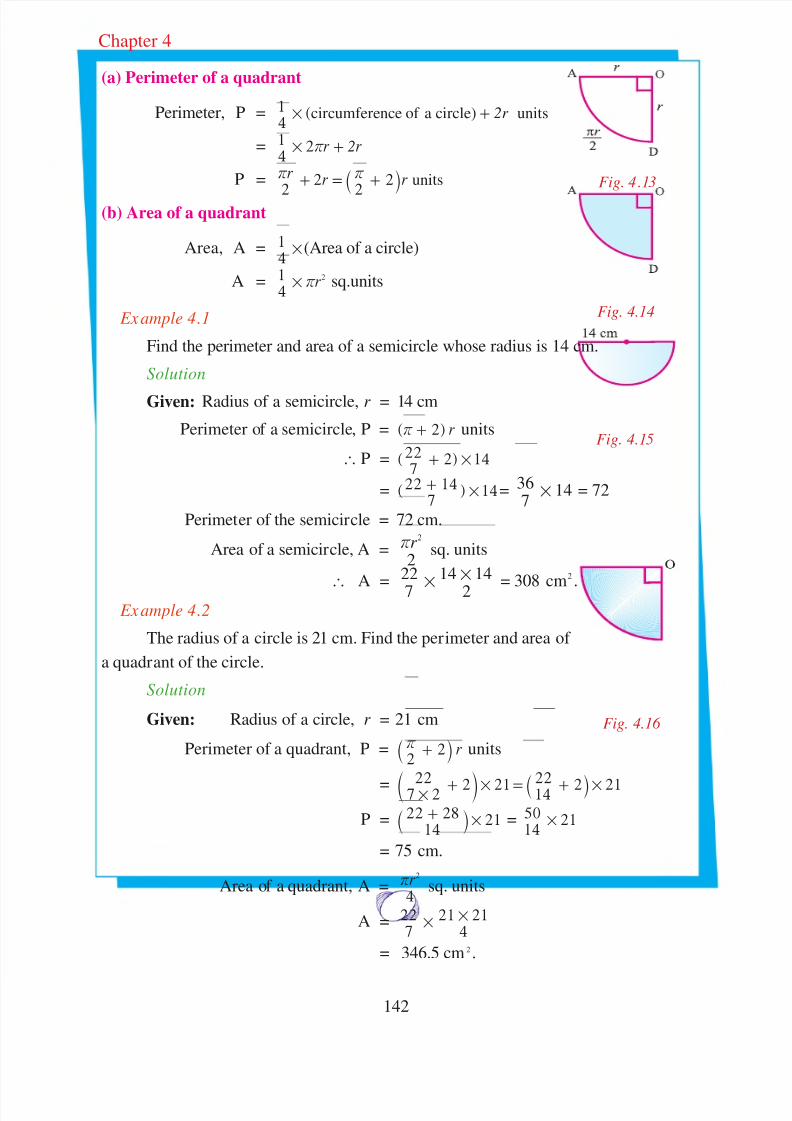
(a) Perimeter of a quadrant
Perimeter, P = (41 circumference of a circle) units2r # +
= 2 2r r 41
# r +
P = 2r r r
2 2
2 unitsr r + = +` j
(b) Area of a quadrant
Area, A =41
#(Area of a circle)
A = r 41 2
# r sq.units
Example 4.1
Find the perimeter and area of a semicircle whose radius is 14 cm.
Solution
Given: Radius of a semicircle, r = 14 cm
Perimeter of a semicircle, P = ( ) r 2r + units
` P = ( )7
22 2 14#+
= ( )7
22 14 14#+ =
736 14# = 72
Perimeter of the semicircle = 72 cm.
Area of a semicircle, A = r
2
2r sq. units
`
A = 7
22
2
14 14#
#
= 308 cm
2
. Example 4.2
The radius of a circle is 21 cm. Find the perimeter and area of
a quadrant of the circle.
Solution
Given: Radius of a circle, r = 21 cm
Perimeter of a quadrant, P = r 2
2r +` j units
= 21 217 222
2 1422
2# # #+ = +c `m jP =
1422 28 21#
+` j = 211450
#
= 75 cm.
Area of a quadrant, A = r
4
2r sq. units
A =7
224
21 21#
#
= 346.5 cm2 .
Fig. 4.13
Fig. 4.14
Fig. 4.15
Fig. 4.16

8/2/2019 Std08 Maths EM 2
http://slidepdf.com/reader/full/std08-maths-em-2 5/152
143
Measurements
Example 4.3
The diameter of a semicircular grass plot is 14 m. Find
the cost of fencing the plot at ` 10 per metre .
Solution
Given: Diameter, d = 14 m. ` Radius of the plot, r =
214 7= m.
To fence the semicircular plot, we have to find the perimeter of it.
Perimeter of a semicircle, P = 2 #r +^ h r units
= 7722 2 #+` j
= 77
22 14#
+` j
P = 36 m
Cost of fencing the plot for 1 metre = ` 10
` Cost of fencing the plot for 36 metres = 36 × 10 = ` 360.
Example 4.4
The length of a chain used as the boundary of a
semicircular park is 36 m. Find the area of the park.
Solution
Given:Length of the boundary = Perimeter of a semicircle
r 2` r +^ h = 36 m
r 722 2 #+` j = 36
r 7
22 14#
+` j = 36
r 736 # = 36 7r m& =
Area of the park = Area of the semicircle
A = r
2
2r sq. units
= 77722
27 7 m2
## =
` Area of the park = 77 .m2
Fig. 4.17
Fig. 4.18

8/2/2019 Std08 Maths EM 2
http://slidepdf.com/reader/full/std08-maths-em-2 6/152

8/2/2019 Std08 Maths EM 2
http://slidepdf.com/reader/full/std08-maths-em-2 7/152
145
Measurements
4.3 Combined Figures
Fig. 4.19
What do you observe from these gures?
In Fig. 4.19 (a), triangle is placed over a
semicircle. In Fig. 4.19 (b), trapezium is placed
over a square etc.
Two or three plane gures placed
adjacently to form a new gure. These are‘combined gures’. The above combined
gures are Juxtaposition of some known gures; triangle, rectangle, semi-circle, etc.
Can we see some examples?
S. No. Plane fgures Juxtaposition
1. Two scalene triangles Quadrilateral
2.Two right triangles and
a rectangleTrapezium
3. Six equilateral triangles Hexagon
(a) Polygon
A polygon is a closed plane gure formed by ‘n’
line segments.
A plane gure bounded by straight line segments is
a rectilinear fgure.
A rectilinear gure of three sides is called a
triangle and four sides is called a Quadrilateral.
(a) (b) (c) (d) (e)
Some combinations of plane
gures placed adjacently, with
one side equal in length to a
side of the other is called a
Juxtaposition of gures.
A B
C
D
FEA B
CD
B C
D
EF
A
Fig. 4.20
The word ‘Polygon’ means
a rectilinear gure with
three or more sides.
8/2/2019 Std08 Maths EM 2
http://slidepdf.com/reader/full/std08-maths-em-2 8/152
146
Chapter 4
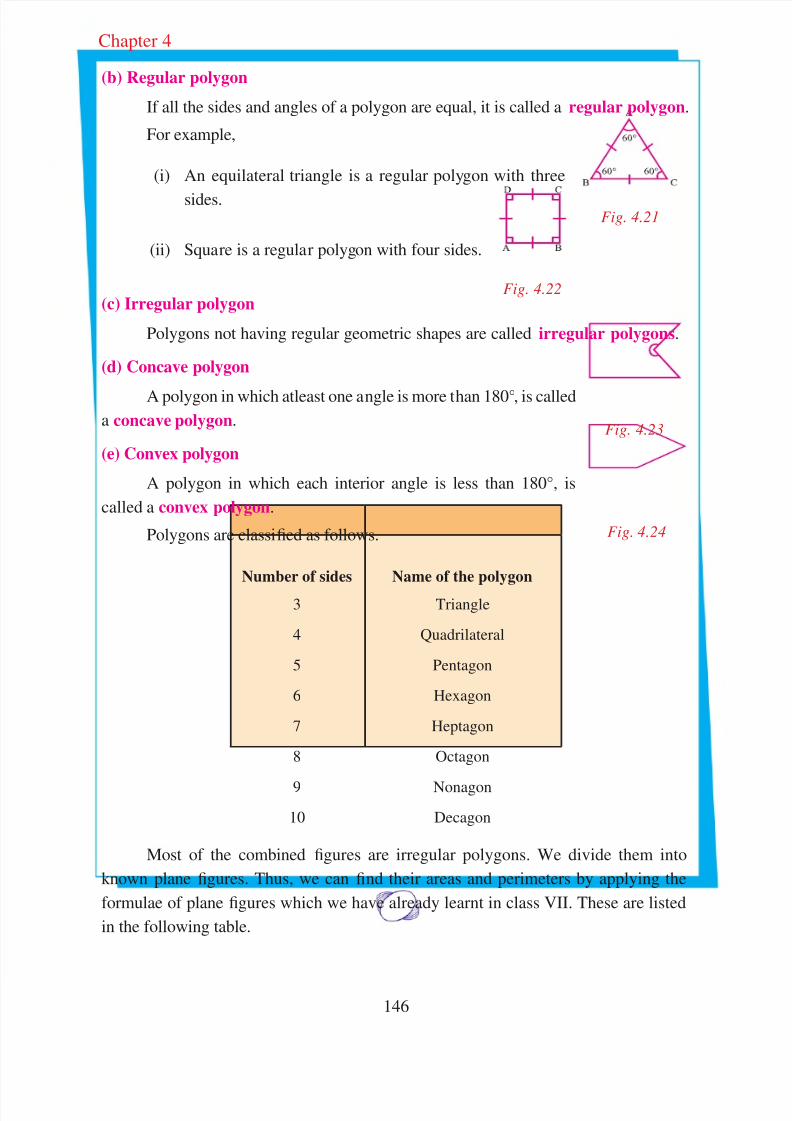
(b) Regular polygon
If all the sides and angles of a polygon are equal, it is called a regular polygon.
For example,
(i) An equilateral triangle is a regular polygon with three
sides.
(ii) Square is a regular polygon with four sides.
(c) Irregular polygon
Polygons not having regular geometric shapes are called irregular polygons.
(d) Concave polygon
A polygon in which atleast one angle is more than 180°, is called
a concave polygon.
(e) Convex polygon
A polygon in which each interior angle is less than 180°, is
called a convex polygon.
Polygons are classified as follows.
Number of sides Name of the polygon
3
4
5
6
7
8
9
10
Triangle
Quadrilateral
Pentagon
Hexagon
Heptagon
Octagon
Nonagon
Decagon
Most of the combined figures are irregular polygons. We divide them into
known plane figures. Thus, we can find their areas and perimeters by applying the
formulae of plane figures which we have already learnt in class VII. These are listed
in the following table.
Fig. 4.21
Fig. 4.22
Fig. 4.23
Fig. 4.24

8/2/2019 Std08 Maths EM 2
http://slidepdf.com/reader/full/std08-maths-em-2 9/152
147
Measurements
No.Name of the
FigureFigure
Area (A)
(sq. units)
Perimeter (P)
(units)
1. Triangle b h2
1# # AB + BC + CA
2. Right triangle b h
2
1# #
(base + height +
hypotenuse)
3.Equilateral
triangle
a43 2
where
( 3 - 1.732)
AB+BC+CA = 3a ;
Altitude, h = a2
3
units
4. Isosceles triangle a h2 2
# - 2a +2 a h2 2
-
5. Scalene triangle( ) ( ) ( )s s a s b s c- - -
where sa b c
2=
+ +
AB BC CA+ +
a b c= + +^ h
6. Quadrilateral ( )d h h2
11 2# # +
AB + BC + CD + DA
7. Parallelogram b × h 2 × (a + b)
8. Rectangle l × b 2 × (l + b)
9. Trapezium h2
1# #(a+b) AB + BC + CD + DA
10. Rhombusd d
2
11 2# # where
d d ,1 2 are diagonals
4a
11. Square a2 4a
BA
D
C
h 1
h 2
d
b
A
B C
A
B C

8/2/2019 Std08 Maths EM 2
http://slidepdf.com/reader/full/std08-maths-em-2 10/152
148
Chapter 4
Example 4.5
Find the perimeter and area of the following combined figures.
(i) (ii)
Solution
(i) It is a combined figure made up of a square ABCD
and a semicircle DEA. Here, arc DEA!
is half the
circumference of a circle whose diameter is AD.
Given: Side of a square = 7 cm
` Diameter of a semicircle = 7 cm
` Radius of a semicircle, r =27 cm
Perimeter of the combined figure = AB BC CD DEA+ + +!
P = 7 + 7 + 7 +21
# (circumference of a circle)
= 21 + r 21 2# r = 21 +
722
27
#
P = 21 + 11 = 33 cm ` Perimeter of the combined figure = 33 cm.
Area of the combined figure = Area of a semicircle + Area of a square
A = r a
2
22r
+
=7 2
222 27 7
##
#
# + 72 =4
77 + 49
̀ Area of the given combined figure = 19.25 49+ = 68.25 cm2 .
Divide the given shapes into plane figures as you like and discuss among
yourselves.
Fig. 4.25
B
A
C
D
E
Fig. 4.26 Fig. 4.27
B
A
C
D
E

8/2/2019 Std08 Maths EM 2
http://slidepdf.com/reader/full/std08-maths-em-2 11/152
149
Measurements
Fig. 4.28
Fig. 4.29
(ii) The given combined figure is made up of a square ABCD and
an equilateral triangle DEA.
Given: Side of a square = 4 cm
` Perimeter of the combined figure = AB + BC + CD + DE + EA
= 4 + 4 + 4 + 4 + 4 = 20 cm ` Perimeter of the combined figure = 20 cm.
Area of the given combined figure = Area of a square +
Area of an equilateral triangle
= a2 + a
43 2 .3 1 732=
= 4 4# + 4 443
# #
= 16 + 1.732 × 4
Area of the given combined figure = 16 + 6.928 = 22.928
Area of the given figure - 22. 93 cm2 .
Example 4.6
Find the perimeter and area of the shaded portion
(i) (ii)
Solution
(i) The givenfigure is a combination of a rectangle ABCD and two semicircles
AEB and DFC of equal area.
Given: Length of the rectangle, l = 4 cm
Breadth of the rectangle, b = 2 cm
Diameter of a semicircle = 2 cm
` Radius of a semicircle, r =22 = 1 cm
` Perimeter of the given figure = AD+BC+ AEB DFC+!!
= 4+ 4+ 2 #21
# (circumference of a circle)
= 8 + 2 # r 21 2# r
= 8 + 2 # 7
22#1
= 8 2 3.14#+
= 8 + 6. 28

8/2/2019 Std08 Maths EM 2
http://slidepdf.com/reader/full/std08-maths-em-2 12/152
150
Chapter 4
` Perimeter of the given figure = 14.28 cm.
Area of the given figure = Area of a rectangle ABCD +
2 × Area of a semicircle
= l × b + 2 # r
2
2r
= 4 × 2 + 2 #
7 222 1 1
#
# #
` Total area = 8 + 3. 14 = 11. 14 cm 2 .
(ii) Let ADB, BEC and CFA be the three semicircles I, II and III respectively.
Given:
Radius of a semicircle I, r 1
=2
10 = 5 cm
Radius of a semicircle II,r
2 = 2
8
=4 cm
Radius of a semicircle III, r 3
=26
=3 cm
Perimeter of the shaded portion = Perimeter of a semicircle I +
Perimeter of a semicircle II +
Perimeter of a semicircle III
= 5 42 2 2 3# # #r r r + + + + +^ ^ ^h h h= 2 5 4 3r + + +^ ^h h = 2 12#r +^ h=
722 14 12#+` j = 12 61.714
736 # =
Perimeter of the shaded portion - 61.71cm.
Area of the shaded portion, A = Area of a semicircle I +
Area of a semicircle II +
Area of a semicircle III
A = r r r
2 2 21
22
23
2r r r
+ +
= 5 5 4 47 2
22
7 2
22
7 2
22
3 3# # # # # # # # #+ +
A = .7
2757
1767
997
550 78 571 cm2+ + = =
Area of the shaded portion - 78.57 cm2
In this example we observe that,
Area of semicircle BEC + Area of semicircle CFA = Area of semicircle ADB
IIIII
I

8/2/2019 Std08 Maths EM 2
http://slidepdf.com/reader/full/std08-maths-em-2 13/152
151
Measurements
Example 4.7
A horse is tethered to one corner of a rectangular
field of dimensions 70 m by 52 m by a rope 28 m long
for grazing. How much area can the horse graze inside?
How much area is left ungrazed?
Solution
Length of the rectangle, l = 70 m
Breadth of the rectangle, b = 52 m
Length of the rope = 28 m
Shaded portion AEF indicates the area in which the horse can graze. Clearly, it
is the area of a quadrant of a circle of radius, r = 28 m
Area of the quadrant AEF = r
4
1 2# r sq. units
=41
722 28 28# # # = 616 m2
` Grazing Area = 616 m2 .
Area left ungrazed = Area of the rectangle ABCD –
Area of the quadrant AEF
Area of the rectangle ABCD = l × b sq. units
= 70 × 52 = 3640 m2
`
Area left ungrazed = 3640 – 616 = 3024 m2
. Example 4.8
In the given figure, ABCD is a square of side 14 cm. Find the
area of the shaded portion.
Solution
Side of a square, a = 14 cm
Radius of each circle, r =27 cm
Area of the shaded portion = Area of a square -4 × Area of a circle
= a2 - 4 ( r 2
r )
= 14 × 14 – 4 # 7
2227
27
# #
= 196 – 154
` Area of the shaded portion = 42 cm2 .
F
E
Fig. 4.30
Fig. 4.31
Fig. 4.32
7cm 7cm
7/2cm 7/2cm

8/2/2019 Std08 Maths EM 2
http://slidepdf.com/reader/full/std08-maths-em-2 14/152
152
Chapter 4
Example 4.9
A copper wire is in the form of a circle with radius 35 cm. It is bent into a
square. Determine the side of the square.
Solution
Given: Radius of a circle,r
= 35 cm.Since the same wire is bent into the form of a square,
Perimeter of the circle = Perimeter of the square
Perimeter of the circle = r 2r units
= 2 357
22 cm# #
P = 220 cm.
Let ‘a’ be the side of a square.
Perimeter of a square = 4a units
4a = 220
a = 55 cm
` Side of the square = 55 cm.
Example 4.10
Four equal circles are described about four corners of
a square so that each touches two of the others as shown in the
Fig. 4.35. Find the area of the shaded portion, each side of thesquare measuring 28 cm.
Solution
Let ABCD be the given square of side a.
` a = 28cm
` Radius of each circle, r =2
28
= 14 cm
Area of the shaded portion = Area of a square - 4 × Area of a quadrant
= a2 - 4 r
41 2
# # r
= 28 × 28 -4 # 14 1441
722
# # #
= 784 – 616
` Area of the shaded portion = 168 cm2 .
Fig. 4.35
Fig. 4.34
Fig. 4.33

8/2/2019 Std08 Maths EM 2
http://slidepdf.com/reader/full/std08-maths-em-2 15/152
153
Measurements
Example 4.11
A 14 m wide athletic track consists of two straight
sections each 120 m long joined by semi-circular ends
with inner radius is 35 m. Calculate the area of the track.
SolutionGiven: Radius of the inner semi circle, r = 35 m
Width of the track = 14 m
̀ Radius of the outer semi circle, R = 35 + 14 = 49 m
R = 49 m
Area of the track is the sum of the areas of the semicircular tracks and the areas
of the rectangular tracks.
Area of the rectangular tracks ABCD and EFGH = 2 × (l × b)
= 2 × 14 × 120 = 3360 m2.
Area of the semicircular tracks = 2 × (Area of the outer semicircle-
Area of the inner semicircle)
= 2 r
2
1
2
1R2 2
# r r -` j
= 2 r
2
1 R2 2
# # r -^ h
=7
2249 35
2 2
# -^ h
= 49 35 49 357
22 + -^ ^h h
=7
2284 14# # = 3696 m2
` Area of the track = 3360 + 3696
= 7056 m2 .
Example 4.12
In the given Fig. 4.37, PQSR represents a ower bed. If
OP = 21 m and OR = 14 m, nd the area of the shaded portion.
Solution
Given : OP = 21 m and OR = 14 m
Area of the ower bed = Area of the quadrant OQP -
Area of the quadrant OSR
=4
1
4
1OP OR
2 2
# #r r -
Fig. 4.37
Fig. 4.36

8/2/2019 Std08 Maths EM 2
http://slidepdf.com/reader/full/std08-maths-em-2 16/152
154
Chapter 4
= 214
1
4
114
2 2
# # # #r r -
= 21 144
1 2 2
# #r -^ h
= 21 144
1
7
2221 14# # #+ -^ ^h h
` Area of the flower bed = 354
1
7
227# # # = 192. 5 m
2
.
Example 4.13
Find the area of the shaded portions in the Fig. 4.38, where
ABCD is a square of side 7 cm.
Solution
Let us mark the unshaded portions by I, II, III and IV as
shown in the Fig. 4.39.
Let P,Q,R and S be the mid points of AB, BC,CD and DA
respectively.
Side of the square, a = 7 cm
Radius of the semicircle, r =2
7 cm
Area of I + Area of III = Area of a square ABCD –
Area of two semicircles
with centres P and R
= a2
- r 22
1 2
# # r
= 7 7# - 221
722
27
27# # # #
̀ Area of I + Area of III = 492
77
2
21cm cm2 2
- =` j .
Similarly, we have
Area of II + Area of IV = 492
77
2
21cm cm2 2
- =` j .
Area of the shaded portions = Area of the square ABCD – (Area of I +
Area of II + Area of III + Area of IV)
= 49 - 2
21
2
21+` j
= 49 - 21= 28 cm2
̀ Area of the shaded portions = 28 cm 2 .
Example 4.14
A surveyor has sketched the measurements of a land as below.
Find the area of the land.
Solution
Let J, K, L, M be the surveyor’s marks from A to D.
Fig. 4.38
B
C
F
E
Fig. 4.40
Fig. 4.39

8/2/2019 Std08 Maths EM 2
http://slidepdf.com/reader/full/std08-maths-em-2 17/152
155
Measurements
Given: AJ = 5 m , JF = 7 m,
KB = 6 m, LE = 9 m , MC = 10 m,
AK = 10 m, AL = 12 m,
AM = 15 m and AD = 20 m.
The given land is the combination of the trapezium
KBCM, LEFJ and right angled triangles ABK, MCD, DEL
and JFA.
Let A1
denote the area of the trapezium KBCM.
A1
= ( )21 KB MC KM# #+
= ( )21 6 10 5# #+
A1
= 16 5 4021 m2
# # = .
Let A2 denote the area of the trapezium LEFJ.
A2
= ( )21 JF LE JL# #+
= ( )21 7 9 7# #+
A2
= 16 7 5621 m2
# # = .
Let A3
denote the area of the right angled triangle ABK.
A3
=21 AK KB# #
A3
= 10 6 3021 m2
# # = .
Let A4
denote the area of the right angled triangle MCD.
A4 = .
21 MC MD# #
=21 10 5# #
A4
= 252
50 m2= .
Let A5
denote the area of the right angled triangle DEL.
A5
=21 DL LE# #
=21 AD AL LE# #-^ h
= 921 20 12 #-^ h
A5
= 8 9 3621 m2
# # = .
C
E
F
B
(a parallel sides are KB,
MC and height is KM
KB = 6 m, MC = 10 m,
KM = AM – AK
= 15 – 10 = 5 m)
(a parallel sides are LE,
JF and height is JL
JF = 7 m, LE = 9 m,
JL = AL – AJ
= 12 – 5 = 7 m)

8/2/2019 Std08 Maths EM 2
http://slidepdf.com/reader/full/std08-maths-em-2 18/152
156
Chapter 4
Let A6
denote the area of the right angled triangle JFA.
A6
=21 AJ JF# #
= 5 7 17.521
235 m2
# # = = .
Area of the land = A A A A A A1 2 3 4 5 6+ + + + +
= 40 56 30 25 36 17.5+ + + + +
` Area of the land = 204.5 m2.
EXERCISE 4.2
1. Find the perimeter of the following figures
(i) (ii) (iii)
(iv) (v)
2. Find the area of the following figures
(i) (ii) (iii)
(iv) (v)

8/2/2019 Std08 Maths EM 2
http://slidepdf.com/reader/full/std08-maths-em-2 19/152
157
Measurements
3. Find the area of the coloured regions
(i) (ii) (iii)
(iv) (v) (vi)
4. In the given figure, find the area of the shaded portion if
AC = 54 cm, BC = 10 cm, and O is the centre of bigger
circle.
5. A cow is tied up for grazing inside a rectangular field of dimensions 40 m # 36 m
in one corner of the field by a rope of length 14 m. Find
the area of thefi
eld left ungrazed by the cow.
6. A square park has each side of 100 m. At each corner of
the park there is a flower bed in the form of a quadrant of
radius 14 m as shown in the figure. Find the area of the
remaining portion of the park.
7. Find the area of the shaded region shown in the figure. The
four corners are quadrants. At the centre, there is a circleof diameter 2 cm.
8. A paper is in the form of a rectangle ABCD in which AB = 20 cm and BC = 14
cm. A semicircular portion with BC as diameter is cut off. Find the area of the
remaining part.

8/2/2019 Std08 Maths EM 2
http://slidepdf.com/reader/full/std08-maths-em-2 20/152
Chapter 4
9. On a square handkerchief, nine circular designs each of radius
7 cm are made. Find the area of the remaining portion of the
handkerchief.
10. From each of the following notes in the field book of a surveyor, make a rough
plan of the field and find its area.
(i) (ii)
Can you help the ant?
An ant is moving around a few food
pieces of different shapes scattered on the
floor. For which food-piece would the ant
have to take a shorter round and
longer round?
Which is smaller? The perimeter of a square or the perimeter of
a circle inscribed in it?
158

8/2/2019 Std08 Maths EM 2
http://slidepdf.com/reader/full/std08-maths-em-2 21/152
159
Measurements
The central angle of a circle is 360°.
Perimeter of a semicircle r 2 #r = +^ h units.
Area of a semicircle r
2
2r
= sq . units.
The central angle of a semicircle is 180°.
Perimeter of a quadrant r 2 2 #
r
= +` j units.
Area of a quadrant r
4
2r
= sq . units.
The central angle of a quadrant is 90°.
Perimeter of a combined figure is length of its boundary.
A polygon is a closed plane figure formed by ‘n’ line segments.
Regular polygons are polygons in which all the sides and angles are
equal.
Irregular polygons are combination of plane figures.

8/2/2019 Std08 Maths EM 2
http://slidepdf.com/reader/full/std08-maths-em-2 22/152
5Geometry
5.1 Introduction
5.2 Properties of Triangle
5.3 Congruence of Triangles
5.4 Concurrency in Triangle
5.5 Pythagoras Theorem
5.6 Circles
5.1 Introduction
Geometry was developed by Egyptians more than 1000 years
before Christ, to help them mark out their fields after the floods from the
Nile. But it was abstracted by the Greeks into logical system of proofs
with necessary basic postulates or axioms.
Geometry plays a vital role in our life in many ways. In nature,
we come across many geometric shapes like hexagonal bee-hives,
spherical balls, rectangular water tanks, cylindrical wells and so on. The
construction of Pyramids is a glaring example for practical application
of geometry. Geometry has numerous practical applications in many
fields such as Physics, Chemistry, Designing, Engineering, Architecture
and Forensic Science.
The word ‘Geometry’ is derived from two Greek words ‘Geo’
which means ‘earth’ and ‘metro’ which means ‘to measure’. Geometry
is a branch of mathematics which deals with the shapes, sizes, position
and other properties of the object.
In class VII, we have learnt about the properties of parallel lines,
transversal lines, angles in intersecting lines, adjacent and alternative
angles. Moreover, we have also come across the angle sum property of
a triangle.
Euclid
Father of Geometry
“Euclid
was a great
Mathematician
who gave birth to
logical thinking
in geometry”.Euclid collected
the various
information on
geometry around
300B.C. and
published them
in the form of
13 books in a
systematic manner.
These books are
called Euclid
Elements.Euclid said :
“The whole is
greater with any of
its parts”.

8/2/2019 Std08 Maths EM 2
http://slidepdf.com/reader/full/std08-maths-em-2 23/152
161
Geometry
Let us recall the results through the following exercise.
REVISION EXERCISE
1. In Fig.5.1, x° = 128°. Find y°. 2. Find BCE+ and ECD+ in the
Fig.5.2, where 90ACD+
=c
3. Two angles of a triangle are 43° and 27°. Find the third angle.4. Find x° in the Fig.5.3, if PQ || RS. 5. In the Fig.5.4, two lines AB and CD
intersect at the point O. Find the
value of x° and y°.
6. In the Fig. 5.5 AB || CD. Fill in the blanks.
(i) EFB+ and FGD+ are .................... angles.
(ii) AFG+ and FGD+ are ................... angles.
(iii) AFE+ and FGC+ are ...................... angles.
5.2 Properties of Triangles
A triangle is a closedfigure bounded by three line segments
in a plane.
Triangle can be represented by the notation ‘Δ’.
In any triangle ABC, the sides opposite to the vertices
A, B, C can be represented by a, b, c respectively.
C
yo xo
O BAFig. 5.1
C B
D E
x°
A
x°+10°
Fig. 5.2
P
R
Q
S
M
N
2 x°+15°
x°+45°
Fig. 5.3
A D
B
O x°
750
C
y°
Fig. 5.4
Fig. 5.6
C
B
D
E
H
G
F
Fig. 5.5
A
.

8/2/2019 Std08 Maths EM 2
http://slidepdf.com/reader/full/std08-maths-em-2 24/152
Chapter 5
5.2.1. Kinds of Triangles
Triangles can be classified into two types based on sides and angles.
Based on sides:
(a) Equilateral Triangle (b) Isosceles Triangle (c) Scalene Triangle
Based on angles:
(d) Acute Angled (e) Right Angled (f) Obtuse Angled
Triangle Triangle Triangle
5.2.2 Angle Sum Property of a Triangle
Theorem 1
The sum of the three angles of a triangle is 180°.
Given : ABC is a Triangle.
To Prove : 180ABC BCA CAB o+ + ++ + =
Construction : Through the vertex A draw XY parallel to BC.
Proof :Statement Reason
(i) BC XY< and AB is a transversal
ABC XAB` + +=
(ii) and BCA YAC+ +=
(iii) ABC BCA XAB YAC+ + + +++ =
(iv) ABC BCA CAB+ + ++ +^ h =
XAB YAC CAB+ + ++ +^ h
(v) ABC BCA CAB` + + ++ + =180°
Alternate angles.
Alternate angles.
By adding (i) and (ii).
By adding BAC+ on both sides.
The angle of a straight line is 180°.
B C
A Y X
> >
Fig. 5.7
162

8/2/2019 Std08 Maths EM 2
http://slidepdf.com/reader/full/std08-maths-em-2 25/152
163
Geometry
(i) Triangle is a polygon of three sides.
(ii) Any polygon could be divided into triangles by joining the diagonals.
(iii) The sum of the interior angles of a polygon can be given bythe formula (n – 2) 180°, where n is the number of sides.
Illustration
Figure
Number of sides 3 4 5
Classification Triangle Quadrilateral Pentagon
Sum of angles (3 – 2) 180° = 180° (4 – 2)180° = 360° (5 – 2) 180° = 540°
Theorem 2
If a side of a triangle is produced, theexterior angle so formed, is equal to the sum of
the two interior opposite angles.
Given : ABC is a triangle.
BC is produced to D.
To Prove : ACD ABC CAB+ + += +
Proof :
Statement Reason
(i) In ABC,T ABC BCA CAB+ + ++ + =1800 (ii) BCA ACD+ ++ = 180
0
(iii) ABC BCA CAB+ + ++ + =
BCA ACD+ ++
(iv) ABC CAB` + ++ = ACD+
(v) The exterior angle ACD+ is equal to the
sum of the interior opposite angles
ABC+ and CAB+ .
Angle sum property of a triangle
Sum of the adjacent angles of a straight
line
Equating (i) and (ii)
Subtracting BCA+ on both sides of (iii)
Hence proved.
Fig. 5.8
A
CB D
Results

8/2/2019 Std08 Maths EM 2
http://slidepdf.com/reader/full/std08-maths-em-2 26/152
Chapter 5
(i) In a traingle the angles opposite to equal sides are equal.
(ii) In a traingle the angle opposite to the longest side is largest.
Example 5.1
In ABC, A 75 , B 65o o+ +D = = find C+ .
Solution
We know that in ABC,D
A B C+ + ++ + = 180°
75 65 Co o++ + = 180°
140 Co++ = 180°
C+ = 180° – 140°
C` + = 40°.
Example 5.2
In ABC,D given that A 70o+ = and AB = AC. Find the other angles of Δ ABC.
Solution
Let B+ = x° and C+ = y°.
Given that ΔABC is an isosceles triangle.
AC = AB
B+ = C+ [Angles opposite to equal sides are equal]
xo = yo
In ABCD , A B C+ + ++ + = 180°
x y70o o o
+ + = 180°
x x70o o o
+ + = 180° x ya =c c6 @
2 x° = 180° – 70°
2 x° = 110°
x° = 2110
o
= 55°. Hence B+ = 55° and C+ = 55°. Example 5.3
The measures of the angles of a triangle are in the ratio 5 : 4 : 3. Find the angles
of the triangle.
Solution
Given that in a ABC, A : B : C+ + +D = 5 : 4 : 3.
Let the angles of the given triangle be 5 x°, 4 x° and 3 x°.
Fig. 5.9
Fig. 5.10
Results
164

8/2/2019 Std08 Maths EM 2
http://slidepdf.com/reader/full/std08-maths-em-2 27/152
165
Geometry
We know that the sum of the angles of a triangle is 180° .
5 x° + 4 x° + 3 x° = 180° & 12 x° = 180°
x° =12
1800
= 15°
So, the angles of the triangle are 75°, 60° and 45°.
Example 5.4
Find the angles of the triangle ABC, given in Fig.5.11.
Solution
BD is a straight line.
We know that angle in the line segment is 180°.
x°+ 110° = 180°
x° = 180° – 110°
x° = 70°We know that the exterior angle is equal to the sum of the two interior opposite
angles.
x° + y° = 110°
70° + y° = 110°
y° = 110° – 70° = 40°
Hence, x° = 70°
and y° = 40°.
Example 5.5
Find the value of DEC+ from the given Fig. 5.12.
Solution
We know that in any triangle, exterior angle is equal
to the sum of the interior angles opposite to it.
In ABC,D ACD+ = ABC CAB+ ++
ACD` + = 70° + 50° = 120°
Also, ACD+ = ECD+ = 120°.
Considering ECD,D
ECD CDE DEC+ + ++ + = 1800 [Sum of the angles of a triangle]
120 22 DEC0 0++ + = 1800
DEC+ = 180° – 142°
DEC+ = 38°
Fig. 5.11
Fig. 5.12

8/2/2019 Std08 Maths EM 2
http://slidepdf.com/reader/full/std08-maths-em-2 28/152
Chapter 5
Draw all the types of triangles T1, T
2, T
3, T
4, T
5and T
6. Let us name the triangles
as ABC.Let a, b, c be the sides opposite to the vertices A, B, C respectively.
Measure the sides and arrange the data as follows:
SerialNo.of T
a(cm)
b(cm)
c(cm)
(c+a) > bTrue / False
(a + b) > cTrue / False
(b + c) > aTrue / False
T1
T2
T3
T4
T5
T6
What do you observe from this table ?
Theorem 3
Any two sides of a triangle together is greater than the third side.
(This is known as Triangle Inequality)
Veri fication :
Consider the triangle ABC such that BC = 12 cm, AB = 8 cm, AC = 9 cm.
(i) AB = 8 cm , AB + BC = 20 cm
(ii) BC = 12 cm , BC + CA = 21 cm
(iii) CA = 9 cm, CA + AB = 17 cmNow clearly ,
(i) AB + BC > CA
(ii) BC + CA > AB
(iii) CA + AB > BC
In all the cases, we find that the sum of any two sides of a triangle is greater
than the third side.
Example 5.6
Which of the following will form the sides of a triangle?
(i) 23 cm, 17 cm, 8 cm (ii) 12 cm, 10 cm, 25 cm (iii) 9 cm, 7 cm, 16cm
Solution
(i) 23cm, 17cm, 8cm are the given lengths.
Here 23 + 17 > 8, 17 + 8 > 23 and 23 + 8 > 17.
` 23cm, 17cm, 8cm will form the sides of a triangle.
(ii) 12cm, 10cm, 25cm are the given lengths.
166

8/2/2019 Std08 Maths EM 2
http://slidepdf.com/reader/full/std08-maths-em-2 29/152
Geometry
Here 12 + 10 is not greater than 25. ie, 12 10 252+6 @
` 12cm, 10cm, 25cm will not form the sides of a triangle.
(iii) 9cm, 7 cm, 16cm are given lengths. 9 + 7 is not greater than 16.
ie, ,9 7 16 9 7 162+ = +6 @
`9 cm, 7cm and 16cm will not be the sides of a triangle.
(i) c a b2+ ( b c a1 + ( b c a1-
(ii) b c a2+ ( a b c1 + ( a b c1-
(iii) a b c2+ ( c a b1 + ( c a b1-
From the above result we observe that in any triangle the difference between
the length of any two sides is less than the third side.
EXERCISE 5.1
1. Choose the correct answer:
(i) Which of the following will be the angles of a triangle?
(A) 35°, 45°, 90° (B) 26°, 58°, 96°
(C) 38°, 56°, 96° (D) 30°, 55°, 90°
(ii) Which of the following statement is correct ?
(A) Equilateral triangle is equiangular.
(B) Isosceles triangle is equiangular.(C) Equiangular triangle is not equilateral.
(D) Scalene triangle is equiangular
(iii) The three exterior angles of a triangle are 130°, 140°, x° then x° is
(A) 90° (B) 100° (C) 110° (D) 120°
(iv) Which of the following set of measurements will form a triangle?
(A) 11 cm, 4 cm, 6 cm (B) 13 cm, 14 cm, 25 cm
(C) 8 cm, 4 cm, 3 cm (D) 5 cm, 16 cm, 5 cm
(v) Which of the following will form a right angled triangle, given that thetwo angles are
(A) 24°, 66° (B) 36°, 64°
(C) 62°, 48° (D) 68°, 32°
2. The angles of a triangle are ( x – 35)°, ( x – 20)° and ( x + 40)°.
Find the three angles.
3. In ABCD , the measure of A+ is greater than the measure of B+ by 24c. If
exterior angle C+ is 108°. Find the angles of the ABCD .
Results
167

8/2/2019 Std08 Maths EM 2
http://slidepdf.com/reader/full/std08-maths-em-2 30/152
168
Chapter 5
4. The bisectors of B+ and C+ of a ABCD meet at O.
Show that BOC 902A
++
= +c .
5. Find the value of x° and y° from the following figures:
(i) (ii) (iii)
6. Find the angles x° , y° and z° from the given figure.
5.3 Congruence of Triangles
We are going to learn the important geometrical idea “Congruence”.
To understand what congruence is, we will do the following activity:
Take two ten rupee notes. Place them one over the other. What do you observe?
One note cover the other completely and exactly.
From the above activity we observe that the figures are of the same shape and
the same size.
In general, if two geometrical figures are identical in shape and size then they
are said to be congruent.
Check whether the following objects are congruent or not :
(a) Postal stamps of same denomination.
(b) Biscuits in the same pack.
(c) Shaving blades of same brand.

8/2/2019 Std08 Maths EM 2
http://slidepdf.com/reader/full/std08-maths-em-2 31/152
169
Geometry
Now we will consider the following plane figures.
Fig. 5.13 Fig. 5.14
Observe the above two figures. Are they congruent? How to check?
We use the Method of Superposition.
Step 1 : Take a trace copy of the Fig. 5.13. We can use Carbon sheet.
Step 2 : Place the trace copy on Fig. 5.14 without bending, twisting and
stretching.
Step 3 : Clearly the figure covers each other completely.
Therefore the two figures are congruent.
Congruent: Two plane figures are Congruent if each when superposed on the other
covers it exactly. It is denoted by the symbol “/”.
5.3.1 (a) Congruence among Line Segments
Two line segments are congruent, if they have the same length.
Here, length AB = length CD. Hence AB CD/
(b) Congruence of Angles
Two angles are congruent, if they have the same measure.
Here the measures are equal. Hence MON PQR+ +/ .
A
F
E
DB
C
P
U
T
SQ
R
A
B
3 c m
C D
3cm
N
M
O40o
QP
R
40o

8/2/2019 Std08 Maths EM 2
http://slidepdf.com/reader/full/std08-maths-em-2 32/152
170
Chapter 5
(c) Congruence of Squares
Two squares having same sides are congruent to each other.
Here, sides of the square ABCD = sides of the square PQRS.
` Square ABCD / Square PQRS
(d) Congruence of Circles
Two circles having the same radius are congruent.
In the given figure, radius of circle C1 = radius of circle C2 .
` Circle C1 / Circle C2
The above four congruences motivated us to learn about the congruence of triangles.
Let us consider the two triangles as follows:
If we superpose ΔABC on ΔPQR with A on P, B on Q and C on R such that
the two triangles cover each other exactly with the corresponding vertices, sides and
angles.
We can match the corresponding parts as follows:
Corresponding Vertices Corresponding Sides Corresponding Angles
A P* AB = PQ A P+ +=
B Q* BC = QR B Q+ +=
C R* CA = RP C R+ +=

8/2/2019 Std08 Maths EM 2
http://slidepdf.com/reader/full/std08-maths-em-2 33/152
171
Geometry
5.3.2. Congruence of Triangles
Two triangles are said to be congruent, if the three sides and the three angles
of one triangle are respectively equal to the three sides and three angles of the other.
Note: While writing the congruence condition between two triangles the order of
the vertices is signifi
cant.
If ΔABC/ ΔPQR, then the congruence could be written as follows in different orders
ΔBAC / ΔQPR, ΔCBA / ΔRQP and so on. We can also write in anticlockwisedirection.
5.3.3. Conditions for Triangles to be Congruent
We know that, if two triangles are congruent, then six pairs of their corresponding
parts (Three pairs of sides, three pairs of angles) are equal.
But to ensure that two triangles are congruent in some cases, it is suf ficient to
verify that only three pairs of their corresponding parts are
equal, which are given as axioms.
There are four such basic axioms with different
combinations of the three pairs of corresponding parts. These
axioms help us to identify the congruent triangles.
If ‘S’ denotes the sides, ‘A’ denotes the angles, ‘R’ denotes the right angle and
‘H’ denotes the hypotenuse of a triangle then the axioms are as follows:
(i) SSS axiom (ii) SAS axiom (iii) ASA axiom (iv) RHS axiom
(i) SSS Axiom (Side-Side-Side axiom)
If three sides of a triangle are respectively equal to the three sides of anothertriangle then the two triangles are congruent.
Axiom: The simple
properties which aretrue without actually
proving them.
A
B C
P
Q R

8/2/2019 Std08 Maths EM 2
http://slidepdf.com/reader/full/std08-maths-em-2 34/152
Chapter 5
We consider the triangles ABC and PQR such that,
AB = PQ, BC = QR and CA= RP.
Take a trace copy of ABCT and superpose on PQRT such that
AB on PQ , BC on QR and AC on PR
Since AB = PQ & A lies on P, B lies on QSimilarly BC = QR & C lies on R
Now, the two triangles cover each other exactly.
` ABC PQR/D D
Here, we observe that AB PQ , BC QR , CA RP= = = .
It can be written asPQAB
QRBC
RPCA 1= = = .
Example 5.7
From the following figures, state whether the given pairs of triangles are
congruent by SSS axiom.
Solution
Compare the sides of the ΔPQR and ΔXYZ
PQ = XY = 5cm, QR = YZ = 4.5 cm and RP = ZX = 3cm.
If we superpose PQR on XYZD D .
P lies on X, Q lies on Y, R lies on Z and PQRT covers XYZT exactly.
PQR XYZ` /D D [by SSS axiom].
Example 5.8
In the figure, PQSR is a parallelogram.
PQ = 4.3 cm and QR = 2.5 cm. Is PQR PSR?/D D
Solution
Consider PQR and PSRD D . Here, PQ = SR = 4.3cm
and PR =QS = 2.5cm. PR = PR [common side]
PQR RSP` /D D [by SSS axiom]
PQR PSR` _D D [ RSPD and PSRD are of different order]
What will happen
when the ratio is not
equal to 1?
172

8/2/2019 Std08 Maths EM 2
http://slidepdf.com/reader/full/std08-maths-em-2 35/152
173
Geometry
(ii) SAS Axiom (Side-Angle-Side Axiom)
If any two sides and the included angle of a triangle are respectively equal
to any two sides and the included angle of another triangle then the two triangles
are congruent.
We consider two triangles, ABC and PQRD D such that AB = PQ, AC = PR
and included angle BAC = included angle QPR.
We superpose the trace copy of ABCD on PQRD with AB along PQ and AC
along PR.
Now, A lies on P and B lies on Q and C lies on R. Since,AB = PQ and AC = PR,
B lies on Q and C lies on R. BC covers QR exactly.
ABC` D covers PQRD exactly.
Hence, ABC PQR/D D
(iii) ASA Axiom (Angle-Side-Angle Axiom)
If two angles and a side of one triangle are respectively equal to two
angles and the corresponding side of another triangle then the two triangles are
congruent.
Consider the triangles, ABC and PQRD D .Here, BC QR, B Q, C R+ + + += = = .
By the method of superposition, it is understood that ABC+ covers PQR+
exactly and BCA+ covers QRP+ exactly.
So, B lies on Q and C lies on R. Hence A lies on P.
ABC` D covers PQRD exactly. Hence, ABC PQR/D D .
As the triangles are congruent, we get remaining corresponding parts are also
equal. (i.e.) AB = PQ, AC = PR and A P+ +=
A
B C
P
Q R
A
B C
P
Q R

8/2/2019 Std08 Maths EM 2
http://slidepdf.com/reader/full/std08-maths-em-2 36/152
174
Chapter 5
Representation: The Corresponding Parts of Congruence Triangles are Congruent
is represented in short form as c.p.c.t.c. Hereafter this notation will be used in the
problems.
Example 5.9
AB and CD bisect each other at O. Prove that AC = BD.
Solution
Given : O is mid point of AB and CD.
AO OB` = and CO OD=
To prove : AC BD=
Proof : Consider ΔAOC and ΔBOD
AO OB= [Given]
CO OD= [Given]
AOC BOD+ += [Vertically Opposite angle]
AOC BODT/T [by SAS axiom]
Hence we get, AC BD= [by c.p.c.t.c.]
Example 5.10
In the given figure, DABD and CABD are on
the same base AB. Prove that DAB CAB/D D
Solution
ConsiderΔ
DAB andΔ
CAB DAB+ = 35 20 55=+c c c = CBA+ [Given]
DBA+ = CAB+ = 20c [Given]
AB is common to both the triangles.
DBA CAB` /D D [by ASA axiom]
Hypotenuse
Do you know what is meant by hypotenuse ?
Hypotenuse is a word related with right angled triangle.
Consider the right angled triangle ABC. B+ is a right angle.
The side opposite to right angle is known as the hypotenuse.
Here AC is hypotenuse.
A
D
B
C
O
Fig. 5.13
h y potenuse
A
B C
h y p o t e n u s e
A
BC
h y p o t e n u s e A
B
C

8/2/2019 Std08 Maths EM 2
http://slidepdf.com/reader/full/std08-maths-em-2 37/152
175
Geometry
(iv) RHS Axiom (Right angle - Hypotenuse - Side)
If the hypotenuse and one side of the right angled triangle are respectively
equal to the hypotenuse and a side of another right angled triangle, then the two
triangles are congruent.
Consider ABCD and DEFD where, B E 90o+ += =
Hypotenuse AC = Hypotenuse DF [Given]
Side AB = Side DE [Given]
By the method of superposing, we see that ABC DEF/D D .
5.3.4 Conditions which are not suf ficient for congruence of triangles
(i) AAA (Angle - Angle - Angle)
It is not a suf ficient condition for congruence of triangle. Why?
Let us find out the reason. Consider the following triangles.
In the above figures,
A P+ += , B Q+ += and C R+ +=
But size of ABCD
is smaller than the size of PQRD
.` When ABCD is superposed on the PQR,D they will not cover each other
exactly. ABC PQR` _D D .
(ii) SSA (Side-Side-Angle)
We can analyse a case as follows:
Construct ΔABC with the measurements B 50°+ = , AB = 4.7 cm and
AC = 4 cm. Produce BC to X. With A as centre and AC as radius draw an arc of 4 cm.
It will cut BX at C and D.
A
B C
D
E F

8/2/2019 Std08 Maths EM 2
http://slidepdf.com/reader/full/std08-maths-em-2 38/152
Chapter 5
AD` is also 4cm [aAC and AD are the radius of
the same circle]
Consider ABCD and ABDD .
B+ is common.
AB is common and AC = AD = 4cm[by construction]
Side AC, side AB and B of ABC+ D and side
AD , side AB and B+ of ΔABD are respectively
congruent to each others. But BC and BD are not equal.
ABC ABD` _D D .
Example 5.11
Prove that the angles opposite to equal side of a triangle are equal.
Solution
ABC is a given triangle with, AB = AC.
To prove : Angle opposite to AB = Angle
opposite to AC (i.e.) C B+ += .
Construction : Draw AD perpendicular to BC.
ADB` + = ADC+ = 90c
Proof :
Condiser ABD and ACDD D .AD is common
AB = AC [ ABCD is an isosecles]
ADB+ = ADC+ = 90c [by construction]
ADB ADC` /D D [by RHS axiom]
Hence ABD+ = ACD+ [by c.p.c.t.c]
(or) ABC+ = ACB+ .
B+ = C+ . Hence the proof.
This is known as Isosceles triangle theorem.
Example 5.12
Prove that the sides opposite to equal angles of a triangle are equal.
Solution
Given : In a ABCD , B C+ += .
To prove : AB = AC.
Construction : Draw AD perpendicular to BC.
A
B CD
X
176

8/2/2019 Std08 Maths EM 2
http://slidepdf.com/reader/full/std08-maths-em-2 39/152
177
Geometry
Proof :
ADB+ = ADC+ = 90° [by construction]
B+ = C+ [given]
AD is common side.
ADB ADC` /D D (by AAS axiom)
Hence, AB = AC. [by c.p.c.t.c]
So, the sides opposite to equal angles of a triangle are equal.
This is the converse of Isosceles triangle theorem.
Example 5.13
In the given figure AB = AD and BAC DAC+ += . Is ABC ADC?T/T
If so, state the other pairs of corresponding parts.
SolutionIn ABCT and ADCT , AC is common.
BAC+ = DAC+ [given]
AB = AD [given]
ABC ADC` T T/ [by SAS axiom]
So, the remaining pairs of corresponding parts are
BC DC= , ABC ADC+ += , ACB ACD+ += . [by c.p.c.t.c]
Example 5.14PQRD is an isosceles triangle with PQ = PR, QP is produced to S and PT
bisects the extension angle 2 x°. Prove that Q xo+ = and hence prove that PT QR< .
Solution
Given : PQRD is an isosceles triangle with PQ = PR .
Proof : PT bisects exterior angle SPR+ and therefore SPT+ = TPR+ = xc.
Q` + = R+ . [Property of an isosceles triangle]
Also we know that in any triangle,
exterior angle = sum of the interior opposite angles.
In PQR` D , Exterior angle SPR+ = PQR PRQ+ ++
2 xc = Q R+ ++
= Q Q+ ++
x2o = 2 Q+
xo = Q+
Hence Q+ = x°.
40o
40o
B
A
D
C
S
TP
Q R
xo
xo
A
B CD

8/2/2019 Std08 Maths EM 2
http://slidepdf.com/reader/full/std08-maths-em-2 40/152
178
Chapter 5
To prove : PT QR<
Lines PT and QR are cut by the transversal SQ. We have SPT+ = x°.
We already proved that xQ o+ = .
Hence, SPT+ and PQR+ are corresponding angles.` PT QR< .
EXERCISE 5.2
1. Choose the correct answer:
(i) In the isosceles XYZD , given XY = YZ then which of the following angles are
equal?
(A) X and Y+ + (B) Y and Z+ + (C) Z and X+ + (D) X, Y and Z+ + +
(ii) In ABCD and DEF, B E, AB DE, BC EF+ +D = = = . The two triangles are
congruent under _____ axiom
(A) SSS (B) AAA (C) SAS (D) ASA(iii) Two plane figures are said to be congruent if they have
(A) the same size (B) the same shape
(C) the same size and the same shape (D) the same size but not same shape
(iv) In a triangle ABC, A 60o+ = and AB = AC, then ABC is _____ triangle.
(A) a right angled (B) an equilateral (C) an isosceles (D) a scalene
(v) In the triangle ABC, when A 90+ = c the hypotenuse is ------
(A) AB (B)BC (C) CA (D) None of these
(vi) In the PQRD the angle included by the sides PQ and PR is
(A) P+ (B) Q+
(C) R+ (D) None of these
(vii) In the figure, the value of x° is ----------
(A) 80o (B) 100o
(C) 120o (D) 200o
2. In the figure, ABC is a triangle in 3. In the figure, Find x°.
which AB = AC. Find x° and y°.
A
CB E
x+480
x0 x0
y0
A
B D
C
O
xO
40O

8/2/2019 Std08 Maths EM 2
http://slidepdf.com/reader/full/std08-maths-em-2 41/152
179
Geometry
4. In the figure PQRD and SQRD 5. In the figure, it is given that BR = PC
are isosceles triangles. Find x°. and ACB QRP+ += and AB PQ< .
Prove that AC = QR.
6. In the figure, AB = BC = CD , A xo+ = . 7. Find x°, y°, z° from the figure,
Prove that DCF 3 A+ += . where AB = BD, BC = DC and
DAC 30o+ = .
8. In the figure, ABCD is a parallelogram. 9. In figure, BO bisects ABC+ of AB
is produced to E such that AB = BE. ABCD . P is any point on BO. Prove
AD produced to F such that AD = DF. that the perpendicular drawn from P
Show that FDC CBE/D D . to BA and BC are equal.
10. The Indian Navy flights fly in a formation
that can be viewed as two triangles with
common side. Prove that SRT QRT3 3/ ,
if T is the midpoint of SQ and SR = RQ.
A
B
R
P
QCS
Q R
P
40O
70O
xO
A B C
D
zo
300
xo
yo
A B D E
C
F
x0
A EB
F
CD
A
B
D
CE
PO

8/2/2019 Std08 Maths EM 2
http://slidepdf.com/reader/full/std08-maths-em-2 42/152
180
Chapter 5
5.4 Concurrency in Triangles
Draw three or more lines in a plane. What are the possible ways?
The possibilities may be as follows:
(a) (b) (c) (d)
In fig (a), AB ,CD and EF are parallel so they are not intersecting.In fig (b), AB and CD intersect at P, AB and EF intersect at Q. So P, Q are
two points of intersection.
In fig (c), P, Q, R are three point of intersection.
But in fig (d), P is the only point of intersection. Here AB, CD, EF passing
through the same point P. These lines are called as concurrent lines. The point P is
called the point of concurrency.
In a triangle there are some special points of concurrence, which are Centroid
of a triangle, Orthocentre of a triangle, Incentre of a triangle and Circumcentre of atriangle. Now we are going to study how to obtain these points in a triangle.
5.4.1 Centroid of a Triangle
In the adjacent figure, ABC is a triangle.
D is mid point of BC. Join AD .
Here AD is one of the medians of Δ ABC.
A median of a triangle is the line segment joining a vertex
and the midpoint of the opposite side.
Now consider the adjacent figure, in which AD, BE, CF are
the three medians of 3 ABC.
They are concurrent at G. This point is called as centroid.
The three medians of a triangle are concurrent and the point
of concurrency is known as Centroid. It is denoted by ‘G’.
Note : (i) The Centroid divides each of the median in the ratio 2 : 1
(ii) The Centroid would be the physical centre of gravity.
A
B
F
DQ
P
C
E
A
B
C
D
E FQ R
P
E
F
C
D
A
B
P
A B
C D
E F
A
B D C2cm 2cm

8/2/2019 Std08 Maths EM 2
http://slidepdf.com/reader/full/std08-maths-em-2 43/152
181
Geometry
5.4.2 Orthocentre of a Triangle
In the adjacent figure, ABC is a triangle .
From A, draw a perpendicular to BC ,
AD is perpendicular to BC .
ADB ADC 900
+ += = . Here D need not be themid point. Here AD is an altitude from vertex A.
Altitude of a triangle is a perpendicular line
segment drawn from a vertex to the opposite side. Now
consider the figure, the triangle ABC in which AD, BE,
CF are the three altitudes.
They are concurrent at H. This point in known as
Orthocentre.
The three altitudes of a triangle are concurrent and the point of concurrency is
known as Orthocentre.
Different positions of orthocentre
(a) (b) (c)
Case (i) : In fig (a), ABC is an acute angled triangle .
Here orthocentre lies inside the ΔABC .
Case (ii) : In fig (b), ABC is a right angled triangle .
Here orthocentre lies on the vertex at the right angle.
Case (iii) : In fig (c), ABC is an obtuse angled triangle.
Here orthocentre lies outside the ΔABC .
5.4.3 Incentre of a Triangle
In the adjacent figure , ABC is a triangle.
The A+ is bisected into two equal parts by AD.
Therefore BAD DAC+ += .
Here AD is said to be the angle bisector of +A.
B
A
CD
A
CB
A
BD C

8/2/2019 Std08 Maths EM 2
http://slidepdf.com/reader/full/std08-maths-em-2 44/152
182
Chapter 5
Angle bisector of a triangle is a line segment which
bisects an angle of a triangle.
Now consider the figure in which AD, BE, CF are
three angle bisectors of 3ABC.
They are concurrent at I.
This point is known as incentre of the triangle.
The three angle bisectors of a triangle are concurrent
and the point of concurrence is called the Incentre .
5.4.4 Circumcentre of a Triangle
We have learnt about perpendicular bisector in previous class.
What is a perpendicular bisector in a triangle?
Refer the following figures:
(a) (b) (c)
In fig (a): AD is perpendicular from A to BC but not bisecting BC .
In fig (b): AD bisects BC. Hence BD = DC and AD is perpendicular to BC.
In fig (c): DX is perpendicular to BC and DX also bisecting BC. BD = DC but
DX need not passes through the vertex ‘A’.
The perpendicular bisector of the side of a triangle is the line that is perpendicular
to it and also bisects the side.
Now, consider the above figure.
A
CB
M
Q
R N
SP
O

8/2/2019 Std08 Maths EM 2
http://slidepdf.com/reader/full/std08-maths-em-2 45/152
183
Geometry
Here PQ, RS, and MN are the three perpendicular bisectors of BC, AC and AB
concurrent at O.
O is known as the circumcentre.
The three perpendicular bisectors of a triangle are concurrent and the point of
concurrence is known as circumcentre .Note : (i) In any triangle ABC , Circumcentre (O) , Centroid (G) and Orthocentre
(H) are always lie on one straight line, which is called as Euler Line,
and OG : GH = 1 : 2.
(ii) In particular for equilateral triangle, Circumcentre (O), Incentre (I),
Orthocentre (H) and Centroid (G) will coincide.
5.5 Pythagoras Theorem
Pythagoras (582 - 497 B.C) was one of the foremost Mathematicians of all
times. He was perhaps best known for the right angled triangle relation which bears
his name.
5.5.1 Pythagoras Theorem
In a right angled triangle the square of the hypotenuse is equal to the sum
of the squares of the other two sides.
Let us consider ABCD with C 90o+ = .
BC a, CA b= = and AB c= .
Then, a b c
2 2 2
+ = .This was proved in number of ways by different
Mathematicians.
We will see the simple proof of Pythagoras
Theorem.
Now, we construct a square of side (a b+ ) as shown in the figure,
and using the construction we prove
Pythagoras theorem. That is, we prove .a b c2 2 2+ =
We know that Area of any square is squareof its side.
Area of a square of side (a b)+ = (a b) 2+
From the figure,
Area of the square of side (a + b) is = (a b) 2+
= sum of the area of the
triangles I, II, III and IV +
the area of the square PQRS
A
CB
h y p o
t e n u
s e
a
b
base
c
h
e i g h t
I II
IIIIV
a P b
b
Q
a
b R a
a
S
bc
c c
c

8/2/2019 Std08 Maths EM 2
http://slidepdf.com/reader/full/std08-maths-em-2 46/152
184
Chapter 5
i.e., (a b) 2+ = 4 (Area of right angled D) + (Area of the square PQRS)
(a b) 2+ = 4
21 a b c2
# # +` j a b 2ab2 2
+ + = 2ab c2+
a b2 2` + = c2
Hence we proved Pythagoras theorem.
Pythagoras Theorem
Draw a right angled triangle
ABC,such that C 90 ,o+ = AB = 5 cm,
AC = 4 cm and BC = 3 cm.
Construct squares on the three
sides of this triangle.
Divide these squares into smallsquares of area one cm2 each.
By counting the number of small
squares, pythagoras theorem can be
proved.
Number of squares in ABPQ = 25
Number of squares in BCRS = 9
Number of squares in ACMN = 16
`Number of squares in ABPQ = Number of squares in BCRS +
Number of squares in ACMN.
The numbers which are satisfying the Pythagoras theorem are called the
Pythagorian Triplets.
Example 5.15
In ABC, B 90o+D = , AB = 18cm and BC = 24cm. Calculate the length of AC.
Solution
By Pythagoras Theorem, AC2
= AB BC2 2
+
= 18 242 2+
= 324 + 576
= 900
∴ AC = 900 = 30cm
Example 5.16
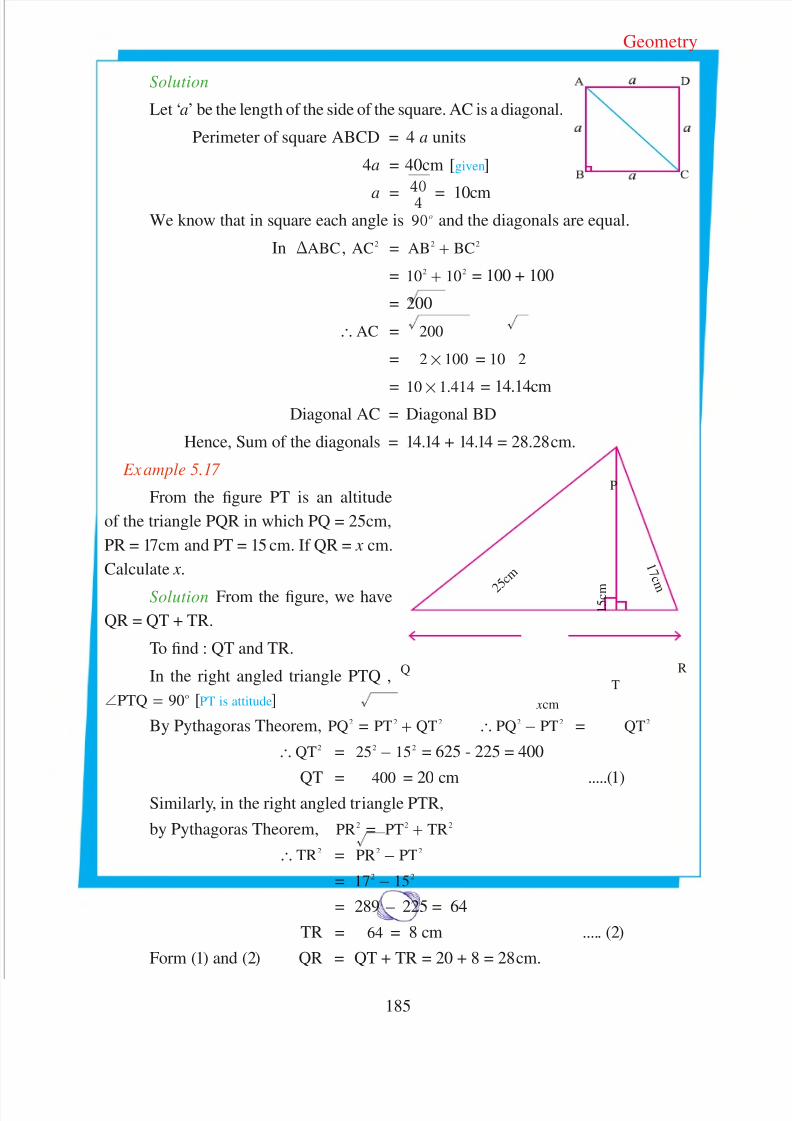
A square has the perimeter 40cm. What is the sum of the diagonals?
8/2/2019 Std08 Maths EM 2
http://slidepdf.com/reader/full/std08-maths-em-2 47/152
185
Geometry
Solution
Let ‘a’ be the length of the side of the square. AC is a diagonal.
Perimeter of square ABCD = 4 a units
4a = 40cm [given]
a = 440
= 10cmWe know that in square each angle is 90o and the diagonals are equal.
In ABCD , AC2 = AB BC2 2+
= 10 102 2+ = 100 + 100
= 200
AC` = 200
= 2 100# = 10 2
= 10 1.414# = 14.14cmDiagonal AC = Diagonal BD
Hence, Sum of the diagonals = 14.14 + 14.14 = 28.28cm.
Example 5.17
From the figure PT is an altitude
of the triangle PQR in which PQ = 25cm,
PR = 17cm and PT = 15 cm. If QR = x cm.
Calculate x.
Solution From the figure, we have
QR = QT + TR.
To find : QT and TR.
In the right angled triangle PTQ ,
PTQ 90o+ = [PT is attitude]
By Pythagoras Theorem, PQ2 = PT QT2 2+ PQ PT2 2
` - = QT2
QT2` = 25 152 2
- = 625 - 225 = 400
QT = 400 = 20 cm .....(1)Similarly, in the right angled triangle PTR,
by Pythagoras Theorem, PR2 = PT TR2 2+
TR2` = PR PT2 2
-
= 17 152 2-
= 289 - 225 = 64
TR = 64 = 8 cm ..... (2)
Form (1) and (2) QR = QT + TR = 20 + 8 = 28cm.
xcm
P
Q R
T
2 5 c
m
1 7 c m
1 5 c m

8/2/2019 Std08 Maths EM 2
http://slidepdf.com/reader/full/std08-maths-em-2 48/152
186
Chapter 5
Example 5.18
A rectangular field is of dimension 40m by 30m. What distance is saved by
walking diagonally across the field?
Solution
Given: ABCD is a rectangular field of Length = 40m, Breadth = 30m, B 90o+ =
In the right angled triangle ABC,
By Pythagoras Theorem,
AC2 = AB BC2 2+
= 30 402 2+ = 900 + 1600
= 2500
AC` = 2500 = 50 m
Distance from A to C through B is
= 30 + 40 = 70 m
Distance saved = 70 – 50 = 20 m.
EXERCISE 5.3
1. Choose the correct answer
(i) The point of concurrency of the medians of a triangle is known as
(A) incentre (B) circle centre (C) orthocentre (D) centroid
(ii) The point of concurrency of the altitudes of a triangle is known as
(A) incentre (B) circle centre (C) orthocentre (D) centroid
(iii) The point of concurrency of the angle bisectors of a triangle is known as
(A) incentre (B) circle centre (C) orthocentre (D) centroid
(iv) The point of concurrency of the perpendicualar bisectors of a triangle is known as
(A) incentre (B) circumcentre (C) orthocentre (D) centroid
2. In an isosceles triangle AB = AC and B 65+ = c. Which is the shortest side?
3. PQR is a triangle right angled at P. If PQ = 10 cm and PR = 24 cm, find QR.
4. Check whether the following can be the sides of a right angled triangleAB = 25 cm, BC = 24 cm, AC = 7cm.
5. Angles Q and R of a triangle PQR are 25° and 65°. Is ΔPQR a right angled
triangle? Moreover PQ is 4cm and PR is 3 cm. Find QR.
6. A 15 m long ladder reached a window 12m high from the ground. On placing it
against a wall at a distance x m. Find x.
7. Find the altitude of an equilateral triangle of side 10 cm.
8. Are the numbers 12, 5 and 13 form a Pythagorian Triplet?

8/2/2019 Std08 Maths EM 2
http://slidepdf.com/reader/full/std08-maths-em-2 49/152
187
Geometry
9. A painter sets a ladder up to reach the bottom of
a second story window 16 feet above the ground.
The base of the ladder is 12 feet from the house.
While the painter mixes the paint a neighbour’s
dog bumps the ladder which moves the base 2
feet farther away from the house. How far up side
of the house does the ladder reach?
5.6 Circles
You are familiar with the following objects. Can you say the shape of the
following?
(a) Cycle wheel
(b) Ashoka chakra in our National Emblem
(c) Full moon
Sure, your answer will be circle. You know that a circle is described when a
point P moves in a plane such that its distance from a fixed point in the plane remains
constant.
Definition of Circle
A circle is the set of all points in a plane at a constant distance from afixed point
in that plane.
The fixed point is called the centre of the circle.
The constant distance is known as the radius of the
circle.
In the figure ‘O’ is centre and OA, OB, OC are radii
of the circle.
Here, OA = OB = OC = r
Note: All the radii of the circle are equal.
Chord
A chord is a line segment with its end points lying
on a circle.
In figure, CD, AB and EF are chords.
Here AB is a special chord passes through the
centre O.

8/2/2019 Std08 Maths EM 2
http://slidepdf.com/reader/full/std08-maths-em-2 50/152
Chapter 5
Diameter
A diameter is a chord that passes through the centre of the circle and
diameter is the longest chord of a circle.
In the figure, AOB is diameter of the circle.
O is the mid point of AB and OA= OB = radius of the circleHence, Diameter = 2 × radius (or) Radius = ( diameter ) ÷ 2
Note : (i) The mid-point of every diameter of the circle is the centre of the circle.
(ii) The diameters of a circle are concurrent and the point of concurrency is
the centre of the circle.
Secant of a Circle
A line passing through a circle and intersecting the circle at two points is called
the secant of the circle.
In the given figure, line AB is a Secant.
It cuts the circle at two points A and B .
Now, let us move the secant AB
downwards. Then the new positions are A1
B1,
A2
B2, .... etc.,
While secant AB moves down, the
points A and B are moving closer to each other.So distance between A and B is
gradually decreases.
At one position the secant AB touches the circle at only one point L. At this
position, the line LM is called as tangent and it touches the circle at only one point.
Tangent
Tangent is a line that touches a circle at exactly one point, and the point is
known as point of contact.
Arc of a Circle
In the figure AB is a chord. The chord AB divides the
circle into two parts.
The curved parts ALB and AMB are known as Arcs.
Arcs will be denoted by the symbol ‘!
’.
The smaller arc ALB!
is the minor arc.
The greater arc AMB!
is the major arc.
A
BA1
B1A
2
B2
L M
N
188

8/2/2019 Std08 Maths EM 2
http://slidepdf.com/reader/full/std08-maths-em-2 51/152
189
Geometry
M I N O R S E G M E N T
A
BM A
J O R S E G M E N T
L
M
Segment of a Circle
A chord of a circle divides the circular region
into two parts. Each part is called as segment of
the circle.The segment containing minor arc is called
the minor segment.
The segment containing major arc is called
the major segment.
Sector of a Circle
The circular region enclosed by an arc of a circle and
the two radii at its end points is known as Sector of a circle.
The smaller sector OALB is called the minor sector.
The greater sector OAMB is called the major sector.
EXERCISE 5.4
1. Choose the correct answer:
(i) The _______ of a circle is the distance from the centre to the circumference.(A) sector (B) segment (C) diameters (D) radius
(ii) The relation between radius and diameter of a circle is ______
(A) radius = 2 × diameters (B) radius = diameter + 2
(C) diameter = radius + 2 (D) diameter = 2 (radius)
(iii) The longest chord of a circle is
(A) radius (B) secant (C) diameter (D) tangent
2. If the sum of the two diameters is 200 mm, find the radius of the circle in cm.
3. Define the circle segment and sector of a cirle.4. Define the arc of a circle.
5. Define the tangent of a cirle and secant of a cirle.

8/2/2019 Std08 Maths EM 2
http://slidepdf.com/reader/full/std08-maths-em-2 52/152
190
Chapter 5
The sum of the three angles of a triangle is 180°.
If the sides of a triangle is produced, the exterior angle so formed, is
equal to the sum of the two interior opposite angles.
Any two sides of a triangle together is greater than the third side.
Two plane figures are Congruent if each when superposed on the other
covers it exactly. It is denoted by the symbol “/”.
Two triangles are said to be congruent, if three sides and the threeangles of one triangle are respectively equal to three sides and three
angles of the other.
SSS Axiom: If three sides of a triangle are respectively equal to the
three sides of another triangle then the two triangles are congruent.
SAS Axiom: If any two sides and the included angle of a triangle are
respectively equal to any two sides and the included angle of another
triangle then the two triangles are congruent.
ASA Axiom: If two angles and a side of one triangle are respectively
equal to two angles and the corresponding side of another triangle then
the two triangles are congruent.
RHS Axiom : If the hypotenuse and one side of the right angled triangle
are respectively equal to the hypotenuse and a side of another right
angled triangle, then the two triangles are congruent.
Cent roid : Point of concurrency of the three Medians.
Ort hocentre : Point of concurrency of the three Altitudes.
I ncent re : Point of concurrency of the three Angle Bisectors.
Circumcentre : Point of concurrency of the Perpendicular Bisectors of
the three sides.
Circle : A circle is the set of all points in a plane at a constant distance
from a fixed point in that plane .

8/2/2019 Std08 Maths EM 2
http://slidepdf.com/reader/full/std08-maths-em-2 53/152
191
Geometry
Chord : A chord is a line segment with its end points lying on a circle.
Diameter : A diameter is a chord that passes through the centre of the
circle.
A line passing through a circle and intersecting the circle at two points
is called the secant of the circle.
Tangent is a line that touches a circle at exactly one point, and the
point is known as point of contact.
Segment of a circle : A chord of a circle divides the circular region
into two parts.
Sector of a cir cle : The circular region enclosed by an arc of a circle
and the two radii at its end points is known as Sector of a circle.
Mathematics Club Activity
THE IMPORTANCE OF CONGRUENCY
In our daily life, we use the concept of congruence in many ways. In our home,
we use double doors which is congruent to each other. Mostly our house double gate is
congruent to each other. The wings of birds are congruent to each other. The human
body parts like hands, legs are congruent to each other. We can say many examples like
this.
Birds while flying in the sky, they fly in the formation of
a triangle. If you draw a median through the leading bird you
can see a congruence. If the congruency collapses then the
birds following at the end could not fly because they losses their
stability.
Now, try to identify the congruence structures in the
nature and in your practical life.

8/2/2019 Std08 Maths EM 2
http://slidepdf.com/reader/full/std08-maths-em-2 54/152
6Practical Geometry
6.1 Introduction
Ancient Egyptians demonstrated practical knowledge of geometry
through surveying and construction of projects. Ancient Greeks practisedexperimental geometry in their culture. They have performed variety of
constructions using ruler and compass.
Geometry is one of the earliest branches of Mathematics.
Geometry can be broadly classified into Theoretical Geometry and
Practical Geometry. Theoretical Geometry deals with the principles of
geometry by explaining the construction of figures using rough sketches.
Practical Geometry deals with constructing of exact figures using
geometrical instruments.
We have already learnt in the previous classes, the definition,
properties and formulae for the area of some plane geometrical figures.
In this chapter let us learn to construct some specific plane geometrical
figures.
6.1 Introduction
6.2 Quadrilateral
6.3 Trapezium
6.4 Parallelogram
6.5 Rhombus6.6 Rectangle and Square
6.7 Concentric Circles
Guass[1777-1855 A.D.]
Guass was a
German Math-
ematician. At the
age of seventeen
Gauss investigated
the constructibility
of regular ‘ p-gons’
(polygons with
p-sides) where p is prime number.
The construction
was then known
only for
p = 3 and p = 5.
Gauss discovered
that the regular
p-gon is con-
structible if and
only if p is prime“Fermat Number”
(i.e.) p 2 1n2
= +

8/2/2019 Std08 Maths EM 2
http://slidepdf.com/reader/full/std08-maths-em-2 55/152
193
Practical Geometry
6.2 Quadrilateral
6.2.1 Introduction
We have learnt in VII standard about
quadrilateral and properties of quadrilateral.
Let us recall them.In Fig. 6.1, A, B, C, D are four points in a
plane. No three points lie on a line.
AB, BC, CD, DA intersect only at the
vertices. We have learnt that quadrilateral is a
four sided plane figure. We know that the sum
of measures of the four angles of a quadrilateral
is 360°.
,AB AD^ h, AB,BC^ h, BC,CD^ h, ,CD DA^ h are adjacent sides. AC and
BD are the diagonals.
EA,EB,EC andED (or EDAB, EABC,EBCD, ECDA) are the angles
of the quadrilateral ABCD.
∴ EA +EB +EC +ED = 360°
Note : (i) We should name the quadrilateral in cyclic ways such as ABCD
and BCDA.
(ii) Square, Rectangle, Rhombus, Parallelogram, Trapezium are all
Quadrilaterals.
(iii) A quadrilateral has four vertices, four sides, four angles and two
diagonals.
6.2.2 Area of a Quadrilateral
Let ABCD be any quadrilateral with BD as
one of its diagonals.
Let AE and FC be the perpendiculars drawn
from the vertices A and C on diagonal BD .From the Fig. 6.2
Area of the quadrilateral ABCD
= Area of ABD3 + Area of 3 BCD
= 21 BD AE# # +
21 BD CF# #
= 21 BD AE CF# # +^ h =
2
1 × d × (h1
+ h2) sq. units.
Fig. 6.1
Fig. 6.2

8/2/2019 Std08 Maths EM 2
http://slidepdf.com/reader/full/std08-maths-em-2 56/152
Chapter 6
where BD ,d = AE h1= and CF h2= .
Area of a quadrilateral is half of the product of a diagonal and the sum of the
altitudes drawn to it from its opposite vertices. That is,
A =21 d (h
1+ h
2) sq. units, where ‘d ’ is the diagonal; ‘h
1’ and ‘h
2’ are the
altitudes drawn to the diagonal from its opposite vertices.
By using paper folding technique, verify A =21 d (h
1+ h
2)
6.2.3 Construction of a Quadrilateral
In this class, let us learn how to construct a quadrilateral.
To construct a quadrilateral first we construct a triangle from the given data.
Then, we find the fourth vertex.
To construct a triangle, we require three independent measurements. Alsowe need two more measurements to find the fourth vertex. Hence, we need five
independent measurements to construct a quadrilateral.
We can construct, a quadrilateral, when the following measurements are given:
(i) Four sides and one diagonal
(ii) Four sides and one angle
(iii) Three sides, one diagonal and one angle
(iv) Three sides and two angles
(v) Two sides and three angles6.2.4 Construction of a quadrilateral when four sides and one diagonal are given
Example 6.1
Construct a quadrilateral ABCD with AB = 4 cm, BC = 6 cm, CD = 5.6 cm
DA = 5 cm and AC = 8 cm. Find also its area.
Solution
Given: AB = 4 cm, BC = 6 cm, CD = 5.6 cm
DA = 5 cm and AC = 8 cm.
To construct a quadrilateral
Steps for construction
Step 1 : Draw a rough figure and mark the given
measurements.
Step 2 : Draw a line segment AB = 4 cm.
Step 3 : With A and B as centres draw arcs of radii
8 cm and 6 cm respectively and let them cut at C.Fig. 6.3
194

8/2/2019 Std08 Maths EM 2
http://slidepdf.com/reader/full/std08-maths-em-2 57/152
195
Practical Geometry
Fig. 6.4Step 4 : Join AC and BC .
Step 5 : With A and C as centres draw arcs of radii 5 cm, and 5.6 cm
respectively and let them cut at D.
Step 6 : Join AD and CD .
ABCD is the required quadrilateral.
Step 7 : From B draw BE = AC and from D draw DF = AC , then measure
the lengths of BE and DF. BE = h1 =3 cm and DF = h
2 =3.5 cm.
AC = d = 8 cm.Calculation of area:
In the quadrilateral ABCD, d = 8 cm, h1 =3 cm and h
2 =3.5 cm.
Area of the quadrilateral ABCD =21 d h h
1 2+^ h
.21 8 3 3 5= +^ ^h h
.21 8 6 5# #=
= 26 cm2.
6.2.5 Construction of a quadrilateral when four sides and one angle are given
Example 6.2
Construct a quadrilateral ABCD with AB = 6 cm, BC = 4 cm, CD = 5 cm,
DA = 4.5 cm,EABC = 100° and find its area.
Solution
Given:
AB = 6 cm, BC = 4 cm,CD = 5 cm, DA = 4.5 cm EABC = 100°.

8/2/2019 Std08 Maths EM 2
http://slidepdf.com/reader/full/std08-maths-em-2 58/152
196
Chapter 6
To construct a quadrilateral
Fig. 6.6
Steps for construction
Step 1 : Draw a rough diagram and mark the given measurments.
Step 2 : Draw a line segment BC = 4 cm.
Step 3 : At B on BC makeECBX whose measure is 100°.
Step 4 : With B as centre and radius 6 cm draw an arc. This cuts BX at A.
Join CA
Step 5 : With C and A as centres, draw arcs of radii 5 cm and 4.5 cm
respectively and let them cut at D.
Step 6 : Join CD and AD .
ABCD is the required quadrilateral.
Step 7 : From B draw BF = AC and from D draw DE = AC . Measure the
lengths of BF and DE. BF = h1 =3 cm, DE = h
2 =2.7 cm and
AC = d = 7.8 cm.Calculation of area:
In the quadrilateral ABCD, d = 7.8 cm, h1
= 3 cm and h2
= 2.7 cm.
Area of the quadrilateral ABCD2
1= d (h
1+ h
2)
. .2
17 8 3 2 7= +^ ^h h
= 7.8 .2
15 7# # = 2.23 cm2 .
Fig. 6.5
B C4 cm

8/2/2019 Std08 Maths EM 2
http://slidepdf.com/reader/full/std08-maths-em-2 59/152
197
Practical Geometry
6.2.6 Construction of a quadrilateral when three sides, one diagonal and one
angle are given
Example 6.3
Construct a quadrilateral PQRS with PQ = 4 cm, QR = 6 cm, PR = 7 cm,
PS = 5 cm andEPQS = 40° and find its area.
Solution
Given: PQ = 4 cm, QR = 6 cm, PR= 7 cm,
PS= 5 cm andEPQS = 40°.
To construct a quadrilateral
Fig. 6.8
Steps for construction
Step 1 : Draw a rough diagram and mark the given measurements.
Step 2 : Draw a line segment PQ = 4 cm.
Step 3 : With P and Q as centres draw arcs of radii 7 cm and 6 cm respectively
and let them cut at R.
Step 4 : Join PR and QR.
Step 5 : At Q on PQ make PQT whose measure is 400
.
Step 6 : With P as centre and radius 5 cm draw an arc. This cuts QT at S.
Step 7 : Join PS.
PQRS is the required quadrilateral.
Step 8 : From Q draw QX = PR and from S draw SY = PR . Measure the
lengths QX and SY. QX = h1 =3.1 cm, SY = h
2 =3.9 cm.
PR = d = 7 cm.
Fig. 6.7

8/2/2019 Std08 Maths EM 2
http://slidepdf.com/reader/full/std08-maths-em-2 60/152
198
Chapter 6
Calculation of area:
In the quadrilateral PQRS, d = 7 cm, h1
= 3.1 cm and h2 = 3.9 cm.
Area of the quadrilateral PQRS21
= d (h 1
+ h2)
. .
2
1 7 3 1 3 9= +^ ^h h
7 721
# #=
= 24.5 cm2.
6.2.7 Construction of a quadrilateral when three sides and two angles are given
Example 6.4
Construct a quadrilateral ABCD with AB = 6.5 cm, AD = 5 cm, CD = 5 cm,
EBAC = 40° andEABC = 50°, and also find its area.
SolutionGiven:
AB = 6.5 cm, AD = 5 cm, CD = 5 cm,
EBAC = 40° andEABC = 50°.
To construct a quadrilateral
Fig. 6.10
Steps for construction
Step 1 : Draw a rough diagram and mark the given measurements.
Step 2 : Draw a line segment AB .6 5= cm.
Step 3 : At A on AB make EBAX whose measure is 40° and at B on AB
makeEABY whose measure is 50°. They meet at C.
Fig. 6.9
5 c m

8/2/2019 Std08 Maths EM 2
http://slidepdf.com/reader/full/std08-maths-em-2 61/152
199
Practical Geometry
Step 4 : With A and C as centres draw arcs of radius 5 cm and 5 cm
respectively and let them cut at D.
Step 5 : Join AD and CD.
ABCD is the required quadrilateral.
Step 6 : From D draw DE = AC and from B draw BC = AC. Then measurethe lengths of BC and DE. BC = h
1 =4.2 cm, DE = h
2 =4.3 cm and
AC = d = 5 cm.
Calculation of area:
In the quadrilateral ABCD, d = 5 cm, BC = h1
= 4.2 cm and h2= 4.3 cm.
Area of the quadrilateral ABCD d h h21
1 2= +^ h
. .21 5 4 2 4 3= +^ ^h h
.21 5 8 5# #= = 21.25 cm2.
6.2.8 Construction of a quadrilateral when two sides and three angles are given
Example 6.5
Construct a quadrilateral ABCD with AB = 6 cm, AD = 6 cm, EABD = 45°,
E BDC = 40° andE DBC = 40°. Find also its area.
Solution
Given: AB = 6 cm, AD = 6 cm, EABD = 45°,
EBDC = 40° andEDBC = 40°.
To construct a quadrilateral
Fig. 6.12
Fig. 6.11

8/2/2019 Std08 Maths EM 2
http://slidepdf.com/reader/full/std08-maths-em-2 62/152
200
Chapter 6
Steps for construction
Step 1 : Draw a rough diagram and mark the given measurements.
Step 2 : Draw a line segment AB = 6 cm.
Step 3 : At B on AB makeEABX whose measure is 450
.
Step 4 : With A as centre and 6 cm as radius draw an arc. Let it cut BX at D.
Step 5 : Join AD.
Step 6 : At B on BD makeEDBY whose measure is 400
.
Step 7 : At D on BD makeEBDZ whose measure is 400
.
Step 8 : Let BY and DZ intersect at C.
ABCD is the required quadrilateral.
Step 9 : From A draw AE = BD and from C draw CF = BD. Then measure
the lengths of AE and CF. AE = h1 = 4.2 cm, CF = h
2 =3.8 cm and
BD = d = 8.5 cm.
Calculation of area:
In the quadrilateral ABCD, d = 8.5 cm, h1= 4.2 cm and h
2= 3.8 cm.
Area of the quadrilateral ABCD21
= d ( h1
+ h2)
. . .21 8 5 4 2 3 8= +^ ^h h
8.5 821
# #= = 34 cm2.
EXERCISE 6.1Draw quadrilateral ABCD with the following measurements. Find also its area.
1. AB = 5 cm, BC = 6 cm, CD = 4 cm, DA= 5.5 cm and AC = 7 cm.
2. AB = 7 cm, BC = 6.5 cm, AC = 8 cm, CD= 6 cm and DA = 4.5 cm.
3. AB = 8 cm, BC = 6.8 cm, CD = 6 cm, AD= 6.4 cm andE B = 50°.
4. AB = 6 cm, BC = 7 cm, AD = 6 cm, CD= 5 cm, andE BAC = 45°.
5. AB = 5.5 cm, BC = 6.5 cm, BD = 7 cm, AD= 5 cm andE BAC= 50°.
6. AB = 7 cm, BC = 5 cm, AC = 6 cm, CD= 4 cm, andEACD = 45°..
7. AB = 5.5 cm, BC = 4.5cm, AC = 6.5 cm,E CAD = 80° andEACD = 40°.
8. AB = 5 cm, BD = 7 cm, BC = 4 cm,E BAD = 100° andE DBC = 60.
9. AB = 4 cm, AC = 8 cm,EABC = 100°,EABD = 50° and
E CAD = 40°.
10. AB = 6 cm, BC = 6 cm,E BAC = 50°,EACD = 30° andE CAD = 100°.

8/2/2019 Std08 Maths EM 2
http://slidepdf.com/reader/full/std08-maths-em-2 63/152
201
Practical Geometry
6.3 Trapezium
6.3.1 Introduction
In the class VII we have learnt special quadrilaterals such as trapezium and
isosceles trapezium. We have also learnt their properties. Now we recall the definition
of a trapezium.
A quadrilateral in which only one pair of opposite sides are parallel is
called a trapezium.
6.3.2 Area of a trapezium
Let us consider the trapezium EASY
Fig. 6.13
We can partition the above trapezium into two triangles by drawing
a diagonal YA.
One triangle has base EA ( EA = a units )The other triangle has base YS ( YS = b units )
We know ||EA YS
YF HA h= = units
Now, the area of 3 EAY is21 ah. The area of 3 YAS is
21 bh.
Hence,
the area of trapezium EASY = Area of 3 EAY + Area of 3 YAS
21= ah +
21 bh
= 21 h (a + b) sq. units
=21
× height × (Sum of the parallel sides) sq. units
Area of Trapezium
A =21 h (a + b) sq. units where ‘a’ and ‘b’ are the lengths of the parallel sides
and ‘h’ is the perpendicular distance between the parallel sides.

8/2/2019 Std08 Maths EM 2
http://slidepdf.com/reader/full/std08-maths-em-2 64/152
202
Chapter 6
6.3.3 Construction of a trapezium
In general to construct a trapezium, we take the parallel sides which has
greater measurement as base and on that base we construct a triangle with the given
measurements such that the triangle lies between the parallel sides. Clearly the vertex
opposite to the base of the triangle lies on the parallel side opposite to the base. We
draw the line through this vertex parallel to the base. Clearly the fourth vertex lies on
this line and this fourth vertex is fixed with the help of the remaining measurement.
Then by joining the appropriate vertices we get the required trapezium.
To construct a trapezium we need four independent data.
We can construct a trapezium with the following given information:
(i) Three sides and one diagonal
(ii) Three sides and one angle
(iii) Two sides and two angles
(iv) Four sides
6.3.4 Construction of a trapezium when three sides and one diagonal are given
Example 6.6
Construct a trapezium ABCD in which AB is parallel to DC, AB = 10 cm,
BC = 5 cm, AC = 8 cm and CD = 6 cm. Find its area.
Solution
Given:AB is parallel to DC, AB = 10 cm,
BC = 5 cm, AC = 8 cm and CD = 6 cm.
To construct a trapezium
Fig. 6.15
Fig. 6.14

8/2/2019 Std08 Maths EM 2
http://slidepdf.com/reader/full/std08-maths-em-2 65/152
203
Practical Geometry
Steps for construction
Step 1 : Draw a rough diagram and mark the given measurements.
Step 2 : Draw a line segment AB = 10 cm.
Step 3 : With A and B as centres draw arcs of radii 8 cm and 5 cm respectively
and let them cut at C.Step 4 : Join AC and BC.
Step 5 : Draw CX parallel to BA.
Step 6 : With C as centre and radius 6 cm draw an arc cutting CX at D.
Step 7 : Join AD.
ABCD is the required trapezium.
Step 8 : From C draw CE=AB and measure the length of CE.
CE = h = 4 cm.AB = a = 10 cm, DC = b = 6 cm.
Calculation of area:
In the trapezium ABCD, a = 10 cm, b = 6 cm and h = 4 cm.
Area of the trapezium ABCD21
= h (a + b)
21 4 10 6= +^ ^h h
4 121 6# #=
= 32 cm2.
6.3.5 Construction of a trapezium when three sides and one angle are given
Example 6.7
Construct a trapezium PQRS in which PQ is parallel to SR, PQ = 8 cm
EPQR = 70°, QR = 6 cm and PS = 6 cm. Calculate its area.
Solution
Given:
PQ is parallel to SR, PQ = 8 cm,EPQR = 70°,
QR = 6 cm and PS = 6 cm.
Fig 6.16

8/2/2019 Std08 Maths EM 2
http://slidepdf.com/reader/full/std08-maths-em-2 66/152
204
Chapter 6
To construct a trapezium
Fig. 6.17
Steps for construction
Step 1 : Draw a rough diagram and mark the given measurements.
Step 2 : Draw a line segment PQ = 8 cm.
Step 3 : At Q on PQ makeEPQX whose measure is 70°.
Step 4 : With Q as centre and 6 cm as radius draw an arc. This cuts QX at R.
Step 5 : Draw RY parallel to QP.Step 6 : With P as centre and 6 cm as radius draw an arc cutting RY at S.
Step 7 : Join PS.
PQRS is the required trapezium.
Step 8 : From S draw ST=PQ and measure the length of ST.
ST = h = 5.6 cm,
RS = b = 3.9 cm. PQ = a = 8 cm.
Calculation of area:In the trapezium PQRS, a = 8 cm, b = 3.9 cm and h = 5.6 cm.
Area of the trapezium PQRS a b21 h= +^ h
. .21 5 6 8 3 9= +^ ^h h
5. 1 .21 6 1 9# #=
= 33.32 cm2.
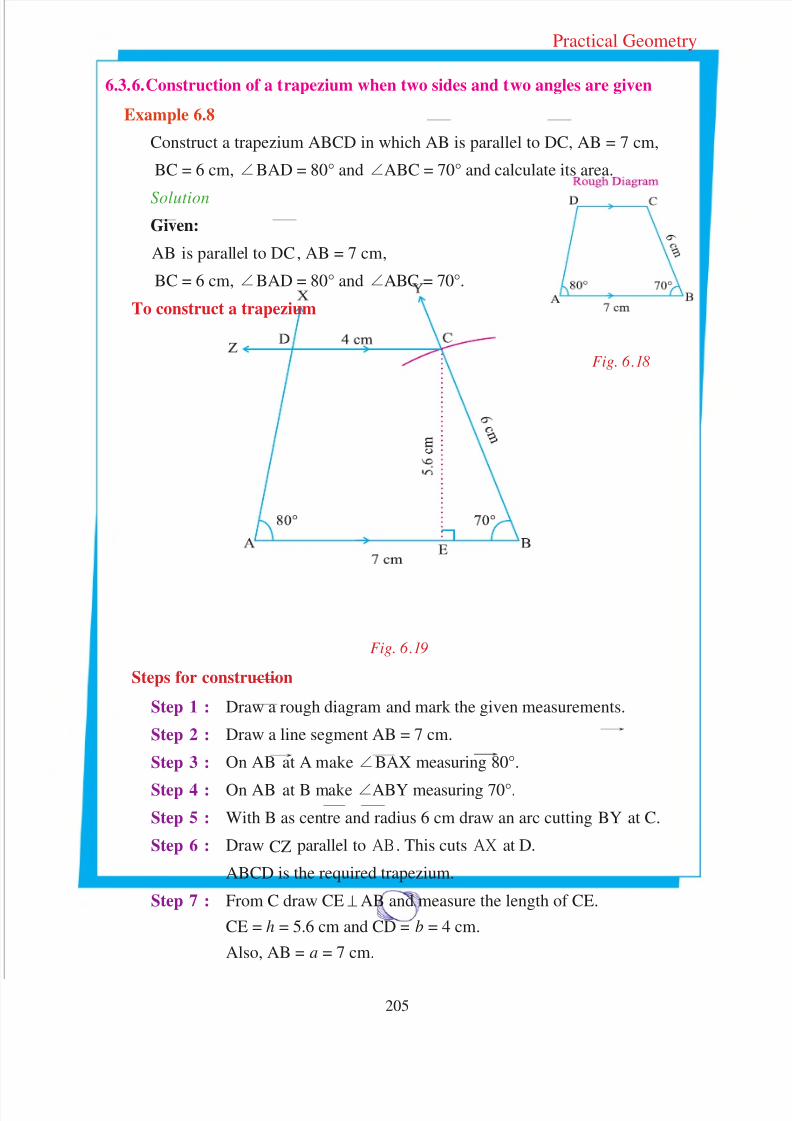
8/2/2019 Std08 Maths EM 2
http://slidepdf.com/reader/full/std08-maths-em-2 67/152
205
Practical Geometry
6.3.6. Construction of a trapezium when two sides and two angles are given
Example 6.8
Construct a trapezium ABCD in which AB is parallel to DC, AB = 7 cm,
BC = 6 cm,EBAD = 80° andEABC = 70° and calculate its area.
Solution
Given:
AB is parallel to DC, AB = 7 cm,
BC = 6 cm,EBAD = 80° andEABC = 70°.
To construct a trapezium
Fig. 6.19
Steps for construction
Step 1 : Draw a rough diagram and mark the given measurements.
Step 2 : Draw a line segment AB = 7 cm.
Step 3 : On AB at A makeEBAX measuring 80°.
Step 4 : On AB at B makeEABY measuring 70°.
Step 5 : With B as centre and radius 6 cm draw an arc cutting BY at C.
Step 6 : Draw CZ parallel to AB . This cuts AX at D.
ABCD is the required trapezium.
Step 7 : From C draw CE=AB and measure the length of CE.
CE = h = 5.6 cm and CD = b = 4 cm.
Also, AB = a = 7 cm.
Fig. 6.18

8/2/2019 Std08 Maths EM 2
http://slidepdf.com/reader/full/std08-maths-em-2 68/152
206
Chapter 6
Calculation of area:
In the trapezium ABCD, a = 7 cm, b = 4 cm and h = 5.6 cm.
Area of the trapezium ABCD h a b21
= +^ h
.
2
1 5 6 7 4= +^ ^h h
= 5. 1121 6# #
= 30.8 cm2.
6.3.7. Construction of a trapezium when four sides are given
Example 6.9
Construct a trapezium ABCD in which AB is parallel to ,DC AB = 7 cm,
BC = 5 cm, CD = 4 cm and AD = 5 cm and calculate its area.
Solution
Given:
AB is parallel to ,DC BC = 5 cm,
CD = 4 cm and AD = 5 cm.
To construct a trapezium
Fig. 6.21
Steps for construction
Step 1 : Draw a rough diagram and mark the given measurements.
Draw | |CE DA . Now AECD is a parallelogram.
∴ EC = 5 cm, AE = DC = 4 cm, EB = 3cm.
Step 2 : Draw a line segment AB = 7 cm.
Step 3 : Mark E on AB such that AE = 4 cm. [a DC = 4 cm]
Fig. 6.20

8/2/2019 Std08 Maths EM 2
http://slidepdf.com/reader/full/std08-maths-em-2 69/152
207
Practical Geometry
Step 4 : With B and E as centres draw two arcs of radius 5 cm and let them
cut at C.
Step 5 : Join BC and EC.
Step 6 : With C and A as centres and with 4 cm and 5 cm as radii draw two
arcs. Let them cut at D.Step 7 : Join AD and CD.
ABCD is the required trapezium.
Step 8 : From D draw DF=AB and measure the length of DF.
DF = h = 4.8 cm. AB = a = 7 cm, CD = b = 4 cm.
Calculation of area:
In the trapezium ABCD, a = 7 cm, b = 4 cm and h = 4.8 cm.
Area of the trapezium ABCD h a b21= +^ h
.21 4 8 7 4= +^ ^h h
.21 4 8 11# #=
.2 4 11#=
= 26.4 cm2.
6.3.8 Isosceles trapezium
In Fig. 6.22 ABCD is an isosceles trapezium
In an isosceles trapezium,
(i) The non parallel sides are
equal in measurement i.e., AD = BC.
(ii) EA =EB.
and EADC =EBCD
(iii) Diagonals are equal in length
i.e., AC = BD
(iv) AE = BF, (DB = AB, CF = BA)
To construct an isosceles trapezium we need only three independent
measurements as we have two conditions such as
(i) One pair of opposite sides are parallel.
(ii) Non - parallel sides are equal.
Fig. 6.22

8/2/2019 Std08 Maths EM 2
http://slidepdf.com/reader/full/std08-maths-em-2 70/152
208
Chapter 6
6.3.9. Construction of isosceles trapezium
Example 6.10
Construct an isosceles trapezium ABCD in which AB is parallel to DC,
AB = 11 cm, DC = 7 cm, AD = BC = 6 cm and calculate its area.
Solution
Given:
AB is parallel to DC, AB = 11 cm,
DC = 7 cm, AD = BC = 6 cm.
To construct an isosceles trapezium
Fig. 6.24
Steps for construction
Step 1 : Draw a rough diagram and mark the given measurements.
Step 2 : Draw a line segment AB = 11 cm.
Step 3 : Mark E on AB such that AE = 7 cm ( since DC = 7 cm)
Step 4 : With E and B as centres and (AD = EC = 6 cm) radius 6 cm draw
two arcs. Let them cut at C.
Step 5 : Join BC and EC.
Step 6 : With C and A as centres draw two arcs of radii 7 cm and 6 cm
respectively and let them cut at D.
Step 7 : Join CDAD and .
ABCD is the required isosceles trapezium.
Step 8 : From D draw DF=AB and measure the length of DF.
DF = h = 5.6 cm. AB = a = 11 cm and CD = b = 7 cm.
Fig. 6.23

8/2/2019 Std08 Maths EM 2
http://slidepdf.com/reader/full/std08-maths-em-2 71/152
209
Practical Geometry
Calculation of area:
In the isosceles trapezium ABCD, a = 11 cm, b = 7 cm and h = 5.6 cm.
Area of the isosceles trapezium ABCD h a b21
= +^ h
.2
1 5 6 11 7= +^ ^h h
.21 5 6 18# #=
= 50.4 cm2.
EXERCISE 6.2
I. Construct trapezium PQRS with the following measurements. Find also its
area.
1. PQ is parallel to ,SR PQ = 6.8 cm, QR = 7.2 cm, PR = 8.4 cm and RS = 8 cm.
2. PQ is parallel to ,SR PQ = 8 cm, QR = 5 cm, PR = 6 cm and RS = 4.5 cm.
3. PQ is parallel to ,SR PQ = 7 cm,E Q = 60°,QR = 5 cm and RS = 4 cm.
4. PQ is parallel to ,SR PQ = 6.5 cm, QR = 7 cm, E PQR = 85° and 9 .PS cm=
5. PQ is parallel to ,SR PQ = 7.5 cm, PS = 6.5 cm, EQPS = 100° and
E PQR = 45°.
6. PQ is parallel to ,SR PQ = 6 cm, PS = 5 cm,EQPS = 60° andE PQR = 100°.
7. PQ is parallel to ,SR PQ = 8 cm, QR = 5 cm, RS = 6 cm and SP = 4 cm.
8. PQ is parallel to ,SR PQ = 4.5 cm, QR = 2.5 cm, RS =3 cm and SP = 2 cm.
II. Construct isosceles trapezium ABCD with the following measurements
and find its area.
1. AB is parallel to DC, AB = 9 cm, DC = 6 cm and AD = BC = 5 cm.
2. AB is parallel to DC, AB = 10 cm, DC = 6 cm and AD = BC = 7 cm.
It is interesting to note that many of the properties of quadrilaterals were
known to the ancient Indians. Two of the geometrical theorems which are
explicitly mentioned in the Boudhayana Sutras are given below:
i) The diagonals of a rectangle bisect each other. They divide the rectangle
into four parts, two and two.
ii) The diagonals of a Rhombus bisect each other at right angles.

8/2/2019 Std08 Maths EM 2
http://slidepdf.com/reader/full/std08-maths-em-2 72/152
210
Chapter 6
6.4 Parallelogram
6.4.1. Introduction
In the class VII we have come across parallelogram. It is defined as follows:
A quadrilateral in which the opposite sides are parallel is called a
parallelogram.
Consider the parallelogram BASE given in the Fig. 6.25,
Then we know its properties
(i) BA | | ES ; BE | | AS
(ii) ,BA ES BE AS= =
(iii) Opposite angles are equal in measure.
EBES =EBAS;EEBA =EESA
(iv) Diagonals bisect each other.
OB = OS; OE = OA, but BS AE! .
(v) Sum of any two adjacent angles is equal to 180°.
Now, let us learn how to construct a parallelogram, and find its area.
6.4.2 Area of a parallelogram
Let us cut off the red portion ( a right
angled triangle EFS ) from the parallelogram
FAME. Let us fix it to the right side of thefigure FAME. We can see that the resulting
figure is a rectangle. See Fig. 6.27.
We know that the area of a rectangle
having length b units and height h units is given by A = bh sq. units.
Here, we have actually convertedthe parallelogram FAME into a rectangle.
Hence, the area of the parallelogram is
A = bh sq. units where ‘b’ is the base of the
parallelogram and ‘h’ is the perpendicular
distance between the parallel sides.
Fig. 6.25
Fig. 6.26
Fig. 6.27

8/2/2019 Std08 Maths EM 2
http://slidepdf.com/reader/full/std08-maths-em-2 73/152
211
Practical Geometry
6.4.3 Construction of a parallelogram
Parallelograms are constructed by splitting up the figure into suitable triangles.
First a triangle is constructed from the given data and then the fourth vertex is found.
We need three independent measurements to construct a parallelogram.
We can construct a parallelogram when the following measurements are given . (i) Two adjacent sides, and one angle
(ii) Two adjacent sides and one diagonal
(iii) Two diagonals and one included angle
(iv) One side, one diagonal and one angle.
6.4.4 Construction of a parallelogram when two adjacent sides and one angle are
givenExample 6.11
Construct a parallelogram ABCD with AB = 6 cm, BC = 5.5 cm and
EABC = 80° and calculate its area.
Solution
Given: AB = 6 cm, BC = 5.5 cm and EABC = 80°.
To construct a parallelogram
Fig. 6.29
Fig. 6.28

8/2/2019 Std08 Maths EM 2
http://slidepdf.com/reader/full/std08-maths-em-2 74/152
212
Chapter 6
Steps for construction
Step 1 : Draw a rough diagram and mark the given measurements.
Step 2 : Draw a line segment AB = 6 cm.
Step 3 : At B on AB makeEABX whose measure is 80°.
Step 4 : With B as centre draw an arc of radius 5.5 cm and
let it cuts BX at C.
Step 5 : With Cand A as centres draw arcs of radii 6 cm and 5.5 cm repectively
and let them cut at D.
Step 6 : Join AD CDand .
ABCD is the required parallelogram.
Step 7 : From C draw CE=AB and measure the length of CE.
CE = h = 5.4 cm. AB = b = 6 cm.
Calculation of area:
In the parallelogram ABCD, b = 6 cm and h = 5.4 cm.
Area of the parallelogram ABCD = b × h = 6 × 5.4
= 32.4 cm2.
6.4.5. Construction of parallelogram when two adjacent sides and one diagonal
are given
Example 6.12
Construct a parallelogram ABCD with AB = 8 cm, AD = 7 cm and BD = 9 cm
andfi
nd its area.Solution
Given: AB = 8 cm, AD = 7 cm and BD = 9 cm.
To construct a parallelogram
Fig. 6.30
Fig. 6.31

8/2/2019 Std08 Maths EM 2
http://slidepdf.com/reader/full/std08-maths-em-2 75/152
213
Practical Geometry
Steps for construction
Step 1 : Draw a rough diagram and mark the given measurements.
Step 2 : Draw a line segment AB = 8 cm.
Step 3 : With A and B as centres draw arcs of radii 7 cm and 9 cm respectively
and let them cut at D.
Step 4 : Join AD BDand .
Step 5 : With B and D as centres draw arcs of radii 7 cm and 8 cm respectively
and let them cut at C.
Step 6 : Join CD BCand .
ABCD is the required parallelogram.
Step 7 : From D draw DE=AB and measure the length of DE.
DE = h = 6.7 cm. AB = DC= b = 8 cm
Calculation of area:
In the parallelogram ABCD, b = 8 cm and h = 6.7 cm.
Area of the parallelogram ABCD = b × h
= 8 × 6.7 = 53.6 cm2.
6.4.6. Construction of a parallelogram when two diagonals and one included angle
are given
Example 6.13
Draw parallelogram ABCD with AC = 9 cm, BD = 7 cm andEAOB = 120°
where AC BDand intersect at ‘O’ and find its area.
Solution
Given: AC = 9 cm, BD = 7 cm andEAOB = 120°.
Fig. 6.32
Fig. 6.33

8/2/2019 Std08 Maths EM 2
http://slidepdf.com/reader/full/std08-maths-em-2 76/152
214
Chapter 6
To construct a parallelogram
Steps for construction
Step 1 : Draw a rough diagram and mark the given measurements.
Step 2 : Draw a line segment AC = 9 cm.
Step 3 : Mark ‘O’ the midpoint of .AC
Step 4 : Draw a line XY through ‘O’ which makesEAOY = 120°.
Step 5 : With O as centre and 3.5 cm as radius draw two arcs on XY on either
sides of AC cutting OX at D and OY at B.
Step 6 : Join , , .AB BC CD DAand
ABCD is the required parallelogram.
Step 7 : From D draw DE=AB and measure the length of DE.
DE = h = 4 cm. AB = b = 7 cm.
Calculation of area:
In the parallelogram ABCD, b = 7 cm and h = 4 cm.
Area of the parallelogram ABCD = b × h = 7 × 4 = 28 cm2.
6.4.7. Construction of a parallelogram when one side, one diagonal and one angle
are given
Example 6.14
Construct a parallelogram ABCD, AB = 6 cm, EABC = 80° and AC = 8 cm
and find its area.
Solution
Given: AB = 6 cm,EABC = 80° and AC = 8 cm.
To construct a parallelogram
Fig. 6.35
Fig. 6.34

8/2/2019 Std08 Maths EM 2
http://slidepdf.com/reader/full/std08-maths-em-2 77/152
215
Practical Geometry
Steps for construction
Step 1 : Draw a rough diagram and mark the given measurements.
Step 2 : Draw a line segment AB = 6 cm
Step 3 : At B on AB makeEABX whose measure is 800
.
Step 4 : With A as centre and radius 8 cm draw an arc. Let it cut BX at C.
Step 5 : Join AC.
Step 6 : With C as centre draw an arc of radius 6 cm.
Step 7 : With A as centre draw another arc with radius equal to the length of
BC. Let the two arcs cut at D.
Step 8 : Join .AD CDand
ABCD is the required parallelogram.
Step 9 : From C draw CE=AB and measure the length of CE.
CE = h = 6.4 cm. AB = b = 6 cm.
Calculation of area:
In the parallelogram ABCD, b = 6 cm and h = 6.4 cm.
Area of the parallelogram ABCD = b × h
= 6 × 6.4
= 38.4 cm2.
EXERCISE 6.3
Draw parallelogram ABCD with the following measurements and calculate its area.
1. AB = 7 cm, BC = 5 cm andEABC = 60°.
2. AB = 8.5 cm, AD = 6.5 cm andE DAB = 100°.
3. AB = 6 cm, BD = 8 cm and AD = 5 cm.
4. AB = 5 cm, BC = 4 cm, AC = 7 cm.
5. AC = 10 cm, BD = 8 cm andEAOB = 100° where AC BDand intersect
at ‘O’.
6. AC = 8 cm, BD = 6 cm andE COD = 90° where AC BDand intersect at ‘O’.
7. AB = 8 cm, AC = 10 cm andEABC = 100°.
8. AB = 5.5 cm,E DAB = 50° and BD = 7 cm.

8/2/2019 Std08 Maths EM 2
http://slidepdf.com/reader/full/std08-maths-em-2 78/152
216
Chapter 6
6.5 Rhombus
6.5.1. Introduction
A parallelogram in which the adjacent sides are equal is called a rhombus.
In rhombus ABCD, see Fig. 6.36.
(i) All sides are equal in measure.
i.e., AB = BC = CD = DE
(ii) Opposite angles are equal in measure.
i.e.,EA =EC andEB =ED
(iii) Diagonals bisect each other at right
angles.
i.e., AO = OC ; BO = OD,
At ‘O’, AC and BD are perpendicular to
each other.(iv) Sum of any two adjacent angles is equal to 180°.
(v) Each diagonal of a rhombus divides it into two congruent triangles.
(vi) Diagonals are not equal in length.
6.5.2 Area of a rhombus
Let us consider the rectangular sheet of paper JOKE as shown below.
Fig. 6.37
Let us mark the mid - points of the sides. (We use the paper folding techniqueto find the mid point), The mid-point of JO is F ; the mid-point of OK is A ; the mid-
point of KE is I and the mid-point of EJ is R. Let us join RA and IF . They meet at C.
FAIR is a rhombus.
We have eight congruent right angled triangles. The area of the required rhombus
FAIR is the area of four right angled triangles.
In other words, we can say that the area of the rhombus FAIR is half of the
rectangle JOKE.
Fig. 6.36

8/2/2019 Std08 Maths EM 2
http://slidepdf.com/reader/full/std08-maths-em-2 79/152
217
Practical Geometry
We can clearly see that JO, the length of rectangle becomes one of the diagonals
of the rhombus RA^ h. The breadth becomes the other diagonal IF^ h of the rhombus.
Area of rhombus FAIR d d 21
1 2#=
Area of rhombus A d d 21
1 2# #= sq. units
where d 1 and d 2 are the diagonals of the rhombus.
6.5.3 Construction of a rhombus
Rhombus is constructed by splitting the figure into suitable triangles. First, a
triangle is constructed from the given data and then the fourth vertex is found. We
need two independent measurements to construct a rhombus.
We can construct a rhombus, when the following measurements are given
(i) One side and one diagonal (iii) Two diagonals
(ii) One side and one angle (iv) One diagonal and one angle
6.5.4 Construction of Rhombus when one side and one diagonal are given
Example 6.15
Construct a rhombus PQRS with PQ = 6 cm and PR = 9 cm and find its area.
Solution
Given: PQ = 6 cm and PR = 9 cm.
To construct a rhombus
Fig. 6.39
Fig. 6.38

8/2/2019 Std08 Maths EM 2
http://slidepdf.com/reader/full/std08-maths-em-2 80/152
218
Chapter 6
Steps for construction
Step 1 : Draw a rough diagram and mark the given measurements.
Step 2 : Draw a line segment PQ = 6 cm.
Step 3 : With P and Q as centres, draw arcs of radii 9 cm and 6 cm respectively
and let them cut at R.
Step 4 : Join PR and .QR
Step 5 : With P and R as centres draw arcs of radius 6 cm
and let them cut at S.
Step 6 : Join PS and .RS
PQRS is the required rhombus.
Step 7 : Measure the length of QS.
QS = d 2
= 8 cm. PR = d 1
= 9 cm.
Calculation of area:
In the rhombus PQRS, d 1
= 9 cm and d 2
= 8 cm.
Area of the rhombus PQRS d d 21
1 2# #= 21 9 8# #= = 36 cm2.
6.5.4 Construction of a rhombus when one side and one angle are given
Example 6.16
Construct a rhombus ABCD with AB = 7 cm and
EA = 60° and find its area.
Solution
Given: AB = 7 cm andEA = 60°.
To construct a rhombus
Fig. 6.41
Fig. 6.40

8/2/2019 Std08 Maths EM 2
http://slidepdf.com/reader/full/std08-maths-em-2 81/152
219
Practical Geometry
Steps for construction
Step 1 : Draw a rough diagram and mark the given measurements.
Step 2 : Draw a line segment AB = 7 cm.
Step 3 : At A on AB makeEBAX whose measure 60°.
Step 4 : With A as centre draw an arc of radius 7 cm. This cuts AX at D.
Step 5 : Wth B and D as centres draw arcs of radius 7 cm.
and let them cut at C.
Step 6 : Join BC and DC.
ABCD is the required rhombus.
Step 7 : Measure the lengths AC and BD.
AC = d 1
= 12.2 cm and BD = d 2
= 7 cm.
Calculation of area:
In the rhombus ABCD, d 1
= 12.2 cm and d 2
= 7 cm.
Area of the rhombus ABCD = d d 21
1 2# #
12. 721 2# #=
= 42.7 cm2.
6.5.5 Construction of a rhombus when two diagonals are given
Example 6.17
Cosnstruct a rhombus PQRS with PR = 8 cm and QS = 6 cm and find its area.
Solution
Given: PR = 8 cm and QS = 6 cm.
Steps for construction
Step 1 : Draw a rough diagram and mark the given measurements.
Step 2 : Draw a line segment PR = 8 cm
Step 3 : Draw the perpendicular bisector XY to .PR Let it cut PR at “O” .
Step 4 : With O as centre and 3 cm (half of QS) as radius draw arcs on either
side of ‘O’ which cuts XY at Q and S as shown in Fig. 6.43.
Step 5 : Join , ,PQ QR RS SPand .
PQRS is the required rhombus.
Step 6 : We know, PR = d 1
= 8 cm and QS = d 2
= 6 cm.

8/2/2019 Std08 Maths EM 2
http://slidepdf.com/reader/full/std08-maths-em-2 82/152
220
Chapter 6
Calculation of area:
In the Rhombus PQRS, d 1
= 8 cm and d 2
= 6 cm.
Area of the rhombus PQRS d d 21
1 2# #=
2
1 8 6# #=
= 24 cm2.
6.5.6 Construction of a rhombus when one diagonal and one angle are given
Example 6.18
Construct a rhombus ABCD with AC = 7.5 cm andEA = 100°. Find its area.
Solution
Given: AC = 7.5 cm andEA = 100°.
Fig. 6.42
To construct a rhombus

8/2/2019 Std08 Maths EM 2
http://slidepdf.com/reader/full/std08-maths-em-2 83/152
221
Practical Geometry
To construct a rhombus
Fig. 6.45
Steps for constructionStep 1 : Draw a rough figure and mark the given measurements.
Step 2 : Draw a line segment AC = 7.5 cm.
Step 3 : At A draw AX and AY on either side of AC making on angle 50°
with AC.
Step 4 : At C draw CM and CN on either side of CA making an angle 50°
with CA.
Step 5 : Let AX and CM cut at D and AY and CN cut at B.
ABCD is the required rhombus.
Step 6 : Measure the length BD. BD = d 2
= 9 cm. AC = d 1
= 7.5 cm.
Calculation of area:
In the rhombus ABCD, d 1
= 7.5 cm and d 2
= 9 cm.
Area of the rhombus ABCD d d 21
1 2# #=
.21 7 5 9# #= = 7.5 × 4.5 = 33.75 cm2.
Fig. 6.44

8/2/2019 Std08 Maths EM 2
http://slidepdf.com/reader/full/std08-maths-em-2 84/152
222
Chapter 6
EXERCISE 6.4
Draw rhombus BEST with the following measurements and calculate its area.
1. BE = 5 cm and BS = 8 cm.
2. BE = 6 cm and ET = 8.2 cm.
3. BE = 6 cm andE B = 45°.
4. BE = 7.5 cm andE E = 65°.
5. BS = 10 cm and ET = 8 cm.
6. BS = 6.8 cm and ET = 8.4 cm.
7. BS = 10 cm andE B = 60°.
8. ET = 9 cm andE E = 70°.
6.6 Rectangle and Square
6.6.1 Rectangle
A rectangle is a parallelogram whose one of the angle is a right angle.
Its properties are
(i) The opposite sides are equal.
(ii) All angles are equal.
(iii) Each angle is a right angle.
(iv) The diagonals are equal in length.
(v) The diagonals bisect each other.
Area of a rectangle:
Area of the rectangle ABCD = length × breadth
A = l × b sq. units.
6.6.2 Construction of a rectangle
We can construct a rectangle, when the following measurements are given:
(i) Length and breadth
(ii) A side and a diagonal
Fig. 6.46

8/2/2019 Std08 Maths EM 2
http://slidepdf.com/reader/full/std08-maths-em-2 85/152
223
Practical Geometry
6.6.3. Construction of a rectangle when length and breadth are given
Example 6.19
Construct a rectangle whose adjacent sides are 6 cm and 4 cm and find its area.
Solution
Given:
Adjacent sides are 6 cm and 4 cm.
To construct a rectangle
Fig. 6.48Steps for construction
Step 1 : Draw a rough diagram and mark the given measurements.
Step 2 : Draw a line segment AB = 6 cm.
Step 3 : At A, with a compass construct AX = AB .
Step 4 : With A as centre draw an arc of radius 4 cm and let it cut AX at D.
Step 5 : With D as centre draw an arc of radius 6 cm above the line segment
AB .
Step 6 : With B as centre draw an arc of radius 4 cm cutting the previous arcat C. Join BC and CD .
ABCD is the required rectangle.
Step 7 : AB = l = 6 cm and BC = b = 4 cm.
Calculation of area:
In the rectangle ABCD, l = 6 cm and b = 4 cm.
Area of the rectangle ABCD = l × b
= 6 × 4 = 24 cm2.
Fig. 6.47
4 cm
6 cm

8/2/2019 Std08 Maths EM 2
http://slidepdf.com/reader/full/std08-maths-em-2 86/152
224
Chapter 6
6.6.4 Construction of a rectangle when one diagonal and one of a side are given
Example 6.20
Construct a rectangle whose diagonal is 7 cm and length of one of its side is
4 cm. Find also its area.
SolutionGiven:
Diagonal = 7 cm and length of one side = 4 cm.
To construct a rectangle
Fig. 6.50
Steps for construction
Step 1 : Draw a rough diagram and mark the given measurements.
Step 2 : Draw a line segmeant AB = 4 cm.
Step 3 : Construct ABBX = .
Step 4 : With A as centre, draw an arc of radius 7 cm which cuts BX at C.
Step 5 : With BC as radius draw an arc above AB with A as centre.
Step 6 : With C as centre and 4 cm as radius to cut the previous arc at D.
Step 7 : Join AD and CD. ABCD is the required rectangle.
Step 8 : Measure the length of BC. BC = l = 5.8 cm
Calculation of area:
In the rectangle ABCD, l = 5.8 cm and b = 4 cm.
Area of the rectangle ABCD = l × b = 5.8 × 4 = 23.2 cm2.
Fig. 6.49

8/2/2019 Std08 Maths EM 2
http://slidepdf.com/reader/full/std08-maths-em-2 87/152
225
Practical Geometry
6.6.5 Construction of a Square
Square
A square is a rectangle, whose adjacent sides are equal in length.
The properties of a square are :
(i) All the angles are equal.
(ii) All the sides are of equal length.
(iii) Each of the angle is a right angle.
(iv) The diagonals are of equal length and
(v) The diagonals bisect each other at right angles
Area of a square = side × side
Aa a#=
A a2
= sq. units
To construct a square we need only one measurement.
We can construct a square when the following measurements are given:
(i) one side, (ii) a diagonal
6.6.6 Construction of a square when one side is given
Example 6.21
Construct a square of side 5 cm. Find also its area.Solution
Given: Side = 5 cm.
To construct a square
Fig. 6.53
Fig. 6.51
Fig. 6.52
If the diagonal is known ,
then area = d
2
2

8/2/2019 Std08 Maths EM 2
http://slidepdf.com/reader/full/std08-maths-em-2 88/152
226
Chapter 6
Steps for construction
Step 1 : Draw a rough diagram and mark the given measurements.
Step 2 : Draw a line segment PQ = 5 cm.
Step 3 : At P using a compass construct PX PQ= .
Step 4 : With P as centre draw an arc of radius 5 cm cutting PXat S.
Step 5 : With S as centre draw an arc of radius 5 cm above the line segment
PQ .
Step 6 : With Q as centre and same radius, draw an arc, cutting the previous
arc at R.
Step 7 : Join QR and RS.
PQRS is the required square.
Calculation of area:
In the square PQRS, side a = 5 cm
Area of the square PQRS = a × a
= 5 × 5 = 25 cm2.
6.6.7 Construction of a square when one diagonal is given
Example 6.22
Construct a square whose diagonal is 6 cm. Measure the side. Find also its area.
Solution
Given: Diagonal = 6 cm.
To construct a square
Fig. 6.55
Fig. 6.54

8/2/2019 Std08 Maths EM 2
http://slidepdf.com/reader/full/std08-maths-em-2 89/152
227
Practical Geometry
Steps for construction
Step 1 : Draw the rough diagram and mark the given measures.
Step 2 : Draw a line segment AC = 6 cm.
Step 3 : Construct a perpendicular bisector XY of AC.
Step 4 : XY intersects AC at O. We get OC =AO = 3 cm.Step 5 : With O as centre draw two arcs of radius 3 cm cutting the line XY
at points B and D.
Step 6 : Join AB, BC, CD and DA.
ABCD is the required square.
Calculation of area:
In the square ABCD, diagonal d = 6 cm
Area of the Square ABCD = d 2
2= 6 6
2# = 18 cm2.
EXERCISE 6.5
1. Construct rectangle JUMP with the following measurements. Find also its
area.
(i) JU = 5.4 cm and UM = 4.7 cm.
(ii) JU = 6 cm and JP = 5 cm.
(iii) JP = 4.2 cm and MP= 2.8 cm.
(iv) UM = 3.6 cm and MP = 4.6 cm.
2. Construct rectangle MORE with the following measurements. Find also its
area.
(i) MO = 5 cm and diagonal MR = 6.5 cm.
(ii) MO = 4.6 cm and diagonal OE = 5.4 cm.
(iii) OR = 3 cm and diagonal MR = 5 cm.
(iv) ME = 4 cm and diagonal OE = 6 cm.
3. Construct square EASY with the following measurements. Find also its area.
(i) Side 5.1 cm. (ii) Side 3.8 cm.
(iii) Side 6 cm (iv) Side 4.5 cm.
4. Construct square GOLD, one of whose diagonal is given below. Find also its
area.
(i) 4.8 cm. (ii) 3.7 cm.
(iii) 5 cm. (iv) 7 cm.

8/2/2019 Std08 Maths EM 2
http://slidepdf.com/reader/full/std08-maths-em-2 90/152
228
Chapter 6
6.7 Concentric Circles
In this section, we are going to learn about Concentric Circles. Already we are
familiar with Circles.
6.7.1. Motivation
When a small stone was dropped in still water, you might have seen circularripples were formed. Which is the centre of these circles? Is it not the place where the
stone was dropped? Yes.
The circles with different measures of radii and with the same centre are called
concentric circles. The centre is known as common centre.
The Concentric Circles
Circles drawn in a plane with a common centre and different radii are called
concentric circles. See Fig. 6.56 and 6.57.
Look at the following two figures:
Fig. 6.58 represents two concentric circles.
In Fig. 6.59 the area between the two concentric circles are shaded with colour.
The coloured area is known as circular ring.
Fig. 6.56 Fig. 6.57
Fig. 6.58 Fig. 6.59

8/2/2019 Std08 Maths EM 2
http://slidepdf.com/reader/full/std08-maths-em-2 91/152
229
Practical Geometry
Description : Circular Ring
In Fig. 6.60, C1
and C2
are two circles having the
same centre O with different radii r 1 and r 2
Circles C1
and C2
are called concentric circles.
The area bounded between the two circles isknown as circular ring.
Width of the circular ring = OB – OA r r 2 1= -
(r2> r
1)
6.7.2. Construction of concentric circles when the radii are given.
Example 6.23
Draw concentric circles with radii 3 cm and 5 cm and shade the circular ring.Find its width.
Solution
Given: The radii are 3 cm and 5 cm.
To construct concentric circles
Fig. 6.62
Fig. 6.60
Fig. 6.61

8/2/2019 Std08 Maths EM 2
http://slidepdf.com/reader/full/std08-maths-em-2 92/152
Chapter 6
Steps for construction
Step 1 : Draw a rough diagram and mark the given measurements.
Step 2 : Take any point O and mark it as the centre.
Step 3 : With O as centre and draw a circle of radius OA = 3 cm
Step 4 : With O as centre and draw a circle of radius OB = 5 cm.
Thus the concentric circles C1
and C2are drawn.
Width of the circular ring = OB – OA
= 5 – 3
= 2 cm.
EXERCISE 6.6
1. Draw concentric circles for the following measurements of radii. Find out thewidth of each circular ring.
(i) 4 cm and 6 cm.
(ii) 3.5 cm and 5.5 cm.
(iii) 4.2 cm and 6.8 cm.
(iv) 5 cm and 6.5 cm.
(v) 6.2 cm and 8.1 cm.
(vi) 5.3 cm and 7 cm.
Interesting Information• The golden rectangle is a rectangle which has appeared in art and architecture
through the years. The ratio of the lengths of the sides of a golden rectangle is
approximately 1 : 1.6. This ratio is called the golden ratio. A golden rectangle is
pleasing to the eyes. The golden ratio was discovered by the Greeks about the
middle of the fifth century B.C.
• The Mathematician Gauss, who died in 1855, wanted a 17-sided polygon drawn on
his tombstone, but it too closely resembled a circle for the sculptor to carve.
• Mystic hexagon: A mystic hexagon is a regular hexagon with all
its diagonals drawn.
230

8/2/2019 Std08 Maths EM 2
http://slidepdf.com/reader/full/std08-maths-em-2 93/152
231
Practical Geometry
A quadrilateral is a plane figure bounded by four line segments.
To construct a quadrilateral, fi ve independent measurements are necessary.
A quadrilateral with one pair of opposite sides parallel is called a trapezium.
To construct a trapezium four independent measurements are necessary.
If non-parallel sides are equal in a trapezium, it is called an isosceles
trapezium.
To construct an isosceles trapezium three independent measurements are
necessary.A quadrilateral with each pair of opposite sides parallel is called a
parallelogram.
To construct a parallelogram three independent measurements are
necessary.
A quadrilateral with each pair of opposite sides parallel and with each pair
of adjacent sides equal is called a rhombus.
To contruct a rhombus two independent measurements are necessary.
A parallelogram in which each angle is a right angle, is called a rectangle.
Square is a rectangle, whose pair of adjecent sides are equal.
Circles drawn in a plane with a common centre and different radii are
called concentric circles.
The area bounded between two concentric circles is known as circular
ring.
‘The area of a quadrilateral, A =21 d ( h
1+ h
2 ) sq. units, where ‘d ’ is the
diagonal, ‘h1’ and ‘h
2’ are the altitudes drawn to the diagonal from its
opposite vertices.
The area of a trapezium, A h a b21= +^ h sq. units, where ‘a’ and ‘b’ are the
lengths of the parallel sides and ‘h ’ is the perpendicular distance between
the two parallel sides.
The area of a parallelogram, A= bh sq. units, where ‘b’ is the base of the
parallelogram and ‘h ’ is the perpendicular distance between the parallel
sides.
The area of a rhombus, A = d d 21
1 2sq. units, where d
1and d
2are the two
diagonals of the rhombus.

8/2/2019 Std08 Maths EM 2
http://slidepdf.com/reader/full/std08-maths-em-2 94/152
7Graphs
7.1 Introduction
7.2 Introduction to Cartesian Plane with Axes
7.3 Plotting of points for different kinds of
situations
7.4 Drawing Straight Lines and Parallel Lines
to the Coordinate Axes
7.5 Linear Graphs
7.6 Reading Linear Graphs
7.1 Introduction
The story of a fly and the graph
The mathematician who introduced graph was Rene Descartes,
a French Mathematician in early 17th century. Here is an interesting
anecdote from his life.
Rene Descartes, was a sick child
and was therefore, allowed to remainin bed till quite late in the morning.
Later, it became his nature. One
day when he was lying on the bed,
he saw a small insect(fly) near one
corner of the ceiling. It’s movement
led Rene Descartes to think about the
problem of determining its position
on the ceiling. He thought that it wassuf ficient to know the eastward and
northward distance of the fly from the corner ‘O’ of the ceiling (refer
figure). This was the beginning of the subject known as Graphs.
His system of fixing a point with the help of two measurements
one with vertical and another with horizontal is known as ‘Cartesian
System’. The word ‘Cartes’ is taken from Rene Descartes and is named
as ‘Cartesian System’, in his honour. The two axes x and y are called as
Cartesian axes.
Rene Descartes
(1596- 1650 A.D)
The French
Mathematician
and philosopher
who wrote the
book “Discourse
on Method”.
His attempts to
unify algebraand geometry
gave birth to
new branches
of mathematics,
Coordinate
Geometry and
Graphs. One of his
famous statements
is
“I think,
therefore I am”.
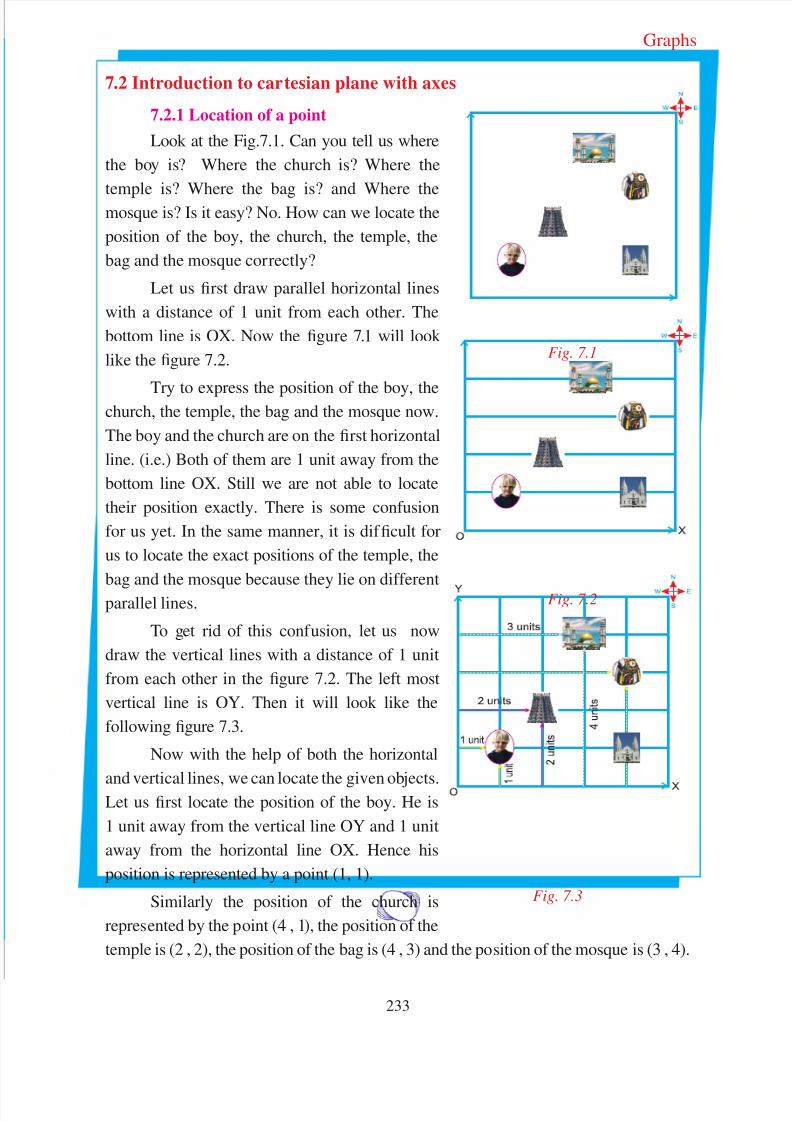
8/2/2019 Std08 Maths EM 2
http://slidepdf.com/reader/full/std08-maths-em-2 95/152
233
Graphs
7.2 Introduction to cartesian plane with axes
7.2.1 Location of a point
Look at the Fig.7.1. Can you tell us where
the boy is? Where the church is? Where the
temple is? Where the bag is? and Where themosque is? Is it easy? No. How can we locate the
position of the boy, the church, the temple, the
bag and the mosque correctly?
Let us first draw parallel horizontal lines
with a distance of 1 unit from each other. The
bottom line is OX. Now the figure 7.1 will look
like the figure 7.2.
Try to express the position of the boy, thechurch, the temple, the bag and the mosque now.
The boy and the church are on the first horizontal
line. (i.e.) Both of them are 1 unit away from the
bottom line OX. Still we are not able to locate
their position exactly. There is some confusion
for us yet. In the same manner, it is dif ficult for
us to locate the exact positions of the temple, the
bag and the mosque because they lie on different
parallel lines.
To get rid of this confusion, let us now
draw the vertical lines with a distance of 1 unit
from each other in the figure 7.2. The left most
vertical line is OY. Then it will look like the
following figure 7.3.
Now with the help of both the horizontal
and vertical lines, we can locate the given objects.Let us first locate the position of the boy. He is
1 unit away from the vertical line OY and 1 unit
away from the horizontal line OX. Hence his
position is represented by a point (1, 1).
Similarly the position of the church is
represented by the point (4 , 1), the position of the
temple is (2 , 2), the position of the bag is (4 , 3) and the position of the mosque is (3 , 4).
Fig. 7.2
Fig. 7.3
Fig. 7.1

8/2/2019 Std08 Maths EM 2
http://slidepdf.com/reader/full/std08-maths-em-2 96/152
234
Chapter 7
7.2.2. Coordinate system
Now let us define formally
what the coordinate system is.
Let X OXl and Y OYl be
the two number lines intersecting
each other perpendicularly at zero.
They will divide the whole plane
of the paper into four parts which
we call quadrants [I, II, III and
IV]. See the figure.
The line XlOX is called the x-axis.
The line Y OYl is called the y-axis.
The point ‘O’ is called the Origin.
Thus, origin is the point of
intersection of x-axis and y-axis.
This is called the Cartesian coordinate system.
Note : To mark a point, we always write the x-coordinate (or the number on the
horizontal axis) first and then the y-coordinate (or the number on the vertical
axis). The first number of the pair is called the x-coordinate or abscissa.The second number of the pair is called the y-coordinate or ordinate.
Observation : Let us consider the point P (4, 6) in the figure. It is 4 units away
from the right side of the y-axis and 6 units above the x-axis. Then the coordinate of
the point P is (4, 6).
7.3 Plotting of Points for different kinds of situations
7.3.1 Plotting a point on a Graph sheet
Example 7.1
Plot the point (4, 5) on a graph sheet. Is it the same as (5, 4) ?
Solution
Draw X OXl and Y OYl and let them cut at the origin at O.
Mark the units along the x-axis and y-axis with a suitable scale.
The given point is P (4, 5).
Here the x-coordinate of P is 4 and the y-coordinate of P is 5.

8/2/2019 Std08 Maths EM 2
http://slidepdf.com/reader/full/std08-maths-em-2 97/152
235
Graphs
And both are positive. Hence the point
P (4, 5), lies in the first quadrant.
To plot, start at the Origin O(0,0) . Move
4 units to the right along the x-axis. Then turn
and move 5 units up parallel to y-axis. You will
reach the point P (4, 5). Then mark it. (As shown
in the adjoining figure)
Next, let us plot the point Q (5, 4). Here
the x-coordinate of Q is 5 and the y-coordinate
of Q is 4. And both are positive. Hence, this
point Q (5, 4) also lies in the quadrant I. To plot
this point Q (5, 4); start at the Origin. Move 5
units to the right along the x-axis . Then turn and
move 4 units up parallel to y-axis. You will reach the point Q (5, 4). Then mark it (As
shown in the above figure).
Conclusion: From the above figure, it is very clear that the points P (4,5) and
Q(5, 4) are two different points.
Example 7.2
Plot the following points on
a graph paper and find out in which
quadrant do they lie?
(i) A (3,5) (ii) B (–2 , 7)
(iii) C (–3,–5) (iv) D (2, – 7)
(v) O (0, 0)
Solution
Draw the x and y axes. Mark
the units along the x and y axes
with a suitable scale.
(i) To plot the point A (3 , 5)
Here, the x-coordinate of
A is 3 and the y-coordinate of A
is 5. Both are positive. Hence the
point A (3 , 5) lies in the quadrant
I. Start at the Origin. Move three
units to the right along the x-axis.

8/2/2019 Std08 Maths EM 2
http://slidepdf.com/reader/full/std08-maths-em-2 98/152
236
Chapter 7
Then turn and move 5 units up parallel to Y-axis and mark the point A (3 , 5).
(ii) To plot the point B (–2 , 7)
Here, the x-coordinate of B is –2 which is negative and the y-coordinate of B
is 7 which is positive. Hence the point B (–2 , 7) lies in the quadrant II. Start at the
Origin. Move 2 units to the left along the x-axis. Then turn and move 7 units up
parallel to y-axis and mark the point B (–2 , 7).
(iii) To plot the point C (–3 , –5)
Here, the x-coordinate of C is –3 and the y-coordinate of C is –5. Both are
negative. Hence the point C (–3 , –5) lies in the quadrant III. Start at the Origin. Move
3 units to the left along the x-axis. Then turn and move 5 units down parallel to y-axis.
and mark the point C (–3 , –5).
(iv) To plot the point D (2 , –7)
Here, the x-coordinate of the point D is 2 which is positive and the y-coordinate
of D is –7 which is negative. Hence the point D (2 , –7) lies in the quadrant IV. Start
at the Origin. Move 2 units to the right along the x-axis. Then turn and move 7 units
down parallel to y-axis and mark the point D (2 , –7).
(v) To plot the point O (0, 0)
This is the origin. Both the x and y coordinates are zeros. It is the point of
intersection of the axes x and y.
Mark the point O (0,0).
Example 7.3
Plot the following
points on a graph paper and
find out where do they lie?
(i) A (7, 0) (ii) B (– 5, 0)
(iii) C (0 , 4) (iv) D (0, – 3)
Solution
Draw the x and y axes.
Mark the units along the x and y
axes with a suitable scale.
(i) To plot the point A (7, 0)
Here, the x-coordinate of
A is 7 which is positive and the
y-coordinate of A is zero. Hence

8/2/2019 Std08 Maths EM 2
http://slidepdf.com/reader/full/std08-maths-em-2 99/152
237
Graphs
the point A (7, 0) lies on the x-axis. Start at the Origin. Move 7 units to the right along
the x-axis and mark it.
(ii) To plot the point B (–5 , 0)
Here, the x-coordinate of B is –5 which is negative and the y-coordinate is zero.
Hence the point B (–5 , 0) lies on the x-axis. Start at the Origin. Move 5 units to theleft along the x-axis and mark it.
(iii) To lot the point C (0 ,4)
Here, the x-coordinate of C is zero and the y-coordinate of C is 4 which is
positive. Hence the point C (0 , 4) lies on the y-axis. Start at the Origin. Move 4 units
up along the y-axis and mark it.
(iv) To plot the point D (0 , –3)
Here the x-coordinate of D is zero and the y-coordinate of D is –3 which isnegative. Hence the point D (0 , – 3) lies on the y-axis. Start at the Origin. Move 3 units
down along the y-axis and mark it.
Where do the points lie? How can we tell without actually plotting the points on
a graph sheet? To know this, observe the following table.
Sl. No. Examplesx coordinate of
the point
y coordinate of the
point
Location of the
point1. (3,5) Positive (+) Positive (+) Quadrant I
2. (–4,10) Negative (–) Positive (+) Quadrant II
3. (–5,–7) Negative (–) Negative (–) Quadrant III
4. (2,–4) Positive (+) Negative (–) Quadrant IV
5. (7,0) Non zero Zero On the X axis
6. (0,–5) Zero Non-zero On the Y axis
7 (0,0) Zero Zero Origin
Can you tell, where do the following points lie without actually plotting them
on the graph paper?
(i) (2 , 7) (ii) (–2 , 7) (iii) (–2 , –7) (iv) (2 , –7)
(v) (2 , 0) (vi) (–2 , 0) (vii) (0 , 7) (viii) (0 , –7)

8/2/2019 Std08 Maths EM 2
http://slidepdf.com/reader/full/std08-maths-em-2 100/152
238
Chapter 7
7.4 Drawing straight lines and parallel lines to the coordinate axes
In this section first we are going to learn how to draw straight lines for the
given two points and then how to draw lines parallel to coordinate axes. Also to find
the area of plane figures.
7.4.1 Line joining two given points
Example 7.4
Draw the line joining the
following points.
(i) A (2,3) and B (5, 7),
(ii) P (–4,5) and Q (3,–4).
Solution
(i) To draw the line joining thepoints A (2 , 3) and B(5 , 7):
First, plot the point (2 , 3) and
denote it by by A.
Next, plot the point (5 , 7) and
denote it by B.
Then, join the points A and B.
AB is the required line.
(ii) To draw the line joining
the points P (–4 , 5) and Q (3 , –4)
First, plot the point (–4 , 5)
and denote it by P.
Next, plot the point (3 , –4)
and denote it by Q.
Then, join the points P and Q.
PQ is the required line.

8/2/2019 Std08 Maths EM 2
http://slidepdf.com/reader/full/std08-maths-em-2 101/152
239
Graphs
7.4.2 Drawing straight parallel lines to axes
Example 7.5
(i) Draw the graph of x = 3.
(ii) Draw the graph of y = –5.
(iii) Draw the graph of x = 0.
Solution
(i) The equation x = 3 means:
Whatever may be y-coordinate,
x-coordinate is always 3. Thus, we have
x 3 3
y 3 –4
Plot the points A (3, 3) and
B (3 , –4). Join these points and extend
this line on both sides to obtain the
graph of x = 3.
(ii) The equation y = – 5 means:
Whatever may be the x-coordinate,
the y-coordinate is always – 5.
Thus we have,
x –2 6
y –5 –5
Plot the points A (–2, –5) and
B (6 , –5). Join these points A and B and
extend this line on both sides to obtain
the graph of y = –5.

8/2/2019 Std08 Maths EM 2
http://slidepdf.com/reader/full/std08-maths-em-2 102/152
240
Chapter 7
(iii) The equation x = 0 means;
Whatever may be the y-coordinate,
x-coordinate is always 0.
Thus, we have
x 0 0
y 3 –3
Plot the points A (0 , 3) and
B (0, – 3).
Join the points A and B and extend
this line to obtain the graph of x = 0.
7.4.3 Area of Plane Figures
Area of regions enclosed by plane figures like square, rectangle, parallelogram,
trapezium and triangle drawn in a graph sheet can be determined by actual counting
of unit squares in the graph sheet.
Example: 7.6
Plot the points A (5 , 3),
B (–3 , 3), C (–3 , –4), D (5 , –4) andfind the area of ABCD enclosed by
the figure.
Solution
Draw the x-axis and y-axis with
a suitable scale.
Plot the points A (5, 3),
B (– 3, 3), C (–3 , –4), D (5 , –4). Join
the points A and B, B and C, C and D
and D and A. We get a closed figure
ABCD. Clearly it is a rectangle. Count
the number of units squares enclosed
between the four sides. There are
altogether 56 unit squares. Hence the
area of the rectangle ABCD is 56 cm2.

8/2/2019 Std08 Maths EM 2
http://slidepdf.com/reader/full/std08-maths-em-2 103/152
241
Graphs
Example 7.7
Plot the points A (2 , 8 ),
B (–3 , 3) , C (2 , 3) and
find the area of the region
enclosed by the figure ABC.
Solution
Draw the x-axis and
y-axis with a suitable scale.
Plot the points A (2 , 8),
B (– 3, 3), C (2 , 3). Join the
points A and B, B and C and
C and A. We get a closed
figure ABC. Clearly it is a
triangle. Count the number
of full squares. There are 10
full unit squares.
Count the number of half squares. There are 5 half unit squares.
Hence the area of a triangle is 10 10 2.5 12.52
5 cm2+ = + = .
EXERCISE 7.1
1. Plot the following points in the graph paper and find out where do they lie?
(i) A (2 , 3) (ii) B (– 3 , 2) (iii) C (–5 ,–5) (iv) D (5 , –8)
(v) E (6 , 0) (vi) F (–4 , 0) (vii) G (0 , 9) (viii) H (0 , –3)
(ix) J (7 , 8) (x) O (0 , 0)
2. State in which quadrant each of the following
points lie without actually plotting the points.
(i) (8 , 15) (ii) (–15 , 2)
(iii) (–20 , –10) (iv) (6 , –9)
(v) (0 , 18) (vi) (–17 , 0)
(vii) (9 , 0) (viii) (–100 , –200)
(ix) (200 , 500) (x) (–50 , 7500).
3. Determine the quadrants and the coordinates
of the points A, B, C, D, E, F, G, H and O in
the given figure.

8/2/2019 Std08 Maths EM 2
http://slidepdf.com/reader/full/std08-maths-em-2 104/152
242
Chapter 7
4. Plot the following points and draw a line through the points.
(i) (2 , 7) , (–2 ,– 3) (ii) (5 , 4), (8 , –5)
(iii) (–3 , 4), (–7 , –2) (iv) (–5 , 3), (5 , –1)
(v) (2 , 0), (6 , 0) (vi) (0 , 7), (4 , –4)
5. Draw the graph of the following equations:
(i) y = 0 (ii) x = 5 (iii) x = –7 (iv) y = 4 (v) y = –3
6. Plot the following points and find out the area of enclosed figures.
(i) A (3 , 1), B (3 , 6), C (–5 , 6), D (–5 , 1)
(ii) A (– 2 , – 4), B (5 , – 4), C (5 , 4), D (–2 , 4)
(iii) A (3 , 3), B (–3 , 3), C (–3 , –3), D (3 , –3)
(iv) O (0 , 0), A (0 , 7), B (–7 , 7), C (–7 , 0)
(v) A (0 , – 2), B (–4 , – 6), C (4 ,– 6)
(vi) A (1 , 2), B (9,2), C (7 , 4), D (3 , 4)(vii) A (–4, 1), B (–4, 7), C (–7, 10), D (–7 , 4)
7. Find the perimeter of the rectangle and squares of the previous problems
6 (i), (ii), (iii) and (iv).
7.5 Linear Graphs
We have learnt to draw straight lines and the parallel lines in the graph sheet.
When we get a straight line by joining any two points, then the graph is called a linear
graph.
7.5.1 Time and Distance Graph
Let us consider the following example to study the relationship between time
and distance.
Example 7.8
Amudha walks at a speed of 3 kilometers per hour. Draw a linear graph to show
the relationship between the time and distance.
SolutionAmudha walks at a speed of 3 kilometers per hour. It means she walks 3 Km in
1 hour, 6 Km in 2 hours, 9 km in 3 hours and so on.
Thus we have the table
Time in hours ( x) 0 1 2 3 4 5
Distance in km ( y) 0 3 6 9 12 15
Points: (0 , 0), (1 , 3), (2 , 6), (3 , 9), (4 , 12) and (5 , 15).

8/2/2019 Std08 Maths EM 2
http://slidepdf.com/reader/full/std08-maths-em-2 105/152
243
Graphs
Plot the points (0 , 0), (1, 3),
(2, 6), (3, 9), (4, 12) and (5, 15). Join
all these points.
We get a straight line . Hence, it
is a linear graph.
Relationship between x and y:
We know that,
Distance = Speed × Time.
From the above table,
0 = 3 × 0
3 = 3 × 1
6 = 3 × 29 = 3 × 3
12 = 3 × 4
15 = 3 × 5
y( = 3 x
[Here, y = Distance, x = Time in hour and 3 is the speed]
The linear equation of this problem is y = 3 .
7.5.2 Perimeter–side graph of a square
Example 7.9
Draw a linear graph to show the perimeter–side relationship of a square.
Solution
We know that the perimeter
of a square is four times of its side.
(i.e) P = 4a.
(Here, P = Perimeter and a = side)
For different values of a, the values
of P are given in the following table.
a (in cm) 1 2 3 4
P = 4a (in cm) 4 8 12 16
Points: (1, 4), (2, 8), (3, 12), (4, 16).
Plot the above points. Join all the
points. We get the linear graph of P = 4a.

8/2/2019 Std08 Maths EM 2
http://slidepdf.com/reader/full/std08-maths-em-2 106/152
244
Chapter 7
7.5.3 Area as a function of side of a square
Example 7.10
Draw a graph to show the area-
side of a square.
SolutionWe know that the area of a square is
the square of its side. (i.e) A = a2.
(Here, A = Area, a = side). For
different values of a, the values of A are
given in the following table.
a (in cm) 1 2 3 4 5
A = a2 (in cm2) 1 4 9 16 25
Points: (1 , 1), (2 , 4), (3 , 9), (4 ,16),
(5 , 25)
Plot the above points.
Join all the points. Observe the
graph. Is it a linear graph? No. It is a curve.
7.5.4 Plotting a graph of different multiples of numbers
Example 7.11Draw a graph of multiples of 3.
Solution
Let us write the multiples of 3.
Multiples of 3 are 3, 6, 9, 12, 15... etc.
We can also write this as Multiples
of 3 = 3 # n, where n = 1, 2, 3, ...
m = 3 n. m is the multiple of 3
Thus, we have the following table.
n 1 2 3 4 5
m = 3n 3 6 9 12 15
Points: (1 , 3), (2 , 6), (3 , 9), (4 , 12),
(5 , 15).
Plot all these points and join them.
We get the graph for multiples of 3.

8/2/2019 Std08 Maths EM 2
http://slidepdf.com/reader/full/std08-maths-em-2 107/152
245
Graphs
7.5.5. Simple Interest–Time graph
Example 7.12
Ashok deposited ` 10,000 in a bank at the rate of 8% per annum. Draw a linear
graph to show the simple interest-time relationship. Also, find the simple interest for
5 years.
Solution
We know that,
Simple interest, I =100Pnr
[where P = Principal, n = Time in years,
r = Rate of interest]
Principal, P = 10000
Time, n = ?
Rate, r = 8%
I = n r
100P # #
I =100
10000 8n# #
I = 800 n.
(Here, the simple interest, I depends upon N)
For different values of n, the values of I are given in the following table.
n (Time in Yrs) 1 2 3 4 5
I = 800 n (in ` ) 800 1600 2400 3200 4000
Points: (1, 800), (2, 1600), (3, 2400), (4, 3200), (5, 4000)
Plot all the points. Join them all. Draw the linear graph.
So, Ashok will get ` 4000 as simple interest after 5 years. (In the graph, the
answer is shown by the dotted lines.)
7.6 Reading Linear Graphs
Money Exchange: The world has become very small today. It is inevitable to
do business with foreign countries. When we are doing business with other countries,we have to transact our money (Indian currency) in terms of their currencies. Different
countries use different currencies under different names. Hence we should know the
concepts related to money exchange. Let us consider the following example.
Example 7.13
On a particular day the exchange rate of 1 Euro was ` 55. The following linear
Graph shows the relationship between the two currencies. Read the graph carefully.
and answer the questions given below:

8/2/2019 Std08 Maths EM 2
http://slidepdf.com/reader/full/std08-maths-em-2 108/152
246
Chapter 7
(i) Find the values of 4 Euros in terms of Rupees.
(ii) Find the values of 6 Euros in terms of Rupees.
(iii) Find the value of ` 275 in terms of Euros.
(iv) Find the value of ` 440 in terms of Euros.
Solution
(i) To find the value of 4
Euros. In this graph, draw a
dotted line at x= 4 parallel
to y-axis.
Locate the point of
intersection of this line
with the given line.
From this point drawa dotted line parallel to
x-axis.
It cuts the y -axis at 220.
(See figure)
Hence the value of
4 Euros is ` 220.
Try and answer the remaining questions (ii), (iii) and (iv).
EXERCISE 7.2
1. Draw a linear graph for the following data.
x 5 5 5 5 5 5
y 1 2 3 4 5 6
2. Draw the linear graph and find
the missing entries.
x 1 2 3 4 –
y 6 12 – – 30
4. Draw the graph of y = 7x.
5. If Akbar is driving a car at a uniform speed of 40 km/hr. Draw the distance time
graph. Also find the time taken by Akbar to cover a distance of 200 km.
6. Eliza deposited ` 20,000 in a bank at the rate of 10% per annum. Draw a linear
graph showing the time and simple interest relationship. Also, find the simple
interest for 4 years.
(i) (ii)x 1 2 3 4 5
y 1 2 3 4 5
Side (in m) 2 3 4 5 6
Area (inm2) 4 9 16 25 36
3. Draw the following graph of side–area
relationship of a square.
8/2/2019 Std08 Maths EM 2
http://slidepdf.com/reader/full/std08-maths-em-2 109/152
8Data Handling
8.1 Introduction
Everyday we come across different kinds of information in the
form of numbers through newspapers and other media of communication.
This information may be about food production in our country,
population of the world, import and export of different countries, drop-
outs of children from the schools in our state, the accidential deaths, etc.
In all these information, we use numbers. These numbers are
called data. The data help us in making decisions. They play a vital part
in almost all walks of life of every citizen. Hence, it is very important to
know how to get relevant and exact information from such data.
The calculated data may not be suitable for reading, understanding
and for analysing. The data should be carefully handled so that it can be
presented in various forms. A common man should be able to understand
and visualize and get more information on the data.
8.1 Introduction
8.2 Recalling the Formation of Frequency Table
8.3 Drawing Histogram and Frequency Polygon
for Grouped Data
8.4 Construction of Simple Pie chart
8.5 Measures of Central Tendency
R.A. Fisher
[17th Feb., 1890 -
29th July, 1962]
Fisher was
interested in the
theory of errors
that eventually let
him to investigate
statistical
problems. He
became a teacherin Mathematics
and Physics
between 1915
and 1919. He
studied the design
of experiments
by introducing
randomisation
and the analysis
of variance
procedures now
used throughout
the world. He is
known as
“Father of Modern
Statistics”.

8/2/2019 Std08 Maths EM 2
http://slidepdf.com/reader/full/std08-maths-em-2 110/152
248
Chapter 8
8.2 Recalling the Formation of Frequency Table
We have learnt in seventh standard, how to form a frequency table. Let us
recall it.
8.2.1 Formation of frequency table for an ungrouped data
Example 8.1
Consider the following data:
15, 17, 17, 20, 15, 18, 16, 25, 16, 15,
16, 18, 20, 28, 30, 27, 18, 18, 20, 25,
16, 16, 20, 28, 15, 18, 20, 20, 20, 25. Form a frequency table.
Solution
The frequency table is given below:
Number
( x)Tally Mark
Frequency
( f )
15 4
16 5
17 2
18 5
20 7
25 3
27 1
28 2
30 1
Total 30
8.2.2 Formation of frequency table for a grouped data
Example: 8.2
The marks obtained by 50 students in a Mathematics test with maximum marks
of 100 are given as follows:

8/2/2019 Std08 Maths EM 2
http://slidepdf.com/reader/full/std08-maths-em-2 111/152
249
Data Handling
43, 88, 25, 93, 68, 81, 29, 41, 45, 87, 34, 50, 61, 75, 51, 96, 20, 13, 18, 35,
25, 77, 62, 98, 47, 36, 15, 40, 49, 25, 39, 60, 37, 50, 19, 86, 42, 29, 32, 61,
45, 68, 41, 87, 61, 44, 67, 30, 54, 28.
Prepare a frequency table for the above data using class interval.
Solution
Total number of values = 50
Range = Highest value -Lowest value
= 98 – 8 = 90
Let us divide the given data into 10 classes.
` Length of the Class interval =Number of class interval
Range
=
10
90 9=
The frequency table of the marks obtained by 50 students in a mathematics test
is as follows:
Class
Interval (C.I)Tally Mark Frequency ( f )
0 - 10 2
10 - 20 4
20 - 30 6
30 - 40 7
40 - 50 9
50 - 60 4
60 - 70 8
70 - 80 2
80 - 90 5
90 - 100 3
Total 50

8/2/2019 Std08 Maths EM 2
http://slidepdf.com/reader/full/std08-maths-em-2 112/152
250
Chapter 8
Thus the given data can be grouped and tabulated as follows:
Class
Interval
(C.I)
0-10 10-20 20- 30 30-40 40- 50 50- 60 60- 70 70- 80 80-90 90-100
Frequency
( f )2 4 6 7 9 4 8 2 5 3
8.3 Drawing Histogram and Frequency Polygon for Grouped Data
The statistical data can be represented by means of geometrical figures or
diagrams which are normally called “graphs’’. The graphical representation of data
makes itself interesting for reading, consuming less time and easily understandable.
There are many ways of representing numerical data graphically. In this chapter, we
will study the following two types of diagrams:
(i) Histogram
(ii) Frequency Polygon
8.3.1 Histogram
A two dimensional graphical representation of a continuous frequency
distribution is called a histogram.
In histogram, the bars are placed continuously side by side with no gap between
adjacent bars. That is, in histogram rectangles are erected on the class intervals of
the distribution. The areas of rectangle are proportional to the frequencies.
8.3.1 (a) Drawing a histogram for continuous frequency distribution
Procedure:
Step 1 : Represent the data in the continuous (exclusive) form if it is in the
discontinuous (inclusive) form.
Step 2 : Mark the class intervals along the X-axis on a uniform scale.
Step 3 : Mark the frequencies along the Y-axis on a uniform scale.
Step 4 : Construct rectangles with class intervals as bases and corresponding
frequencies as heights.
The method of drawing a histogram is explained in the following example.
Example 8.3
Draw a histogram for the following table which represent the marks obtained by
100 students in an examination:

8/2/2019 Std08 Maths EM 2
http://slidepdf.com/reader/full/std08-maths-em-2 113/152
251
Data Handling
Marks 0-10 10-20 20-30 30-40 40-50 50-60 60-70 70-80
Number of
students5 10 15 20 25 12 8 5
Solution
The class intervals are all equal with length of 10 marks. Let us denote these
class intervals along the X-axis. Denote the number of students along the Y-axis, with
appropriate scale. The histogram is given below.
Fig. 8.1
Note: In the above diagram, the bars are drawn continuously. The rectangles are of
lengths (heights) proportional to the respective frequencies. Since the class intervals
are equal, the areas of the bars are proportional to the respective frequencies.
8.3.1 (b) Drawing a histogram when class intervals are not continuous
Example 8.4:
The heights of trees in a forest are given as follows. Draw a histogram to
represent the data.
Heights in metre 16-20 21-25 26-30 31-35 36-40 41-45 46-50 51-55
Number of trees 10 15 25 30 45 50 35 20

8/2/2019 Std08 Maths EM 2
http://slidepdf.com/reader/full/std08-maths-em-2 114/152
252
Chapter 8
Solution
In this problem, the given class intervals are discontinuous (inclusive) form.
If we draw a histogram as it is, we will get gaps between the class intervals. But in
a histogram the bars should be continuously placed without any gap. Therefore we
should make the class intervals continuous. For this we need an adjustment factor.
Adjustment Factor =21 [(lower limit of a class interval) –
(upper limit of the preceding class interval)]
=21 (21 – 20) = 0.5
In the above class interval, we subtract 0.5 from each lower limit and add 0.5 in
each upper limit. Therefore we rewrite the given table into the following table.
Heights in
metre15.5-20.5 20.5-25.5 25.5-30.5 30.5-35.5 35.5-40.5 40.5-45.5 45.5-50.5 50.5-55.5
Number of Trees
10 15 25 30 45 50 35 20
Now the above table becomes continuous frequency distribution. The histogram
is given below
Fig. 8.2

8/2/2019 Std08 Maths EM 2
http://slidepdf.com/reader/full/std08-maths-em-2 115/152
253
Data Handling
Note: In the histogram (Fig. 8.2) along the X-axis the
first value starts from 15.5, therefore a break (kink)
is indicated near the origin to signify that the graph is
drawn beginning at 15.5 and not at the origin.
8.3.2 Frequency polygon
Frequency Polygon is another method of representing frequency distribution
graphically.
Draw a histogram for the given continuous data. Mark the middle points of the
tops of adjacent rectangles. If we join these middle points successively by line segment,
we get a polygon. This polygon is called the frequency polygon. It is customary to
bring the ends of the polygon down to base level by assuming a lower class of a
frequency and highest class of a frequency.Frequency Polygon can be constructed in two ways:
(i) Using histogram
(ii) Without using histogram.
8.3.2 (a) To draw frequency polygon using histogram
Procedure:
Step 1 : Obtain the frequency distribution from the given data and draw a
histogram.Step 2 : Join the mid points of the tops of adjacent rectangles of the histogram
by means of line segments.
Step 3 : Obtain the mid points of two assumed class intervals of zero
frequency, one adjacent to the first bar on its left and another
adjacent to the last bar on its right. These class intervals are known
as imagined class interval.
Step 4 : Complete the polygon by joining the mid points of first and the
last class intervals to the mid point of the imagined class intervalsadjacent to them.
Example 8.5
Draw a frequency polygon imposed on the histogram for the following
distribution
Class interval 10-20 20-30 30-40 40-50 50-60 60-70 70-80 80-90
Frequency 4 6 8 10 12 14 7 5
The break is indicated
by a Zig - Zag curve.

8/2/2019 Std08 Maths EM 2
http://slidepdf.com/reader/full/std08-maths-em-2 116/152

8/2/2019 Std08 Maths EM 2
http://slidepdf.com/reader/full/std08-maths-em-2 117/152

8/2/2019 Std08 Maths EM 2
http://slidepdf.com/reader/full/std08-maths-em-2 118/152
256
Chapter 8
Solution
Mark the class intervals along the X-axis and the number of students along the
Y-axis. Draw a histogram for the given data. Now mark the mid points of the upper
sides of the consecutive rectangles. The mid points are joined with the help of a ruler.
Note that, the first and last edges of the frequency polygon meet at the mid point of
the vertical edges of the first and last rectangles.
Fig. 8.5
8.3.2 (b) To draw a frequency polygon without using histogram
Procedure:
Step 1 : Obtain the frequency distribution and compute the mid points of
each class interval.
Step 2 : Represent the mid points along the X-axis and the frequencies along
the Y-axis.
Step 3 : Plot the points corresponding to the frequency at each mid point.
Step 4 : Join these points, by straight lines in order.
Step 5 : To complete the polygon join the point at each end immediately to the
lower or higher class marks (as the case may be at zero frequency) on
the X-axis.
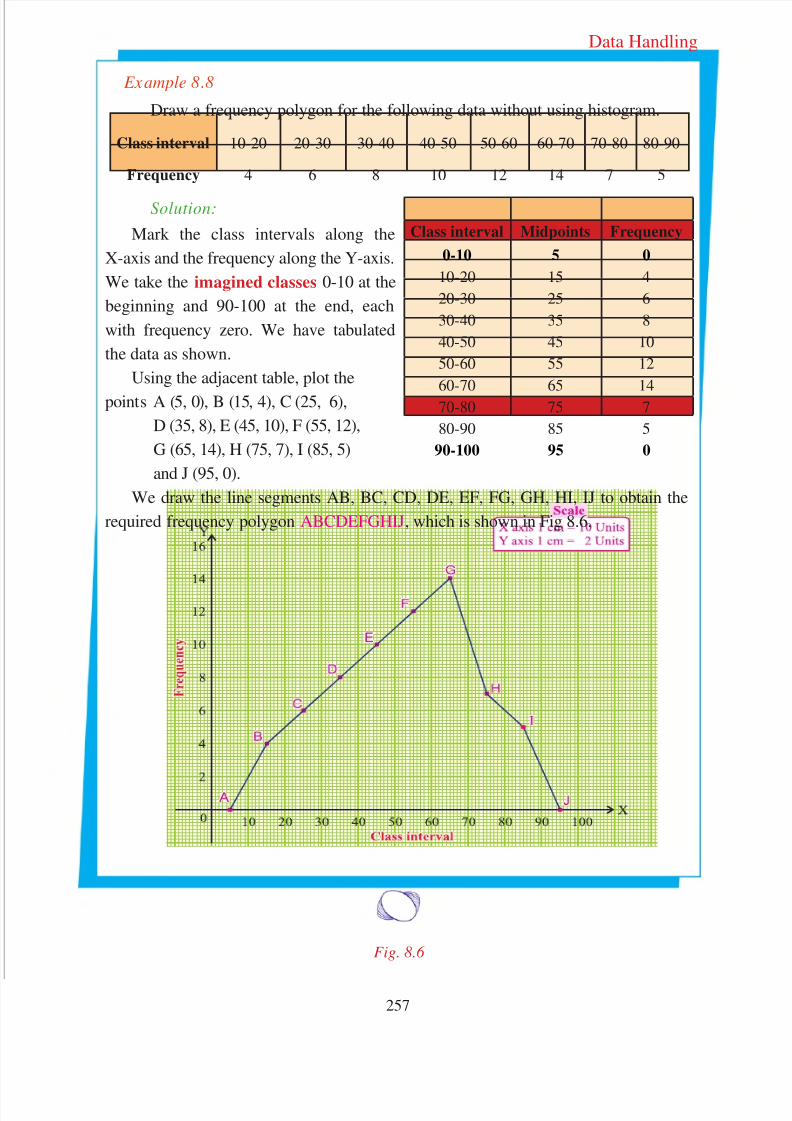
8/2/2019 Std08 Maths EM 2
http://slidepdf.com/reader/full/std08-maths-em-2 119/152
257
Data Handling
Example 8.8
Draw a frequency polygon for the following data without using histogram.
Class interval 10-20 20-30 30-40 40-50 50-60 60-70 70-80 80-90
Frequency 4 6 8 10 12 14 7 5
Solution:
Mark the class intervals along the
X-axis and the frequency along the Y-axis.
We take the imagined classes 0-10 at the
beginning and 90-100 at the end, each
with frequency zero. We have tabulated
the data as shown.
Using the adjacent table, plot the
points A (5, 0), B (15, 4), C (25, 6),
D (35, 8), E (45, 10), F (55, 12),
G (65, 14), H (75, 7), I (85, 5)
and J (95, 0).
We draw the line segments AB, BC, CD, DE, EF, FG, GH, HI, IJ to obtain the
required frequency polygon ABCDEFGHIJ, which is shown in Fig 8.6.
Fig. 8.6
Class interval Midpoints Frequency
0-10 5 0
10-20 15 4
20-30 25 6
30-40 35 8
40-50 45 10
50-60 55 12
60-70 65 1470-80 75 7
80-90 85 5
90-100 95 0

8/2/2019 Std08 Maths EM 2
http://slidepdf.com/reader/full/std08-maths-em-2 120/152
258
Chapter 8
EXERCISES 8.1
1. Draw a histogram to represent the following data
Class intervals 0-10 10-20 20-30 30-40 40-50 50-60
Frequency 8 12 6 14 10 5
2. Draw a histogram with the help of the following table
Yield per acre (Quintal) 11-15 16-20 21-25 26-30 31-35 36 - 40
Number of rice field 3 5 18 15 6 4
3. Draw a histogram to represent the following data of the spectators in a cricket
match
Age in years 10-19 20-29 30-39 40-49 50-59 60-69
Number of spectators 4 6 12 10 8 2
4. In a study of diabetic patients in a village, the following observations were noted
Age (in years) 10-20 20-30 30-40 40-50 50-60 60-70
Number of patients 3 6 13 20 10 5
Represent the above data by a frequency polygon using histogram.
5. Construct a histogram and frequency polygon for the following data
Class interval 0-10 10-20 20-30 30-40 40-50 50-60
Frequency 7 10 23 11 8 5
6. The following table shows the performance of 150 candidates in an Intelligence
test. Draw a histogram and frequency polygon for this distribution
Intelligent Quotient 55-70 70-85 85-100 100-115 115-130 130-145Number of candidates 20 40 30 35 10 15
7. Construct a frequency polygon from the following data using histogram.
Marks 0-10 10-20 20-30 30-40 40-50 50-60 60-70 70-80 80-90 90-100
No of
students9 3 4 6 2 3 4 5 7 8

8/2/2019 Std08 Maths EM 2
http://slidepdf.com/reader/full/std08-maths-em-2 121/152
259
Data Handling
8. Draw a frequency polygon for the following data without using histogram
Age (in years) 0-10 10-20 20-30 30-40 40-50 50-60 60-70
Number of persons 6 11 25 35 18 12 6
9. Construct a frequency polygon for the following data without using histogram
Class interval 30-34 35-39 40-44 45-49 50-54 55-59
Frequency 12 16 20 8 10 4
10. The following are the marks obtained by 40 students in an English examination
(out of 50 marks). Draw a histogram and frequency polygon for the data
29, 45, 23, 40, 31, 11, 48, 11, 30, 24, 25, 29, 25, 32, 31, 22, 19, 49, 19, 13,
32, 39, 25, 43, 27, 41, 12, 13, 32, 44, 27, 43, 15, 35, 40, 23, 12, 48, 49, 18.
8.4 Construction of Simple Pie Chart
Have you ever come across the data represented in circular form as shown
in Figure 8.7 and Figure 8.8 ?
The figures similar to the above are called circle
graphs. A circle graph shows the relationship between
a whole and its parts. Here, the whole circle is divided
into sectors. The size of each sector is proportional
to the activity or information it represents. Since,
the sectors resemble the slices of a pie, it is called a
pie chart.
The time spent by a school student
during a day (24 hours).
Viewers watching different types of
channels on TV.
Fig. 8.7 Fig. 8.8
Pie is an American
food item

8/2/2019 Std08 Maths EM 2
http://slidepdf.com/reader/full/std08-maths-em-2 122/152
260
Chapter 8
For example, in the pie chart (Fig 8.7).
The proportion of the sector
for hours spent in sleepingG =
whole day
number of sleeping hours
=24 hours8 hours =
31
So, this sector is drawn 31 rd part of the circle.
The proportion of the sector
for hours spent in schoolG =
Whole daynumber of school hours
=24 hours6 hours =
41
So, this sector is drawn41 th of the circle.
The proportion of the sector
for hours spent in playG=
Whole day
number of play hours
=24 hours3 hours =
81
So, this sector is drawn81 th of the circle.
The proportion of the sector
for hours spent in homework G =
whole daynumber of home work hours
=24hours3 hours =
81
So, this sector is drawn81 th of the circle.
The proportion of the sector
for hours spent in othersG =
whole daynumber of others hours
=24hours4 hours =
61
So, this sector is drawn61 th of the circle.
Adding the above fractions for all activities,
We get the total =31
41
81
81
61
+ + + +
=24
8 6 3 3 4+ + + + =2424 = 1.
The sum of all fractions is equal to one. Here the time spent by a school
student during a day is represented using a circle and the whole area of the circle is
taken as one. The different activities of the school student are represented in various
sectors by calculating their proportion. This proportional part can also be calculated
using the measure of angle. Since, the sum of the measures of all angles at the central
point is 360°, we can represent each sector by using the measure of angle.

8/2/2019 Std08 Maths EM 2
http://slidepdf.com/reader/full/std08-maths-em-2 123/152
261
Data Handling
In the following example, we are going to illustrate how a pie chart can be
constructed by using the measure of angle.
Example 8.9
The number of hours spent by a school student on various activities on a working
day, is given below. Construct a pie chart using the angle measurment.
Activity Sleep School Play Homework Others
Number of hours 8 6 3 3 4
Solution
Number of hours spent in different activities in a day of 24 hours are converted
into component parts of 360°. Since the duration of sleep is 8 hours, it should be
represented by 248 3600# =120°.
Therefore, the sector of the circle representing sleep hours should have a central
angle of 120°.
Similarly, the sector representing other activities such as school, play, homework,
and others are calculated in the same manner in terms of degree, which is given in the
following table :
Activity Duration in hours Central angle
Sleep 8 248
3600
# = 1200
School 6246 360
0# = 900
Play 3 360243 0
# = 450
Homework 3 360243 0
# = 450
Others 4 360244 0
# = 600
Total 24 3600
Drawing pie chart
Now we draw a circle of any convenient radius. In that circle, start with any
radius and measure 120° at the centre of the circle and mark the second arm of this
angle. This sector represents the hours spent in sleeping.

8/2/2019 Std08 Maths EM 2
http://slidepdf.com/reader/full/std08-maths-em-2 124/152

8/2/2019 Std08 Maths EM 2
http://slidepdf.com/reader/full/std08-maths-em-2 125/152
263
Data Handling
Example 8.10
The following table shows the monthly budget of a family
Particulars FoodHouse
RentClothing Education Savings
Miscella-
neous
Expenses
(in ` ) 4800 2400 1600 800 1000 1400
Draw a pie chart using the angle measurement.
Solution
The central angle for various components may be calculated as follows:
Particulars Expenses (in Rs) Central angle
Food 4800 360°120004800
# = 144°
House rent 2400 360°120002400
# = 72°
Clothing 1600 360°120001600
# = 48°
Education 800 360°12000
800# = 24°
Savings 1000360°12000
1000#
= 30°
Miscellaneous 1400 360°120001400
# = 42°
Total 12000 360°
Clearly, we obtain the required pie chart as shown below.
Monthly Budget of a Family
Fig. 8.10

8/2/2019 Std08 Maths EM 2
http://slidepdf.com/reader/full/std08-maths-em-2 126/152
264
Chapter 8
Example 8.11
The S.S.L.C Public Examination result of a school is as follows:
ResultPassed in
first class
Passed in
second class
Passed in
third classFailed
Percentage of students
25% 35% 30% 10%
Draw a pie chart to represent the above information.
Solution
Central angle for a component =100
Percentage value of the component3600
#
We may calculate the central angles for various components as follows:
Result Percentage of students Central angle
Passed in first class 25% 10025 360
0# = 900
Passed in second class 35% 36010035 0
# = 1260
Passed in third class 30% 36010030 0
# = 1080
Failed 10% 360
100
10 0# = 36°
Total 100% 3600
Clearly, we obtain the required pie chart as shown below:
SSLC Public Examination Results
Fig. 8.11

8/2/2019 Std08 Maths EM 2
http://slidepdf.com/reader/full/std08-maths-em-2 127/152
265
Data Handling
EXERCISE 8.2
1. Yugendran’s progress report card shows his marks as follows:
Subject Tamil English Mathematics Science Social science
Marks 72 60 84 70 74
Draw a pie chart exhibiting his mark in various subjects.
2. There are 36 students in class VIII. They are members of different clubs:
Clubs Mathematics N.C.C J.R.C Scout
Number of students 12 6 10 8
Represent the data by means of a pie chart.
3. The number of students in a hostel speaking different languages is given below:
Languages Tamil Telugu Malayalam Kannada English Others
Number of students 36 12 9 6 5 4
Represent the data in a pie chart.
4. In a school, the number of students interested in taking part in various hobbies
from class VIII is given below. Draw a pie chart.
Hobby Music Pottery Dance Drama Social service
Number of students 20 25 27 28 20
5. A metal alloy contains the following metals. Represent the data by a pie chart.
Metal Gold Lead Silver Copper Zinc
Weights (gm) 60 100 80 150 60
6. On a particular day, the sales (in ` ) of different items of a baker’s shop are given
below. Draw a pie chart for this data.
Item Ordinary Bread Fruit Bread Cakes Biscuits Others
Cost ( ` ) 320 80 160 120 40
7. The money spent on a book by a publisher is given below:
Item Paper Printing Binding Publicity Royalty
Money spent ( ` ) 25 12 6 9 8
Represent the above data by a pie chart.
8. Expenditure of a farmer for cultivation is given as follows:
Item Ploughing Fertilizer Seeds Pesticides Irrigation
Amount ( ` ) 2000 1600 1500 1000 1100
Represent the data in a pie chart.

8/2/2019 Std08 Maths EM 2
http://slidepdf.com/reader/full/std08-maths-em-2 128/152
266
Chapter 8
9. There are 900 creatures in a zoo as per list below:
Creatures Wild animal Birds Other land animals Water animals Reptiles
Number of
Creatures400 120 135 170 75
Represent the above data by a pie chart.
10. In a factory, five varieties of vehicles were manufactured in a year, whose break
up is given below. Represent this data with the help of a pie chart.
Vehicle Scooter Motorbike Car Jeep Van
Number 3000 4000 1500 1000 500
11. A food contains the following nutrients. Draw a pie chart representing the data.
Nutrients Protein Fat Carbohydrates Vitamins Minerals
Percentage 30% 10% 40% 15% 5%
12. The favorite flavours of ice cream for students of a school is given in
percentages as follows
Flavours Chocolate Vanilla Strawberry Other flavours
Percentage of Students
preferring the flavours40% 30% 20% 10%
Represent this data by a pie chart.
13. The data on modes of transport used by students to come to school are givenbelow:
Mode of transport Bus Cycle Walking Scooter Car
Percentage of students 40% 30% 15% 10% 5%
Represent the data with the help of a pie chart.
14. Mr. Rajan Babu spends 20% of his income on house rent, 30% on food and 10%
for his children’s education. He saves 25%, while the remaining is used for other
expenses. Make a pie chart exhibiting the above information.
15. The percentage of various categories of workers in a state are given in following
table
Category of
workersCultivators
Agricultural
labours
Industrial
Workers
Commercial
WorkersOthers
Percentage 40% 25% 12.5% 10% 12.5%
Represent the information given above in the form of a pie chart.

8/2/2019 Std08 Maths EM 2
http://slidepdf.com/reader/full/std08-maths-em-2 129/152
267
Data Handling
8.5 Measures of Central Tendency
Even after tabulating the collected mass of data, we get only a hazy general
picture of the distribution. To obtain a more clear picture, it would be ideal if we can
describe the whole mass of data by a single number or representative number. To get
more information about the tendency of the data to deviate about a particular value,there are certain measures which characterise the entire data. These measures are
called the Measures of Central Tendency. Such measures are
(i) Arithmetic Mean, (ii) Median and (iii) Mode
8.5.1 Arithmetic Mean (A.M)
The arithmetic mean is the ratio of the sum of all the observations to the total
number of observations.
8.5.1. (a) Arithmetic mean for ungrouped data
If there are n observations , ,, , x x x xn1 2 3
g for the variable x then their arithmetic
mean is denoted by x and it is given by x =n
x x x xn1 2 3
g+ + + +.
In Mathematics, the symbol
in Greek letter R , is called Sigma.
This notation is used to represent the
summation. With this symbol, the sum of
, ,, , x x x xn1 2 3g
is denoted as xi
i
n
1=
/ or simply
as xiR . Then we have x n
x iR= .
Note: Arithmetic mean is also known
as Average or Mean.
Example 8.12
The marks obtained by 10 students in a test are 15, 75, 33, 67, 76, 54, 39, 12, 78,
11. Find the arithmetic mean.
Solution
Here, the number of observations, n = 10
A. M = x =10
15 75 33 67 76 54 39 12 78 11+ + + + + + + + +
x =10
460 = 46.
More about Notation : Σ
k k 1
3
=
/ = 1 + 2 + 3 = 6
n
n 3
6
=
/ = 3 + 4 + 5 + 6 = 18
n2n 2
4
=
/ = 2 × 2 + 2 × 3 + 2 × 4 = 18
5k 1
3
=
/ = 5k 1
3
=
/ × k 0
= 5 × 10 + 5 × 20 + 5 × 30
= 5 + 5 + 5 = 15
1k
2
4
K
-
=
^ h/ = (2 – 1) + (3 – 1) + (4 – 1) = 6

8/2/2019 Std08 Maths EM 2
http://slidepdf.com/reader/full/std08-maths-em-2 130/152
268
Chapter 8
Example 8.13
If the average of the values 9, 6, 7, 8, 5 and x is 8. Find the value of x.
Solution
Here, the given values are 9, 6, 7, 8, 5 and x, also n = 6.
By formula, A.M. = x =
x
6
9 6 7 8 5+ + + + +
=
x
6
35 +
By data, x = 8
So, x6
35 + = 8
i.e. 35 + x = 48
x = 48 – 35 = 13.
Example 8.14The average height of 10 students in a class was calculated as 166 cm. On
verification it was found that one reading was wrongly recorded as 160 cm instead of
150 cm. Find the correct mean height.Solution
Here, x = 166 cm and n= 10
We have x =n xR = x
10
R
i.e. 166 = x10
R or Σ x = 1660
The incorrect Σ x = 1660
The correct Σ x = incorrect Σ x – the wrong value + correct value
= 1660 – 160 + 150 = 1650Hence, the correct A.M. =
10
1650 = 165 cm.
8.5.1 (b) Arithmetic mean for grouped data
Arithmetic mean for grouped data can be obtained in two methods which are
(i) Direct Method and (ii) Assumed Mean Method
(i) To calculate Arithmetic Mean (Direct Method)
Suppose we have the following frequency distribution
Variable x1
x2
x3 g x
n
Frequency f 1
f 2
f 3 g
f n
Then this table is to be interpreted in the following manner:
The value : x1 occurs f 1 times
x2
occurs f 2
times
x3
occurs f 3 times
ggggg
ggggg
xn
occurs f n
times.
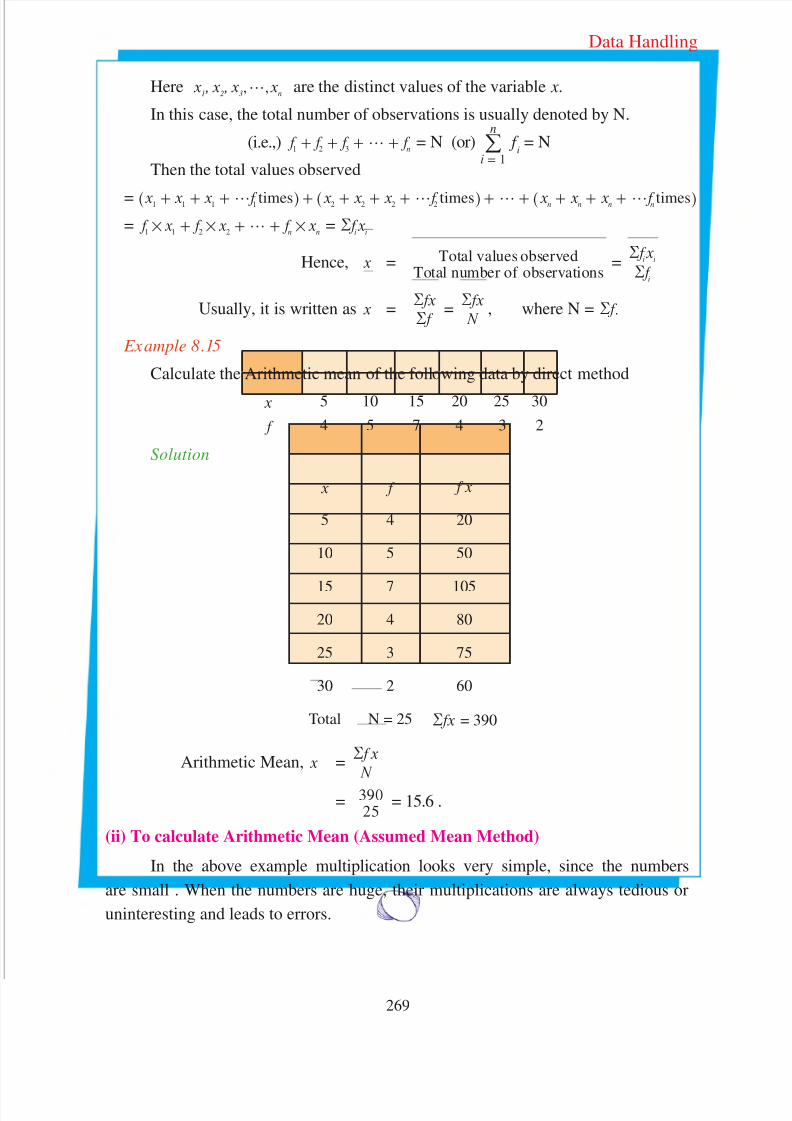
8/2/2019 Std08 Maths EM 2
http://slidepdf.com/reader/full/std08-maths-em-2 131/152
269
Data Handling
Here , ,, , x x x xn1 2 3
g are the distinct values of the variable x.
In this case, the total number of observations is usually denoted by N.
(i.e.,) f f f f n1 2 3
g+ + + + = N (or)i
n
1=
/ f i= N
Then the total values observed
= x x x f x x x f x x x f times times timesn n n n1 1 1 1 2 2 2 2g g g g
+ + + + + + + + + + + +^ ^ ^h h h
= f x f x f xn n1 1 2 2# # #g+ + + = f x
i iR
Hence, x =Total number of observations
Total values observed = f
f x
i
i i
R
R
Usually, it is written as x = f
fx
R
R=
N
fxR, where N = . f R
Example 8.15
Calculate the Arithmetic mean of the following data by direct method
x 5 10 15 20 25 30
f 4 5 7 4 3 2
Solution
x f f x
5 4 20
10 5 50
15 7 105
20 4 80
25 3 75
30 2 60
Total N = 25 fxR = 390
Arithmetic Mean, x = N
f xR
=25
390 = 15.6 .
(ii) To calculate Arithmetic Mean (Assumed Mean Method)
In the above example multiplication looks very simple, since the numbers
are small . When the numbers are huge, their multiplications are always tedious or
uninteresting and leads to errors.

8/2/2019 Std08 Maths EM 2
http://slidepdf.com/reader/full/std08-maths-em-2 132/152
270
Chapter 8
To overcome this dif ficulty another simpler method is devised. In this method
we assume one of the values as mean (A). This assumed value A is known as assumed
mean. Then we calculate the deviation , , , ,d d d d , n1 2 3g of each of the variables
, , , , x x x xn1 2 3
g from the assumed mean A.
i.e. d x A1 1= - , d x A2 2= - , d x A3 3= - ,g,d x An n= -
Now, multiply , , , ,d d d d , n1 2 3g respectively by , , , , f f f f
n1 2 3g and add all these
values to get fd R . Now,
Arithmetic mean x = f
fd A
R
R+
x = fd
AN
R+ (Here A is assumed mean and N = f R )
Now, we can calculate the A.M. for the above problem (example 8.15) by
assumed mean method.
Take the assumed mean A = 15
x f d = x – A f d
5 4 – 10 – 40
10 5 – 5 – 25
15 7 0 0
20 4 5 20
25 3 10 30
30 2 15 30
Total N = 25 fd R = 15
Arithmetic Mean = x = N
fd A
R+
= 15+2515 = 15+
53 =
575 3+ =
578
= 15.6 .
8.5.2 Weighted Arithmetic Mean (W.A.M.)
Sometimes the variables are associated with various weights and inthose cases the A.M. can be calculated, such an arithmetic mean is known as
Weighted Arithmetic Mean (W.A.M.).
For example, let us assume that the variable x1 is associated with the weight
w1 , x2 is associated with the weight w2 etc. and finally, xn is associated with the weight
wn then
W. A. M. =w w w w
w x w x w x w x
n
n n
1 2 3
1 1 2 2 3 3
g
g
+ + + +
+ + + +=
wwxR
R

8/2/2019 Std08 Maths EM 2
http://slidepdf.com/reader/full/std08-maths-em-2 133/152
271
Data Handling
Example 8.16
Find the weighted A. M of the price for the following data:
Food stuff Quantity (in kg) wi
Price per kg (in ` ) xi
Rice 25 30
Sugar 12 30
Oil 8 70
Solution
Here the x-values are the price of the given food stuff and the weights associated
are the quantities (in Kg)
Then, the W.A.M =w w w w
w x w x w x w x
n
n n
1 2 3
1 1 2 2 3 3
g
g
+ + + +
+ + + +
=25 12 8
25 30 12 30 8 70# # #
+ ++ + =
451670
= ` 37.11 .
8.5.3 Median
Another measure of central tendency is the Median.
8.5.3 (a) To find Median for ungrouped data
The median is calculated as follows:
(i) Suppose there are an odd number of observations, write them in ascending
or descending order. Then the middle term is the Median.
For example: Consider thefi
ve observations 33, 35, 39, 40, 43. The middlemost value of these observation is 39. It is the Median of these observation.
(ii) Suppose there are an even number of observations, write them in
ascending or descending order. Then the average of the two middle terms
is the Median.
For example, the median of 33, 35, 39, 40, 43, 48 is2
39 40+ = 39.5.
Note: The Median is that value of the variable which is such that there are as many
observations above and below it.
Example 8.17 Find the median of 17, 15, 9, 13, 21, 7, 32.
Solution
Arrange the values in the ascending order as 7, 9, 13, 15, 17, 21,32,
Here, n = 7 (odd number)
Therefore, Median = Middle value
= n2
1 th+` j value =2
7 1 th+` j value = 4th value.
Hence, the median is 15.

8/2/2019 Std08 Maths EM 2
http://slidepdf.com/reader/full/std08-maths-em-2 134/152
272
Chapter 8
Example 8.18
A cricket player has taken the runs 13, 28, 61, 70, 4, 11, 33, 0, 71, 92. Find the
median.
Solution
Arrange the runs in ascending order as 0, 4, 11, 13, 28, 33, 61, 70, 71, 92.
Here n = 10 (even number).
There are two middle values 28 and 33.
∴ Median = Average of the two middle values
=2
28 33+ =2
61 = 30.5 .
8.5.3 (b) To find Median for grouped data
Cumulative frequency
Cumulative frequency of a class is nothing but the total frequency upto that
class.
Example 8.19
Find the median for marks of 50 students
Marks 20 27 34 43 58 65 89
Number of students 2 4 6 11 12 8 7
Solution
Marks ( x) Number of students ( f ) Cumulativefrequency
20 2 2
27 4 (2 + 4 = ) 6
34 6 (6 + 6 = ) 12
43 11 (11 + 12 = ) 23
58 12 (23 + 12 = ) 35
65 8 (35 + 8 = ) 43
89 7 (43 + 7 =) 50
Here, the total frequency, N = f R = 50
∴ 2N =
250 = 25.
The median is2N th
` j value = 25th value.
Now, 25th value occurs in the cummulative frequency 35, whose
corresponding marks is 58.
Hence, the median = 58.

8/2/2019 Std08 Maths EM 2
http://slidepdf.com/reader/full/std08-maths-em-2 135/152
273
Data Handling
8.5.4 Mode
Mode is also a measure of central tendency.
The Mode can be calculated as follows:
8.5.4 (a) To find Mode for ungrouped data (Discrete data)
If a set of individual observations are given, then the Mode is the value which
occurs most often.
Example 8.20
Find the mode of 2, 4, 5, 2, 1, 2, 3, 4, 4, 6, 2.
Solution
In the above example the number 2 occurs maximum number of times.
ie, 4 times. Hence mode = 2.
Example 8.21
Find the mode of 22, 25, 21, 22, 29, 25, 34, 37, 30, 22, 29, 25.
Solution
Here 22 occurs 3 times and 25 also occurs 3 times
` Both 22 and 25 are the modes for this data. We observe that there are two
modes for the given data.
Example 8.22
Find the mode of 15, 25, 35, 45, 55, 65,Solution
Each value occurs exactly one time in the series. Hence there is no mode for
this data.
8.5.4 (b) To find Mode for grouped data (Frequency distribution)
If the data are arranged in the form of a frequency table, the class corresponding
to the maximum frequency is called the modal class. The value of the variate of the
modal class is the mode.
Example: 8.23
Find the mode for the following frequency table
Wages (Rs) 250 300 350 400 450 500
Number of workers 10 15 16 12 11 13

8/2/2019 Std08 Maths EM 2
http://slidepdf.com/reader/full/std08-maths-em-2 136/152
274
Chapter 8
Solution
Wages ( ` ) Number of workers
250 10
300 15
350 16
400 12
450 11
500 13
We observe from the above table that the maximum frequency is 16. The value
of the variate (wage) corresponding to the maximum frequency 16 is 350. This is
the mode of the given data.
EXERCISE 8.3
I. Problems on Arithmetic Mean
1. Find the mean of 2, 4, 6, 8, 10 , 12, 14, 16.
2. If the average of the values 18, 41, x , 36, 31, 24, 37, 35, 27, 36, is 31. Find the
value of x.
3. If in a class of 20 students, 5 students have scored 76 marks, 7 students have
scored 77 marks and 8 students have scored 78 marks, then compute the mean
of the class.
4. The average height of 20 students in a class was calculated as 160 cm. On
verification it was found that one reading was wrongly recorded as 132 cm
instead of 152 cm. Find the correct mean height.
Unimodal Bimodal Trimodal Multimodal
If there is
only one mode in
a given series, then
it is called
Unimodal.
If there are
two modes in a
given series, then it
is called
Bimodal.
If there are
three modes in a
given series, then
it is called
Trimodal.
If there are
more than three
modes in the
series it is called
Multimodal.
Example :
10, 15, 20, 25, 15,
18, 12, 15.Here, Mode is 15.
Example:
20, 25, 30, 30,
15, 10, 25.Here 25, 30 are
Bimodal.
Example:
60, 40, 85, 30, 85,
45, 80, 80, 55, 50,60. Here 60, 80,
85 are Trimodal.
Example:
1, 2, 3, 8, 5, 4, 5,
3, 4, 2, 3, 1, 3, 5,2, 7, 4, 1. Here
1, 2, 3, 4, 5 are
Multimodal.
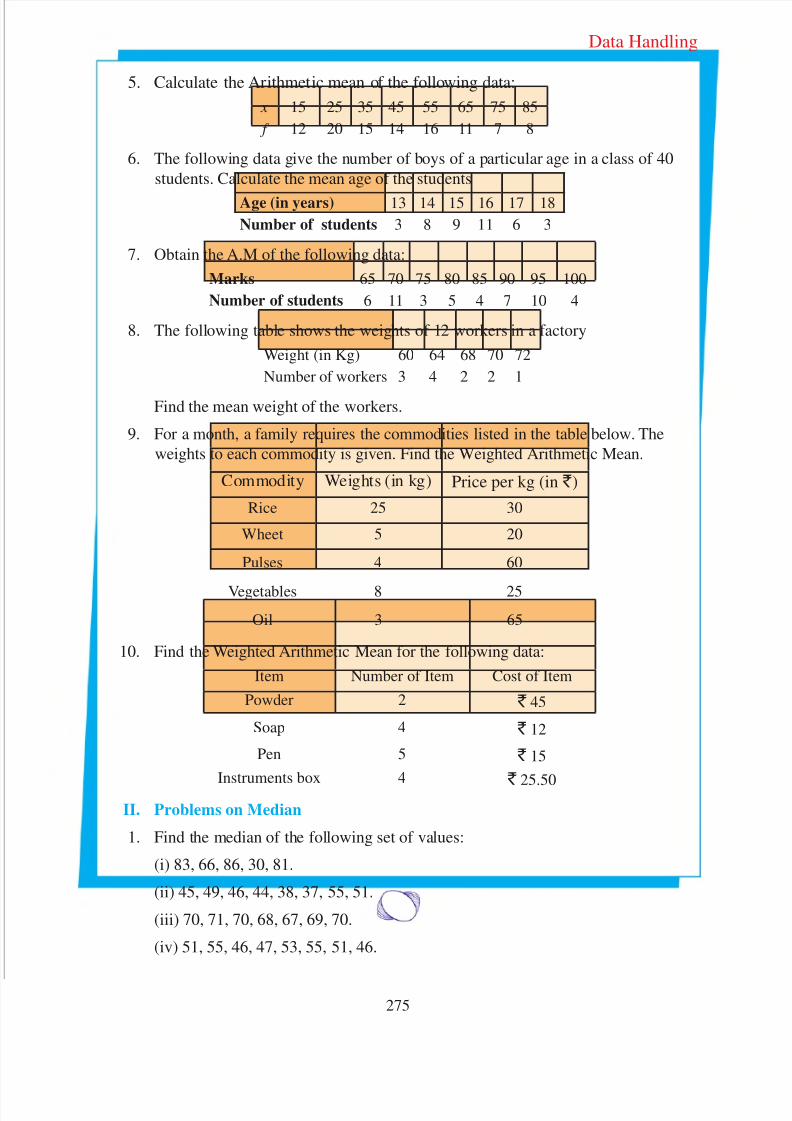
8/2/2019 Std08 Maths EM 2
http://slidepdf.com/reader/full/std08-maths-em-2 137/152
275
Data Handling
5. Calculate the Arithmetic mean of the following data:
x 15 25 35 45 55 65 75 85
f 12 20 15 14 16 11 7 8
6. The following data give the number of boys of a particular age in a class of 40
students. Calculate the mean age of the students
Age (in years) 13 14 15 16 17 18
Number of students 3 8 9 11 6 3
7. Obtain the A.M of the following data:
Marks 65 70 75 80 85 90 95 100
Number of students 6 11 3 5 4 7 10 4
8. The following table shows the weights of 12 workers in a factory
Weight (in Kg) 60 64 68 70 72
Number of workers 3 4 2 2 1
Find the mean weight of the workers.
9. For a month, a family requires the commodities listed in the table below. The
weights to each commodity is given. Find the Weighted Arithmetic Mean.
Commodity Weights (in kg) Price per kg (in ` )
Rice 25 30
Wheet 5 20
Pulses 4 60
Vegetables 8 25
Oil 3 65
10. Find the Weighted Arithmetic Mean for the following data:
Item Number of Item Cost of Item
Powder 2 ` 45
Soap 4 ` 12
Pen 5 ` 15
Instruments box 4`
25.50
II. Problems on Median
1. Find the median of the following set of values:
(i) 83, 66, 86, 30, 81.
(ii) 45, 49, 46, 44, 38, 37, 55, 51.
(iii) 70, 71, 70, 68, 67, 69, 70.
(iv) 51, 55, 46, 47, 53, 55, 51, 46.

8/2/2019 Std08 Maths EM 2
http://slidepdf.com/reader/full/std08-maths-em-2 138/152
276
Chapter 8
2. Find the median for the following data:
x 1 2 3 4 5 6 7 8
f 9 11 5 6 8 1 3 7
3. The height ( in cm) of 50 students in a particular class are given below:
Height (in cm) 156 155 154 153 152 151 150Number of students 8 4 6 10 12 3 7
Find the median.
4. The hearts of 60 patients were examined through X-ray and the observations
obtained are given below:
Diameter of heart (in mm) 130 131 132 133 134 135
Number of patients 7 9 15 12 6 11
Find the median.
5. The salary of 43 employees are given in the following table. Find the median.
Salary (in ` ) 4000 5500 6000 8250 10,000 17,000 25,000
Number of employees 7 5 4 3 13 8 3
III. Problems on Mode
1. Find the mode of the following data:
i) 74, 81, 62, 58, 77, 74. iii) 43, 36, 27, 25, 36, 66, 20, 25.
ii) 55, 51, 62, 71, 50, 32. vi) 24, 20, 27, 32, 20, 28, 20.
2. Find the mode for the following frequency table:
x 5 10 15 20 25 30
f 14 25 37 16 8 5
3. Find the mode for the following table:
Temperature in °c 29 32.4 34.6 36.9 38.7 40
Number of days 7 2 6 4 8 3
4. The demand of different shirt sizes, as obtained by a survey, is given below.
Size 38 39 40 41 42 43 44
Number of persons (wearing it) 27 40 51 16 14 8 6
Calculate the Mode.
IV. Problems on Mean, Median and Mode
1. Find the mean, median and mode for the following frequency table:
x 10 20 25 30 37 55
f 5 12 14 15 10 4

8/2/2019 Std08 Maths EM 2
http://slidepdf.com/reader/full/std08-maths-em-2 139/152
277
Data Handling
2. The age of the employees of a company are given below.
Age (in years) 19 21 23 25 27 29 31
Number of persons 13 15 20 18 16 17 13
Find the mean, median and mode.
3. The following table shows the weights of 20 students.Weight (in kg) 47 50 53 56 60
Number of students 4 3 7 2 4
Calculate the mean, median and mode.
Histogram and frequency polygon are the two types of graphical
representations of a frequency distribution.
In the graphical representation of histogram and frequency polygon the
class-intervals are taken along the X-axis and the corresponding frequencies
are taken along the Y-axis.
In a histogram the rectangles are placed continuously side by side with no
gap between the adjacent rectangles.
The polygon obtained by joining the mid points of the top of the adjacent
rectangles of a histogram and also the midpoints of the preceding and
succeeding class intervals is known as a frequency polygon.
The central angle of a component = 360Total value
Value of the component# c; E
Arthmetic mean is the ratio of the sum of all the observations to the total
number of observations.
Formula for finding A.M.
(i) x =n xR (ii) x =
f fx
RR
(iii) x = A + f
fd
R
Rwhen A is the assumed mean and d = x – A.
The weighted Arithmetic mean (W.A.M.) =w
w x
i
i iR
R.
The median is that value of the variable which is such that there are as
many observations above and below it.
Mode is that value which occurs most frequently in a distribution.

8/2/2019 Std08 Maths EM 2
http://slidepdf.com/reader/full/std08-maths-em-2 140/152
278
Answers
ANSWERS
Chapter 1
Exercise 1.1
1. i) A ii) C iii) B iv) D v) A
2. i) Commutative ii) Associative iii) Commutative
iv) Additive identity v) Additive inverse
3. i) Commutative ii) Multiplicative identity
iii) Multiplicative Inverse iv) Associative
v) Distributive property of multiplication over addition
6. i)252
505- ii)14
1-
Exercise 1.2
1. i)1513 ii)
8423 iii)
176117 iv)
2453
2. i)7031 ,
14051 ii) ,
110111
220243 iii) ,
3017
209 iv) ,
241
121-
3. i) , ,83
165
329 ii) , ,
6041
12083
240167
iii) , ,127
81
485- iv) , ,
485
9611
19223
Note: In the above probelms 1, 2 and 3; the given answes are one of the possibilities.
Exercise 1.3
1. i) A ii) B iii) C iv) A v) B
2. i) 2247 ii)
1716 iii)
3211 iv) 1
187 v)
198-
vi) 4 3223 vii) 4 viii) 5 6041-
Exercise 1.4
1. i) C ii) B iii) A iv) D v) C
vi) A vii) B viii) B ix) B x) D
2. i)64
1- ii)641 iii) 625 iv)
6752 v)
3
122
vi) 54 vii) 1 viii) 256 pq ix) 231 x) 531

8/2/2019 Std08 Maths EM 2
http://slidepdf.com/reader/full/std08-maths-em-2 141/152
279
Answers
3. i) 5 ii)21 iii) 29 iv) 1 v) 5
161 vi)
7
621
4. i) m = 2 ii) m = 3 iii) m = 3 iv) m = 3 v) m = – 6 vi) m =41
5. a) i) 4 ii) 4 iii) 256 iv) 64 v)41
5. b) i) 4 ii) 2187 iii) 9 iv) 6561 v)91
Exercise 1.5
1. (ii), (iii), (v) are not perfect squares.
2. i) 4 ii) 9 iii) 1 iv) 5 v) 4
3. i) 64 ii) 16 iii) 81
4. i) 1 + 3 + 5 + 7 + 9 +11 + 13 ii) 1 + 3 + 5 + 7 + 9 + 11 + 13 + 15 + 17
iii) 1 + 3 + 5 + 7 + 9 iv) 1 + 3 + 5 + 7 + 9 + 11 + 13 + 15 + 17 + 19 + 21
5. i)649 ii)
10049 iii)
251 iv)
94 v)
1600961
6. i) 9 ii) 49 iii) 0.09 iv)94 v)
169 vi) 0.36
7. a) 42 + 52 + 202 = 212 b) 10000200001
52 + 62 + 302 = 312 100000020000001
6
2
+ 7
2
+ 42
2
= 43
2
Exercise 1.6
1. i) 12 ii) 10 iii) 27 iv) 385
2. i)83 ii)
41 iii) 7 iv) 4
3. i) 48 ii) 67 iii) 59 iv) 23 v) 57
vi) 37 vii) 76 viii) 89 ix) 24 x) 56
4. i) 27 ii) 20 iii) 42 iv) 64 v) 88
vi) 98 vi) 77 viii) 96 ix) 23 x) 90
5. i) 1.6 ii) 2.7 iii) 7.2 iv) 6.5 v) 5.6
vi) 0.54 vii) 3.4 viii) 0.043
6. i) 2 ii) 53 iii) 1 iv) 41 v) 31
7. i) 4 ii) 14 iii) 4 iv) 24 v) 149

8/2/2019 Std08 Maths EM 2
http://slidepdf.com/reader/full/std08-maths-em-2 142/152
280
Answers
8. i) 1.41 ii) 2.24 iii) 0.13 iv) 0.94 v) 1.04
9. 21 m 10. i)5615 ii)
5946 iii)
4223 iv) 1
7613
Exercise 1.7
1. i) A ii) C iii) B iv) A v) B
vi) D vii) A viii) A ix) A x) D
2. ii) 216 iii) 729 v) 1000
3. i) 128 ii) 100 v) 72 vi) 625
4. i) 3 ii) 2 iii) 5 iv) 3 v) 11 vi) 5
5. i) 3 ii) 2 iii) 3 iv) 5 v) 10
6. i) 9 ii) 7 iii) 8 iv) 0.4 v) 0.6
vi) 1.75 vii) – 1.1 viii) – 30
7. 2.7 cm
Exercise 1.8
1. i) 12.57 ii) 25.42 kg iii) 39.93 m
iv) 56.60 m v) 41.06 m vi) 729.94 km
2. i) 0.052 m ii) 3.533 km iii) 58.294 l
iv) 0.133 gm v) 365.301 vi) 100.123
3. i) 250 ii) 150 iii) 6800 iv) 10,000
v) 36 lakhs vi) 104 crores
4. i) 22 ii) 777 iii) 402 iv) 306 v) 300 vi) 10,000
Exercise 1.9
1. i) 25, 20, 15 ii) 6, 8, 10 iii) 63, 56, 49
iv) 7.7, 8.8, 9.9 v) 15, 21, 28 vi) 34, 55, 89
vii) 125, 216, 343

8/2/2019 Std08 Maths EM 2
http://slidepdf.com/reader/full/std08-maths-em-2 143/152
281
Answers
2. a) 11 jumps b) 5 jumps
3. a) 10 rows of apples = 55 apples b) 210 apples
Rows 1 2 3 4 5 6 7 8 9
Total
apples 1 3 6 10 15 21 28 36 45
Chapter 2
Exercise 2.1
1. i) C ii) B iii) A iv) A v) D
vi) D vii) C
2.
Sl. No. Terms Coeff ficients of variables
i)3 abc
– 5 ca
3
– 5
ii) 1, x, y2 constant term, 1, 1
iii)
3 x2 y2
– 3 xyz
y2
3
3
1
iv)
– 7
2 pq
75- qr
qp
constant term
2
75-
1
v)
x
2
y
2
-
– 0.3 xy
21
21-
– 0.3
3. Monomials : 3 x2
Binomials : 3 x + 2, x5 – 7, a2b + b2c , 2l + 2m.
Trinomials : x2 – 4 x + 2, x2 + 3 xy + y2, s2 + 3st – 2t 2
4. i) 5 x2 – x – 2 ii) 2 x2 + x – 2 iii) – 3t 2 – 2t – 3
iv) 0 v) 2 (a2 + b2 + c2 + ab + bc + ca)

8/2/2019 Std08 Maths EM 2
http://slidepdf.com/reader/full/std08-maths-em-2 144/152
282
Answers
5. i) a ii) – 4 x – 18 y iii) 5ab – 7bc + 13ca
iv) – x2 + 5 x2 + 3 x + 1 v) 5 x2 y – 9 xy – 7 x + 12 y + 25
6. i) 7, 5 ii) 13, – 1 iii) 7, – 1 iv) 8, 1 v) 8, – 2
Exercise 2.2
1. i) 21 x ii) – 21 xy iii) – 15a2b iv) – 20a3 v)32 x7 vi) x3 y3
vii) x4 y7 viii) a2b2c2 ix) x3 y2 z2 x) a3b3c5
2.
First Monomial "
Second Monomial .2 x – 3 y 4 x2 – 5 xy 7 x2 y – 6 x2 y2
2 x 4 x 2
– 6 xy 8 x3
– 10 x2
y 14 x3
y – 12 x3
y2
– 3 y – 6 xy 9 y2 – 12 x2 y 15 xy2 – 21 x2 y2 18 x3 y3
4 x2 8 x3 – 12 x2 y 16 x4 – 20 x3 y 28 x4 y – 24 x4 y2
– 5 xy – 10 x2 y 15 xy2 – 20 x3 y 25 x2 y2 35 x3 y2 30 x3 y3
7 x2 y 14 x3 y – 21 x2 y2 28 x4 y – 35 x3 y2 49 x4 y2 – 42 x4 y3
– 6 x2 y2 – 12 x3 y2 18 x2 y3 – 24 x4 y2 30 x3 y3 – 42 x4 y3 36 x4 y4
3. i) 30a7 ii) 72 xyz iii) a2b2c2 iv) – 72m7 v) x3 y4 z2
vi) l
2
m
3
n
4
vii) – 30 p
3
q
4. i) 8a23 ii) – 2 x3 – 3 x + 20 iii) 3 x2 + 8 xy – 3 y2 iv) 12 x2– x–6
iv)4
5- a3 b3
5. i) 2a3 – 3a2b – 2ab2 + 3b3 ii) 2 x3 + x2 y – xy2 + 3 y3
iii) x2 + 2 xy + y2 – z2 iv) a3 + 3a2b + 3ab2 + b3 v) m3 – n3
6. i) 2 ( x2 – 2 xy + yz – xz – y2) ii) 17a2 + 14ab – 21ac
Exercise 2.3
1. i) C ii) D iii) B iv) D v) A vi) B
2. i) x2 + 6 x + 9 ii) 4m2 + 12m + 9 iii) 4 x2 – 20 x + 25
iv) a2 – 2 +a
12
v) 9 x2 – 4 vi) 25a2 – 30 ab + 9b2
vii) 4l2 – 9m2 viii)169 – x2 ix)
x y
1 12 2
- x) 9991

8/2/2019 Std08 Maths EM 2
http://slidepdf.com/reader/full/std08-maths-em-2 145/152
283
Answers
3. i) x2 + 11 x + 28 ii) 25 x2 + 35 x + 12 iii) 49 x2 – 9 y2
iv) 64 x2 – 56 x + 10 v) 4m2 + 14 mn + 12n2 vi) x2 y2 – 5 xy + 6
vii) a 2 + xy
x y+c ma + xy
1 viii) 4 + 2 x – 2 y – xy
4. i) p2 – 2 pq + q2 ii) a2 – 10a + 25 iii) 9 x2 + 30 x + 25
iv) 25 x2 – 40 x + 16 v) 49 x2 + 42 xy + 9 y2 vi) 100m2 – 180mn + 81n2
vii) 0.16a2 – 0.4ab + 0.25 b2 viii) x2 – 2 + x
12
ix) x2 – xy
3+
y
9
2
x) 0.08
5. i) 10609 ii) 2304 iii) 2916 iv) 8464 v) 996004 vi) 2491
vii) 9984 viii) 896 ix) 6399 x) 7.84 xi) 84 xii) 95.06
7. ab =49 , a2 + b2 = 4
21 8. i) 80, 16, ii) 196, 196
9. 625
10. x3 + (a + b + c) x2 + (ab + bc + ca) x + abc.
Exercise 2.4
1. i) C ii) D iii) A iv) C v) B
2. i) 3 ( x – 15) ii) 7 ( x – 2 y) iii) 5 a (a + 7)
iv) 4 y (5 y2 – 3) v) 5ab (3a + 7) vi) pq (1 – r )
vii) 9m (2m2 – 5n2) viii) 17 (l2 + 5m2) ix) 3 x2 (2 xy – 4 y + 5 x2)
x) 2a2b (a3b2 – 7b + 2a)
3. i) a (2b + 3) + 2b (or) 2b (a + 1) + 3a vi) (a + b) (ax + by + c)
ii) (3 x – 2) (2 y – 3) vii) (ax – b) ( x2 + 1)
iii) ( x + y) (3 y + 2) viii) ( x – y) (m – n)
iv) (5b – x2) (3b – 1) ix) (2m2 + 3) (m – 1)
v) (ax + y) (ax + b) x) (a + 11b) (a + 1)
4. i) (a + 7)2 ii) ( x – 6)2 iii) (2 p + 5q) (2 p – 5q) iv) (5 x – 2 y)2
v) (13m + 25n) (13m – 25n) vi) x31 2
+` j

8/2/2019 Std08 Maths EM 2
http://slidepdf.com/reader/full/std08-maths-em-2 146/152
284
Answers
vii) (11a + 7b)2 viii) 3 x ( x + 5) ( x – 5) ix) (6 + 7 x)(6 –7 x)
x) (1 – 3 x) 2
5. i) ( x + 3) ( x + 4) ii) ( p – 2) ( p – 4) iii) (m – 7) (m + 3)
iv) ( x – 9) ( x – 5) v) ( x – 18) ( x – 6) vi) (a + 12) (a + 1)
vii) ( x – 2) ( x – 3) viii) ( x – 2 y) ( x – 12 y)
ix) (m – 24) (m + 3) x) ( x – 22) ( x – 6)
Exercise 2.5
1. i) x
2
3
ii) – 6 y iii)3
2 a2b2c2 iv) 7m – 6
v)3
5 xy vi) 9l2 m3 n5
2. i) 5 y2 – 4 y + 3 ii) 3 x3 – 5 x2 – 7 iii)2
5 x2 – 2 x +2
3
iv) x + y – 7 v) 8 x3 – 4 y2 + 3 xz3.
3. i) ( x + 5) ii) (a + 12) iii) ( x – 2) iv) (5m – 2n)
v) (2a + 3b) vi) (a2 + b2) (a + b)
Exercise 2.6
1. i) x = 6 ii) y = –7 iii) y = 4 iv) x = 12 v) y = – 77
vi) x = – 6 vii) x = 2 viii) x = 12 ix) x = 6 x) m =7
6
2. i) 18 ii) 29, 30, 31 iii) l = 19, b = 11 iv) 12, 48
v) 12, 9 vi) 45, 27 vii) 4000 viii)5
3
ix) Nandhini’s present age is 15 years and Mary’s present age is 45 years.
x) Rs.3,00,000
Chapter 3
Exercise 3.1
1. i) D ii) C iii) B iv) B v) A
2. i) 200 litres ii) 20,000 km iii) ` 1,550
iv) 50 minutes v) ` 50
3. ` 40,000 4. 3750

8/2/2019 Std08 Maths EM 2
http://slidepdf.com/reader/full/std08-maths-em-2 147/152
285
Answers
5. i) 90% ii) 94% iii) 98% iv) 88% v) 95% vi) 93%
6. 5 7. ` 9,000 8. ` 1,020
9. 180, 1320 10. 6 kgs.
11. i) 26,100 ii) 5,220 12. 25%, ` 8,600
13. She scored better in maths by 20% 14. ` 6,250 15. 20%
Exercise 3.2
1. i) ` 7490 ii) ` 500 iii) ` 9,000 iv) ` 2,246 v) ` 6,57,500
2. i) Profit ` 64, Profit % = 20%
ii) Profit ` 200, Profit % = 8%
iii) Loss ` 19, Loss % = 5%
iv) S.P. = ` 38, Loss % = 5%
v) S.P. = ` 5,500, Profit % = 10%.
3. i) ` 787.50 ii) ` 1,260 iii) ` 2,835
4. ` 1,200 5. 333
1 % 6. 25%
7. ` 22,80,000 8. ` 34,40,000
9. 1191 % 10. Overall gain ` 113.68
Exercise 3.3
1. i) A ii) D iii) B iv) B v) C
2. ` 360 3. ` 8,000 4. ` 49,220
5. ` 18,433.40 6. ` 4,950 7. ` 13,000
8. 33% 9. ` 9,832.50 10. 20%
11. ` 1,310.40 per shirt
12. i) Amount of discount = ` 460; S.P. = ` 1,840
ii) Amount of discount = ` 35; Rate of discount = 25%
iii) M.P. = ` 20,000; Amount of discount = ` 4,000
iv) Rate of discount = 5%; Amount of discount = ` 725
v) Amount of discount = ` 403; S.P. = ` 2,821

8/2/2019 Std08 Maths EM 2
http://slidepdf.com/reader/full/std08-maths-em-2 148/152
286
Answers
Exercise 3.4
1. i) A = ` 1,157.63, Interest = ` 157.63
ii) A = ` 4,840, Interest = ` 840
iii) A = ` 22,869, Interest = ` 4,869
2. ` 2,125
3. i) ` 88,200 ii) ` 4,410
4. A = ` 27,783, C.I. = ` 3,783 5. ` 9,826
6. C.I. = ` 1,951 7. ` 20,000 8. ` 36,659.70
9. i) ` 92,400 ii) ` 92,610, Difference = ` 210
10. ` 6 11. ` 25 12. ` 2,000
13. Suja pays more interest of ` 924.10 14. P = ` 1,25,000
15. 2 years 16. 10% 17. 10%
Exercise 3.5
1. 2,205 2. ` 2,55,150 3. ` 46,000
4. 5,31,616.25 5. 5,415 6. ` 20,000
7. 10,000
Exercise 3.6
1. ` 27,000 2. ` 86,250 3. ` 10,800
4. ` 200 5. 9% 6. ` 1,250
7. ` 19,404 8. E.M.I. = ` 875, Total Amount = ` 8,750
Exercise 3.7
1. 24 days 2. 10; 1250 3. 36 compositors 4. 15 Workers
5. 24 days 6. ` 192
Exercise 3.8
1. 3 days 2. 30 days 3. 2 days 4. 12 minutes
5. A = ` 360, B = ` 240 6. 6 days 7. 1 hour

8/2/2019 Std08 Maths EM 2
http://slidepdf.com/reader/full/std08-maths-em-2 149/152
287
Answers
Chapter 4
Exercise 4.1
1. i) C ii) B iii) A iv) D v) A
vi) D vii) B viii) C ix) A x) C
2. i) 180 cm, 1925 cm2 ii) 54 cm, 173.25 cm2
iii) 32.4 m, 62.37 m2 iv) 25.2 m, 37.73 m2
3. i) 7.2 cm, 3.08 cm 2 ii) 144 cm, 1232 cm2
iii) 216 cm, 2772 cm2 iv) 288m, 4928 m2
4. i) 350 cm, 7546 cm 2 ii) 250 cm, 3850 cm2
iii) 150 m, 1386 m2 iv) 100 m, 616 m2
5. 77 cm2, 38.5 cm2 6. Rs.540
Exercise 4.2
1. i) 32 cm ii) 40 cm iii) 32.6 cm
iv) 40 cm v) 98 cm
2. i) 124 cm2
ii) 25 m2
iii) 273 cm2
iv) 49.14 cm2
v) 10.40m2
3. i) 24 m2 ii) 284 cm2 iii) 308 cm2
iv) 10.5 cm2 v) 135.625 cm2 vi) 6.125 cm2
4. 770 cm2 5. 1286 m2 6. 9384 m2
7. 9.71 cm2 8. 203 cm2 9. 378 cm2
10. i) 15,100 m2, ii) 550000 m2
Chapter 5
Revision Exercise
1. y° = 52° 2. x° = 40° 3. A+ = 110° 4. x° = 40°
5. x° = 105° 6. i) Corresponding angle, ii) Alternate angle, iii) Coresponding angle

8/2/2019 Std08 Maths EM 2
http://slidepdf.com/reader/full/std08-maths-em-2 150/152
Answers
Exercise 5.1
1. i) B ii) A iii) A iv) B v) A
2. x° = 65° 3. x° = 42° 5. i) x° = 58°, y° = 108° ii) x° = 30°, y° = 30°
iii) x° = 42°, y° = 40° 6. x° = 153°, y° = 132°, z° = 53°.
Exercise 5.2
1.i)C ii) C iii) C iv) C v) B vi) A vii) B
2. x° = 66°, y° = 132° 3. x° = 70°
4. x° = 15°, y° = 55° 7. x° = 30°, y° = 60°, z° = 60°
Exercise 5.3
1.i)D ii) C iii) A iv) B
2.The shortest side is BC. 3. QR = 26 cm 4.It forms a right angled triangle
5.QR = 5 cm 6. x = 9 m 7.Altitude x = 5 3 cm
8.Yes 9. 2 51 ft
Exercise 5.4
1. i) D ii) D iii) C 2. radius = 5 cm.
Chapter 7
Exercise 7.1
2. i) Quadrant I ii) Quadrant II iii) Quadrant III
iv) Quadrant IV v) on the y-axis vi) on the x-axis
vii) on the x-axis viii) Quadrant III ix) Quadrant I
x) Quadrant II
3.
Point Quadrants/Axes Coordinates
A On the y - axis (0,4)B Quadrant II (-3,2)
C On the x-axis (-5,0)
D Quadrant III (-4,-6)
E On the y-axis (0.-3)
F Quadrant IV (7,-1)
G On the x-axis (4,0)
H Quadrant I (6,3)
O The origin (0,0)
288

8/2/2019 Std08 Maths EM 2
http://slidepdf.com/reader/full/std08-maths-em-2 151/152
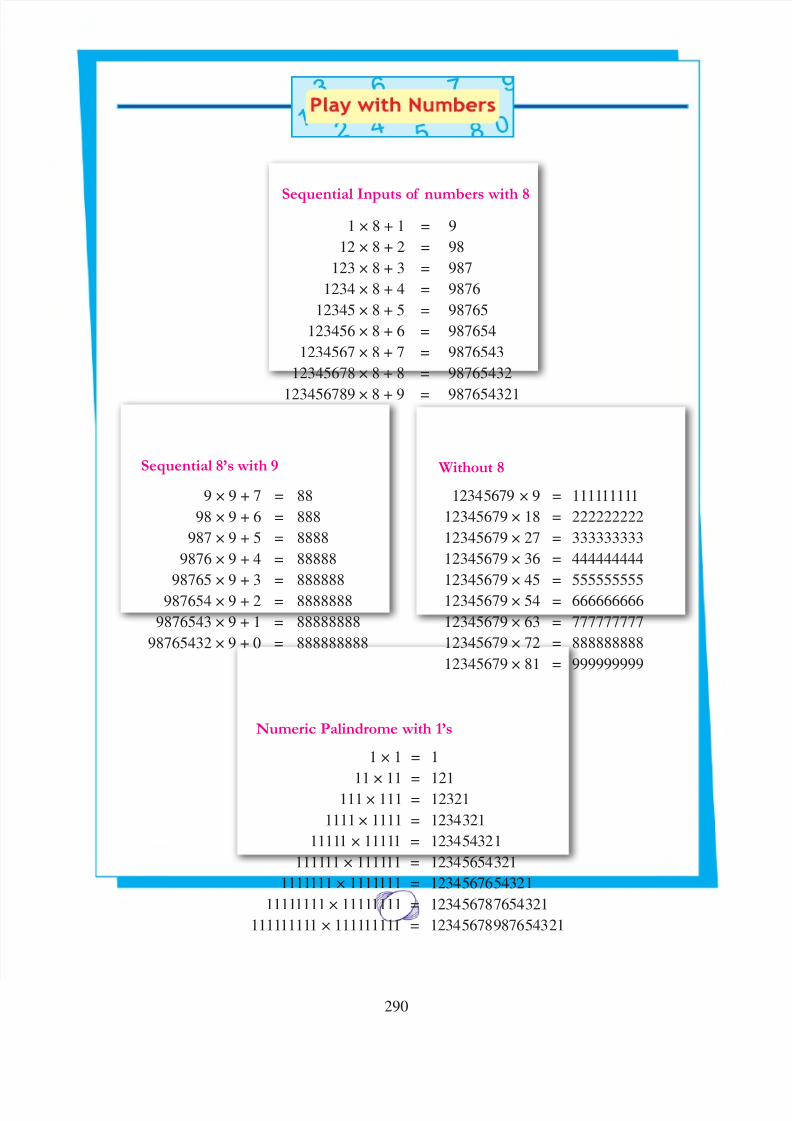
8/2/2019 Std08 Maths EM 2
http://slidepdf.com/reader/full/std08-maths-em-2 152/152
Sequential Inputs of numbers with 8
1 × 8 + 1 = 9
12 × 8 + 2 = 98
123 × 8 + 3 = 987
1234 × 8 + 4 = 9876
12345 × 8 + 5 = 98765
123456 × 8 + 6 = 987654
1234567 × 8 + 7 = 9876543
12345678 × 8 + 8 = 98765432
123456789 × 8 + 9 = 987654321
Sequential 8’s with 9
9 × 9 + 7 = 88
98 × 9 + 6 = 888
987 × 9 + 5 = 8888
9876 × 9 + 4 = 88888
98765 9 3 888888
Without 8
12345679 × 9 = 111111111
12345679 × 18 = 222222222
12345679 × 27 = 333333333
12345679 × 36 = 444444444
12345679 45 555555555