Embed Size (px)
Citation preview

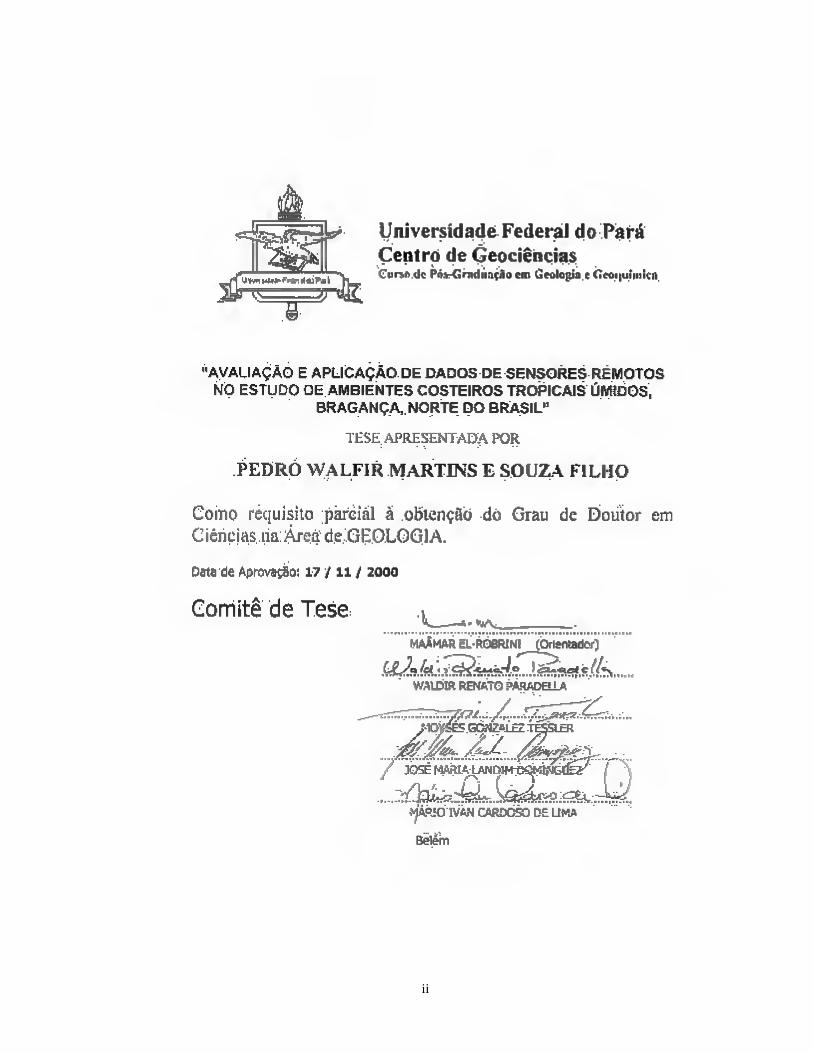
UNIVERSIDADE FEDERAL DO PARÁ CENTRO DE GEOCIÊNCIAS
CURSO DE PÓS-GRADUAÇÃO EM GEOLOGIA E GEOQUÍMICA
TESE DE DOUTORADO
"AVALIAÇÃO E APLICAÇÃO DE DADOS DE SENSORES REMOTOS NO ESTUDO DE AMBIENTES COSTEIROS
TROPICAIS ÚMIDOS, BRAGANÇA, NORTE DO BRASIL"
PEDRO WALFIR MARTINS E SOUZA FILHO
BELÉM 2000
ii
'y iiaiTa k
Universidade Federal do Pará
Centro de Geociências *• * " ^ '.**».• * * * * Cur>ò dc Pó.v-Onidiinçiio cm Geologia e (Tcoiiuimlcit.
"AVALIAÇÃO E APLICAÇÃO DE DADOS DE SENSORES REMOTOS NO ESTUDO OE AMBIENTES COSTEIROS TROPICAIS ÚMIDOS,
BRAGANÇA,. NORTE DO BRASIL"
TESE, APRESENTADA POR
PEDRO WALFIR MARTINS E SOUZA FILHO
Como requisito pareiál á oblençüò dó Grau dc Doutor em
Ciências na Área de GEOLOGIA.
Data de Aprovado; 17 /11/ 2000
Gomitê de Tese
MAAMAR EL-R06RÍNI (OrieníafloO
!L WAIDIR RENATO PÁRADELLA
^7/,./{... T1ÜY5E? GC*i2flL£Z TE^SLER
/ :OSÊ MAftlATAN DIHÍ^MÍWGÍÊ^
«ÃOJOTVÃN CARDOSO DE UMA
Belém

SOUZA FILHOs Pedro Wálíir Martins e. Avaliação e aplicação de dados de sensores remotos no estudo de ambientes^costeiros tropicais úmidos dominados por jnacromare. Belém,_Unlversidade Federal do Para. Centro de Geociencias, 2000. 219p.
Tese(Doutorado em Geologia) - Curso de Pós - Graduaçao em Geologia e Geoquímica, CG, UFPA, 2000
1.GE0M0RF0L0GIA 2.SENSORIAMENTO REMOTO 3.ZONA COSTEIRA 4.MANGUEZAIS 5.AMAZÔNIA I.EL-ROBRINI, Maamar, Orient. II.Título

Aos meus eternos amores Rosália, Pedro e Carolina
ii
AGRADECIMENTOS
Em primeiro lugar, eu gostaria de agradecer a todas as instituições que contribuíram e
viabilizaram em grande parte a realização desta tese, agradecendo a (o):
Curso de Pós-Graduação em Geologia e Geoquímica (CPGG), do Centro de Geociências
da Universidade Federal do Pará pela oportunidade de desenvolver a tese nesta instituição e pelos
auxílios financeiros para realização dos trabalhos de campo.
Coordenadoria de Observação da Terra do Instituto Nacional de Pesquisas Espaciais,
(OBT/INPE) pela doação de duas imagens TM do satélite Landsat-5 e pela utilização da infra-
estrutura para processamento digital das imagens.
Agência Espacial Canadense (CSA) pela doação de uma imagem do RADARSAT-1 no
âmbito do Programa GlobeSAR-2.
CAPES pela concessão da bolsa de doutorado que permitiu minha dedicação exclusiva a
este trabalho ao longo dos últimos 4 anos.
Campus Universitário de Bragança da Universidade Federal do Pará pelo apoio aos
trabalhos de campo realizados em Bragança.
Superintendência de Desenvolvimento da Amazônia (SUDAM) e Serviço Geológico do
Brasil (CPRM-SUREG-Belém) pela doação de duas imagens TM do satélite Landsat-5.
Instituto Brasileiro de Geografia e Estatístico (IBGE) pela utilização de seu laboratório de
geoprocessamento, onde foram impressas as imagens de satélite.
Não obstante, eu gostaria de mostrar minha gratidão às pessoas que não mediram esforços
para o êxito deste trabalho, como:
O Prof. Dr. Maâmar El-Robrini, primeiro, pela oportunidade de executar esta tese de
doutorado no CPGG e pela liberdade dada para elaboração do tema da pesquisa desenvolvida e
apoio para integração deste trabalho. Agradeço ao Prof. Maâmar pelas oportunidades de pesquisa
e amizade ao longo destes últimos dez anos.
O Dr. Waldir Renato Paradella, que desde o início desta tese tem motivado meu
aprendizado na área de sensoriamento remoto, orientando-me a respeito das diversas técnicas de
processamento digital de imagens, e acima de tudo a importância deste estudo em regiões
tropicais úmidas. Agradeço também pelo apoio dados às minhas frias estadias em São José dos
Campos, quando tive a oportunidade de conhecer um pouco de sua nobre filosofia de fazer
pesquisa em um país chamado Brasil.

iii
A Profa. Dra. Helenice Vital pela leitura crítica de todo o trabalho, sugestões para torná-lo
melhor e elogios e incentivos que me deram força para chegar ao fim desta jornada.
Os Membros da banca de exame de qualificação, Profs. Dr. Lauro Júlio Calliari, José
Maria Landim Dominguez e Werner Truckembrodt, bem como aos Profs. Drs. Moysés Gonzalez
Tessler e Mario Ivan Cardoso de Lima, que vieram compor o comitê de avaliação final dessa
tese, pelos comentários e importantes contribuições a esse trabalho.
O Prof. Dr. Basile Kotshoubey e Paulo Sérgio Gorayeb, coordenadores do CPGG, pela
incansável vontade de sempre tornar possível a viabilização dessa tese.
A Msc. Maria Carolina de Moraes que não mediu esforços para transformar em êxito
minhas missões quase impossíveis em São José dos Campos, para processar imagens orbitais.
A Dra. Maria Tereza Prost e Dr. Rubén José Lara pelos comentários e sugestões em
alguns artigos que compõe esta tese, incentivando-me sempre a continuar essa longa jornada.
O Técnico Afonso Quaresma, um amigo de campo, com o qual já percorri centenas de
quilômetros fazendo levantamentos geológicos de campo e perfis de praia.
Os colegas Ayrtom Ranieri, Dirlene Gomes, Alan Brunelli, Alexandre Santos, Eugênio
Frazão, e Leonardo Montalvão cuja colaboração nos trabalhos de campo e laboratório foram
imprescindíveis para a conclusão deste trabalho.
Os mestrandos Marivaldo Santos, Marcos Gleidson e Marcelo Moreno pela ajuda nos
trabalhos de campo e discussões a respeito da geologia costeira da região norte.
O doutorando e oceanógrafo Heitor Tozzi com quem tive a oportunidade de discutir o
rumo desta tese, a oceanografia geológica da área em estudo e acima de tudo a aplicabilidade dos
dados de perfis de praias no monitoramento costeiro.
Os Profs. Drs. Carlos Alberto Albuquerque e Carmem Pires Frazão pela revisão dos
inúmeros textos em inglês.
Os amigos Cadu e Rosemary com quem pude sempre contar nas horas difíceis, pois seus
ouvidos estavam sempre abertos para me ouvirem e seus corações sempre dispostos a me
confortarem.
A todas pessoas que tive a oportunidade de conhecer nestes últimos três anos na UFPA e
no INPE que tornaram esse trabalho possível de ser concluído.
Por fim, eu gostaria de agradecer a Deus, pelos pais que me deu, pelo amor e educação que
tive e por ter me dado a graça de conhecer Rosália, minha esposa; e dois presentes divinos, meu
filho Pedro e minha filha Carolina, que são minhas fontes constantes de inspiração e força
interior ao longo dessa jornada de aprendizagem no planeta Terra, chamada “vida”.

iv
“Quem me dera, ao menos uma vez, Explicar o que ninguém consegue entender:
Que o que aconteceu ainda está por vir E o futuro não é mais como era antigamente”
© 1986 Renato Russo

v
SUMÁRIO
DEDICATÓRIA AGRADECIMENTOS EPÍGRAFE SUMÁRIO LISTA DE ILUSTRAÇÕES LISTA DE TABELAS RESUMO ABSTRACT CAPÍTULO 1. INTRODUÇÃO 1.1. APRESENTAÇÃO E OBJETIVOS 1.2. SISTEMAS DE OBSERVAÇÃO COSTEIRA: O PAPEL DO SENSORIAMENTO REMOTO CAPÍTULO 2. GEOLOGIA COSTEIRA DA PLANÍCIE DE BRAGANÇA 2.1. TECTONIC CONTROL ON THE COASTAL ZONE GEOMORPHOLOGY OF THE NORTHEASTERN PARÁ STATE Abstract Introduction Geologic setting Data set and methods Different geologic sectors of northeastern Pará coastal zone Coastal plain geomorphology and tectonic framework Discussion Summary and conclusions Acknowledgement References Ø Situação do Artigo: publicado na Revista Brasileira de Geociências, v.30, n.3, p: 523-526. 2.2. GEOMORPHOLOGY OF THE BRAGANÇA COASTAL ZONE,
NORTHEASTERN PARÁ, BRAZIL Abstract Introduction
Regional Setting
Methods Geomorphologic classification of the coastal zone
Coastal plain Tidal mudflats (mangrove) Salt marshes Tidal sandflats Chenier sand ridges Coastal sand dunes Barrier-beach ridges Ebb-tidal delta
Estuarine plain
i ii iv v xi xv 1 2
3
4
8
13
14 14 14 15 16 17 18 20 21 21 22
24 24 24 25 26 26 26 27 28 28 29 30 30 31 31

vi
Alluvial plain Summary and conclusions Acknowledgement References Ø Situação do Artigo: publicado na Revista Brasileira de Geociências, v.30, n.3, p: 518-522. 2.3. AS VARIAÇÕES DO NÍVEL DO MAR E A ESTRATIGRAFIA DE SEQÜÊNCIAS DA PLANÍCIE COSTEIRA BRAGANTINA, NORDESTE DO PARÁ, BRASIL Abstract Introdução Metodologia Cenário regional Ambientes sedimentares, morfoestratigrafia e fácies sedimentares
Unidades morfoestratigráficas Planície aluvial
Planície de inundação Diques marginais Barras de canal
Planície estuarina Barra em pontal
Planície costeira Pântano salino Manguezal de supramaré Manguezal de intermaré Dunas costeiras Cheniers Planície arenosa Estirâncio
Fácies estratigráficas Areia e lama estuarina e de planície de maré Areia e lama de barra em pontal estuarina Areia marinha Sedimento basal
Influência das variações do nível do mar na sedimentação costeira Estratigrafia de seqüências da Planície Costeira Bragantina
Qual é o limite de seqüência basal dos depósitos quaternários da Planície Costeira Bragantina? Trato de sistemas e as sucessões estratigráficas S1, S2 e S3
Conclusões Agradecimentos Referências Ø Situação do Artigo: publicado no Boletim do Museu Paraense Emílio Goeldi, Série Ciências
da Terra, v. 10, p. 45-78.
31 32 33 33
35 35 35 36 37 39 39 39 39 42 42 42 42 43 43 43 44 44 44 45 45 46 46 46 46 47 47 50
51 51 53 56 56

vii
CAPÍTULO 3. TÉCNICAS DE SENSORIAMENTO REMOTO PARA
MAPEAMENTO DE ZONAS COSTEIRAS TROPICAIS ÚMIDAS DOMINADAS POR MANGUEZAIS
3.1 COASTAL ENVIRONMENT MAPPING AND LARGE-SCALE EVOLUTION OF
BRAGANÇA COASTAL PLAIN (NORTHERN BRAZIL) FROM SAR IMAGERIES
Abstract Introduction Study Area
Data set and Image Processing
Results and Discussions Mapping of coastal environments
Mangroves Salt marshes Chenier sand ridges Coastal dunes Barrier-beach ridges Shallow water morphology
Mapping of coastal land cover Spatial and temporal analysis of shoreline change
Conclusions Acknowledgement References Ø Situação do Artigo: minuta concluída 3.2. INTEGRATION OF REMOTELY SENSED DATA FOR COASTAL
GEOMORPHOLOGICAL MAPPING IN BRAGANÇA, AMAZON REGION, BRAZIL Summary Introduction Study Site and Geological Setting Remote Sensing Dataset Digital Image Processing
Geometric Correction
Digital Enhancement Techniques and Data Integration
SAR With Landsat TM Data Integration Conclusions Acknowledgements Reference Ø Situação do Artigo: minuta concluída
63
64 64 65 65 67 70 70 70 71 71 73 73 73 76 76 81 81 81
84 84 84 85 86 87 87 87 90 94 95 95

viii
3.3. REMOTE SENSING DATA AND GEOGRAPHIC INFORMATION SYSTEM
INTEGRATION FOR COASTAL GEOMORPHOLOGICAL MAPPING IN A MACROTIDAL MANGROVE COAST, BRAZILIAN AMAZON REGION
Abstract Introduction Study Area Methodological Approach Results and Discussions
Geomorphologic mapping of the coastal zone Coastal landforms description and interpretation
Coastal plateaus Tidal mudflats (mangrove) Salt marshes Chenier sand ridges Coastal dunes Barrier-beach ridges Ebb-tidal delta Tidal sandflats Estuarine channel and submerse sandy tidal banks
Degraded areas by human activities Coastal landform boundaries and coastline delineation
Conclusions Acknowledgement References Ø Situação do Artigo: minuta concluída
3.4. EVALUATION OF LANDSAT THEMATIC MAPPER AND RADARSAT-1
DATA TO GEOMORPHOLOGICAL MAPPING ON A MANGROVE COAST, BRAGANÇA, PARÁ, BRAZILIAN AMAZON REGION
Abstract Introduction Study site Remote sensing dataset Methodological approach TM Landsat-5 imager Radarsat-1 imagery Multisensor fusion (SAR with TM) Visual analysis Results and Discussion TM Landsat-5 RADARSAT-1
RADARSAT-1 with TM integrated product Conclusions Acknowledgement References
98 98 98 100 102 106 106 107 107 107 110 111 111 112 112 112 112 113 114 116 117 117
121 121 122 123 124 125 125 125 126 126 127 127 129 130 134 134 135
ix
Ø Situação do Artigo: Submetido para publicação na Wetlands Ecology and Management. CAPÍTULO 4. APLICAÇÃO DE DADOS DE SENSORIAMENTO REMOTO NO ESTUDO DA GEOLOGIA COSTEIRA 4.1. SATELLITE IMAGES FOR STUDY OF DYNAMIC OF BRAGANÇA MANGROVE COAST, NORTHERN BRAZILIAN AMAZON Abstract Introduction Regional setting Data set and methods Geologic shoreline changes Historical shoreline changes Mid-term morphological changes Short (seasonal) morphological changes Discussion Conclusions Acknowledgement References Ø Situação do Artigo: minuta concluída 4.2. MANGROVES AS GEOLOGICAL INDICATOR OF COASTAL CHANGES IN BRAGANÇA, PARÁ, NORTHERN BRAZIL Abstract Introduction Environmental setting Data sets and methodology Mangroves as geological indicator Assessing of mangrove shoreline position Evaluating of erosional and depositional settings Implications of sea level changes in mangrove and salt marsh evolution Evaluating risk from coastal hazards Discussion and conclusion Acknowledgement References Ø Situação do Artigo: publicado na Mangrove 2000 International Conference, Recife,
ISME/UFRPE. Full paper CD ROM. 4.3. GEOMORPHOLOGY, LAND-USE AND ENVIRONMENTAL HAZARD IN
AJURUTEUA MACROTIDAL SANDY BEACH, NORTHERN BRAZIL Abstract Introduction Study Site Methods Ajuruteua Macrotidal Sandy Beach Morphology Short-Term Beach Change Present Beach Use Natural Processes to Coastal-Hazard Risk Assessment
138
139 139 139 140 144 145 146 146 148 154 155 155 156 159 159 159 160 160 162 162 164 165 165 166 167 167
169 169 169 170 173 174 175 178 179 181 181

x
Conclusions Acknowledgement Literature Cited Ø Situação do Artigo: submetido para publicação no Journal of Coastal Research,
Special Issue: Brazilian Sandy Beaches. 4.4.IMPACTOS NATURAIS E ANTRÓPICOS NA PLANÍCIE COSTEIRA DE BRAGANÇA Abstract Introdução Cenário Regional Metodologia Impacto dos processos naturais na zona costeira de Bragança Erosão da linha de costa Acreção da linha de costa Variações na vegetação costeira Impacto das atividades antrópicas na zona costeira Construção de estradas de acesso às praias Ocupação desordenada das praias
Impacto dos resíduos sólidos no ambiente costeiro Impacto na flora e fauna Degradação física
Impactos estéticos e econômicos Impactos na saúde
Estratégia de ocupação da área costeira Áreas de preservação permanente Áreas adequadas à ocupação Áreas de risco à ocupação Áreas degradadas
Recomendações para reduzir a vulnerabilidade da área costeira Conclusões Agradecimentos Referencias Ø Situação do Artigo: Aceito para publicação no Livro Organizado por M.T. Prost e A.C.
Mendes (ed.). 2000. "Impactos Ambientais em Áreas Costeiras. Belém, MPEG/UNESCO. CAPÍTULO 5. CONCLUSÕES GERAIS 5.1. EVOLUÇÃO DA ZONA COSTEIRA 5.2. MAPEAMENTO DE ZONAS TROPICAIS ÚMIDAS POR SENSORES REMOTOS 5.3. APLICAÇÃO DE DADOS DE SENSORIAMENTO REMOTO EM GEOLOGIA COSTEIRA CAPÍTULO 6. LITERATURA CITADA ANEXOS Anexo A- Lista de trabalhos publicados e submetidos à publicação Anexo B- Mapa Geomorfológico da Planície Costeira de Bragança
182
184 184 184 185 186 187 187 188 188 190 190 191 191 192 192 192 192 193 193 194 195 195 195 196 197 197
199
200
201
204
205
xi
LISTA DE ILUSTRAÇÕES p.
CAPÍTULO 1
Figure 1- Mapa de localização da área de estudo 5
CAPÍTULO 2
Seção 2.1
Figure 1- Localization and tectonic map of northeastern Pará State showing two geologic sectors in the coastal zone (based on Gorini and Bryan 1976).
15
Figure 2- Bouguer gravity anomaly map of northeastern Pará State (Oliveira and Castro 1971).
18
Figure 3- Band 5 of TM-Landsat imagery showing the coastal geomorphology of the northeastern Pará State.
19
Seção 2.2
Figure 1- Map location of study area and coastal zone geomorphologic map. 27
Figure 2- Tidal mudflat sedimentary environments densely covered by mangrove tree 28
Figure 3- Inner salt marshes flooded during the rainy season. 29
Figure 4- Outer salt marshes developed over old barrier-beach ridges. 29
Figure 5- Band 5 of TM Landsat imagery showing geomorphologic features in the Ajuruteua Island, Bragança coastal plain.
32
Seção 2.3
Figura 1- Mapa de localização da planície Costeira Bragantina. 38
Figura 2- Mapa dos ambientes sedimentares da Planície Costeira Bragantina. 40
Figura 3- Seções estratigráficas das unidades morfoestratigráficas e das fácies estratigráficas da Planície Costeira Bragantina
49
Figure 4- Seção estratigráfica generalizada Bragança-Ajuruteua 50
Figura 5- Seção estratigráfica da unidade pântano salino 51
CAPÍTULO 3
Seção 3.1
Figure 1- Location map of study area of the Bragança coastal plain. 66

xii
Figure 2- Flow chart with the main steps of RADARSAT image processing 69
Figure 3- Detailed coastal geomorphology of Bragança plain from RADARSAT-1. 72
Figure 4- Shallow water morphology from RADARSAT-1. 74
Figure 5- Land cover mapping from RADARSAT-1. 77
Figure 6- 1998 RADARSAT image and superimposed vector showing shoreline changes since 1972, coastal erosion and accretion, island migration and geomorphologic features.
79
Figure 7- RADARSAT-1 and Landsat TM composite showing the coastal geomorphology and shallow water morphology.
80
Seção 3.2
Figure 1- Location of study area and coastal zone geomorphologic map. 86
Figure 2- Flow chart with the main steps in the SAR RADARSAT and Landsat TM data integration.
88
Figure 3- RADARSAT (F1) and Landsat TM (decorrelation stretch) integrated product from the Bragança Coastal Plain.
92
Figure 4- RADARSAT (F1) and Landsat TM (selective principal component) integrated product from the Bragança Coastal Plain.
93
Seção 3.3
Figure 1- Location map of the Bragança Coastal Plain 101
Figure 2- Flow chart with main steps in the SAR and TM integration. 104
Figure 3- SPC-SAR integrated product in the Bragança Coastal Plain. 105
Figure 4- Geomorphologic map of the Bragança coastal plain. 107
Figure 5- Transition between coastal plateaus (A), inner salt marsh (B), outer salt marsh (C) and intertidal mangrove (D) showed in the SPC-SAR integrated product.
110
Figure 6- SPC-SAR integrated product displayed along the Ajuruteua Island. 111
Figure 7- Mangrove prograding over tidal sandflat along the Picanço Point from SPC-SAR integrated product.
113
Figure 8- Human activities mapped from SPC-SAR integrated product. 114
Figure 9- SPC-SAR integrated product showing coastal change from 1991 to 1998. 115
Seção 3.4
Figure 1- Location of study area and coastal zone geomorphologic map. 124
Figure 2- Landsat TM false color composite (4R5G3B) from the Bragança Coastal Plain. 128
Figure 3- RADARSAT Fine Beam Mode (F1) from the Bragança Coastal Plain. 130
Figure 4- RADARSAT (F1) and Landsat TM (selective principal component) integrated product from the Bragança Coastal Plain.
132
CAPÍTILO 4

xiii
Seção 4.1
Figure 1- Location map of the study site. 141
Figure 2- 1985 Landsat TM false color composite (4R5G3B) showing geomorphic landforms of the Bragança macrotidal coast.
142
Figure 3- 1985 Landsat TM band 3 showing turbidity distribution patterns and tidal current lines.
143
Figure 4- Lon-term morphological changes observed through 1972 shoreline vector superimposed to 1998 RADARSAT-1 Fine Mode image. A) Maiaú Point; B) Buçucanga Beach; C) Maciel Point; and D) Atalaia Estuary
147
Figure 5- Short-term morphological changes in positions of shoreline in the Maiaú Point. 159
Figure 6- Short-term morphological changes in positions of shoreline in the Buçucanga Beach.
150
Figure 7- Short-term morphological changes in positions of shoreline in the Maciel Point. 151
Figure 8- Short-term morphological changes in positions of shoreline in the Atalaia Estuary.
152
Figure 9- Annual precipitation in the Traquateua hydro-meteorological station from 1974 to 1998.
153
Figure 10- Month precipitation in the Traquateua hydro-meteorological station during the period of short-term shoreline analysis.
154
Seção 4.2
Figure 1- Location map of the study area and mangrove distribution in the Bragança coastal plain.
161
Figure 2- Shoreline recession by barrier overwash and mangrove erosion at Maiaú Point, from 1975 to 1998.
163
Figure 3- Shoreline accretion by tidal mudflat progradation from 1975 to 1998. 163
Figure 4- Assessment of mangroves as geological indicator to detect coastal changes. 164
Figure 5- Natural and anthropogenic impacts on coastal area. 166
Seção 4.3
Figure 1- Location map of study area based on Landsat TM band 5. 171
Figure 2- Geomorphologic landforms and shore drift directions on the Ajuruteua Island. 172
Figure 3- Localization of shore-normal transects used to measure short-term changes in shoreline position.
173
Figure 4- Morphologic details of the Ajuruteua macrotidal sandy beach. 174
Figure 5- Relative shoreline position along the Ajuruteua Beach 176
Figure 6- Plot of shoreline rate of change values for the Ajuruteua Beach.. 177
Figure 7- Beach profiles and volumes changes on the Ajuruteua Beach. 177
Figure 8- Overview of coastal land use in the Ajuruteua Beach 179
Figure 9- The Ajuruteua Beach under high spring tide conditions. 179

xiv
Seção 4.4
Figura 1- Mapa geomorfológico e mapa de localização da Planície Costeira de Bragança 186
Figura 2 - A) Setor NW da Praia de Ajuruteua submetido a erosão ... 189
Figure 3- Impacto dos resíduos sólidos na Praia de Ajuruteua. 193
Figura 4- Mapa geoambiental da Planície Costeira de Bragança 194

xv
LISTA DE TABELAS
p. CAPÍTULO 2
Seção 2.1
Table 1- Details of used satellite data. 16
Seção 2.3
Tabela 1- Principais características das unidades morfoestratigráficas 41
Tabela 2- Principais características das fácies estratigráficas 42
CAPÍTULO 3
Seção 3.1
Table 1- Characteristic of the remotely sensed data. 68
Table 2- Interpretation of RADARSAT-1 Fine Mode imagery for coastal geological mapping
75
Seção 3.2
Table 1- Characteristics of the remotely sensed data. 87
Table 2- Eigenvector loadings and variance (in %) of the selective principal component images obtained: a) for TM 1, 2 and 3 bands, and b) for TM 5 and 7 bands.
90
Table 3- Evaluation of integrated products 91
Seção 3.3
Table 1- Characteristics of the coastal mapping features 108
Seção 3.4
Table 1- Characteristics of the remotely sensed data. 125
Table 2- Remote sensing product evaluation. 133
CAPÍTULO 4
Seção 4.1
Table 1- Characteristics of the remotely sensed data. 144
Seção 4.2
Table 1- Characteristics of remotely sensed data. 161
1
RESUMO
Dados de sensores remotos orbitais foram avaliados e aplicados ao estudo de ambientes costeiros tropicais úmidos na Amazônia brasileira (Planície Costeira de Bragança, no nordeste do Pará) como parte do programa GLOBESAR-2, cujos objetivos eram construir e consolidar a capacitação de recursos humanos, bem como avaliar o potencial e a aplicabilidade do radar de abertura sintética SAR RADARSAT-1 na América Latina.
A área em estudo está inserida no contexto geológico da bacia costeira de Bragança-Viseu. A evolução holocênica desta área é marcada por progradação lamosa em uma costa de submersão, onde se desenvolveu um dos maiores sistemas de manguezal do planeta, com aproximadamente 6.000 km2.
Este trabalho tem demonstrado que dados orbitais de sensores remotos podem fornecer excelentes informações geológicas e de uso das áreas costeiras. Imagens do RADARSAT-1 representam uma ferramenta poderosa para o estudo de ambientes costeiros tropicais úmidos, principalmente em costas de manguezal. Este fato está relacionado à radiação nas microondas poder ser interpretada para o mapeamento e monitoramento da zona costeira amazônica, pois imagens SAR constituem a única fonte de dados com capacidade de percepção remota em todas as condições de tempo, em resposta a dificuldade de se obter imagens no espectro óptico na Amazônia, devido a permanente cobertura de nuvens. Imagens do sensor TM do satélite Landsat são excelentes dados para integração com o SAR RADARSAT, apresentando excelente performance na discriminação dos ambientes costeiros. Esta integração propiciou uma visão sinóptica da área, fornecendo informações geobotânicas (relação entre o ambiente costeiro e a vegetação sobrejacente) e de variações multitemporais. Adicionando os dados integrados a um sistema de informação geográfica foi possível ainda analisar simultaneamente as relações espaciais e temporais entre os vários ambientes costeiros, tornando a interpretação geológica mais compreensível, acessível, rápida e precisa dentro de uma filosofia organizacional para controle dos dados e posterior uso desta informação no gerenciamento da zona costeira. As aplicações dos dados de sensores remotos no estudo de ambientes costeiros tropicais foram utilizadas em diversas abordagens. Em relação ao estudo da variabilidade na posição da linha de costa ao longo da Planície Costeira de Bragança, este estudo tem revelado que durante o Holoceno (últimos 5.200 anos) a planície é marcada por uma progradação lamosa da linha de costa. Entretanto, a partir da análise de imagens de sensores remoto, foi possível investigar a variabilidade da linha de costa em escalas de longo (72-98) e curto período (85 a 88, 88 a 90, 90 a 91), cujas variações morfológicas são caracterizadas por um recuo da linha de costa, provavelmente devido à variações climáticas, tais como El-Niño e La-Niña, que controlam a precipitação ao longo da zona costeira, onde os períodos de erosão mais severos (85-88) são acompanhados de elevadas taxas de precipitação (>4.000 mm/ano). Do ponto de vista da análise espacial de ambientes costeiros, os manguezais constituem um dos melhores ambientes para análise a partir de sensores remotos, tanto no espectro eletro-óptico devido sua alta reflectância no infravermelho próximo, quanto nas microondas devido sua textura rugosa. Portanto, os manguezais tem mostrado ser um excelente indicador geológico para detecção e quantificação das variações morfológicas de curto e longo período.
Por fim, a integração de sensores remotos com GIS e dados de campo apresenta um papel fundamental para o gerenciamento integrado de zonas costeiras, avaliação de risco ambiental, caracterização local, mapas bases e geração de mapas temáticos e disseminação da informação de domínio público, que são fatores significantes no processo de tomada de decisão.

2
ABSTRACT
Orbital remote sensing data were used to evaluate its applications in the study of wet tropical coastal environments in the Brazilian Amazon (Bragança coastal plain, in the northeastern of the State of Pará). This work was developed as part of the GlobeSAR-2 Program, whose the objectives were build and consolidate the formation of human resources, as well as evaluate the potential and the applicability of the synthetic aperture radar (SAR) RADARSAT-1 in the Latin America.
The study site is situated in the Cretaceous Bragança-Viseu coastal basin. The holocenic evolution of this area is marked by muddy progradation over a submerging coast, where is developed one of the most mangrove system of the world, with almost 6,000 km2.
This research has showed that orbital remote sensing data can provide excellent geologic and coastal land use information. The SAR RADARSAT-1 imageries represent a powerful tool to understand the coastal processes in the wet tropical environments, mainly in the mangrove coasts. This fact is related to microwave radiation can be interpreted for Amazon coastal zone mapping and monitoring, because SAR image constitutes in the unique source of data with all-weather remote sensing capability, in response to difficulty to get optical images in the Amazon, due to all-time cloud cover.
Landsat TM imageries are excellent data sources to integration with RADARSAT-1. They present a good performance in coastal environments discrimination. The remote sensing data integration allow a synoptic view of the area and provide geobotanic (relation between coastal environment and vegetation) and multitemporal information. In addition to integrated data, geographic information system (GIS) combines different data sets and simultaneously interprets the spatial and temporal relationship between various coastal environments. This way, GIS allows for a more comprehensive, accurate and easier interpretation of a geomorphologic mapping under an organizational philosophy to control data towards use the information to coastal zone management.
The application of remote sensing data in the tropical coastal studies was used in different approaches. In relation to spatial and temporal variability of the shoreline, this study has revealed that during the Holocene, the coastal plain is marked by a muddy progradation. However, from the analysis of the remote sensing images were possible investigate the shoreline variability under long (1972-1998) and short (1985-1988, 1988-1990, 1990-1991) term, which is characterized by shoreline retreat, probably due to climatic changes, such as El-Niño and La-Niña events. These climatic events control the rainfall along the coastal zone, where severe erosional period (1985-1988) are coupled with high precipitation rate (> 4,000 mm/yr.).
From the point of view of the spatial analysis of the coastal changes, the mangroves constitutes one of the most environments to be analyzed by remote sensing images, as in the electro-optical spectrum due to their high reflectance in the infrared, as in the microwave due to their rough surface responsible for high backscattering. Therefore, mangroves have showed to be an excellent geologic indicator to detect and to quantify short and long-term morphological coastal changes.
To conclude, remote sensing data integration, GIS and auxiliary fieldwork data present a fundamental role to the integrated coastal zone management, environmental risk assessment, local characterization of the study sites, base maps upgrading and information dissemination for public consultation, which are all significant factors in this decision-making process.

3
CAPÍTULO 1:
INTRODUÇÃO
4
1.1. APRESENTAÇÃO E OBJETIVOS
As regiões tropicais úmidas da Terra estendem-se do Equador até cerca de 15º N e S,
representando menos de um quarto de toda a superfície terrestre, mas sendo responsável por mais
da metade da água doce, partículas e solutos descarregados nos oceanos. Os trópicos úmidos são
caracterizados por precipitação alta e constante (> 1.500 mm/ano), altas temperaturas (> 20º) com
baixa variação térmica. Além disso, o oceano costeiro tropical apresenta outros fatores em
comum, tais como radiação solar alta, grande “runnof” de água doce, ventos alísios de leste e
fraca força de Coriolis (Nittrouer et al. 1995).
Os processos oceânicos costeiros nos trópicos tem grande relevância social, como
demonstraram Glaser & Grasso (1998). A crescente necessidade de área para construção, devido
o aumento na população humana, tem levado a destruição muitas florestas tropicais de manguezal
nos últimos anos. No contexto da história geológica, cenários tropicais tem sido os precursores
para muitos depósitos petrolíferos do mundo. Portanto, o entendimento dos processos costeiros
nos trópicos úmidos tem ampla relevância científica, assim como importância social e econômica
(Nittrouer et al. 1995).
A área em estudo encontra-se situada no maior e mais bem preservado ambiente tropical
úmido do planeta, a Região Amazônica. A costa nordeste do Estado do Pará e noroeste do
Maranhão estende-se por cerca de 480 km e ao longo desse trecho do litoral brasileiro ocorre um
dos maiores sistemas de manguezal do mundo, com cerca de 6.000 km2 (Herz 1991). Esta costa
de manguezal é extremamente irregular e recortada, com inúmeras baías e estuários. Este setor do
litoral brasileiro é caracterizado por um sistema de macromaré semidiurna, com variações médias
de 4 m e máxima superior a 8 m, e correntes de marés máximas superiores a 4 m/s no Golfão
Maranhense (Ferreira apud Rebelo-Mochel 1997). Os manguezais são desenvolvidos em clima
equatorial quente e úmido, com estação chuvosa e seca muito bem definidas e precipitação média
anual em torno de 2,500 mm. A temperatura do ar varia de 25º a 27º C e a umidade relativa de
80% a 91% (Martorano et al. 1993).
A área de estudo, a Planície Costeira de Bragança, está situada no setor nordeste do
Estado do Pará, ao longo da costa de manguezais do norte do Brasil (Figure 1). Geologicamente,
a área encontra-se situada na bacia costeira de Bragança-Viseu (Cretáceo), cuja evolução é
controlada por falhamentos normais que alcançam a atual zona costeira. O arcabouço estrutural
dessa bacia é responsável pela submersão da zona costeira (Souza Filho 2000), que apresenta

5
baixo gradiente e alcança 45 km de largura na parte emersa. Tais características, aliadas a
estabilidade ou queda relativa do nível do mar a partir de 5.200 anos B.P. e contínuo suprimento
sedimentar fluvial tem permitido a progradação da planície lamosa e desenvolvimento do sistema
de manguezal (Souza Filho & El-Robrini 1995).
Figura 1- Mapa de localização da área de estudo.
Brasil
Área de Esti Lí» ' .
Bragança
PARA an
46042W
, Planície costeira
Planado costeiro
tfjçu;anga do Nlaiau
PnnUi lio
m
m
mà m
m
<■5 .
>1
i^a-s

6
Dentro desse contexto, esta pesquisa foi conduzida como parte do Programa GlobeSAR-2
para avaliar as aplicações do Radar de Abertura Sintética (SAR) do RADARSAT-1, suportado
pelo Centro Canadense de Sensoriamento Remoto (CCRS), Agência Canadense para
Desenvolvimento Internacional (CIDA), Centro de Pesquisa para Desenvolvimento Internacional
(IDRC), Agência Espacial Canadense (CSA) and Instituto Nacional de Pesquisas Espaciais
(INPE). Detalhes deste programa no Brasil podem ser encontrado em Paradella et al. (1997 a). Os
outros projetos que deram suporte à esta tese foram Monitoramento da Dinâmica Costeira e
Estuarina da Planície Costeira de Bragança, através de imagens de satélites e perfis de praia,
financiado pela Universidade Federal do Pará (PROINT/98) e o Projeto de Financiamento
(PROF) da CAPES
A área em estudo pode ser considerada um local em seu estado natural relacionado a
dinâmica costeira. Ao longo desta zona costeira, não há atividades humanas que perturbem os
processos costeiros. Assim, o entendimento dos processos geológico pode ser muito melhor
compreendido através de dados de sensores remotos, aliados a dados morfológicos, geológicos,
meteorológicos e oceanográficos. Outros importantes aspectos foram considerados na escolha da
área de estudo, tais como grande diversidade de ambientes sedimentares costeiros, facilidade de
acesso, ausência de trabalhos relacionados à geologia costeira, exceto os já desenvolvidos pelo
autor desta tese, além da busca do entendimento das respostas humanas frente às variações
costeiras, e a oportunidade de testar novas metodologias e sua aplicabilidade no estudo de zonas
costeiras dominadas por manguezais de macromaré.
Os objetivos desta investigação foram: 1) caracterizar o cenário geológico regional da costa
de manguezal de macromaré de Bragança, (2) reconhecer os ambientes sedimentares costeiros
baseados em dados de sensores remotos ópticos e microondas, (3) avaliar a efetividade de realces
de imagens, técnicas de fusão e integração de dados de sensores remotos para mapeamento
geológico de ambientes costeiros na Região Amazônica, (4) mostrar aplicações de dados de
sensores remotos integrados, processamento digital de imagens e técnicas de sistemas de
informações geográficas (SIG) no estudo de ambientes costeiros, (5) examinar a dinâmica das
formas costeiras através de dados de sensores remotos em escalas de curto e longo período em
comparação com eventos na escala geológica, cuja evolução é refletida na estratigrafia dos
ambientes costeiros, e (6) analisar o impacto de risco geológico no ambiente costeiro e suas
implicações no assentamento da população costeira. Assim, esta pesquisa fornece importantes

7
resultados para o gerenciamento integrado de zonas costeiras, combinando abordagens de
diferentes escalas temporais e espaciais.
Esta tese foi concebida na forma de integração de artigos científicos organizados em seis
capítulos e dois anexos. O Capítulo 1 inicia com as razões pelas quais estudou-se um ambiente
tropical úmido, representado pela costa de manguezal do norte do Brasil (Seção 1.1), seguida por
uma discussão do papel dos dados de sensoriamento remoto na pesquisa geológica costeira
(Seção 1.2). O Capítulo 2 descreve o cenário geológico regional relacionado ao controle tectônico
da geomorfologia da zona costeira do nordeste do Pará (seção 2.1), a geomorfologia da planície
costeira de Bragança (Seção 2.2) e as variações do nível do mar e a evolução das seqüências
estratigráficas da área em estudo.
O Capítulo 3 constitui a fundamentação desta tese. Descreve as técnicas de sensoriamento
remoto relacionadas ao processamento digital de imagens e realces de ambientes costeiros
tropicais dominados por manguezais de macromaré. Técnicas têm sido utilizadas para corrigir a
geometria e realçar a imagem do RADARSAT-1 no reconhecimento de feições costeiras naturais
e antropogênicas e detectar variações de longo período (Seção 3.1). As imagens RADARSAT-1 e
TM Landsat são integradas a partir de diferentes processamentos digitais para realçar feições
costeiras dentro da abordagem de multi-sensores (Seção 3.2). As imagens de sensores remotos
também foram integradas em um SIG a fim de se executar o mapeamento geológico dos
ambientes sedimentares costeiros (Seção 3.3). No final deste capítulo, dados do RADARSAT-1,
Landsat TM e as combinações entre eles são avaliados quanto à sua efetividade no mapeamento
de ambientes geológicos costeiros tropicais (Seção 3.4).
O Capítulo 4 apresenta diversas aplicações de dados de sensores remotos no estudo da
geologia costeira. As imagens orbitais são usadas no estudo da dinâmica de curto e longo período
da costa de manguezais (Seção 4.1). Manguezais são visto como indicadores geológicos de
variações costeiras (Seção 4.2). Uma abordagem integrada é apresentada para a Praia de
Ajuruteua, baseada na geomorfologia, uso da costa e impacto ambiental (Seção 4.3). Por fim,
impactos naturais e antrópicos são reconhecidos ao longo da planície costeira de Bragança (Seção
4.4). No Capítulo 5 é apresentado um resumo dos resultados e conclusões e no Capítulo 6 é
listada a literatura citada nesta tese. Em anexo ao texto principal é apresentado o mapa geológico-
geomorfológico dos ambientes sedimentares costeiros da área de estudo e uma lista de artigos
publicados dentro do escopo desta tese.

8
1.2. SISTEMAS DE OBSERVAÇÃO COSTEIRA:
O PAPEL DOS SENSORES REMOTOS
Dado o interesse internacional e reconhecimento da importância da zona costeira, o
programa LOICZ (Land-Ocean Interactions in Coastal Zones) juntamente com o IGBP
(International Geosphere-Biosphere Program) tem sido implementado ao longo de todo o mundo.
Além do mais, um módulo para monitoramento dos ambientes da zona costeira e suas variações
costeiras são também um componente importante no GOOS (Global Ocean Observing System),
estabelecido em 1993 (Johannessen 2000). Os objetivos desses esforços relacionados ao
monitoramento da zona costeira podem ser perfeitamente alcançados através da utilização de
dados de sensores remotos operacionais na faixa das microondas, óptico e infravermelho
(Cracknell 1999).
Para muitos aspectos do estudo costeiro, a escala dos dados orbitais no passado não
apresentava facilidades para o estudo de monitoramento costeiro (dados do Landsat MSS com
resolução espacial de 80 m). Entretanto, desenvolvimentos recentes de sistemas de sensores
remotos orbitais (SPOT, Landsat 5 e 7, RADARSAT-1 e IKONOS) tem permitido o uso de
dados orbitais para diversos estudos costeiros. Assim, a partir de meados da década de 80, com o
lançamento de plataformas modernas, imagens de satélite tem sido extensivamente usada em
mapeamento geológico regional. Ao longo deste tempo, a fonte mais usual de dados orbitais
ópticos para aplicações em geomorfologia tem sido as imagens do Landsat TM (Thematic
Mapper). Levantamentos geomorfológicos costeiros através do Landsat TM tem sido executado
em todo o mundo (Jones 1986, Gowda et al. 1995, Souza Filho 1995, Ciavola et al. 1999, Yang et
al. 1999). Durante os últimos 10 anos, radares de abertura sintéticos vêm sendo utilizados com
maior freqüência, principalmente em ambientes tropicais úmidos (Singhroy 1995, Singhroy 1996,
Rudant et al. 1996, Prost 1997, Kushwaha et al. 2000), devido a versatilidade dos imageamentos
nas microondas, que estende a capacidade dos sensores ópticos pela oportunidade de penetração
em nuvens e chuvas, que são bastante comuns em áreas tropicais úmidas e iluminação
independente de fonte solar.
Aspectos complementares na utilização dos dados de sensores remotos dizem respeito a
integração de diferentes partes do espectro eletromagnético (microondas, infravermelho e
visível). Tal abordagem já vem sendo utilizada em aplicações geológicas (Harrys et al. 1990,
Rheault et al. 1991, Harrys et al. 1994, Paradella et al. 1997 b, Paradella et al., 1998) e em

9
especial em geologia costeira (Singhroy 1996, Ramsey III et al. 1998, Souza Filho & Paradella
submetido). Nesta abordagem, enquanto as energias nas microondas medidas pelos sistemas SAR
fornecem informações das propriedades geométricas (macro e micro-topografia ou rugosidade
superficial) e elétricas (relacionada ao conteúdo de umidade; Lewis et al. 1998, Raney, 1998),
sensores ópticos tornam possível à extração de informações dos alvos relacionadas à composição
físico-química dos materiais (Colwell 1983). Portanto, a sinergia dos dados SAR e óptico através
de produtos integrados permite a detecção, caracterização e monitoramento dos ambientes
costeiros e de suas feições, principalmente em ambientes tropicais úmidos, aonde a utilização de
imagens SAR vem crescendo nos últimos anos, vindo a se constituir na principal fonte de
informações espaciais de áreas tropicais úmidas.
Sistemas de informações geográficas (SIG) vêm sendo utilizados na cartografia de ambientes
costeiros, onde imagens de sensores remotos são definidas como uma fonte de informação
geográfica, fornecendo importantes feições no domínio do espaço e tempo (Burrough 1986).
Deste modo, a habilidade dos SIGs para combinar um conjunto de dados (SAR, TM, litologia,
etc) facilita a interpretação do relacionamento espacial e temporal de várias fontes de informação
em uma base quantitativa, permite uma interpretação mais compreensiva da geologia costeira.
Esta abordagem aliada a integração de dados multi-sensores pode ser considerada como uma das
futuras direções do sensoriamento remoto aplicado a investigação de zonas costeiras
REFERÊNCIAS BURROUGH, P.A. 1986. Principles of Geographical Information Systems for Land Resources
Assessment. Oxford, Clarendon Press. 193p.
CIAVOLA, P.; MANTOVANI, F.; SIMEONI, U.; TESSARI, U. 1999. Relation between river
dynamic and coastal changes in Albania: an assessment integrating satellite imagery with
historical data. International Journal of Remote Sensing, 20: 561-584.
COLWELL, R.N. 1983. Manual of Remote Sensing. Falls Cruch, American Society of
Photogrammetry. 518p.
CRACKNELL, A.P. 1999. Remote sensing techniques in estuaries and coastal zones - an update.
International Journal of Remote Sensing, 19: 485-496.

10
GLASER, M. & GRASSO, M.1998. Fisheries of a mangrove estuary: dynamics and inter-
relationships between economy and ecosystem in Caeté Bay, northeastern Pará, Brazil.
Boletim do Museu Paraense Emílio Goeldi, Série Zoologia, 14: 95-125.
GOWDA, H.H.; GANESHA RAJ, K.; PADMAVATHY, A.S.; MANIKIAN, B. 1995. Multidate
satellite data for study of dynamic of coastal landforms of Uttara Kannada, South India.
International Journal of Remote Sensing, 16: 2539-2553.
HARRIS, J.R., BOWIE, C., RENCZ, A.N., GRAHAM, D. 1994. Computer-enhancement
techniques for the integration of remotely sensed, geophysical, and thematic data for the
geosciences. Canadian Journal of Remote Sensing, 20: 210-221.
HARRIS, J.R.; MURRAY, R.; HIROSE, T. 1990. IHS transform for the integration of radar
imagery and other remotely sensed data. Photogrametry Engineering & Remote Sensing, 56:
1631-1341.
HERZ, R. 1991. Manguezais do Brasil. São Paulo, IOUSP/CIRM, 401p.
JOHANNESSEN, J.A. 2000. Coastal observing systems: the role of synthetic aperture radar.
Johns Hopkins APL Technical Digest, 21: 7-14.
JONES, A. R. 1986. An evaluation of satellite thematic mapper imagery for geomorphological
mapping in arid and semi-arid environment. In: GARDINER, V. (ed.) International
Geomorphology. Chichester, Wiley. p. 343-357.
KUSHWAHA, S.P.S.; DWIVEDI, R.S.; RAO, B.R.M. 2000. Evaluating of various digital image
processing techniques for detection of coastal wetlands using ERS-1 SAR data. International
Journal of Remote Sensing, 21: 565-579.
LEWIS, A.J.; HENDERSON, F.M.; HOLCOMB, D.W. 1998. Radar fundamentals: the
geoscience perspective. In: HENDERSON, F.M. & LEWIS, A.J. (eds.) Principles &
Applications of Imaging Radar. Manual of Remote Sensing. 3rd ed, New York, John Willey
& Sons. p. 131-180.
MARTORANO, L.G.; PERREIRA, L.C.; CÉZAR, E.G.M.; PEREIRA, I.C.B. 1993. Estudos
Climáticos do Estado do Pará, Classificação Climática (KÓPPEN) e Deficiência Hídrica
(THORNTHWHITE, MATHER). , Belém, SUDAM/ EMBRAPA. 53p.
NITTROUER, C.A.; BRUNSKILL, G.J.; FIGUEIREDO, A.G, 1995. Importance of tropical
coastal environments. Geo-Marine Letters, 15: 121-126.

11
PARADELLA, W.R.; BIGNELLI, P.A.; VENEZIANI, P.; PIETSCH, R.W.; TOUTIN, T. 1997b.
Airborne and spaceborne synthetic aperture radar (SAR) integration with Landsat TM and
gamma ray spectrometry for geological mapping in a tropical rain forest environment, the
Carajás Mineral Province, Brazil. International Journal of Remote Sensing, 18: 1483-1501.
PARADELLA, W. R.; KRUG, T.; LAUNDRY, R.; PIETSCH, R. W. 1997 a. GLOBESAR-2: O
Programa de Avaliação de Dados do RADARSAT-1 nas Geociências. Revista Brasileira de
Geociências, 27: 403-406.
PARADELLA, W.R.; SANTOS, A.R.; DALL' AGNOL, R.; PIETSCH, R.W.; SANT'ANA,
M.V. 1998. A geological investigation based on airborne (SAREX) and spaceborne
(RADARSAT-1) SAR integrated products in the Central Serra dos Carajás Granite Area,
Brazil. Canadian Journal of Remote Sensing, 24: 376-392.
PROST, M. T. 1997. La mangrove de front de mer en Guyane: ses transformations sous
l'influence du système de dispersion Amazonien et son suivi par télédétection. In: KJERFVE,
B.; LACERDA, L. D.; DIOP, E. H. S. (ed.). Mangrove ecosystem studies in Latin America
and Africa. Paris, UNESCO. p. 111-126.
RAMSEY III, E.W.; NELSON, G.A.; SAPKOTA, S.K. 1998. Classifying coastal resources by
integrating optical and radar imagery and color infrared photography. Mangroves and Salt
Marshes, 2: 109-119.
RANEY, K. 1998. Radar fundamentals: technical perspective. In: HENDERSON, F.M. &
LEWIS, A.J. (eds.), Principles & Applications of Imaging Radar. Manual of Remote
Sensing. 3rd ed., , New York, John Willey & Sons. p. 8-130.
REBELO-MOCHEL, F. 1997. Mangroves on São Luís Island, Maranhão Brazil. In: KJERFVE,
B.; LACERDA, L. D.; DIOP, E. H. S. (eds.). Mangrove ecosystem studies in Latin America
and Africa. Paris, UNESCO. p. 145-154.
RHEAULT, M.; SIMARD, R.; GARNEAU, C.; SLANEY, V.R. 1991. SAR Landsat TM-
geophysical data integration utility of value-added products in geological exploration.
Canadian Journal of Remote Sensing, 17: 185-190.

12
RUDANT, J.P.; BALTZER, F.; DEROIN, J.P.; LOINTIER, M.; MAITRE, H.; MOUGLIN, E.;
PÉNICAND, C.; PROST, M.T. 1996. Apport des images radar satellitaires ERS-1 et JERS-1
dans le domaine de la cartographie générale et thématique en contexte tropical humide:
exemples en Guyane française et régions limitrophes. Société Française de Photogrammétrie
et Télédetection, 142: 15-33.
SINGHROY, V. 1995. SAR integrated techniques for geoharzard assessment. Advanced Space
Research, 15: 1167-1178.
SINGHROY, V. 1996. Interpretation of SAR images for coastal zone mapping in Guyana.
Canadian Journal of Remote Sensing, 22: 317-328.
SOUZA FILHO, P.W.M. 1995. Influência das Variações do Nível do Mar na Morfoestratigrafia
da Planície Costeira Bragantina (NE do Pará) durante o Holoceno. Belém. Universidade
Federal do Pará. Centro de Geociências. 123p. (Tese de Mestrado).
SOUZA FILHO, P.W.M. 2000. Tectonic control on the coastal zone geomorphology of the
northeastern Pará State. Revista Brasileira de Geociências, 30: 523-526.
SOUZA FILHO, P.W.M. & EL-ROBRINI, M. 1995. Um exemplo de sistema deposicional
dominado por macromaré: A Planície Costeira Bragantina - NE do Pará (Brasil). In:
CONGRESSO DA ASSOCIAÇÃO BRASILEIRA DE ESTUDOS DO QUATERNÁRIO, 5,
Niterói, Anais... ABEQUA. p. 278-284.
SOUZA FILHO, P. W. M. AND PARADELLA, W.R. Evaluation of Landsat Thematic Mapper and
RADARSAT-1 Data to Geological Mapping on a Mangrove Coast, Bragança, Pará,
Brazilian Amazon Region. (submetido a Wetlands Ecology and Management).
YANG, X.; DAMEN, M. C. J.; VAN ZUIDAM, R. A. 1999. Use of thematic mapper imagery
with geographic information system for geomorphologic mapping in a large deltaic lowland
environment. International Journal of Remote Sensing, 20: 659-681.
13
CAPÍTULO 2:
GEOLOGIA COSTEIRA DA PLANÍCIE DE BRAGANÇA

14
2.1. TECTONIC CONTROL ON THE COASTAL ZONE GEOMORPHOLOGY OF THE
NORTHEASTERN PARÁ STATE1
ABSTRACT
Based on the integration of geomorphologic, geophysical and structural data it was possible to characterize the large-scale distribution of the Quaternary sedimentary environments on the northeastern Pará coastal zone. Two geomorphological sectors are observed in the study area: sector 1, between Marajó and Pirabas Bay, presents a narrow, no more than 2 km wide coastal zone, developed over the Pará platform, and seems to be a very stable area. In sector 2, from Pirabas Bay eastward, the coastal zone becomes broader, almost 30 km wide, from inactive coastal cliffs to the shoreline. The evolution of this sector is related to the Bragança-Viseu coastal basin, which is controlled by normal faults that reach the present coastal zone. Therefore, the northeastern Pará coastal zone presents a stable coast associated to the Pará platform, and a submerging coast related to the Bragança-Viseu coastal basin.
Keywords: Coastal zone, geomorphology, tectonic control, Northern Brazil.
INTRODUCTION
The continental margin of northern Brazil has been studied to trace mid-ocean tectonic
structures into the continental margins and into the continental interior (Gorini and Bryan 1976).
Works discussing the geology and geomorphology at Atlantic type margins have emphasized the
tectonic, stratigraphic, sedimentary and morphologic control of northern Brazilian passive margin
evolution (Zembruscki et al. 1972, Campos et al. 1974, Asmus 1984). However, the coastal zone
is an integral part of the continental margin, and its long-term evolution is controlled by thermo-
tectonic evolution of passive margins (Gilchrist and Summerfield 1994).
The coastal zone evolution in Brazil has been traditionally studied with basis on sea level
changes, sedimentary dynamics and landform features. However, the large-scale geomorphology
of the northern Brazilian coastal zone is directly related to the structural and sedimentary
evolution of the coastal basins. This area is clearly linked to the basement framework and to the
tectonism that affected this basin and is related to the uplift and collapse that preceded the
opening of the Equatorial Atlantic ocean (Aranha et al. 1990). The purpose of the present paper is
to evince the tectonic control of coastal zone evolution with basis on the integration of
geomorphologic, geophysical and structural data.
1 Artigo publicado na Revista Brasileira de Geociências, Vol. 30, No. 3, p. 523-526. - Brazilian Contributions to 31st International Geological Congress, Brazil 2000.

15
GEOLOGIC SETTING
The general tectonic configuration of the northern Brazilian continental margins was
established in the Early Cretaceous, during the opening of the Equatorial Atlantic Ocean
(Rezende and Ferradaes 1971, Campos et al. 1974, Asmus 1984). Campos et al. (1974) noted that
Precambrian lines of crustal weakness were reactived by tensional forces responsible for gravity-
faulted structural pattern development (rifts) and coastal basins depressed in the basement. These
faults show a stepped pattern from the continent to the ocean, forming a series of horsts and
grabens (Gorini and Bryan 1976, Igreja 1992). According to Suguio and Martin (1996), the role
of marginal basins, as a neotectonic agent in the evolution of the Brazilian coast, must be
considered. Thus, the geotectonic activity in northeastern of Pará is controlled by E-W
transcurrent faults connected through NW-SE normal faults, whereas the structural and
sedimentary evolution of the area is clearly linked to the reactivation of basement framework
(Costa et al. 1996).
Along the northeastern Pará coast, two structural frameworks can be observed (Figure 1):
the Pará platform and the Bragança-Viseu basin (Gorini and Bryan 1976). The origin and
evolution of these tectonic structures were explained through a model of Atlantic-type margins
(Asmus 1984).
Figure 1- Localization and tectonic map of northeastern Pará State showing two geologic sectors in the coastal zone (based on Gorini and Bryan 1976).
f8o 47lw - Normal fault Depositional a
V. p. Salinógolis P'rabas Bay structural arch Pre-Cambrian shield
Pará Platform
Bragança
irt" vGurupi a a X- Horst ,\V Bragança-Vise
x ^ coastal basin x x
^N\x X x X . : 50 km

16
During the Quaternary, the northeastern Pará coastal zone has been affected by regressive
and transgressive episodes. Milliman and Barreto (1975) dated lagoon oolites at 17,400 years
BP., which suggests that the continental shelf was exposed and sea level was located on the shelf
break (-80 to -90 m lower than present sea level). Milliman and Emery (1968) believe that from
17.400 years BP, the sea level began to rise and coastline and transgressive sandy sheets migrated
landward, eroding and onlapping the coastal plateaus to form active cliffs. Afterwards, under
stillstand, or slower relative sea level rise, it is possible to observe a muddy progradation of the
coastline seaward that marks the beginning of intertidal mangrove development. (Silva 1996,
Souza Filho and El-Robrini 1996, Souza Filho and El-Robrini 1998). This sea level history has
strongly controlled the Quaternary evolution of the coastal zone, which is characterized now by
wide mudflat environments (mangroves).
DAT SET AND METHODS
Digital data from TM Landsat-5 imageries in orbit-point 222-61 and 223-60 were selected
to cover the northeastern Pará coastal zone. The images were not geocoded to make the false
color composition on a 1:250,000 scale. Details of the satellite data used are given on Table 1.
Ancillary data such as plan-altimeter maps on a 1:250,000 scale, geological map on a 1:50,000
scale, bathymetric and sedimentological maps on a 1:5,000,000 scale and field observation were
utilized for the study.
Table 1- Details of used satellite data.
Platform/ Sensor
Orbit/Point Acquisition date Spatial resolution
Landsat TM 5 222/61 August 24, 1985 30x30 m Landsat TM 5 223/60 July 24, 1988 30x30 m
The geomorphologic study of the coastal zone was based on the interpretation of TM
Landsat-5 satellite data in the form of false color composite (4R5G3B). Digitally enhanced
products were carried out using standard keys such as tone/color, texture, patterns, form, size,
shape and drainage. The accuracy of interpretation was also assessed through fieldwork. The
geomorphologic map was integrated with gravity and tectonic maps to establish the relationships
between coastal zone geomorphology and the tectonic framework of the northern Brazilian
continental margin.

17
DIFFERENT GEOLOGIC SECTORS OF THE NORTHEASTERN PARÁ COASTAL
ZONE
Along the Pará continental margin, two geologic sectors can be observed, according to
Gorini and Bryan (1976). The Pará platform as defined by Rezende and Ferradaes (1971),
constitutes areas of no more than 2,000 m of Cretaceous or Jurassic/Triassic deposits. The
Tertiary sedimentary cover, almost 1,500 m thick, is not tectonically influenced by older centers
of deposition, which reflects great tectonic stability compared to adjoining coastal basins
(Rezende and Ferradaes 1971, Gorini and Bryan 1976). The other sector is represented by the
Bragança-Viseu coastal basin, which constitutes a graben bounded by normal faults along the
northwest-southeast structural trend. Sedimentary thickness reaches almost 4,500 m, deposited in
two mega-sequences: Codó-Grajaú sequence (Late Aptian) and Itapecuru sequence (Early Albian
to Early Cenomanian) (Aranha et al. 1990). The Cenozoic sequence is constituted by the Pirabas
Formation, deposited under transgressive conditions, responsible for a carbonatic sedimentation,
followed by Barreiras Group deposition under regressive conditions (Goes et al. 1990).
Nowadays, the Barreiras Group forms coastal plateaus along the coast.
These geological sectors are controlled by the tectonic of the Pará continental margin
(Figure 1). The Pará platform goes from Marajó to Pirabas Bay and constitutes the tectonic
boundary of the continental margin. This platform represents a gravimetric high; easily identified
on the Bouguer gravity anomaly map (Figure 2), which can explain the narrow geomorphologic
expression of the coastal plain. The Bragança-Viseu coastal basin is completely developed in
land and this geologic sector represents a gravimetric low developed from the Pirabas Bay to
Gurupi River along a northwest-southeast direction and from coastline to continental fracture
zone (Gurupi horst) in a northeast-southwest direction (Figure 2). According to Aranha et al
(1990) and Igreja (1992), this basin is submitted to transtensive movimentation predominantly
dextral, due to the displacement of the South American and African plates. Therefore, the coastal
zone is located in a different geologic sector in relation to continental shelf, developed over the
Pará platform.

18
COASTAL ZONE GEOMORPHOLOGY AND TECTONIC FRAMEWORK
Stretching out for 300 km, according to Franzinelli (1992), the northeastern Pará littoral
constitutes a submergence coast subdivided in two sectors: sector 1, from Marajó Bay to Pirabas
Bay, where the bays cut the active cliffs and; sector 2, from Pirabas Bay eastward, where the
coastal plateaus stretch out southward to constitute inactive cliffs. This geomorphologic
compartimentation can be observed in TM images; the coastal sedimentary environments
(predominantly mangroves) widen considerably towards the east from Pirabas Bay (Figure 3). As
the coastal plateaus extend southward, the coastal zone is wider and consequently this sector
represents a lower topography, much more influenced by flooding and tidal action.
Figure 2- Bouguer gravity anomaly map of northeastern Pará State (Oliveira and Castro 1971).
The two geomorphologic sectors recognized by Franzinelli (1992) can be described in
relation to morphostructural compartimentation of the northeastern Pará coastal zone. The sector
1 presents a narrow, no more than 2 km wide coastal zone, developed over Barreiras Group
sediments, that reach the littoral to form active coastal cliffs. The cliffs constitute the outer
boundary of the coastal plateaus exposed to erosion along the shoreline due to wave and tidal
Salinópolis/ P,irabas Bay Bragança-Viseu coastal basin
.Pará Platform
Bragança
4)0/M

19
action. Estuaries incised in the coastal plateaus, extend for more than 70 km landward and
mangrove deposits constitute the mud intertidal flat (Figure 3A). However, in the sector 2, the
coastal zone becomes broader, reaching a width of almost 30 km from inactive coastal cliffs to
shoreline (Figure 3B). The inactive cliffs are 1 m high in direct contact with the mud tidal flat
represented by mangrove prograding environment and the estuaries extend for more than 100 km
from shoreline to coastal plateaus.
Figure 3- Band 5 of TM-Landsat imagery showing the coastal geomorphology of the northeastern Pará State. A) In the sector 1, note that coastal plateaus reach the shoreline and coastal plain is narrow. B) In the sector 2, observe that coastal plateaus stretch out southward to constitute inactive cliffs and coastal plain becomes wide, reaching more than 30 km of width.
O Original data from UAS/MPEG Salmópolis
íi^?íí A Marieta Tarana pjrabas Bay Algodoal
Manau
- r
s*-- ■B .
20 km - ■ A
Quatipuru Maiaú
fíV^SIfeífJS ~ Canela Ajuruteua
tó rK. Camaraçu
Sèrrarribi
©Original data from IN PE
:Apeú' 's'*v
tífPv*^
' •r-
' rs t - •- ■ Vi
:v " i.. '• B
#v mi »> * .

20
DISCUSSION
Based on the integration of these data it is possible to state that sea level changes only
could not explain the differences in sedimentary pattern and geomorphologic compartimentation
between the western and eastern part of northeastern Pará State. In the sector 1, on the Pará
platform, the higher relief developed with Tertiary deposits is found near the coastline forming
active cliffs. Based on gravity map, this sector is found to be subject to stability or emergence
processes. In the sector 2, in the Bragança-Viseu coastal basin, the relief along the coastline is
lower and is related to Quaternary unconsolidated deposits. Gravity map analysis shows that this
sector represents a submerging coast, where the sediment supply has been more important to
build the coastal zone than in the sector 1, since the Bragança-Viseu basin represents a sink of
sediments.
It is also interesting to verify that the transition between emerging and submerging zones
is abrupt, which can be observed as well, in the gravity maps as in TM images. This seems to
eliminate the hypothesis of morphological differentiation due to continental flexural mechanism
described in the other sectors of the Brazilian coastline (Suguio and Martin 1976, Driscoll and
Karner 1994, Bittencourt et al. 1999). Therefore, the tectonic interactions between fault blocks,
separated by NW-SE normal faults developed as consequence of tectonic activity responsible for
the Equatorial Atlantic Ocean opening, persist active during the Quaternary.
Sediment distribution along the coastal zone is also controlled by tectonic evolution of the
continental margin. In the sector 1, the coastal plain is associated with the tidal flat along
estuaries limited by Tertiary deposits (Figure 3A) that reach the coastline. In the sector 2, inactive
cliffs mark the interior limit of the Quaternary plain, which possibly represents an ancient
reactivated fault. From inactive cliffs, the Quaternary deposits prograde almost 30 km seaward
(Figure 3B), probably due to continuous submergence of the coast during the Holocene.
In low elevation passive margins, such as in northeastern Pará, a broad continental shelf
leads to a coastal plain, which rises gradually to a relatively low-lying interior surface (Gilchrist
and Summerfield 1994). The continental shelf of the Pará is 220 km wide, with a smooth and
gentle bathymetric surface, forming broad terraces (Zembruski et al. 1972). This morphologic
characteristic of the continental shelf must be responsible for the control of the coastal plain
morphology. However, two geomorphological sectors can be observed showing several different

21
characteristics. Therefore, differences in the continental structures are reflected in the Quaternary
coastal deposit distribution that is controlled by the tectonic framework.
SUMMARY AND CONCLUSIONS
The large-scale geomorphological evolution of northeastern Pará State is controlled by the
tectonic setting of the passive margin developed since the Early Cretaceous during the opening of
the Equatorial Atlantic Ocean. Two geomorphological sectors are observed in the study area.
Sector 1 is developed over the Pará platform, which shows a wide Tertiary sedimentary cover
represented by the Pirabas Formation and the Barreiras Group. The evolution of this sector is not
tectonically influenced by older centers of deposition, seeming to be very stable (Rezende and
Ferradaes 1971). Therefore, the coastal deposits are restricting to estuarine channels, prograding
no more than 2 km seaward, constituting an emerging coast. Sector 2 has its evolution related to
the Bragança-Viseu coastal basin that is controlled by normal faults that reach the present coastal
zone. The structural framework of this coastal basin is responsible for a submerging coastal zone
development, showing a wide mangrove ecosystem due to mudflat progradation.
The tectonic control of the coastal zone geomorphology has affected long-term and large-
scale landscape development. Therefore, the tectonic framework of the Equatorial Atlantic
margin controls large-scale geomorphic characteristics of the Quaternary sedimentary
environments.
Acknowledgement
The author thanks the Remote Sensing Division of the National Institute for Space
Research (DSR-INPE) and the Spatial Analysis Unit of the Museu Paraense Emílio Goeldi
(UAS-MPEG) to provide original digital data of TM Landsat imageries. Invaluable field support
was given by Geology and Geochemistry Post-Graduation Course of the Federal University of
Pará (CPGG-UFPA). The author would also like to thank Dr. Maâmar El-Robrini for
infrastructure support, Dra. Carmem Pires Frazão for English review and CAPES for a Ph.D.
scholarship.

22
REFERENCES
Aranha L. G. F., Lima H. P., Souza J. M. P., Makino R. K. 1990. Origem e evolução das bacias
de Bragança-Viseu, São Luís e Ilha Nova. In: De Raja Gabaglia G. P. and Milani E. J. (ed.).
Origem e evolução de bacias sedimentares. Rio de Janeiro, PETROBRÁS, p. 221- 233.
Asmus H. E. 1984. Geologia da margem continental brasileira. In: Geologia do Brasil, Rio de
Janeiro, DNPM, p. 443-472.
Bittencourt A. C. S. P., Dominguez J. M. L., Ussami N. 1999. Flexure as a tectonic control on the
large scale geomorphic characteristics of the eastern Brazil coastal zone. Journal of Coastal
Research, 15(2): 505-519.
Campos C. W. M., Ponte F. C., Miura K. 1974. Geology of the Brazilian continental margin. In:
Burk, C. A. and Drake, C. L. (eds.). The geology of continental margins. Berlin, Springer-
Verlag, p. 447-461.
Costa J. B. S., Bemerguy R. L., Hasui, Y., Borges M. S., Ferreira Jr. C. R. P., Bezerra P. E. L.,
Costa M. L. C., Fernandes J. M. G. 1996. Neotectônica da Região Amazônica: aspectos
tectônicos, geomorfológicos e deposicionais. Geonomos, 4(2): 23-44.
Driscoll N. W. and Karner G. D. 1994. Flexural deformation due to Amazon fan loading: a
feedback mechanism affecting sediment delivery to margins. Geology, 22: 1015-1018.
Franzinelli E. 1992. Evolution of the geomorphology of the coast of the State of Pará, Brazil. In:
M. T. Prost (ed.). Évolution des littoraux de Guyane et de la Zone Caraïbe Méridionale
pendant le Quaternaire. Paris, ORSTOM. p. 203-230.
Gilchrist A. R. and Summerfield M. A. 1994. Tectonic models of passive margins evolution and
their implications for theories of long-term landscape development. In: Kirkby M. J. (ed.).
Processes models and theoretical geomorphology. Chilchester, Willey, p. 55-84.
Goes A. M., Rossetti D. F., Nogueira A. C. R., Toledo P. M. 1990. Modelo deposicional
preliminar da Formação Pirabas no nordeste do Estado do Pará. Boletim do Museu
Paraense Emílio Goeldi, Série Ciências da Terra, 2: 3-15.
Gorini M. A. and Bryan G. M. 1976. The tectonic fabric of the Equatorial Atlantic and adjoining
continental margins: Gulf of Guinea to northeastern Brazil. Anais da Academia Brasileira
de Ciências, 48 (suplemento): 101-119.

23
Igreja H. L. S. 1992. Aspectos tectono-sedimentares do Fanerozóico do nordeste do Pará e
noroeste do Maranhão, Brasil. Centro de Geociências, Universidade Federal do Pará.
Belém, Tese de Doutorado, 191p.
Milliman J.D. and Barreto H.T. 1975. Relict magnesian calcite oolite and subsidence of Amazon
Shelf. Sedimentology, 22: 137-145.
Milliman J.D. and Emery K.O. 1968. Sea levels during the past 35.000 years. Science, 162:
1121-1123.
Oliveira E. and Castro P. J. M. 1971. Problemas de integração gravimétrica no Brasil. In: SBG,
Congresso Brasileiro de Geologia, 25, São Paulo, Anais, v.2, 71-78.
Pontes F. C. and Asmus H. E. 1976. The Brazilian marginal basins: current state of knowledge.
Anais da Academia Brasileira de Ciências, 48 (suplemento): 215-235.
Rezende W. M. and Ferradaes J. O. 1971. Integração geológica regional da bacia sedimentar da
Foz do Rio Amazonas. In: SBG, Congresso Brasileiro de Geologia, 25, São Paulo, Anais,
v.3, 203-214.
Silva M. S. 1996. Morfoestratigrafia e evolução holocênica da Planície Costeira de Salinópolis,
Nordeste do Estado do Pará. Centro de Geociências, Universidade Federal do Pará.
Belém, Dissertação de Mestrado, 142p.
Souza Filho P. W. M. and El-Robrini M. 1996. Morfologia, processos de sedimentação e
litofácies dos ambientes morfosedimentares da Planície Costeira Bragantina - Nordeste do
Pará (Brasil). Geonomos, 4: 1-16.
Souza Filho P.W.M. and El-Robrini M. 1998. As variações do nível do mar e a estratigrafia de
sequências da Planície Costeira Bragantina - Nordeste do Pará, Brasil. Boletim do Museu
Paraense Emílio Goeldi, Série Ciências da Terra, 10: 45-78.
Suguio K. and Martin L. 1976. Brazilian coastline Quaternary formations - The states of São
Paulo and Bahia littoral zone evolution schemes. Anais da Academia Brasileira de
Ciências, 48 (suplemento): 325-334.[
Suguio K. and Martin L. 1996. The role of neotectonics in the evolution of the Brazilian coast.
Geonomos, 4(2): 45-53.
Zembruscki S. G., Barreto H. T., Palma J. C., Milliman J. D. 1972. Estudo preliminar das
províncias geomorfológicas da margem continental brasileira. In: SBG, Congresso Brasileiro
de Geologia, 26, Belém, Anais, v.2, 187-209.

24
2.2. GEOMORPHOLOGY OF THE BRAGANÇA COASTAL ZONE, NORTHEASTERN
PARÁ, BRAZIL1
ABSTRACT
The area can be subdivided into three main geomorphologic compartments: (1) alluvial plain, with fluvial channels, levees and flood plain; (2) estuarine plain, with an estuarine channel subdivided into estuarine funnel segment, straight segment, meandering segment and upstream channel and; (3) coastal plain, with salt marshes (inner and outer), tidal flats (supratidal mangroves, intertidal mangroves and sandy tidalflats), chenier sand ridges, coastal dunes, barrier-beach ridges and ebb-tidal delta environments. The Bragança coastal zone is an active sedimentary region, which has been developed largely since the higher Holocene sea level (5,100 years BP). It has been concluded, based on geomorphology, lithostratigraphy and sedimentary processes that the coastal plain has evolved from mangrove progradation protected by dune-beach ridges with associated fluvial-estuarine-tidal channels. Therefore, the sedimentary model shows a complex depositional system, which is influenced by a broad tidal range.
Keywords: Coastal geomorphology, macro tidalflat, mangrove, remote sensing, Northern Brazil. INTRODUCTION
Geomorphology is the science concerned with relationship between landforms and the
processes currently acting on them (Summerfield 1991). Coastal zone environments are products
of many complex interacting processes (transport, erosion and deposition), which continually
modify rocks and sediments. According to Summerfield (1991), coastal zones are broad and
reach from the landward limit of marine processes to the seaward limit of alluvial and shoreline
processes. Therefore, coastal zone is the region between continental and marine environments
where occur estuaries, deltas, tidal flats, salt marshes, barrier islands, cheniers, beaches and other
coastal landforms.
In the Northeastern part of the State of Pará (Amazon Region) the coastal environments
are dominated by macrotidal systems (6m ranges). The dominant geomorphologic features
usually consist of wide muddy tidal flats (mangroves) with estuaries, shoals, salt marshes,
cheniers, dunes, beaches and associated washover deposits (Silva 1996, Souza Filho and El-
Robrini 1996).
1 Paper published in the Revista Brasileira de Geociências, Vol. 30, No. 3, p. 518-522 - Brazilian Contribution to
31st International Geological Congress, Brazil 2000.

25
The morphology and sedimentary facies of coastal environments are the product of
interactions between relative sea levels, coastal processes and sediment supply. Tidal coastal
plains develop under conditions of rising sea level (transgressive coasts) or stable or falling sea
level (prograding coasts) in response to different combinations of sea level changes history
(Dalrymple et al. 1992). These settings are responsible for landward migration of the shoreline
(transgression) and seaward migration of the shoreline (regression) and may be identified by
geomorphologic mapping. Therefore, the recognition of shoreline deposits may be crucial to
understand the sea-level changes and the stratigraphic sequence (Reading and Collinson 1996).
The purpose of this study was to investigate the coastal zone geomorphology of Bragança plain to
add to the understanding of the coastal evolution.
REGIONAL SETTING
The Bragança coastal zone is situated in the northeastern part of the State of Pará, in the
Cretaceous Bragança-Viseu coastal basin (Cretaceous). Distribution and thickness of the Tertiary
and Quaternary deposits have been controlled by the geometry of the basin and its
paleotopography, and by recent tectonic movements. This coastal plain constitutes a macrotidal
(6 m) depositional system, developed in a hot and humid equatorial climate, with dry and wet
well-defined seasons and an annual precipitation averaging 3,000 mm; relative humidity varies
from 80 to 91% (Martorano et al. 1993).
The Brazilian coastline is currently undergoing different tectonic, geomorphic, climatic and
oceanographic processes. The Northern Brazilian Region is characterized by a wide continental
shelf, the Northeastern Pará coastal zone being represented by an embayed coastline developed
over Tertiary deposits, clastic and carbonatic sediments of the Barreiras Group and Pirabas
Formation, respectively. These Tertiary deposits constitute the coastal plateaus which are
continuous along the Northern Brazilian coast at elevations of about 50 to 60 m, decreasing
progressively seaward, where it forms inactive and active cliffs along of shoreline and estuarine
margins (Souza Filho and El-Robrini 1996).
The littoral zone from the Amazonas River to the Gurupi River has a width of about 600
km. In this region, Franzinelli (1992) could distinguish two primary geomorphological features
on the coastline: (1) emergence coast, represented by Marajó Island, with a straight coastline, and
(2) submergence coast, east of Marajó Bay to Gurupi Bay; the latter was subdivided in two

26
sectors, a first one, from Marajó Bay to Pirabas Bay, where the bays cut active cliffs, and the
second, east of Pirabas Bay, where the coastal plateaus extend southward as inactive cliffs
(Figure 1).
METHODS
The coastal zone mapping was based on TM Landsat-5 imagery dated from 24/July/91,
orbit-point 222-61 in digital format. The TM Landsat-5 data were digitally processed. Standard
procedures were used, including geometric and radiometric corrections and image enhancement.
The interpretation of satellite data in the form of false color Composite (TM4, TM5, TM3) and
digitally enhanced products were made using standard key such as tone/color, texture, pattern,
form, size, geometry, drainage and others. A detailed analysis of the spectral signatures of terrain
associated with important elements both of geometric and textural characteristics of the coastal
landforms, made it possible to identify different geomorphologic units.
Fieldwork was carried out to check the features observed in the image interpretation.
During geomorphological mapping were identified vegetation, sediment texture and landforms of
different coastal units, which were positioned through of global positional system (GPS). Each
coastal unit was described and sampled by vibracorer technique and the sediments collected were
analyzed.
GEOMORPHOLOGIC CLASSIFICATION OF THE COASTAL ZONE
The coastal zone geomorphic classification was based on landforms, sediment patterns,
and dominant processes in operation (historical processes); some other factors, including
geomorphological processes, land use and land cover, were also considered. Three large
geomorphological compartments were mapped: coastal plain, estuarine plain and alluvial plain.
Coastal plain
The coastal plain is the most extensive of the three geomorphologic compartments. It
extends north of the coastal plateaus for more than 20 km, occurring as wide tidal flats, until it
reaches the shoreline dominated by marine processes (Figure 1). The major landforms observed
are tidal mudflats (mangrove), salt marshes, tidal sandflats, chenier sand ridges, coastal sand
dunes, barrier-beach ridges and ebb-tidal delta. Important observations in relation to

27
geomorphological processes, sediment patterns, coastal processes, land use and land covers are
highlighted below according to geomorphological classification.
TIDAL MUDFLATS (MANGROVE)
The tidal mudflats constitute a wide mangrove ecosystem with a width of about 20 km,
densely covered by mangrove trees (Figure 2). They are located from the high spring tide to the
mean tidal level. Organic muddy sediments are deposited on the tidal flats during the slack
tidewater, when the currents decrease. Simple lenticular bedding with fine sand lenses, wavy
bedding, tidal bundle and massive muddy sediments containing plant fragments and roots occur
in the sedimentary mudflat deposits.
Figure 1- Map localization of study area and coastal zone geomorphologic map (Modified from Souza Filho and El-Robrini 1998).
Field studies have indicated that Rhizophora sp. and Avicennia sp. are the dominant species
commonly found along this coast. The distribution of tidal flats is mainly controlled by
topography. Therefore, based on relative altimetry and vegetation height, the tidal flats were
subdivided in supratidal mangrove and intertidal mangrove. The supratidal mangroves are
topographically higher with smaller trees and can be reached by water only during the spring
Bala rto Maiaú Buçucanga
uanela ^ Island /í
1 'M r.
1 RanaRo costolro
nl Manguozal do supramaró
*| Manguezal de I me r ma ré
|rj Pântano salino Interno i Pântano salino cxtorno
Planície arenosa | Chenier
'rj Dunas costeiras
|| Praias
Planície estuanna
i Planície de inundação

28
tides, while the intertidal mangroves are topographically lower with progradacional and erosional
areas.
Figure 2- Tidal mudflat sedimentary environments densely covered by mangrove trees
SALT MARSHES
The salt marshes are known in the area as "Campos de Bragança". The marshes are
situated in the supratidal zone; sedimentation is marked by mud deposition carried from tidal
fluxes along creeks (Souza Filho and El-Robrini 1996). They are subdivided in inner and outer
salt marshes. The inner salt marsh occurs over the coastal plateaus and is flooded only during the
rainy season and tidal waters influence its tidal creeks only during the dry season (Figure 3). The
outer salt marsh occurs over old sandy beach ridge deposits along the tidal mudflat (Figure 4).
Outer salt marshes are frequently flooded during the spring tides. The map in Figure 1 shows the
spatial relationship between salt marsh, old beach ridges (cheniers) and tidal mudflats.
This unit is constituted by massive mud, but it is possible observe fine sand lenses
intercalated by mud that characterize a lenticular bedding (Souza Filho and El-Robrini 1998).
TIDAL SANDFLATS
The tidal sandflats occur along the coast between mean tidal and low spring tidal levels.
This unit is represented by sandy tidal shoals, which have many ripples, and megaripple marks
and sand waves exposed at low tide (Figure 5). These tidal sandy deposits are characterized by
plane-parallel and tangential cross stratification and simple flaser bedding with burrows filled by
mud. Muddy balls reworked by tidal currents also occur along the sandflat.
5"
-
\ m

29
Figure 3- Inner salt marshes flooded during the rainy season.
Figure 4- Outer salt marshes developed over old barrier-beach ridges (sandy ridge covered by trees).
CHENIER SAND RIDGES
The chenier sand ridges constitute old dune-beach ridges with associated washover fans.
They are constituted by white fine sand covered by sparse vegetation. The cheniers have a very
well characterized geometric linear and curved form whose boundary is marked by prograding
tidal mudflats (Figure 5). The sedimentary processes responsible for its development are related
to shoreline retreat during transgressive sea-level conditions followed by mud progradation. The
.. ' > ' !i S v

30
mud progradation sometimes covered the sandy deposits, which allowed mangrove and salt
marsh development. Foreset stratification and bioturbed structures deposited over intertidal
muddy deposits characterize these coastal landforms.
COASTAL SAND DUNES
Sandy sediments of tidal shoals and beach reworked by the wind constitute the coastal
sand dunes. Nowadays, the dunes are migrating landward over the mangrove deposits in the
intertidal mudflats. Transverse and pyramidal dunes are partially or completely covered with
vegetation and represent coastal dunes composed of very fine quartz sand, which is very well
sorted, with few shell fragments and root marks. The transverse dunes present tabular cross
stratification and the pyramidal dunes have beds dipping in opposite directions from the ridge,
which is parallel to the trade winds direction (Souza Filho and El-Robrini 1996).
BARRIER- BEACH RIDGES
The barrier- beach ridges are the most dynamic coastal environments. They extend from
low spring tidal levels to dune-beach scarps that represent the higher spring tidal level in the
intertidal beach. The beaches have a linear and elongated form along an east-west direction, with
curved spits in the longshore sediment transport direction (Figure 5). This barrier-beach ridges
form protected backward areas where muddy sediments are deposited during the slack water and
so salt grasses and mangrove trees are installed.
The barrier-beach ridges are dominated by macrotidal conditions and they were
subdivided in supratidal zone (backshore), intertidal zone and subtidal zone based on relative
tidal level (Wright et al. 1982). The supratidal zone extends above the high spring tide level that
coincides with the topographic boundary (dune-beach scarp). The intertidal zone occurs between
high and low spring tide level. This zone is subdivided in three sub-zones based on morphologic
and sedimentologic characteristics, flooding time and dynamic regimes. The high intertidal zone
extends from high spring tide to high neap tide level; the mean intertidal zone is centered
between high neap tide and low neap tide level, while the low intertidal zone extends from low
neap tide to low spring tide level. The lower area, named subtidal zone, occurs under low spring
tide level and extends to the breaker zone.

31
EBB-TIDAL DELTA
The size and shape of ebb deltas are directly related to the relative influence of waves and
tidal currents on barrier-beach ridges (Davis Jr. 1992). Where the tidal energy is dominant, ebb
deltas extend seaward in the form of large deltas; shore normal sand bodies (Figure 5). The ebb
delta morphology has shallow ebb channels exposed during low spring tide, flanked by sandy
bars. These ebb deltas contain a very complex system of bedform such as different types of
ripples, megaripples and sand waves on intertidal sandy bodies. The sediments are very fine to
fine, well sorted, with shells and micaceous mineral fragments.
Estuarine plain
The estuarine plain extends upstream to the southward, as far as the tidal limit of the
Caeté and Taperaçu rivers (Figure 1), to the north its boundary is dominated by marine processes.
The river channel is influenced by fluvial, tidal and marine processes. Souza Filho and El-Robrini
(1996) observed that geomorphology of the estuarine plain changes between downstream and
upstream limits. According to Woodroffe et al. (1989), this is a reflex of progressive change of
the river and its wet season flood profile. Souza Filho and El-Robrini (1996) recognized four
estuarine channel types in the Caeté River: estuarine funnel, straight segment, meandering
segment and upstream tidal channel.
Alluvial plain
The alluvial plain extends south of the tidal limit, forming the floodplain of the freshwater
parts of the Caeté and Taperaçu rivers. The fluvial channels are meandering with longitudinal and
point bars, and box morphologic anomalies. The floodplain is bounded by levees and it is flooded
during the wet season.
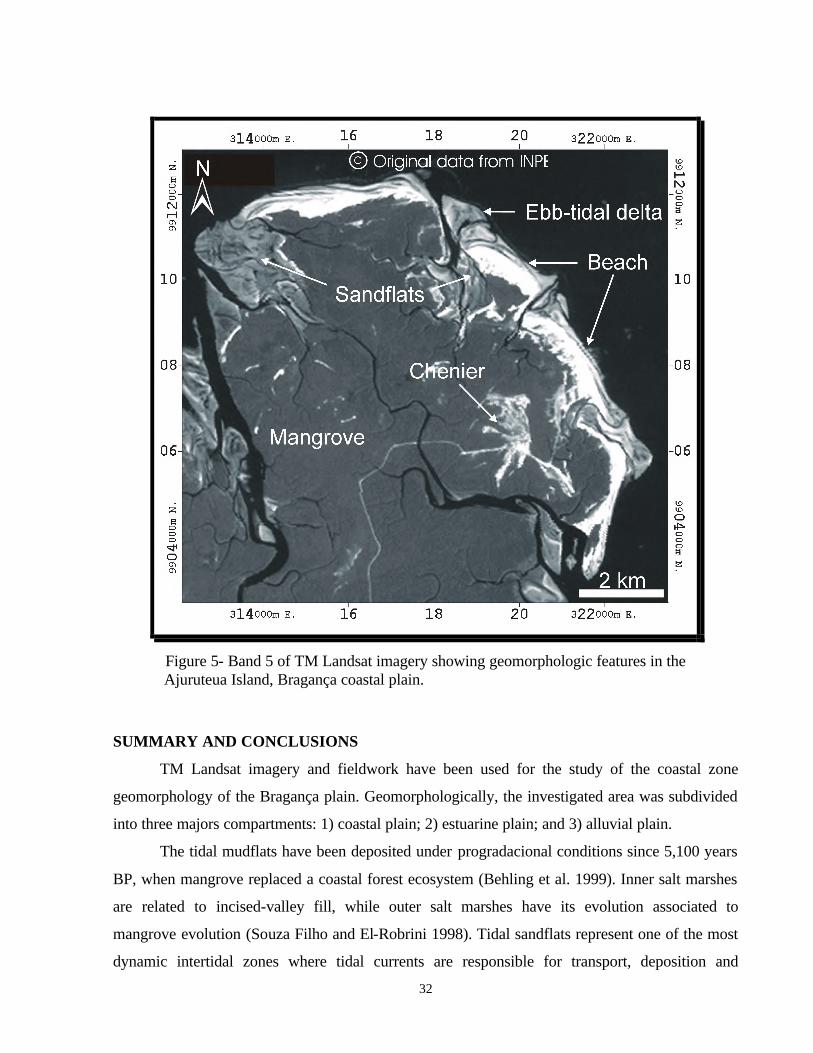
32
Figure 5- Band 5 of TM Landsat imagery showing geomorphologic features in the Ajuruteua Island, Bragança coastal plain.
SUMMARY AND CONCLUSIONS
TM Landsat imagery and fieldwork have been used for the study of the coastal zone
geomorphology of the Bragança plain. Geomorphologically, the investigated area was subdivided
into three majors compartments: 1) coastal plain; 2) estuarine plain; and 3) alluvial plain.
The tidal mudflats have been deposited under progradacional conditions since 5,100 years
BP, when mangrove replaced a coastal forest ecosystem (Behling et al. 1999). Inner salt marshes
are related to incised-valley fill, while outer salt marshes have its evolution associated to
mangrove evolution (Souza Filho and El-Robrini 1998). Tidal sandflats represent one of the most
dynamic intertidal zones where tidal currents are responsible for transport, deposition and
314000111 E. 15 18 20 32200Ora E.
0 Original data from INPE
CM
10-
hO
t }
«-S.
Al»'
:n
A. r ^ \
>, NrOv Sandflats
Ebb-tidal delta
Beach -10
08- Clfénier
06-
s
o
jy v \ ♦
Mangrove
1-08
-06
o
s g
3l4000in E. 15 1 8 2 0 3 2 2 000m E.

33
erosion. Chenier sand ridges mark old beach ridges in the coastal zone showing the great
displacement of the shoreline seaward during the Holocene period. Coastal sand dunes are
partially or completely covered with vegetation, an evidence of the presence, in the recent past, of
a period of dune formation with intense reworking of the sands by wind. However, nowadays, the
dunes have been dissipated and waves and tidal currents have eroded dunes along the coast. The
beach ridges have been developed under macrotidal conditions and work as barriers, which
reduce coastal erosion. These barriers are responsible for the development of protected areas
where occurs mud progradation with an increase of the mangrove area. The ebb-tidal delta
represents the most dynamic area, where the tidal channels have migrated considerably along
time. This constant displacement is responsible for intense erosion.
Inactive cliffs bound the coastal plateaus representing older shoreline position developed
during the last Holocene transgression (5,100 years BP). Simões (1981) obtained this age through
midden datation along the coastal plateaus. Afterwards, the shorelines have been submitted to
extensive progradation well defined by the position of chenier beach ridges and by mangrove
development.
Acknowledgements
We acknowledge support for this project from PROINT-UFPA (061/CG). The author
thanks the Remote Sensing Division of the National Institute for Spacel Research (DSR-INPE) to
provide original digital data of TM Landsat imagery. The authors are grateful to Carlos Alberto
Albuquerque for English review and reviewers for their helpful comments on the manuscript. The
first author would also like to thank CAPES for a Ph.D. scholarship.
REFERENCES
Behling H., Cohen M. C. L, Lara R, J. 1999. Holocene mangrove dynamics of the Bragança
Region on Northeastern Pará, Brazil. In: Madam Project, International Conference, 5,
Belém, Abstracts, 10-11.
Dalrymple R. W., Zaitlin B. A., Boyd R. 1992. Estuary facies models: conceptual basis and
stratigraphic Implications. Journal of Sedimentary Petrology, 62(2): 1130-1146.
Davis Jr. R. A. 1992. Depositional system: An Introduction to Sedimentology and Stratigraphy. 2nd ed. , New Jersey , Prentice Hall, 604p.

34
Franzinelli E. 1992. Evolution of the geomorphology of the coast of the State of Pará, Brazil. In:
M. T. PROST (ed.) Évolution des littoraux de Guyane et de la Zone Caraïbe Méridionale
pendant le Quaternaire. Paris, ORSTOM, 203-230.
Martorano L. G., Perreira L. C., Cézar E. G. M., Pereira I. C. B. 1993. Estudos Climáticos do
Estado do Pará, Classificação Climática (KÓPPEN) e Deficiência Hídrica
(THORNTHWHITE, MATHER). Belém, SUDAM/ EMBRAPA, 53p.
Reading H. G. and Collinson J. D. 1996. Clastic coasts. In: H.G. READING (ed.) Sedimentary
Environments: Processes, Facies and Stratigraphy. 3rd ed. Oxford, Blackwell Science, 154-
231p.
Silva M. S. 1996. Morfoestratigrafia e evolução holocênica da Planície Costeira de Salinópolis,
Nordeste do Estado do Pará. Centro de Geociências, Universidade Federal do Pará.
Belém, Dissertação de Mestrado, 142p.
Simões M. F. 1981. Coletores - Pescadores ceramistas do litoral do salgado (Pará). Boletim do
Museu Paraense Emílio Goeldi, Nova Série Antropologia, 78: 1-33.
Souza Filho P. W. M. and El-Robrini M. 1996. Morfologia, processos de sedimentação e
litofácies dos ambientes morfosedimentares da Planície Costeira Bragantina - Nordeste do
Pará (Brasil). Geonomos, 4: 1-16.
Souza Filho P. W. M. and El-Robrini M. 1998. As variações do nível do mar e a estratigrafia
de sequências da Planície Costeira Bragantina - Nordeste do Pará, Brasil. Boletim do
Museu Paraense Emílio Goeldi, Série Ciências da Terra, 10: 45-78.
Summerfield M. A. 1991. Global geomorphology: an introduction to the study of landforms.
New York , Longman, 537p.
Woodroffe C. D., Chappell J., Thom B.G., Wallensky E. 1989. Depositional models of a
macrotidal estuary and flood plain, South Alligator River, Northern Australia.
Sedimentology, 36: 737-756.
Wright L. D., Nielsen P., Short A. D., Green M. O. 1982. Morphodynamics of a macrotidal
beach. Marine Geology, 50: 97-128.

35
2.3. AS VARIAÇÕES DE NÍVEL RELATIVO DO MAR E A ESTRATIGRAFIA DE SEQÜÊNCIAS DA PLANÍCIE COSTEIRA BRAGANTINA, NORDESTE DO PARÁ, BRASIL1
ABSTRACT
The integration of geomorphologic, sedimentologic, stratigraphic and remote sensing data collected on the Bragança Coastal Plain allowed the detection of three stratigraphic successions that were correlated to relative sea-level changes during the Holocene. The Holocene stratigraphy of the Bragança Coastal Plain show: (a) a basal retrogradational Succession S1 constituted by beach and estuarine sands and salt-marsh mud; (b) an intermediate progradational Succession S2 developed by mud progradation on tidal flats (mangroves) and; (c) an upper retrogradacional sandy Succession S3 represented by coastal dunes, beaches, chêniers and sand shoals. The Holocene evolution in the Northern Brazil, began when sea level reached the present position 5,200y BP (maximum of Holocenic Transgression). This event was characterized by the development of a retrogradational Succession S1 (transgressive sand sheet). During sea level stillstand conditions, the seaward muddy progradation took representing the beginning of the Succession S2 development, whose boundary with the coastal Succession S1 is flat and well defined as a consequence of subaerial progradation, which was interrupted by short transgressive pulses, responsible dune-beach ridge deposition that was isolated due to shoreline muddy progradation forming chêniers. The Succession S3 is characterized by retrograding sandy coast succession (dune-beach ridge and sandy tidal shoal) situated on the progradational muddy Succession S2, which characterizes the present transgressive episode, responsible for Succession S3 development. The interpretation of the sedimentary and stratigraphic patterns of the Bragança Coastal Plain, based on sequence stratigraphy concepts is the first tentative of application of this concepts on Holocene coastal environments in the Northern Brazil. Key-Words: morphostratigraphy, stratigraphic facies, relative sea-level changes, sequence stratigraphy, Holocene.
INTRODUÇÃO
Os ambientes costeiros brasileiros têm sido intensa e extensivamente estudados nas
regiões nordeste, sudeste e sul, onde as costas são dominadas por ondas e submetidas a um
regime de micro (0 a 2m) a mesomarés (2 a 4 m de amplitude). As seqüências costeiras são
progradantes, desenvolvidas sob condições de nível de mar descendente (Dominguez 1982;
Dominguez et al. 1987; Villwock 1987; Martin & Suguio 1989; Dominguez et al. 1992; Martin
et al. 1993; 1996; Tomazelli & Villwock 1996; Angulo & Lessa 1997).
1 Artigo publicado no Boletim do Museu Paraense Emílio Goeldi, Série Ciências da Terra, Vol. 10, p. 45-78

36
Toda a linha de costeira do norte do Brasil é dominada por macromarés com feições
geomorfológicas características, com extensos depósitos de planície de maré (manguezais), com
estuários, baixios, pântanos salinos, chêniers, dunas, praias e leques de lavagens associados
(Souza Filho 1995; Souza Filho & El-Robrini 1996a; Santos 1996; Silva 1996; Souza Filho & El-
Robrini 1996c). Estas planícies costeiras dominadas por maré são desenvolvidas sob condições
de subida (costas retrogradacionais), de estabilidade ou mesmo de queda do nível relativo do mar
(costas progradantes), em resposta às diferentes combinações de história das variações de nível
relativo do mar, largura e gradiente da plataforma continental, incidência de ondas, nível de
energia, amplitude de maré e suprimento sedimentar (Dalrymple et al. 1992).
Deste modo, seqüências costeiras são assumidas como sendo depositadas, principalmente,
durante condições de nível de mar estável e transgressivo, enquanto quedas relativas do nível do
mar estão geralmente relacionadas a eventos não-deposicionais, com superfícies erosivas
amplamente desenvolvidas (Allen & Posamentier 1993).
Vários trabalhos têm sido realizados na Região Norte com o intuito de esclarecer os
ambientes sedimentares e as sucessões estratigraficas holocênicas, associadas às feições
morfológicas (Souza Filho 1995; Souza Filho & El-Robrini 1995, 1996c; Silva 1996; Santos
1996). Deste modo, Souza Filho & El-Robrini (1996a; 1996b) analisaram pela primeira vez as
sucessões estratigráficas à luz do conceito da estratigrafia de seqüências.
O objetivo deste artigo é apresentar: (a) a interrrelação entre as unidades
morfoestratigráficas e as fácies estratigráficas da Planície Costeira Bragantina, com às variações
de nível relativo do mar e; (b) a provável evolução holocênica da Planície Costeira Bragantina
baseada no conceito de estratigrafia de seqüências.
METODOLOGIA
Os métodos e os equipamentos utilizados durante a execução deste trabalho incluíram
sensoriamento remoto, geo-processamento, testemunhagem à vibração, análises sedimentológicas
e faciológicas.
A cena do sensor TM do satélite LANDSAT-5, datada de 24/07/1991 (órbita-ponto 222-
61), foi processada digitalmente através do Sistema de Tratamento de Imagens (SITIM-340),
quando foi obtida a composição colorida 5R 4G 3B, definida como a melhor para o estudo das
áreas de manguezais.

37
Os levantamentos de campo foram realizados para a identificação da vegetação, da textura
sedimentar e dos ambientes de sedimentação. Foram realizados 35 testemunhagens à vibração,
cujas amostras foram marcadas e processadas, segundo as técnicas descritas por Figueiredo Jr.
(1990). Na descrição dos testemunhos, foram identificadas as estruturas e texturas sedimentares
e cor dos sedimentos, utilizando a tabela da Rock-Color Chart Committee (1984), coletando-se
também amostras sedimentológicas para análises granulométrica e morfoscópica.
Os estudos granulométricos foram realizados somente em amostras predominantemente
arenosas, utilizando-se métodos clássicos descritos por Suguio (1973).
CENÁRIO REGIONAL
A Planície Costeira Bragantina, no nordeste do Estado do Pará, apresenta cerca de 40 km
de linha de costa, estendendo-se desde a Ponta do Maiaú até a foz do Rio Caeté (Figura 1). Ela
está inserida na Bacia Costeira de Bragança-Viseu (Cretáceo) e sua geometria e paleotopografia
estão associadas às movimentações tectônicas, que tem controlado as espessuras dos depósitos
terciários e quaternários (Igreja 1991; Costa et al. 1993, Costa & Hasui 1997).
Regionalmente, a área está inserida em uma costa indentada transgressiva dominada por
macromaré que, Franzinelli (1982, 1992) subdividiu em dois setores: (1) a oeste da Baía de
Pirabas, onde as baías delimitam as falésias ativas do Planalto Costeiro e; (2) a leste, o Planalto
Costeiro que recua rumo ao sul, constituindo falésias mortas e as baías recortam a planície
costeira.
Souza Filho (1995) compartimentou geomorfologicamente a geomorfologia da Planície
Costeira Bragantina em três domínios: (a) planície aluvial, com canal fluvial, diques marginais e
planície de inundação; (b) planície estuarina, com canal estuarino subdividido em funil estuarino,
segmento reto, segmento meandrante e curso superior, canal de maré e; planície de inundação e;
(c) planície costeira, com ambientes de pântanos salinos (interno e externo), planície de maré
(manguezais de supramaré, manguezais de intermaré e planície arenosa com baixios de maré),
chêniers, dunas costeiras e praias (Figura 1).

38
Figura 1 - Mapa de localização da planície Costeira Bragantina. Observar a compartimentação morfológica e a posição dos perfis P1 e P2.
O clima da área é equatorial quente e úmido (Amw de Köppen), com estação muito
chuvosa de dezembro a maio e precipitação anual de 3.000 mm, com umidade relativa do ar
oscilando entre 80 e 91% (Martorano et al. 1993). As condições hidrodinâmicas são
caracterizadas por macromarés semidiurnas, que durante os períodos de sizígia chegam a alcançar
amplitudes de até 6m (DHN 1995).
.... hrflft âe
de $ Hat a j ó '. (
y vy^
■im*9A A Í*^Beié,n HE do Pará

39
AMBIENTES SEDIMENTARES, MORFOESTRATIGRAFIA E FÁCIES SEDIMENTARES O estudo dos ambientes sedimentares da Planície Costeira Bragantina (Figura 2) foi
realizado pela aplicação do conceito de unidades morfoestratigráficas introduzido por Frey &
Williman (1960) no mapeamento de depósitos glaciais pleistocênicos do Lago Michigan (Estados
Unidos). As unidades morfoestratigráficas foram definidas pelas características morfológicas
superficiais, pela estratigrafia de subsuperfície e pelos processos sedimentares atuantes e,
portanto, têm uma conotação genética, sendo descritas a partir da planície aluvial rumo à planície
costeira. Este conceito morfoestratigráfico tem sido amplamente utilizado na geomorfologia
costeira por Rhodes (1982), Woodroffe et al. (1986, 1989), Woodroffe & Mulrennan (1993) e
outros autores na planície costeira da Austrália.
No entanto, o conceito estratigráfico é referido aos depósitos subsuperficiais que não
podem ser interpretados em termos dos ambientes atuais. A história deposicional e as mudanças
ambientais associadas são reveladas a partir da análise faciológica dos depósitos, definidas em
termos texturais, mineralógicos, estruturas sedimentares e conteúdo fossilífero.
Onze unidades morfoestratigráficas e cinco fácies estratigráficos foram definidas na
Planície Costeira Bragantina, estando suas principais características sintetizadas nas Tabelas 1 e 2
respectivamente.
UNIDADES MORFOESTRATIGRÁFICAS
Planície aluvial
Planície de inundação
Apresentam espessuras em torno de 1m sobre o Planalto Costeiro (sedimentos basais)
(Figura 3A), sendo constituídas por lama oxidada de coloração cinza oliva claro (5Y 5/6), sem
estrutura sedimentar aparente, fitoturbada, com marcas e fragmentos de raízes. Lentes
milimétricas de areia fina estão intercaladas a este pacote de lama, provavelmente relacionados
aos períodos de grandes inundações, quando a água do canal fluvial transborda e deposita os
sedimentos finos por decantação na planície de inundação (Figura 3B).

40
Figura 2 - Mapa dos ambientes sedimentares da Planície Costeira Bragantina (Modificado de Souza Filho, 1995).
00°43'18"
Ajuruteua Baia do Maiau
ò
o stuano
do A Cae
i ± ±
li li i
Bragança 2 km
Praias
Planície arenosa
01o04117" Pântanos salinos internos
Pântanos salinos externos
X] Dunas costeiras ÜE Planície de inundação
jlQI Manguezal de supramaré Planície estuarina
Manguezal de intermaré | _ Planalto costeiro
Chênier

Tabela 1 - Principais características das unidades morfoestratigráficas
Unidades
Morfoestratigráficas Características dos Sedimentos Morfologia Tempo de Inundação Vegetação
Planície de Inundação Lama cinza oliva claro rica em fragmentos orgânicos e fitoturbações
Áreas planas limitadas por levees e pelo planalto costeiro
Somente durante os períodos de grandes cheias
Herbácea (Aleucharias sp.)
Levee Areia lamosa cinza oliva claro, fitoturbada e rica em fragmentos orgânicos
Diques vegetados ao longo do canal fluvial
Somente durante os períodos de grandes cheias
Mangue sp. Aleucharias sp
Barra de Canal Areias fina a média de cor amarelo pálido, com marcas onduladas
Barras arenosas longitudinais de meio de canal e barras arenosas em pontal
Constantemente inundados ________
Manguezal de Supramaré
Lama superficial oxidada, cinza acastanhada, fitoturbada com marcas e fragmentos orgânicos. Seguida de lama cinza médio, intercalada com
fragmentos de matéria orgânica
Planície de supramaré, colonizada por mangue de pequeno porte
Inundação irregular durante as marés de sizígia mais altas (5-6m)
Mangue
Pântano Salino Camada superficial rica em fragmentos orgânicos pretos acastanhados escuros, seguida de lama
oxidada de cor marrom amarelada e por lama cinza médio, maciça, com areias formando acamamento
lenticular
Planície de supramaré encaixada em uma paleo rede de drenagem colmatada,
limitada pelo planalto costeiro e recortada por córregos de marés
Inundação irregular durante as marés de sizígia mais altas (5-6m) e durante todo o período chuvoso
Herbácea
(Aleucharias sp.)
Manguezal de Intermaré
Lama superficial oxidada, cinza acastanhada, seguida de lama cinza médio, sem estruturação aparente, fitoturbada com marcas e fragmentos
orgânicos
Planície de intermaré colonizada por mangue de grande porte
Inundado regularmente pela maré semidiurna
Mangue
Planície Arenosa Areias quartzosas, finas, cinza muito claro, com estruturação maciça, estratificação plano-paralela, cruzada tangencial de pequeno porte, acamamento
flaser e clastos de argila retrabalhados
Extensas áreas planas, recortadas por canais de marés, com “sand waves”, (mega) ondulações e barras expostas
durante a maré baixa
Inundado regularmente pela maré semidiurna
________
Barra em Pontal Areias quartzosas, finas, cinza muito claro, intercaladas com lama, formando estrutura
heterolítica inclinada...
Forma lunada Constantemente inundados ________
Dunas Costeiras Areias quartzosas, muito fina, amarelo pálido, com estratificação cruzada tabular de grande porte e
estratificação oblíqua
Dunas longitudinais e piramidais _______________
Arbustiva
Chênier Areias quartzosas cinza amarelado a cinza muito claro, finas a muito finas, com estrutura mosqueada
no topo e cruzada de médio porte na base
Cordões com cristas irregulares e cordões com cristas alongadas,
limitados por manguezais
Inundado somente no período chuvoso
Arbustiva
Praia Areias quartzosas finas, com fragmentos de conchas, cinza muito claro, com estratificação
plano-paralela
Extensas áreas planas, inclinadas 2º rumo ao mar, recortadas por sistema de
calha e crista (“ridge e runnel”)
Inundado regularmente pela maré semidiurna
________

42
Tabela 2- Principais características das fácies estratigráficas
Fácies
estratigráficas Característica dos Sedimentos Paleoambiente Prof. (m)
Areia Fluvial Areias quartzosas, médias a grossas, muito mal selecionadas
Fundo de canal fluvial
5
Areia e lama estuarina/ maré
Areias quartzosas, com fragmentos de conchas, bem selecionadas, com estratificação plano paralela, marcas onduladas e estrati-ficação cruzada de baixo ângulo e
pequeno porte, intercalada com lamas cinza médio, que constituem acamamentos de maré e flaser
Sedimentos do face praial (“shoreface”) e de barras arenosas
de foz estuarina
2.5 - 4
Areia e lama de barra em pontal
Areias quartzosas finas, cinza claro, intercalado com lama e/ou fragmentos orgânicos, formando estrutura
heterolítica inclinada
Canal estuarino e/ou de maré
2-4
Areia marinha Areias quartzosas finas, cinza claro, com estratificação plano-paralela e cruzada de baixo ângulo
Face praial 2-5
Sedimentos basais Lama arenosa azulada, com manchas marrom claro e vermelho moderado, com grânulos e seixos ferruginosos
Leques aluviais do Grupo Bar-reiras
____
Diques marginais
São constituídos por areias finas a muito finas, com intercalações milimétricas de lama.
Os sedimentos estão oxidados, com coloração marrom oliva claro (5Y 5/6), fitoturbados com
marcas e fragmentos de raízes. Devido à intensa fitoturbação, as laminações estão completamente
obliteradas, dando ao pacote aspecto mosqueado.
Barras de canal
As barras longitudinais e em pontal são as mais comuns no canal fluvial do Rio Caeté. As
barras longitudinais formam corpos arenosos no meio de canal e são constituídas por areias finas
a médias de coloração cinza muito claro (N8). As barras em pontal ocorrem nas porções
convexas dos meandros, sendo constituídas por estratos arenosos centimétricos (2 cm) de
coloração cinza muito claro (N8) recobertos por lâminas lamosas (“mud drapes”) milimétricas.
Planície estuarina
Barra em pontal
Dois tipos de barras em pontal ocorrem na área: barras em pontal arenosas, situadas a
jusante do sistema estuarino e barras em pontal lamosas situadas a montante do estuário.

43
As barras em pontal arenosas são superpostas por depósitos lamosos de manguezal de
intermaré. São constituídas por pacote inferior (150-254 cm) marcado pela alternância de níveis
arenosos de 1 a 10 cm de espessura, de coloração cinza muito claro (N8), limitadas por lâminas
lamosas de 5 mm a 5 cm de espessura, de coloração cinza médio (N5), com 20º a 25º de
mergulho, caracterizando uma estratificação heterolítica inclinada. O pacote superior (0-210 cm)
é caracterizado por areias quartzosas finas, bem selecionadas, com poucos fragmentos de conchas
e coloração cinza muito claro (N8), sem estruturação interna, intercalado com lentes milimétricas
de matéria orgânica cominuída (“coffee ground”) e lâminas lamosas com 10º de mergulho.
Blocos e seixos de lama retrabalhados por correntes de maré também ocorrem.
O pacote superior das barras em pontal está associada às porções mais rasas da barra, que
sofre maior retrabalhamento pelas correntes de maré e migram rumo ao eixo do canal principal a
medida que o meandro desloca-se lateralmente.
As barras em pontal lamosas são constituídas por pacotes (“bundles”) milimétricos de
areia fina, bem selecionada, recobertos por camadas lamosas com até 5 cm, inclinadas de 30º,
constituindo a estratificação heterolítica inclinada.
Planície costeira
Pântano salino
Apresenta espessura máxima de 600 cm e recobre depósito de canal abandonado,
representado pelo fácies areia de canal fluvial (Figura 3C e 3D). Os 500 cm basais são
constituídos por lama de coloração cinza médio (N5), sem estrutura sedimentar aparente.
Observam-se lentes de areia fina intercalada a lama, caracterizando acamamento lenticular
simples. Feições de bioturbação também ocorrem ao longo do pacote lamoso. Segundo Bouma
1962 (in Frey & Basan 1978), a espessura do pacote lamoso depende da deposição de argilas na
forma de flocos ou de grânulos de granulometria maior. Os sedimentos subseqüentes (30 a 10
cm) são constituídos por lama oxidada de coloração cinza oliva claro (5Y 6/1), superposta por
lamas ricas em matéria orgânica fragmentada, de coloração preto acastanhada (5YR/6).
Manguezal de supramaré
A espessura do depósito é superior a 500 cm, sendo o intervalo basal (65-430 cm)
marcado pela intercalação de estratos de lama e matéria orgânica de 2 a 10 mm de espessura, com

44
mergulho de 20º, caracterizando estratificação heterolítica inclinada, onde a areia é substituída
por matéria orgânica; enquanto o pacote superficial (0-65 cm) é constituído por lama orgânica de
coloração cinza médio (N5), sem estrutura sedimentar aparente, representativa da planície de
supramaré lamosa, seguida de lama orgânica oxidada, de cor cinza amarelada (5Y 7/2), com
manchas oliva claro acastanhadas (5Y 5/6), fitoturbada com marcas e fragmentos de raízes.
Manguezal de intermaré
A espessura desses depósitos varia de 300 a 600 cm. De 430 a 40 cm, ocorre um pacote de
lama orgânica, de coloração cinza médio (N5), sem estrutura sedimentar aparente, fitoturbado
com marcas e fragmentos de raízes, representativo da planície de intermaré lamosa. O pacote
superior (40-0 cm) é constituído por lama orgânica oxidada, de coloração amarelo escuro (5Y
6/4), com manchas marrom claro (5 YR 5/6), bastante fitoturbada por fragmentos de raízes. Esta
unidade representa o episódio de progradação lamosa holocênica da planície costeira.
Dunas costeiras
As dunas longitudinais e piramidais vegetadas são compostas por areias quartzosas
angulosas, muito finas, bem selecionadas e com poucos fragmentos de conchas. As dunas
longitudinais apresentam estratificação cruzada tabular de grande porte, mergulhando 26º/210ºAz
e marcas de raízes, enquanto as dunas piramidais (Goldsmith 1978) apresentam camadas que
mergulham em sentidos opostos à linha de crista da duna, que é paralela a direção dos ventos
alísios (270º Az), resultando na estratificação cruzada obliqua. Dunas barcanóides e piramidais
não fixadas, ocorrem sobre a pós-praia, constituindo um campo de dunas móveis com 0,5 a 1m de
altura, que migram rumo ao continente (Figura 3G).
Esta unidade é formada pelo retrabalhamento eólico dos sedimentos das planícies
arenosas e das praias. As dunas migram rumo ao continente, soterrando os depósitos de
manguezal da planície lamosa (Souza Filho & El-Robrini 1996c).
Chêniers
Apresenta espessura máxima de 5,5 m, cujo pacote arenoso repousa em discordância
erosiva sobre um pacote lamoso de 130 cm de espessura, com topo exibindo tubos biogênicos
preenchidos por areias finas, evidenciando uma superfície de exposição subaérea. Um nível
de conchas de Mytela sp. em posição de vida e fragmentos de conchas são observados

45
neste intervalo. O intervalo basal (130 - 100 cm) é marcado por estratificação inclinada,
mergulhando 23º rumo ao continente, com alternância de estratos milimétricos de areia fina e
matéria orgânica, caracterizando a estratificação de camadas frontais (“foreset”) da porção distal
do leque de lavagem, superposta por intervalo de 100-0 cm, onde ocorrem sedimentos arenosos
finos, de coloração castanho amarelado pálido (10YR 6/2) a laranja muito pálido (10yr 8/2),
bem selecionados, bastante bioturbado e com estrutura mosqueada, característica da porção
proximal do leque de lavagem e/ou depósito de estirâncio (“foreshore”), que apresenta
estratificação horizontal (Figura 3G) (Souza Filho & El-Robrini 1997b). Os 3 m superiores
deste depósito de chêniers são constituídos por dunas vegetadas, de areias muito finas, de
coloração marrom pálido (10 YR 6/2), bem selecionadas, cujas estruturas primárias estão
completamente obliteradas por processos pedogenéticos.
Este depósito é típico de chêniers, sendo semelhante aos descritos por Penland & Suter
(1989) no Delta do Mississipi, diferenciando-se deste modo dos depósitos de cordão de praia e
esporões arenosos (“spits”).
Planície arenosa
Apresenta espessura superior a 400 cm. O intervalo basal (430 - 350 cm) é caracterizado
por areias finas a muito-finas, de coloração cinza muito claro (N8), bem selecionadas, com
estrutura maciça, com alguns fragmentos de conchas e micas; enquanto o intervalo subseqüente
(350 - 200 cm) apresenta estratificações plano-paralelas, cruzadas tangenciais e marcas
onduladas, além de acamamento flaser simples, tubos biogênicos preenchidos por lama e clastos
de argila retrabalhados. O pacote superior (200 - 0 cm) é constituído por areias quartzosas finas,
cinza muito claro (N8), bem selecionadas, com estrutura aparentemente maciça (Figura 3H).
Estirâncio (Foreshore)
A espessura varia de 50 cm a 300 cm, tendo sido depositada sobre manguezais de
intermaré. Na zona de espraiamento, próximo a escarpa de praia, observam-se estratificações
cruzadas de baixo ângulo, desenvolvidas por migração de marcas onduladas. São constituídas em
profundidade por areias quartzosas finas, bem selecionadas, com estratificação cruzada planar de
baixo ângulo, que caracteriza os depósitos de estirâncio (Figura 3I). Os sedimentos arenosos

46
migram sobre a unidade morfoestratigráfica manguezal de intermaré, constituindo, deste modo,
praias transgressivas.
FÁCIES ESTRATIGRÁFICOS
Areias de canais fluviais
Ocorrem sob sedimentos lamosos de pântanos salinos a 520 cm de profundidade. Estas
areias fluviais são essencialmente quartzosas, angulosas, de granulometria média a grossa, mal
selecionadas, de coloração cinza claro (N7) e por vezes recobertas por uma fina película de
hidróxido de ferro de cor castanho amarelo pálido (10YR 6/2). Estes sedimentos são típicos de
depósitos de fundo de canais fluviais, que foram progressivamente preenchidos por depósitos
lamosos de pântano salino (Figura 3C).
Areia e lama estuarinas e de planície maré
Esta fácies está amplamente distribuída sob as unidades morfoestratigráficas de pântano
salino (externo), a uma profundidade que varia de 250 a 400 cm. As areias são quartzosas, finas a
muito finas, angulosas, de coloração cinza muito claro (N8), bem selecionadas, com estruturas
maciças, plano paralelas, marcas onduladas e cruzadas de pequeno porte intercaladas com lentes
milimétricas de matéria orgânica. As lamas são de cor cinza médio (N5) e ocorrem intercaladas
às areias, constituindo acamamentos de maré, estrutura flaser e heterolítica inclinada,
evidenciando influência da maré nesta fácies estratigráfica.
Areia e lama de barra em pontal estuarina
Esta fácies encontra-se interdigitada com os depósitos lamosos das unidades
morfoestratigráficas de pântano salino e manguezal de intermaré. É constituída pela alternância
de pacotes (“bundles”) arenosos com mergulho de 10 a 30º, recobertos por lâminas lamosas,
constituindo estratificação heterolítica inclinada, representativa da migração lateral de barras em
pontal em canais de maré lamosos (Figura 3D).
Areia marinha
Esta fácies está amplamente distribuída sob a unidade morfoestratigráfica manguezal de
intermaré a profundidade que varia de 2 a 4 m. As areias são quartzosas, finas a muito finas, de
47
coloração cinza muito claro (N8), bem selecionadas, com fragmentos de conchas, estruturas
maciças, plano-paralelas, marcas onduladas e cruzadas de pequeno porte, caracterizando o
ambiente de face praial, cujas areias tem origem na plataforma continental interna (Figura 3G).
Sedimento basal
Esta fácies foi encontrada próxima ao contato do planalto costeiro com a unidade
morfoestratigráfica Manguezal de Intermaré. É constituída por lama arenosa maciça, de coloração
cinza azulado claro (5B 7/1), com manchas marrom claro (5YR 5/6) e vermelho moderado (5R
4/6). Grânulos e seixos ferruginosos apresentam-se dispostos na matriz (Figura 3A). Esta fácies
estratigráfica é interpretada como sendo a fácies areno-argilosa superior do Grupo Barreiras
(Rossetti et al. 1989), que constitui o embasamento da planície costeira.
INFLUÊNCIA DAS VARIAÇÕES DO NÍVEL DO MAR NA SEDIMENTAÇÃO
COSTEIRA
Souza Filho & El-Robrini (1997a) admitem que a história evolutiva holocênica no norte
do Brasil, iniciou-se quando o nível relativo do mar alcançou a posição atual há cerca de 5.200
anos A.P (Simões 1981), que representaria o máximo da Transgressão Holocênica. Durante este
evento transgressivo, a subida do nível do mar provocou erosão dos depósitos do Grupo Barreiras
na Planície Costeira Bragantina formando falésias ativas, além da migração de um lençol
transgressivo constituído por depósitos de baixios de maré, praias e cordão de duna e praia. Este
evento afogou a rede de drenagem, que foi progressivamente colmatada, evoluindo para uma
seqüência de preenchimento de paleoestuários, representada pelo Pântano Salino, além de
esculpir as falésias mortas de 1m de altura, preservadas no contato do planalto com a planície
costeira, representativa da linha de costa deste período.
Durante este evento transgressivo, ocorreu o desenvolvimento da sucessão
retrogradacional S1. Esta sucessão estende-se na forma de lençol arenoso transgressivo no sentido
de costa afora (Figura 4), onde as fácies estratigráficas, predominantemente arenosas, foram
desenvolvidas em condições de ambiente praial de águas rasas, influenciado por ondas e
correntes de marés, enquanto os sedimentos lamosos dos pântanos salinos, preenchem os canais
estuarinos, superpondo-se aos sedimentos fluviais de fundo de canal (Figura 5).

Figura 3- Seções estratigráficas das unidades morfoestratigráficas e das fácies estratigráficas da Planície Costeira Bragantina: A- sedimentos basais, B- planície de inundação, C- pântano salino interno sotoposto pelo fácies areia-fluvial, D- pântano salino externo sotoposto pelo fácies areia e lama estuarina-maré; E - manguezal de supramaré; F- manguezal de intermaré sotoposto pelo fácies areia marinha; G- chênier sotoposto pela unidade manguezal de intermaré; H- planície arenosa; I- praia.
[• 1 Areia média grossa X Raízes EstraL cruzada
11 «* | Areia fina -■<; Marca ondulada Areia lamosa S Bioturbação
Superfície erosiva rX- Lama orgânica „ Conchas \~*I\ Lama orgânica oxidada Frag. de conchas
Lama sem estrutura Acam. lenticular aparente Acam. flaser Fragmentos orgânicos

49
Sob condições de nível de mar estável, observa-se a progradação lamosa da linha de costa
rumo ao mar, marcando o início de desenvolvimento do manguezal de intermaré. O contato do
lençol arenoso transgressivo, com os depósitos da frente de progradação lamosa é aplainado e
bruscamente definido (Figura 4), resultado de progradação subaérea, truncando sucessivos
cordões de praia, à medida que a linha de costa avança rumo ao mar (Souza Filho & El-Robrini
1997a).
Os sedimentos depositados durante este evento (sucessão S2) evidenciam a natureza
progradante da sedimentação costeira, que está associada a uma estabilização ou descida relativa
do nível do mar (Allen & Posamentier 1993). Deste modo, de acordo com Souza Filho & El-
Robrini (1996c) a sedimentação deixa de ser retrogradante e passa a ser progradante, marcada
pela planície de maré e barras arenosas (Figura 4).
Durante a fase de progradação, ocorreram fases de erosão, responsáveis pelo
retrabalhamento dos sedimentos costeiros, com deposição de cordões de dunas e praias (“dune-
beach ridge”) com leques de lavagem associados.
(m)
"-V 3: 3! 3! I / i ±
i i
i j£ Lt Ü jt jt: jt ^ j:
jÜ Ü ±±± ■± j±i i±i jli t it Í jii it it it
S3
§2
si;
EV=92 n Planície arenosa Barra em pontal E Manguezal Q Areia e lama estuarina/maré H Chênier □ Grupo Barreiras C3 Pântano salino ? contato inferido
5 km
S3- Sucessão 3 S2- Sucessão 2 Si- Sucessão 1
Figura 4- Seção estratigráfica generalizada Bragança-Ajuruteua, mostrando as sucessões estratigráficas S! , S2 e S3 e as unidades morfoestratigráficas e as fácies estratigráficas (ver localiza- ção na Figura 1)(Souza Filho & El-Robrini, 1997b).

50
O evento seguinte é representado pela sucessão S3, que marca uma nova situação de nível
relativo de mar transgressivo, onde o lençol arenoso transgressivo (baixios de maré e cordões de
dunas e praias) migra sobre os depósitos lamosos de manguezal e erode a linha de costa (Figura
4). Este novo evento transgressivo já foi reconhecido por Souza Filho (1995) e Silva (1996) no
litoral nordeste do Pará e por Tomazelli et al. (1997) na costa do Rio Grande do Sul.
ESTRATIGRAFIA DE SEQÜÊNCIAS DA PLANÍCIE COSTEIRA BRAGANTINA
A interpretação do padrão estratigráfico de sedimentação da Planície Costeira Bragantina,
baseado nos conceitos de estratigrafia de seqüências proposto por Posamentier et al. (1988) e
Posamentier & Vail (1988), é uma tentativa de se aplicar e discutir tais conceitos em ambientes
costeiros holocênicos do Norte do Brasil.
(m)
Legenda
l——I Pântano salino
Areia de canal fluvial
—1 Grupo Barreiras
250m
EV=93
Figura 5- Seção estratigráfica da unidade pântano salino. Notar o limite de seqüência basal sob o depósito fluvial sobreposto por lamas estuarinas, enquanto os interflúvios estão _e?postos a erosão subaérea (ver localização na Figura 1).

51
Qual é o limite de seqüência basal dos depósitos quaternários da Planície Costeira Bragantina?
A Planície Costeira Bragantina pode constituir, aproximadamente, uma seqüência
deposicional tipo 1, no sentido de Van Wagoner et al. (1988) e Posamentier & Vail (1988),
embora o limite de seqüências basal expresso por discordância erosiva sobre os depósitos
terciários do Grupo Barreiras, marcada na parede dos vales incisivos e seus interflúvios, seja
inferida, uma vez que não foi possível caracterizar toda a geometria do sistema de vales incisos.
Segundo Posamentier et al. (1988) e Posamentier & Vail (1988), a seqüência tipo 1 inclui
o limite de seqüência basal (SB), o trato de sistema de nível de mar baixo (TSMB), o trato de
sistema transgressivo (TST), a superfície transgressiva (ST), o trato de sistema de nível de mar
alto (TSMA) e a superfície de inundação máxima (SIM). Além do mais, outras importantes
superfícies, como a superfície de ravinamento por maré e/ou onda pode ser observada. No
entanto, na área em estudo as superfícies acima mencionadas ainda não foram amplamente
reconhecidas.
O limite de seqüência dos depósitos quaternários está esculpido em depósitos Mio-
pleistocênicos do Grupo Barreiras, sendo superposto por depósitos areno-argilosos pós-Barreiras
que, de acordo com Rossetti et al. (1989), são representativos de antigas dunas costeiras. Nos
interflúvios, este limite de seqüências permanece exposto e a superfície de discordância continua
sofrendo processos de erosão subaérea.
Essa discordância é interpretada como formada quando a taxa de queda eustática do nível
do mar excede a taxa de subsidência na quebra da plataforma continental, produzindo uma queda
relativa do nível do mar nesta posição (Van Wagoner et al. 1988). Assim, este limite de
seqüência é desenvolvido pela combinação da incisão fluvial que formou os vales e pela
exposição subaérea dos interflúvios, constituídos por depósitos terciários do Grupo Barreiras.
Trato de Sistema e as Sucessões Estratigráficas S1, S2 e S3
Duas são as possibilidades de se relacionar às sucessões estratigráficas S 1, S2 e S3 aos
tratos de sistemas. Na primeira, as sucessões S1 e S3 representariam um trato de sistema
transgressivo, enquanto a sucessão S2 constituiria o trato de sistema de nível de mar alto. A
segunda hipótese aqui discutida associa as sucessões S1, S2 e S3 a um único trato de sistema, o de
nível de mar alto, dentro do qual ocorrem variações do nível do mar, relacionadas a pulsos

52
transgressivos, regressivos e de nível de mar estável responsável por eventos de sedimentação
retrogradacional (sucessão S1 e S3) e progradacional (sucessão S2).
A sedimentação transgressiva, (Sucessão S1), é iniciada com a sedimentação de lamas
estuarinas, representadas pelos depósitos de pântanos salinos (Souza Filho & El-Robrini 1996b).
Com a contínua subida do nível do mar até 5.200 anos A.P. (Simões 1981), as areias e lamas
estuarinas e de planície de maré e areias marinhas migram rumo ao continente, superpondo os
depósitos lamosos dos pântanos salinos, causando o recobrimento transgressivo do Planalto
Costeiro, vindo a constituir um extenso lençol arenoso transgressivo. Caso os depósitos
estuarinos e marinhos venham a recobrir os depósitos fluviais e os depósitos terciários (Grupo
Barreiras), esta discordância viria a marcar uma superfície transgressiva que representaria a base
do trato de sistema transgressivo, ou simplesmente a base de uma parasseqüência transgressiva
(Posamentier et al. 1988).
A sucessão S2 é caracterizada por aumento de espessura dos depósitos progradacionais,
interpretados como sendo depositados durante nível relativo de mar estável (Souza Filho 1995;
Souza Filho & El-Robrini 1996c), onde o recuo da linha de costa dá lugar à progradação
generalizada da planície costeira. Assim, a sedimentação deixa de ser retrogradacional e passa a
ser progradacional, representada pelos depósitos lamosos da planície de maré (manguezais de
intermaré) e barras arenosas. Segundo Allen & Posamentier (1993), estes depósitos não parecem
ter se acumulado durante a fase transgressiva, pois eles apenas se formam em períodos de
progradação geral da costa.
A superfície entre as sucessões S1 e S2 é marcada por uma superfície de recobrimento
regressivo (Posamentier & Vail 1988) reconhecida pelo contato marcante entre as areias e lamas
estuarinas e de planície de maré e areias marinhas da sucessão S1, superpostas por lamas
orgânicas dos manguezais de intermaré da sucessão S2 (Figura 4).
Sobre as unidades de manguezais de intermaré, representativa da progradação costeira,
repousam os depósitos de chêniers. De acordo com Hoyt (1969), corroborado por Augustinus
(1989), os chêniers delimitam períodos erosivos da linha de costa, responsáveis pela interrupção
da progradação lamosa e formação de uma superfície de ravinamento por onda e/ou maré
(Demarest & Kraft 1987). Esta superfície é uma importante feição que marca períodos de nível
de mar transgressivo, responsável pelo recuo erosivo da linha de costa, formando esta superfície
de ravinamento.

53
No nordeste do Pará, o processo de formação dos chêniers é dominado pela ação de
ondas, durante eventos de marés de sizígia, quando se intensificam as correntes de deriva
litorânea e de marés, que retrabalham os sedimentos, removendo os sedimentos pelíticos e
concentrando as areias. Esta variação periódica de energia no ambiente litorâneo produz uma
variação episódica no suprimento de sedimentos arenosos marinhos oriundo da plataforma
contiental interna que, associada à progradação lamosa da planície de maré, é responsável pelo
desenvolvimento dos chêniers.
No entanto, a progradação lamosa da planície de maré, relacionada à formação dos
chêniers, é resultado também de variações do nível do mar. Tal proposta é corroborada por Souza
Filho & El-Robrini (1996c), que admitem um modelo sedimentar atual resultante da progradação
da linha de costa durante uma fase de nível de mar estável, com sedimentação dos extensos
depósitos lamosos de manguezal da planície de maré lamosa, intercalada com eventos
transgressivos de curta duração, quando se deu o desenvolvimento dos chêniers, que marcam uma
fase retrogradacional atual da linha de costa, onde vários ambientes sedimentares atuais estão
evoluindo.
Atualmente, a porção distal dos estuários está sendo transformada em deltas (Souza Filho
1995), enquanto sua porção proximal já está completamente preenchida. Além do mais, minerais
pesados euedrais de fontes fluviais estão sendo depositados na plataforma continental interna (El-
Robrini et al. 1992), resultado da progradação da linha de costa e eventual agradação fluvial. A
linha de costa vem sofrendo, novamente, processos erosivos e os ambientes litorâneos vem
migrando sobre os manguezais de intermaré e uma nova superfície de ravinamento por onda e/ou
maré está erodindo os depósitos progradacionais da sucessão S2, o que indicaria que as sucessões
S2 e S3 poderiam ser sincrônicas.
CONCLUSÕES
As variações do nível do mar e a história estratigráfica da Planície Costeira Bragantina
iniciada a partir de 17.400 anos A.P. (Milliman & Barreto 1975), está intimamente associada a
construção de uma antiga barreira recifal constituída por areias biogênicas (Silva 1993) e bancos
carbonáticos com algas coralíneas, hexacorais e ostreídeos (Vital et al. 1991) desenvolvida sob
condições de nível de mar baixo. Esta barreira recifal foi formada quando a plataforma
continental estava exposta e o nível relativo do mar estaria 80 a 90 m abaixo do atual, beirando a

54
quebra do talude. Sob esta condição de queda do nível relativo do mar, vales fluviais foram
escavados no Planalto Costeiro, formando um sistema de vales incisivos (Dalrymple et al. 1994),
que recortavam a plataforma continetal exposta rumo ao mar (Souza Filho 1993). A erosão
fluvial seria a responsável pela formação do limite de seqüência basal erosivo, sobre o qual
depositaram-se os sedimentos.
Milliman & Emery (1968) e El-Robrini & Souza Filho (1993) acreditam que a partir de
17.400 anos A.P., o nível relativo de mar começou a subir e a extremidade distal (jusante) dos
vales fluviais foi sendo transgredida e convertida em um estuário. Durante este evento, grande
quantidade de sedimentos fluviais foi aprisionada no estuário e os sedimentos arenosos
reliquiares da plataforma continental foram retrabalhados por ondas ao longo da linha de costa
(Faria Jr. et al. 1987; El-Robrini et al. 1992). A ocorrência de depósitos estuarinos acumulados
sobre areias grossas fluviais, indica que não ocorrem significante agradação fluvial durante rápida
subida do nível relativo do mar (Allen & Posamentier 1993). Conseqüentemente, o suprimento
sedimentar oriundo do curso superior dos rios, foi depositado por agradação, enquanto os
depósitos estuarinos influenciados por maré, recobriram (“onlap”) os sedimentos fluviais, sendo
o vale fluvial, progressivamente transformado em estuário.
Segundo Allen & Posamentier (1994), os sedimentos lamosos (pântanos salinos)
acumulados entre a foz do paleoestuário (limite planalto/planície costeira) e seu curso superior
viriam a constituir a primeira fase da transgressão e representaria o limite mais inferior de uma
seqüência ou sucessão transgressiva.
Durante a subida do nível relativo do mar no Holoceno, os sedimentos arenosos e lamosos
(fácies areia e lama estuarina e de planície de maré) formavam as barras arenosas de maré, a
planície arenosa de foz de estuários e os depósitos de face praial (fácies areia marinha) que
recobrem o Planalto Costeiro e migraram em direção ao continente, constituindo a sucessão S1.
A sucessão S1 foi interpretada como sendo de ambientes estuarino, parálico (pântano
salino) e de face praial (“shoreface”), constituindo uma sucessão retrogradacional, cuja evolução
está intimamente relacionada a um período de nível de mar transgressivo. Tal situação
proporcionou a migração destes ambientes costeiros rumo ao continente sob ação de ondas e
correntes de marés, que erodiram o Planalto Costeiro formando falésias, atualmente distantes 25
km da linha de costa. Com a contínua subida do nível relativo do mar, os estuários foram
progressivamente preenchidos, e os depósitos lamosos preencheram os antigos cursos fluviais

55
delineando uma paleorrede de drenagem (Figura 2), onde ocorre o ambiente de pântanos salinos.
Segundo Souza Filho & El-Robrini (1997a), este evento transgressivo pode ser correlacionável ao
nível de mar mais alto do Holoceno, conhecido na costa leste brasileira como Transgressão
Holocênica (5.100 anos A.P.), responsável pelo afogamento de cursos fluviais que foram
transformados em estuários (Dominguez 1982; Suguio et al. 1985; Martin & Suguio 1989,
Martin et al. 1996). Estas evidências são observadas, na área de estudo, além de sambaquis
datados de 5.200 anos A.P. (Simões 1981) localizados na base das falésias. Estes indicadores
levam a concluir que a sucessão retrogradacional S1 pode vir a representar o estágio final de
sedimentação sob condições de nível de mar transgressivo.
Posteriormente, sob condições de nível de mar estável ou com taxa de subida mais lenta,
desenvolve-se a sucessão S2, constituída pelo ambiente de planície de maré (manguezais de
intermaré e supramaré), que vem a representar uma sucessão progradacional desenvolvida sob
condições de nível de mar alto estável. O limite desta sucessão S2 com a sucessão S1 é marcado
por uma superfície de recobrimento regressivo bem definida, resultado da progradação lamosa
subaérea sobre os depósitos arenosos (Figura 4 e 5), a medida que a linha de costa avança em
direção ao mar. Assim, admite-se que estes depósitos lamosos da planície de maré tenham se
acumulado durante período de progradação geral da linha de costa, sob condições de nível de mar
alto estável.
A sucessão S3 foi interpretada como de ambiente litorâneo (dunas costeiras, praias
e chêniers”) e estuarino, representando eventos transgressivos de curta duração, responsável pela
fase retrogradacional atual da linha de costa, onde vários ambientes sedimentares atuais estão
evoluindo.
Desta maneira, pode-se concluir que a aplicação dos conceitos de estratigrafia de
seqüências na Planície Costeira Bragantina é possível, mas para que se estabeleça com precisão
os limites das sucessões e sua geometria interna, se faz necessária a utilização de novas
ferramentas como a sísmica de alta resolução, perfilagem de raios gama, testemunhagens mais
profundas e datações isotópicas. Tais resultados viriam contribuir para melhor entendimento da
estratigrafia de seqüência costeira e sua relação com as variações do nível do mar, sendo possível
então se definir com precisão os limites de seqüências e a individualização dos tratos de sistemas.

56
AGRADECIMENTOS
Os autores agradecem ao Conselho Nacional de Desenvolvimento Científico e
Tecnológico (CNPq) pela concessão da bolsa de estudo ao primeiro autor desse trabalho; ao
Curso de Pós-Graduação em Geologia e Geoquímica da Universidade Federal do Pará
(CPGG/UFPA) pelo financiamento das etapas de campo e utilização dos laboratórios do Centro
de Geociências. Ao geólogo Msc. Márcio Sousa da Silva pela inestimável ajuda nos trabalhos de
campo. Aos pesquisadores Msc. Amilcar Carvalho Mendes e Dra. Dilce Rossetti (CNPq/Museu
Paraense Emílio Goeldi) e Profa. Dra. Ana Maria Góes (Departamento de Geologia/Universidade
Federal do Pará) pelas discussões, sugestões e revisão do texto.
REFERÊNCIAS BIBLIOGRÁFICAS
ALLEN, G.P. & POSAMENTIER, H.W. 1993. Sequence stratigraphy and facies model of an
incised valley fill: The Gironde Estuary, France. Journal of Sedimentary Petrology, 63:
378-391.
ALLEN, G.P. & POSAMENTIER, H.W. 1994. Transgressive facies and sequence architecture in
mixed tide-and-wave-dominated incised valleys: Example from the Gironde Estuary,
France. In: DALRYMPLE, R.W.; ZAITLIN, B.A.; SCHOLLE, P.A. (ed) Incised-valley
systems: origin and sedimentary sequences. Tulsa, SEPM,p.225-240.
ANGULO, R.J. & LESSA, G.C. 1997. The Brazilian sea level curves: a critical review with
enphasis on the curves from Paranaguá and Cananéia regions. Marine Geology, 140: 141-
166.
AUGUSTINUS, P.G.E.F. 1989. Chêniers and chêniers plains: a general introduction. Marine
Geology, 90: 219-229.
COSTA, J.B.S.; BORGES, M.S.; BEMERGUY, R.L.; FERNANDES, J.M.G.; COSTA JR., P.S.
COSTA, M.L. 1993. Evolução cenozóica da região de Salinópolis, Nordeste do Estado do
Pará. Geociências, 12: 353-372.
COSTA, J.B.S. & HASUI, Y. 1997. Evolução geológica da Amazônia. In: COSTA, M.L. &
ANGÉLICA, R.S. (ed.) Contribuições a Geologia da Amazônia. Belém, FINEP/SBG, p.15-
90.
DALRYMPLE, R.W.; ZAITLIN, B.A.; BOYD, R. 1992. Estuary facies models: conceptual basis
and stratigraphic implications. Journal of Sedimentary Petrology, 62: 1130-1146.

57
DALRYMPLE, R.W.; BOYD, R.; ZAITLIN, B.A. 1994. History of research, types and internal
organization of incised-valley systems: introduction to the volume. In: In: DALRYMPLE,
R.W.; ZAITLIN, B.A.; SCHOLLE, P.A. (ed.) Incised-valley systems: origin and
sedimentary sequences. Tulsa, SEPM, p. 3-10.
DEMAREST, J.M. & KRAFT, J.C. 1987. Stratigraphic record of Quaternary sea-levels:
implications for more ancient strata. In: NUMMENDAL, D.; PILKEY, O.H. HOWARD,
J.D. (ed.) Sea-level fluctuation and coastal evolution. Tulsa, SEPM, p. 223-239.
DHN (DEPARTAMENTO DE HIDROGRAFIA E NAVEGAÇÃO). 1995. Tábuas de marés
para 1994. Costa do Brasil e alguns portos estrangeiros. Rio de Janeiro, DHN. p. 1-6.
DOMINGUEZ, J.M.L. 1982. Evolução quaternária da planície costeira associada à foz do Rio
Jequitinhonha (BA): influência das variações do nível do mar e da deriva litorânea de
sedimentos. Universidade Federal da Bahia, Tese de Mestrado, 79p.
DOMINGUEZ, J.M.L.; BITTENCOURT, A.C.S.P.; MARTIN, L. 1992. Controls on Quaternary
coastal evolution of the east-northeastern coast of Brazil: roles of sea level history, trade
winds and climate. Sedimentary Geology, 80: 213-232.
DOMINGUES, J.M.L.; MARTIN, L; BITTENCOURT, A.C.S.P. 1987. Sea-level history and
Quaternary evolution of river-mouth-associated beach-ridge plains along the east-southeast
Brazillian coast. In: NUMMEDAL, D.; PILKEY, O.H. HOWARD, J.D. (ed.) Sea-level
fluctuation and coastal evolution. Tulsa, SEPM, p. 115-127.
EL-ROBRINI, M.; FARIA Jr., L.E.C.; TORRES, A.M.; SOUZA FILHO, P.W.M.; SILVA.; M.S.
1992. Deposição e assoreamento das rias do Estado do Pará. CONGRESSO BRASILEIRO
DE GEOLOGIA, 37, Resumos. 79-80. São Paulo, SBG.
EL-ROBRINI, M. & SOUZA FILHO, P.W.M. 1993. Evidence of Quaternary sea levels on the
Northern Continental Shelf. SIMPÓSIO AMASSEDS, 2, Resumos. 16. Niterói,
Universidade Federal Fluminense.
FARIA Jr., L.E.C.; MARÇAL, M. S. & PINHEIRO. R.V.L. 1987. A dinâmica sedimentar da
praia do Maçarico/Salinópolis e sua importância para a geologia da região costeira do
Estado do Pará. CONGRESSO DA ASSOCIAÇÃO BRASILEIRA DE ESTUDOS DO
QUATERMÁRIO, 1, Anais. 343-356. Porto Alegre, ABEQUA.

58
FIGUEIREDO JR., A.G. 1990. Normas de controle de qualidade para processamento de
testemunhos inconsolidados. Projeto Sedimentos de talude. Rio de Janeiro, Contrato
PETROBRÁS/ UFF no3-570-794-0-90, 27p.
FRANZINELLI, E. 1982. Contribuição a geologia da costa do Estado do Pará (entre as baías de
Curuçá e Maiaú). SIMPÓSIO INTERNACIONAL DE QUATERNÁRIO, 4, Atas. 305-322.
Manaus, INQUA.
FRANZINELLI, E. 1992. Evolution of the geomorphology of the coast of the State of Pará,
Brazil. In: PROST, M.T. (ed.) Évolution des littoraux de Guyane et de la Zone Caraï be
Méridionale pendant le Quaternaire. Paris, ORSTOM. p. 203-230.
FREY, J.C & WILLIMAN, H.B. 1960. Classification of the Wisconsinian stage in the Lake
Michigan glacial lobe. Illinois State Geological Survey, 285: 16p.
FREY, R.W. & BASAN, P.B. 1978. Coastal salt marsh. In: DAVES Jr., R.A. (ed.) Coastal
Sedimentary Environments. New York, Springer-Verlag. 420p
GOLDSMITH, V. 1978. Coastal Dunes. In: DAVES Jr., R.A. (ed.) Coastal Sedimentary
Environments. New York, Springer-Verlag. 420p
HOYT, J.H. 1969. Chêniers versus Barrier, genetic and stratigraphic distinction. The American
Association of Petroleum Geologist Bulletin, 53: 299-306.
IGREJA, H.L.S. 1991. Aspectos tectono-sedimentares do Fanerozóico do nordeste do Pará e
noroeste do Maranhão, Brasil. Universidade Federal do Pará. Tese de Doutorado, 191p.
MARTIN, L. & SUGUIO, K. 1989. Excursion route along the brazilian coast between Santos
(State of São Paulo) and Campos (State of Rio de Janeiro). INTERNATIONAL
SYMPOSIUM ON GLOBAL CHANGES IN SOUTH AMERICA DURING THE
QUATERNARY, Guia de Excursão. 136p. São Paulo, INQUA (Special publication, 2).
MARTIN, L. SUGUIO, K.; FLEXOR, J.M. 1993. As flutuações do nível do mar durante o
Quaternário Superior e a evolução gelógica dos "deltas" brasileiros. Boletim IG-USP, 15:
1-86.
MARTIN, L.; SUGUIO, K.; FLEXOR, J-M; DOMINGUEZ, J.M.L.; BITTENCOURT, C.S.P.
1996. Quaternary sea-level hystory and variation in dynamics along the central Brazillian
coast: consequences on coastal plain construction. Anais da Academia Brasileira de
Ciências, 68: 303-354.
59
MARTORANO, L.G.; PERREIRA, L.C.; CÉZAR, E.G.M.; PEREIRA, I.C.B. 1993. Estudos
Climáticos do Estado do Pará, Classificação Climática (KÖPPEN) e Deficiência Hídrica
(THORNTHWHITE, MATHER). Belém, SUDAM/ EMBRAPA, SNLCS. 53p.
MILLIMAN, J.D. & BARRETO, H.T. 1975. Relict magnesian calcite oolite and subsidence of
Amazon Shelf. Sedimentology, 22: 137-145.
MILLIMAN, J.D. & EMERY, K.O. 1968. Sea levels during the past 35.000 years. Science, 162:
1121-1123.
PENLAND, S. & SUTER, J. 1989. The geomorphology of the Mississipi River chêniers plain.
Marine Geology, 90: 231-258
POSAMENTIER, H.W. & VAIL, P.R. 1988. Eustatic controls on clastic deposition II - Sequence
and system tract models. In: WILGUS, C.K.; HASTINGS, B.S.; KENDAL, C.G.St.C.;
POSAMENTIER, C.A.R.; VAN WAGONER, J.C. (ed.) Sea-level changes: an integrated
approach. Tulsa, SEPM, p 125-154.
POSAMENTIER, H.W.; JERVEY, M.T.; VAIL, P.R. 1988. Eustatic controls on clastic
deposition I- Conceptual framework. In: WILGUS, C.K.; HASTINGS, B.S.; KENDAL,
C.G.St.C.; POSAMENTIER, C.A.R.; VAN WAGONER, J.C. (ed.) Sea-level changes: an
integrated approach. Tulsa, SEPM, p. 109-124.
RHODES, E.G. 1982. Depositonal model for a chêniers plain, Gulf of Carpentaria, Australia.
Sedimentology, 29: 1-19.
ROCK-COLOR CHART COMMITTE. 1984. Rock-Color Chart. Netherlands, Huyskes-
Enschade.
ROSSETTI, D.F.; TRUCKENBRODT, W.; GÓES, A.M. 1989. Estudo paleoambiental e
estratigráfico dos sedimentos barreiras e Pós-Barreiras na Região Bragantina, Nordeste do
Pará. Boletim do Museu Paraense Emílio Goeldi, 1: 25-74. Série Ciências da Terra.
SANTOS, V.F. 1996. Estratigrafia holocênica e morfodinâmica atual da Planície Costeira da
Ilha de Algodoal e Marudá. Universidade Federal do Pará, Tese de Mestrado, 128p.
SILVA, M.S. 1993. Estudo mineralógico dos sedimentos de fundo da Plataforma Continental do
Amazonas. Universidade Federal do Pará. Trabalho de Conclusão de Curso, 64p.
SILVA, M.S. 1996. Morfoestratigrafia e evolução holocênica da Planície Costeira de
Salinópolis, NE do Estado do Pará. Universidade Federal do Pará, Tese de Mestrado,
142p.

60
SIMÕES, M.F. 1981. Coletores - Pescadores ceramistas do litoral do salgado (Pará). Boletim do
Museu Paraense Emílio Goeldi, 78: 1-33. Nova Série Antropologia.
SOUZA FILHO, P.W.M. 1993. Oscilações do nível o mar na Plataforma Continental do
Amazonas. Universidade Federal do Pará. Trabalho de Conclusão de Curso, 61p.
SOUZA FILHO, P.W.M. 1995. Influência das Variações do Nível do Mar na Morfoestratigrafia
da Planície Costeira Bragantina (NE do Pará) durante o Holoceno. Universidade Federal
do Pará, Tese de Mestrado, 123p.
SOUZA FILHO, P.W.M. & EL-ROBRINI, M. 1995. Um exemplo de sistema deposicional
dominado por macromaré: A Planície Costeira Bragantina - NE do Pará (Brasil).
CONGRESSO DA ASSOCIAÇÃO BRASILEIRA DE ESTUDOS DO QUATERNÁRIO,
5, Anais. 278-284. Niterói, ABEQUA.
SOUZA FILHO, P.W.M. & EL-ROBRINI, M. 1996a. Seqüências estratigráficas do Holoceno
como conseqüência das variações do nível do mar na Planície Costeira Bragantina.
SIMPÓSIO DE GEOLOGIA DA AMAZÔNIA, 5, Anais. 203-206. Belém, SBG.
SOUZA FILHO, P.W.M. & EL-ROBRINI, M. 1996b. Estratigrafia de seqüências da Planície
Costeira Bragantina, Nordeste do Pará, Brasil. CONGRESSO BRASILEIRO DE
GEOLOGIA, 39, Anais. 275-277. Salvador, SBG.
SOUZA FILHO, P.W.M. & EL-ROBRINI, M. 1996c. Morfologia, processos de sedimentação e
litofácies dos ambientes morfosedimentares da Planície Costeira Bragantina - Nordeste do
Pará (Brasil). Geonomos, 4: 1-16.
SOUZA FILHO, P.W.M. & EL-ROBRINI, M. 1997a. A influência das variações do nível do mar
na sedimentação da Planície Costeira Bragantina durante o Holoceno - Nordeste do Pará,
Brasil. In: COSTA, M.L. & ANGÉLICA, R.S. (ed.) Contribuições à Geologia da
Amazônia. Belém, FINEP/SBG. P. 307-337.
SOUZA FILHO, P.W.M. & EL-ROBRINI, M. 1997b. Chêniers: evidências morfológicas e
estratigráficas de antigas linhas de costa na Planície Costeira Bragantina, Nordeste do Pará
- Brasil. CONGREESO DA ASSOCIAÇÃO BRASILEIRA DE ESTUDOS DO
QUATERNÁRIO, 6, Resumos Expandidos. 147-150. Curitiba, ABEQUA.
SUGUIO, K. 1973. Introdução à Sedimentologia . São Paulo, Edgard Blücher. 342p.

61
SUGUIO, K.; BITTENCOURT, A.C.S.P.; DOMINGUEZ, J.M.L.; FLEXOR, J.M.; AZEVEDO,
A.E.G. 1985. Flutuações do Nível Relativo do Mar durante o Quaternário Superior ao
longo do Litoral Brasileiro e suas implicações na Sedimentação Costeira. Revista Brasileira
de Geociências, 15:273-286.
TOMAZELLI, L.J. & VILLWOCK, J.A. 1996. Quaternary geological evolution of Rio Grande
do Sul coastal plain, Southern Brazil. Anais da Academia Brasileira de Ciências, 68: 373-
382.
TOMAZELLI, L.J.; VILLWOCK, J.A.; DILLENBURG, S.R.; BACHI, F.A.; DEHNHARDT,
B.A. 1997. A erosão costeira e a transgressão marinha atual na costa do Rio Grande do Sul.
CONGRESSO DA ASSOCIAÇÃO BRASILEIRA DE ESTUDOS DO QUATERNÁRIO,
6, Resumos expandidos. 415-419, Curitiba, ABEQUA.
VAN WAGONER, J.C.; POSAMENTIER, H.W.; MITCHUM, R.M.; VAIL, P.R.; SARG, J.F.;
LOUTIT, T.S.; HARDENBOL, J. 1988. An overview of the fundamentals of sequence
stratigraphy and key definitions. In: WILGUS, C.K.; HASTINGS, B.S.; KENDAL,
C.G.St.C.; POSAMENTIER, C.A.R.; VAN WAGONER, J.C. (ed.) Sea-level changes: an
integrated approach. Tulsa, SEPM, p. 39-45.
VILLWOCK, J.A. 1987. Processos costeiros e a formação da costa sul e sudeste brasileira.
SIMPÓSIO SOBRE ECOSSISTEMAS DA COSTA SUL E SUDESTE BRASILEIRA,
Anais. 380-398. Cananéia, SBG.
VITAL, H.; SILVEIRA, O.F.M.; TORRES, A.M.; SILVA, M.S.; SOUZA FILHO, P.W.M.;
FARIA Jr., L.E.C. 1991. Cone do Amazonas - Proj. MAR 3.1: Dados geológicos
preliminares. SIMPÓSIO SOBRE OCEANOGRAFIA, 2, Resumos. 245., São Paulo, IOUSP.
WOODROFFE, C.D. & MULRENNAN, M.E. 1993. Geomorphology of the Lower Mary River
Plains. Northern Territory. Darwin, Australia National University. 152p.
WOODROFFE, C.D.; CHAPPELL, J.; THOM, B.G.; WALLENSKY, E. 1986.
Geomorphological Dynamics and Evolution of the South Alligator River and Plains,
Northern Territory. Australia National University. North Australia Research Unit.
Mangrove Monograph nº. 3. 190p.

62
WOODROFFE, C.D.; CHAPPELL, J.; THOM, B.G.; WALLENSKY, E. 1989. Depositional
models of a macrotidal estuary and flood plain, South Alligator River, Northern Australia.
Sedimentology, 36: 737-756.

63
CAPÍTULO 3:
TÉCNICAS DE SENSORIAMENTO
REMOTO PARA MAPEAMENTO DE
AMBIENTES COSTEIRAS TROPICAIS

64
3.1. COASTAL GEOMORPHOLOGICAL STUDY AND LARGE-SCALE EVOLUTION
OF BRAGANÇA COASTAL PLAIN (BRAZILIAN AMAZON) FROM SAR
IMAGERIES
ABSTRACT
A RADARSAT-1 Fine Mode image acquired in 1998 over a study site located on the
North of the Brazilian Amazon Region was evaluated aiming at mapping and assessing the large-
scale evolution of this wet tropical coastal environment. With SAR's side viewing geometry,
longer wavelengths, and almost all-weather sensing capability, RADARSAT-1 imagery has been
extensively used as monitoring tool for coastal changes in the moist tropics. In this investigation,
RADARSAT Fine Mode data acquired in 1998 was combined with airborne SAR X-HH GEMS
acquired in 1972 during the RADAM Project and it was possible to evaluate the large-scale
coastal changes occurring over the past three decades.
The orbital SAR data was digitally geometric corrected (ortho-rectified) and filtered for
speckle noise. The airborne SAR data, originally available on mosaic format was scanned and
geometrically corrected through polynomial method. The results have shown that the
RADARSAT-1 image represents a powerful tool for geomorphological mapping and land use
assessments in the Amazon Region, mainly in environmental characterization of macrotidal
mangrove coast such as the Bragança coastal plain. Thus, it was possible to map mangroves, salt
marshes, chenier sand ridges, dunes, barrier-beach ridges and shallow water morphologies based
on this kind of orbital SAR data. Furthermore, a simple method to estimate shoreline changes was
carried out based on the superimposition of shoreline vectors extracted from the airborne radar
and related features present on the RADARSAT data. The results of the investigation have
allowed characterizing changes in the area associated with shoreline retreat and accretion. In
addition, the mapping of the tidal current and wave attack direction, estuarine and tidal channel
displacements have also provided an understanding of the coastal sedimentary dynamic, marine
transgression and sea-level changes in this sector of the Northern Brazilian coast.
Key words: coastal mapping, coastal changes, orbital (RADARSAT-1) SAR and airborne
(RADAMBRASIL) SAR data.

65
INTRODUCTION
The Bragança coastal plain situated along the northeast of the State of Pará (northeastern
Brazilian Amazon) is part of one of the largest macrotidal mangrove coast of the world, with
almost 6,000 km2 (Herz, 1991). Geologically, the Amazon coastal zone is poorly mapped. The
RADAMBRASIL Project, in the beginning of the 70’, carried out the first regional mapping
project in the area. With the SAR´s side viewing geometry, longer wavelengths, airborne X-HH
band SAR imagery from the RADAMBRASIL were extensively used as an operational tool for
regional mapping in the coastal Amazon environments. The area is associated with perennial
cloud cover that restricts the use of airborne or spaceborne-based optical sensors. In addition, the
high sun-angle in the tropics also provides limited shadowing and poor topographic contrast.
Over the past 26 years (1972-1998), only six Landsat-TM acquisitions are available with less
than 40% cloud cover over the Pará State coast. Based on this kind of optical orbital data, Souza
Filho (1995) produced the just coastal plain map in the scale of 1:100.000, describing the
geologic and geomorphologic coastal features of the area.
A recent RADARSAT Fine Mode acquisition campaign was undertaken during
September 1998 in the area. In contrast with optical data, orbital SAR imageries (ERS-1, JERS-1,
RADARSAT-1) have been extensively used for mapping and monitoring wet tropical coastal
environments (Singhroy, 1992; 1995; Rudant et al. 1996; Singhroy, 1996; Conway, 1997;
Barbosa et al. 1999; Johannessen, 2000; Kushwaha et al., 2000). This paper presents a guide to
digital image processing and interpretation of RADARSAT-1 data in tropical coastal
environment mapping and assesses the large-scale coastal evolution during the last three decades.
It also emphasizes the importance of using SAR images for coastal zone mapping purposes. In
addition, the integration of information got from old and new SAR imageries has allowed an
excellent evaluation of the shoreline changes and mapping of areas at risk related to coastal
erosion.
STUDY AREA
The study area extends for 50 km of coastline between Caeté and Quatipuru estuaries
(Figure 1). The climate is marked by a wet season from December to May and a dry season from
June to November. Located at 1º S of the Equator line, trade winds blow from northeast
throughout the year, most strongly during the dry season. The average annual rainfall reaches

66
2,500 mm and the mean tidal ranges measures around 4 m in a semi-diurnal cycle, and the range
during the spring tides is locally as high as 6 m. Thus, during the spring tides, large areas of the
low land are inundated by water as a result of both high rainfall-runoff rates and tidal inundation
(Kjerfve et al. 2000). Strong tidal currents and waves are responsible for the erosion of
mangroves along the coast, estuaries and bays, where lines of fallen mangroves trees mark the
eroded places. On the other hand, new mangrove fringes are prograding seaward in response to
muddy sedimentation.
Figure 1- Location map of study area of the Bragança coastal plain.
47W Study Area ^
-A', P)<X
Brazil / □diiçajj
PARA P8^ Q V
46u55 40*42W Maiau Pomt 0"44 I
c»<omnjo
Coastal piam Coastal plateau
r*' ^ Mala ii Bay
> O^u % ^ (V\ Estuarv /^XE\
t\ La ^
,--vPojii
rs.
* ■ ' i,. O.
35
v.r
Uttíiw Ailiü
-:i

67
The geology and geomorphology of the Bragança coastal plain were described in various
publications (Souza Filho, 1995; Souza Filho and El-Robrini, 1996; 2000). The area can be
subdivided into three main geomorphologic compartments: (1) alluvial plain, with fluvial
channels, levees and flood plain; (2) estuarine plain, with an estuarine channel subdivided into
estuarine funnel segment, straight segment, meandering segment and upstream channel; and (3)
coastal plain, with salt marshes (inner and outer), tidal flats (supratidal mangroves, intertidal
mangroves, muddy and sandy tidal flats), chenier sand ridges, coastal dunes, barrier-beach ridges
and ebb-tidal delta environments. The coastal plain is extremely irregular, with jagged nature of
this low gradient coast. The Bragança coastal zone is an active sedimentary region, which has
been developed largely since the higher Holocene sea level (5,100 years BP) (Souza Filho and
El-Robrini, 1998).
Topographically, the study site presents a low gradient. The tidal flat, including mangrove
system, have slopes around 1:3000 (0.033%), being dissected by creeks. Salt marshes constitute
the higher areas of the coastal plain. They are situated 3 m above the mean tidal level, while
intertidal mangrove occurs from 2 to 2.6 m and supratidal mangrove develop between 2.6 to 2.8
m above the mean tidal level. Consequently, the salt marshes are inundated only 28 day/yr., while
mangroves remained flooded from 51 day/yr. (supratidal mangrove) to 233 day/yr. (intertidal
mangrove) (Cohen et al. 2000).
The original vegetation over the coastal plateaus is constituted by tropical rain forest. This
vegetation cover has been affected by anthropogenic activities (agriculture and human
settlement). Mangrove forest is found on the tidal flat, grasses occur along the marshes and
arbustive vegetation occupies the chenier sand ridges, dunes and backshore zone of the barrier-
beach ridges.
DATA SET AND IMAGE PROCESSING
The investigation was based on airborne and spaceborne SAR images. The airborne X-
HH band SAR data was acquired in 1972, during the RADAM Project. The spaceborne C-HH
band RADARSAT Fine Beam Mode 1 (descending orbit) was acquired in 1998, under the
GLOBESAR-2 Program (Paradella et al., 1997). Details of the SAR remotely sensed data used in
this study are presented in the Table 1.
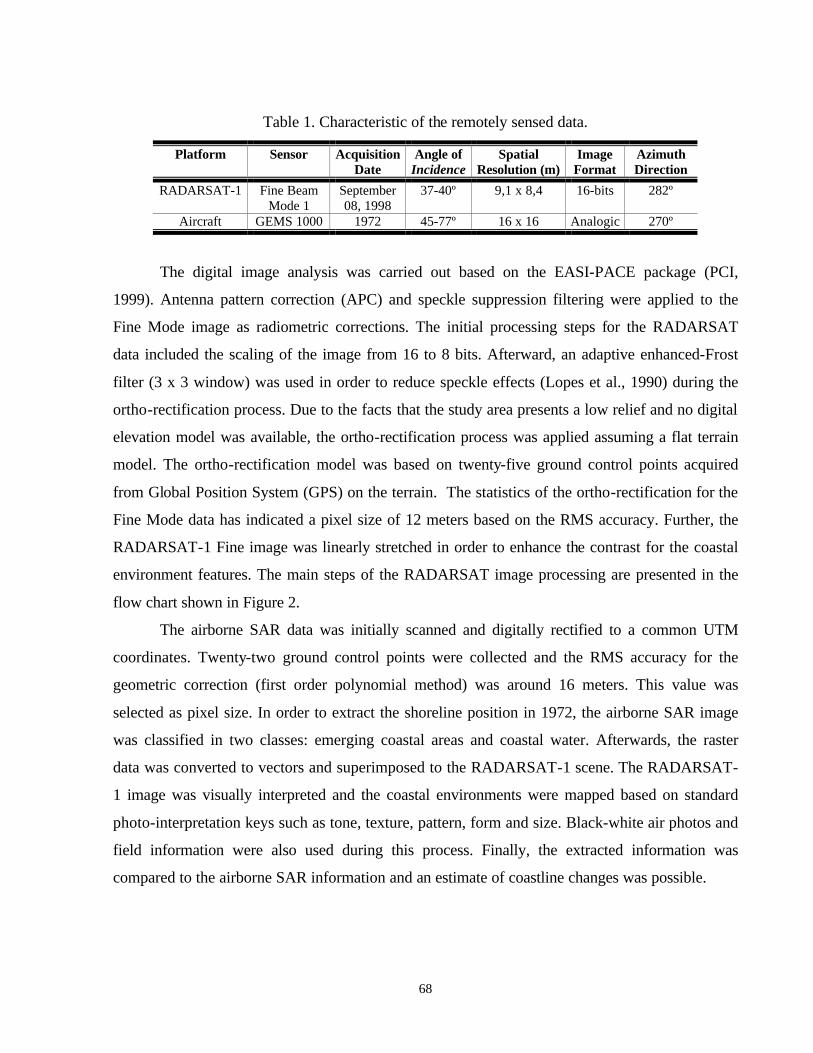
68
Table 1. Characteristic of the remotely sensed data.
Platform Sensor Acquisition Date
Angle of Incidence
Spatial Resolution (m)
Image Format
Azimuth Direction
RADARSAT-1 Fine Beam Mode 1
September 08, 1998
37-40º 9,1 x 8,4 16-bits 282º
Aircraft GEMS 1000 1972 45-77º 16 x 16 Analogic 270º
The digital image analysis was carried out based on the EASI-PACE package (PCI,
1999). Antenna pattern correction (APC) and speckle suppression filtering were applied to the
Fine Mode image as radiometric corrections. The initial processing steps for the RADARSAT
data included the scaling of the image from 16 to 8 bits. Afterward, an adaptive enhanced-Frost
filter (3 x 3 window) was used in order to reduce speckle effects (Lopes et al., 1990) during the
ortho-rectification process. Due to the facts that the study area presents a low relief and no digital
elevation model was available, the ortho-rectification process was applied assuming a flat terrain
model. The ortho-rectification model was based on twenty-five ground control points acquired
from Global Position System (GPS) on the terrain. The statistics of the ortho-rectification for the
Fine Mode data has indicated a pixel size of 12 meters based on the RMS accuracy. Further, the
RADARSAT-1 Fine image was linearly stretched in order to enhance the contrast for the coastal
environment features. The main steps of the RADARSAT image processing are presented in the
flow chart shown in Figure 2.
The airborne SAR data was initially scanned and digitally rectified to a common UTM
coordinates. Twenty-two ground control points were collected and the RMS accuracy for the
geometric correction (first order polynomial method) was around 16 meters. This value was
selected as pixel size. In order to extract the shoreline position in 1972, the airborne SAR image
was classified in two classes: emerging coastal areas and coastal water. Afterwards, the raster
data was converted to vectors and superimposed to the RADARSAT-1 scene. The RADARSAT-
1 image was visually interpreted and the coastal environments were mapped based on standard
photo-interpretation keys such as tone, texture, pattern, form and size. Black-white air photos and
field information were also used during this process. Finally, the extracted information was
compared to the airborne SAR information and an estimate of coastline changes was possible.

69
Figure 2- Flow chart with the main steps of RADARSAT image processing
Scaling of 16 bits - 8 bits
Ground control point selection
Mathemetical model for geometric correction
Geometric ortho-correction
+ Speckle reduction
RADARSAR Fine Mode F1
Reading of image orbit
Linear stretch
Input Data
Radiometric Correction
Geometric Correction
Enhancement
Pré-Processing Phase:
and
Processing Phase:
Assessment of SAR Products
Photogeologic Interpretation
70
RESULTS AND DISCUSSIONS
Coastal geomorphology from RADARSAT Fine 1
The backscattered microwave energy from the Earth's surface measured by a SAR system
provides information of geometry (macro and micro-topography) and electrical properties
(moisture content) (Lewis et al., 1998; Raney, 1998). Based on these characteristics, six
prominent geological coastal features in the study area were examined in detail, using the
information gathered from the RADARSAT Fine image. The orbital SAR data was evaluated to
identify coastal environment features and shallow water morphology related to the tidal current
and incidence wave direction in the coastline (Figure 3 and 4).
Mangroves
The tidal mudflats constitute a wide mangrove ecosystem with a width of about 20 km,
densely covered by mangrove trees, principally Rhizophora sp. and Avicennia sp. They are
located from the high spring tide to the mean tidal level, whose distribution of tidal flats is mainly
controlled by topography. Therefore, based on relative altimetry and vegetation height, the tidal
flats were subdivided in supratidal mangrove and intertidal mangrove. The supratidal mangroves
are topographically higher with smaller trees and can be reached by water only during the spring
tides, while the intertidal mangroves are topographically lower with progradacional and erosional
areas (Souza Filho and El-Robrini, 2000).
The interpretation of the RADARSAT Fine image in the mangrove environment has
indicated that intertidal mangrove forest (trees with a height around 20m) are related to
microwave responses controlled, probably, by volumetric scattering and double-bounce
mechanism. This particular condition is responsible for a very rough texture and light-gray tone
allowing the discrimination of this coastal environment (Figure 3). The smooth, flat, high
dielectric constant surface of the water increases the amount of backscattered radiation toward the
radar, due to tree-ground double-bounce interaction. The supratidal mangrove presents a similar
behavior of the intertidal mangrove, however the mangrove trees are smaller and spaced,
reducing the double-bounce effect. Hence, the target appears less rough and with dark-grayish
tone.

71
Salt marshes
The marshes are situated in the supratidal zone. The sedimentation is marked by mud
deposition carried from tidal fluxes along creeks (Souza Filho and El-Robrini 1996). They are
subdivided in inner and outer salt marshes. The inner salt marsh occurs over the coastal plateaus
and is flooded only during the rainy season and tidal waters influence its tidal creeks only during
the dry season. The outer salt marsh occurs over old sandy beach ridge deposits along the tidal
mudflat.
The RADARSAT-1 Fine image clearly outlines the salt marshes. The inner salt marsh,
completely flooded in the rainy season, presents a specular scattering behavior when the
microwave radiation reaches the water table on the surface. Thus, this target appears as very dark
tone in the image (Figure 3). However, for the sectors where the inner salt is covered by grasses,
the radiation interaction produces a slightly rougher surface with lighter gray tones. Finally, for
the outer salt marsh a similar scattering mechanism related to the inner vegetated salt marsh is
characterized, but its geometry and spatial distribution are typical.
Chenier sand ridges
The chenier sand ridges constitute old dune-beach ridges with associated washover fans. They are
constituted by white fine sand covered by sparse vegetation. The cheniers have a very well
characterized geometric linear and curved form whose boundary is marked by prograding tidal
mudflats (Souza Filho, 1995). The sedimentary processes responsible for its development are
related to shoreline retreat during transgressive sea-level conditions followed by mud
progradation. The mud progradation sometimes covered the sandy deposits, which allowed
mangrove and salt marsh development (Souza Filho and El-Robrini, 2000).
From the SAR RADARSAT-1 Fine image, the chenier sand ridges present a smooth
surface and dark tones. These SAR image characteristics appear to be controlled by presence of
dry sandy sediments of old dune-beach ridges and washover fans (cheniers; Figure 3). This
morpho-sedimentary characteristic is responsible for absorption of the microwave radiation. As
intertidal mangrove around cheniers presents a double-bounce effects and light gray tone, this
behavior favours its image discrimination (Souza Filho and Paradella, submitted).

72
Figure 3- Detailed coastal geomorphology of Bragança plain from the RADARSAT-1.
290000m E. 30 31 320000ro E.
N 10 km
A
Maíau Bay
Taperaçu fe, Bay
5 ;
mí
Caete Bay rsn
m ms mms -z íSS» &sm
wasm u':- Í-.
1-lntertidal Mangroves
Aerial photo II
2- Supratidal IVlangrove
3- Salt marshes
PNP^:
Aerial photo
3. J
f 3 s*
Aerial photc > Aerial photo
4- Cheniers 5- Dune and beach Be-adl
w* %
X 4 i _TJune
JK
RADÂRSAT image © Canadlan Space Ágericy. 1998

73
Coastal dunes
Sandy sediments of tidal shoals and beach reworked by the wind constitute the coastal
sandy dunes. Nowadays, the dunes are migrating landward over the mangrove deposits in the
intertidal mudflats. Transverse and pyramidal dunes are partially or completely covered with
vegetation and represent coastal dunes composed of very fine quartz sand, which is very well
sorted, with few shell fragments and root marks (Souza Filho and El-Robrini, 1996)
Coastal dunes in RADARSAT-1 image are well defined in response to dry sandy
sediments covered by sparse arbustive vegetation. This characteristic attributes to the scene
moderated rough and dark-gray tones, compared to adjacent mangrove forest (Figure 3).
Barrier-beach ridges
The barrier-beach ridges are one of the most dynamic coastal environments. They extend
from low spring tidal levels to dune-beach scarps that represent the higher spring tidal level in the
intertidal beach. The beaches are constituted by fine white quartz sand and present a flat
morphology with linear and elongated forms and curved spits in the direction of the longshore
sediment transport (Souza Filho and El-Robrini, 2000).
In response to sedimentologic and morphologic characteristics, barrier-beach ridges in
SAR image present a smooth surface and very dark tones (Figure 3), due to specular scattering of
the microwave radiation.
Shallow water morphology
Along the study area, Souza Filho and Paradella (submitted) have mapped submerse
sandy banks and estuarine tidal channel from integrated remote sensed data. From SAR image,
underwater morphology is inferred through the radar signature of ocean surface current changes
and corresponding modulations of the shorter gravity-capillary waves (Johannessen, 2000). These
SAR characteristics are responsible for wave front mapping in the surf zone and tidal current
interactions with bottom features to locate and orient submerse sandy banks (Figure 4h).
Based on research results, assessment of coastal environments mapping and
RADARSAT-1 interpretation note is summarized in Table 2.

74
Figure 4- Shallow water morphology from RADARSAT-1.
N
A
L
Submerse sandbanks
Tidal chamei
3 km
Surf zones
■l

75
Table 2- Interpretation of SAR RADARSAT-1 imagery for coastal geological mapping
Coastal geological features and land cover SAR image interpretation results
A. Coastal environments
Mangrove • Coastal areas dominated by forest with average trees of 20 m
high. Mangroves are associates with rough surface and
medium-light tones (double-bounce).
Salt marsh • Coastal low-lying and water logged terrain covered by
grasses. Slightly rough surface and dark tones on the SAR
image.
Chenier sand ridge • Linear features with until 4 m high covered by arbustive
vegetation. It is bounded by mangrove forest and presents
rough surface and medium tones.
Coastal dunes • Linear features with until 6 m high covered by arbustive
vegetation. Slightly rough surface and dark tones on the SAR
image.
Barrier-beach ridge • Linear and flat features in the intertidal zone without
vegetation. Smooth surface and very dark gray tones on the
SAR texture.
Shallow water morphology • Smooth surface with very dark tones intercalated with light
tones defined by shorter gravity-capillary waves.
B. Erosional settings
Coastal forms • From 500 to 1000 m of erosional forms mainly identified in
the open coast as curved shoreline.
Estuarine forms • From 30 to 400 m of straight erosional forms.
C. Depositional forms
Mangrove progradation • Coastal prograding areas covered by young mangrove forest
with until 1,000 km of shoreline accretion Rough texture and
light gray tones on the SAR image.
D. Land cover
Regenerated mangrove • Coastal mangrove forest deforested and now subjects to
regenerative process. Rough texture and highlight tones due to
corner reflection.
Deforested mangrove • Muddy soil exposed with smooth surface and very dark gray
tones

76
Mapping of coastal land cover
The RADARSAT-1 imagery has shown to be valorous in providing information to
produce and update coastal land cover maps in this tropical environments, covered by clouds
during all time. The Bragança Coastal Plain has suffered fast and dramatic changes in the
landscape. The anthropogenic impacts are most related to the opening of roads over the
mangroves to access the beaches and unplanned coastal land use, as well as the drops of solid
wastes and groundwater contamination (Souza Filho, 2000a). Along the Bragança-Ajuruteua
road, it was detected areas where the mangrove ecosystems are completely deforested and in
same places are subject to regeneration.
The interpretation of the RADARSAT-1 image has allowed the mapping of changing
land cover. Flat and linear features bounded by mangrove forest characterize the roads, thus
appear as a smooth surface with very dark tones. Specular scattering is observed too in the
deforested mangrove areas, where salt and wet muddy sediments are exposed in the flat terrain
(Figure 5). The natural regenerated mangrove sites present sparse and short vegetation
distributed over flat muddy morphology. These factors favor the backscattered signal strength
controlled by corner reflector mechanisms, producing high radar returns. Thus, this target shows
a rough texture with high light gray tones (Figure 5). In a specific place, an artificial lake was
formed due to a tidal creek damping by road (Figure 5). Table 2 summarizes the land cover
characteristics in SAR imagery.
Spatial and temporal analysis of shoreline change from SAR
A number of potential shoreline datum or geomorphic features can be used to monitor
historical shoreline changes. However, in most situations, the high water line, represented in
study site by the spring high tide level (SHTL), has been demonstrated to be the best indicator of
the land-water interface for historical shoreline comparison study (Dolan et al., 1980; Crowell et
al., 1991). The SHTL delineates the landward extent of the last high tide, hence it is easily
recognizable in the field and it can usually be detected from airborne and spaceborne remote
sensed data. The landward extent is represented by mangrove forest easily discernible in SAR
imageries and according Souza Filho (2000b), mangroves are one of the best geoindicators for
evaluating shoreline changes associated to erosional and depositional processes in muddy coast.

77
Figure 5- Land cover mapping from RADARSAT-1.
RADARSAT imagp ©Canad an Space Agency, 199B
Sí ,' ffl *s':
m- -.'Vi./
m 3
r . r
Saít marsh l-M1 .
Í-T»
-'«lK TOoa&-
ífi .
a
r.v 1.5 km
1- Deforested mangrove
2- Regenerated mangrove
Aenai photo
3- Artificial lake
Aenal photo
1

78
The mid-term changes in shoreline position were measured between 1972 and 1998 using
SAR data from airborne GEMS and spaceborne RADARSAT-1, respectively (characteristics are
presented in table 1). The shoreline position accuracy was determined by surveying ground
control points. Reference points consisted of the corner of discernible structures, road driveway
fluvial intersections. After geometric correction, the GEMS RMS error was around 16 m, while
RADARSAT-1 RMS error reached 12 m, based on statistics of the ortho-rectification. Therefore,
the maximum error due to the shoreline position change was estimated at ± 28 meters.
The impact of the natural dynamics in the Bragança Coastal Plain has made fast and
dramatic changes in the shoreline position during the last three decades. From microwave remote
sensing imageries, critical observations of large-scale coastal evolution provide clues to the
natural history. The comparison between 1972 airborne SAR GEMS and 1998 spaceborne SAR
RADARSAT-1 has shown that the shoreline has been subjected to severe erosion and accretion
processes. In any specific coastal sites, some sectors remained unchanged. In the ocean setting,
the mid-term shoreline recession reached maximum distance of 1,500 m and 1,250 m ±28 m in
the Maiaú Point and Buçucanga Beach, respectively (Figure 6A and 6B). These erosional
settings represent the most seaward boundary of the coastal plain, which receive little or no
muddy sediment. The main sedimentary process responsible for the shoreline retreat is related to
sandflats migration landward over the mangrove deposits due to tidal currents and large wave
action. Mangrove vegetation has been killed by rapid sand deposition over it and mangrove
terrace has been eroded. Hence, great parts of the shoreline, principally beaches, are
characterized as transgressive deposits (Souza Filho, 1995). The shoreline accretion sectors are
well represented by the Picanço Point, where the shoreline position has migrated around 1,250 m
seaward (Figure 6C). In this area, the continuous sediment supply and the geomorphological
positions, protected of wave attack, favor the accretion of sandbanks, muddy deposition and
mangrove vegetation establishment. Therefore, mangrove trap sediments to build a depositional
mud terrace in the upper intertidal flat and successive zones of pioneer vegetation (spartina sp.)
and other mangrove species migrate seaward. Migration of islands is observed along the Maiaú
Bay in response to oceanographic and sedimentary processes. For example, the Maciel Island
migrated almost 1 km from 1972 to 1998 (Figure 6C).

79
Figure 6- 1998 RADARSAT image and superimposed vector showing shoreline changes since 1972, coastal erosion and accretion, island migration and geomorphologic features. Maiaú Point (A) and Buçucanga Beach (B) erosional sector; and Picanço Point (C) accretionary sector showing an island migration process.
RADARSATirnage-üi Canadiar» Space Agfncy. 1C98
2 krr í-J 10T|<rr
4 J-
sm
i
i? E. ?krr 2Krr»
2
i h i i
-
I a- "
. iT.
2- Accretmg mangrove •i it
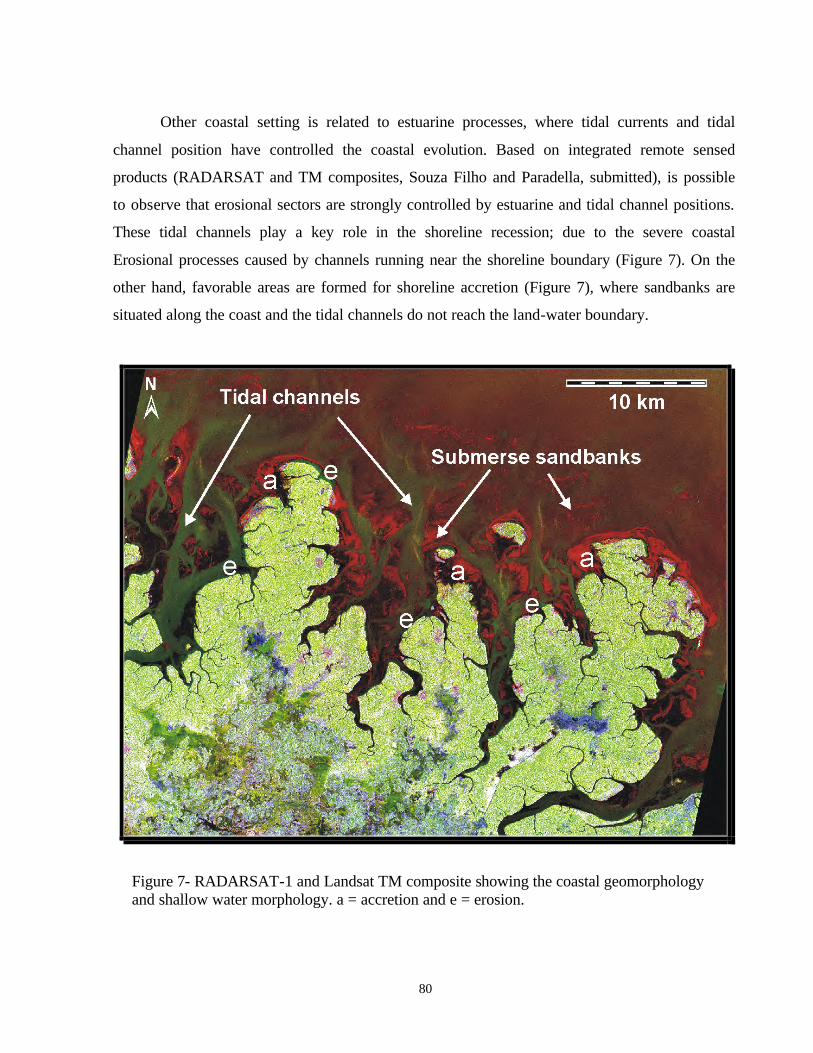
80
Other coastal setting is related to estuarine processes, where tidal currents and tidal
channel position have controlled the coastal evolution. Based on integrated remote sensed
products (RADARSAT and TM composites, Souza Filho and Paradella, submitted), is possible
to observe that erosional sectors are strongly controlled by estuarine and tidal channel positions.
These tidal channels play a key role in the shoreline recession; due to the severe coastal
Erosional processes caused by channels running near the shoreline boundary (Figure 7). On the
other hand, favorable areas are formed for shoreline accretion (Figure 7), where sandbanks are
situated along the coast and the tidal channels do not reach the land-water boundary.
Figure 7- RADARSAT-1 and Landsat TM composite showing the coastal geomorphology and shallow water morphology. a = accretion and e = erosion.
Tida c
<••• ^ '
m
m. m
■■ir.
m •ihX-
m •■:A
m

81
CONCLUSIONS
The SAR imageries represent a powerful tool for the tropical coastal environments study,
mainly in a macrotidal mangrove coast such as Bragança coastal plain, where the capability of
SAR data to penetrate cloud cover provides a unique opportunity to map and monitor coastal
changes in the Amazon Region. This paper illustrates RADARSAT’s capability to provide
geomorphological and land uses information. Furthermore, the integration of this kind of
information with ancillary data has allowed detecting coastal changes related to shoreline retreat
and accretion. Sedimentary dynamic, tidal current, wave action and estuarine and tidal channel
displacement have played an important role in controlling of these coastal changes.
The SAR imagery has an important role to play in environmental assessment, site
characterization and base maps updating, which are all significant and useful factors for an
integrated coastal zone management program. Hence, the SAR interpretation in tropical coastal
environment can be used to:
§ Map the coastal sedimentary environment;
§ Determine the position of submerse sandy banks in estuarine shallow waters;
§ Map the directions of superficial tidal currents and waves in the surf zone;
§ Determine the accurate position of the shoreline and to estimate its changes;
§ Identify sectors subject to erosion, accretion or stability along the shoreline allowing the
localization of areas subjected to coastal geologic risk;
§ Locate areas subject to mangrove regeneration and deforestation related to coastal land-use.
ACKNKOWLEDGEMENT
The authors would like to thank the National Institute for Space Research (INPE) for
structural support for digital image processing, the Geoscience Center of Federal University of
Pará for financial support to fieldwork survey and the reviewers for their helpful comments on
the manuscript. Canadian Space Agency provided the RADARSAT-1 image under the
GlobeSAR-2 Program.
REFERENCES
Barbosa, M.P.; Singhroy, V.; Saint-Jean, R. 1999. Mapping coastal erosion in Southern Paraíba,
Brazil from RADARSAT-1. Canadian Journal of Remote Sensing, 25: 323-328.

82
Cohen, M.C.L.; Lara, R.J.; Szlafstein, C.F.; Dittmar, T. 2000. Analysis of mangrove inundation
by GIS techniques. In: In: Mangrove 2000: Conference Sustainable Use of Estuaries and
Mangroves. Recife. Full papers. UFRPE/ISME.
Conway, J. 1997. Evaluating ERS-1 SAR data for the discrimination of tropical forest from other
tropical vegetation types in Papua New Guinea. International Journal of Remote Sensing, 18:
2967-2984.
Crowell, M.; Leatherman, S.P.; Buckley, M.K. 1991. Historical shoreline change: error analysis
and mapping accuracy. Journal of Coastal Research, 7: 839-852.
Dolan, R.B.; Hayden, B.P.; May, P. 1980. The reliability of shoreline change measurements from
aerial photographs. Shore and Beach, 48: 22-29.
Herz, R. 1991. Manguezais do Brasil. IOUSP/CIRM, São Paulo, Brazil.
Johannessen, J.A. 2000. Coastal observing systems: the role of synthetic aperture radar. Johns
Hopkins APL Technical Digest, 21: 7-14.
Kjerfve, B.; Perillo, G.M.E.; Gardner, L.R.; Rine, J.M.; Dias, G.T.M.; Rebelo-Mochel, F. 2000.
Morphodynamics of muddy environments along the Atlantic coast of North and South
America (in press).
Kushwaha, S.P.S., Dwivedi, R.S. and Rao, B.R.M. 2000. Evaluating of various digital image
processing techniques for detection of coastal wetlands using ERS-1 SAR data. International
Journal of Remote Sensing, 21: 565-579.
Lewis, A.J.; Henderson, F.M.; Holcomb, D.W. 1998. Radar fundamentals: the geoscience
perspective. In: Henderson, F.M. and Lewis, A.J. (eds.), Principles & Applications of
Imaging Radar. Manual of Remote Sensing. 3rd ed. New York, John Willey, p. 131-180
Lopes, A., Touzi, R. and Nezry, E. 1990. Adaptive speckle filters and scene heterogeneity. IEEE
Transaction on Geoscience and Remote Sensing, 28: 992-1000.
Paradella, W. R.; Krug, T.; Landry, R.; Pietsch, R. W. 1997a. GLOBESAR-2: O Programa de
Avaliação de Dados do RADARSAT-1 nas Geociências Revista Brasileira de Geociências,
27: 403-406.
PCI, 1999. EASI-PACE User’s Manual, version 6.3, PCI Enterprises, Ontario, Canada.
Raney, K. 1998. Radar fundamentals: technical perspective. In: Henderson, F.M. and Lewis, A.J.
(eds.), Principles & Applications of Imaging Radar. Manual of Remote Sensing. 3rd ed. New
York, John Willey, p. 8-130.

83
Rudant, J.P.; Baltzer, F.; Deroin, J.P.; lointier, M.; Maitre, H.; Mouglin, E.; Pénicand, C.; Prost,
M.T. 1996. Apport des images radar satellitaires ERS-1 et JERS-1 dans le domaine de la
cartographie générale et thématique en contexte tropical humide: exemples en Guyane
française et régions limitrophes. Société Française de Photogrammétrie et Télédetection,
142: 15-33.
Singhroy, V. 1992. Radar geology: techniques and results. Episodes, 15: 15-20.
Singhroy, V. 1995. SAR integrated techniques for geoharzard assessment. Advanced Space
Research, 15: 1167-1178.
Singhroy, V. 1996. Interpretation of SAR images for coastal zone mapping in Guyana. Canadian
Journal of Remote Sensing, 22: 317-328.
Souza Filho, P.W.M. 1995. Influência das Variações do Nível do Mar na Morfoestratigrafia da
Planície Costeira Bragantina (NE do Pará) durante o Holoceno. Master Dissertation,
Universidade Federal do Pará, 123pp.
Souza Filho, P. W. M., 2000a. Impactos naturais e antrópicos na planície costeira de Bragança.
In: Prost, M. T. and Mendes, A. C. (eds.), Impactos Ambientais em Áreas Costeiras: Norte e
Nordeste do Brasil e Guiana Francesa. Belém, Mus. Par. Emílio Goeldi/UNESCO. (In press).
Souza Filho, P.W.M. 2000b. Mangroves as geological indicator of coastal changes. In:
International Mangrove Conference, Recife, ISME/UFRPE, CD ROM of Full Paper.
Souza Filho, P.W.M. and El-Robrini, M. 1996. Morfologia, processos de sedimentação e
litofácies dos ambientes morfosedimentares da Planície Costeira Bragantina - Nordeste do
Pará (Brasil). Geonomos 4: 1-16.
Souza Filho, P.W.M. and El-Robrini, M. 1998. As variações do nível do mar e a estratigrafia de
sequências da Planície Costeira Bragantina - Nordeste do Pará, Brasil. Boletim do Museu
Paraense Emílio Goeldi, Série Ciências da Terra 10: 45-78.
Souza Filho, P. W. M. and El-Robrini, M. 2000. Coastal Zone Geomorphology of the Bragança
Area, Northeast of Amazon Region, Brazil. Revista Brasileira de Geociências, 30, 518-522.
Souza Filho, P. W. M. and Paradella, W.R. Evaluation of Landsat Thematic Mapper and
RADARSAT-1 Data to Geological Mapping on a Mangrove Coast, Bragança, Pará,
Brazilian Amazon Region. Wetlands Ecology and Management (submitted).

84
3.2. INTEGRATION OF REMOTELY SENSED DATA FOR COASTAL GEOMORPHOLOGICAL MAPPING IN BRAGANÇA, AMAZON REGION, BRAZIL
ABSTRACT
This work shows the application of integrated microwave and optical data for coastal
geologic study in one of the largest mangrove system of the world, along the Pará and Maranhão
State coasts (northern Brazil). The study site, in the Bragança Coastal Plain, is a macrotidal
depositional system, whose evolution is related to fall in the relative sea level during Holocene.
In this research, it was evaluated and compared a series of Landsat TM data digitally integrated
with RADARSAT-1 Fine Mode imagery. Two different image enhancements were applied to the
TM scenes: decorrelation stretch (DEC) of TM 4, 5, 3 bands, and selective principal components
analysis (SPC) from the PC1 of TM 1, 2, 3, TM4 and PC1 of TM 5, 7. The integration of the
SAR with optical data was based on the IHS transformation.
The SAR data has allowed enhancing differences between coastal vegetation heights and
areas showing different moisture content. On the other hand, TM Landsat images have
contributed to enhance vegetation and sedimentary environments based on the spectral response
of the targets. The SPC-SAR integrated product was considered the best product for coastal
geological mapping, providing additional information about geobotany (vegetation and coastal
sedimentary environment relationship), emerge and submerge coastal geology and also insights
regarding multi-temporal dynamics.
Keywords: Remote sensing, tropical environment, RADARSAT-1, Landsat TM, and SAR
integrated products.
INTRODUCTION
The Brazilian Amazon coast along the states of Pará and Maranhão extends, for almost
480 km and represents the largest mangrove system of the world, measuring almost 6,000 km2
(Herz, 1991). This mangrove coast is extremely irregular and jagged with numerous bays and
estuaries. The broad coastal plain presents a low gradient and reach 45 km as a result of falling
relative sea level, associated to rapid muddy progradation of the coast in response to the riverine
sediment supply. Geologically, the region has been locally mapped from optical remote sensing
data (Souza Filho, 1995). However, due to the mixed spectral response of the sediments,
vegetation and water in the coastal environments, part of the geological features has been very

85
difficult to be discriminated. In addition, the constant cloud cover over mangrove system restricts
the data acquisition based on optical sensors. On the other hand, Synthetic Aperture radar (SAR)
with side viewing geometry, longer wavelength and all-weather sensing capability has been
extensively used as an operational tool for coastal mapping, playing an important role in the
acquisition of information in tropical rain forest environments (Rudant et al., 1996; Singhroy,
1996; Kushwaha et al., 2000).
The process of digital integration based on different sources of remote sensing data is a
promising alternative for solving problems regarding geological mapping of coastal
environments, such as undistinguished features and coastal changes. The nature of this approach
is based on the pixel fusion of complementary remote sensing and geosciences data, producing
accurate and color image maps on which colors and textural attributes can meaningfully be
interpreted (Harris et al., 1994; Paradella et al., 1997a).
The main purpose of this study was to investigate the use of different TM digital
processing techniques integrated with RADARSAT Fine Mode data for coastal environmental
geological mapping in this complex coastal environment of the Brazilian Amazon Region.
STUDY SITE AND GEOLOGICAL SETTING
The Bragança Coastal Plain is located on the northeastern part of the State of Pará along
the macrotidal northern Brazilian mangrove coast (Figure 1). Geologically, the area is related to
in the Bragança-Viseu coastal basin (Cretaceous), and shows an evolution mainly controlled by
normal faults. The tectonical and structural framework of the basin is responsible for a
submergence of the coastal zone (Souza Filho, 2000). This submerging coast coupled with falling
relative sea level, during the Holocene and riverine sediment supply, have allowed the muddy flat
progradation and development of one of the largest mangrove system of the world (Kjerfve et al.,
2000).
The study area is related to Tertiary deposits of the Barreiras Group and Pirabas
Formation. These deposits constitute the coastal plateau along the north of Brazil, which forms
inactive and active cliffs in the coastal plain (Souza Filho and El-Robrini, 2000).
The coastal plain extends northward of the coastal plateaus for more than 20 km, and is
characterized by a macrotidal mangrove coast. The major coastal features observed are tidal
mudflats (mangrove), salt marshes, tidal sandflats, chenier sand ridges, coastal sand dunes,

86
barrier-beach ridges and ebb-tidal delta (Figure 1). The estuarine plain extends southward
upstream as far as the tidal limit of the Caeté, Maiaú and Tapera-Açu estuaries. The climate in the
area is hot, typical of the humid equatorial climate, marked by a wet season from December to
May and a dry season from June to November. The annual precipitation is around 2,500 mm and
the relative humidity ranges from 80 to 91%.
Figure 1- Location of study area and the coastal zone geomorphologic map (Modified from Souza Filho and El-Robrini 1998).
REMOTE SENSING DATASET
The investigation was based on a RADARSAT Fine Mode (Beam 1) image, acquired on a
descending pass in 1998, under the Globesar-2 Program. Details about this program can be found
in Paradella et al. (1997b). Spaceborne optical data were represented by the Landsat TM
reflective bands (path 222, row 61), acquired in 1991 under INPE auspicious. Table 1 provides
details of the remotely sensed data used in the investigation.
H RanaRo cosleiro
Manguezal de supramaré
_*{ Manguezal de inlermaré
-J Pântano salmo interno
Pântano salino oxlerno
□ Planície arenosa B Chenier
["•« Dunas costeiras
O Praias
_ Ranioe cstuanna
Ranlcio do inundação

87
Table 1. Characteristics of the remotely sensed data.
Platform Sensor Acquisition Date
Angle of Incidence
Spatial Resolution (m)
Pixel Size (m)
Number of Looks
Image Format
RADARSAT-1 Fine Beam Mode 1
September 08, 1998
37-40º 9,1 x 8,4 6,25x6,25 1x1 16-bits Path Image
Landsat-5 TM Bands 1,2,3,4,5,7
December 31, 1991
_____ 30 x 30 30 x 30 _____ 8-bits
DIGITAL IMAGE PROCESSING
Geometric Correction
The main steps of the methodological approach are presented in the flow chart shown in
Figure 2. The methodology essentially has involved multisensor data fusion and visual
interpretation of the enhanced products for detection and characterization of the tropical coastal
environments. The digital analysis was carried out based on the EASI-PACE package (PCI
1999). The optical and SAR data were geometrically corrected to a common UTM format, thus
ensuring data standardization on a spatial sense, and allowing data manipulation and comparison
on a pixel-to-pixel basis (Toutin, 1995). An ortho-rectification scheme was used to correct
induced terrain distortion, which is a major factor in radar geometric correction due to the off-
nadir viewing. Distortions due to relief in optical and even SAR images can be considered
negligible over low-relief terrain. In the study area, variations of elevation are less than 4 m and
due to the absence of a previous digital elevation model (DEM); the ortho-rectification correction
was applied assuming a flat terrain model along the coastal plain. Based on the statistics of the
ortho-rectification for the TM and the SAR data (RMS accuracies around one cell resolution for
each data). In order to keep a balance of the geometric and the radiometric integrities in the data
fusion, a 30-meter pixel size was selected as common pixel size for the data integration.
Digital Enhancement Techniques and Data Integration
The digital integration was based on the Intensity-Hue-Saturation (IHS) transform (Harris
et al. 1990). For the RADARSAT-1 Fine image, antenna pattern correction (APC) and speckle
suppression filtering were applied as radiometric processing. The APC was based on the
procedures designed by Pietch (1993). An Enhanced-Frost filter was chosen to reduce speckle
effects (Lopes et al., 1990) and applied during the ortho-rectification process. The RADARSAT-

88
1 Fine image was further linearly stretched and used as the Intensity channel in the reverse IHS-
RGB transformation.
Figure 2- Flow chart with the main steps in the RADARSAT F1 and Landsat TM data fusion.
Scaling of 16 bits - 8 bits
Mathemetical model for geometric
correction
Geometric ortho-correction
RADARSAR Fine Mode F1
Reading of image orbit
INPUT
Radiometric
Geometric Correctio
Enhancement
PRE-PROCESSING PHASE:
and
PROCESSING PHASE:
ASSESSMENT: SAR and TM Data Combination
Ground control point selection
Landsat TM
Reading of image orbit
Mathemetical model for geometric
correction
Geometric ortho-correction
Atmospheric Correction
SPC-SAR Transformation TM bands 1,2,3,5 and 7
RBG to IHS Convertion
I - Replaced bySAR H - Keep the same S - Constant of 60
IHS to RGB Conversion
Linear stretch SPC-SAR
Photogeologic Interpretation
Data
and
Speckle reduction
Decorrelation stretch PC1(TM1,2,3), TM4,
PC1(TM5,7)
TM bands 453
RBG to IHS Convertion
I - Replaced bySAR H - Keep the same S - Constant of 60
IHS to RGB Conversion
Linear stretch DEC-SAR
Photogeologic Interpretation
Decorrelation stretch TM bands TM 453

89
The pre-processing technique applied to the TM data has involved the radiometric
correction related to the attenuation of atmospheric effects and was based on the minimum
histogram pixel (Chavez, 1988). A feature selection approach based on the optimum index factor-
OIF (Chavez et al., 1982) was also used to select triplets of the TM bands for color composites.
The RGB color composite TM4, TM5 and TM3 was chosen based on this triplet was used as
input for the integration (modulation of hue in the IHS transform).
Two different image enhancements were applied to the TM bands before the digital
integration with SAR data: 1) decorrelation stretch of a set of TM bands (TM 3, 4 and 5); and 2)
selective principal components (SPC) based on the PC1 of TM 1, 2, 3, and PC1 of TM 5, 7, plus
the use of the original TM4.
Decorrelation stretch is a spectral enhancement technique based on the use of principal
component transformation. Normally, a set of three original bands is transformed to a new and
decorrelated coordinate system (Gillespie et al. 1987). The purpose of using decorrelated images
is mainly to maximize spectral contrast given by color nuances. Several examples of the effective
use of decorrelation stretching of the Landsat TM, previously to SAR integration, have been
published in the literature (Harris et al., 1994; Paradella et al. 1997a; 1998).
The "SPC-SAR Integrated Product" used in this research constitutes a new approach, and
was originally proposed by Paradella et al. (1999) for the integration of RADARSAT and TM
data in the geological mapping of the Carajás Mineral Province (Amazon Region). Basically, a
principal component transform is independently applied to two distinct sets of the TM bands (TM
1, 2 and 3; and 5 and 7). The two first eigen channels obtained (PC1 of TM 1, 2, 3 and PC1 of
TM 5 and 7), retained the maximum variance of the visible and the mid-infrared parts of the TM
spectrum (Table 2). In addition, TM 4 band was used as one of the three input channels in the
RGB/IHS transform. In order to maximize the variance of these channels, a decorrelation stretch
can be also applied to the channels, previously to the RGB/IHS transform. A synthetic image
(image with a constant value) with a digital number 60 was used as the saturation channel in the
reverse IHS-RGB transform.

90
Table 2: Eigenvector loadings and variance (in %) of the selective principal component images obtained: a) for TM 1, 2 and 3 bands, and b) for TM 5 and 7 bands.
a)
PC1 PC2 PC3
TM1 0.69 0.42 0.59 TM2 -0.61 -0.09 0.78 TM3 -0.38 0.90 -0.20
Var. (%) 95.11 4.42 0.47
b)
PC1 PC2 TM5 0.08 -0.99 TM7 -0.99 -0.08
Var. (%) 64.44 35.56
RADARSAT WITH LANDSAT TM DATA INTEGRATION
The complementary aspects of integrating radar and optical imageries have already been
demonstrated aiming at geologic applications (Harrys et al., 1990; Harrys et al., 1994; Singhroy,
1996; Paradella et al., 1997a; Paradella et al., 1998). While backscattered microwave energy from
the Earth's surface measured by a SAR system provides information the geometry (macro and
micro-topography) and electrical properties (particularly related to the water content) (Lewis et
al., 1998), optical sensors provide information controlled by physical-chemical properties of the
targets (Colwell, 1983). Thus, the synergism of SAR and optical data through integrated products
improve the detection and the characterization of coastal environments and features, mainly in
tropical coastal environments.
Two types of integrated products were produced using SAR and TM data acquired from
the Bragança Coastal Plain. The evaluation of these products was based on visual interpretation
taking into account color and textural attributes. Table 2 provides a ranking of the performance of
the integrated products, based on a criterion of interpretability (range of color-texture,
effectiveness of integration, ability to combine more than three bands of Landsat TM with SAR
data).
The RADARSAT-TM integrated based on the Fine image and the three TM decorrelated
bands (DEC 453) was no so effective to discriminate the different coastal environments, mainly
along the shoreline and the estuarine plain. The interpretability and detection of image patterns
are poor, probably in response to the combination of only three TM bands. This product provides,
principally SAR information related to macro-topography (low local slopes), micro-topography
(superficial roughness), and water content of the coastal sedimentary environments. The intertidal
mangrove forest (Figure 3a) can only be separated from the secondary vegetation of the coastal

91
plateau due to rougher texture, without exposed soil. The supratidal mangrove (Figure 3b) with a
more spaced coastal forest is partly confused with the salt marsh, and is only discriminated due to
its spatial distribution. Backscattered responses controlled by the water content, has allowed
subdivided the salt marsh in: (1) inner salt marshes (Figure 3c), constituted by wet muddy
sediment, densely covered by grasses along tidal creeks, showing a dark green colors; and (2)
outer salt marshes (Figure 3d), covered by a grasses in a wet muddy sediments, responsible for
light greenish patterns. Cheniers sand ridges (Figure 3e) are discernible based on textural patterns
and spatial position, characterized by a smooth surface and dark tones in response to absorption
of the microwave radiation by dry sandy sediments. Barrier-dune-beach ridges, ebb-tidal deltas,
tidal sandflats, submerse sandy banks and tidal estuarine channel are difficult to be discriminated
on this integrated product.
Table 3- Evaluation of the integrated products Integrated Products Qualitative
Factors SAR x TM (SPC) SAR x TM (DEC)
Interpretability of patters G P
Color-texture range G P
Combination of more than
three TM bands
Y N
Shoreline delineation G G
Coastal environment
recognizing
G M
Subjective Ranking 1 2
DEC = Decorelated stretch SPC = Selective principal component
P = Poor M = Moderate G = Good N = No Y = Yes
1 = Highest ranking 4 = Lowest ranking
The RADARSAT-TM integrated product produced from the Fine Mode image and the selective
principal component of the six TM reflective bands has shown much better results for the coastal
geological mapping. This product has favoured the visual interpretability (better range of color-
texture), showing effectiveness of integration, and ability to combine information from more than
three bands of the Landsat TM with SAR data. Hence, the complementary aspects of integrating
radar and visible and infrared imageries were reached, allowing a much more accurate and easier
and more consistent interpretation of the remote sensing data. According to Souza Filho and

92
Paradella (submitted), with the "SAR-SPC Integrated Product", three relevant aspects have been
embedded in this integration: 1) powerful tool for visual analysis; 2) geobotany; and 3) multi-
spectral and multi-temporal analysis.
Figure 3- RADARSAT (F1) and Landsat TM (decorrelation stretch) integrated product from the Bragança Coastal Plain. The letters are discussed in the text (a = intertidal mangrove, b = supratidal mangrove, c = inner salt marsh, d = outer salt marsh, e = chenier sand ridge).
320000rfi E. 29 30 280000™ E
kO r\i
CM rn
a
e
a b
f- « ■ ■ 9(1 9(1
a v.Y •C
r
VM m- •t ■ ■ Wí A-V
m 89 89 »
Coastal PJatôau ' ' *-r :v''':
■'-A- ai v "w/.
, ai Kl •b:
■ • ca m a> r •**« v ■ ■• •
mmmm
ZVOOODia E, 30 31 320000ni E.

93
The spectral TM and textural SAR integrated responses can be related to topographic
differences (elevation) closely related to variations in sedimentology, water content and
geobotanical controls. Thus, intertidal mangrove forest associated with wet muddy sediments,
flooded twice per day by tides, is expressed by a greenish pattern and a rough texture (Figure 4a).
The supratidal mangrove forest related to muddy sediments, and flooded only during high spring
tides, is characterized by a more spaced mangrove forest showing bluish colors (Figure 4b).
Figure 4- RADARSAT (F1) and Landsat TM (selective principal component) integrated product from the Bragança Coastal Plain. The letters are discussed in the text (a = intertidal mangrove, b = supratidal mangrove, c = inner salt marsh, d = outer salt marsh, e = chenier sand ridge, f = barrier-dune beach ridge, g = ebb-tidal delta, h = tidal sandflat, i = submerse sandy bank, j = tidal estuarine channel, k = coastal change).
32ooooiti e. 29 30 2oOOOOin E.
hO
cg cr»
e
b
N.
i (S í:
90 90
\ r ■rw
V-i MSS 'r 'L- .»
89 89 ¥'< .A
w :í' r Coastal Plateáú -
m ■> *■ co ^êcák * co an v-
% CltY ír> "v. CO CO
280000ni E. 30 31 320000ni E

94
The vegetated inner salt marsh is constituted by wet muddy sediment, densely covered by
grasses expressing as dark green colors (Figure 4c), while outer salt marshes, covered by a more
spaced grasses with muddy exposed sediments, are depicted as bluish patterns (Figure 4d).
Cheniers sand ridges, topographically higher, dry and covered by arbustive vegetation, are related
to reddish hues (Figure 4e). The shoreline and estuarine environments, such as barrier-dune-
beach ridges (Figure 4f), ebb-tidal deltas (Figure 4g), tidal sandflats (Figure 4h), submerse sandy
banks (Figure 4i) and tidal estuarine channel (Figure 4j), almost not perceptible in the SAR data
are easily mapped in the "SPC-SAR integrated Product" due to the spectral TM contribution
(hue), expressed as reddish colors.
Finally, a multi-temporal analysis can be done based on a single color composite product
since images of different dates are integrated, and provide information about coastal accretion or
retreating. This is a fundamental aspect to be addressed when dealing with coastal dynamic
studies (Figure 4k).
CONCLUSIONS
This research has demonstrated how the spaceborne SAR integrated with optical remote
sensing data can be used to support coastal geological mapping in tropical macrotidal
environments. The "SPC-SAR Integrated Product" has proved to be a powerful toll for the
integration of RADARSAT with Landsat TM data, showing the best performance in the
discrimination of units in this kind of coastal environment. This superior performance was mainly
related to the information content provided by the six reflective TM bands. The first eigen
channel (PC1) obtained from the TM bands 1, 2 and 3 was responsible for the enhancement of
the shoreline and submerse coastal features. The first eigen channel (PC1) generated from the TM
bands 5 and 7 has enhanced exposed soils in the coastal environments and allowed the spectral
discrimination between inner and outer salt marshes and supratidal mangroves. The contribution
of the TM band 4 was related to the discrimination of dense mangrove forest from secondary
vegetation of the coastal plateaus, whose spectral response is mixed with exposed soil produced
by human activity. The SAR data was responsible by the enhancement of distinct coastal
vegetation height, geometry and water contents. In addition, the digital fusion of RADARSAT
Fine with TM images also provided a synoptic view of the area, and favored planning for field
campaigns and the integration of previous disperse information. Finally, the use of SAR image
integrated with optical data must be recognized by coastal geologist as an extremely important

95
tool for mapping and purposes monitoring of the coastal zones. The "SPC-SAR integrated
product" has provides information about geobotany (vegetation and coastal sedimentary
environment relationship), emerge and submerge coastal geology, and also allowed the detection
of changes in coastal areas over periods of years to decades, which cannot be done from field
investigations alone.
Acknowledgements
The authors would like to thank the National Institute for Space Research (INPE) for the
support during the digital image processing. The PROINT Project (Geoscience Center of Federal
University of Pará) and PROF Project (Geology and Geochemistry Under-graduation Course)
have provided the financial support for the fieldwork campaigns. The reviewers for their helpful
comments on the manuscript. The Landsat TM images were kindly provided by INPE.
RADARSAT data was provided by CSA/RSI under the GlobeSAR-2 Program.
REFERENCES
Chavez, P.S., Berlin, G.L. and Sowers, L.B. 1982. Statistical method for selecting Landsat MSS
ratios. Journal of Applied Photographic engineering, 8: 23-30.
Chavez, P.S. 1988. An improved dark-object subtraction technique for atmospheric scattering
correction of multispectral data. Remote Sensing of Environment, 24: 450-479.
Colwell, R.N. 1983. Manual of Remote Sensing. American Society of Photogrammetry, Falls
Cruch, VA.
Gillespie, A.R.; Kahle, A.B.; Walker, R.E. 1987. Color enhancement of highly correlated images.
II. Channel ratio and "chromaticity" transformation techniques. Remote Sensing of
Environment, 22: 343-365.
Harris, J.R., Bowie, C., Rencz, A.N., Graham, D. 1994. Computer-enhancement techniques for
the integration of remotely sensed, geophysical, and thematic data for the geosciences.
Canadian Journal of Remote Sensing, 20: 210-221.
Harris, J. & Murray, R. 1990. IHS transform for the integration of radar imagery with geological
data. Photogrammetric Engineering & Remote Sensing, 56: 1631-1641.
Herz, R. 1991. Manguezais do Brasil. IOUSP/CIRM, São Paulo, Brazil.

96
Kjerfve, B.; Perillo, G.M.E.; Gardner, L.R.; Rine, J.M.; Dias, G.T.M.; Rebelo-Mochel, F. 2000.
morphodynamics of muddy environments along the Atlantic coast of North and South
America (in press).
Kushwaha, S.P.S., Dwivedi, R.S. and Rao, B.R.M. 2000. Evaluating of various digital image
processing techniques for detection of coastal wetlands using ERS-1 SAR data. International
Journal of Remote Sensing, 21: 565-579.
Lewis, A.J.; Henderson, F.M.; Holcomb, D.W. 1998. Radar fundamentals: the geoscience
perspective. In: Henderson, F.M. and Lewis, A.J. (eds.), Principles & Applications of
Imaging Radar. Manual of Remote Sensing. 3rd ed. New York, John Willey, p. 131-180
Lopes, A., Touzi, R. and Nezry, E. 1990. Adaptive speckle filters and scene heterogeneity. IEEE
Transaction on Geoscience and Remote Sensing, 28: 992-1000.
Paradella, W.R., Bignelli, P.A., Veneziani, P, Pietsch, R.W. and Toutin, T. 1997a. Airborne and
spaceborne synthetic aperture radar (SAR) integration with Landsat TM and gamma ray
spectrometry for geological mapping in a tropical rain forest environment, the Carajás
Mineral Province, Brazil. International Journal of Remote Sensing, 18: 1483-1501.
Paradella, W. R.; Krug, T.; Landry, R.; Pietsch, R. W. 1997b. GLOBESAR-2: O Programa de
Avaliação de Dados do RADARSAT-1 nas Geociências Revista Brasileira de Geociências,
27: 403-406.
Paradella, W.R., Santos, A.R., Dall' Agnol, R., Pietsch, R.W. and Sant'ana, M.V. 1998. A
geological investigation based on airborne (SAREX) and spaceborne (RADARSAT-1) SAR
integrated products in the Central Serra dos Carajás Granite Area, Brazil. Canadian Journal
of Remote Sensing, 24: 376-392.
Paradella, W. R.; Santos, A. R., Venezini, P., Morais, M. C. 1999. Avaliação de dados do
RADARSAT-1 em Aplicação Geológica na Província Mineral de Carajás, Estado do Pará.
Final Report: FAPESP Project # 10946-4/1997, INPE-São José dos Campos, Brazil.
PCI, 1999. EASI-PACE User’s Manual, version 6.3, PCI Enterprises, Ontário, Canadá.
Pietsch, R.W. 1993. TFI SAR Processing Report. Internal Report, CCRS/Dendron Surveying,
Ottawa, Canada.

97
Rudant, J.P.; Baltzer, F.; Deroin, J.P.; lointier, M.; Maitre, H.; Mouglin, E.; Pénicand, C.; Prost,
M.T. 1996. Apport des images radar satellitaires ERS-1 et JERS-1 dans le domaine de la
cartographie générale et thématique en contexte tropical humide: exemples en Guyane
française et régions limitrophes. Société Française de Photogrammétrie et Télédetection,
142: 15-33.
Singhroy, V. 1996. Interpretation of SAR images for coastal zone mapping in Guyana. Canadian
Journal of Remote Sensing, 22: 317-328.
Souza Filho, P.W.M. 1995. Influência das Variações do Nível do Mar na Morfoestratigrafia da
Planície Costeira Bragantina (NE do Pará) durante o Holoceno. Master Dissertation,
Universidade Federal do Pará, 123pp.
Souza Filho, P. W. M. 2000. Tectonic control on the coastal zone geomorphology of the
northeastern Pará State. Revista Brasileira de Geociências, 30: 523-526.
Souza Filho P.W.M. and El-Robrini M. 1998. As variações do nível do mar e a estratigrafia de
sequências da Planície Costeira Bragantina - Nordeste do Pará, Brasil. Boletim do Museu
Paraense Emílio Goeldi, Série Ciências da Terra, 10: 45-78.
Souza Filho, P. W. M. and El-Robrini, M. 2000. Coastal Zone Geomorphology of the Bragança
Area, Northeast of Amazon Region, Brazil. Revista Brasileira de Geociências, 30: 518-522.
Souza Filho, P. W. M. and Paradella, W.R. Evaluation of Landsat Thematic Mapper and
RADARSAT-1 Data to Geological Mapping on a Mangrove Coast, Bragança, Pará,
Brazilian Amazon Region. Wetlands Ecology and Management (submitted).
Toutin, T. 1995. Intégration de données multi-source: comparaison de méthodes géométriques et
radiométriques. . International Journal of Remote Sensing, 16: 2795-2811.

98
3.3. REMOTE SENSING DATA AND GEOGRAPHIC INFORMATION SYSTEM
INTEGRATION FOR COASTAL GEOMORPHOLOGICAL MAPPING IN A
MACROTIDAL MANGROVE COAST, BRAZILIAN AMAZON REGION
ABSTRACT
The geomorphologic mapping in a macrotidal coastal plain in the Amazon region is complex.
Firstly, as these lowland coast environments are formed by large and heterogeneous landforms,
and secondly, these landforms are submitted to rapid and significant changes along the coastline.
The coastal environments spatial changes, in the inner sectors of the coastal plain, are related to a
long-term time scale. Therefore, the geomorphologic mapping does not have to be updated in
relation to geologic and morphologic attributes, except to monitor and manage coastal
environments. This study suggests that integrated spatial analysis of remote sensing data
(RADARSAT-1 and Thematic Mapper™ images) with Geographic Information System
represents a new approach to geomorphologic mapping in wet tropical coastal plains. This
approach became possible with the integration of a complete sequence of acquisition, processing,
storage and management of the spatial data. Based on spatial, spectral and textural attributes, the
coastal environments were mapped and validated with field observations, such as sediments,
stratigraphy, vegetation, topography, land cover and land use characteristics. This research has
revealed that integrated remote sensing data and GIS for geomorphologic coastal mapping
provided valuable, rapid and accurate methods for the study of coastal landforms. Remote
sensing data provides great details of the coastal configuration and associated with the
organizational philosophy of GIS allow the site characterization, base maps and thematic maps
generation and information dissemination for public consultation, which are all significant factors
in this decision-making process.
Key words: RADARSAT-1, Landsat TM, GIS, coastal geomorphology, northern Brazil.
INTRODUCTION
The coastal zone is a broad zone that reaches from the landward limit of marine processes
to the seaward limit of alluvial and shoreline processes, situated between continental and marine
environments where occur estuaries, deltas, tidal flats, salt marshes, barrier islands, cheniers,
lagoons, beaches and others (Summerfield, 1991). Coastal environments are products of many

99
complex interacting processes (transport, erosion and deposition), which are continually
modifying the landscape.
Geomorphologic mapping is concerned with the Earth's surface representation and shows
the shape, form, spatial distribution, constituent material, age and other planimetric features of
the landforms and give important keys to the processes, which led to their development (Cook
and Doornkamp 1990). The morphology and sedimentary facies of the coastal environments are
the product of interactions between tectonic controls, relative sea level, coastal processes and
sediment supply responsible for geomorphologic coastal evolution. Landform mapping in tropical
macro-tidal coastal plain environment is complicated due to a number of factors. Firstly, macro-
tidalflats form lowland areas, where relief information is often scarce and the spatial planimetric
representation becomes dominant. According to Yang et al. (1999), this often causes problems in
landform interpretation if spectral elements and other indirect features, such as vegetation pattern,
hydrographic features, and land use, are not effectively utilized. Secondly, the tidal range reaches
around 6 m, producing dramatic changes in coastal sedimentary environment boundaries, estuary
water line and shoreline position in response to wide vertical and lateral displacement of the tide.
Thirdly, the coastal geomorphological changes are very intense and rapid in many coastal
landforms. Therefore, these characteristics are limiting factors for coastal landform mapping in
the study site, along the Bragança coastal plain.
Orbital remotely sensed data has been extensively used in regional geomorphologic
mapping when a modern satellite platform was launched in the 1970's. Since this time, the most
useful source of satellite optical data for geomorphologic application is images from the Landsat
Thematic Mapper (TM). Coastal geomorphologic survey through TM Landsat has been carried
out elsewhere (Jones 1986; Gowda et al. 1995; Prost 1997; Ciavola et al. 1999; Yang et al. 1999).
During the last 10 years, Synthetic Aperture Radar (SAR) has been used more widely, mostly in
tropical coastal environments (Singhroy, 1995; 1996; Rudant et al., 1996; Prost, 1997; Kushwaha
et al. 2000). With SAR's side viewing geometry, longer wavelengths, and almost all-weather
sensing capability, RADARSAT-1 imagery has been extensively used as an operational tool for
geomorphological mapping in the moist tropics.
The complementary aspects of integrating radar, visible and infrared imageries have
already been demonstrated to geologic applications (Harrys et al., 1990; Rheault et al. 1991;
Harrys et al., 1994; Singhroy, 1996; Paradella et al., 1997a; Paradella et al., 1998; Ramsey III et

100
al. 1998). While backscattered microwave energy from the Earth's surface measured by a SAR
system provides information the geometry (macro and micro-topography) and electrical
properties (particularly related to the water content) (Lewis et al., 1998), optical sensors provide
information controlled by physical-chemical properties of the targets (Colwell, 1983). Thus, the
synergism of SAR and optical data through integrated products improve the detection and
characterization of coastal environments and features, mainly in wet tropical coastal
environments.
According Burrough (1986), remote sensing and geographic information system (GIS)
can be treated as general framework of integrated spatial analysis. Hence, the remote sensing data
represents the source of geographical information, providing important features in the space and
time domains. The ability to combine a data set (remote sensing and geosciences data) and
simultaneously interpret the spatial relationship between various sources of information allows
for a more accurate and comprehensive interpretation (McGregor et al., 1999).
The purpose of this research was to integrate remote sensing data, digital image
processing and GIS techniques to geomorphologic mapping in a wet tropical mangrove coast.
Based on remotely sensed data and GIS integrated approach, coastal landforms have been
mapped to provide a better understanding of the geomorphologic coastal evolution of the
Bragança coastal plain.
STUDY AREA
The study area is located along the Pará-Maranhão Coast, northern Brazil (Figure 1),
which represents one of the larger mangrove systems of the world, with almost 6,000 km2 (Herz,
1991). Geologically, the area is located in the Bragança-Viseu coastal basin of Cretaceous age,
whose tectonic evolution is controlled by normal faults. The structural framework of this coastal
basin is responsible for a submergence of the coastal zone (Souza Filho, 2000). This submerging
coast coupled with a falling relative sea level during the Holocene. The riverine sediment supply
has allowed the muddy flat progradation and development of the coastal sedimentary
environment during the last 5,1000 years B.P. (Souza Filho and El-Robrini, 2000).
The coastal study site is developed over Tertiary deposits of the Barreiras Group and
Pirabas Formation. These deposits constitute the coastal plateau along the northern Brazilian
coast, which is bounded by inactive and active cliffs (Souza Filho and El-Robrini 1996). The

101
coastal plain extends northward of the coastal plateaus for more than 20 km, where are found
wide tidal flats. The major coastal environments observed are tidal mudflats (mangrove), salt
marshes, tidal sandflats, chenier sand ridges, coastal sand dunes, barrier-beach ridges and ebb-
tidal delta (Souza Filho, 1995).
Figure 1- Location map of the Bragança Coastal Plain.
The estuarine plain extends southward upstream as far as the tidal limit of the Caeté,
Maiaú and Tapera-Açu estuaries and it is bounded northward by marine processes. The climate in
the area is a hot and humid equatorial climate, with rainy season from December to May and a
dry season from June to November, with an annual precipitation averaging 2,500 mm and relative
humidity of the air ranging from 80 to 91%.
—
É ■ o K-y—•—-
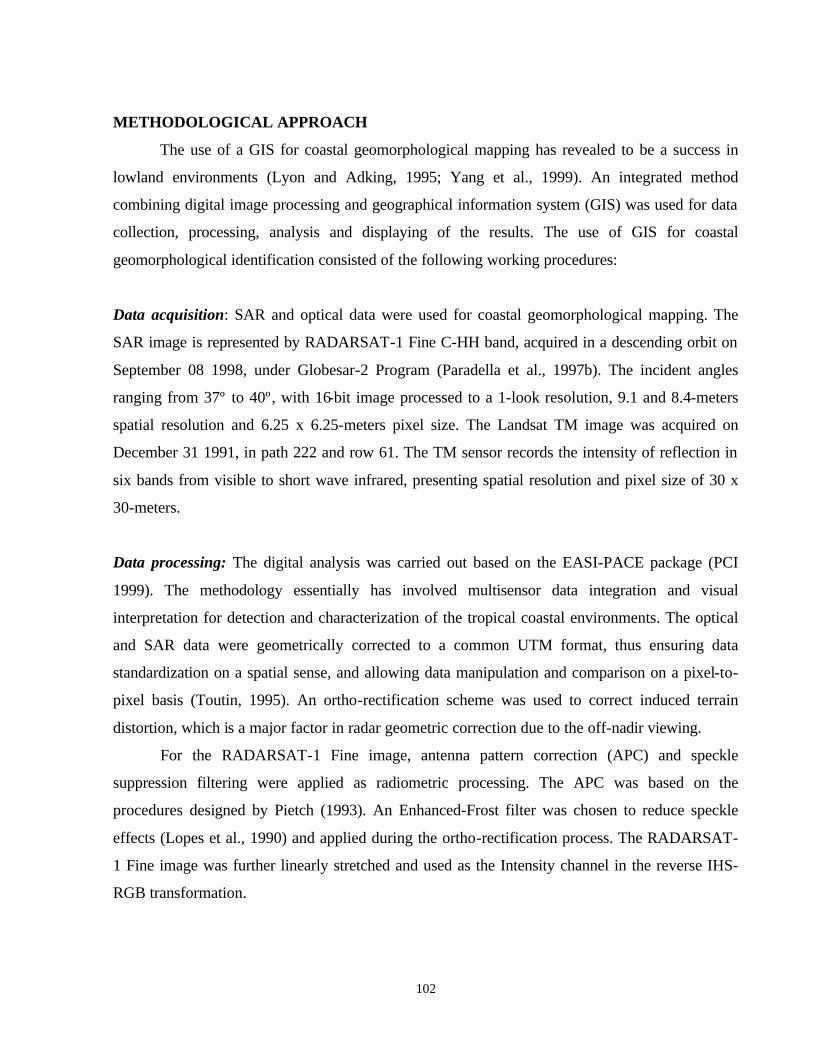
102
METHODOLOGICAL APPROACH
The use of a GIS for coastal geomorphological mapping has revealed to be a success in
lowland environments (Lyon and Adking, 1995; Yang et al., 1999). An integrated method
combining digital image processing and geographical information system (GIS) was used for data
collection, processing, analysis and displaying of the results. The use of GIS for coastal
geomorphological identification consisted of the following working procedures:
Data acquisition: SAR and optical data were used for coastal geomorphological mapping. The
SAR image is represented by RADARSAT-1 Fine C-HH band, acquired in a descending orbit on
September 08 1998, under Globesar-2 Program (Paradella et al., 1997b). The incident angles
ranging from 37º to 40º, with 16-bit image processed to a 1-look resolution, 9.1 and 8.4-meters
spatial resolution and 6.25 x 6.25-meters pixel size. The Landsat TM image was acquired on
December 31 1991, in path 222 and row 61. The TM sensor records the intensity of reflection in
six bands from visible to short wave infrared, presenting spatial resolution and pixel size of 30 x
30-meters.
Data processing: The digital analysis was carried out based on the EASI-PACE package (PCI
1999). The methodology essentially has involved multisensor data integration and visual
interpretation for detection and characterization of the tropical coastal environments. The optical
and SAR data were geometrically corrected to a common UTM format, thus ensuring data
standardization on a spatial sense, and allowing data manipulation and comparison on a pixel-to-
pixel basis (Toutin, 1995). An ortho-rectification scheme was used to correct induced terrain
distortion, which is a major factor in radar geometric correction due to the off-nadir viewing.
For the RADARSAT-1 Fine image, antenna pattern correction (APC) and speckle
suppression filtering were applied as radiometric processing. The APC was based on the
procedures designed by Pietch (1993). An Enhanced-Frost filter was chosen to reduce speckle
effects (Lopes et al., 1990) and applied during the ortho-rectification process. The RADARSAT-
1 Fine image was further linearly stretched and used as the Intensity channel in the reverse IHS-
RGB transformation.

103
The pre-processing technique applied to the TM data has involved the radiometric
correction related to the attenuation of atmospheric effects and was based on the minimum
histogram pixel (Chavez, 1988). Selective principal components (SPC) transform based on the
PC1 of TM 1, 2, 3, and PC1 of TM 5, 7, plus the use of the original TM4 was applied in the TM
reflective bands to before the digital integration with SAR data.
The "SPC-SAR Integrated Product" used in this research constitutes a new approach, and
was originally proposed by Paradella et al. (1999) for the integration of RADARSAT and TM
data in the geological mapping of the Carajás Mineral Province (Amazon Region). Basically, a
principal component transform is independently applied to two distinct sets of the TM bands (TM
1, 2 and 3; and 5 and 7). The two first eigen channels obtained (PC1 of TM 1, 2, 3 and PC1 of
TM 5 and 7), retained the maximum variance of the visible and the mid-infrared parts of the TM
spectrum. In addition, TM 4 band was used as one of the three input channels in the RGB/IHS
transform. In order to maximize the variance of these channels, a decorrelation stretch can be also
applied to the channels, previously to the RGB/IHS transform. A synthetic image (image with a
constant value) with a digital number 60 was used as the saturation channel in the reverse IHS-
RGB transform.
The main steps of the digital image processing methodological approach are presented in
the flowchart showed in the Figure 2, while the RADARSAT-TM integrated product produced
from the Fine Mode image and the selective principal component of the six TM reflective bands
is showed in the Figure 3.
Analysis and interpretation: The interpretation of the "SPC-SAR Integrated Product" was carried
out using standard keys such as tone/color, texture, pattern, form, size, geometry, drainage and
others. A detailed analysis of the coastal geomorphology is associated with important elements,
such as spectral, textural and geometric characteristics of the coastal landform. The subsequent
systematic interpretation was performed with on-screen digitizer provided by an Arc-View GIS
Software, version 3.1 (ESRI, 1996). The "SPC-SAR Integrated Product" was used to map on a
1:70.000 scale. A polygon file was initially generated to illustrate the coastal landform boundary,
while line files were used to show the drainage and roads, and point files were generated to show
towns and villages.
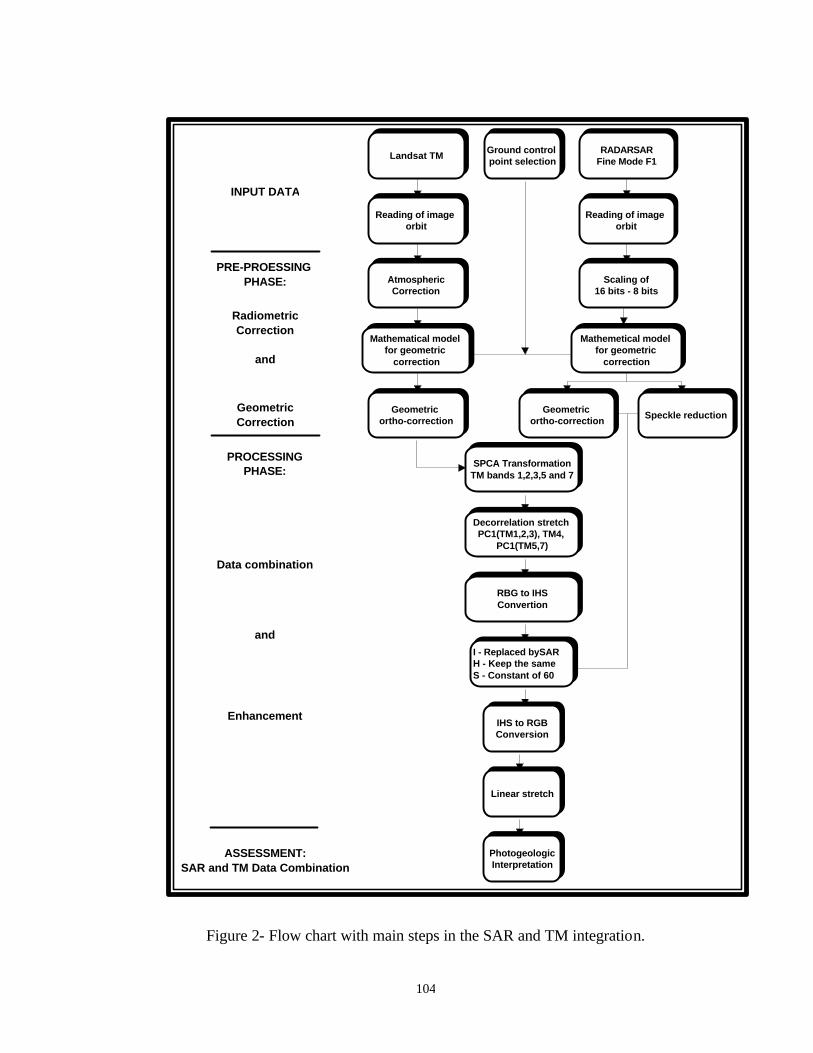
104
Figure 2- Flow chart with main steps in the SAR and TM integration.
Scaling of 16 bits - 8 bits
Mathemetical model for geometric
correction
Geometric ortho-correction
RADARSAR Fine Mode F1
Reading of image orbit
INPUT DATA
Radiometric Correction
Geometric Correction
Enhancement
PRE-PROESSING PHASE:
and
PROCESSING PHASE:
ASSESSMENT: SAR and TM Data Combination
Ground control point selection
Landsat TM
Reading of image orbit
Mathematical model for geometric
correction
Geometric ortho-correction
Atmospheric Correction
SPCA Transformation TM bands 1,2,3,5 and 7
RBG to IHS Convertion
I - Replaced bySAR H - Keep the same S - Constant of 60
IHS to RGB Conversion
Linear stretch
Photogeologic Interpretation
Data combination
and
Speckle reduction
Decorrelation stretch PC1(TM1,2,3), TM4,
PC1(TM5,7)
105
Figure 3 - SPC-SAR integrated product in the Bragança Coastal Plain. The letters are discussed in the text (a = intertidal mangrove, b = supratidal mangrove, c = inner salt marsh, d = outer salt marsh, e = chenier sand ridge, f = barrier-dune beach ridge, g = ebb-tidal delta, h = tidal sandflat, i = submerse sandy bank, j = tidal estuarine channel, k = coastal change).
Field working and observations: The field survey was carrying out to check the initial features
observed in the image interpretation. During the geomorphological mapping were identified
vegetation, sediment texture, stratigraphy, vegetation, age, topography and features of different
coastal landforms, which were positioned through the global positional system (GPS). Each
coastal unit was described and sampled through vibracorer techniques, whose sediments were
collected and analyzed from genetic facies approach.
32oooc« e 29 28dooo»
N
N O
d 90 90
H
'>* * \
. £ Á Sf
r B9 - V
Coastal Platc^üs
Bmcaríci CO
s CO
1 x CO
28oooo» E, 31 32oooob e

106
Map integration and cartographic presentation: Based on fieldwork data, the preliminary
polygon file was further modified and refined, together with the attribute database to calculate the
area of each coastal landform. The final map was cartographically designed with output,
including text placement, legend and hardcopy printing.
RESULTS AND DISCUSSIONS
Geomorphological mapping of the coastal zone
The landforms classification system adopted in this study is modified of ITC system of
geomorphologic survey (Verstappen and Van Zuidam, 1991). This is based on geomorphologic
principles, i.e. a classification on the basis of landform, sedimentary patterns, and the dominant
processes in operation related to historical processes. Some other factors, including land use and
land covers, were used for classification. Those coastal parameters were largely extracted from
digital image processing through manipulation of spectral-textural and spatial of the image data,
whose principal aim was to enhance the coastal landforms.
The "SPC-SAR Integrated Product" allowed the identification of various colors and
textures patterns. Along the coastal plain, a greenish pattern and a rough texture (Figure 3a)
express intertidal mangrove environment. A more spaced mangrove forest showing bluish colors
(Figure 3b) characterizes the supratidal mangroves. The vegetated inner salt marshes are
expressed as dark green colors (Figure 3c), while outer salt marshes are depicted as bluish
patterns (Figure 3d). Cheniers sand ridges are related to reddish hues (Figure 3e). The shoreline
and estuarine environments, such as barrier-dune-beach ridges (Figure 3f), ebb-tidal deltas
(Figure 3g), tidal sandflats (Figure 3h), submerse sandy banks (Figure 3i) and tidal estuarine
channel (Figure 3j), almost not perceptible in the SAR data are easily mapped in the "SPC-SAR
integrated Product" due to the spectral TM contribution (hue), expressed as reddish colors.
The geomorphologic map realized under a GIS environment is illustrated in Figure 4. The
characteristics of each coastal landform unit are summarized in Table 1, while detailed
description of morphologic, stratigraphic and sedimentary attributes can be found in the work of
Souza Filho (1995) and Souza Filho and El-Robrini (1998). This map represents the recent status
of the coastal plain in relation to morphology of sedimentary environment, vegetation conditions

107
and land use due to the more dramatic impacts, which were caused during the building of the
Bragança-Ajuruteua road in the early 1980's.
Coastal landforms description and interpretation
The major landforms observed in the Bragança Coastal Plain are tidal mudflats,
mangroves, salt marshes, tidal sandflats, chenier sand ridges, coastal dunes, barrier-beach ridges
and ebb-tidal delta (Figure 4).
Important observations in relation to geomorphologic processes, sediment pattern, coastal
processes, land cover and anthropogenic environmental impacts in the coastal plain are
highlighted below according to geomorphologic classification.
Coastal plateau
The Coastal Plateau is developed over Tertiary deposits of Barreiras Group and is marked
by land cover with secondary vegetation, such as pasture and also exposed soil. In response to
these characteristics, this target is very well distinguished by texture and mixed spectral response
of secondary vegetation and exposed soil (Figure 2).
Tidal mudflats (mangrove)
The tidal mudflats are easily mapped due to strong spectral response and rough texture of
the mangrove vegetation (Figure 2). The tidal mudflats constitute wide mangrove system. They
are located from the high spring tide to the mean tidal level. Organic muddy sediments are
deposited on the tidal flat during the slack tidewater, when the currents decrease. The field
studies have indicated that Rhizophora sp. and Avicennia sp. are the dominant species commonly
found along this coast.
The distribution of mangrove is mainly controlled by topography (Coehn et al. 2000).
Based on relative altimetry and vegetation height, the tidal flats were subdivided in supratidal
mangrove and intertidal mangrove. The supratidal mangroves are topographically higher with
smaller trees and reached by water only during the spring tides, while the intertidal mangroves
are topographically lower with high trees (almost 30 m) and progradational front’s seawards.

108
Table 1 - Characteristics of the coastal mapping features
Morphostratigraphic Unit
Sediments Morphology Land cover/ Use
Image characteristics (SPC-SAR Integrated Product)
Inundation time (day/yr.) Cohen et al., 2000)
Area (km2)
Area (%)
Estuaries and tidal channels
Fine sand, silty clay
Erosion and accretion of the channel margins
_________
Smooth surface with greenish tones 365 305
____
Submerse sandbank Fine sand Longitudinal banks with lateral shifting
_________ Smooth surface with reddish tones 365 92
10.05
Sand flat Fine sand Intertidal flat erosion and accretion
_________ Smooth surface with reddish tones 300 93
10.17
Mudflat Silt, silty clay Intertidal flat deposition _________ Smooth surface with dark tones 300 1.5
0.16
Ebb-tidal delta Fine sand Intertidal flat, erosion and accretion
_________ Smooth surface with reddish tones 300 3.6
0.40
Old estuarine sanbanks
Fine sand Supratidal flat accumulation _________ Smooth surface with bluish tones Without field data 0.2
0.02
Barrier-beach ridges Fine sand Intertidal flat erosion Arbustive Linear features, smooth surface with reddish tones
233 15 1.63
Coastal dunes Very fine sand Transverse, longitudinal and pyramidal dunes, erosion
Arbustive Rough surface with reddish tones 0 1,7
0.18
Chenier sand ridges Fine sand Transverse dunes with washover fans
Arbustive Linear features, rough surface with reddish tones 28 8
0.92
Young intertidal mangrove
Silt, silty clay Recent prograding zone Mangrove trees Rough surface with light greenish tones 300 12
1.32
Intertidal mangrove Silt, silty clay Accretion and erosion Mangrove forest Very rough surface with light greenish tones 100 480
52.47
Supratidal mangrove Silt, silty clay Flooding and accumulation Mangrove forest Rough surface with green-bluish tones 28 34
3.73
Outer salt marsh Silt, silty clay Flooding and accumulation Grassland Rough surface with bluish tones 0 67 7.29
Inner salt marsh Silt, silty clay Flooding and accumulation Grassland Slightly rough surface with greenish tones Without field data 79
8.63
Fluvial flood plain Fine sand, silt Flooding, accumulation and marginal erosion
Grassland Rough surface with greenish tone Without field data 24
2.60
Regenerated mangrove
Silt, silty clay Flooding and accumulation Mangrove trees Very rough surface with light tone 2.5
0.28
Degraded mangrove Silt, silty clay Flooding and accumulation _________ Smooth surface with dark tones 100 1.2
0.13
Artificial lake Silt, silty clay Flooding and accumulation Water body Smooth surface with dark tones 365 0.2 0.02
Urban areas Ferruginous silty sand
Hill relief Buildings Very rough surface with bluish tones __________ ____ ____

109
Figure 4- Geomorphologic map of the Bragança coastal plain.
280000 2900X1 300000 3100XJ 320000
_U Ki ometers
-f /
v
&
•'i
5
?IÍ
'
7
r- £
i
n© r
y — + + + +
LEGEND
• Cities /V Road3
Coastal Geology Esiuarine channel Submerso sandbank Sandflat Old estuarine sandbank
IMudflat Ebb-tidal dolta Barrier-beach ridge Coastal dunes Chenier sand ridge
■■ Young mterlidal mangrove Hlntertidal mangrove
Supralidal mangrove Outer salt marçh Inner sall marsh Fluvial flood plair Coastal plateaus Degraded mangrove Regenerated mangrove
_ Artificial lake I I Urban areas
280000 290000 300000 310000 320000
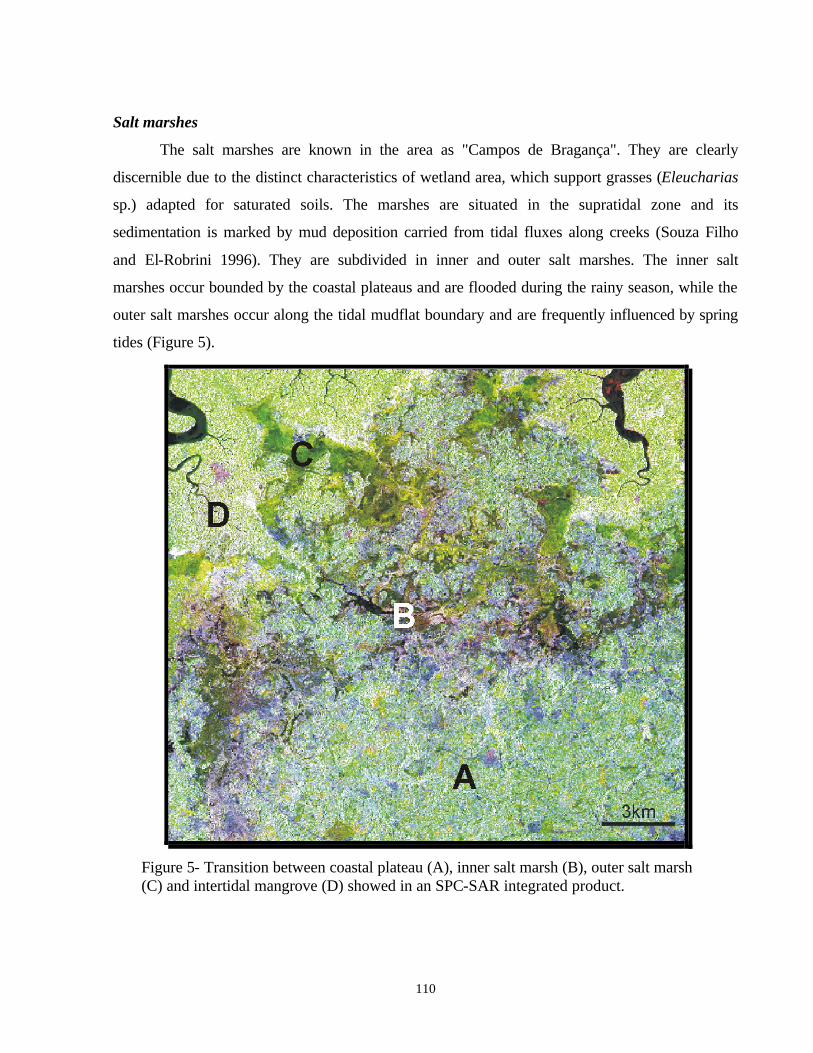
110
Salt marshes
The salt marshes are known in the area as "Campos de Bragança". They are clearly
discernible due to the distinct characteristics of wetland area, which support grasses (Eleucharias
sp.) adapted for saturated soils. The marshes are situated in the supratidal zone and its
sedimentation is marked by mud deposition carried from tidal fluxes along creeks (Souza Filho
and El-Robrini 1996). They are subdivided in inner and outer salt marshes. The inner salt
marshes occur bounded by the coastal plateaus and are flooded during the rainy season, while the
outer salt marshes occur along the tidal mudflat boundary and are frequently influenced by spring
tides (Figure 5).
Figure 5- Transition between coastal plateau (A), inner salt marsh (B), outer salt marsh (C) and intertidal mangrove (D) showed in an SPC-SAR integrated product.
-A"
m.
& -■
« '• L» rs. . S
9Í RhK V nau ■
- '-V7-- Wr-, a?» r.^ri ^4- ■ iV
«5 '.■: ,.■- ■ *
i ;<
.Ü- -a- ■!' v
■S v*;. -.1
. . fh :. ■••: ♦->
V---' ■ n-
'
• : - mmm ':£m

111
Chenier sand ridges
The chenier sand ridges constitute old dune-beach ridges with associated washover fans.
It is easy to identify this feature in the image due to high spectral response of white fine sand
covered by sparse arbustive vegetation and geometric boundary. The cheniers have a well-
defined linear and curved form, whose boundary is the prograding tidal mudflats (Figure 6).
Coastal dunes
Coastal sandy dunes occur in restricted areas along the Ajuruteua Island. From SPC-SAR
integrated product was possible to separate dry sands of vegetated dunes from wet sand of the
beaches (Figure 6). Nowadays, the dunes are migrating landward over the mangrove deposits in
the intertidal mudflats. Transversal sandy dunes are partially or completely vegetated and they
are composed by very fine quartz sand.
Figure 6- SPC-SAR integrated product displayed along the Ajuruteua Island. Observe the chenier sand ridge (A) bounded by intertidal mangroves (B), the coastal dunes (C), the transgressive barrier-beach ridge (D), and ebb-tidal deltas (E) in the tidal channel mouth and spits (F).
(TC!-*
*£
■
«ÍT: 0. í:^
^5
:M
mk
112
Barrier-beach ridges
Barrier- beach ridges extend from low spring tidal level to the dune-beach scarp that
represents the higher spring tidal level in the intertidal beach. This coastal landform was easily
identified from the TM imagery contribution, due to the high spectral response of white sands.
The beaches show a linear and elongated form with curved spits in the longshore sediment
transport direction (Figure 2 and 6). These barrier-beach ridge forms transgressive beaches,
which migrate over intertidal mangroves.
Ebb-tidal delta
Ebb-tidal deltas are the most dynamic coastal landform, whose size and shape are directly
related to the relative influence of waves and tidal currents on barrier-beach ridge (Davis Jr.
1992). Its detection from TM imagery is due to the same spectral attributes observed in sandflats
landform, but it presents peculiar spatial features. As the tidal energy is dominant, ebb deltas
extend seaward in the form of large deltas, and shore normal sand bodies. The ebb delta
morphology presents shallow ebb channels exposed during low spring tide, flanked by sandy bars
(Figure 6).
Tidal sandflats
The tidal sandflats occur between mean tidal and low spring tidal levels along the coast.
Sandy tidal shoals show many ripple and megaripple marks and sand waves exposed at low tide.
Due to these characteristics, the mapping of this coastal landform is a direct response of
sandbanks in shallow waters (Figure 2). In these areas, it is possible to map the prograding zone
by mangrove colonization (Figure 7).
Estuarine channel and submerse sandy tidal banks
Estuarine channel and submerse sandy tidal banks are not usually mapped from remote
sensed data, principally in waters with great concentration of suspended sediments. However, the
selective principal component analyses of six TM bands allowed the discrimination of submerse
coastal features (Figure 2 and 8). Estuarine channel appears a smooth surface and greenish tones
very well defined in the SPC-SAR integrated product. Submerse sandy tidal banks are in reddish
tones, whose surface is well enhanced.

113
Figure 7- Mangrove prograding over tidal sandflat along the Picanço Point from the SPC-SAR integrated product. Note the extension of sandflat exposed during the low tide (A) that is progressively colonized by mangrove vegetation (B). Observe the tidal channels bounding the sandflat (C).
Degraded areas by human activities
Along the Bragança coastal plain there are many human settlements. In these villages are
developed agricultural and fishery activities. Agricultural villages are located in the coastal
plateau and salt marshes areas, while fishery villages are situated along the estuarine margins,
mangroves and beaches. Extensive areas affected by human activities have been mapped with
success from SPC-SAR integrated product, such as roads along mangrove system, deforested
mangrove areas and artificial lakes (Figure 8).
il
-r
m i iV^X m
L*
í

114
Figure 8- Human activities mapped from SPC-SAR integrated product. Deforested mangrove area (A); mangrove-regenerated areas (B); native mangrove forest (C); grasses of salt marsh (D); and artificial lake (E).
Coastal landform boundaries and coastline delineation
Due to great variations of oceanographic processes such as macro-tidal range, wave
directions, longshore drift, river discharge, rainfall, and rapid morphologic coastal changes, the
landform boundaries and coastline delineation are difficult to establish in coastal zone
geomorphologic mapping.
The inner coastal landform boundaries are very well defined in the SPC-SAR integrated
product because the texture, geometry and spectral responses of the targets are different in
intensity and spatial distribution. The inner coastal plain boundary is defined by contact between
coastal plateaus and mangrove or inner salt marsh. The contact between coastal plateaus and
mangrove is marked by abrupt lithologic, vegetation and morphologic changes, which can be
observed in the Figure 2. The contact between coastal plateaus, inner and outer salt marshes and
mangroves shows an environmental succession controlled by topography and tidal inundation
(Figure 5). Other landform boundaries such as cheniers and mangroves, dunes and mangroves,
M W
m V
p.-

115
beaches and mangroves, beaches and tidal sandflats are also easily recognized in the images and
in the field.
The coastline delineation was very well defined along the inner part of estuarine channel
dominated by tidal currents. In this sector, the boundaries between coastal plateaus and water,
and mangrove and water were easily recognized (Figure 2). In the distal sectors of estuarine plain
influenced by waves action and lateral tidal range, the boundary between water and land was
established with more difficult. Due to relative changes in tidal ranges, this boundary was defined
based on dry sand (high spectral response) or intertidal mangrove line. Thus, the coastline
mapped in this work represents the high tide line. As remote sensed images present different
dates (1991 Landsat TM and 1998 RADARSAT-1) the multitemporal coastal changes could be
well mapped from SPC-SAR integrated product (Figure 9).
Figure 9- SPC-SAR integrated product showing coastal changes from 1991 to 1998.
A
■
í: n

116
CONCLUSIONS
Several conclusions have been reached with regard to integrated remote sensing data and
the use of GIS for the purpose of site characterization within a Bragança Coastal Plain.
The geomorphologic mapping of tropical macro-tidal coastal environments is complex
owing to tide, wave, longshore drift, fluvial discharge action and rapid morphologic changes. The
use of SPC-SAR integrated product imagery in the geomorphologic mapping showed it to be an
excellent tool to extract morphologic features of coastal landforms. Many techniques of digital
image processing are available in the literature and they can be used to enhance different targets,
i.e. different coastal landforms with specific spectral response displayed in the space. However,
the integration of RADARSAT and TM data in geological mapping presents, at least, three
relevant aspects:
1) The visual analysis of integrated products is related to the ability of the SAR to enhance
topographic features and differences in the vegetation heights. In addition, the Landsat TM data
provided more information on the land cover types and land use and changes in vegetation
signatures, which indicated the sites of coastal environments transitions; 2) the SAR and TM data
integration involves the geobotany, were coastal vegetation is closely related to coastal
sedimentary environments; and 3) the SAR and TM integration is related to multi-temporal
analysis. When images of different dates are integrated, a multi-temporal attribute is also added
to the product, providing information about coastal accretion or retreat.
The integration of the remote sensed data with a GIS constitute the more general
framework of integrated spatial analysis and makes possible the complete sequence of acquiring,
processing, storing and managing spatial data (Star and Estes 1990). Thus, the ability of GIS to
combine different data sets and simultaneously interpret the spatial relationship between several
coastal environments allows for a more comprehensive interpretation of a geomorphologic
mapping.
The study has revealed that integrated remote sensing data and GIS for geomorphologic
coastal mapping provided valuable, rapid and accurate methods for the study of coastal
landforms. The GIS represents an organizational philosophy to control data towards uses the
information to coastal zone management. Hence, for a coastal zone management program, remote
sensing and GIS technologies have important roles to play in environmental assessment, site

117
characterization, base maps and thematic maps generation and information dissemination for
public consultation, which are all significant factors in this decision-making process.
Acknowledgements
The authors would like to thank the National Institute of Spatial Research (INPE) for
structural support for digital image processing. Thanks are also to Dra. Maria Tereza Prost and
anonymous reviewers for their helpful manuscript comments and Dr. Carlos Albuquerque for a
review of the English text and Afonso Quaresma for his help in many ways. The Landsat TM
images were kindly provided by INPE and Canadian Space Agency (CSA/RSI) under the
GlobeSAR-2 Program provided RADARSAT-1 data.
REFERENCES
Burrough, P.A. 1986. Principles of Geographical Information Systems for Land Resources
Assessment. Oxford, Clarendon Press, 193p.
Ciavola, P.; Mantovani, F.; Simeoni, U.; Tessari, U. 1999. Relation between river dynamic and
coastal changes in Albania: an assessment integrating satellite imagery with historical data.
International Journal of Remote Sensing, 20: 561-584.
Cohen, M.C.L.; Lara, R.J.; Szlafstein, C.F.; Dittmar, T. 2000. Analysis of mangrove inundation
by GIS techniques. In: In: Mangrove 2000: Conference Sustainable Use of Estuaries and
Mangroves. Recife. Full papers. UFRPE/ISME.
Colwell, R.N. 1983. Manual of Remote Sensing. American Society of Photogrammetry, Falls
Cruch, VA.
Cooke, R. U. and Doornkanp, J. C. 1990. Geomorphology in Environmental Management, 2nd
edition (Oxford: Clarendon Press).
Davis Jr., R.A. 1992. Depositional system: An Introduction to Sedimentology and Stratigraphy.
2nd ed., New Jersey, Prentice hall. 604p.
ESRI. 1996. Using ArcView GIS. ERSI, New York, 350p.
Gowda, H.H.; Ganesha Raj, K.; Padmavathy, A.S.; Manikian, B. 1995. Multidate satellite data
for study of dynamic of coastal landforms of Uttara Kannada, South India. International
Journal of Remote Sensing, 16: 2539-2553.

118
Harris, J.R., Bowie, C., Rencz, A.N., Graham, D. 1994. Computer-enhancement techniques for
the integration of remotely sensed, geophysical, and thematic data for the geosciences.
Canadian Journal of Remote Sensing 20: 210-221.
Harris, J.R.; Murray, R.; Hirose, T. 1990. IHS transform for the integration of radar imagery and
other remotely sensed data. Photogrammetry Engineering & Remote Sensing, 56: 1631-
1341.
Herz, R. 1991. Manguezais do Brasil. IOUSP/CIRM, São Paulo, Brazil.
Jones, A. R. 1986. An evaluation of satellite thematic mapper imagery for geomorphological
mapping in arid and semi-arid environment. In: Gardiner, V. (ed.) International
Geomorphology. Chichester, Wiley, p. 343-357.
Kushwaha, S.P.S., Dwivedi, R.S. and Rao, B.R.M. 2000. Evaluating of various digital image
processing techniques for detection of coastal wetlands using ERS-1 SAR data. International
Journal of Remote Sensing, 21: 565-579.
Lewis, A.J.; Henderson, F.M.; Holcomb, D.W. 1998. Radar fundamentals: the geoscience
perspective. In: Henderson, F.M. and Lewis, A.J. (eds.), Principles & Applications of
Imaging Radar. Manual of Remote Sensing. 3rd edn. New York, John Willey, p. 131-180.
Lopes, A., Touzi, R. and Nezry, E. 1990. Adaptive speckle filters and scene heterogeneity. IEEE
Transaction on Geoscience and Remote Sensing, 28: 992-1000.
Lyon, J.G. and Adking, K.F. 1995. Use of a GIS for wetlands identification, The St. Clair Flats,
Michigan. In: Lyon, G.J. and McCarthy, J. (eds.). Wetlands and environmental applications
of GIS. New York, Lewis Publishers, p. 49-60.
McGregor, R.G.; Bruton, P.; Singhroy, V.H; Brown, A. 1999. An application of remote sensing
and GIS towards geological site characterization of a Canadian Shield Terrain. Canadian
Journal of Remote Sensing, 25: 245-257.
Paradella, W.R., Bignelli, P.A., Veneziani, P, Pietsch, R.W. and Toutin, T. 1997a. Airborne and
spaceborne synthetic aperture radar (SAR) integration with Landsat TM and gamma ray
spectrometry for geological mapping in a tropical rain forest environment, the Carajás
Mineral Province, Brazil. International Journal of Remote Sensing, 18: 1483-1501.
Paradella, W. R.; Krug, T.; Landry, R.; Pietsch, R. W. 1997b. GLOBESAR-2: O Programa de
Avaliação de Dados do RADARSAT-1 nas Geociências Revista Brasileira de Geociências,
27: 403-406.

119
Paradella, W.R., Santos, A.R., Dall' Agnol, R., Pietsch, R.W. and Sant'ana, M.V. 1998. A
geological investigation based on airborne (SAREX) and spaceborne (RADARSAT-1) SAR
integrated products in the Central Serra dos Carajás Granite Area, Brazil. Canadian Journal
of Remote Sensing, 24: 376-392.
Paradella, W. R.; Santos, A. R., Venezini, P., Morais, M. C. 1999. Avaliação de dados do
RADARSAT-1 em Aplicação Geológica na Província Mineral de Carajás, Estado do Pará.
Final Report: FAPESP Project # 10946-4/1997, INPE-São José dos Campos, Brazil.
PCI, 1999. EASI-PACE User’s Manual, version 6.3, PCI Enterprises, Ontario, Canada.
Pietsch, R.W. 1993. TFI SAR Processing Report. Internal Report, CCRS/Dendron Surveying,
Ottawa, Canada.
Prost, M. T. 1997. La mangrove de front de mer en Guyane: ses transformations sous l'influence
du système de dispersion Amazonien et son suivi par télédétection. In: Kjerfve, B.; Lacerda,
L. D.; Diop, E. H. S. (ed.). Mangrove ecosystem studies in Latin America and Africa. Paris,
UNESCO, p. 111-126.
Ramsey III, E. W.; Nelson, G. A.; Sapkota, S. K. 1998. Classifying coastal resources by
integrating optical and radar imagery and color infrared photography. Mangroves and Salt
Marshes, 2: 109-119.
Rheault, M.; Simard, R.; Garneau, C.; Slaney, V.R. 1991. SAR Landsat TM-geophysical data
integration utility of value-added products in geological esploration. Canadian Journal of
Remote Sensing, 17: 185-190.
Rudant, J.P.; Baltzer, F.; Deroin, J.P.; lointier, M.; Maitre, H.; Mouglin, E.; Pénicand, C.; Prost,
M.T. 1996. Apport des images radar satellitaires ERS-1 et JERS-1 dans le domaine de la
cartographie generale et thématique en contexte tropical humide: exemples en Guyane
française et regions limitrophes. Société Française de Photogrammétrie et Télédetection,
142: 15-33.
Singhroy, V. 1995. SAR integrated techniques for geoharzard assessment. Advanced Space
Research, 15: 1167-1178.
Singhroy, V. 1996. Interpretation of SAR images for coastal zone mapping in Guyana. Canadian
Journal of Remote Sensing, 22: 317-328.

120
Souza Filho, P.W.M. 1995. Influência das Variações do Nível do Mar na Morfoestratigrafia da
Planície Costeira Bragantina (NE do Pará) durante o Holoceno. Centro de Geociências,
Universidade Federal do Pará. Master Dissertation, 123p.
Souza Filho, P. W. M. 2000. Tectonic control on the coastal zone geomorphology of the
northeastern Pará State. Revista Brasileira de Geociências, 30: 523-526.
Souza Filho, P.W.M. and El-Robrini, M. 1996. Morfologia, processos de sedimentação e
litofácies dos ambientes morfosedimentares da Planície Costeira Bragantina - Nordeste do
Pará (Brasil). Geonomos, 4: 1-16.
Souza Filho, P.W.M. and El-Robrini, M. 1998. As variações do nível do mar e a estratigrafia de
sequências da Planície Costeira Bragantina - Nordeste do Pará, Brasil. Boletim do Museu
Paraense Emílio Goeldi, Série Ciências da Terra, 10: 1-34.
Souza Filho, P. W. M. and El-Robrini, M. 2000. Coastal Zone Geomorphology of the Bragança
Area, Northeast of Amazon Region, Brazil. Revista Brasileira de Geociências 30, 518-522.
Star, J. and Estes, J. 1990. Geographic information systems: an introduction. New Jersey,
Prentice Hall, 303p.
Summerfield, M.A. 1991. Global geomorphology: an introduction to the study of landforms.
New York, Longman. 537p.
Toutin, T. 1995. Multisource data integration with an integrated and unified geometric modeling.
In: Askne, J. (ed.). Sensors and environmental applications of remote sensing. Rotterdam,
Balkema. p. 163-174.
Verstappen, H.T. and Van Zuidam, R.A. 1991. The ITC system of geomorphologic survey.
Netherlands, ITC Publication nº 10, 89p.
Yang, X.; Damen, M. C. J.; Van Zuidam, R. A. 1999. Use of thematic mapper imagery with
geographic information system for geomorphologic mapping in a large deltaic lowland
environment. International Journal of Remote Sensing, 20(4): 659-681.
121
3.4. EVALUATION OF LANDSAT THEMATIC MAPPER AND RADARSAT-1 DATA
TO GEOMORPHOLOGICAL MAPPING ON A MANGROVE COAST,
BRAGANÇA, PARÁ, BRAZILIAN AMAZON REGION1
ABSTRACT
Orbital remote sensing data were evaluated for geological mapping on a Mangrove Coast, along
the Bragança Region, in the Pará State, Brazilian Amazon Region. This study aimed at a detailed
reconnaissance of the coastal environments (wetlands - mangroves and salt marshes, sandflats,
chenier sand ridges, coastal sand dunes, barrier-beach ridges and ebb-tidal delta) and the coastal
features (plateaus and coastal plain boundary, depositional and erosional features, coastline form,
suspended sediments and submerse sandy banks) based on Landsat-5 Thematic Mapper and
RADARSAT-1 Fine-mode data. In addition, the effectiveness of various image enhancement
techniques was also evaluated in the context of coastal depositional systems detection. With
Landsat TM data, it was possible to detect distinct coastal environments based on the spectral
responses controlled by physical-chemical composition of water, vegetation and sediments. On
the other hand, the RADARSAT-1 image has provided complementary information related to the
electric-geometrical characteristics of the environment. Finally, multisensor data fusion based on
the optical and SAR images has allowed to characterize geobotanical controls due to changes in
the vegetation cover, closely related to variations in flooding frequency and sedimentology of the
area. An important aspect involving the optical-SAR data fusion is related to the multi-temporal
information providing additional insights about the coastal dynamic. The result of the
investigation has shown the importance of using orbital remote sensing integrated products as a
powerful tool for coastal geomorphological mapping in the Amazon Region, particularly in the
wetland environments of mangrove coasts.
Keywords: Brazilian Amazon Region, coastal mapping, Landsat TM, mangrove, multi-sensor
data integration, RADARSAT-1, salt marsh.
1 Paper submitted to Wetlands Ecology and Management

122
INTRODUCTION
Wetland low-lying areas that are flooded at a sufficient frequency to support vegetation
adapted for life in saturated soils, include mangroves forest and salt marshes (Clarck, 1996).
Coastal wetlands exhibit extreme variations in area extent, temporal duration, and spatial
complexity (Ramsey III et al., 1998). The transition of continental and coastal environments is
marked by a water table near or above the surface, hydric soil and hydrophytic vegetation. The
development of monitoring tools for this kind of complex environment is necessary, mainly in the
discrimination of wetland types and in the identification of seasonal alterations caused by natural
and anthropogenic processes.
In general, three approaches have been used to extract geological and geomorphological
information from remote sensing data: spectral, photo-geological and digital integration methods
(Singhroy, 1992). The spectral approach involves differences in target reflectance, which is used
to multispectral classification schemes. The photo-geological technique uses topographic
features, textures, tones and drainage patterns to delineate geological, geomorphological and
lithologic units. Finally, integration methods use remote sensing data integration techniques as a
complement to the spectral and photo-geologic interpretation. Therefore, the synoptic view of the
coastal wetland environments from space has been used for accurate mapping of coastal wetland
systems. Distinct sensors exploring the optical spectra, such as the Landsat TM, have a long
history of successful mapping of wetland types through different techniques of digital image
processing (Ramsey III and Laine, 1997; Ramsey III et al., 1998; Smith et al., 1998). One of the
major drawbacks related to the usage of spaceborne optical data is the presence of perennial
clouds in the equatorial coastal zone, particularly during the wet season. Synthetic Aperture
Radar (SAR) technology has advanced during the last 10 years with the advent of global
observation system based on imaging radar (ERS-1, JERS-1, ERS-2, and RADARSAT-1). SAR
could extend the capability of optical sensor for mapping of coastal zone wetlands, due to its all-
weather imaging capability, since microwaves can penetrate cloud, and to a high degree, rain.
Furthermore, imaging radar also operates independently of sun illumination. These factors have
opened a new dimension in the use of spaceborne sensors for coastal zone applications,
particularly in the assessment and management of the natural resources during the wet season
(Lecont and Pultz, 1991; Rudant et al., 1996; Adams et al., 1998; Kushwaha et al., 2000). On the

123
other hand, data integration using the concept of multisensor synergy is becoming a common
trend in applications in geosciences (Harris et al., 1994; Singhroy, 1996; Wald, 1998).
Taking into account these aspects, this investigation had two main objectives: (1) a detailed
reconnaissance of a coastal wetland environment located in the Northern part of Brazil, based on
spaceborne optical and SAR data, and (2) to evaluate the effectiveness of image enhancement and
data integration techniques for mapping and characterization of this complex tropical
environment.
STUDY SITE
The Bragança Region, located on the northeastern Brazilian Amazon (Figure 1) is
influenced by a macrotidal coastal environments. The area, part of the Pará-Maranhão Coast,
represents one of the larger mangrove ecosystems of the world with almost 6,000 km2 (Herz,
1991). The Holocene sedimentary evolution of the Bragança coastal plain began at 5,100 years
B.P, when the sea level reached the maximum relative level (Souza Filho and El-Robrini, 1998;
Behling et al. 1999). From 5,100 years B.P to the moment, the sedimentary model is a result of
coastline progradation with development of a mangrove system, intercalated to short-term
retrogradation events responsible for coastal erosion and deposition of old and recent barrier
dune-beach ridges. These features mark old and recent coastlines that interrupted the mangrove
progradation.
Along the Mangrove Coast, the major landforms observed are salt marshes, tidal sandflats,
chenier sandy ridges, coastal sandy dunes, barrier-beach ridges and ebb-tidal deltas (Figure 1)
(Souza Filho and El-Robrini, 2000). The distribution of tidal flats is mainly controlled by
topography. Therefore, based on the relative altimetry and vegetation height, the tidal flats were
subdivided in supratidal mangrove and intertidal mangrove. The supratidal mangroves are
topographically higher with smaller trees and can be reached by water only during the spring
tides, while the intertidal mangroves are lower in elevation with progradacional and erosional
areas.
According to Souza Filho (2000), the coastal zone geomorphology of the northeast of the
Pará State presents a tectonic control. The study area occurs along the Bragança-Viseu coastal
basin, with Quaternary deposits controlled by the geometry of the basin and its paleo-topography.
This coastal plain constitutes a macrotidal (>4 m) depositional system, developed in a hot and

124
humid equatorial climate, with dry and wet well-defined seasons and an annual precipitation
averaging 2,500 mm, while relative humidity varies from 80 up to 91% (Martorano et al., 1993).
REMOTE SENSING DATASET
The investigation was based on the C-HH band RADARSAT-1 Fine Beam 1, (descending
orbit) with acquisition occurring in 1998, under the GlobeSAR-2 Program. Details of this
program in Brazil can be found in Paradella et al. (1997a). Spaceborne optical data were
represented by Landsat TM data (path 222, row 61) acquired in 1985 and 1991. Table 1 provides
details of the remotely sensed data used in the research.
Figure 1- Location of the study area and coastal zone geomorphologic map (Modified from Souza Filho and El-Robrini 1998).
C-TM". 18 "
£ N ^ Canda
I A Maiflu Bay Aju.uleua * *. Ib. \* * it ^LBeach
.. f 'i' •*• 'à ^ Taperaçu -i- -i * »'í$. ( \ * y* J > . Estuary \ ^ •* '^A^. :
:-»**•* fl \ .f;Lfv>,. f ' i 4 v» * » * - ^ st J.' 4 4 j. ^ a 4 4 Caeté
j * .• , «t- ♦ -■ * * , ^-.Vní\li k .li"*')1 * k 4.Estuary • * i^EíUBÍ*^ ^ ir t: ^», r. V * v * * * %■[-:. *
'•-4 meK* sl.^ 1 ', ^ , « A«=i V
Ia * * «Í-Jt1'* ' x 4 *-w'14 ' 4 •
^ay ,1'rana . ^ Ajuruleua
a a Beadi ^ Taperaçu * * . *• ('
Estuary \ .+ a
L ' -f L®i * * -^•'f <
AM* PA
(Anuam «vèi ._ mouih
| Coastal platoaus
Coastal plain
^ '/ \ j; . i] Supratldal mudflats .<i'i A * ' ■'""S
' * ■' ^ ^ u. UI Intertidal mudflats i.y:.- ^ R Inner sall marshes
^ JÊKkt* x ^ x x ; - ^ // í^JS-^fcíL*. a ^ i ■* 3 0u,er sa^ marshes
-r^yi-z-jfcü ^Rl ■ • Tmal sandflals ^ jT'/ | Chenler
■ dunes
Barnor-beach ridges
ÉBA:* •' m ^ 1» f . í :» .•_ i A ^ U . / 4" - A
» * * JÊK$ X X X / ' .' • — ■^ -3 çS '
Bragança Estuarine plain
|| Alluvial plain 01" 04 17

125
Table 1- Characteristics of the remotely sensed data.
Platform Sensor Acquisition Date
Angle of Incidence
Spatial Resolution (m)
Pixel Size (m)
Number of Looks
Image Format
Radarsat-1 Fine Beam Mode 1
September 08, 1998
37-40º 9,1 x 8,4 6,25x6,25 1x1 16-bits Path Image
Landsat-5 TM Bands 1,2,3,4,5,7
December 31, 1991
_____ 30 x 30 30 x 30 _____ 8-bits
Landsat-5 TM Bands 1,2,3,4,5,7
August 24, 1985
_____ 30 x 30 30 x 30 _____ 8-bits
METHODOLOGICAL APPROACH
The methodology essentially has involved: (1) the analysis of the RADASAT-1 Fine and
the Landsat TM data through digital image processing techniques, (2) multisensor data
integration, and (3) the visual interpretation of the enhanced products for detection and
characterization of the coastal wetland environments. The digital analysis was carried out with
PCI software (PCI 1999). Both data-set were geometrically corrected to a common UTM format,
thus ensuring data standardization on a spatial sense, and allowing data manipulation and
comparison on a pixel to pixel basis (Toutin, 1995).
Landsat TM-5 imagery
The pre-processing techniques applied to the TM data have involved radiometric and
geometric corrections. The radiometric correction was related to the attenuation of atmospheric
effects based on the minimum histogram pixel (Chavez, 1988). A rigorous geometric correction
based on an ortho-rectification scheme was applied to the TM bands in order to assure correction
for terrain distortions (Toutin, 1995). Image enhancements were also applied based on linear and
equalization stretches. A feature selection approach based on the optimum index factor- OIF
(Chavez et al., 1982) was also used to select triplets of the TM bands for color composites. The
RGB color composite based on TM4, TM5 and TM3 was selected based on this statistical
criterion and chosen for visual interpretation.
RADARSAT-1 imagery
Antenna pattern correction (APC) and speckle suppression filtering for the Fine Mode
image was applied as radiometric corrections. The APC was based on the procedures designed by

126
Pietch (1993). An Enhanced-Frost Filter was applied to reduce speckle effects (Lopes et al.,
1990) during the ortho-rectification process. Based on the statistics of the ortho-rectification for
the TM and the SAR data (RMS accuracies around cell resolution for each data) and in order to
keep a balance of the geometric and radiometric integrities in the data fusion, a 30-meters pixel
size was selected as common pixel size for the data integration.
Multisensor integration (RADARSAT with TM)
IHS (Intensity, Hue and Saturation) transform combined with enhanced techniques
(linear, decorrelation stretches, etc.) have been commonly used for remote sensing data
integration (Harris et al., 1994; Paradella et al., 1997b; Paradella et al., 1998; Pohl, 1998, among
others). A new approach, the "SPC-SAR (Selective Principal Component) Integrated Product", as
proposed originally by Paradella et al. (1999) for the integration of RADARSAT and TM data in
the geological mapping of the Carajás Mineral Province (Amazon Region), was also evaluated.
Basically, a Principal Component Transform is independently applied to two distinct sets of the
TM bands (TM 1, 2 and 3; and 5 and 7). The two first eigen channels obtained (PC1 of TM 1, 2,
3 and PC1 of TM 5 and 7), retained the maximum variance of the visible and the mid-infrared
parts of the TM spectrum (Table 2). In addition, TM 4 band was used as one of the three input
channels in the RGB/IHS transform. In order to maximize the variance of these channels, a
decorrelation stretch can be also applied to the channels, previously to the RGB/IHS transform. A
synthetic image (image with a constant value) with a digital number 60 was used as the saturation
channel in the reverse IHS-RGB transform.
Visual analysis
The visual analysis of the digitally enhanced products were carried out using standard keys
such as tone/color, texture, pattern, form, size, geometry, drainage and others. The TM bands
provided the spectral attributes of the landforms; while the geometric and textural characteristics
of the terrain were highlighted through the SAR backscattered responses. The application of these
techniques has provided an integrated, detailed and more accurate geomorphological
interpretation map of coastal wetland areas.

127
RESULTS AND DISCUSSIONS
The coastal geomorphology classification for the study area was mainly based on
landforms, sedimentary and stratigraphic patterns, and dominates processes in action
(evolutionary processes) (Souza Filho and El-Robrini, 1996). In addition, factors such as
geomorphological processes, land use and land cover, were also considered. Six coastal
sedimentary environments were mapped: tidal flats (mangroves and sandflats), salt marshes,
chenier sand ridges, coastal sand dunes, barrier-beach ridges and ebb-tidal delta (Souza Filho and
El-Robrini, 2000).
Landsat TM
In the color composite of the Landsat TM images acquired on August 1985 (Figure 2). The
intertidal mangrove is depicted as reddish hue, with strong infrared spectral response caused by
the contribution of the dense mangrove forest in the TM 4 band (Figure 2a). The supratidal
mangroves appear as green-reddish colors due to mixed response of muddy sediments and
mangrove trees (Figure 2b). Field information has indicated that Rhizophora sp. and Avicennia
sp. are the dominant species commonly found along this coast.
The salt marshes are situated in the supratidal zone, with sedimentation marked by mud
deposition carried from tidal fluxes along the creeks (Souza Filho and El-Robrini, 1996). They
are subdivided in inner and outer salt marshes. TM image shows the inner salt marsh in dark
tones in TM bands 3, 4 and 5 at the end of the rainy season, in response to the spectral behavior
of clean water (Figure 2c). The outer salt marsh marks the transitional zone between the coastal
plateaus and the mangrove system, and shows green-reddish colors due to the mixed spectral
response of muddy sediments and grasses (Figure 2d). Therefore, it presents the same spectral
response of the supratidal mangrove.
The chenier sand ridges constitute old dune-beach ridges with associated washover fans.
They present light-bluish colors in response to the spectral reflectance of dry white fine sand
covered by sparse vegetation in TM 3 and 4 (Figure 2e). The cheniers have a well-characterized
geometry given by linear and curved forms with boundaries marked by prograding tidal mudflats.
The chenier's appearances are typical in the images. They are discernible from recent beaches by
form and spatial distributions rather than by color attributes.

128
Figure 2- Landsat TM false color composite (4R5G3B) from the Bragança Coastal Plain. The letters are discussed in the text (a = intertidal mangrove, b = supratidal mangrove, c = inner salt marsh, d = outer salt marsh, e = chenier sand ridge, f = barrier-dune beach ridge, g = ebb-tidal delta, h = tidal sandflat).
Barrier-dune-beach ridges (Figure 2f), ebb-tidal deltas (Figure 2g) and tidal sandflats
(Figure 2h) are associated with white colors due to the high spectral response in all three TM
bands caused by the presence of dry fine white sandy deposits in dunes and intertidal beaches.
Coastal features, such as coastal plateaus and coastal plain boundary, prograding depositional
features, suspended sediments and submerse sandy banks, are well discernible in the images due
to the spectral response of the these targets.
30 280000m E 320000" E.
u; ro
n CTl
90 90 ck;
£ v
y
w
89 89
Coasta Plateau N
co V cc
Braganç 4 '
m CO •A -A CO y !—^ r ^» 280000ra E. 23 30 31 320000ir E

129
RADARSAT-1
The interpretation of the RADARSAT Fine image in the mangrove environment has
indicated that intertidal mangrove forest (trees with a height around 20m) are related to
microwave responses controlled, probably, by volumetric scattering and double-bounce
mechanism. This particular condition is responsible for a very rough texture and light-gray tone
allowing the discrimination of this coastal environment (Figure 3a). The smooth, flat, high
dielectric constant surface of the water increases the amount of backscattered radiation toward the
radar, due to tree-ground double-bounce interaction. The supratidal mangrove presents a similar
behavior of the intertidal mangrove, however the mangrove trees are smaller and spaced,
reducing the double-bounce effect. Hence, the target appears less rough and with dark-grayish
tone Figure 3b).
The RADARSAT-1 Fine image clearly outlines the salt marshes. The inner salt marsh,
completely flooded in the rainy season, presents a specular scattering behavior when the
microwave radiation reaches the water table on the surface. Thus, this target appears as very dark
tone in the image (Figure 3c). However, for the sectors where the inner salt is covered by grasses,
the radiation interaction produces a slightly rougher surface with lighter gray tones Figure 3d).
Finally, for the outer salt marsh a similar scattering mechanism related to the inner vegetated salt
marsh is characterized, but its geometry and spatial distribution are typical (Figure 3e).
From the RADARSAT-1 Fine image, the chenier sand ridges and dunes (Figure 3f) present
a smooth surface and dark tones. These SAR image characteristics appear to be controlled by
presence of dry sandy sediments of old dunes. This morph-sedimentary characteristic is
responsible for absorption of the microwave radiation (Souza Filho and Paradella, submitted).
Barrier-beach ridges and ebb-tidal deltas are constituted by wet fine sandy deposits and
present a flat morphology. In response to sedimentologic and morphologic characteristics, these
coastal features in RADASAT image present a smooth surface and very dark tones (Figure 3),
due to specular scattering of the microwave radiation. As a consequence, the mapping of these
coastal features is difficult. On the other hand, other coastal features, e.g. coastal plain and
estuaries boundary, erosional features and coastline forms, are very well discriminated based on
the SAR data.

130
Figure 3- RADARSAT Fine Bean Mode (F1) from the Bragança Coastal Plain. The letters are discussed in the text. (a = intertidal mangrove, b = supratidal mangrove, c = inner salt marsh, d = outer salt marsh, e = chenier sand ridge, f = barrier-dune beach ridge).
RADARSAT-1 with TM integrated product
The backscattered microwave energy from the Earth's surface measured by a SAR system
provides information the geometry (macro and micro-topography) and electrical properties
(particularly related to the water content) (Lewis et al., 1998; Raney, 1998). On the other hand,
optical sensors provide information controlled by physical-chemical properties of the targets
(Colwell, 1983). Thus, the synergism of SAR and optical data through integrated products
28000C»7n E. 3 2 0000rr E
í N
O km A
r
,4
28nnoaii« p. 29 30 31 320D00m R

131
improve the detection and the characterization of coastal environments and features, mainly in
tropical coastal environments (Figure 4).
The first relevant aspect in the visual analysis of integrated products is related to the ability
of the SAR to enhance topographic features and differences in the vegetation heights. The
mangrove coast in the Bragança Region is characterized by a low and flat terrain, segmented by
estuaries and tidal channels and colonized by different vegetation types, whose structures varies
from forest to natural fields. Variations in the vegetation height are expressed by distinct textural
patterns (mesoscale roughness), while variations in the vegetation structures control the
gradations in tone (microscale roughness) in the SAR data. Thus, mangrove forests are easily
discriminated from marsh grasses. In addition, this discrimination is favoured by the presence of
distinct moisture content in the mangrove forests. It is also important to mention that Landsat
TM data provides the colors in the integrated products, with hue variations closely related to the
spectral responses of the targets. The product's interpretation is much more accurate and easier to
be done.
The second relevant aspect in the SAR and TM data fusion involves the geobotany
(Paradella and Bruce, 1990; Paradella et al., 1994; Paradella et al., 1998). Spectral TM response
can be related to topographic differences (elevation) closely related to variations in
sedimentology, water content and geobotanical controls. Intertidal mangrove forest is related to
wet muddy sediments flooded twice per day by tides and is represented by a greenish pattern and
rough texture (Figure 4a). The supratidal mangrove forest is related to muddy sediments flooded
only during high spring tides and are associated with more spaced mangrove forest with bluish
colors (Figure 4b). The vegetated inner salt marsh is constituted by wet muddy sediment, densely
covered by grasses showing a dark green colors (Figure 4c); while outer salt marshes are covered
by more spaced grasses with muddy exposed sediments, responsible for the observed bluish
patterns (Figure 4d). Cheniers sand ridges, topographically higher, dry and covered by arbustive
vegetation, are related to reddish tones (Figure 4e). Barrier-dune-beach ridges (Figure 4f), ebb-
tidal deltas (Figure 4g) tidal sandflats (Figure 4h) and submerse sandy banks (Figure 4i) and tidal
estuarine channel (Figure 4j) almost not perceptible in the SAR data, in response to their flat
morphology, are mapped in the scenes due to the spectral TM responses (hue), showing a reddish
colors. The other coastal features previously mentioned in the TM and SAR scenes are also well
discriminated in the integrated products.

132
Figure 4- RADARSAT (F1) and Landsat TM (selective principal component) integrated product from the Bragança Coastal Plain. The letters are discussed in the text (a = intertidal mangrove, b = supratidal mangrove, c = inner salt marsh, d = outer salt marsh, e = chenier sand ridge, f = barrier-dune beach ridge, g = ebb-tidal delta, h = tidal sandflat, i = submerse sandy bank, j = tidal estuarine channel, k = coastal change).
Finally, the third relevant aspect involving the SAR/TM fusion is related to multi-temporal
analysis. When images of different dates are integrated, a multi-temporal attribute is also added
to the product, providing information about coastal accretion or retreating. This is a fundamental
aspect to be addressed when dealing with coastal dynamic studies (Figure 4k). Thus, the
relationships of hue coupled with morphological changes of the terrain on different dates will
29 30 280000ni E.
UD
N
A Í '
M
C\1 CTl
' ~
b
m
s. 91
a
i d 9 0 90
o./.;. '■ p: • *-
.. i/*- r*
o-'; £ m : Wj».
•T . v-c í «ttíSLã ^ '■* "r..
r
/ Coastal Plateaú ■ S
89
:;r
p '■'-fmí 3?
:í'.. «IM- ^Kk-íii ^ ■ ,-. ;>áP7 ' ?u .t; . rJsá • - .u' - >
1 V. CO
T Bragança.:
> ■■City x-
N CO •V
r r -■ «i CO MM CO
ZSOOOOra E. 30 31 320000ni E
320000ni E.

133
provide a more accurate geomorphological interpretation than that based solely on the individual
SAR or TM scenes.
Based on research results, assessment of the different remote sensing data applied to coastal
environments study is summarized in Table 2.
Table 2- Remote sensing product evaluation.
Image interpretation results Recognizing level Coastal environments and features
SAR
TM
SARxTM
SAR
TM
SARxTM
Intertidal mangrove
Very rough surface, light tones, covered by mangrove forest
Enhanced by the TM data due to the vegetation cover
Very rough surface with light greenish
tones
M
G
G
Supratidal mangrove
Rough surface, gray tones, covered by spaced
mangrove forest
Enhanced by the TM data due to the vegetation cover and soil
exposed.
Rough surface with green-bluish tones
M
G
G
Inner salt marsh
Slightly rough surface, medium tones, covered
by grasses
Recognized on TM as dark tones due to wet exposed
sediments
Slightly rough surface with greenish tones
G
G
G
Outer salt marsh
Slightly rough surface, medium tones, covered
by grasses
Recognized on TM as light tones due to spectral response of dry sediments and grasses
Rough surface with bluish tones
M
G
G
Water bodies in salt marshes
Smooth surface, dark tones
Recognized on TM as dark tones due to spectral response
of clean waters
Smooth surface with dark tones
G
G
G
Chenier sand ridges
Linear features, rough surface, dark tones, covered by arbustive
vegetation
Enhanced by the TM data due to white sand exposition
Linear features, rough surface with reddish
tones
G
G
G
Barrier dune-beach ridges
Linear features, smooth surface, dark tones
Enhanced by the TM data due to white sand exposition
Linear features, smooth surface with
reddish tones
M
G
G
Ebb-tidal deltas
Smooth surface, dark tones
Enhanced by the TM data due to white wet sand exposition
Smooth surface with reddish tones
P
G
G
Tidal sandflats Smooth surface, dark tones
Enhanced by the TM data due to white wet sand exposition
Smooth surface with reddish tones
P
G
G
Plateaus and coastal plain
boundary
----------
----------
----------
M
G
G
Coastal plain and water boundaries
----------
----------
----------
G
M
G
Erosional landforms
----------
----------
----------
G M G
Depositional landforms
----------
----------
----------
G G G
Coastline forms
G M G
G = good M = moderate P = poor

134
CONCLUSIONS
(1) This research has demonstrated the importance of using digital image processing for
geomorphological mapping of mangrove coast based on orbital SAR and optical remote
sensing.
(2) The geometrical correction through ortho-retifications was a fundamental step in the digital
processing. It assures that optical and SAR data can be integrated under a more consistent
and robust modeling.
(3) The SPC Integrated Product has shown to be a powerful toll for the integration of
RADARSAT with Landsat TM with the best performance in the discrimination of classes.
(4) The research has also demonstrated the importance of the usage of orbital remote sensing data
in the coastal environment studies, mainly in the wetland areas. The TM sensor has
contributed with spectral response to enhance the chemical characteristics of the materials,
while SAR data was responsible by enhancement of distinct coastal vegetation height,
geometry and water contents. In addition, the digital fusion of SAR with TM also provided a
synoptic view of the area which favors planning for field campaigns and the integration of
previous disperse information.
(5) The Mangrove Coast along the Northern Brazil is a large area, poorly mapped. The results of
this investigation offer a real possibility of using spaceborne optical and SAR data for coastal
geomorphological mapping and monitoring purposes. This is first step aiming an
environmental protection program of this complex but extremely fragile moist tropics
ecosystem.
Acknowledgements
This work has been carried out as part of the doctorate thesis of the first author, within the
project Applications of Optical and SAR Orbital Data in the Coastal Environment
Morphodynamic Study, Bragança Coastal Plain, Northeast of Pará, Brazil founded by
GlobeSAR-2 Program that was supported by Canadian Centre for Remote Sensing (CCRS),
Canadian International Development Agency (CIDA), International Development Research
Centre (IDRC), Canadian Space Agency (CSA) and National Institute for Space Research
(INPE). We are thankful for the reviewers for their helpful comments on the manuscript.

135
REFERENCES
Adams, S., Wiebe, J., Colins, M. and Pietroniro, A. 1998. Radarsat flood mapping the Peace-
Athabasca Delta, Canada. Canadian Journal of Remote Sensing 24: 69-79.
Behling, H., Cohen, M.C.L, Lara, R,J. 1999. Holocene mangrove dynamics of the Bragança
Region on Northeastern Pará, Brazil. In: International Conference of Madam Project 1999.
pp. 10-11. CNPq/BMBF, Belém, Brazil.
Chavez, P.S., Berlin, G.L. and Sowers, L.B. 1982. Statistical method for selecting Landsat MSS
ratios. Journal of Applied Photographic engineering 8: 23-30.
Chavez, P.S. 1988. An improved dark-object subtraction technique for atmospheric scattering
correction of multispectral data. Remote Sensing of Environment 24: 450-479.
Clarck, J.R. 1996. Coastal Zone Management Handbook. Lewis Publishers, New York, USA.
Colwell, R.N. 1983. Manual of Remote Sensing. American Society of Photogrammetry, Falls
Cruch, VA.
Harris, J.R., Bowie, C., Rencz, A.N., Graham, D. 1994. Computer-enhancement techniques for
the integration of remotely sensed, geophysical, and thematic data for the geosciences.
Canadian Journal of Remote Sensing 20: 210-221.
Herz, R. 1991. Manguezais do Brasil. IOUSP/CIRM, São Paulo, Brazil.
Kushwaha, S.P.S., Dwivedi, R.S. and Rao, B.R.M. 2000. Evaluating of various digital image
processing techniques for detection of coastal wetlands using ERS-1 SAR data. International
Journal of Remote Sensing 21: 565-579.
Lecont, R. and Pultz, T.J. 1991. Evaluation of the potential of Radarsat for flood mapping using
simulated satellite SAR imagery. Canadian Journal of Remote Sensing 17: 241-249.
Lewis, A.J.; Henderson, F.; Holcomb, D.W. 1998. Radar fundamentals: the geoscience
perspective. In: Henderson, F.M. and Lewis, A.J. (eds.), Principles & Applications of
Imaging Radar. Manual of Remote Sensing. 3rd edn. pp. 131-180. John Willey & Sons, New
York, USA.
Lopes, A., Touzi, R. and Nezry, E. 1990. Adaptive speckle filters and scene heterogeneity. IEEE
Transaction on Geoscience and Remote Sensing 28: 992-1000.
Martorano, L.G., Perreira, L.C., Cézar, E.G.M., Pereira, I.C.B. 1993. Estudos Climáticos do
Estado do Pará, Classificação Climática (KÓPPEN) e Deficiência Hídrica
(THORNTHWHITE, MATHER). SUDAM/ EMBRAPA, Belém, Brasil.

136
Paradella, W.R. and Bruce, W.D. 1990. Geobotânica por sensores remotos: uma revisão. Revista
Brasileira de Geociêncais 19: 425-435.
Paradella, W.R., Bignelli, P.A., Veneziani, P, Pietsch, R.W. and Toutin, T. 1997b. Airborne and
spaceborne synthetic aperture radar (SAR) integration with Landsat TM and gamma ray
spectrometry for geomorphological mapping in a tropical rain forest environment, the
Carajás Mineral Province, Brazil. International Journal of Remote Sensing 18: 1483-1501.
Paradella, W. R., Krug, T. , Laundry, R., Pietsch, R. W. 1997a. GLOBESAR-2: O Programa de
Avaliação de Dados do RADARSAT-1 nas Geociências. Revista Brasileira de Geociêncais
27 (4): 403-406.
Paradella, W.R., Santos, A.R., Dall' Agnol, R., Pietsch, R.W. and Sant'ana, M.V. 1998. A
geological investigation based on airborne (SAREX) and spaceborne (RADARSAT-1) SAR
integrated products in the Central Serra dos Carajás Granite Area, Brazil. Canadian Journal
of Remote Sensing 24: 376-392.
Paradella, W. R.; Santos, A. R., Venezini, P., Morais, M. C. 1999. Avaliação de dados do
RADARSAT-1 em Aplicação Geológica na Província Mineral de Carajás, Estado do Pará.
Final Report: FAPESP Project # 10946-4/1997, INPE-São José dos Campos, Brazil.
Paradella, W.R., Silva, M.F.F., Rosa, N.A. and Kushigbor, C.A. 1994. A geobotanical approach
to the tropical rain forest environment of the Carajás Mineral Province (Amazon Region,
Brazil), based on digital TM-Landsat and DEM data. International Journal of Remote
Sensing 15: 1633-1648.
PCI, 1999. EASI-PACE User’s Manual, version 6.3, PCI Enterprises, Ontário, Canadá.
Pietsch, R.W. 1993. TFI SAR Processing Report. Internal Report, CCRS/Dendron Surveying,
Ottawa, Canada.
Pohl, C. 1998. Tools and methods used in data fusion. In: Gudmandsen, P. (ed.), Future Trends in
Remote Sensing. pp. 391-399. A.A.Balkema, Rotterdam, Brokfield.
Ramsey III, E.W. and Laine, S.C. 1997. Comparison of Landsat Thematic Mapper and high
resolution photography to identify changes in complex coastal wetlands. Journal of Coastal
Research 13: 281-292.
Ramsey III, E.W., Nelson, G.A. and Sapkota, S.K. 1998. Classifying coastal resources by
integrating optical and radar imagery and color infrared photography. Mangroves and Salt
marshes 2: 109-119.

137
Raney, K. 1998. Radar fundamentals: technical perspective. In: Henderson, F.M. and Lewis, A.J.
(eds.), Principles & Applications of Imaging Radar. Manual of Remote Sensing. 3rd edn. pp.
8-130. John Willey & Sons, New York, USA.
Rudant, J.P.; Baltzer, F.; Deroin, J.P.; lointier, M.; Maitre, H.; Mouglin, E.; Pénicand, C.; Prost,
M.T. 1996. Apport des images radar satellitaires ERS-1 et JERS-1 dans le domaine de la
cartographie générale et thématique en contexte tropical humide: exemples en Guyane
française et régions limitrophes. Société Française de Photogrammétrie et Télédetection,
142: 15-33.
Singhroy, V. 1992. Remote sensing in global geoscience processes: introductory remarks.
Episodes 15: 3-5.
Singhroy, V. 1996. Interpretation of SAR images for coastal zone mapping in Guyana. Canadian
Journal of Remote Sensing 22: 317-328.
Smith, G.M., Spencer, T., Murray, A.L. and French, J.R. 1998. Assessing seasonal vegetation
change in coastal wetlands with airborne remote sensing: an outline methodology.
Mangroves and Salt marshes 2: 15-28.
Souza Filho, P. W. M. 2000. Tectonic control on the coastal zone geomorphology of the
northeastern Pará State. Revista Brasileira de Geociências 30: 523-526.
Souza Filho, P.W.M. and El-Robrini, M. 1996. Morfologia, processos de sedimentação e
litofácies dos ambientes morfosedimentares da Planície Costeira Bragantina - Nordeste do
Pará (Brasil). Geonomos 4: 1-16.
Souza Filho, P.W.M. and El-Robrini, M. 1998. As variações do nível do mar e a estratigrafia de
sequências da Planície Costeira Bragantina - Nordeste do Pará, Brasil. Boletim do Museu
Paraense Emílio Goeldi, Série Ciências da Terra 10: 45-78.
Souza Filho, P. W. M. and El-Robrini, M. 2000. Coastal Zone Geomorphology of the Bragança
Area, Northeast of Amazon Region, Brazil. Revista Brasileira de Geociências 30: 518-522.
Toutin, T. 1995. Intégration de données multi-source: comparaison de méthodes géométriques et
radiométriques. . International Journal of Remote Sensing 16: 2795-2811.
Wald, L. 1998. An overview of concepts in fusion of Earth data. In: Gudmandsen, P. (ed.), Future
Trends in Remote Sensing.. pp. 385-390. A.A.Balkema, Rotterdam, Brookfield.

138
CAPÍTULO 4:
APLICAÇÃO DE DADOS DE SENSORIAMENTO REMOTO NO ESTUDO
DA GEOMORFOLOGIA COSTEIRA

139
4.1. SATELLITE IMAGES FOR STUDY OF DYNAMIC OF THE BRAGANÇA
MANGROVE COAST, NORTHERN BRAZILIAN AMAZON
ABSTRACT
Diverse coastal macrotidal environments characterize the Bragança mangrove coast in the
State of Pará lying on the northern coast of Brazil. In order to understand the geologic evolution
of the coastal zone, its coastal landforms, and their seasonal and mid-term dynamics, multidate
satellite data from 1972 (airborne SAR GEMS 1000), 1985, 1988, 1990, 1991 (Landsat TM) and
1998 (RADARSAT-1) were used for visual interpretation of the coastal area around Bragança.
The satellite images were integrated in a geographic information system for interpretation and
evaluation of shoreline changes. The Bragança mangrove coast represents a submerging coast,
whose geologic evolution is related to sea level rise since 5,200 years B.P, followed by stillstand
conditions responsible for mangrove fringe progradation. Therefore, the geologic coastal
evolution of the study area is controlled by relative sea level changes. The mid-term
morphological changes from 1972 to 1998 are marked by shoreline recession. The dynamic
changes observed along the coastal features are thus mainly controlled by the combined effects of
waves, tides and currents operating in the area, coupled with nature, type, composition of the
material, orientation of the coast and variation in the tidal channel positions. The short-term
evolution has revealed few modifications at local level, well recognized at specific place mainly
from 1985 to 1988. These short-term coastal changes are, principally related to anomalous
rainfall times, associated to La-Niña events and responsible for severe coastal erosion periods.
Key words: remote sensing, Landsat TM, RADARSAT-1, coastal erosion, El-Niño event.
INTRODUCTION
The landforms along the Bragança macrotidal mangrove coast in Pará State (northern
Brazil) are complex and dynamic in nature. The interactive processes that are operating in the
evolution of these coastal landforms are mainly controlled by waves, wind, tides and currents
coupled with geology and lithology of the area. The coastal processes of erosion, deposition and
transport, flooding and relative sea level change continuously modify the shoreline. Thus, the
understanding of coastal landform development and their spatial and temporal changes is very
important to characterize the coastal evolution.

140
Orbital remotely sensed data has been extensively used in regional geomorphologic
mapping when modern satellite platform was launched in the 1970's. Useful source of satellite
optical data for geomorphologic application are images from the Landsat Multispectral Scanner
(MSS) and Thematic Mapper (TM), SPOT HRV and other higher resolution sensor. The TM
sensor of Landsat 5 allows a variety of use, notably in natural resources survey, land cover and
land use, coastal geomorphologic changes and environmental monitoring (Jones 1986; Loughlin
1991; Gowda et al. 1995; Prost 1997; Ramsey III et al. 1998; Ciavola et al. 1999; Yang et al.
1999). During the last 10 years, Synthetic Aperture Radar (SAR) has been used with more
frequency, principally in tropical coastal environments (Singhroy, 1995; 1996; Rudant et al.,
1996; Prost, 1997; Barbosa et al. 1999; Johannessen, 2000; Kushwaha et al. 2000). Nowadays,
the RADARSAT-1 Fine Mode is a useful data for coastal dynamic studies. This SAR emphasizes
the importance of using microwave images for coastal zone mapping, and the integration of
information got from older and new SAR has an excellent evaluation of the shoreline changes
and mapping of areas at risk from coastal erosion.
The principal objectives of this paper are to examine the dynamic of coastal landforms over
seasonal and mid-term changes in comparison to the holocenic events and to consider the
possible role of direct rainfall related to El Niño-La Niña events in producing coastal erosion.
REGIONAL SETTING
The study area is located in the northeast of the State of Pará, around 1º S and 46º W
(Figure 1). A continuous mangrove belt of around 20 km wide fringes the shoreline with
elevation from 1 to 2 m above mean tide level (Cohen et al. 2000). A wet season from December
to May and a dry season from June to November mark the climate. Trade winds blow from
northeast throughout the year, most strongly during the dry season. The average annual rainfall
reach 2,500 mm and the mean tidal range measures around 5 m in a semi-diurnal cycle, and
during the spring tides is locally as high as 6 m. Thus, during spring tides large areas of the low
land are inundated as a result of both high rainfall and runoff rates and tidal inundation (Kjerfve
et al. 2000). Strong tidal currents and waves are responsible for erosion of mangroves along the
coast, estuaries and bays, where lines of fallen mangroves trees mark the eroded places. On the
other hand, new mangrove fringes are prograding seaward in response for muddy sedimentation
(Souza Filho and El-Robrini, 1998).

141
Figure 1- Localization map of the study site.
The detailed knowledge of the coastal environments (mangroves, salt marshes, sandflats,
chenier sand ridges, coastal sand dunes, barrier-beach ridges and ebb-tidal delta) and the coastal
features (plateaus and coastal plain boundary, depositional and erosional features, coastline form
and suspended sediments) is observed in the color composite of the Landsat TM images acquired
on August 1985 (Figure 2; Souza Filho and Paradella, submitted). Intertidal mangrove is depicted
as reddish hue, with strong infrared spectral response caused by the contribution of the dense
mangrove forest in the TM 4 band (Figure 2a). Supratidal mangroves appear as green-reddish
colors due to mixed response of muddy sediments and mangrove trees (Figure 2b). Salt marshes
are situated in the supratidal zone, with sedimentation marked by mud deposition carried from
rV-A
Brazil /
Hr SKü
Sludy Area
OfMançaJ
PARÁ
M».BU Port
:eP -ÍV SSS" ^ í ■,>sr
' A vV> i ' i ÍLT y " Tv K
COMtMpWtMll
8 Km
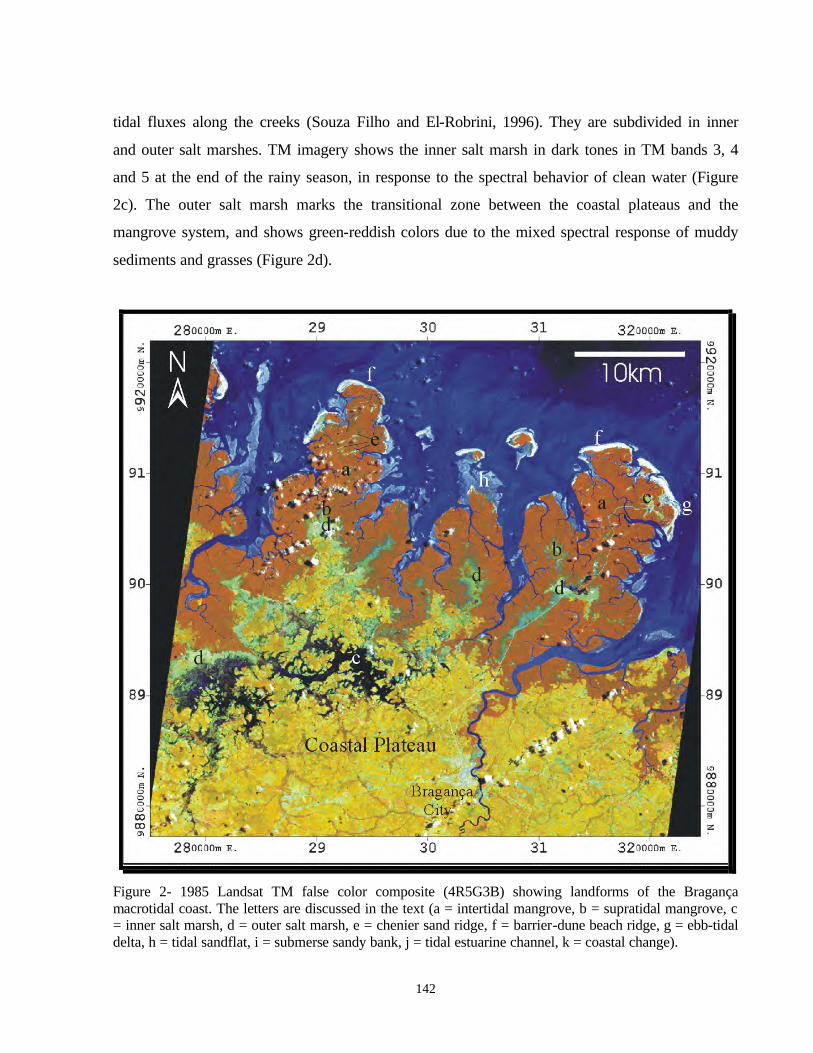
142
tidal fluxes along the creeks (Souza Filho and El-Robrini, 1996). They are subdivided in inner
and outer salt marshes. TM imagery shows the inner salt marsh in dark tones in TM bands 3, 4
and 5 at the end of the rainy season, in response to the spectral behavior of clean water (Figure
2c). The outer salt marsh marks the transitional zone between the coastal plateaus and the
mangrove system, and shows green-reddish colors due to the mixed spectral response of muddy
sediments and grasses (Figure 2d).
Figure 2- 1985 Landsat TM false color composite (4R5G3B) showing landforms of the Bragança macrotidal coast. The letters are discussed in the text (a = intertidal mangrove, b = supratidal mangrove, c = inner salt marsh, d = outer salt marsh, e = chenier sand ridge, f = barrier-dune beach ridge, g = ebb-tidal delta, h = tidal sandflat, i = submerse sandy bank, j = tidal estuarine channel, k = coastal change).
29 30 280COOin E 3200QOm E.
ro
ut
»
90 ' 90 d •"V- r * Vi £ Vi>-
ÀJP"
89 89
r
Coastal Plateau -V N
co
i
•» co Bragan -.
Ci¥ CO -> co
280000ni E. 30 31 32ooqo>II E.

143
The chenier sand ridges constitute old dune-beach ridges with associated washover fans.
They present light-bluish colors in response to the spectral reflectance of wet white fine sand
covered by sparse vegetation in TM 3 and 4 (Figure 2e). The cheniers have a very well
characterized geometry given by linear and curved forms with boundaries marked by prograding
tidal mudflats. The chenier's appearances are typical in the images. They are discernible from
recent beaches by form and spatial distributions rather than by color attributes.
Barrier-dune-beach ridges (Figure 2f), ebb-tidal deltas (Figure 2g) and tidal sandflats
(Figure 2h) are associated with white colors due to the high spectral response in all three TM
bands caused by the presence of dry fine white sandy deposits in dunes and intertidal beaches.
Coastal features, such as coastal plateaus and coastal plain boundary are very well discernible in
the images due to the spectral response of the targets. The suspended sediments and tidal currents
responsible for sediment dispersion are much more recognizable in Landsat TM band 3 (Figure
3). Note the high turbidity near the coast and tidal current line orientated along north-south
direction defining a singular turbidity distribution pattern.
Figure 3- 1985 Landsat TM band 3 showing turbidity distribution patterns and tidal current lines.
280Q00in E. 320000in E. 29 30
A •
* >** \ «•
>
90
5 ,
89 89
30 31 28aaooiii e 320000m E.

144
DATA SET AND METHODS
Historical investigation of the shoreline positions was based on remote sensing data
represented by GEMS 1000 acquired in 1972, Landsat TM (path 222, row 61) acquired in 1985,
1988, 1990, 1991 and 1995 and C-HH band RADARSAT-1 Fine Mode 1, (descending orbit)
acquired in 1998. Table 1 provides details of the remotely sensed data used in this research.
Table 1. Characteristics of the remotely sensed data.
Platform Sensor Acquisition Date
Angle of Incidence
Spatial Resolution (m)
Pixel Size (m)
Image Format
Aircraft GEMS 1000 1972 13-36º 16x16 16 Analogic Landsat-5 TM Bands
1,2,3,4,5,7 August 24,
1985 _____ 30 x 30 30 x 30 8-bits
Landsat-5 TM Bands 1,2,3,4,5,7
October 03, 1988
_____ 30 x 30 30 x 30 8-bits
Landsat-5 TM Bands 1,2,3,4,5,7
July 05, 1990
_____ 30 x 30 30 x 30 8-bits
Landsat-5 TM Bands 1,2,3,4,5,7
December 31, 1991
_____ 30 x 30 30 x 30 8-bits
Landsat-5 TM Bands 3,4,5
June 08, 1995
_____ 30 x 30 30 x 30 8-bits
RADARSAT-1 Fine Beam Mode 1
September 08, 1998
37-40º 9,1 x 8,4 6,25 16-bits Path Image
The digital image analysis was carried out based on EASI-PACE package (PCI, 1999).
The TM data were radiometric and geometric corrected. Radiometric correction was related to
the attenuation of atmospheric effects based on the minimum histogram pixel (Chavez, 1988). A
rigorous geometric correction based on an ortho-rectification scheme was applied to the TM
bands in order to assure correction for terrain distortions (Toutin, 1995). The initial processing
steps for the RADARSAT data included the scaling of the image from 16 to 8 bits. Afterward, a 3
x 3 adaptive enhanced-Frost filter window was applied to reduce speckle effects (Lopes et al.,
1990) during the ortho-rectification process. Based on the statistics of the ortho-rectification for
the TM and the SAR data, the RMS accuracy was around 1 pixel size. Hence, the minimum
detectable change works out to be 60 m for TM data and 18 m for SAR data.
The mid-term shoreline change was examined from airborne SAR data that was initially
scanned and digitally rectified to common UTM coordinates (RMS accuracy was around one
pixel size through first order polynomial method). In order to extract the shoreline position in
1972, the airborne SAR image was classified in two classes: emerging coastal areas and coastal

145
water. Afterwards, the raster data was converted to vector and superimposed to the RADARSAT-
1 scene. Finally, the extracted information was compared to the airborne SAR information and an
estimate of coastline changes was possible.
The short-term shoreline change was analyzed from digital image enhancement of
Landsat TM and superimposition of different dates in the same scene. The shoreline positions
were gathered in an ArcView GIS (ESRI, 1996).
The shoreline position used to monitor historical changes is represented here by spring
high tide level (SHTL), which has been demonstrated to be the best indicator of the land-water
interface for historical shoreline comparison study (Dolan et al., 1980; Crowell et al., 1991). The
SHTL delineates the landward extent of the last high tide, hence it is easily recognizable in the
field and it can usually be approximated from remote sensed data.
GEOLOGIC SHORELINE CHANGES
The large-scale geomorphological evolution of northeastern Pará State is controlled by the
tectonic setting of the passive margin developed since the Early Cretaceous during the opening of
the Equatorial Atlantic Ocean. Bragança mangrove coast has its evolution related to the
Bragança-Viseu coastal basin that is controlled by normal faults that reach the present coastal
zone. The structural framework of this coastal basin is responsible for a submerging coastal zone
development, showing a wide mangrove ecosystem due to mudflat progradation (Souza Filho,
2000). According Bird (1993), submerging coast is presently confined and has been subsiding
along the geologic history.
Souza Filho & El-Robrini (1997) suggest that holocenic evolution in the Northern Brazil
begun when the sea level reach the present position around 5, 100 years B.P (Simões, 1981),
which represent the maximum of the Holocenic Transgression. During this event, the sea level
rose and eroded the Tertiary deposits developing active cliffs along the shoreline. The
transgressive sand sheet migrated landward forming sand tidal shoal, estuarine mouth bars,
beaches and dune-beach ridges. This environment constitute a retrogradational succession that is
found 3-5 meters depth, where the sand stratigraphic facies were developed under shallow water
conditions, influenced by tidal current and waves, while the salt marsh mud facies filled the
estuarine channels.

146
Under stillstand sea level conditions since 5,100 years B.P occur a muddy progradation of
the coastline in direction to seaward marking the beginning of mangrove development at 2,100
years B.P (Behling et al, 1999). The contact between the transgressive sand sheet and the mud
mangrove deposits is flat and very well defined, as result of subaerial progradation (Souza Filho
and El-Robrini, 1998). During this progradation occurred erosional phase responsible by
reworking of coastal sediments and deposition of dune-beach ridge with washover fans
associated that will evolve to Chenier deposits. Therefore, these sediments deposited during the
stillstand conditions represent the progradational succession. The boundary between the
transgressive sand sheet and the muddy progradation deposits is plane and define a downlap
surface that represents a maximum flooding surface (MFS). Therefore, this surface characterizes
a progradation responsible for coastline accretion.
The last sedimentary event is marked by a new transgressive condition, where the
transgressive sand sheets (sand tidal shoal and beach-dune ridges) migrates over muddy
mangrove deposits and erodes the coastline. Souza Filho (1995) and Silva (1996) characterized
this transgressive event in the coast of Pará State and by Tomazelli et al (1998) in the coast of the
State of Rio Grande do Sul.
HISTORICAL SHORELINE CHANGES
Mid-term morphological changes
The mid-term changes in shoreline position were measured between 1972 and 1998 using
SAR data from airborne GEMS and spaceborne RADARSAT-1, respectively. The impact of the
natural dynamics in the Bragança Coastal Plain has made fast and dramatic changes in the
shoreline position during the last three decades. A comparison between 1972 and 1998 in the
shoreline position has shown that shoreline has been subjected to severe erosion and accretion,
and some sector remains unchanged in any specific coastal site. In the oceanic setting, the mid-
term shoreline recession reaches maximum distance of 1,500 m and 1,250 m ± 28 m in Maiaú
Point and Buçucanga Beach (Figure 4), with average recession rate for these sites were 57.7
m/yr. and 48 m/yr. for the 26-year period, respectively. These erosional settings represent the
most seaward boundary of the coastal plain, which receive little or no muddy sediment. The main
sedimentary process responsible for shoreline retreat is related to sandflats migration landward
over the mangrove deposits due to tidal currents and large waves action. Mangrove vegetation

147
has been killed by rapid sand deposition over it and mangrove terrace has been eroded. Hence,
great parts of the shoreline, principally beaches, are characterized as transgressive deposits
(Souza Filho, 1995).
Figure 4- Lon-term morphological changes observed through 1972 shoreline vector superimposed to 1998 RADARSAT-1 image. A) Maiaú Point; B) Buçucanga Beach; C) Maciel Point; and D) Atalaia Estuary.
The shoreline recession sectors are very well observed in the Maciel Point, where shoreline
position migrated 1,250 m seaward (Figure 4). This is about 48 m/year of coastal progradation. In
this area, the continuous sediment supply, geomorphological positions and protection of wave
attack favor the accretion of sandbanks, muddy deposition and mangrove vegetation
establishment. Therefore, mangrove trap sediments to build a depositional mud terrace in the
290000^ E. 3 2 OOOOra E. 30
10 Km
ui
-
S3g
00
3 - cr> oo
31 290000in E. 320000in E.
RADARSAT image ©Canadian Space Agency, 1998

148
upper intertidal flat and successive zones of pioneer vegetation (spartina sp.) and other mangrove
species migrate seaward. Migration of islands is observed along the Maiaú Bay in response to
oceanographic and sedimentary processes. For example, the Maciel Island migrated almost 1 km
from 1972 to 1998, with average migration rate of 38.5 m/year (Figure 4).
Other coastal setting is related to estuarine processes, where tidal currents and tidal
channel position have controlled the coastal evolution. Based on integrated remote sensed data,
SAR and TM composite (Souza Filho and Paradella, submitted), is possible to conclude that
erosional sectors are strongly controlled by estuarine and tidal channel position and ebb-tidal
delta evolution. Where tidal channels run near the shoreline boundary are observed the specific
places subject to severe coastal erosion, such as the Maiaú, Picanço and Buçucanga Point. On the
other hand, where sandbanks are situated along the coast and the tidal channels do not reach the
land-water boundary, favorable areas are formed for shoreline accretion, such as the Maciel
Point.
Short (seasonal) morphological changes
The study of short-term changes through Landsat TM data of August 1985 vs. October
1988, October 1988 vs. July 1990 and July 1990 vs. December 1991 has showed no major
changes only few modifications at specific places. Hence, four sites were selected for detailed
analysis of short-term coastal changes based on places submitted to greater mid-term changes
(Figure 4). The two most prominent points (Maiaú and Buçucanga) are being eroded. In Maiaú
Point, the principal coastal process is related to erosion, responsible for shoreline retreat of
approximately 300 ± 48 m from 1985 to 1988, 75 ± 46 m from 1988 to 1990 and 130 ± 47 m
from 1990 to 1991 (Figure 5). In this place, tidal currents along the coast and wave attack mainly
control the coastal erosion. In the Buçucanga Beach, the coastal erosion is associated to ebb-tidal
delta migration that is responsible for sandbanks migration over mangrove deposits. Moreover,
ebb and tidal currents coupled with waves of northeastward favor the shoreline retreat that
reaches values of 530 ± 48 m from 1985 to 1988, less than 60 m from 1988 to 1990 and 260 ± 47
m from 1990 to 1991 (Figure 6).
Protected areas such as Maciel Point and Atalaia Estuary were analyzed. The Maciel Point
represents one of the few sites dominated by depositional processes related to stabilization of
sandbanks and posteriori colonization by mangroves and muddy deposition (Figure 7). The

149
geographical position of this site besides the estuarine island and behind two estuaries allowed
the development and emerging of sandbank protected of wave attack and tidal current erosion
(Figure 3). The Atalaia Estuary is marked by little erosion along its margins (Figure 8). The tidal
channels and submerse sandy banks has been subjected to severe coastal changes, however due to
macrotidal conditions is difficult to quantify the real geomorphic changes.
Figure 5- Short-term morphological changes in positions of shoreline in the Maiaú Point. A) 1985-1988; B) 1988-1990; C) 1990-1991; and D) map showing the shoreline changes from 1985 to 1991.
A B
C D
M
I r-
Míf *
«ir
A/ 1985
/x' 1990 A/ 1991
2 km

150
Figure 6- Short-term morphological changes in positions of shoreline in the Buçucanga Beach. A) 1985-1988; B) 1988-1990; C) 1990-1991; and D) map showing the shoreline changes from 1985 to 1991.
A B
C D
v
i *
v 3
-w.
\1Ê
E /*'
V
Kj
A
1 Km
A/ 'A: 1!:': :: AA ív^A

151
Figure 7- Short-term morphological changes in positions of shoreline in the Maciel Point. a) 1985-1988; b) 1988-1990; c) 1990-1991; and d) map showing the shoreline changes from 1985 to 1991.
A
2 km
N
B
C D
V
•r- L
Ivás
í
■
»■
I
n
A
A/ 1985 /V 1988 /X'' 1990 A/ 1991
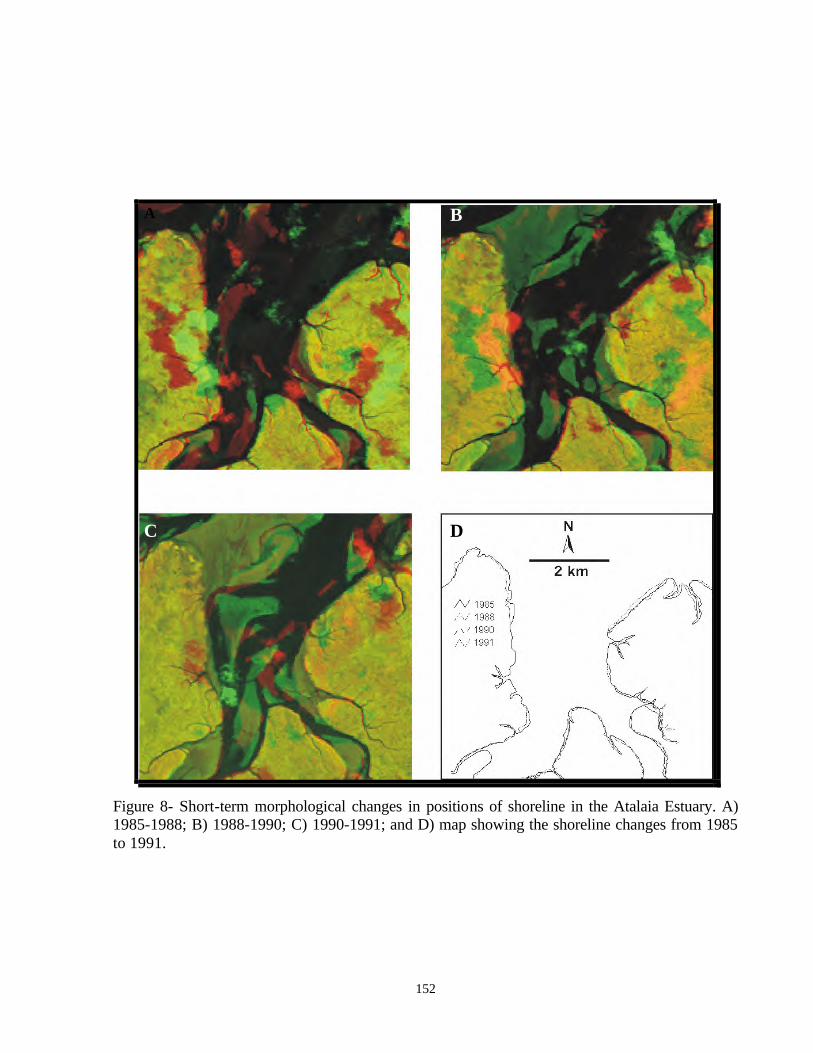
152
Figure 8- Short-term morphological changes in positions of shoreline in the Atalaia Estuary. A) 1985-1988; B) 1988-1990; C) 1990-1991; and D) map showing the shoreline changes from 1985 to 1991.
A B
C D
h
*
V ' •
S
%
t-
L v
2 km

153
The short-term coastal changes observed along the study area are well marked from 1985
to 1988. All sites examined during this period revealed the major shoreline changes. The analysis
of meteorological data has shown that there were abnormalities in precipitation during this
period. Only in 1985, the annual precipitation totaled 4,069 mm after voluminous rainfall
compared to the annual average of approximately 2,500 mm (Figure 9). In March the
precipitation amounted 761 mm and during the wet season (January to June) rainfall reached
3386 mm with average of 564 mm/month, which is much greater than month average (Figure 10).
1986 and 1988 were also characterized by heavy rainfall (Figure 8) with annual precipitation of
3423 and 2878 mm, respectively. During the wet season, the month average remained above the
mean (Figure 10).
The period between 1988-1990 is characterized by stabilization in the shoreline position.
During this same time, the precipitation in marked by index under the annual average (2,331 and
1,848 mm, respectively; Figure 9). The month average remained under the mean along the almost
all month (Figure 10). From 1990 to 1991 small shoreline changes are observed in combination
to increase in the precipitation that reached 3,487 mm in 1991.
Figure 9- Annual precipitation in the Traquateua hydro-meteorological station from 1974 to 1998. Note the years with precipitation higher than annual average.
« 2500 & e 2000
CDCDCDÇpmCDÇPÇPÇOÇDÇDCOCO ~-J-VI-VJC»c»C»C»C»CD®®85CD -t.O)COOK)^C3)COOK)-^0)CO
Years

154
Figure 10- Month precipitation in the Traquateua hydro-meteorological station during the period of short-term shoreline analysis.
DISCUSSION
The Bragança mangrove coast geologic evolution was initiated during the Holocene
transgression at 5,200 years B.P, when rise in sea level partly eroded and drowned the coastal
plateaus. During this event, extensive transgressive sandy sheets and barrier-beach ridges were
formed. From 2,100 years B.P (Behling et al, 1999), a wide mangrove coast was developed under
drop in sea level favoured by seaward progradation of the coastline. The stillstand sea level also
exposed estuaries, which were replaced by brackish water wetlands, such as salt marshes.
Presently, a new transgressive condition is observed along the coastal zone. Stratigraphic records
show transgressive sandy sheets migrating over muddy mangrove deposits and producing a
coastline retreat.
In view of Holocene history, the general tendency that would be expected in the study
coast would be the mangrove shore progradation. However, the mid-term morphological changes
from 1972 to 1998 are marked by shoreline recession, which represents the dominant
morphological change along the coast with showed recession rates of until 57.7 m/yr. The

155
dynamic changes observed along the coastal features are thus mainly controlled by the combined
effects of waves, tides and currents operating in the area, coupled with nature, type, composition
of the material and orientation of the coast. Also variation in tidal channel positions has
contributed to changes in coastal landforms
The short-term evolution has revealed small modification at local level. This few
morphological changes are related to shoreline recession, well recognized at specific place
mainly from 1985 to 1988 during a La-Niña event. This period is marked by high precipitation
that probably resulted in flooding, high river discharge, severe tidal currents, high tidal range and
high wave energy. Hence, theses coastal processes must have been responsible for shoreline
retreat during this short-term scale. Ulbricht and Heckendorff (1998) also characterized this
climatic event in the coast of João Pessoa (northeastern Brazil). This fact suggest that flooding
phenomena from 1985 to 1988 had a regional scale producing short-term shoreline retreat along
the northern and northeastern Brazilian coast.
CONCLUSION
This investigation has revealed that this mangrove-fringed coast is very sensitive and
susceptible to changes as a result of natural dynamic processes. The Bragança mangrove coast
represents a submerging coast, whose geologic evolution is related to sea level rise since 5,200
years B.P, followed by stillstand conditions responsible for mangrove fringe progradation.
However, the mid-term and short-term landscape development is marked by shoreline retreat,
probably related to climate changes. Therefore, climatic changes associated with El-Niño and La-
Niña events that controlled the annual precipitation, must be one of important factors in
producing coastal erosion from 1985 to 1988 in the Bragança Coastal Plain.
Acknowledgements
The authors would like to thank the National Institute for Space Research (INPE) for the
Landsat TM acquisition and for support during the digital image processing and the National
Department for Water and Energy (DNAE) for provide precipitation data. Special thanks to Dra.
Helenice Vital, Rubén José Lara and anonymous reviewers for the constructive reviewing of the
manuscript. Finally, we gratefully acknowledge at CAPES and CNPq for a research grant during
this investigation.
156
REFERENCES
Barbosa, M.P.; Singhroy, V.; Saint-Jean, R. 1999. Mapping coastal erosion in Southern Paraíba,
Brazil from RADARSAT-1. Canadian Journal of Remote Sensing, 25: 323-328.
Behling, H., Cohen, M.C.L, Lara, R,J. 1999. Holocene mangrove dynamics of the Bragança
Region on Northeastern Pará, Brazil. In: International Conference of Madam Project 1999.
pp. 10-11. CNPq/BMBF, Belém, Brazil.
Bird, E.C.F. 1993. Submerging coast: the effects of a rising sea level on coastal environments.
New York, John Willey, 184p.
Chavez, P.S. 1988. An improved dark-object subtraction technique for atmospheric scattering
correction of multispectral data. Remote Sensing of Environment 24: 450-479.
Ciavola, P.; Mantovani, F.; Simeoni, U.; Tessari, U. 1999. Relation between river dynamic and
coastal changes in Albania: an assessment integrating satellite imagery with historical data.
International Journal of Remote Sensing, 20: 561-584.
Cohen, M.C.L.; Lara, R.J.; Szlafstein, C.F.; Dittmar, T. 2000. Analysis of mangrove inundation
by GIS techniques. In: . In: Mangrove 2000: Conference Sustainable Use of Estuaries and
Mangroves. Recife. Full papers. UFRPE/ISME.
Crowell, M.; Leatherman, S.P.; Buckley, M.K. 1991. Historical shoreline change: error analysis
and mapping accuracy. Journal of Coastal Research, 7: 839-852.
Dolan, R.B.; Hayden, B.P.; May, P. 1980. The reliability of shoreline change measurements from
aerial photographs. Shore and Beach, 48: 22-29.
ESRI. 1996. Using ArcView GIS. ERSI, New York, 350p.
Gowda, H.H.; Ganesha Raj, K.; Padmavathy, A.S.; Manikian, B. 1995. Multidate satellite data
for study of dynamic of coastal landforms of Uttara Kannada, South India. Intenational
Journal of Remote Sensing, 16: 2539-2553.
Johannessen, J.A. 2000. Coastal observing systems: the role of synthetic aperture radar. Johns
Hopkins APL Technical Digest, 21: 7-14.
Jones, A. R. 1986. An evaluation of satellite thematic mapper imagery for geomorphological
mapping in arid and semi-arid environment. In: Gardiner, V. (ed.) International
Geomorphology. Chichester, Wiley, p. 343-357.

157
Kjerfve, B.; Perillo, G.M.E.; Gardner, L.R.; Rine, J.M.; Dias, G.T.M.; Rebelo-Mochel, F. 2000.
Morphodynamics of muddy environments along the Atlantic coast of North and South
America (in press).
Kushwaha, S.P.S., Dwivedi, R.S. and Rao, B.R.M. 2000. Evaluating of various digital image
processing techniques for detection of coastal wetlands using ERS-1 SAR data. International
Journal of Remote Sensing, 21: 565-579.
Lopes, A., Touzi, R. and Nezry, E. 1990. Adaptive speckle filters and scene heterogeneity. IEEE
Transaction on Geoscience and Remote Sensing, 28: 992-1000.
Loughlin, W.P. 1991. Principal component analysis for alteration mapping. Photogrammetric
Engineering & Remote Sensing, 57: 1163-1169.
PCI, 1999. EASI-PACE User’s Manual, version 6.3, PCI Enterprises, Ontário, Canadá.
Prost, M. T. 1997. La mangrove de front de mer en Guyane: ses transformations sous l'influence
du système de dispersion Amazonien et son suivi par télédétection. In: Kjerfve, B.; lacerda,
L. D.; Diop, E. H. S. (ed.). Mangrove ecosystem studies in Latin America and Africa. Paris,
UNESCO, p. 111-126.
Ramsey III, E.W., Nelson, G.A. and Sapkota, S.K. 1998. Classifying coastal resources by
integrating optical and radar imagery and color infrared photography. Mangroves and Salt
marshes 2: 109-119.
Rudant, J.P.; Baltzer, F.; Deroin, J.P.; lointier, M.; Maitre, H.; Mouglin, E.; Pénicand, C.; Prost,
M.T. 1996. Apport des images radar satellitaires ERS-1 et JERS-1 dans le domaine de la
cartographie générale et thématique en contexte tropical humide: exemples en Guyane
française et régions limitrophes. Société Française de Photogrammétrie et Télédetection,
142: 15-33.
Silva, M.S. 1996. Morfoestratigrafia e evolução holocênica da Planície Costeira de Salinópolis,
Nordeste do Estado do Pará. Universidade Federal do Pará, Master Dissertation, 142p.
Simões, M.F. 1981. Coletores - Pescadores ceramistas do litoral do salgado (Pará). Boletim do
Museu Paraense Emílio Goeldi; Nova Série Antropologia, 78: 1-33.
Singhroy, V. 1995. SAR integrated techniques for geoharzard assessment. Advanced Space
Research, 15(11): 1167-1178.
Singhroy, V. 1996. Interpretation of SAR images for coastal zone mapping in Guyana. Canadian
Journal of Remote Sensing, 22: 317-328.

158
Souza Filho, P.W.M. 1995. Influência das Variações do Nível do Mar na Morfoestratigrafia da
Planície Costeira Bragantina (NE do Pará) durante o Holoceno. Master Dissertation,
Universidade Federal do Pará, 123pp.
Souza Filho, P. W. M. 2000. Tectonic control on the coastal zone geomorphology of the
northeastern Pará State. Revista Brasileira de Geociências, 30: 523-526.
Souza Filho, P.W.M. and El-Robrini, M. 1996. Morfologia, processos de sedimentação e
litofácies dos ambientes morfosedimentares da Planície Costeira Bragantina - Nordeste do
Pará (Brasil). Geonomos 4: 1-16.
Souza Filho, P.W.M. & El-Robrini, M. 1997. A influência das variações do nível do mar na
sedimentação da Planície Costeira Bragantina durante o Holoceno - Nordeste do Pará,
Brasil. In: COSTA, M.L. & ANGÉLICA, R.S. (ed.). 1997. Contribuições a Geologia da
Amazônia. Belém, FINEP/SBG-Núcleo Norte. p. 307-337.
Souza Filho, P.W.M. and El-Robrini, M. 1998. As variações do nível do mar e a estratigrafia de
sequências da Planície Costeira Bragantina - Nordeste do Pará, Brasil. Boletim do Museu
Paraense Emílio Goeldi, Série Ciências da Terra 10: 45-78.
Souza Filho, P. W. M. and Paradella, W.R. Evaluation of Landsat Thematic Mapper and
RADARSAT-1 Data to Geological Mapping on a Mangrove Coast, Bragança, Pará,
Brazilian Amazon Region. Wetlands Ecology and Management (submitted).
Tomazelli, L.J.; Villwock, J.A.; Dillenburg, S.R.; Bachi, F.A.; Dehnhardt, B.A. 1998. Significance
of present-day coastal erosion and marine transgression, Rio Grande do Sul, Southern
Brazil. Anais da Academia Brasileira de Ciências, 70: 221-229.
Toutin, T. 1995. Intégration de données multi-source: comparaison de méthodes géométriques et
radiométriques. International Journal of Remote Sensing, 16: 2795-2811.
Ulbricht, K.A. and Heckendorff, W.D. 1998. Satellite images for recognition of landscape and
landuse changes. Journal of Photogrammetry & Remote Sensing, 53: 235-243.
Yang, X.; Damen, M. C. J.; Van Zuidam, R. A. 1999. Use of thematic mapper imagery with
geographic information system for geomorphologic mapping in a large deltaic lowland
environment. International Journal of Remote Sensing, 20: 659-681.

159
4.2. MANGROVES AS GEOLOGICAL INDICATOR OF COASTAL CHANGES IN
BRAGANÇA, PARÁ, NORTHERN BRAZIL
ABSTRACT
Mangrove ecosystems show close links between geomorphology and vegetation
assemblage. In addition, the vegetation can change through time as landforms accrete or erode
what is a direct response to coastal sedimentary processes. This demonstrates that significant
changes can occur on short time scales and mangroves provide very well register of these
modifications. Therefore, mangrove morphology and sediments are good indicators of
interactions between relative sea level, coastal processes and sediment supply. These interactions
are responsible for landward migration of the shoreline (transgression) and seaward migration of
the shoreline (regression) that is possible to detect from field observation and geomorphologic
mapping. Mangroves are one of the best geoindicators in global change research and they are an
excellent procedure to detect and quantify coastal modifications.
Keywords: Mangroves - geoindicators - coastal changes - remote sensing - Northern Brazil
INTRODUCTION
Mangroves are the most prominent tropical ecosystem in the Northern Brazilian coast
where geomorphologic, sedimentary and oceanographic processes have controlled the landscape
evolution. Natural processes and human activities have extensively modified mangrove
communities, and economic and social impacts have increased along the last two decades.
Therefore, natural and anthropogenic impacts on mangroves ecosystem have contributed to the
rapid coastal changes.
In recent years, there has been much discussion about the natural (physical, chemical and
biological) environment to know what is its integrity state? What is the pressure both natural and
anthropogenic that it is undergone? What is the significance of the changes? And how are we
responding to the changes - what are we doing about them? (Berger 1996). Based on
geoindicators' approach, the aim of this paper is to establish mangrove as environmental
indicator able to detect and quantify the short-term changes in Bragança coastal plain.

160
ENVIRONMENTAL SETTING
Mangrove shorelines occur in a number of different environmental settings that comprise
geophysical (climate, tides and sea level) and geomorphological (dynamic history of the land
surface and contemporary processes and biological components, Woodroffe 1992).
The Bragança coastal plain presents a hot and humid equatorial climate, with a dry and
wet well-defined seasons and an annual average precipitation of 3,000 mm. The study area is a
tide-dominated setting characterized by a semidiurnal macrotidal regime (6 m high tidal range).
There is an extensive (more than 20 km wide) and low gradient intertidal zone available for
mangrove colonization that forms a fringe wetland vegetation zone between coastal plateaus and
sea (Figure 1). Mangrove vegetation is composed of forest with trees reaching up to 30 m high
and brackish or marine waters as a result of tidal action that regularly overflow them. Strong bi-
directional tidal currents characterize the Caeté Estuary, which presents funnel-shaped mouth,
straight, and meandering segments and up-stream tidal channel (Souza Filho and El-Robrini,
1996).
DATA SETS AND METHODOLOGY
The investigation was based on spaceborne SAR, TM Landsat and aerial photograph
data. Table 1 provides details of the remotely sensed data. The methodology applied to assess the
geomorphologic changes was based on multidate satellite data. An ortho-rectification process
was necessary in order to correct terrain distortion and compare different images (Toutin 1995).
This geometric correction was based on cubic convolution and UTM geo-referencing. The
images were digitally enhanced through different imaging processing. The mangrove ecosystems
were mapped through SAR Radarsat (1998) and TM Landsat 5 (1985) imageries and scanned
aerial photographs (1975), auxiliary data and field observations. Fieldwork was carried out to
detect the sedimentary processes responsible for coastal changes and geomorphologic
modifications observed in the imageries.

161
Figure 1- Location map of the study area and mangroves distribution in the Bragança coastal plain.
Table 1- Characteristics of remotely sensed data.
Platform/ Sensor
Acquisition date
Tide condition
Incidence angle
Spatial resolution
Radarsat F1 September 08, 1998
High tide 37-40º 9.1 x 8.4 m
Landsat TM August 24, 1985
Low tide ---- 30x30 m
Aerial photos 1975 High tide ---- 2.5 x 2.5 m
OO^^S-S 2"N
Maiaú Point AMAPÁ - 100 Km
Picanço Canela Island A Islandj Maraio Islantl ,
t PARA
^/Caeté^ m Estuaryj
fc-^L li
M
4 km Bragança
01o04'17" O Coastal plateaus | Mangroves I I Other coastal environments
162
MANGROVES AS GEOLOGICAL INDICATOR
Geoindicators are measures of surface or near-surface geological processes and
phenomena that significantly over periods of less one century and that provide information that
is meaningful for environmental assessment (Berger 1996). They measure (mainly abiotics)
variations including those related to climate changes, shoreline positions and geomorphologic
and sea level changes. Geoindicators measure both catastrophic and gradual events related to
natural and anthropogenic activity.
Coastal sedimentary landforms can be used as geomorphological indicators of the
environments and processes that shape the coastal zone. Coastal zones are very sensitive to
environmental change, but multiple linkages, feedback mechanisms, nonlinearly and possible
chaotic effects combine to produce uncertainty in the meaning of these indicators (Forbes and
Liverman, 1996). There is a wide selection of potential geoindicators in the coastal zone, but in
the Bragança coastal plain, mangroves cover approximately 471 km2, almost 76.5 % of the
coastal study area (Souza Filho and El-Robrini1998). And besides, mangrove ecosystem is very
sensitive to shoreline position and rate of change, erosional and depositional processes, climate
and sea level change.
Assessing of mangrove shoreline position
Indicator of shoreline position is derived from remotely sensed imageries that were used
to detect the shoreline changes between 1975 and 1998. Water line positions depend on water
level at the time of observations, what is very difficult to establish in satellite imageries in
macrotidal environments. Therefore, mangrove boundary was used as reference line to detect the
shoreline changes.
The overview of the shoreline position shows stability, but in the restricted sectors as
tidal channels and estuaries mouths, the coastal erosion is very strong. Shoreline recession, of
almost 600 m, is observed in the Maiaú point in response to rapid and strong sedimentary
dynamic in macrotidal coast setting (Figure 2). On the other hand, in protected barrier-beach
ridge areas, it is possible to observe wide and shallow tidal shoals where mangroves spread
directly out to accreting tidal mudflats (Figure 3). These progradational processes are responsible
for the formation of mangrove fringes and island over the tidal sand shoals. A good example of
this it is the island formed in the Rombada Creek between 1975 and 1985 in response to sandy

163
tidal shoal accretion (arrow in Figure 3). Afterward, sandbanks are colonized by pioneer
vegetation (spartina sp.) that increases the rate of mud sedimentation allowing the vegetated
estuarine mouth bar formation.
Shoreline position changes can be observed widely in the study area. Barrier-beach ridges
are overlaying the mangrove deposits. Islands have modified their positions due to sedimentary
dynamic in response to tides, waves and current processes.
Figure 3- Shoreline accretion by tidal mudflat progradation from 1975 to 1998. Remotely sensed data was ortho-rectified to UTM coordinates. Mangrove line position in 1975 (green), 1985 (Band 5 of TM Landsat) and 1998 (red) was digitized in Arc View GIS, from air photographs, TM Landsat and SAR Radarsat imageries, respectively. Note that mudflat is prograding over sand tidal shoals that is being progressively colonized by mangrove vegetation.
Figure 2- Shoreline recession by barrier overwash and mangrove erosion at Maiaú Point, from 1975 to 1998. Remotely sensed data was ortho-rectified to UTM coordinates. Mangrove line position in 1975 (green), 1985 (Band 5 of TM Landsat) and 1998 (red) was digitized in Arc View GIS, from air photographs, TM Landsat and SAR Radarsat imageries, respectively. Observe de strong coastal erosion eastward and the tidal mudflat prograding westward
E
E

164
Evaluating of erosional and depositional settings
Mangroves are one of the best geoindicators for evaluating shoreline changes associated
to erosional and depositional processes in muddy coast. On sectors with continuous sediment
supply or favorable geomorphological positions, mangroves trap sediments to build a
depositional mud terrace in the upper intertidal flat, where successive zones of pioneer
vegetation (spartina sp.) and other mangrove species migrate seaward (Figure 4A). On coastal
sectors that receive little or no muddy sediment, mangrove terrace has been eroded (Figure 4B).
In areas where intertidal sandflats migrate landward over the mangrove deposits due to tidal
currents and large waves action, the mangrove has been killed by rapid sand deposition.
Mangrove forests die due to sand deposition, producing the shoreline recession (Figure 4C).
Figure 4- Assessment of mangroves as geological indicator to detect coastal changes. A) Mangrove succession in response to mud progradation. B) Mangrove terrace formed by strong tidal current and wave attack that produce the shoreline recession. C) High mangrove forest died due to rapid sand deposition over muddy substrata. D) Environmental succession marked by salt marsh, supratidal and intertidal mangrove prograding seaward in response to sea level changes.
A B
C D
^ — V
•í
á
ÚS#'.

165
Implications of sea level changes in mangrove and salt marsh evolution
Evolution of the mangrove and salt marsh during the last 5,100 years BP suggest that
these environments are able to achieve sustained vertical and lateral growth under rising or
stillstand sea level conditions. Mangroves grow in the upper intertidal flat seaward in response to
high muddy sediment input. However, in the inner sectors of the coastal plain in contact with
coastal plateaus, mangrove has been less influenced by tidal action that has allowed the
development of salt marshes followed by supratidal mangrove. Therefore, salt marsh represents
the geomorphologic, sedimentary and vegetational evolution of mangrove ecosystem situated in
the supratidal zone inundated only by the equinoctial spring tides. This environmental succession
can be observed in Figure 4D.
Mangroves have spread seaward in front of salt marshes and other continental vegetation
on terraces formed by muddy sediment accretion. This is due to the existence of sufficient
muddy sediment supply to accrete and maintain the seaward edge, while salt marshes spread in
direction to mangrove (Figure 4D).
Evaluating risk from coastal hazards
The impact of the natural dynamics and anthropogenic activities in the Bragança Coastal
Plain has made fast and dramatic changes in the landscape. Critical observations of large and
small-scale coastal geomorphology and vegetation provide clues to the natural history, erosion
and accretion degree of the shoreline and potential risk of associated natural hazards for any
specific coastal site. (Young et al. 1996).
Souza Filho (2000) suggests that natural clues have presented coastal-hazard risk
assessing. Coastal erosion and overwash are among the most intense short-term processes that
have affected the coastal area. As mangroves constitute low and flat areas bounded by estuaries
and barrier-beach ridges. Their morphology, vegetation and drainage have been strongly affected
by destructive tidal current and wave attack. On Ajuruteua Island, the barrier-beach ridge has
been strongly eroded and the shoreline recession has changed the high spring tide line landward.
This process is responsible for houses' exposure to waves and longshore current action in the
intertidal zone (Figure 5A). These natural processes have disturbed the daylife of fishermen,
hotel owners and tourists, due to severe coastal erosion and shoreline recession. Therefore, in
erosional barrier-beach ridges, the mangrove ecosystems will be reached and eroded too.

166
The anthropogenic impacts are most related to the opening of roads over the mangroves
to access the beaches (Figure 5B) and unplanned coastal land use, as well as the drops of solid
wastes and groundwater contamination (Souza Filho 2000). Along the Bragança-Ajuruteua road
there is an area where the mangrove ecosystems were deforested and the geological, chemical
and biological characteristics were completely modified. These environmental changes are
responsible for climatic modifications on mangrove ecosystems that will be very difficult to
discern from modifications due to anthropogenic actions and episodic natural events (Kjerfve
and Macintosh, 1997). Moreover, because mangrove proximity to coastal settlements, they have
been subject to dramatic human stressors responsible for decrease in mangrove area (Schaeffer-
Novelli and Citrón-Molero 1999).
Figure 5- Natural and anthropogenic impacts on coastal area. A) Shoreline recession from Ajuruteua Beach, where houses are situated in the intertidal zone underwent to waves and currents attack. B) Mangrove ecosystem deforestation along Bragança-Ajuruteua road.
DISCUSSION AND CONCLUSION
Mangrove ecosystems have showed be an excellent geological indicator in the coastal
zones to detect and quantify short-term changes. They are a good marker of shoreline changes in
macrotidal dominated setting due to be easily recognized in aerial photographs, airborne and
spaceborne SAR and orbital optical sensor imageries. The ortho-rectification of the remote
sensing data allows comparing images from different sensors (optical and microwave) on various
platforms (airborne and spaceborne) showing an absolute accuracy. The digital image processing
permitted the recognizing of the coastal sedimentary environments what became possible the
mangrove mapping associated to field survey.
A B

167
Mangroves as geological indicator usually represent the integrated response of the coastal
zone to a number of interacting geological parameters and environmental variables. It may be
difficult to establish a single cause of a change in coastal positions, morphology, erosion, human
impacts, or a change in the rates; frequency or intensity of coastal processes (Forber and
Liverman 1996). However, the effective use of mangrove as indicator depends on a thorough
understanding of coastal processes operating in the study area, such as waves, tides, currents and
sedimentary dynamic.
There is no doubt that sensibility of mangrove ecosystem to register coastal changes from
years to decades time scales become it a potential geological indicator able to detect and quantify
the modification along the coastal zone. Mangrove may be used as qualitative indicator for
managing a particular stretch of coastline related to natural and human action. Therefore,
mangrove as geological indicator should help to assess environmental changes important for the
attainment of sustainability, and for ecosystem management, environmental impact and
risk/hazard assessment.
Acknowledgement
The authors are grateful to reviewers for their helpful comments of the manuscript. The
author would like to thank CAPES for Ph.D. scholarship, Ph.D. Carmen Pires Frazão for English
review and home institution.
REFERENCES
Berger, A. R. 1996. The geoindicartor concept and its application: an introduction. In: Berger, A.
R. and Iams, W. J. (ed.) Geoindicators: assessing rapid environmental changes in earth
systems. Rotterdam, Balkema. p. 1-14.
Forber, D. L. and Livernam, D. G. E. 1996. Geological indicators in the coastal zone. In: In:
Berger, A. R. and Iams, W. J. (ed.) Geoindicators: assessing rapid environmental changes in
earth systems. Rotterdam, Balkema. p. 175-192.
Kjerfve, B. and Macintosh, D. J. 1997. The impact of climatic change on mangrove ecosystems.
In: Kjerfve, B.; Lacerda, L. D.; Diop, E. H. S. (eds.). Mangrove ecosystem studies in Latin
America and Africa. Paris, UNESCO, p.1-7

168
Schaeffer-Novelli, Y. and Citrón-Molero, G. 1999. Brazilian mangroves: a historical ecology.
Ciência & Cultura Journal, 51(3/4): 274-286.
SOUZA FILHO, P. W. M., 2000a. Impactos naturais e antrópicos na planície costeira de
Bragança. In: Prost, M. T. and Mendes, A. C. (eds.), Impactos Ambientais em Áreas
Costeiras: Norte e Nordeste do Brasil e Guiana Francesa. Belém, Mus. Par. Emílio
Goeldi/UNESCO. (In press).
Souza Filho, P. W. M. and El-Robrini 1996. Morfologia, processos de sedimentação e litofácies
dos ambientes morfosedimentares da Planície Costeira Bragantina - Nordeste do Pará (Brasil).
Geonomos, 4 (2): 1-16.
Souza Filho, P. W. M. and El-Robrini 1998. As variações do nível do mar e a estratigrafia de
sequências da Planície Costeira Bragantina - Nordeste do Pará, Brasil. Boletim do Museu
Paraense Emílio Goeldi, Série Ciências da Terra, 10: 1-34.
Toutin, T. 1995. Multisource data integration with an integrated and unified geometric modeling.
In: Askne, J. (ed.). Sensors and environmental applications of remote sensing. Rotterdam,
Balkema. p. 163-174.
Woodroffe, C. 1992. Mangrove sediments and morphology. In: Robertson, A.I. and Alongi, D.
M. (eds.). Tropical mangrove ecosystems. Washington, AGU. p.7-41
Young, R. S.; Bush, D. M.; Pilkey, O. H. 1996. Evaluating shoreline change and associated risk
from coastal hazards: An inexpensive qualitative approach. In: Berger, A. R. and Iams, W. J.
(ed.) Geoindicators: assessing rapid environmental changes in earth systems. Rotterdam,
Balkema. p. 193-206.

169
4.3. GEOMORPHOLOGY, LAND-USE AND ENVIRONMENTAL HAZARDS IN
AJURUTEUA MACROTIDAL SANDY BEACH, NORTHERN BRAZIL.
ABSTRACT
The Ajuruteua macrotidal sandy beach in northern Brazil extends along one of the largest
mangrove coast of the world, with almost 6,000 km2. The coastal zone evolution is related to a
submerging coast, coupled with falling relative sea level from 5,200 years B.P. and muddy flat
progradation from riverine sediment supply. The Ajuruteua Beach has a flat, linear and elongated
form and is bounded by ebb-tidal deltas. Based on relative tidal level, the barrier-beach ridge was
subdivided in three zones: supratidal zone, where are found dunes and berm, intertidal zone
(high, mean and low intertidal zone) and subtidal zone. The Ajuruteua shoreline is subject to two
distinct coastal processes and can be subdivided in two sectors: 1) Northwestern (NW) Sector,
very vulnerable to shoreline recession with rates of -2.21 m/month; and 2) Southeastern (SE)
Sector, which remains stable or with shoreline accretion with rates of +1.46 m/month. Building
displacement from shoreline to coastal dunes owing severe coastal erosion in the NW Sector
marks the present beach use. The risks of coastal hazards are related to shoreline change rating
and the NW Sector is considered as a high risk area, while the SE Sector is considered as a
moderate risk area. The coastal land use has not been regulated, and is occurring an unsustainable
exploitation of the natural landscape. In response to this beach settlement, the natural process of
shoreline retreating has been an emergent coastal problem.
Additional Index Words: Coastal geomorphology, mangrove coast, remote sensing, beach
profiles, beach erosion.
INTRODUCTION
The Ajuruteua Island is located near the northern Brazilian coast in the State of Pará. This
area occurs along one of the largest mangrove systems of the world, with almost 6,000 km2
(HERZ, 1991), along the coasts of the states of Pará and Maranhão. This coast has macrotidal
beaches, which show visible changes over periods of time ranging from hours, days, months and
years. They also represent one of the most important natural and economic resources of
northeastern region of the State.

170
During the last three decades, dunes and beaches became settlement area due to the
increase of tourism, which depends largely on the beaches. An important fact was the building of
36 km of the PA-458 Road over a mangrove system, between the town of Bragança and
Ajuruteua Beach, which created serious environmental problems for both beach and mangrove.
Beaches can be viewed as systems in dynamic equilibrium, where the sea level, wave and tidal
energy, beach sediment supply and position in space are interdependent factors, which control the
coastline development (PILKEY, 1991).
The study site constitutes a submerging coast coupled with falling relative sea level
during the Holocene and riverine sediment supply has allowed the muddy flat progradation
(SOUZA FILHO and EL-ROBRINI, 1998). However, nowadays the shoreline is subject to retreat
and coastal problems associated to erosion has been emergent. Problems related to natural
dynamics and land occupation have been very well studied along the Brazilian coast (ANGULO,
1996; SOUZA and SUGUIO, 1996; MENDES et al., 1997; SOUZA FILHO, 2000a). This study
is believed to become helpful in beach use planning, zoning and regulation. The main objectives
are the following: 1) provide an overview of the geomorphology of the Ajuruteua macrotidal
sandy beach; 2) describe its present land-use; and 3) analyze the hazard impacts in the coastal
environment and their implications on the coastal population settlement.
STUDY SITE
The Bragança Coastal Plain is situated in the northeastern part of the State of Pará along
the northern Brazilian mangrove coast (Figure 1). Geologically, the area is located in the
Bragança-Viseu coastal basin of Cretaceous age, whose its evolution is controlled by normal
faults reaching the present coastal zone. The structural framework of this coastal basin is
responsible for a submergence of the coastal zone (SOUZA FILHO, 2000b).
The coastal study site is developed over Tertiary deposits of the Barreiras Group and
Pirabas Formation. These deposits constitute the coastal plateaus near the northern coast of
Brazil, which forms inactive and active cliffs in the coastal plain (SOUZA FILHO and EL-
ROBRINI, 2000). The coastal plain extends northward of the coastal plateaus for more than 20
km, where occur wide tidal flats, to the shoreline dominated by marine processes. The major
coastal environments observed in the Ajuruteua Island are tidal mudflats (mangrove), sandflats,
chenier sand ridges, coastal dunes, barrier-beach ridges and ebb-tidal deltas (Figure 2).

171
Figure 1- Localization map of the study area based on Landsat TM band 5.
A wet season from December to May and a dry season from June to November mark the
climate. Geographically, the are is located 1º S of the equator, trade winds blow from the
northeast throughout the year, more strongly during the dry season. The average annual rainfall
reaches 2,500 mm and the mean tidal range measures around 4 m in a semi-diurnal cycle,
although this range during the spring tides is locally as high as 6 m. Thus, during the spring tides
large areas of the low land are inundated by water as a result of both high rainfall-runoff rates and
tidal inundation (KJERFVE et al. 2000). Strong tidal currents and waves are responsible for
erosion of mangroves along the coast, estuaries and bays, where lines of fallen mangrove trees
mark the eroded places. On the other hand, new mangrove fringes are prograding seaward in
314OOOm E. 15 18 20 32 2 OOOm E.
R o o_ o CM
10-
08-
06-
O
Ajuruteua Beach
N
A
Mangrove
B
Study Area
Brazi
A
Braganç
i\) _o o o g
-10
08
-06
o
D Coastal plateaus □ Coastal piai 2 km
3l4000rn E, 16 18 20 32200011) E,

172
response to muddy sedimentation. The net shore drift direction responsible for sediment transport
along the coast presents two main directions along the Ajuruteua Island (Figure 2). In the
Ajuruteua Beach, shore drift direction changes from one coastal sector to another due to the
variations in coastal orientation and nearby oceanographic conditions.
Figure 2- Geomorphologic landforms and shore drift directions on the Ajuruteua Island. Observe the beach localization 1) Pescadores, 2) Ajuruteua, 3) Farol, 4) Buçucanga and 5) Chavascal beaches.
N
/
A
rst
905800
3 km
39 0769 p|
_ 9910461
Legend
Ebb-Mal delia Sandflat Coastal dunes
PHiiHj Barrier-beach ridge Chenier sand ridge Intertidal mangrove
Shore dritt dtrection Net shore dritt directlon
»"<ave crest direction
-9
316029
A

173
METHODS
The coastal zone mapping was carried out in Geographical Information System (GIS-
ArcView Software) from TM Landsat and RADARSAT-1 image processing. The land-use was
mapped and monitored with obliquous air photographs and panoramic photographs from 1995 to
1999, while the coastal environmental hazard impacts were described and monitored along the
same period. Topographic profiles to characterize the beach morphology and evaluate the short-
term coastal changes were gathered normal to coastline from tidal flat (mangrove) to low spring
tidal level. Hence, each littoraneous feature was measured and positioned in relation to tidal level.
The analysis of short-term variability in shoreline position was quantified through five sets of
monthly beach profile measurements. Five benchmarks were established at approximately 400 m
intervals along the 3.0 km of Ajuruteua shoreline (Figure 3). The beach profiles were carried out
at approximately spring low tide from March 1998 to March 1999 through the EMERY (1961)
method of beach profiling.
Figure 3- Localization of shore-normal transects used to measure short-term changes in shoreline position.
Northweasl Sector
1 km P5
P4
P3
P2
Southeasí Sector
P1
Legend
I' - H Ebb-tidal delta Coastal dunes
r I Barrier-beach ridge Chenier sand ridge Intertidal mangrove
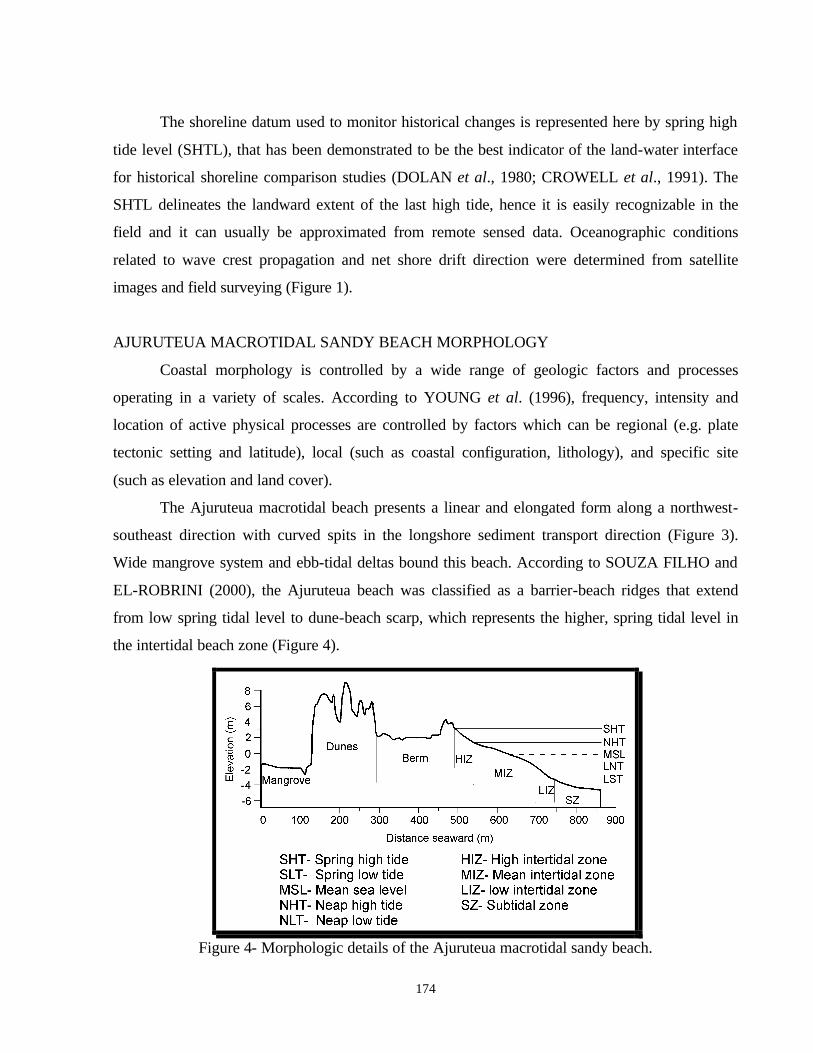
174
The shoreline datum used to monitor historical changes is represented here by spring high
tide level (SHTL), that has been demonstrated to be the best indicator of the land-water interface
for historical shoreline comparison studies (DOLAN et al., 1980; CROWELL et al., 1991). The
SHTL delineates the landward extent of the last high tide, hence it is easily recognizable in the
field and it can usually be approximated from remote sensed data. Oceanographic conditions
related to wave crest propagation and net shore drift direction were determined from satellite
images and field surveying (Figure 1).
AJURUTEUA MACROTIDAL SANDY BEACH MORPHOLOGY
Coastal morphology is controlled by a wide range of geologic factors and processes
operating in a variety of scales. According to YOUNG et al. (1996), frequency, intensity and
location of active physical processes are controlled by factors which can be regional (e.g. plate
tectonic setting and latitude), local (such as coastal configuration, lithology), and specific site
(such as elevation and land cover).
The Ajuruteua macrotidal beach presents a linear and elongated form along a northwest-
southeast direction with curved spits in the longshore sediment transport direction (Figure 3).
Wide mangrove system and ebb-tidal deltas bound this beach. According to SOUZA FILHO and
EL-ROBRINI (2000), the Ajuruteua beach was classified as a barrier-beach ridges that extend
from low spring tidal level to dune-beach scarp, which represents the higher, spring tidal level in
the intertidal beach zone (Figure 4).
Figure 4- Morphologic details of the Ajuruteua macrotidal sandy beach.
111 -4 jMangrove|
100 200 300 400 500 600 700 800 900 Distance seaward (m)
SHT- Spring high tide SLT- Spring low tide MSL- Mean sea levei NHT- Neap high tide NLT- Neap low tide
HIZ- High intertidal zone MIZ- Mean intertidal zone LIZ- low intertidal zone SZ- Subtidal zone

175
Based on relative tidal levels (WRIGHT et al. 1982), the barrier-beach ridge was subdivided
in three zones (Figure 4):
1) Supratidal zone (backshore): extends above the high spring tide level that coincides with
the topographic boundary (dune-beach scarp). This zone is constituted by transverse vegetated
coastal dunes 7 m high, followed by berm situated 1m under spring high tide level (SHTL).
However, it is separated from the high intertidal zone by berm crest 1 m above SHTL.
2) Intertidal zone: occurs between high and low spring tide level. This zone is subdivided in
three sub-zones along of 1,100 km2. The high intertidal zone extends for almost 50 m from spring
high tide to neap high tide level with mean gradient of 1:23; the mean intertidal zone with almost
160 m is centered between neap high tide and neap low tide level (gradient of 1:53), while the
low intertidal zone extends for around 50 m from neap low tide to spring low tide level with a
gradient of 1:27.
3) Subtidal zone: represents the lower area of the beach profile and occurs under spring low
tide level, extending to the breaker zone with a gradient of 1:86.
SHORT-TERM BEACH CHANGES
Beach morphology and shoreline changes could be very well documented by topographic
profiling techniques that involved repeated measurements along the transect oriented
perpendicularly to the shoreline. Short-term beach profile measurements indicated that the
shoreline position along the study site presented two distinct behaviors during the 13 months
study (Figure 5). Figure 5 shows the variability of shoreline position for each month, measured
from dune to beach scarp in the berm crest, because the beach width (distance between beach
scarp and high water level-HWL) during the spring tide is zero. The shoreline variability occurs
mainly during equinoctial period (March and September), when the tidal ranges are higher,
reaching up to 6m.
During the period of study, the end point rate (EPR) method was used to calculate rates of
shoreline change (DOLAN et al., 1991). The method involved measurements of the differences
between shoreline positions with time based only in two shoreline positions (the earliest and
latest dates).
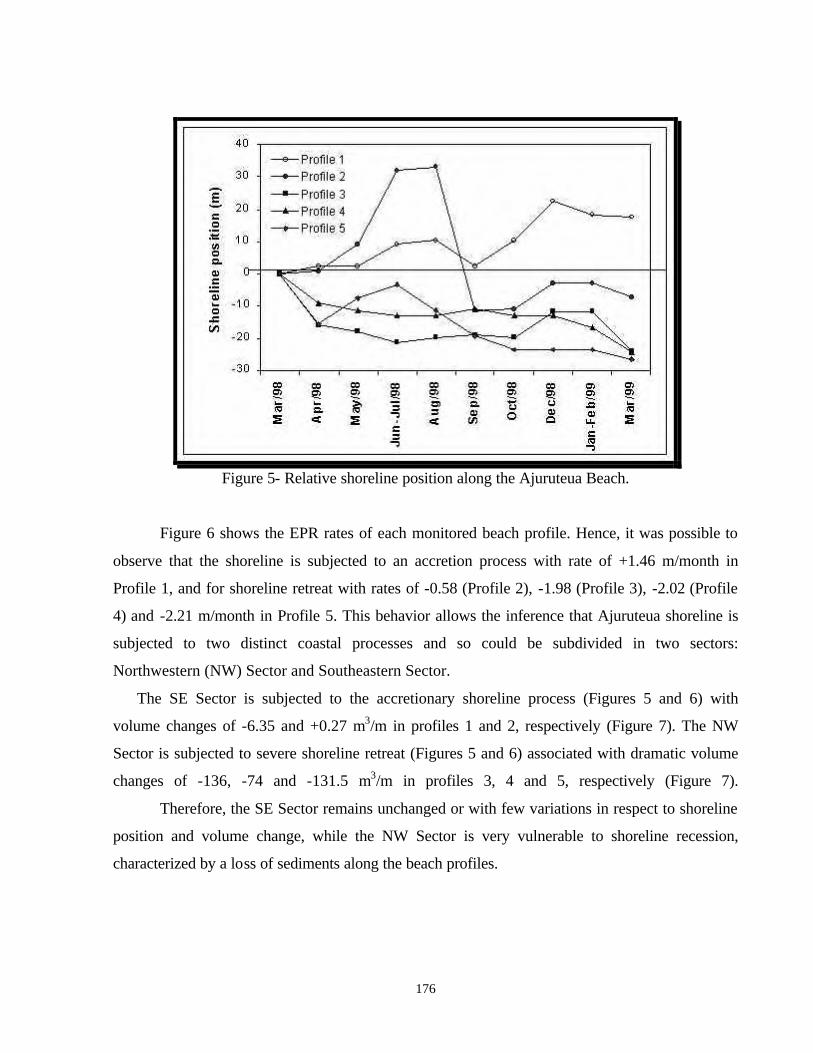
176
Figure 5- Relative shoreline position along the Ajuruteua Beach.
Figure 6 shows the EPR rates of each monitored beach profile. Hence, it was possible to
observe that the shoreline is subjected to an accretion process with rate of +1.46 m/month in
Profile 1, and for shoreline retreat with rates of -0.58 (Profile 2), -1.98 (Profile 3), -2.02 (Profile
4) and -2.21 m/month in Profile 5. This behavior allows the inference that Ajuruteua shoreline is
subjected to two distinct coastal processes and so could be subdivided in two sectors:
Northwestern (NW) Sector and Southeastern Sector.
The SE Sector is subjected to the accretionary shoreline process (Figures 5 and 6) with
volume changes of -6.35 and +0.27 m3/m in profiles 1 and 2, respectively (Figure 7). The NW
Sector is subjected to severe shoreline retreat (Figures 5 and 6) associated with dramatic volume
changes of -136, -74 and -131.5 m3/m in profiles 3, 4 and 5, respectively (Figure 7).
Therefore, the SE Sector remains unchanged or with few variations in respect to shoreline
position and volume change, while the NW Sector is very vulnerable to shoreline recession,
characterized by a loss of sediments along the beach profiles.
- -10
CO CO 00 CO CO CO CO CO O; OJ o> o> 2
o> ç o> © © © u. W u. a. % 3 à 3 s.
0) l/l
B o 0) o OJ LL
k— fO S «£ S "5 «c o s
na -a

177
Figure 6- Plot of shoreline rate of change values for the Ajuruteua Beach. Rates were calculated using EPR method.
Figure 7- Beach profiles and volumes changes on the Ajuruteua Beach.
ã -o .E cc Q. UJ
1,46
| -0.583 4
-1,98 ,0 a ■
PI P2 P3 P4 P5 Shore-normal beach profiles
March 1998 March 1999
VOLUME CHANGE = - 6,35 m3/m
Um 1 Mi
VOLUME CHANGE = 0,27 m3/m
VOLUME CHANGE = - 136 m3/m
VOLUME CHANGE = -74 m3/m
VOLUME CHANGE = - 131,5 0 50 100 150 200 250
Distance seaward (m)
178
PRESENT BEACH USE
The Ajuruteua Beach is located 36 km far from Bragança. The land use in this beach
begun from 70's, when Buçucanga and Chavascal beaches were destroyed by intense erosive
processes responsible for shoreline retreat. The waves and tides eroded the backshore zone and
the intertidal zone migrated landward reaching the dunes. Hence, the land use area in those
beaches was removed and people who lived there moved to Ajuruteua, and tourism also began at
this time.
Today, the Ajuruteua Beach constitutes the more important tourism point of the Bragança
area. The population of Ajuruteua is almost 200 people, however during the summer holiday
more than 20,000 people way arrives in Ajuruteua by excursion buses and cars during a single
weekend. From the GIS it was possible determine that Ajuruteua dune-barrier beach ridge has an
area of 1,100 m2 and an perimeter of 6,851 km. Therefore, during the summer the beach remains
completely crowded.
With the development of "wild area" tourism, a lot of vocation wood houses and hotels
have been built over dunes and backshore zone along all shoreline for tourists to stay and rest
from the beach (Figure 8). However, due to short-term shoreline retreat in the NW Sector,
buildings have been constantly moved from shoreline to coastal dunes due to severe coastal
erosion (Figure 9). On the other hand, in the SE Sector, characterized by shoreline stabilization,
the buildings have been built at least 10 m backward from the shoreline. Owing to this temporary
stability, it was observed an increase in buildings during the last 3 years and the berm crest with
vegetated dunes began to be destroyed. Moreover, due to the macrotidal characteristics of the
beach, the intertidal zone is usually used by tourists for parking cars during the low water level.
Therefore, the present coastal use in Ajuruteua Beach is based on geomorphological
characteristics. Where seaside resorts have been subjected to shoreline retreat, people have
moved or abandoned structures that have been built for recreational use and tourist
accommodation (Figure 9).

179
NATURAL PROCESSES TO COASTAL-HAZARD RISK ASSESSMENT
When human developments are placed in the path of coastal processes, natural events
become geologic hazards from the human perspective (YOUNG et al. 1996). Hence, coastal
problems are made by man, because if no one lived on the shore, there would be no problem
(PILKEY, 1991).
Figure 8- Overview of coastal land use in the Ajuruteua Beach
Figure 9- The Ajuruteua Beach under high spring tide conditions. Observe the beach width and the remains of houses in the high intertidal beach zone destroyed owing to shoreline retreat.
r»
T.

180
Along the Ajuruteua Beach, a considerable number of environmental features provide
information to the active physical processes in the shoreline, its natural history, and the
associated natural hazards. Therefore, the parameters for evaluating site-specific risks from
coastal hazards along the Ajuruteua shoreline are related to elevation, area landward of site, each
width and morphology, coastal shape, dune and berm configuration, overwash, site position in
relation to ebb-tidal deltas, incidence angle of waves, shore drift and shoreline change rates.
The general parameters are related to elevation and area landward of site, represented by
mangroves. The study site is constituted mainly of flat lowland areas, whose high spring tidal
level reaches the dune scarp northeastward and mangrove backward. During this tidal conditions,
only 506 m2 of total areas of dunes and berm remain emerged.
The Ajuruteua barrier-beach ridge forms an arc along a NW-SE direction. This coastal
shape and presence of ebb-tidal deltas are responsible for generation of shore drift in two
opposite directions (Figure 2). The evolution of the Chavascal ebb-tidal delta is related to a shore
drift direction from SE to NW, which produces sedimentary transport in direction to the tidal
channel, while the shore drift southeastward is responsible for sedimentary development of the
spit in the Barca ebb-tidal delta that established the shoreline along the SE Sector. Therefore, the
net shore drift controls the evolution of ebb-tidal delta, whose position migrates along the time
changing the coastal shape configuration, representing a specific-site risk of coastal hazard.
Overwash processes occur frequently along the shoreline where berm crest is absent. For
instance, in the NW Sector, the shoreline is submitted to severe erosion and there are no berm
crests. However, in the SE Sector, where the berm crest is well-developed erosion is not
observed, what is evidence of coastal stability.
The main parameter to evaluate areas of risk of coastal hazard is related to shoreline
change rates. In the NW Sector, the shoreline is rapidly retreating at a rate of up to -2.21
m/month. In this sector, the buildings have suffered from strong coastal erosion and wave and
tidal current power. Hence, the houses had to be moved landward or abandoned. In this case, the
cesspools of houses stay exposed in high intertidal beach zone in response to coastal retreat
(Figure 9), while the waste is disposed in the backshore near the mangrove ecosystem. Therefore,
this sector is considered as high-risk area.

181
In the SE Sector, the shoreline change rates are around +1.46 m/month. Hence the beach
is submitted to an accretionary process, where buildings are located near from dune ridges.
Hence, this sector is considered as moderate risk area.
CONCLUSIONS
Ajuruteua sandy beach has a particular morphology associated to macrotidal
environments with wave action. In the last two decades, activities in Ajuruteua beach have been
considerably increased owing to the building of the Bragança-Ajuruteua road. During this time,
the coastal land use has not been regulated, and an unsustainable exploitation of the natural
landscape occurs. In addition, natural processes related to sediment supply, wave and tide energy
and sea level are the primary causes of coastal changes, whereas human activities are catalysts
that cause disequilibrium conditions, which accelerate changes (MORTON et al. 1996).
Moreover, the physical characteristics of the coastal plain such as lowland coastal topography,
mangrove occurring landward of the beach, flat morphology, concave coastal shape, dune and
berm configuration, site position in relation to ebb-tidal deltas, shore drift, and principally
shoreline change rates make Ajuruteua Beach a place of high risk for coastal hazards assessment
and very susceptible to sea level rise. Hence, the shoreline recession rates and negative volume
changes observed along the beach have shown an emergent problem of coastal erosion.
An effective coastal management plan must be implemented based on geologic
frameworks and on an understanding of changes in natural processes on both geologic and
historical scales. A possible future land use planning can be based on coastal setbacks provisions,
which would establish a safety distance between buildings and the active coastal zone,
characterized by wide mangroves and macrotidal beaches. Hence, there would be a guaranty of
space for the beach move naturally, both during neap and spring tides.
ACKNOWLEDGEMENTS
The authors would like to thank Geology and Geochemistry Undergraduate Course for
financial support to fieldwork survey. We owe our thanks to Prof. Dr. Björn Kjerfve and
reviewers for their helpful comments on the manuscript, Marcos G. Lima Silva for his help in
graphic design and Afonso Quaresma for his help during fieldwork. The first two authors are

182
grateful to CAPES and CNPq respectively, for a Ph.D. scholarship, and the third author would
like to thank CNPq for a research grant during this investigation.
LITERATURE CITED
ANGULO, J.A., 1996. Natural dynamics and land-use on the coast of Paraná, Brazil: background
and perspective. Anais da Academia Brasileira de Ciências, 68, 383-388.
CROWELL, M.; LEATHERMAN, S.P.; BUCKLEY, M.K. 1991. Historical shoreline change:
error analysis and mapping accuracy. Journal of Coastal Research, 7, 839-852.
DOLAN, R.; FENSTER, M.S.; HOLME, S.J. 1991., Temporal analysis of shoreline recession
and accretion. Journal of Coastal Research, 7, 723-744.
DOLAN, R.B.; HAYDEN, B.P.; MAY, P. 1980. The reliability of shoreline change
measurements from aerial photographs. Shore and Beach, 48, 22-29.
EMERY, K.O., 1961. A simple method of measuring beach profiling. Limnology and
Oceanography, 6, 90-93.
HERZ, R., 1991. Manguezais do Brasil. IOUSP/CIRM, São Paulo, Brazil.
KJERFVE, B.; PERILLO, G.M.E.; GARDNER, L.R.; RINE, J.M.; DIAS, G.T.M.; REBELO-
MOCHEL, F., 2000. Morphodynamics of muddy environments along the Atlantic coast of
North and South America (in press).
MENDES, A.C.; SILVA, M.S.; FARIA Jr., L.E.C., 1997. A expansão urbana e seus efeitos
danosos ao meio ambiente da Ilha do Atalaia-Salinópolis/PA. In: Costa, M.L. and Angélica,
R.S. (eds.), Contribuições à Geologia da Amazônia. Belém, SBG-NO, pp. 359-396.
MORTON, R.A., 1996. Geoindicators of coastal wetlands and shorelines. In: Berger, A. R. and
Iams, W. J. (eds.), Geoindicators: assessing rapid environmental changes in earth systems.
Rotterdam, Balkema. pp. 207-230.
PILKEY, O.H., 1991. Coastal erosion. Episodes, 14, 46-51.
SOUZA, C.R.G. and SUGUIO, K., 1996. Coastal erosion and beach morphodynamics along the
State of São Paulo (SE Brazil). Anais da Academia Brasileira de Ciências, 68, 405-424.
SOUZA FILHO, P. W. M., 2000a. Impactos naturais e antrópicos na planície costeira de
Bragança. In: Prost, M. T. and Mendes, A. C. (eds.), Impactos Ambientais em Áreas
Costeiras: Norte e Nordeste do Brasil e Guiana Francesa. Belém, Mus. Par. Emílio
Goeldi/UNESCO. (In press).

183
SOUZA FILHO, P. W. M., 2000b. Tectonic control on the coastal zone geomorphology of the
northeastern Pará State. Revista Brasileira de Geociências, 30, 523-526.
SOUZA FILHO, P. W. M. and EL-ROBRINI, M., 1998. As variações do nível do mar e a
estratigrafia de sequências da Planície Costeira Bragantina - Nordeste do Pará, Brasil.
Boletim Museu Paraense Emílio Goeldi, Série Ciências da Terra, 10, 1-34.
SOUZA FILHO, P. W. M. and EL-ROBRINI, M., 2000. Coastal Zone Geomorphology of the
Bragança Area, Northeast of Amazon Region, Brazil. Revista Brasileira de Geociências, 30,
518-522.
WRIGHT, L.D.; NIELSEN, P.; SHORT, A.D.; GREEN, M.O., 1982. Morphodynamics of a
macrotidal beach. Marine Geology, 50, 97-128.
YOUNG, R. S.; BUSH, D. M.; PILKEY, O. H., 1996. Evaluating shoreline change and
associated risk from coastal hazards: An inexpensive qualitative approach. In: Berger, A. R.
and Iams, W. J. (eds.), Geoindicators: assessing rapid environmental changes in earth
systems. Rotterdam, Balkema. pp. 193-206.
184
4.4. IMPACTOS NATURAIS E ANTRÓPICOS NA PLANÍCIE COSTEIRA DE BRAGANÇA
ABSTRACT The impact of the natural dynamics and anthropogenic activities in the Bragança Coastal
Plain has made fast and dramatic changes in the landscape. The erosion and accretion of the
shoreline are affecting both the mangroves and daylife of the local population. The anthropogenic
impacts are most related to the opening of roads to the beaches and unplanned coastal land use, as
well as the drops of solid wastes and groundwater contamination.
The integration of the several parameters studied here allowed to suggest some important
rules to the future coastal land use. This was also based on the concepts of geo-environmental
units. It is suggested that a strong coastal management directed to the sustainable development of
this area represents one of the main points that could allow the future reduction of the
anthropogenic impacts.
Key words: coastal dynamics, anthropogenic impacts, land use, Bragança region.
INTRODUÇÃO
As áreas litorâneas possuem uma riqueza significativa de recursos naturais, que
apresentam um grande potencial turístico. Contudo, a intensidade de ocupação desordenada vem
colocando em risco este frágil ecossistema costeiro.
Os ambientes costeiros na área de Bragança vem sofrendo constantes modificações
naturais, como a migração de barras arenosas e canais de maré, formação de novas áreas costeiras
devido a progradação de depósitos de manguezais, desenvolvimento de áreas pantanosas
colonizadas por gramíneas e erosão e acreção de praias.
Atualmente, o homem está continuamente interagindo com o ambiente natural,
produzindo modificações no sistema costeiro, como por exemplo, a degradação de manguezais,
através da construção de estradas de acesso às praias; utilização de areias de dunas na construção
civil; construção de casas sobre os campos de dunas e a pós-praia, entre outras formas de
agressão. Portanto, tentar entender a relação entre as atividades antrópicas e os processos naturais
nos ecossistemas costeiros é importante para planejar um desenvolvimento sustentável.

185
Conhecer melhor a dinâmica de funcionamento dos ambientes costeiros e estuarinos
permitirá trazer novos dados científicos e tecnológicos necessários para o monitoramento e
manejo dessas áreas, uma vez que não se pode conservar adequadamente ambientes sem
conhecê-los e sem entender a relação que existe entre ele e o homem. Assim, este trabalho tem
como objetivo fornecer informações sobre a região costeira de Bragança relacionadas às
modificações causadas por fatores naturais e antrópicos, além de utilizar tais informações com o
intuito de propor um melhor uso das áreas costeiras baseado em um planejamento geoambiental.
CENÁRIO REGIONAL
O embasamento da planície costeira é formado por sedimentos terciários do Grupo
Barreiras que constitui o Tabuleiro Costeiro. Os tabuleiros apresentam uma superfície plana
arrasada, suavemente ondulada e fortemente dissecada, com cotas entre 50 e 60m, que diminuem
progressivamente em direção à planície costeira, a norte. Este contato é marcado por uma
mudança litológica (sedimentos areno-argilosos avermelhados do Grupo Barreiras e lamosos da
planície costeira), vegetacional (floresta secundária e mangue) e morfológica brusca (falésias
mortas de até 1m de altura) (Souza Filho & El-Robrini 1996; 1997).
A Planície Costeira Bragantina, no nordeste do Estado do Pará, apresenta cerca de 40 km
de linha de costa, estendendo-se desde a Ponta do Maiaú até a foz do Rio Caeté (Figura 1). Está
inserida em uma costa embaiada transgressiva dominada por macromaré, cuja compartimentação
geomorfológica apresenta três domínios (Souza Filho 1995): (1) Planície Aluvial, com canal
fluvial, diques marginais e planície de inundação; (2) Planície Estuarina, com um canal estuarino
subdividido em funil estuarino, segmento reto, segmento meandrante e canal de curso superior,
canal de maré, e planície de inundação; e (3) Planície Costeira, com os ambientes de pântanos
salinos (interno e externo), planície de maré (manguezais de supramaré e intermaré e planície
arenosa com baixios de maré), cheniers, dunas costeiras e praias (Figura 1).
A vegetação da Planície Costeira Bragantina é caracterizada pela ocorrência de mangues,
que ocupam 95% de toda a área costeira. Os gêneros dominantes são Rhyzophora. Avicenia e
Lagunculária. Associada a esta vegetação ocorre Spartina sp. e Conocarpus L. A vegetação de
campo nos pântanos salinos é predominantemente Aleucharias sp. (juncos), enquanto que nos
cheniers e campos de dunas, observa-se uma vegetação arbustiva (Souza Filho & El-Robrini,
1996).
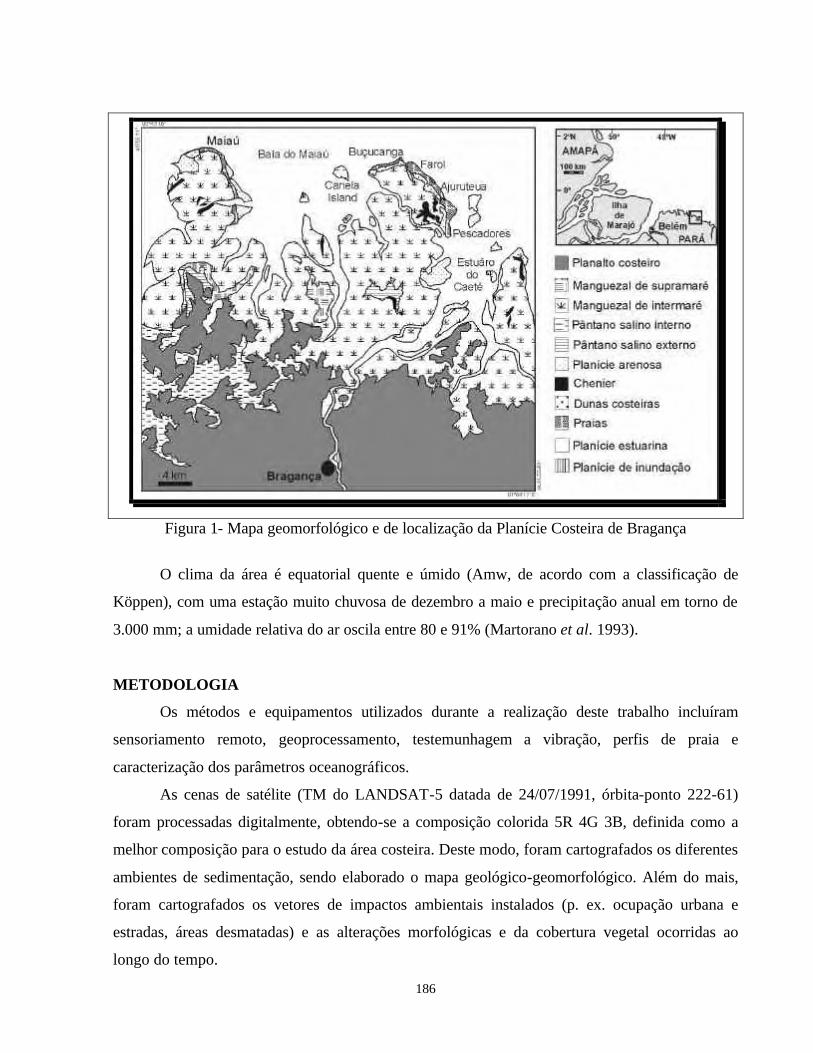
186
Figura 1- Mapa geomorfológico e de localização da Planície Costeira de Bragança
O clima da área é equatorial quente e úmido (Amw, de acordo com a classificação de
Köppen), com uma estação muito chuvosa de dezembro a maio e precipitação anual em torno de
3.000 mm; a umidade relativa do ar oscila entre 80 e 91% (Martorano et al. 1993).
METODOLOGIA
Os métodos e equipamentos utilizados durante a realização deste trabalho incluíram
sensoriamento remoto, geoprocessamento, testemunhagem a vibração, perfis de praia e
caracterização dos parâmetros oceanográficos.
As cenas de satélite (TM do LANDSAT-5 datada de 24/07/1991, órbita-ponto 222-61)
foram processadas digitalmente, obtendo-se a composição colorida 5R 4G 3B, definida como a
melhor composição para o estudo da área costeira. Deste modo, foram cartografados os diferentes
ambientes de sedimentação, sendo elaborado o mapa geológico-geomorfológico. Além do mais,
foram cartografados os vetores de impactos ambientais instalados (p. ex. ocupação urbana e
estradas, áreas desmatadas) e as alterações morfológicas e da cobertura vegetal ocorridas ao
longo do tempo.
| Ranatto costeiro
Manguezal de supramaré
^ Manguezal de intermaré
B Pântano salino interno Pântano sabno oxtorno
[J Planicte arenosa
■ Chemor
!•! Dunas costeiras
19 Praias
Planicio esluanna
I Planície de inundação

187
Os levantamentos de campo foram realizados para identificação da vegetação, ambientes
de sedimentação, processos costeiros naturais, além de um levantamento completo da ocupação e
uso do solo, localização, descrição e registro das ações antrópicas causadoras da degradação
ambiental.
A partir da integração dos dados obtidos nas etapas anteriores foi elaborada a carta
temática geoambiental, cujos objetivos básicos, segundo Mendes et al. (1997) são: (1) registrar as
unidades geológicas-geomorfológicas que retratam o meio físico; (2) registrar o quadro atual da
ocupação antrópica e sua influência sobre o ambiente natural; e (3) apresentar as áreas para as
mais diferentes formas de ocupação das áreas costeiras, respeitando suas particularidades
geológicas, geomorfológicas, botânicas e processos costeiros atuantes, além da legislação
ambiental vigente.
IMPACTO DOS PROCESSOS NATURAIS NA ZONA COSTEIRA BRAGANTINA
Os processos naturais atuantes na zona costeira Bragantina são extremamente energéticos,
o que vem propiciando intensas modificações na paisagem costeira. Segundo Souza Filho (1995),
a posição geográfica do NE do Estado Pará (0o-1o S), aliada a seus embaiamentos costeiros e
grande extensão da Plataforma Continental do Pará/Maranhão, proporciona o desenvolvimento de
um ambiente de alta energia, dominado por macromarés semi-diurnas com amplitudes variando
de 4 a 6 m (DHN 1997), com ondas de até 2 m de altura geradas pelos ventos alísios de NE e
correntes de maré vazante no sentido de SE para NW e correntes de maré enchente no sentido de
NW para SE (DHN 1986). Estes fatores são, em grande parte, responsáveis pelo transporte de
sedimentos, assim como pela orientação dos canais estuarinos do litoral norte do Brasil. Tais
condições hidrodinâmicas influenciam consideravelmente a sedimentação e a dinâmica das áreas
costeiras, tornando-as incomparáveis com os demais setores da costa brasileira.
Erosão da Linha de Costa
Embora o monitoramento das áreas costeiras através da utilização de perfis de praia não
esteja sendo realizado em todas as praias da área de estudo, pode se afirmar, com segurança, que
todas as praias têm sido afetadas por processos erosivos decorrentes, principalmente, da ação das
marés de sizígia de equinócios, que têm provocado o recuo da linha de costa da ordem de até 50
m em um ano de observação (março/1998 a março/99).

188
Na Praia dos Pescadores, eventos erosivos sucessivos vêm afetando constantemente a vida
dos moradores locais. Nos últimos cinco anos, cerca de 500 m da Vila dos Pescadores voltada
para o canal estuarino foram erodidos, sendo os moradores deslocados para outra área mais
segura e livre da ação dos processos costeiros. Na área da praia voltada para o mar, a taxa de
erosão é mais lenta, devido ao perfil de praia dissipativo e o ângulo de incidência das ondas ser
aproximadamente paralela à linha de costa, com ondas com alturas nunca superiores a 1 m.
Na Praia de Ajuruteua, o setor NW vem sendo submetido a um forte processo erosivo
devido sua posição às margens de um canal de maré, ângulo de incidência de ondas em torno de
7º com a linha de costa, alturas próximas a 2m e amplitude de maré variando de 4 a 6,5 m durante
os meses de março e abril. Tais condições propiciaram o recuo de 22 m da linha de costa no
último ano, expondo as casas de veraneio e pousadas à erosão na zona de intermaré (Figura 2A).
Nas praias do Farol e Buçucanga, a ação de ondas e correntes de maré provocam também
o recuo da linha de costa, desenvolvendo escarpas de praia de até 10 m de altura, esculpidas em
dunas longitudinais costeiras, onde ainda é possível observar linhas de deixa formadas por
troncos de árvores de 10 m de altura, que evidenciam a grande energia hidrodinâmica do
ambiente (Figura 2B).
Acreção da Linha de Costa
Enquanto a maioria das praias vem sendo submetida à erosão, um pequeno setor da linha
de costa, com cerca de 1,5 km de extensão, acrescem, devido seu posicionamento as margens de
um canal de maré, onde um amplo delta de maré vazante funciona como uma barreira hídrica e
sedimentar, propiciando a progradação da praia em direção ao mar. Deste modo, graças ao
processo deposicional relacionado ao retrabalhamento de areias da zona de intermaré da praia
pelo vento durante a maré baixa, observa-se a formação de pequenas dunas na base da escarpa de
praia, provocando o alargamento do berma praial e, por conseguinte, a acreção da linha de costa.
Mudanças na Vegetação Costeira
Com a ação dos fortes processos hidrodinâmicos na zona litorânea, o efeito na vegetação
costeira tem sido significante. Mediante a ação de processos deposicionais associados à migração
de bancos de areia sobre os depósitos de manguezais, observa-se à destruição da floresta de
mangues que, mesmo morta por asfixia de suas raízes, permanece em posição de vida, formando
bosques de paliteiros com até 10 m de altura, que em seguida são derrubados pela ação energética
de ondas e correntes de maré, propiciando assim o recuo da linha de costa (Figura 2B).
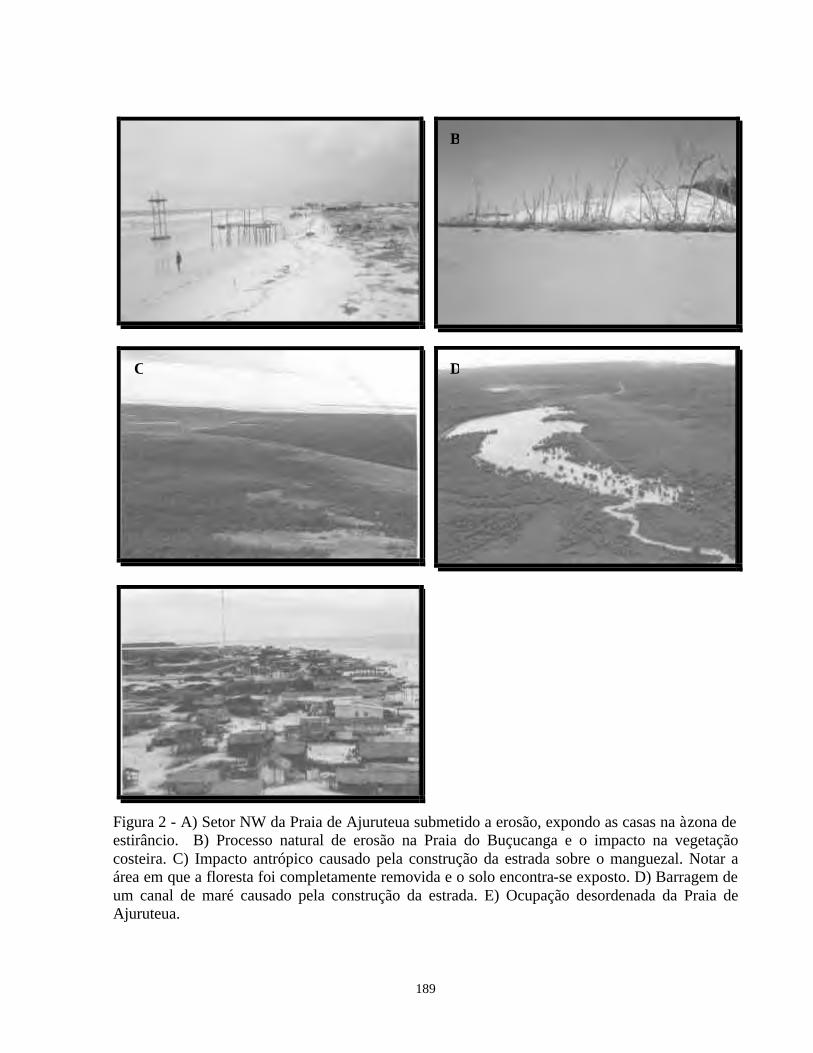
189
Figura 2 - A) Setor NW da Praia de Ajuruteua submetido a erosão, expondo as casas na à zona de estirâncio. B) Processo natural de erosão na Praia do Buçucanga e o impacto na vegetação costeira. C) Impacto antrópico causado pela construção da estrada sobre o manguezal. Notar a área em que a floresta foi completamente removida e o solo encontra-se exposto. D) Barragem de um canal de maré causado pela construção da estrada. E) Ocupação desordenada da Praia de Ajuruteua.
B
C D

190
Em áreas onde predominam os processos de progradação lamosa, a vegetação de mangue
expande-se sobre o substrato lamoso, inicialmente colonizado por spartina sp. gerando uma clara
zonação da vegetação costeira.
IMPACTO DAS ATIVIDADES ANTRÓPICAS NA ZONA COSTEIRA BRAGANTINA
Segundo Nichols & Corbim (1997), para se entender como as áreas costeiras têm sido
afetadas por atividades antrópicas, é necessário saber primeiro qual é a origem dos sedimentos
costeiros, que por sua vez está relacionada à erosão de áreas continentais e ao transporte fluvial
destes sedimentos, e quais são as fontes de sedimentos marinhos que suprem as áreas costeiras.
Portanto, quando analisamos os impactos antrópicos em processos costeiros, se faz necessário
saber que os ambientes costeiros da Planície Bragantina constituem um sistema dinâmico, e
assim, qualquer impacto antrópico que modifique a dinâmica natural, como a construção de
estradas, residências, hotéis e pousadas afetarão os processos costeiros atuantes.
Construção de Estradas de Acesso às Praias
Até o final da década de 70, a falta de acesso às praias da Planície Costeira Bragantina era
visto como um sério problema ao desenvolvimento do turismo na região. No entanto, no início da
década de 80, foi construída a estrada que liga a Cidade de Bragança a Praia de Ajuruteua, o que
sem dúvida alguma deu um grande impulso ao turismo, além de facilitar a vida dos pescadores
locais. Contudo, esta estrada foi construída sobre extensos depósitos da planície de intermaré
lamosa, densamente colonizada por mangue, secionando deste modo, 25 km de manguezais.
Assim, veio a constituir a maior obra de impacto antrópico em áreas costeiras do norte do país,
cujos danos ainda não foram quantificados.
Ao longo dessa estrada, observa-se áreas cuja vegetação de mangue já foi completamente
removida, estando o solo lamoso exposto à incidência direta dos raios solares, que provocam a
formação de gretas de contração, além de desencadear modificações das condições físico-
químicas do solo, que geram certamente prejuízos à atividade biológica (Figura 2C).
Outro problema observado está relacionado à desestruturação de parte da rede de
drenagem, uma vez que diversos canais de maré, responsáveis pela circulação dos nutrientes no
ambiente de manguezal, foram cortados pela estrada, que em alguns trechos funciona como
barragem ao fluxo das marés, gerando enormes áreas com água represada (Figura 3D). Tal

191
modificação tem gerado novas condições ambientais que alteram o funcionamento do
ecossistema de manguezal, desde o processo de sedimentação, condições físico-químicas das
águas até a fauna e flora vivente.
As demais praias da área de estudo (Farol, Chavascal, Buçucanga, Pilão, Picanço, Canela
e Maiaú) encontram-se completamente preservadas, sendo o acesso feito somente por meio
fluvial ou a pés durante as marés baixas.
Ocupação Desordenada das Praias
Os 535 km2 de áreas costeiras em estudo estão pouco ocupados pelo homem. A ocupação
se dá, na maioria das vezes, sobre “ilhas” de terrenos terciários aflorantes em meio à planície de
intermaré lamosa (manguezais). Nas praias a ocupação é desordenada, exceto na Vila dos
Pescadores, onde a grande maioria das casas localiza-se atrás do cordão de dunas fixo; e apenas
uma minoria encontra-se sobre a escarpa de praia, sujeita à ação erosiva de ondas e marés, o que
leva os moradores a desmontarem suas casas, construindo-as posteriormente em áreas mais
protegidas, não influenciadas pela dinâmica praial.
Na praia de Ajuruteua, a forma de uso é inversa, uma vez que toda a linha de escarpa de
praia do setor NW está ocupada por casas e pousadas. Para conter a erosão, alguns moradores
construíram muros de madeira que vem afetando a dinâmica morfo-sedimentar, influindo na
evolução natural do ambiente praial (Figura 3E). Entretanto, o setor SE, submetido a um processo
de acreção da linha de costa, apresenta todas as construções situadas à pelo menos 10 m da
escarpa de praia.
Estudos de monitoramento realizados nestas praias permitirão em breve quantificarmos
exatamente a relação destas formas de ocupação com os processos erosivos e deposicionais
ocorrentes em todas as praias da Planície Costeira Bragantina.
Impacto dos Resíduos Sólidos no Ambiente Costeiro
O volume de lixo sólido depositado no ambiente costeiro constitui uma séria ameaça ao
ambiente praial e manguezal da Planície Costeira Bragantina. Ao longo dos 25 km da planície
costeira, não existe nenhum sistema de coleta de lixo, sendo este depositado regularmente nos
campos de dunas. Seus impactos variam desde a poluição da linha de costa até influências na
saúde da população, e problemas estéticos e econômicos que abalam o turismo da área. Alguns
destes impactos foram muito bem descritos por Simmons (1997) como:

192
Impactos na Fauna e Flora
Estima-se que os resíduos plásticos constituem 60% dos detritos inorgânicos que entram
no ambiente marinho. A degradação deste produto é muito lenta, permanecendo em suspensão no
mar ou retido no fundo por um longo período de tempo. Estes resíduos representam uma ameaça
aos animais marinhos, como pássaros, tartarugas, peixes, crustáceos, etc.
Degradação Física
O grande depósito e a lenta degradação de plásticos (400 anos), vidros (200 anos),
borracha (100 anos), metais (2 anos) e alumínio (não degrada) proporcionam a acumulação dos
resíduos sólidos nos estuários e praias, que são posteriormente retrabalhados e depositados
juntamente com os sedimentos, formando camadas de lixo intercaladas a camadas sedimentares
recentes, marcando períodos de grande acumulação de resíduos (Figura 3A).
Impactos Estéticos e Econômicos
A presença de lixos em áreas costeiras, principalmente, nas praias não é bem visto,
particularmente em áreas onde o turismo é altamente dependente da beleza da praia e de um
ambiente saudável. Logo, um aumento no acúmulo de lixo poderá diminuir a qualidade e beleza
do ambiente e, por conseguinte, diminuir o fluxo de turistas, visitantes e usuários da praia, sendo
isto traduzido em perdas econômicas para pousadas e empresas de turismo, sem contar com os
prejuízos de moradores, pescadores e donos de embarcações.
Impactos na Saúde
Garrafas, copos e latas lançadas nas praias e estuários constituem uma ameaça a banhistas
e demais usuários, que sofrem constantes acidentes. O conteúdo destes detritos em contato com a
pele ou se ingeridos acidentalmente representam um perigo real se tratados de forma imprópria e
inadequada pelos usuários das praias. Além do mais, o lixo e as fossas contaminam os lençóis
freáticos, tornando a água utilizada pela população imprópria ao consumo. Devido a forte erosão
costeira, diversas fossas são encontradas na zona de intermarés das praias (Figura 3B).

193
Figure 3- Impacto dos resíduos sólidos na Praia de Ajuruteua. A)Depósito de lixo (lata, plástico, tijolo, etc) intercalado a camadas de sedimentos arenosos de dunas costeiras; B) Fossas de antigas residências (setas) expostas na zona de intermaré devido ao recuo da linha de costa. Essas fossas representam um perigo a saúde dos banhistas, pois contaminam os lençóis freáticos superficiais, cuja água é utilizada pelos moradores locais.
ESTRATÉGIA DE OCUPAÇÃO DA ÁREA COSTEIRA
A partir da integração dos mapas geológico-geomorfológicos com os processos naturais e
antrópicos observados na área costeira, foi possível identificar e caracterizar áreas apropriadas ou
não ao uso e ocupação do solo, as quais Mendes et al. (1997) denominaram de Unidades
Geoambientais.
Com base no mapa geoambiental (Figura 4), elaborado para a área de estudo, é proposta
uma forma de uso e ocupação da zona costeira, baseado em um planejamento que permita um
desenvolvimento sustentável, conforme descrito abaixo:
Áreas de Preservação Permanente
De acordo com a Resolução nº 004/85 do CONAMA, essas áreas são consideradas
Reservas Ecológicas, sendo representadas na Planície Costeira Bragantina pelos ecossistemas de
manguezal, pântanos salinos, dunas costeiras incluindo os cheniers, planícies arenosas e praias e,
os ecossistemas estuarinos (canal estuarino e planície de inundação). Além das características
ecológicas peculiares destes ecossistemas, essas áreas são inadequadas à urbanização por estarem
sujeitas a processos naturais como erosão, deposição, inundação, marés, ondas, ação eólica, etc.,
os quais dificultam sobremaneira a construção de obras de engenharia.
B
/ r mpr'-
Up

194
Áreas Adequadas à Ocupação
Representam áreas cujas características geológicas-geomorfológicas e ambientais atuais (a
floresta nativa já foi destruída nos primórdios da década de 60) favorecem sua urbanização,
principalmente por estarem localizadas sobre o Tabuleiro Costeiro, sustentado por sedimentos
terciários do Grupo Barreiras. Há a necessidade de avaliação do impacto sobre a cobertura
vegetal e rede de drenagem a ser atingida.
Figura 4- Mapa geoambiental da Planície Costeira de Bragança.
cc^yir ^ j
1 .
Area cie preservação permanente
Áreas Adequadas a ocupação
Áreas de nsco a ocupação
/ Costa esluanna
Costa aberta
^ Estradas
Áreas degradadas
195
Áreas de Risco à Ocupação
Correspondem às áreas que apresentam restrições ao uso do meio físico, dispondo apenas
de condições parciais de suporte a projetos de urbanização. São necessários cuidados especiais a
fim de se evitar problemas ambientais, geológicos e geotécnicos que possam ocorrer nas áreas de
risco, como as margens das paleofalésias, dos rios e estuários. Existe ainda a preocupação com a
emissão dos efluentes nos sistemas estuarinos e costeiros, devido a sua proximidade.
Áreas Degradadas
Constituem áreas situadas na unidade geoambiental de preservação permanente,
submetidas a impactos antrópicos que degradaram o meio físico. Essas áreas são representadas
pela ocupação desordenada das praias, devastação de florestas de mangue, formação de novos
ambientes (lagos) e estradas que seccionam os manguezais. Entretanto, caso essas ações tivessem
sido planejadas, seus impactos ambientais poderiam ter sido minimizados.
RECOMENDAÇÕES PARA REDUZIR A VULNERABILIDADE DA ÁREA COSTEIRA
Para se reduzir à vulnerabilidade das áreas costeiras sujeita, tanto a processos naturais,
quanto os antrópicos, se faz necessário à tomada de decisões, cujas atribuições são do setor
público, responsável pela preservação do patrimônio de uso público e coletivo.
Portanto, para reduzir o impacto ambiental nas áreas costeiras, é preciso a implantação de
alguns programas como:
• monitoramento dos processos costeiros para constituir um banco de dados a fim de predizer a
dinâmica costeira;
• priorizar a proteção dos manguezais, dunas costeiras e praias;
• regenerar áreas costeiras já destruídas pela ação antrópica;
• estabelecimento de uma linha de recuo (“setback”) para o uso e desenvolvimento de áreas
costeiras. Esta linha de recuo será definida como a distância prescrita da linha de maré baixa
para uma feição costeira, preferencialmente a linha de vegetação do campo de dunas, na qual
todos ou certos tipos de desenvolvimento serão proibidos;
• determinação de uma zona entre a linha de maré baixa e a faixa de ocupação costeira, na qual
a zona de praia pode acrescer ou recuar naturalmente;
• controlar a emissão de efluentes domésticos e industriais nos rios, estuários e linha de costa;

196
• estabelecimento de um programa de coleta de resíduos sólidos adequado ao ambiente costeiro,
com a finalidade de reciclar o lixo quando possível.
Estas medidas devem ser tomadas o quanto antes, uma vez que a grande maioria dos
impactos antrópicos responsáveis pela vulnerabilidade das áreas costeiras ainda são reversíveis.
Deste modo, planejar nesse momento um desenvolvimento sustentável para a região é bastante
pertinente, sendo possível evitar danos ambientais irreparáveis, como aqueles observados na área
de Salinópolis (Mendes et al. 1997), também localizada no litoral do Estado do Pará.
CONCLUSÕES
Este artigo representa uma tentativa de se abordar os muitos problemas envolvidos no
gerenciamento de áreas costeiras, com o intuito de planejar um desenvolvimento sustentável para
a Planície Costeira Bragantina. A implementação de uma política de gerenciamento deve ser de
longo período, iniciando-se com o reconhecimento das características do meio abiótico e biótico,
para que se possa então monitorar e em seguida gerenciar o ambiente.
Os principais problemas ambientais na Planície Costeira Bragantina estão relacionados à
erosão costeira e a ocupação desordenada de áreas de preservação permanente, sem que haja
nenhum estudo prévio dos impactos ambientais decorrentes de tal ação. Deste modo, o primeiro
passo é reconhecermos a erosão costeira como um problema que vem afetando a população local,
causando sérios prejuízos econômicos e sociais. Em seguida, é necessário se rever à forma de
ocupação atual da planície costeira e adequá-la a proposta geoambiental de uso e ocupação do
solo, a fim de que se possa reduzir a vulnerabilidade das áreas costeiras aos processos naturais
atuantes. Vale ressaltar ainda a necessidade de estabelecimento de uma política de gerenciamento
costeiro, onde o planejamento do meio físico seja de responsabilidade de órgãos ambientais, que
juntamente com a comunidade, a iniciativa privada e organizações não governamentais fomentem
e incentivem o turismo e o desenvolvimento da região de modo efetivo.
Portanto, ainda a tempo de evitarmos problemas ambientais mais graves na Planície
Costeira Bragantina, que só passam a existir quando o homem ocupa de forma desordenada e
irracional o ambiente em que vive.

197
AGRADECIMENTOS
O autor agradece a CAPES pela concessão da bolsa de doutorado e pelo
financiamento das etapas de campo, ao Curso de Pós-Graduação em Geologia e Geoquímica da
Universidade Federal do Pará (CPGG/UFPA) pela utilização dos laboratórios do Centro de
Geociências, pesquisador Msc. Amilcar Carvalho Mendes (CNPq/Museu Paraense Emílio
Goeldi) e ao Prof. Dr. Werner Trukenbrodt pelas discussões, sugestões e revisão crítica do artigo.
REFERÊNCIAS BIBLIOGRÁFICAS
DIRETORIA DE HIDROGRAFIA E NAVEGAÇÃO – DHN. 1986. Roteiro Costa-Norte. Rio de
Janeiro, DHN. 152p.
DIRETORIA DE HIDROGRAFIA E NAVEGAÇÃO - DHN. 1997. Tábuas de Marés para 1997.
Costa do Brasil e alguns portos estrangeiros. Rio de Janeiro, DHN. p. 1-6.
MARTORANO, L.G.; PERREIRA, L.C.; CÉZAR, E.G.M.; PEREIRA, I.C.B. 1993. Estudos
Climáticos do Estado do Pará, Classificação Climática (KOPPEN) e Deficiência Hídrica
(THORNTHWHITE, MATHER). Belém, SUDAM/ EMBRAPA, SNLCS. 53p.
MENDES, A.C.; SILVA, M.S.; FARIA Jr., L.E.C. 1997. A expansão urbana e seus efeitos
danosos ao meio ambiente da Ilha do Atalaia-Salinópolis/PA. In: COSTA, M.L. &
ANGÉLICA, R.S. (ed.). Contribuições à Geologia da Amazônia . Belém, Finep/SBG-NO. p.
359-396.
NICHOLS, K. E. & CORBIN. C. 1997. Community based approach to beach management. In:
CAMBERS, G. (ed) Managing Beach Resources in the Smaller Caribbean Island. Porto
Rico, UNESCO. p. 182-190.
SIMMONS, D. 1997. Development planning guidelines for tourism development in coast areas
of Small Island States. . In: CAMBERS, G. (ed) Managing Beach Resources in the Smaller
Caribbean Island. Porto Rico, UNESCO. p. 237-247.
SOUZA FILHO, P.W.M. 1995. Influência das Variações do Nível do Mar na Morfoestratigrafia
da Planície Costeira Bragantina (NE do Pará) durante o Holoceno. Universidade Federal
do Pará, Tese de Mestrado, 123p.
SOUZA FILHO, P.W.M. & EL-ROBRINI, M. 1996. Morfologia, processos de sedimentação e
litofácies dos ambientes morfo-sedimentares da Planície Costeira Bragantina - Nordeste do
Pará (Brasil). Geonomos, 4(2): 1-16.

198
SOUZA FILHO, P.W.M. & EL-ROBRINI, M. 1997. A influência das variações do nível do mar
na sedimentação da Planície Costeira Bragantina durante o Holoceno - Nordeste do Pará,
Brasil. In: COSTA, M.L. & ANGÉLICA, R.S. (ed.) Contribuições à Geologia da
Amazônia. Belém, FINEP/SBG. P. 307-337.

199
CAPÍTULO 5:
CONCLUSÕES GERAIS
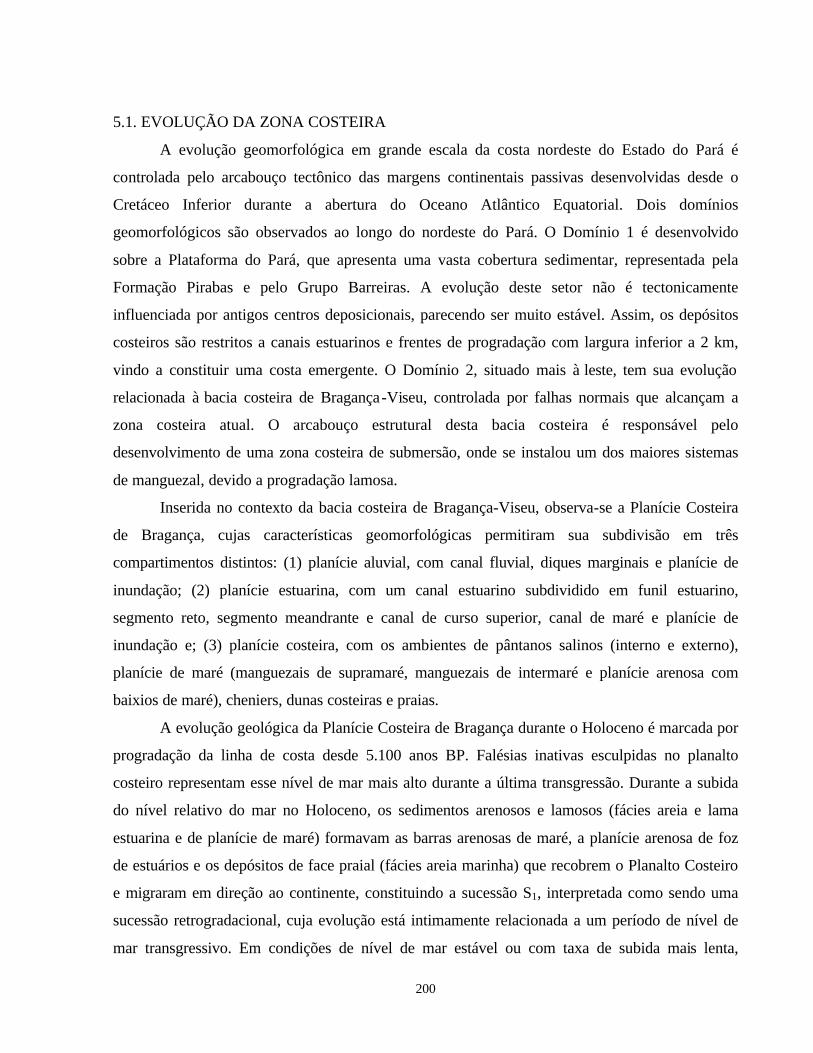
200
5.1. EVOLUÇÃO DA ZONA COSTEIRA
A evolução geomorfológica em grande escala da costa nordeste do Estado do Pará é
controlada pelo arcabouço tectônico das margens continentais passivas desenvolvidas desde o
Cretáceo Inferior durante a abertura do Oceano Atlântico Equatorial. Dois domínios
geomorfológicos são observados ao longo do nordeste do Pará. O Domínio 1 é desenvolvido
sobre a Plataforma do Pará, que apresenta uma vasta cobertura sedimentar, representada pela
Formação Pirabas e pelo Grupo Barreiras. A evolução deste setor não é tectonicamente
influenciada por antigos centros deposicionais, parecendo ser muito estável. Assim, os depósitos
costeiros são restritos a canais estuarinos e frentes de progradação com largura inferior a 2 km,
vindo a constituir uma costa emergente. O Domínio 2, situado mais à leste, tem sua evolução
relacionada à bacia costeira de Bragança-Viseu, controlada por falhas normais que alcançam a
zona costeira atual. O arcabouço estrutural desta bacia costeira é responsável pelo
desenvolvimento de uma zona costeira de submersão, onde se instalou um dos maiores sistemas
de manguezal, devido a progradação lamosa.
Inserida no contexto da bacia costeira de Bragança-Viseu, observa-se a Planície Costeira
de Bragança, cujas características geomorfológicas permitiram sua subdivisão em três
compartimentos distintos: (1) planície aluvial, com canal fluvial, diques marginais e planície de
inundação; (2) planície estuarina, com um canal estuarino subdividido em funil estuarino,
segmento reto, segmento meandrante e canal de curso superior, canal de maré e planície de
inundação e; (3) planície costeira, com os ambientes de pântanos salinos (interno e externo),
planície de maré (manguezais de supramaré, manguezais de intermaré e planície arenosa com
baixios de maré), cheniers, dunas costeiras e praias.
A evolução geológica da Planície Costeira de Bragança durante o Holoceno é marcada por
progradação da linha de costa desde 5.100 anos BP. Falésias inativas esculpidas no planalto
costeiro representam esse nível de mar mais alto durante a última transgressão. Durante a subida
do nível relativo do mar no Holoceno, os sedimentos arenosos e lamosos (fácies areia e lama
estuarina e de planície de maré) formavam as barras arenosas de maré, a planície arenosa de foz
de estuários e os depósitos de face praial (fácies areia marinha) que recobrem o Planalto Costeiro
e migraram em direção ao continente, constituindo a sucessão S1, interpretada como sendo uma
sucessão retrogradacional, cuja evolução está intimamente relacionada a um período de nível de
mar transgressivo. Em condições de nível de mar estável ou com taxa de subida mais lenta,

201
desenvolve-se a sucessão S2, constituída pelo ambiente de planície de maré (manguezais de
intermaré e supramaré), que vem a representar uma sucessão progradacional desenvolvida sob
condições de nível de mar alto estável. O limite desta sucessão S2 com a sucessão S1 é marcado
por uma superfície de recobrimento regressivo bem definida, resultado da progradação lamosa
subaérea sobre os depósitos arenosos, à medida que a linha de costa avança em direção ao mar,
datada em 2.100 anos BP. Assim, admite-se que estes depósitos lamosos da planície de maré
tenham se acumulado durante período de progradação geral da linha de costa, sob condições de
nível de mar alto estável.
A sucessão S3 foi interpretada como de ambiente litorâneo (dunas costeiras, praias
e cheniers) e estuarino, representando eventos transgressivos de curta duração, responsável pela
fase retrogradacional atual da linha de costa, onde vários ambientes sedimentares atuais estão
evoluindo.
5.2. MAPEAMENTO DE ZONAS COSTEIRAS TROPICAIS ÚMIDAS DOMINADAS POR
MANGUEZAIS POR SENSORES REMOTOS ORBITAIS
Este trabalho tem demonstrado que dados orbitais de sensores remotos podem fornecer
excelentes informações geomorfológicas e de uso da terra. Imagens do radar de abertura sintética
RADARSAT-1, no modo de alta resolução, representam uma ferramenta poderosa para o estudo
de ambientes costeiros tropicais úmidos, principalmente em costas de manguezal de macromaré,
onde a capacidade da radiação eletromagnética nas microondas, penetra a cobertura de nuvens,
fornecendo uma oportunidade unívoca para o mapeamento e monitoramento de áreas costeiras
amazônicas. Assim, o processamento digital das imagens SAR seguida de sua interpretação pode
ser usada no mapeamento de ambientes sedimentares costeiros, na determinação da posição de
bancos arenosos submersos em águas rasas, na determinação das direções das correntes de marés
superficiais, na determinação da posição precisa da linha de costa e a estimativa de sua variação
ao longo do tempo, na identificação de setores sujeitos a erosão, acreção ou estabilidade, na
localização de áreas sujeitas ao desflorestamento e regeneração das florestas de mangue e por fim
na localização de áreas de risco geológico costeiro.
Esta pesquisa tem demonstrado também como imagens orbitais SAR combinadas a
sensores remotos ópticos podem ser úteis no mapeamento geológico costeiro em ambientes
tropicais úmidos. Produtos integrados a partir de componentes principais seletivos (SPC) das

202
bandas do sensor TM do satélite Landsat são excelentes dados para integração com o
RADARSAT, apresentando a melhor performance na discriminação dos ambientes costeiros.
Este aspecto está relacionado à habilidade da análise por SPC tornar possível o uso das seis
bandas reflectivas do TM. Assim, o primeiro auto canal (PC1) obtido a partir das bandas TM 1, 2
e 3 é responsável pelo realce da linha de costa e das feições costeiras submersas, uma vez que a
PC1 contém 95,11% da variância do espectro visível do TM. Além do mais, o primeiro auto
canal (PC1) obtido a partir das bandas TM 5 e 7 realça as áreas com solos expostos, permitindo a
discriminação espectral entre os pântanos salinos internos e externos e manguezais de supramaré.
Enquanto a banda TM 4 é responsável pelo realce da floresta costeira de manguezal da vegetação
secundária sobre o planalto costeiro. Os dados SAR foram responsáveis pelo realce de feições
topográficas, diferenças na altura da vegetação, geometria dos corpos e conteúdo de umidade,
enquanto os dados TM forneceram mais informações da cobertura vegetal e variações no tipo
vegetal.
A integração digital das imagens SAR e TM propiciaram uma visão sinóptica da área,
fornecendo informações geobotânicas (relação entre o ambiente costeiro e a vegetação
sobrejacente) e de variações multitemporais. Deste modo, tal técnica de processamento pode ser
reconhecida pelos geólogos costeiros como uma poderosa ferramenta para mapeamento e
monitoramento costeiro.
A partir deste estudo é possível concluir que a integração de dados de sensores remotos
com um sistema de informação geográfica (GIS) constitui a melhor estrutura de análise espacial
integrada. A habilidade do GIS de combinar diferentes conjuntos de dados e a possibilidade de se
interpretar simultaneamente as relações espaciais entre os vários ambientes costeiros permitiu
uma interpretação mais compreensível do mapeamento geológico costeiro. Esta pesquisa revelou
que este sistema de mapeamento costeiro constitui um método acessível, rápido e preciso e o GIS
representa uma filosofia organizacional para controle dos dados e posterior uso desta informação
no gerenciamento da zona costeira.

203
5.3. APLICAÇÃO DE DADOS DE SENSORIAMENTO REMOTO NO ESTUDO DA
GEOLOGIA COSTEIRA
As aplicações dos dados de sensores remotos no estudo de ambientes costeiros tropicais
além de estarem relacionadas ao mapeamento geológico estão associadas a processo de
monitoramento das modificações costeiras. Estas estão relacionadas à dinâmica natural do
ambiente e a influência antrópica exercida sobre ele.
O estudo da variabilidade na posição da linha de costa ao longo da Planície Costeira de
Bragança, revela que durante o Holoceno (últimos 5.200 anos), a planície foi marcada por uma
progradação lamosa da linha de costa. Entretanto, a partir da análise de imagens de sensores
remotos, foi possível investigar a variabilidade da linha de costa em escalas de longo (1972-1998)
e curto período (85 a 88, 88 a 90, 90 a 91), cujas variações morfológicas são caracterizadas por
recuo da linha de costa, provavelmente devido às variações climáticas, associadas á eventos El-
Niño e La-Niña, que controlam a precipitação ao longo da zona costeira, onde os períodos de
erosão mais severos (1985-1988) são acompanhados de elevadas taxas de precipitação (>4.000
mm).
Do ponto de vista da análise espacial de ambientes costeiros, os manguezais constituem
um dos melhores ambientes para análise a partir de sensores remotos, tanto no espectro eletro-
óptico devido sua alta reflectividade no infravermelho próximo, quanto nas microondas devido
sua textura rugosa. Portanto, os manguezais têm mostrado ser um excelente indicador geológico
para detecção e quantificação das variações morfológicas de curto e longo período. Eles são os
melhores marcadores das posições de linha de costa em ambientes dominados por macromaré,
devido seus limites serem facilmente reconhecidos tanto no campo como em imagens de
sensores remotos. Não há dúvidas de que a sensibilidade do sistema de manguezal para registrar
variações nos processos costeiros (erosão, deposição e transporte) em diferentes escalas de
tempo e espaço, o torna um indicador geológico em potencial para ser monitorado a partir de
sensores remotos orbitais.
Por fim, a integração de sensores remotos com o GIS e dados de campo apresenta um
papel fundamental para o gerenciamento integrado de zonas costeiras, avaliação de risco
ambiental, caracterização local, mapas bases e geração de mapas temáticos e disseminação da
informação de domínio público, que são fatores significantes no processo de tomada de decisão.

204
CAPÍTULO 6:
LITERATURA CITADA

205
ADAMS, S.; WIEBE, J.; COLINS, M.; PIETRONIRO, A. 1998. Radarsat flood mapping the
Peace-Athabasca Delta, Canada. Canadian Journal of Remote Sensing, 24: 69-79.
ALLEN, G.P. & POSAMENTIER, H.W. 1993. Sequence stratigraphy and facies model of an
incised valley fill: The Gironde Estuary, France. Journal of Sedimentary Petrology, 63: 378-
391.
ALLEN, G.P. & POSAMENTIER, H.W. 1994. Transgressive facies and sequence architecture in
mixed tide-and-wave-dominated incised valleys: Example from the Gironde Estuary, France.
In: DALRYMPLE, R.W.; ZAITLIN, B.A.; SCHOLLE, P.A. (ed.) Incised-valley systems:
origin and sedimentary sequences. Tulsa, SEPM. p. 225-240.
ANGULO, J.A. 1996. Natural dynamics and land-use on the coast of Paraná, Brazil: background
and perspective. Anais da Academia Brasileira de Ciências, 68: 383-388.
ANGULO, R.J. & LESSA, G.C. 1997. The Brazilian sea level curves: a critical review with
emphasis on the curves from Paranaguá and Cananéia regions. Marine Geology, 140: 141-
166.
ARANHA L. G. F., LIMA H. P., SOUZA J. M. P., MAKINO R. K. 1990. Origem e evolução das
bacias de Bragança-Viseu, São Luís e Ilha Nova. In: DE RAJA GABAGLIA G. P. &
MILANI E. J. (ed.). Origem e evolução de bacias sedimentares. Rio de Janeiro,
PETROBRÁS. p. 221-233.
ASMUS, H. E. 1984. Geologia da margem continental brasileira. Rio de Janeiro, DNPM. p.
443-472.
AUGUSTINUS, P.G.E.F. 1989. Chêniers and chêniers plains: a general introduction. Marine
Geology, 90: 219-229.
BARBOSA, M.P.; SINGHROY, V.; SAINT-JEAN, R. 1999. Mapping coastal erosion in
Southern Paraíba, Brazil from RADARSAT-1. Canadian Journal of Remote Sensing, 25:
323-328.
BEHLING, H., COHEN, M.C.L, LARA, R. J. 1999. Holocene mangrove dynamics of the
Bragança Region on Northeastern Pará, Brazil. In: INTERNATIONAL CONFERENCE OF
MADAM PROJECT, 2. Belém. Abstracts… CNPq/BMBF. p. 10-11.
BERGER, A. R. 1996. The geoindicartor concept and its application: an introduction. In:
BERGER, A. R. & IAMS, W. J. (ed.) Geoindicators: assessing rapid environmental
changes in earth systems. Rotterdam, Balkema. p. 1-14.

206
BIRD, E.C.F. 1993. Submerging coast: the effects of a rising sea level on coastal environments.
New York, John Willey & Sons. 184p.
BITTENCOURT, A. C. S. P.; DOMINGUEZ, J. M. L.; USSAMI, N. 1999. Flexure as a tectonic
control on the large scale geomorphic characteristics of the eastern Brazil coastal zone.
Journal of Coastal Research, 15: 505-519.
BURROUGH, P.A. 1986. Principles of Geographical Information Systems for Land Resources
Assessment. Oxford, Clarendon Press. 193p.
CAMPOS C. W. M., PONTE F. C., MIURA K. 1974. Geology of the Brazilian continental
margin. In: BURK, C. A. & DRAKE, C. L. (eds.). The geology of continental margins.
Berlin, Springer-Verlag, p. 447-461.
CHAVEZ, P.S. 1988. An improved dark-object subtraction technique for atmospheric scattering
correction of multispectral data. Remote Sensing of Environment, 24: 450-479.
CHAVEZ, P.S., BERLIN, G.L. AND SOWERS, L.B. 1982. Statistical method for selecting
Landsat MSS ratios. Journal of Applied Photographic engineering, 8: 23-30.
CIAVOLA, P.; MANTOVANI, F.; SIMEONI, U.; TESSARI, U. 1999. Relation between river
dynamic and coastal changes in Albania: an assessment integrating satellite imagery with
historical data. International Journal of Remote Sensing, 20: 561-584.
CLARCK, J.R. 1996. Coastal Zone Management Handbook. Lewis Publishers, New York, USA.
COHEN, M.C.L.; LARA, R.J.; SZLAFSTEIN, C.F.; DITTMAR, T. 2000. Analysis of mangrove
inundation by GIS techniques. In: MANGROVE 2000: CONFERENCE SUSTAINABLE
USE OF ESTUARIES AND MANGROVES. Recife, CD ROON …UFRPE/ISME.
COLWELL, R.N. 1983. Manual of Remote Sensing. Falls Cruch, VA, American Society of
Photogrammetry, 547p.
CONWAY, J. 1997. Evaluating ERS-1 SAR data for the discrimination of tropical forest from
other tropical vegetation types in Papua New Guinea. International Journal of Remote
Sensing, 18: 2967-2984.
COOKE, R. U. & DOORNKANP, J. C. 1990. Geomorphology in Environmental Management.
Oxford, Clarendon Press. 234p.

207
COSTA J. B. S., BEMERGUY R. L., HASUI, Y., BORGES M. S., FERREIRA JR. C. R. P.,
BEZERRA P. E. L., COSTA M. L. C., FERNANDES J. M. G. 1996. Neotectônica da
Região Amazônica: aspectos tectônicos, geomorfológicos e deposicionais. Geonomos, 4: 23-
44.
COSTA, J.B.S.; BORGES, M.S.; BEMERGUY, R.L.; FERNANDES, J.M.G.; COSTA JR., P.S.
COSTA, M.L. 1993. Evolução cenozóica da região de Salinópolis, Nordeste do Estado do
Pará. Geociências, 12: 353-372.
COSTA, J.B.S. & HASUI, Y. 1997. Evolução geológica da Amazônia. In: COSTA, M.L. &
ANGÉLICA, R.S. (eds.) Contribuições a Geologia da Amazônia. Belém, FINEP/SBG, p.15-
90.
CRACKNELL, A.P. 1999. Remote sensing techniques in estuaries and coastal zones - an update.
International Journal of Remote Sensing, 19: 485-496.
CROWELL, M.; LEATHERMAN, S.P.; BUCKLEY, M.K. 1991. Historical shoreline change:
error analysis and mapping accuracy. Journal of Coastal Research, 7: 839-852.
DALRYMPLE, R. W.; ZAITLIN, B. A.; BOYD R. 1992. Estuary facies models: conceptual
basis and stratigraphic Implications. Journal of Sedimentary Petrology, 62: 1130-1146.
DALRYMPLE, R.W.; BOYD, R.; ZAITLIN, B.A. 1994. History of research, types and internal
organization of incised-valley systems: introduction to the volume. In: DALRYMPLE, R.W.;
ZAITLIN, B.A.; SCHOLLE, P.A. (eds.) Incised-valley systems: origin and sedimentary
sequences. Tulsa, SEPM, p. 3-10.
DAVIS Jr., R.A. 1992. Depositional system: An Introduction to Sedimentology and Stratigraphy.
2nd ed., New Jersey, Prentice hall. 604p.
DEMAREST, J.M. & KRAFT, J.C. 1987. Stratigraphic record of Quaternary sea-levels:
implications for more ancient strata. In: NUMMENDAL, D.; PILKEY, O.H. HOWARD,
J.D. (eds.) Sea-level fluctuation and coastal evolution. Tulsa, SEPM, p. 223-239.
DHN - DEPARTAMENTO DE HIDROGRAFIA E NAVEGAÇÃO. 1995. Tábuas de marés
para 1994. Costa do Brasil e alguns portos estrangeiros. Rio de Janeiro, DHN. p. 1-6.
DHN - DEPARTAMENTO DE HIDROGRAFIA E NAVEGAÇÃO. 1986. Roteiro Costa-Norte.
Rio de Janeiro, DHN. 152p.
DHN - DEPARTAMENTO DE HIDROGRAFIA E NAVEGAÇÃO. 1997. Tábuas de Marés
para 1997. Costa do Brasil e alguns portos estrangeiros. Rio de Janeiro, DHN. p. 1-6.

208
DOLAN, R.; FENSTER, M.S.; HOLME, S.J. 1991., Temporal analysis of shoreline recession
and accretion. Journal of Coastal Research, 7, 723-744.
DOLAN, R.B.; HAYDEN, B.P.; MAY, P. 1980. The reliability of shoreline change
measurements from aerial photographs. Shore and Beach, 48: 22-29.
DOMINGUEZ, J.M.L. 1982. Evolução quaternária da planície costeira associada à foz do Rio
Jequitinhonha (BA): influência das variações do nível do mar e da deriva litorânea de
sedimentos. Salvador, Universidade Federal da Bahia, Instituto de Geociências. 79p.
(Dissertação de Mestrado).
DOMINGUEZ, J.M.L.; BITTENCOURT, A.C.S.P.; MARTIN, L. 1992. Controls on Quaternary
coastal evolution of the east-northeastern coast of Brazil: roles of sea level history, trade
winds and climate. Sedimentary Geology, 80: 213-232.
DOMINGUES, J.M.L.; MARTIN, L; BITTENCOURT, A.C.S.P. 1987. Sea-level history and
Quaternary evolution of river-mouth-associated beach-ridge plains along the east-southeast
Brazilian coast. In: NUMMEDAL, D.; PILKEY, O.H. HOWARD, J.D. (eds.) Sea-level
fluctuation and coastal evolution. Tulsa, SEPM, p. 115-127.
DRISCOLL N. W. & KARNER G. D. 1994. Flexural deformation due to Amazon fan loading: a
feedback mechanism affecting sediment delivery to margins. Geology, 22: 1015-1018.
EL-ROBRINI, M.; FARIA JR., L.E.C.; TORRES, A.M.; SOUZA FILHO, P.W.M.; SILVA.;
M.S. 1992. Deposição e assoreamento das rias do Estado do Para. In: CONGRESSO
BRASILEIRO DE GEOLOGIA, 37. São Paulo. Resumos... SBG. v.1, p. 79-80.
EL-ROBRINI, M. & SOUZA FILHO, P.W.M. 1993. Evidence of Quaternary sea levels on the
Northern Continental Shelf. In: SIMPÓSIO AMASSEDS, 2. Niterói. Resumos…UFF, p. 16.
EMERY, K.O., 1961. A simple method of measuring beach profiling. Limnology and
Oceanography, 6: 90-93.
ESRI. 1996. Using ArcView GIS. New York, ERSI, 350p.
FARIA JR., L.E.C.; MARÇAL, M. S.; PINHEIRO, R.V.L. 1987. A dinâmica sedimentar da
praia do Maçarico/Salinópolis e sua importância para a geologia da região costeira do Estado
do Pará. In: CONGRESSO DA ASSOCIAÇÃO BRASILEIRA DE ESTUDOS DO
QUATERMÁRIO, 1. Porto Alegre. Anais... ABEQUA, p. 343-356,

209
FIGUEIREDO JR., A.G. 1990. Normas de controle de qualidade para processamento de
testemunhos inconsolidados. Projeto Sedimentos de Talude. Rio de Janeiro, Contrato
PETROBRÁS/ UFF no3-570-794-0-90, 27p.
FORBER, D. L. & LIVERNAM, D. G. E. 1996. Geological indicators in the coastal zone. In:
In: BERGER, A. R. AND IAMS, W. J. (eds.) Geoindicators: assessing rapid environmental
changes in earth systems. Rotterdam, Balkema. p. 175-192.
FRANZINELLI, E. 1982. Contribuição a geologia da costa do Estado do Pará (entre as baías de
Curuçá e Maiaú). In: Simpósio Internacional de Quaternário, 4. Manaus. Atas...INQUA, p.
305-322,
FRANZINELLI E. 1992. Evolution of the geomorphology of the coast of the State of Pará,
Brazil. In: M. T. PROST (ed.). Évolution des littoraux de Guyane et de la Zone Caraï be
Méridionale pendant le Quaternaire. Paris, ORSTOM. p. 203-230.
FREY, J.C & WILLIMAN, H.B. 1960. Classification of the Wisconsinian stage in the Lake
Michigan glacial lobe. Illinois State Geological Survey, 285: 1-16.
FREY, R.W. & BASAN, P.B. 1978. Coastal salt marsh. In: DAVES Jr., R.A. (ed.) Coastal
Sedimentary Environments. New York, Springer-Verlag. 420p
GILCHRIST A. R. & SUMMERFIELD M. A. 1994. Tectonic models of passive margins
evolution and their implications for theories of long-term landscape development. In:
KIRKBY M. J. (ed.). Processes models and theoretical geomorphology. Chilchester, Willey,
p. 55-84.
GLASER, M. & GRASSO, M.1998. Fisheries of a mangrove estuary: dynamics and inter-
relationships between economy and ecosystem in Caeté Bay, northeastern Pará, Brazil.
Boletim do Museu Paraense Emílio Goeldi, Série Zoologia, 14: 95-125.
GOES A. M., ROSSETTI D. F., NOGUEIRA A. C. R., TOLEDO P. M. 1990. Modelo
deposicional preliminar da Formação Pirabas no nordeste do Estado do Pará. Boletim do
Museu Paraense Emílio Goeldi, Série Ciências da Terra, 2: 3-15.
GOLDSMITH, V. 1978. Coastal Dunes. In: DAVES Jr., R.A. (ed.) Coastal Sedimentary
Environments. New York, Springer-Verlag. 420p
GORINI M. A. & BRYAN G. M. The tectonic fabric of the Equatorial Atlantic and adjoining
continental margins: Gulf of Guinea to northeastern Brazil. Anais da Academia Brasileira de
Ciências, 48 (suplemento): 101-119.
210
GOWDA, H.H.; GANESHA RAJ, K.; PADMAVATHY, A.S.; MANIKIAN, B. 1995. Multidate
satellite data for study of dynamic of coastal landforms of Uttara Kannada, South India.
Intenational Journal of Remote Sensing, 16: 2539-2553.
GILLESPIE, A.R.; KAHLE, A.B.; WALKER, R.E. 1987. Color enhancement of highly
correlated images. II. Channel ratio and "chromaticity" transformation techniques. Remote
Sensing of Environment, 22: 343-365.
HARRIS, J.R., BOWIE, C., RENCZ, A.N., GRAHAM, D. 1994. Computer-enhancement
techniques for the integration of remotely sensed, geophysical, and thematic data for the
geosciences. Canadian Journal of Remote Sensing, 20: 210-221.
HARRIS, J.R.; MURRAY, R.; HIROSE, T. 1990. IHS transform for the integration of radar
imagery and other remotely sensed data. Photogrammetry Engineering & Remote Sensing,
56: 1631-1341.
HERZ, R. 1991. Manguezais do Brasil., São Paulo, IOUSP/CIRM, 302p.
HOYT, J.H. 1969. Chêniers versus Barrier, genetic and stratigraphic distinction. The American
Association of Petroleum Geologist Bulletin, 53: 299-306.
IGREJA H. L. S. 1992. Aspectos tectono-sedimentares do Fanerozóico do nordeste do Pará e
noroeste do Maranhão, Brasil. Belém. Universidade Federal do Pará. Centro de
Geociências. 191p. (Tese de Doutorado).
JOHANNESSEN, J.A. 2000. Coastal observing systems: the role of synthetic aperture radar.
Johns Hopkins APL Technical Digest, 21: 7-14.
JONES, A. R. 1986. An evaluation of satellite thematic mapper imagery for geomorphological
mapping in arid and semi-arid environment. In: GARDINER, V. (ed.) International
Geomorphology. Chichester, Wiley, p. 343-357.
KJERFVE, B. & MACINTOSH, D. J. 1997. The impact of climatic change on mangrove
ecosystems. In: KJERFVE, B.; LACERDA, L. D.; DIOP, E. H. S. (eds.). Mangrove
ecosystem studies in Latin America and Africa. Paris, UNESCO, p.1-7
KJERFVE, B.; PERILLO, G.M.E.; GARDNER, L.R.; RINE, J.M.; DIAS, G.T.M.; REBELO-
MOCHEL, F. 2000. Morphodynamics of muddy environments along the Atlantic coast of
North and South America (in press).

211
KUSHWAHA, S.P.S.; DWIVEDI, R.S.; RAO, B.R.M. 2000. Evaluating of various digital image
processing techniques for detection of coastal wetlands using ERS-1 SAR data. International
Journal of Remote Sensing, 21: 565-579.
Lecont, R. and Pultz, T.J. 1991. Evaluation of the potential of Radarsat for flood mapping using
simulated satellite SAR imagery. Canadian Journal of Remote Sensing, 17: 241-249.
LEWIS, A.J., HENDERSON, F.M., HOLCOMB, D.W. 1998. Radar fundamentals: the
geoscience perspective. In: HENDERSON, F.M. & LEWIS, A.J. (eds.), Principles &
Applications of Imaging Radar. , New York, John Willey & Sons. p. 131-180
LOPES, A.; TOUZI, R.; NEZRY, E. 1990. Adaptive speckle filters and scene heterogeneity.
IEEE Transaction on Geoscience and Remote Sensing, 28: 992-1000.
LOUGHLIN, W.P. 1991. Principal component analysis for alteration mapping. Photogrammetric
Engineering & Remote Sensing, 57: 1163-1169.
LYON, J.G. & ADKING, K.F. 1995. Use of a GIS for wetlands identification, The St. Clair
Flats, Michigan. In: LYON, G.J. AND MCCARTHY, J. (eds.). Wetlands and environmental
applications of GIS. New York, Lewis Publishers, p. 49-60.
MARTIN, L. & SUGUIO, K. 1989. Excursion route along the Brazilian coast between Santos
(State of São Paulo) and Campos (State of Rio de Janeiro). In: INTERNATIONAL
SYMPOSIUM ON GLOBAL CHANGES IN SOUTH AMERICA DURING THE
QUATERNARY, São Paulo, Guia de Excursão… INQUA (Special publication, 2). 136p.
MARTIN, L. SUGUIO, K.; FLEXOR, J.M. 1993. As flutuações do nível do mar durante o
Quaternário Superior e a evolução geológica dos "deltas" brasileiros. Boletim IG-USP, 15:
1-86.
MARTIN, L.; SUGUIO, K.; FLEXOR, J-M; DOMINGUEZ, J.M.L.; BITTENCOURT, C.S.P.
1996. Quaternary sea-level history and variation in dynamics along the central Brazilian
coast: consequences on coastal plain construction. Anais da Academia Brasileira de
Ciências, 68: 303-354.
MARTORANO, L.G.; PERREIRA, L.C.; CÉZAR, E.G.M.; PEREIRA, I.C.B. 1993. Estudos
Climáticos do Estado do Pará, Classificação Climática (KÓPPEN) e Deficiência Hídrica
(THORNTHWHITE, MATHER). Belém, SUDAM/ EMBRAPA, 53p.

212
McGREGOR, R.G.; BRUTON, P.; SINGHROY, V.H.; BROWN, A. 1999. An application of
Remote sensing and GIS towards geological site characterization of a Canadian Shield
Terrain. Canadian Journal of Remote Sensing, 25: 245-257.
MENDES, A.C.; SILVA, M.S.; FARIA JR., L.E.C. 1997. A expansão urbana e seus efeitos
danosos ao meio ambiente da Ilha do Atalaia - Salinópolis/PA. In: COSTA, M.L. &
ANGÉLICA, R.S. (ed.). Contribuições à Geologia da Amazônia . Belém, Finep/SBG-NO. p.
359-396.
MILLIMAN J.D. & BARRETO H.T. 1975. Relict magnesian calcite oolite and subsidence of
Amazon Shelf. Sedimentology, 22: 137-145.
MILLIMAN J.D. & EMERY K.O. 1968. Sea levels during the past 35.000 years. Science, 162:
1121-1123.
MORTON, R.A., 1996. Geoindicators of coastal wetlands and shorelines. In: BERGER, A. R. &
IAMS, W. J. (eds.), Geoindicators: assessing rapid environmental changes in earth systems.
Rotterdam, Balkema. p. 207-230.
NICHOLS, K. E. & CORBIN. C. 1997. Community based approach to beach management. In:
CAMBERS, G. (ed) Managing Beach Resources in the Smaller Caribbean Island. Porto
Rico, UNESCO. p. 182-190.
NITTROUER, C.A.; BRUNSKILL, G.J.; FIGUEIREDO, A.G, 1995. Importance of tropical
coastal environments. Geo-Marine Letters, 15: 121-126.
OLIVEIRA E. & CASTRO P. J. M. 1971. Problemas de integração gravimétrica no Brasil. In:
CONGRESSO BRASILEIRO DE GEOLOGIA, 25. São Paulo. Anais...SBG. v.2, p.71-78.
PARADELLA, W.R. & BRUCE, W.D. 1990. Geobotânica por sensores remotos: uma revisão.
Revista Brasileira de Geociências, 19: 425-435.
PARADELLA, W.R.; BIGNELLI, P.A.; VENEZIANI, P.; PIETSCH, R.W.; TOUTIN, T. 1997.
Airborne and spaceborne synthetic aperture radar (SAR) integration with Landsat TM and
gamma ray spectrometry for geological mapping in a tropical rain forest environment, the
Carajás Mineral Province, Brazil. International Journal of Remote Sensing, 18: 1483-1501.
PARADELLA, W. R.; KRUG, T.; LANDRY, R.; PIETSCH, R. W. 1997. GLOBESAR-2: O
Programa de Avaliação de Dados do RADARSAT-1 nas Geociências. Revista Brasileira de
Geociências, 27: 403-406.

213
PARADELLA, W.R.; SANTOS, A.R.; DALL' AGNOL, R.; PIETSCH, R.W.; SANT'ANA,
M.V. 1998. A geological investigation based on airborne (SAREX) and spaceborne
(RADARSAT-1) SAR integrated products in the Central Serra dos Carajás Granite Area,
Brazil. Canadian Journal of Remote Sensing, 24: 376-392.
PARADELLA, W. R.; SANTOS, A. R., VENEZINI, P., MORAIS, M. C. 1999. Avaliação de
dados do RADARSAT-1 em Aplicação Geológica na Província Mineral de Carajás, Estado
do Pará. Relatorio Final: FAPESP-INPE Projetp # 10946-4/1997.
PARADELLA, W.R.; SILVA, M.F.F.; ROSA, N.A. & KUSHIGBOR, C.A. 1994. A
geobotanical approach to the tropical rain forest environment of the Carajás Mineral
Province (Amazon Region, Brazil), based on digital TM-Landsat and DEM data.
International Journal of Remote Sensing, 15: 1633-1648.
PCI, 1999. EASI-PACE User’s Manual, version 6.3, Ontário, PCI Enterprises. 362p.
PENLAND, S. & SUTER, J. 1989. The geomorphology of the Mississipi River chêniers plain.
Marine Geology, 90: 231-258
PIETSCH, R.W. 1993. TFI SAR Processing Report. Internal Report, CCRS/Dendron Surveying,
Ottawa, Canada.
PILKEY, O.H., 1991. Coastal erosion. Episodes, 14, 46-51.
POHL, C. 1998. Tools and methods used in data fusion. In: GUDMANDSEN, P. (ed.), Future
Trends in Remote Sensing. pp Rotterdam, A.A.Balkema, p. 391-399.
PONTES F. C. & ASMUS H. E. 1976. The Brazilian marginal basins: current state of
knowledge. Anais da Academia Brasileira de Ciências, 48 (suplemento): 215-235.
POSAMENTIER, H.W. & VAIL, P.R. 1988. Eustatic controls on clastic deposition II - Sequence
and system tract models. In: WILGUS, C.K.; HASTINGS, B.S.; KENDAL, C.G.ST.C.;
POSAMENTIER, C.A.R.; VAN WAGONER, J.C. (ed.) Sea-level changes: an integrated
approach. Tulsa, SEPM, p.125-154.
POSAMENTIER, H.W.; JERVEY, M.T.; VAIL, P.R. 1988. Eustatic controls on clastic
deposition I- Conceptual framework. In: WILGUS, C.K.; HASTINGS, B.S.; KENDAL,
C.G.ST.C.; POSAMENTIER, C.A.R.; VAN WAGONER, J.C. (ed.) Sea-level changes: an
integrated approach. Tulsa, SEPM, p. 109-124.

214
PROST, M. T. 1997. La mangrove de front de mer en Guyane: ses transformations sous
l'influence du système de dispersion Amazonien et son suivi par télédétection. In: KJERFVE,
B.; LACERDA, L. D.; DIOP, E. H. S. (ed.). Mangrove ecosystem studies in Latin America
and Africa. Paris, UNESCO, p. 111-126.
RAMSEY III, E.W. & LAINE, S.C. 1997. Comparison of Landsat Thematic Mapper and high
resolution photography to identify changes in complex coastal wetlands. Journal of Coastal
Research, 13: 281-292.
RAMSEY III, E.W.; NELSON, G.A.; SAPKOTA, S.K. 1998. Classifying coastal resources by
integrating optical and radar imagery and color infrared photography. Mangroves and Salt
marshes, 2: 109-119.
RANEY, K. 1998. Radar fundamentals: technical perspective. In: HENDERSON, F.M. AND
LEWIS, A.J. (eds.), Principles & Applications of Imaging Radar. New York, John Willey &
Sons. p. 8-130.
READING H. G. & COLLINSON J. D. 1996. Clastic coasts. In: H.G. READING (ed.)
Sedimentary Environments: Processes, Facies and Stratigraphy. Oxford, Blackwell Science.
p. 154-231.
REBELO-MOCHEL, F. 1997. Mangroves on São Luís Island, Maranhão Brazil. In: KJERFVE,
B.; LACERDA, L. D.; DIOP, E. H. S. (eds.). Mangrove ecosystem studies in Latin America
and Africa. Paris, UNESCO, p.145-154.
REZENDE W. M. & FERRADAES J. O. 1971. Integração geológica regional da bacia
sedimentar da Foz do Rio Amazonas. In: CONGRESSO BRASILEIRO DE GEOLOGIA,
25. São Paulo. Anais...SBG. v.3, p. 203-214.
RHEAULT, M.; SIMARD, R.; GARNEAU, C.; SLANEY, V.R. 1991. SAR Landsat TM-
geophysical data integration utility of value-added products in geological exploration.
Canadian Journal of Remote Sensing, 17: 185-190.
RHODES, E.G. 1982. Depositional model for a chêniers plain, Gulf of Carpentaria, Australia.
Sedimentology, 29: 1-19.
ROCK-COLOR CHART COMMITTE. 1984. Rock-Color Chart. Netherlands, Huyskes-
Enschade.

215
ROSSETTI, D.F.; TRUCKENBRODT, W.; GÓES, A.M. 1989. Estudo paleoambiental e
estratigráfico dos sedimentos Barreiras e Pós-Barreiras na Região Bragantina, Nordeste do
Pará. Boletim do Museu Paraense Emílio Goeldi, Série Ciências da Terra, 1: 25-74..
RUDANT, J.P.; BALTZER, F.; DEROIN, J.P.; LOINTIER, M.; MAITRE, H.; MOUGLIN, E.;
PENICAND, C.; PROST, M.T. 1996. Apport des images radar satellitaires ERS-1 et JERS-1
dans le domaine de la cartographie générale et thématique en contexte tropical humide:
exemples en Guyane française et régions limitrophes. Société Française de Photogrammétrie
et Télédetection, 142: 15-33.
SANTOS, V.F. 1996. Estratigrafia holocênica e morfodinâmica atual da Planície Costeira da
Ilha de Algodoal e Marudá. Belém, Universidade Federal do Pará. Centro de Geociências.
128p. (Dissertação de Mestrado).
SCHAEFFER-NOVELLI, Y. & CITRON-MOLERO, G. 1999. Brazilian mangroves: a historical
ecology. Ciência e Cultura Journal, 51: 274-286.
SILVA, M.S. 1993. Estudo mineralógico dos sedimentos de fundo da Plataforma do Amazonas.
Belém, Universidade Federal do Pará. Centro de Geociências. 64p. (Trabalho de Conclusão
de Curso).
SILVA, M. S. 1996. Morfoestratigrafia e evolução holocênica da Planície Costeira de
Salinópolis, Nordeste do Estado do Pará. Belém, Universidade Federal do Pará. Centro de
Geociências. 142p. (Dissertação de Mestrado).
SIMMONS, D. 1997. Development planning guidelines for tourism development in coast areas
of Small Island States. . In: CAMBERS, G. (ed) Managing Beach Resources in the Smaller
Caribbean Island. Porto Rico, UNESCO. p. 237-247.
SIMÕES, M. F. 1981. Coletores - Pescadores ceramistas do litoral do salgado (Pará). Boletim do
Museu Paraense Emílio Goeldi, Nova Série Antropologia, 78: 1-33.
SINGHROY, V. 1992. Remote sensing in global geoscience processes: introductory remarks.
Episodes, 15: 3-5.
SINGHROY, V. 1995. SAR integrated techniques for geoharzard assessment. Advanced Space
Research, 15: 1167-1178.
SINGHROY, V. 1996. Interpretation of SAR images for coastal zone mapping in Guyana.
Canadian Journal of Remote Sensing, 22: 317-328.

216
SMITH, G.M.; SPENCER, T.; MURRAY, A.L.; FRENCH, J.R. 1998. Assessing seasonal
vegetation change in coastal wetlands with airborne remote sensing: an outline methodology.
Mangroves and Salt marshes, 2: 15-28.
SOUZA, C.R.G. & SUGUIO, K., 1996. Coastal erosion and beach morphodynamics along the
State of São Paulo (SE Brazil). Anais da Academia Brasileira de Ciências, 68: 405-424.
SOUZA FILHO, P.W.M. 1993. Oscilações do nível do mar na Plataforma Continental do
Amazonas. Belém, Universidade Federal do Pará. Centro de Geociências. 61p. (Trabalho de
Conclusão de Curso).
SOUZA FILHO, P.W.M. 1995. Influência das Variações do Nível do Mar na
Morfoestratigrafia da Planície Costeira Bragantina (NE do Pará) durante o Holoceno.
Belém, Universidade Federal do Pará. Centro de Geociências. 123p. (Dissertação de
Mestrado).
SOUZA FILHO, P.W.M. 2000. Mangroves as geological indicator of coastal changes. In:
MANGROVE 2000: CONFERENCE SUSTAINABLE USE OF ESTUARIES AND
MANGROVES. Recife, CD ROON …UFRPE/ISME.
SOUZA FILHO, P. W. M., 2000a. Impactos naturais e antrópicos na planície costeira de
Bragança. In: PROST, M. T. AND MENDES, A. C. (eds.), Impactos Ambientais em Áreas
Costeiras: Norte e Nordeste do Brasil e Guiana Francesa. Belém, Mus. Par. Emílio
Goeldi/UNESCO (In press).
SOUZA FILHO, P. W. M. 2000. Tectonic control on the coastal zone geomorphology of the
northeastern Pará State. Revista Brasileira de Geociências, 30: 523-526.
SOUZA FILHO, P.W.M. & EL-ROBRINI, M. 1995. Um exemplo de sistema deposicional
dominado por macromaré: A Planície Costeira Bragantina - NE do Pará (Brasil). In:
CONGRESSO DA ASSOCIAÇÃO BRASILEIRA DE ESTUDOS DO QUATERNÁRIO, 5.
Niterói. Anais... ABEQUA. p. 278-284.
SOUZA FILHO, P.W.M. & EL-ROBRINI, M. 1996. Seqüências estratigráficas do Holoceno
como conseqüência das variações do nível do mar na Planície Costeira Bragantina. In:
SIMPÓSIO DE GEOLOGIA DA AMAZÔNIA, 5. Belém. Anais... SBG. p. 203-206.
SOUZA FILHO, P.W.M. & EL-ROBRINI, M. 1996. Estratigrafia de seqüências da Planície
Costeira Bragantina, Nordeste do Pará, Brasil. In: CONGRESSO BRASILEIRO DE
GEOLOGIA, 39. Salvador. Anais... SBG. p. 275-277.

217
SOUZA FILHO P. W. M. AND EL-ROBRINI M. 1996. Morfologia, processos de sedimentação
e litofácies dos ambientes morfosedimentares da Planície Costeira Bragantina - Nordeste do
Pará (Brasil). Geonomos, 4: 1-16.
SOUZA FILHO, P.W.M. & EL-ROBRINI, M. 1997. A influência das variações do nível do mar
na sedimentação da Planície Costeira Bragantina durante o Holoceno - Nordeste do Pará,
Brasil. In: COSTA, M.L. & ANGÉLICA, R.S. (ed.) Contribuições à Geologia da Amazônia .
Belém, FINEP/SBG. p. 307-337.
SOUZA FILHO, P.W.M. & EL-ROBRINI, M. 1997. Chêniers: evidências morfológicas e
estratigráficas de antigas linhas de costa na Planície Costeira Bragantina, Nordeste do Pará -
Brasil. In: CONGRESSO DA ASSOCIAÇÃO BRASILEIRA DE ESTUDOS DO
QUATERNÁRIO, 6. Curitiba. Resumos Expandidos... ABEQUA. p. 147-150.
SOUZA FILHO P.W.M. & EL-ROBRINI M. 1998. As variações do nível do mar e a
estratigrafia de sequências da Planície Costeira Bragantina - Nordeste do Pará, Brasil.
Boletim do Museu Paraense Emílio Goeldi, Série Ciências da Terra, 10: 45-78.
SOUZA FILHO, P. W. M. & EL-ROBRINI, M. 2000. Coastal Zone Geomorphology of the
Bragança Area, Northeast of Amazon Region, Brazil. Revista Brasileira de Geociências, 30:
518-522.
SOUZA FILHO, P. W. M. & PARADELLA, W.R. Evaluation of Landsat Thematic Mapper and
RADARSAT-1 Data to Geological Mapping on a Mangrove Coast, Bragança, Pará,
Brazilian Amazon Region. Wetlands Ecology and Management (submitted).
STAR, J. & ESTES, J. 1990. Geographic information systems: an introduction. New Jersey,
Prentice Hall, 303p.
SUGUIO, K. 1973. Introdução à Sedimentologia . São Paulo, Edgard Blücher. 342p.
SUGUIO, K.; BITTENCOURT, A.C.S.P.; DOMINGUEZ, J.M.L.; FLEXOR, J.M.; AZEVEDO,
A.E.G. 1985. Flutuações do Nível Relativo do Mar durante o Quaternário Superior ao longo
do Litoral Brasileiro e suas implicações na Sedimentação Costeira. Revista Brasileira de
Geociências, 15:273-286.
SUGUIO K. & MARTIN L. 1976. Brazilian coastline Quaternary formations - The states of São
Paulo and Bahia littoral zone evolution schemes. Anais da Academia Brasileira de Ciências,
48 (suplemento): 325-334.

218
SUGUIO K. & MARTIN L. 1996. The role of neotectonics in the evolution of the Brazilian
coast. Geonomos, 4: 45-53.
SUMMERFIELD, M.A. 1991. Global geomorphology: an introduction to the study of landforms.
New York, Longman. 537p.
TOMAZELLI, L.J. & VILLWOCK, J.A. 1996. Quaternary geological evolution of Rio Grande
do Sul coastal plain, Southern Brazil. Anais da Academia Brasileira de Ciências, 68: 373-
382.
TOMAZELLI, L.J.; VILLWOCK, J.A.; DILLENBURG, S.R.; BACHI, F.A.; DEHNHARDT,
B.A. 1997. A erosão costeira e a transgressão marinha atual na costa do Rio Grande do Sul.
In: CONGRESSO DA ASSOCIAÇÃO BRASILEIRA DE ESTUDOS DO
QUATERNÁRIO, 6. Curitiba. Resumos expandidos... ABEQUA. p. 415-419.
TOMAZELLI, L.J.; VILLWOCK, J.A.; DILLENBURG, S.R.; BACHI, F.A.; DEHNHARDT,
B.A. 1998. Significance of present-day coastal erosion and marine transgression, Rio Grande
do Sul, Southern Brazil. Anais da Academia Brasileira de Ciências, 70: 221-229.
TOUTIN, T. 1995. Intégration de données multi-source: comparision de méthodes géométriques
et radiométriques. International Journal of Remote Sensing, 16: 2795-2811.
TOUTIN, T. 1995. Multisource data integration with an integrated and unified geometric
modeling. In: ASKNE, J. (ed.). Sensors and environmental applications of remote sensing.
Rotterdam, Balkema. p. 163-174.
ULBRICHT, K.A. & HECKENDORFF, W.D. 1998. Satellite images for recognition of
landscape and landuse changes. Journal of Photogrammetry & Remote Sensing, 53: 235-243.
VAN WAGONER, J.C.; POSAMENTIER, H.W.; MITCHUM, R.M.; VAIL, P.R.; SARG, J.F.;
LOUTIT, T.S.; HARDENBOL, J. 1988. An overview of the fundamentals of sequence
stratigraphy and key definitions. In: WILGUS, C.K.; HASTINGS, B.S.; KENDAL,
C.G.ST.C.; POSAMENTIER, C.A.R.; VAN WAGONER, J.C. (ed.) Sea-level changes: an
integrated approach. Tulsa, SEPM, p. 39-45.
VERSTAPPEN, H.T. & VAN ZUIDAM, R.A. 1991. The ITC system of geomorphologic survey.
Netherlands, ITC Publication nº 10, 89p.
VILLWOCK, J.A. 1987. Processos costeiros e a formação da costa sul e sudeste brasileira. In:
SIMPÓSIO SOBRE ECOSSISTEMAS DA COSTA SUL E SUDESTE BRASILEIRA,
Cananéia. Anais... SBG. p. 380-398.,

219
VITAL, H.; SILVEIRA, O.F.M.; TORRES, A.M.; SILVA, M.S.; SOUZA FILHO, P.W.M.;
FARIA Jr., L.E.C. 1991. Cone do Amazonas - Projeto MAR 3.1: Dados geológicos
preliminares. In: SIMPÓSIO SOBRE OCEANOGRAFIA, 2. São Paulo. Resumos...IOUSP.
p. 245.
WALD, L. 1998. An overview of concepts in fusion of Earth data. In: GUDMANDSEN, P. (ed.),
Future Trends in Remote Sensing. Rotterdam, A.A.Balkema. p. 385-390.
WOODROFFE, C. 1992. Mangrove sediments and morphology. In: ROBERTSON, A.I. AND
ALONGI, D. M. (eds.). Tropical mangrove ecosystems. Washington, AGU. p.7-41
WOODROFFE, C.D.; CHAPPELL, J.; THOM, B.G.; WALLENSKY, E. 1986.
Geomorphological Dynamics and Evolution of the South Alligator River and Plains,
Northern Territory. Australia National University. North Australia Research Unit. Mangrove
Monograph nº. 3. 190p.
WOODROFFE C. D., CHAPPELL J., THOM B.G., WALLENSKY E. 1989. Depositional
models of a macrotidal estuary and flood plain, South Alligator River, Northern Australia.
Sedimentology, 36: 737-756.
WOODROFFE, C.D. & MULRENNAN, M.E. 1993. Geomorphology of the Lower Mary River
Plains. Northern Territory. Darwin, Australia National University. 152p.
WRIGHT L. D., NIELSEN P., SHORT A. D., GREEN M. O. 1982. Morphodynamics of a
macrotidal beach. Marine Geology, 50: 97-128.
YANG, X.; DAMEN, M. C. J.; VAN ZUIDAM, R. A. 1999. Use of thematic mapper imagery
with geographic information system for geomorphologic mapping in a large deltaic lowland
environment. International Journal of Remote Sensing, 20: 659-681.
YOUNG, R. S.; BUSH, D. M.; PILKEY, O. H. 1996. Evaluating shoreline change and
associated risk from coastal hazards: An inexpensive qualitative approach. In: BERGER, A.
R. & IAMS, W. J. (ed.) Geoindicators: assessing rapid environmental changes in earth
systems. Rotterdam, Balkema. p. 193-206.
ZEMBRUSCKI S. G., BARRETO H. T., PALMA J. C., MILLIMAN J. D. 1972. Estudo
preliminar das províncias geomorfológicas da margem continental brasileira. In:
CONGRESSO BRASILEIRO DE GEOLOGIA SBG, 26. Belém, Anais...SBG. v.2, p. 187-
209.

ANEXO A – LISTA DE TRABALHOS PUBLICADOS E SUBMETIDOS À PUBLICAÇÃO
Souza Filho P.W.M. and El-Robrini M. 1998. As variações do nível do mar e a estratigrafia de
sequências da Planície Costeira Bragantina - Nordeste do Pará, Brasil. Boletim do Museu
Paraense Emílio Goeldi, Série Ciências da Terra, 10: 45-78.
Souza Filho, P. W. M. 2000. Tectonic control on the coastal zone geomorphology of the
northeastern Pará State. Revista Brasileira de Geociências, 30 (3): 523-526.
Souza Filho, P. W. M. and El-Robrini, M., 2000. Coastal Zone Geomorphology of the Bragança
Area, Northeast of Amazon Region, Brazil. Revista Brasileira de Geociências, 30 (3): 518-522.
Souza Filho, P. W. M. and Paradella, W.R. Evaluation of Landsat Thematic Mapper and
RADARSAT-1 Data to Geological Mapping on a Mangrove Coast, Bragança, Pará, Brazilian
Amazon Region. Wetlands Ecology And Management (Submitted).
Souza Filho, P. W. M.; Tozzi, H.A.M.; El-Robrini, M. Geomorphology, land-use and environmental
hazards in Ajuruteua macrotidal sandy beach, northern Brazil. Journal of Coastal Research,
Special Issue, Brazilian Sandy Beach (submitted).
Souza Filho, P. W. M. 2000. Impactos naturais e antrópicos na Planície Costeira de Bragança (NE
do Pará). In: Prost, M. T. and Mendes, A. C. (eds.) Impactos Ambientais em Áreas Costeiras:
Norte e Nordeste do Brasil e Guiana Francesa. Belém, MPEG/UNESCO. (in press).
Souza Filho, P.W.M. 2000. In: Mangroves as geological indicator of coastal changes. In:
International Mangrove Conference, Recife, ISME/UFRPE, Full Paper, CD ROM.
Souza Filho, P.W.M.; Paradella, W.R.; El-Robrini, M. 2000. Integrated techniques for coastal
geological mapping. In: International Geological Congress, 31, Rio de Janeiro, Brasil, Shell,
Abstracts Volume, CD ROM.
Souza Filho, P.W.M.; El-Robrini, M.; Paradella, W.R. 2000. Seasonal and long term dynamics of
Bragança coastal plain, Amazon Region, Brazil. In: International Geological Congress, 31, Rio
de Janeiro, Brasil, Shell, Abstracts Volume, CD ROM.
Souza Filho, P.W.M. and El-Robrini, M. 2000. Coastal zone geomorphology and sedimentology of
Bragança Area, Amazon Region, Brazil. In: International Geological Congress, 31, Rio de
Janeiro, Brasil, Shell, Abstracts Volume, CD ROM.

Souza Filho, P. W. M.; Tozzi, H.A.M.; El-Robrini, M. Geomorphology, land-use and
environmental hazards in Ajuruteua macrotidal sandy beach, northern Brazil. In: Brazilian
Symposium of Sandy Beaches. Itajaí-SC, Editora da UNIVALE, Proceedings.

ANEXO B
Mapa Geomorfológico da Planície Costeira de Bragança
Cs
r;0
e Al
(:oiro,i )
Bragança
Brasil / l j
LEGENDA
Vilarejos / Estradas
Geologia Costeira Canal estuarino Bancos de areia submersos Planície de areia Antigos bancos estuarinos Planície de lama Delta de maré vazante Crista de praia-barreira Dunas costeiras Crista de chenier Manguezal jovem de intermaré Manguezal de intermaré Manguezal de supramaré Pântano salino externo Pântano salino interno Planície de inundação fluvial Tabuleiro costeiro Manguezal degradado Manguezal regenerado Lago artificial Áreas urbanas
Mapa geomorfológico elaborado a partir da interpretação de produtos integrados RADARSAT F1 e Landsat TM . Parte integrante da tese de doutorado de P.W.M. Souza Filho (2000).