Embed Size (px)
Citation preview
UNIVERSIDADE FEDERAL DE SANTA CATARINA
PÓS-GRADUAÇÃO EM LETRAS/INGLÊS E LITERATURA
CORRESPONDENTE
THE PRODUCTION OF WORD-INITIAL // BY BRAZILIAN
LEARNERS OF ENGLISH AND THE ISSUES OF
COMPREHENSIBILITY AND INTELLIGIBILITY
THAÍS SUZANA SCHADECH
Dissertação submetida à Universidade Federal de Santa Catarina em
cumprimento parcial dos requisitos para obtenção do grau de
MESTRE EM LETRAS
FLORIANÓPOLIS
Fevereiro, 2013

ii
Esta Dissertação de Thaís Suzana Schadech, intitulada “The
production of word-initial // by Brazilian learners of English and
the issues of comprehensibility and intelligibility”, foi julgada
adequada e aprovada em sua forma final, pelo Programa de Pós
Graduação em Letras/Inglês e Literatura Correspondente, da
Universidade Federal de Santa Catarina, para fins de obtenção do
grau de
MESTRE EM LETRAS
Área de concentração: Inglês e Literaturas Correspondentes
Opção: Língua Inglesa e Linguística Aplicada
__________________
Prof. Drª. Susana Bornéo Funck
Coordenadora
BANCA EXAMINADORA:
__________________
Prof. Drª. Rosane Silveira
Orientadora e Presidente
_________________
Prof. Drª. Neide Cesar Cruz
Examinadora
__________________
Prof. Drª. Barbara O. Baptista
Examinadora
_________________
Prof. Drª. Raquel C. Souza
Ferraz D’Ely
Examinadora
Florianópolis, 22 de fevereiro de 2013.

iii
Acknowledgements
I would like to thank all those who somehow helped with
this piece of research. First of all, I am most grateful to Professor
Rosane Silveira, my advisor, especially for believing I was capable of
pursuing a Master’s degree when I did not believe in myself.
This thesis is also a result of a strong and unshakable
relationship. My husband was certainly as committed to it as I was. I
will always be grateful for all the support during this period.
I thank my family, for understanding and accepting that I
had to be away and that I could not spend as much time with them as
they deserved.
I also wish to thank my friends, who helped me to relax
during difficult times. Friends from bike trips, acroyoga lessons, gym,
all of them helped me a lot, even though they did not know that. I am
equally thankful for my friends from UFSC that were with me when I
needed the most. I will never forget what you have done for me.
This thesis would not exist without the participants. Thank
you for devoting some minutes of your precious time to contribute to
my research.
A special thanks go to my examination board. Thank you
for all the valuable contributions that improved this piece of research.
Finally, I would like to thank CNPq for providing me with
a Master’s scholarship during these two years.


v
ABSTRACT
THE PRODUCTION OF WORD-INITIAL // BY BRAZILIAN
LEARNERS OF ENGLISH AND THE ISSUES OF
COMPREHENSIBILITY AND INTELLIGIBILITY
THAÍS SUZANA SCHADECH
UNIVERSIDADE FEDERAL DE SANTA CATARINA
2013
Supervising Professor: Rosane Silveira
Brazilian Portuguese (BP) rhotics have many variations, and Brazilians
sometimes transfer the rhotics from BP to English when learning this
language, mainly in the early stages of acquisition (Osborne, 2008).
This process results in non-target productions of the rhotics, and in order
to help Brazilians to succeed when communicating with other non-
native (NNS) and native speakers of English (NSE), it is important to
investigate which non-target productions really hinder intelligibility and
comprehensibility. The concepts of intelligibility and comprehensibility
are different dimensions of language use that complement each other
(Munro, Derwing, & Morton, 2006). While intelligibility refers to what
the listeners actually understood, comprehensibility assesses the level of
difficulty faced by the listeners to understand speech samples (Munro,
Derwing, & Morton, 2006). Both dimensions can be affected by
variables such as the listener’s familiarity with the speaker’s first
language and/or accent, and the listener’s level of proficiency, among
other factors. The objective of this study was to investigate how
Brazilians’ non-target productions of // affect intelligibility and
comprehensibility when they are heard by other Brazilians and NSE. In

vi
order to achieve this objective, reading samples were recorded by BP
speakers of English as a second language and a NSE. Some of the
recordings containing target and non-target productions of 4 words
beginning with // were then presented to 2 groups of Brazilians and 1
group of NSE. Overall, results suggest that the replacement of // with
// hindered intelligibility and comprehensibility. Due to research
limitations, however, more studies need to be conducted so as to
confirm the results reported in this thesis.
Keywords: rhotics; intelligibility; comprehensibility; Brazilian
Portuguese;
Nº de páginas: 98
Nº de palavras: 26.489

vii
RESUMO
THE PRODUCTION OF WORD-INITIAL // BY BRAZILIAN
LEARNERS OF ENGLISH AND THE ISSUES OF
COMPREHENSIBILITY AND INTELLIGIBILITY
THAÍS SUZANA SCHADECH
UNIVERSIDADE FEDERAL DE SANTA CATARINA
2013
Professora Orientadora: Rosane Silveira
Os róticos do Português Brasileiro (BP) possuem várias variações, o que
às vezes induz os brasileiros a transferir a pronúncia dos róticos do PB
para o inglês, principalmente nos estágios iniciais de aprendizado
(Osborne, 2008). Tal processo geralmente resulta em produções não-
padrão dos róticos e, de forma a ajudar os brasileiros a serem bem
sucedidos na comunicação com outros falantes não nativos, bem como
falantes nativos do inglês, é de suma importância investigar quais
produções não-padrão realmente dificultam a inteligibilidade e a
compreensibilidade. Os conceitos de inteligibilidade e
compreensibilidade são dimensões diferentes do uso da língua que se
complementam (Munro, Derwing, & Morton, 2006). Enquanto a
inteligibilidade se refere ao que o ouvinte foi capaz de entender, a
compreensibilidade avalia o nível de dificuldade que os mesmos tiveram
em entender as amostras de fala (Munro, Derwing, & Morton, 2006).
Ambas as dimensões podem ser afetadas por variáveis, tais como o nível
de proficiência do ouvinte e a sua familiaridade com a primeira língua
do falante e/ou sotaque, entre outros fatores. O objetivo deste estudo foi
investigar como as produções não-padrão dos brasileiros afetam a
inteligibilidade e a compreensibilidade quando ouvidos por outros

viii
brasileiros e por falantes nativos de inglês. Para atingir este objetivo,
amostras obtidas a partir da leitura de frases foram gravadas por
brasileiros falantes de inglês e por um falante nativo de inglês. Algumas
das gravações que continham produções padrão e não-padrão de quatro
palavras com // em posição inicial foram apresentadas a 2 grupos de
brasileiros e 1 grupo de falantes nativos de inglês. Os resultados
sugerem que a substituição do // por // dificultou a inteligibilidade e a
compreensibilidade. No entanto, devido às limitações da pesquisa, mais
estudos precisam ser conduzidos para confirmar os resultados relatados
nesta dissertação.
Palavras-chave: róticos; inteligibilidade; compreensibilidade;
português brasileiro
Pages: 98
Words: 26.489

ix
TABLE OF CONTENTS
CHAPTER 1 INTRODUCTION...............................................1
1.1. Context of investigation 1
1.2. Objective and Research Questions 3
1.3. Significance of the Study 5
1.4. Organization of the Study 7
CHAPTER 2 REVIEW OF LITERATURE...........................8
2.1. Context of investigation 8
2.1.1. The pronunciation of rhotics in Brazilian Portuguese 10
2.1.2. The pronunciation of rhotics in English 16
2.2. The process of transfer from BP to English 18
2.3. Defining terms: comprehensibility and intelligibility 20
2.3.1. Variables involved in comprehensibility and intelligibility rating 22
2.3.2. Methodological concerns involved in comprehensibility and
intelligibility rating 26
CHAPTER 3 METHOD..........................................................30
3.1. The participants 30
3.1.1. The speakers 30
3.1.2. The listeners 31
3.2. Instruments 35
3.2.1. Instruments for speakers 35
3.2.2. Instrument for BP listeners (PPGI and Extra groups) 37
3.2.3. Instrument for NSE listeners 39
3.3. Procedures 40
3.3.1. Speakers’ data collection 40
3.3.2. Listeners’ data collection 43

x
3.4. Data Analysis 46
3.5. Summary of the chapter 50
CHAPTER 4 RESULTS AND DISCUSSION………...……51
4.1. The non-target production of // and the issue of intelligibility 51
4.1.1. Intra and inter-rater reliability with non-target and target
productions 52
4.1.2. BPSE non-target productions and intelligibility 60
4.2. The non-target production of // and the issue of comprehensibility 73
4.2.1. Rater-reliability with comprehensibility scores 74
4.2.2 BPSE non-target productions and comprehensibility results 79
4.3. The non-target production of // and the issues of intelligibility and
comprehensibility 84
4.4. The non-target production of // and the issue of familiarity 89
4.5. Summary of the chapter 95
CHAPTER 5 CONCLUSION.................................................96
5.1. Summary of overall results 96
5.2. Pedagogical Implications 98
5.3. Limitations of the study and suggestions for further research 99
REFERENCES.........................................................................101
APPENDICES...........................................................................112
xi
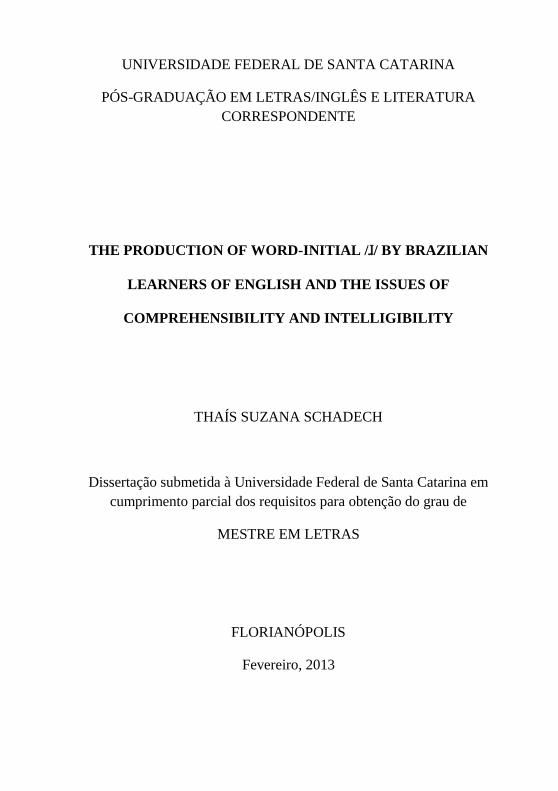
LIST OF TABLES
Table 1 – Possible variations of rhotics in word-initial position
according to most cited authors.................................................. 15
Table 2 – BPSE non-target pronunciations of word-initial // per tested word compared to their frequency in oral speech…... 43
Table 3 – Inter and intra-rater reliability per group of listeners
for ‘ropes’ [] (non-target pronunciation) produced by
Speaker 36................................................................................... 54
Table 4 – Intra and inter-rater reliability per group of listeners
for ‘rabbits’ produced by NSE Speaker 74........... 56
Table 5 – Inter-rater reliability of listeners’ transcriptions of
the words ‘ropes’, ‘rug’, ‘rated’, and ‘rabbits’ accurately
produced by one NSE in time 1.................................................. 58
Table 6 – Contingency table with the frequency of listeners’
transcriptions of ‘ropes’ pronounced as [] by two
different speakers and the Chi-square coefficient……………
62
Table 7 – Contingency table with the frequency of listeners’
transcriptions of ‘rug’ pronounced as by three different
speakers and the chi-square coefficient .....................................
65
Table 8 – Contingency table with the frequency of listeners’
transcriptions of ‘rated’ pronounced as by two
different speakers and the chi-square coefficient .......................
67

xii
Table 9 – Contingency table with the frequency of listeners’
transcriptions of ‘rabbits’ pronounced as ] by two
different speakers and the chi-square coefficient........................ 69
Table 10 – Level of unintelligibility caused by the non-target
production of//………………………………………………... 71
Table 11 – Inter-rater reliability in scores assigned to the same
recording repeated twice per group of listeners ………………. 75
Table 12 – Inter-rater reliability in scores assigned to all tested
words…………………………………………………………… 76
Table 13 – Comprehensibility mean scores assigned to the
NSE productions (rater-reliability)…………………………….. 77
Table 14 – Comprehensibility mean rates for the BPSE non-
target productions ……………………………………………... 79
Table 15 – Differences among groups of listeners regarding the
comprehensibility scores (Kruskall-Wallis test results)……….. 81
Table 16 – Mann-Whitney test results…………………………
82
Table 17 – Comparison between intelligibility and
comprehensibility data for ‘ropes’ pronounced as []…... 84
Table 18 – Comparison between intelligibility and
comprehensibility data for ‘rug’ pronounced as 85

xiii
Table 19 – Comparison between intelligibility and
comprehensibility data for ‘rated’ pronounced as 86
Table 20 – Comparison between intelligibility and
comprehensibility data for ‘rabbits’ pronounced as 87
Table 21– Contingency table of NSE transcriptions of ‘ropes’
pronounced as [], the Chi-square coefficient and
comprehensibility mean scores…………………………………
89
Table 22 – Contingency table of NSE transcriptions of ‘rug’
pronounced as the Chi-square coefficient and
comprehensibility mean scores ………………………………..
91
Table 23 – Contingency table of NSE transcriptions of ‘rated’
pronounced as the Chi-square coefficient and
comprehensibility mean scores…………………………………
92
Table 24 – Contingency table of NSE transcriptions of
‘rabbits’ pronounced as the Chi-square coefficient
and comprehensibility mean scores…………………………….
93

xiv
LIST OF FIGURES
Figure 1 – Articulatory position for syllabic ‘bunched r’ from six
speakers of American English…………………………………………17
Figure 2 – Level of intelligibility by different groups of listeners……25
Figure 3 – Example of intelligibility and comprehensibility task……38

xv
LIST OF APPENDICES
Appendix A – Speakers’ profiles................................................ 111
Appendix B – PPGI Profiles....................................................... 116
Appendix C – Extra Profiles....................................................... 118
Appendix D – NSE Profiles........................................................ 121
Appendix E – Operationalization of listeners’ level of
familiarity with BP......................................................................
123
Appendix F – Results regarding NSE level of familiarity with
BP................................................................................................
126
Appendix G – Homepage of the website Comprehensibility L2
Speech.........................................................................................
128
Appendix H – Speakers’ Instrument........................................... 129
Appendix I – PPGI and Extra Instrument................................... 134
Appendix J – NSE Instrument.................................................... 144
Appendix K – Chi-square Results............................................... 158
Appendix L – Inter-rater reliability with listeners’ rates for the
repeated recording of the word ‘ropes’ per group.......................
166
Appendix M – Reliability – Cronbach’s Alpha Results............. 169
Appendix N – Frequency and means of comprehensibility
scores for the NSE productions...................................................
171
Appendix O – Descriptive Statistics .......................................... 191
Appendix P – Mann-Whitney Test Results................................. 193
Appendix Q – Chi-Square Results – NSE familiarity………… 196

xvi
LIST OF ABBREVIATIONS
BP – Brazilian Portuguese
BPSE – Brazilian Portuguese Speaker(s) of English
EIL – English as an International Language
ESL – English as a Second Language
Extra – Extracurricular Course/Group
L1 – First Language/Mother Tongue
L2 – Second Language/Foreign Language
NS – Native Speaker(s)
NSE – Native Speaker(s) of English
NSE-F – Native Speaker(s) of English Familiar with BP accent
NSE-U- Native Speaker(s) of English Unfamiliar with BP accent
NNS – Non-native Speaker(s)
NNSE – Nonnative Speaker(s) of English
NTP – Non-target Pronunciation
PPGI – Programa de Pós-Graduação em Inglês/Group
SLA – Second Language Acquisition
TP – Target Pronunciation
UFSC – Universidade Federal de Santa Catarina

CHAPTER 1
INTRODUCTION
1.1. Context of investigation
Brazil is a large country with a wide range of dialects. One
of the features that distinguish the dialects is the production of the
rhotics (r sounds). For instance, people from Rio Grande do Sul may say
rata ‘mouse’ as [ˈ]1, but people who are born in Florianópolis tend
to pronounce this word as [ˈ] (Brenner, 2005)The position of the
rhotic in the word also influences the way it is pronounced, for example,
<r> in onset position, as in caro ‘expensive’, is pronounced as a tap [],
while the same grapheme can be pronounced as a retroflex [] in some
Brazilian Portuguese (BP) dialects. Conversely, in English, there are not
as many variations of the rhotics in word and syllable initial positions as
there are in BP (Deus, 2009). While American English has a retroflex
rhotic, in the Northwest of England the standard rhotic pronunciation is
the uvular fricative (Ladefoged & Maddieson, 1996) //. Thus a word
such as ‘red’ can be pronounced as [] or [] (see section 2.1.2 for
further details about the rhotics in English dialects).
With the intent of mapping the variations of the rhotics,
some studies on this sound in the world languages have been conducted
(Ladefoged & Maddieson, 1996; Ladefoged, 2001; Lindau, 1985).
Regarding the BP rhotics, many studies have been carried out to verify
and describe the different pronunciations of rhotics and their deletion in
BP (Bertani, 1998; Brenner, 2005; Brescancini & Monaretto, 2008;
Callou, Moraes, & Leite, 1998; Deus, 2009; Fraga, 2006; Monaretto,
2009; Monguilhott, 2007; Pedrosa & Cardoso, 2010; Reinecke, 2006;
Silva-Brustolin, 2009; Toledo, 2009). Related to these studies is the
transfer of rhotics from BP to English, an issue that has not been
1 In this study, transcriptions were made according to Cristófaro-Silva’s (2010)
recommendations.
2
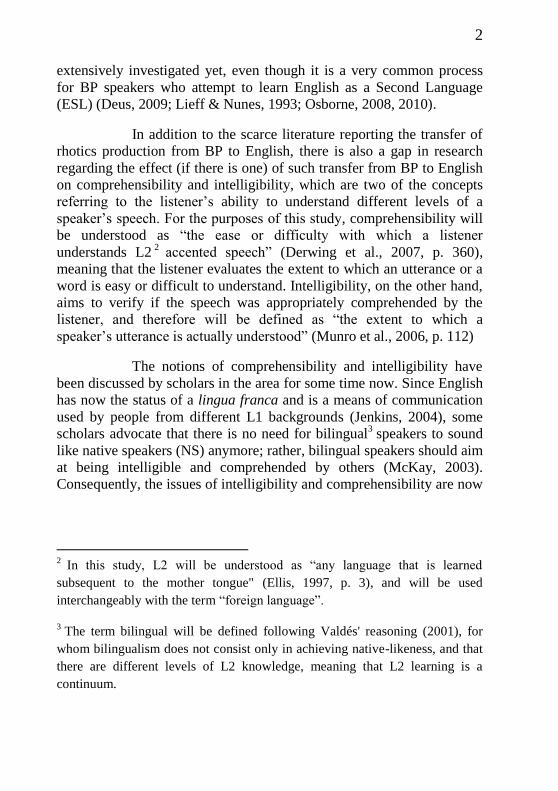
extensively investigated yet, even though it is a very common process
for BP speakers who attempt to learn English as a Second Language
(ESL) (Deus, 2009; Lieff & Nunes, 1993; Osborne, 2008, 2010).
In addition to the scarce literature reporting the transfer of
rhotics production from BP to English, there is also a gap in research
regarding the effect (if there is one) of such transfer from BP to English
on comprehensibility and intelligibility, which are two of the concepts
referring to the listener’s ability to understand different levels of a
speaker’s speech. For the purposes of this study, comprehensibility will
be understood as “the ease or difficulty with which a listener
understands L22
accented speech” (Derwing et al., 2007, p. 360),
meaning that the listener evaluates the extent to which an utterance or a
word is easy or difficult to understand. Intelligibility, on the other hand,
aims to verify if the speech was appropriately comprehended by the
listener, and therefore will be defined as “the extent to which a
speaker’s utterance is actually understood” (Munro et al., 2006, p. 112)
The notions of comprehensibility and intelligibility have
been discussed by scholars in the area for some time now. Since English
has now the status of a lingua franca and is a means of communication
used by people from different L1 backgrounds (Jenkins, 2004), some
scholars advocate that there is no need for bilingual3 speakers to sound
like native speakers (NS) anymore; rather, bilingual speakers should aim
at being intelligible and comprehended by others (McKay, 2003).
Consequently, the issues of intelligibility and comprehensibility are now
2
In this study, L2 will be understood as “any language that is learned
subsequent to the mother tongue" (Ellis, 1997, p. 3), and will be used
interchangeably with the term “foreign language”.
3 The term bilingual will be defined following Valdés' reasoning (2001), for
whom bilingualism does not consist only in achieving native-likeness, and that
there are different levels of L2 knowledge, meaning that L2 learning is a
continuum.

3
being discussed and investigated in the light of English as an
International Language (EIL4) (Sharifian, 2009).
1.2. Objective and Research Questions
Taking into account what has been previously stated
regarding the pronunciation of the rhotics in BP and English, the
transfer from one language to another and the issues of intelligibility
and comprehensibility in the context of EIL, the main objective of this
research is to investigate how each type of non-target pronunciation of
English word-initial // by Brazilian Portuguese speakers of English
(BPSE) affects comprehensibility and intelligibility when these speakers
are heard by native speakers of English (NSE) and other BPSE.
In order to achieve this objective, the first step was to
check what the possible productions of English word-initial // by
Brazilians were, and if they matched the ones predicted in the literature.
The second step was to examine which group of listeners had more
difficulty in comprehending the Brazilian accented //, taking into
account that three variables that can influence the results are a) listeners’
familiarity with the speaker’s accent, b) listeners’ and speakers’ mother
tongue (L1) background, and c) listeners’ level of proficiency. In
accordance with the objectives of this study, the questions and
hypothesis that guided this research were:
RQ1) How does the non-target pronunciation of English
word-initial // by BPSE affect intelligibility according to BPSE and
NSE listeners?
H1. The transfer of the fricatives [] or [] as allophones
for the word-initial position // will cause unintelligibility for the
listeners in general (Lieff & Nunes, 1993).
4 “EIL emphasizes that English, with its many varieties, is a language of
international, and therefore intercultural, communication” (Sharifian, 2009)

4
H2. BPSE listeners (PPGI and Extra) will provide more
accurate transcriptions of the BPSE utterances in comparison to the NSE
listeners, since BPSE participants share an L1 background and therefore
will be more attuned to the Brazilian accent in English.
H3. Less proficient listeners (Extra) will perform better
than more proficient L2/NSE listeners in the intelligibility tasks5, since
they will not be able to notice the difference between [ˈ] and
[ˈ] (Bent & Bradlow, 2003; Hayes-Harb, Smith, Bent, &
Bradlow, 2008; van Wijngaarden, Steeneken, & Houtgast, 2002).
RQ2) How does the non-target pronunciations of
English word-initial // by BPSE affect comprehensibility according
to BPSE and NSE listeners?
H4. Lower proficiency BPSE (Extra) will assign higher
comprehensibility rates in comparison to the other groups of listeners,
because they will not be able to notice the difference between the target
and non-target productions.
H5. Brazilian listeners in general will assign higher
comprehensibility rates to BPSE non-target pronunciation of // in
comparison to NSE (Bent & Bradlow, 2003; Harding, 2011; Imai,
Flege, & Walley, 2003; Major, Fitzmaurice, Bunta, & Balasubramanian,
2002; Munro & Derwing, 2006).
5 In this study, task will be defined according to Bygate, Skehan, and Swain
(2001) “a focused, well-defined activity, relatable to pedagogic decision
making, which requires learners to use language, with an emphasis on meaning,
to attain an objective, and which elicits data which may be the basis for
research”.

5
RQ3) How are the dimensions of comprehensibility and
intelligibility associated for the different groups of listeners?
H6. Listeners will transcribe the word according to what
they heard and intelligibility will be compromised, while they will
assign higher rates for comprehensibility, because they will believe they
transcribed what the speaker actually intended to say. In this sense,
lower proficiency listeners will perform better in intelligibility and
comprehensibility tasks than other Brazilians, who will perform better
than the NSE.
RQ4) Which group of NSE listeners have more
difficulty in understanding the Brazilian accented // in English
words regarding the dimensions of comprehensibility and
intelligibility?
H7. Familiar NSE listeners will be more accurate when
transcribing the tested words (intelligibility measure) and will assign
higher rates to BPSE productions (comprehensibility measure) (Cruz,
2008; Derwing & Munro, 1997; Gass & Varonis, 1984; Munro &
Derwing, 2006).
1.3. Significance of the Study
As previously stated, most studies on the production of the
rhotics are concerned with the description of these sounds (both in BP
and English) and the transfer of rhotics from Portuguese to English,
which usually leads to the production of non-target pronunciation (e.g.,
Deus, 2009; Osborne, 2010). However, so far no study has been carried
out with the intent of investigating the extent to which the non-target
pronunciations of English // in word-initial position affect (or not)
speakers’ comprehensibility and intelligibility. Actually, there are not
many studies concerning NNS intelligibility of English segments at all,
since most experiments still seek evidence of NNS accentedness in
English segments (e.g., Deus, 2009; Osborne, 2010).

6
Nevertheless, Munro & Derwing (2006) are part of a group
of scholars who have been advocating a change in Second Language
Acquisition (SLA) research and teaching, and suggest that there is a
need for more studies in the area of intelligibility and comprehensibility,
since “pronunciation instructors seeking to assist their L2 learners to
become effective communicators should concentrate on aspects of L2
phonology that affect intelligibility and comprehensibility, rather than
accentedness alone” (Munro & Derwing, 2006, p. 521).
In addition, most studies in the area of pronunciation have
been testing the comprehensibility and intelligibility of NNS through
NSE judgments. Yet, if we consider that nowadays there are more NNS
communicating in ESL than NSE (McKay, 2003), it seems that
restricting the analysis to NSE evaluation offers a limited view of the
facts. Nelson (2011, p.3), for instance, remarks that “users want to know
whether their English will serve them with other users who are not of
their immediate neighborhood, circle, region, or nation”. Likewise,
McKay (2003) and other scholars have proposed that NNS should
emulate other NNS who have overcome the obstacles in learning a
second language (L2) and are therefore considered to be successful in
communicating, instead of trying to achieve the so called native-like
competence.
Munro and Derwing (2011) also emphasize that most of the
research produced so far is not in accordance with the underlying
assumption that intelligibility is more important than accent when it
comes to effective communication (which is usually the ultimate
objective of learning an L2) and, therefore, it seems that the research
agenda is not in accordance with pedagogical interests either. Thus, this
study is also innovative and important in the sense that it aims to verify
the extent to which the pronunciation of a certain phoneme consonant
segment is comprehensible and intelligible to other speakers, not only
NSE, but NNS as well.
Following this rationale, the answers to the research
questions may enlighten teachers in relation to the teaching of English
rhotics, meaning that the results might indicate whether non-target
pronunciations of the word-initial // really hinder listeners’

7
comprehensibility and intelligibility of what L2 learners say, and, in
case they do, what type of deviation is most difficult for each group of
listeners to understand (NSE and BPSE). This way, teachers will
probably be more confident regarding the importance (or not) of
demanding a more comprehensible and intelligible pronunciation from
their students, and about whether or not it is important to have a native-
like pronunciation for the English //.
1.4. Organization of the Study
The present study is organized as follows: Chapter 2
provides an overview of the relevant literature concerning the
description of rhotics in BP and in English, as well as the description of
the transfer process of rhotics from BP to English; in addition, this
chapter deals with the issues of comprehensibility and intelligibility,
which are discussed in the light of English as a Lingua Franca. Then,
Chapter 3 presents a detailed description of the method and instruments
used in data collection and analysis, as well as the participants’ profiles.
In Chapter 4 the results are reported and discussed in terms of the
review of literature previously presented. Finally, Chapter 5 highlights
the main findings of the present research, its limitations and suggestions
for further studies, besides the main insights that emerged from the
results.

CHAPTER 2
REVIEW OF LITERATURE
This chapter begins with the most relevant literature
concerning the variations in the pronunciation of the <r> in Portuguese
and in English, as well as the process of transfer from Portuguese to
English by BPSE. This is followed by the discussion of terms related to
intelligibility. Finally, some of the variables involved in the rating of
comprehensibility and intelligibility are presented.
2.1. Context of investigation
Generally speaking, rhotics have been considered hard to
describe in most languages due to their variations across and within
languages. Ladefoged and Maddieson (1996) highlight that while most
languages have only one type of rhotic, there are others that have two or
more (e.g., Portuguese, Spanish). According to some authors
(Ladefoged, 2001; Lindau, 1985), the ways in which the <r> sounds are
pronounced vary not only across and within languages, but also
according to each speaker’s idiolect. Other sources of variation can also
be the position of the r-sound in the word (Cristófaro-Silva, 2005) and
the speaker’s age (Silva & Albano, 1999). However, even though there
is not a consensus concerning all the descriptions of <r> among
researchers, variations of rhotics are usually classified as “voiced or
voiceless vocoids, approximants, fricatives, trills, taps and flaps
produced at various places of articulation” (Eklund et al., 2005).
In the case of BP, the number of different realizations of
the <r> sounds is large. It is important to remark that, besides not
finding agreement among scholars concerning the description of the
rhotics both in BP and in English, there are also differences in the
selection of symbols that represent each segment. However, it is not the
intention of this study to focus on this discussion, since the main
objective here is to give a brief description of the rhotics in both
languages in word-initial position only.

9
Nevertheless, before moving on to the description of
rhotics in word-initial position, it is crucial to explain why this context
was chosen at the expense of other word-positions. First of all, it would
not be possible to examine the pronunciations of // by BPSE and their
intelligibility for all word-positions in this study. Therefore, I chose to
examine the production of this phoneme in word-initial position only,
based on Bent, Bradlow, and Smith's statement (2007) that errors in
word-initial position are more likely to hinder intelligibility if compared
to other word positions. If we relate this statement to the present study,
we could argue that NNS who produce non-target pronunciations of the
English / in word-initial position are more likely to be misunderstood
than NNS who have difficulty with this sound in medial or final word
position.
This claim is based on the activation-competition model of
lexical access, according to which “[…] word-initial segments play a
special role in activating lexical items since segmental information is
encoded sequentially and the encoding of initial segments activates
possible completions” (Bent et al., 2007, p. 336). This statement seems
to be supported by the results found by Bent et al. (2007) in a study on
intelligibility conducted with speakers of Mandarin-accented English, in
which the authors found that non-target productions of vowels and
consonants in word-initial position caused more problems for listeners
than non-target pronunciations of segments in other positions. In, fact,
when investigating if BPSE tended to transfer the pronunciation of
rhotics from BP to English, Deus (2009) verified that these speakers
were more likely to transfer the BP rhotics to English in word medial
and initial position (this study will be explained in more detail in section
2.2).
Clearly more empirical research is needed to support or
refute this argument, and albeit the present study does not aim to make a
comparison of the effects of non-target productions in different word
positions, it appears more logical to start the investigation focusing on
word-initial position, since non-target productions of consonants in this
environment are apparently more detrimental to intelligibility and
comprehensibility.

10
2.1.1. The pronunciation of rhotics in Brazilian Portuguese
As mentioned above, scholars have not reached an
agreement concerning the description of rhotics in BP. This is a result of
two factors: a) traditionally, research has focused on standard BP, which
usually consists of the varieties spoken in Rio de Janeiro and São Paulo;
b) more recent research has investigated other varieties of BP, but has
also been limited to certain regions and has tended to dismiss less
evident productions of the researched sound, as is the case of
Brescancini and Monaretto’s research (2008) about the dialects found in
the south of Brazil, and Cristófaro-Silva’s study (2010) on the typical
dialects from Minas Gerais. Even though initial studies in each region
are necessary so as to have a complete and detailed description of all
dialects, there is little empirical research overviewing all the rhotic
variants found in Brazil, both standard and dialectal ones, as remarked
by Reinecke (2006).
In spite of this gap, there seems to be an agreement
regarding the origin of two of the standard rhotic productions in BP, the
trill and the tap, which are believed to have emerged from Latin, even
though these sounds changed over time, resulting in the current variants.
Camara Jr. (1953; 2008), for example, explains how the tap (which he
calls the weak /r/), and the trill (multiple /r/) developed from the Latin
rhotics:
[...] our weak /r/ corresponds to a weakening of the simple
Latin /r/ in intervocalic position. Conversely, the multiple
/r/ elongates the Latin /r/, which is maintained – as the
other consonants – in initial or medial non-intervocalic
position (this was also the case with the geminate
consonant); therefore, this sound occurs for the same
reason in rei, genro, erra (Camara Jr., 1953; 2008, p. 78) 6
6 My translation. The original excerpt is: “[...] o nosso /r/ brando corresponde,
justamente, a um enfraquecimento do /r/ simples latino em consequência da
posição intervocálica. O /r/ múltiplo prolonga, ao contrário, o /r/ latino, mantido
– como as demais consoantes – em posição inicial ou medial não intervocálica,

11
Therefore, it can be inferred that Camara Jr. (1953; 2008)
claims that in standard BP only the trill occurs in word-initial position.
Thus, for this author, the tap occurs only in medial intervocalic-position,
in words like cara ‘face’, para ‘to’, arara ‘macaw’.
Likewise, Cagliari (2007) lists the following rhotic variants that
can be found in BP in word-initial position:
a) the voiceless velar fricative [], as in rato ‘mouse’ [],
which is the typical carioca pronunciation;
b) the voiceless uvular fricative [], as in roda ‘wheel’
[,which is also mentioned by Camara Jr. (2008);
c) the voiced glottal fricative [], as in roda ‘wheel’ [, or
the voiceless glottal fricative [], as in [, which are common
pronunciations of the mineiro dialect;
d) the retroflex (which can be classified as approximant in other
phonological models) [], as in roda ‘wheel’ [. Cagliari (2007)
claims that this is a typical pronunciation of the caipira dialect, which
can be found in Minas Gerais and in São Paulo.
From the list of possible variants above, we can perceive
that similarly to Câmara Jr. (1953; 2008), Cagliari (2007) does not
mention the occurrence of the tap in syllable onset position either, which
is reaffirmed in this statement:
In Portuguese, the tap usually occurs between a plosive
or labiodental fricative and a vowel, between two
vowels, and for certain speakers, it can also occur in the
como era a do caso especial da consoante geminada; temo-lo, pois, sempre pelo
mesmo motivo, em rei, Israel, genro, erra” (Camara-Jr., 1953; 2008, p. 78).

12
syllable coda before a consonant. In Portuguese, the tap
does not occur in the beginning of words (Cagliari,
2007, p. 41)7.
Cristófaro-Silva (2010) classifies the BP rhotics into four
groups according to manner of articulation: fricatives, taps, trills, and
retroflex. In word-initial position, however, this author claims that only
five realizations are possible: the voiceless alveolar trill, the voiceless
velar fricative, the voiceless glottal fricative, the voiced velar fricative,
and the voiced glottal fricative. According to this author, the trill occurs
in some BP dialects and idiolects, as in the paulista dialect, for example.
The voiceless alveolar trill is represented by the symbol [] (e.g., rata
‘mouse’ [ˈ). The voiceless velar fricative, represented by the
symbol [, is typical of the carioca and florianopolitano (in word-
initial position) dialects (Monaretto, Quednau, & Hora, 1996) (e.g., rata
‘mouse’ [ˈ)The voiceless glottal fricative, represented by the
symbol [, is a typical pronunciation of the dialect found in Belo
Horizonte (e.g., rata ‘mouse’ ˈ).
Cristófaro-Silva (2010) argues that the tap has only one
realization in BP, the voiced alveolar tap [], as in cara ‘face’ ˈ), and that it does not occur in word-initial positionHowever, other
authors such as Monaretto, Quednau, and Hora (1996), and Monaretto
(2009) disagree. These authors argue that bilingual speakers who live in
communities of European colonization replace the trill with the tap in all
positions of the word (Monaretto et al., 1996; Monaretto, 2009).
7
My translation. The original excerpt is: “O tepe em português ocorre
comumente entre uma oclusiva ou fricativa labiodental e uma vogal, entre duas
vogais, e, na pronúncia de certos falantes, também em posição final de sílaba
diante de uma consoante. Em português não ocorre o tepe em início de palavra”
(Cagliari, 2007, p. 41).

13
Likewise, Cristófaro-Silva (2010) explains that the
retroflex rhotic does not occur in word-initial position in BP.
According to her, it is considered to be a voiced alveolar in BP, and it
occurs in the coda, as in the word mar ‘sea’ ˈbeing a typical
production of the caipira dialect of Minas Gerais. Other authors show
evidence that this variation can be found in other regions as well, such
as in parts of Paraná (Botassini, 2009; Toledo, 2009), Rio Grande do
Sul (Callou, Moraes, & Leite, 1996), Santa Catarina (Monguilhott,
1998). In fact, Noll (2008) claims that the retroflex is part of dialects
from Rio Grande do Sul all the way to Rondônia. It should be also
mentioned that Cagliari (2007) and Monaretto (2009) claim that the
retroflex can occur in word-initial position, even though it is rare, as in
roda ‘wheel’ [ˈ.
Even though traditional classifications should always be
taken into consideration when analyzing segments of the language, it is
also crucial to pay attention to evidence from language in use, as in
studies that investigate the frequency of the rhotic variants (e.g., Bertani,
1998; Botassini, 2009; Brenner, 2005; Brescancini & Monaretto, 2008;
Callou, Moraes, & Leite, 1996; Callou, Moraes, & Leite, 1998; Costa,
2009; Dias, 2003; Fraga, 2006; Mollica & Fernandez, 2003; Monaretto,
2009; Monaretto, Quednau & Hora, 1996; Monguilhott, 1998,
Monguilhott, 2007; Noll, 2008; Pedrosa & Cardoso, 2010; Reinecke,
2006; Silva-Brustolin, 2009; Toledo, 2009). Three of these studies -
Brescancini and Monaretto (2008), Monaretto (2009), and Monaretto et
al. (1996) suggest that the tap is also found in word-initial position,
which deviates from the usual classification adopted by more traditional
scholars. Most data showing occurences of the tap in word-initial
position are from the VARSUL project8, and indicate that in certain
Brazilian communities of European colonization there are bilingual
speakers who replace the trill with the tap in all word positions. The
table below summarizes the occurences of each BP rhotic variant in
8 VARSUL (Variação Linguística Urbana no Sul do Brasil) is a data base of
spoken BP, and consists of interviews recorded by people from the South of
Brazil.

14
word-initial position according to the different authors mentioned
above.

15
Table 1
Possible Variations of Rhotics in Word-Initial Position
According to Most Cited Authors
Rhotic
allophones in
word-initial
position
Câmara
Jr.
(1953;
2008)
Cristófar
o-Silva
(2010)
Cagliari
(2007)
Brescancini &
Monaretto
(2008);
Monaretto
(2009);
Monaretto,
Quednau, &
Hora (1996)
Trill [] [ˈ]
Yes Yes No Yes
Voiced Velar
Fricative
[][ˈ] No Yes Yes Yes
Voiceless Velar
Fricative []
[ˈ] Yes Yes Yes No
Uvular
Fricative []
[ˈ] Yes No Yes Yes
Voiceless
Glottal
Fricative []
[ˈ]
No Yes Yes Yes
Voiced Glotal
Fricative []
[ˈ] No No Yes No
Retroflex []
[ˈ] No No Yes Yes
Tap
[[ˈ] No No No Yes

16
No: this author does not mention the occurrence of this variant in word-
initial position.
Yes: this author mentions the occurrence of this variant in word-initial
position.
Given the claims made about BP word-initial rhotics, the
trill, the velar and glottal fricatives, the tap, and the retroflex rhotics will
be investigated in this study as possible transfer variants from BP to
English, even though the retroflex is not expected to affect intelligibility
and comprehensibility, because of its similarity with the retroflex in
English. It is also important to highlight that all the phonetic
transcriptions in BP used in this study will follow the one suggested by
Cristófaro-Silva (2010), in order to avoid misunderstandings due to the
different symbols used by each author.
2.1.2. The pronunciation of rhotics in English
In Standard American English, rhotics in word-initial
position are usually pronounced as a retroflex [] similar to the BP
“caipira” <r> discussed above, or as an approximant. According to the
description provided by Uldall (1958), in some varieties of English the
<r> grapheme can be pronounced as an approximant, which is alveolar
or post-alveolar for “some speakers […], but a more complex
articulation occurs in the so-called 'bunched r'. This sound is produced
with constrictions in the lower pharynx and at the center of the palate,
but with no raising of the tongue tip or blade” (Uldall, 1958, as cited in
Ladefoged & Maddieson, 1996, p. 234). The articulatory position can be
visualized in Figure 1 below.

17
Figure 1 – “Articulatory position for syllabic ‘bunched r’
from six speakers of American English” (Ladefoged & Maddieson,
1996, p. 235)
Delattre and Freeman (1968, as cited in Ladefoged &
Maddieson, 1996, p. 234) claim that other American English speakers
“use a more or less retroflex articulation for [], which is also combined
with a constriction in the lower pharynx, as well as lip rounding”. There
is also variation regarding the British English rhotic, which is described
by Yavas (2011) as having no retroflexion, rather “[…] the tip of the
tongue approaches the alveolar area in a way similar to that of alveolar
stops, but does not make any contact with the roof of the mouth. This is
commonly described as a post-alveolar approximant” (Yavas, 2011, p.
70). Moreover, Ladefoged and Maddieson (1996) briefly describe other
variants of // in other English dialects:

18
Alveolar fricative is the standard rhotic in some urban
South African English dialects. Uvular rhotics (usually
fricative but occasionally the trill ) are a marker of the
Northumberland dialect spoken in the North West of
England and of the English of Sierra Leone. In Scottish
cities, such as Edinburgh and Glasgow the norm is an
alveolar tap . Despite stage caricatures of Scottish
speakers, it is only in the Scottish Lowlands (e.g., in
Galashiels) that an alveolar trilled is the most common
form (Ladefoged & Maddieson, 1996, p. 235-236).
Because of the orthographic “r”, some BPSE tend to
transfer the Portuguese rhotic pronunciations (fricative) to English,
which leads them to produce non-target pronunciations in English. As
explained before, there are two fricative allophones for the rhotics in
English dialects as well, although these allophones are not the standard
pronunciation of the rhotics. It is important to highlight that in this
study, the main objective is to investigate whether these non-target
pronunciations really have an effect on comprehensibility and
intelligibility, concepts that will be dealt with later.
2.2. The process of transfer from BP to English
The role of transfer in second language acquisition is now
accepted as one of the phenomena that take place in acquiring an L2.
Nevertheless, there is still disagreement concerning its definition, due to
the different trends of thought regarding the way and the extent to which
transfer occurs (Koda, 2007). In this study, transfer will be understood
as “automatic activation of well-established L1 competencies (mapping
patterns) triggered by L2 input” (Koda, 2007, p. 17), which implies that
the prior language structures are so rehearsed that they are recalled
automatically when learning the L2, and this process is likely to take
place throughout L2 acquisition, even though transfer might cease as the
learner becomes more proficient.
19
Even though studies describing rhotics in PB and in
English abound in the literature, studies regarding the process of transfer
of these sounds from Portuguese to English are still scarce, Deus (2009)
and Osborne (2010) being the only ones to report results in this area, to
my knowledge.
Deus (2009) tested 30 Brazilian English language
university students in order to check if they transferred the BP
production of <r> in word-initial position to English and whether there
was more transfer of this pronunciation in cognate words. Deus (2009)
found that students tended to transfer more when words contained <r>
in initial or in medial position, although there was not as much transfer
as he expected to find. The author explains that this may be due to the
easy level of the task applied to collect data (word-reading task).
Likewise, Osborne (2010) tested three BPSE who were
living in New York at the time of the data collection. The author
investigated if these participants transferred the BP pronunciation of <r>
to English in different positions of the word in free speech. Differently
from Deus (2009), Osborne (2010) found that the transfer occurred no
matter the position of <r> in the word. For instance, in word-initial
position, 3 out of 4 occurrences were produced as a fricative [], that is
to say, in a non-target manner. Osborne (2010) suggests that this process
is related to the difficulty participants had in perceiving the differences
between the realizations of this sound in the two languages.
In sum, there are not many studies on the transfer of rhotics
from Portuguese to English by BPSE (Deus, 2009; Osborne, 2010), and
the ones found yielded different findings, which is probably a result of
the different methods employed in the data collection. Hence, it is
important to conduct more studies to investigate to what extent the
transfer of this sound is recurrent for BPSE and should be a concern for
teachers of ESL.

20
2.3. Defining terms: comprehensibility and intelligibility
Non-native utterances can be evaluated in several
dimensions and the classifications and definitions of these dimensions
vary among studies. Evaluating intelligibility is, therefore, a difficult
task, due to several factors. Munro and Derwing (2011), for example,
relate the lack of a universal definition to the implications for teaching
and learning: “What has been missing until very recently is, first, a
conceptualization of intelligibility that assists teachers in setting
priorities and second, empirical evidence that identifies effective
practices” (p. 317).
A clear instance of the “lack of universal definition” just
mentioned is Cruz’s review (2007) of ten different dimensions related to
the term intelligibility from 1950 to 2003: intelligibility, effectiveness,
comprehension, comprehensibility, interpretability, understandability,
communication, accessibility, acceptability, and communicativity.
However, the most common dimensions found in the literature related to
the phonological aspects of speech, which are the focus of investigation
in this study, are intelligibility and comprehensibility. Different authors
have provided different definitions for these terms, some of them using
one term or another as a cover word for both and for other dimensions
as well. The more common definitions in the literature are the ones
provided by Smith and Rafiqzad (1979), Smith and Nelson (1987),
Munro and Derwing (1995)9.
Smith & Rafiqzad (1979) work with two concepts,
intelligibility and comprehension. For them, intelligibility is related to
the “capacity for understanding a word or words when spoken/read in
the context of a sentence being spoken/read at natural speed” (p. 371),
whilst comprehension “involves a great deal more than intelligibility”
(p. 371). Because their definition does not specify to what other aspects
9
Munro and Tracey first presented the definitions for intelligibility and
comprehensibility in 1995, which were improved and adapted as other studies
were published with the collaboration of other authors, for instance Derwing et
al. (2007) and Munro et al. (2006).

21
of speech they are referring, this explanation would not fit the purposes
of this study
Smith & Nelson (1985), on the other hand, present
definitions for three concepts: intelligibility, comprehensibility and
interpretability. These authors claim that intelligibility consists in
“word/utterance recognition” (p. 334), while comprehensibility refers to
its meaning, and interpretability would be, as the name itself suggests, a
deeper understanding of the word/utterance. Although this definition has
been used by some authors (Cruz, 2004, 2008; 2010; Jenkins, 2000;
Matsuura, Chiba, & Matsuda, 2010; Matsuura, 2007) the data gathered
in this study for comprehensibility does not match the definition given
to this concept by Smith and Nelson.
The definition of the terms comprehensibility and
intelligibility that seem to be most appropriate for this study are the ones
given by Derwing, Munro and Thomson (2007) and by Munro, Derwing
and Morton (2006), for their specificity and clarity. According to
Derwing, Munro and Thomson (2007), comprehensibility refers to “the
ease or difficulty with which a listener understands L2 accented speech”
(p. 360). Therefore, when checking for comprehensibility, the main
objective is to verify how easy or difficult a NNS’ speech is for a
listener to understand (along a scale). Derwing and Munro (2008)
complement this definition by stating that “[t]his dimension is a
judgment of difficulty and not a measure of how much actually gets
understood” (p. 478), and thus, comprehensibility is usually related to
how long it takes or how much effort is necessary for the listener to
understand the speaker’s speech (Derwing & Munro, 2008).
Intelligibility, on the other hand, aims to verify if what was
said by the speaker (usually a NNS) was accurately understood by the
listener (through orthographic transcription), as expressed in Munro and
Derwing's definition (1995, p. 291): “intelligibility refers to the extent to
which an utterance is actually understood”. As perfectly put by Derwing
and Munro (2008, p. 480), “[…] comprehensibility is about the
listener’s effort, and intelligibility is the end result: how much the
listener actually understands”. Thus, it is possible to infer that even
though these two concepts are intertwined, they are distinct dimensions
and the difference relies mainly on methodological issues, which will be
discussed in more detail in the next chapter.
22
A review of recent publications reveals that these authors’
definitions have been employed in several studies in the area (Becker,
2011; Delft, 2009; Gooskens, van Heuven, van Bezooijen, & Pacilly,
2010; Kennedy & Trofimovich, 2008; Major et al., 2002). Thus,
adopting their definitions is also an attempt to reach a consensus
regarding the concepts and methodologies concerning intelligibility and
comprehensibility.
2.3.1. Variables involved in comprehensibility and
intelligibility rating
Comprehensibility and intelligibility are usually evaluated
by listeners, in the sense that they tell what they have heard (Munro et
al., 2006) and then rate the level of difficulty in understanding nonnative
speech, usually by choosing a number on a scale (Derwing et al., 2007).
According to these authors, these procedures tend to produce reliable
results, as verified in the studies carried out by some researchers in the
area (Bent & Bradlow, 2003; Derwing & Munro, 1997; Kennedy &
Trofimovich, 2008; Munro & Derwing, 1995).
Such a measure of intelligibility and comprehensibility
might be affected by certain speaker and listener factors, which should
be taken into account in order to increase the reliability of the study.
Regarding the speaker, some related factors are rate of speech, number
of non-target productions, and voice quality, whilst some listener factors
are familiarity, L1 background, level of education, multilingualism, and
metalinguistic knowledge. Still other factors concern both the speaker
and the listener, like age, gender, and L2 proficiency. Because of space
constraints, only some of the variables relating to the listener will be
investigated in this study and discussed in more detail in the paragraphs
that follow.
Gass and Varonis (1984), for example, call our attention to
variables such as familiarity with the topic, with nonnative speech, with
a specific accent, and with a particular speaker, all of which are believed
to increase comprehensibility. These authors played recordings by 2
Japanese and 2 Arabic speakers reading sentences in English to 142

23
NSE. Even though these authors found that familiarity with the topic
seemed to facilitate listeners’ comprehensibility the most, results
indicated that familiarity with an accent also played an important role in
listening to NNS speech.
Derwing and Munro (1997) carried out an experiment with
Cantonese, Japanese, Polish, and Spanish intermediate ESL students,
whose speech was evaluated by NSE. These scholars asked the speakers
to narrate a story based on a series of cartoons. Parts of the recordings
were then heard by the NSE. Among other things, the authors asked the
NSE listeners to identify the speakers’ L1, as a way of checking whether
the listeners were in fact familiar with the accents they were listening to,
which most of them did successfully. Similar to the results found by
Gass and Varonis (1984), familiarity with an accent seemed to have a
positive effect on comprehensibility. Other studies that have come to the
same conclusions are Cruz (2008) and Munro et al., 2006).
The second listener variable is what Bent and Bradlow
(2003) label the interlanguage speech intelligibility benefit, which
suggests that listeners who share an L1 background with the speakers
will have an advantage over other listeners. These authors tested the
interlanguage speech intelligibility benefit with three groups of speakers
(Chinese, Korean, and English) and four groups of listeners
(monolingual English, Nonnative-Chinese, Nonnative-Korean, and
Nonnative-mixed). They found that (a) native listeners judged the native
speaker’s speech to be more intelligible than the nonnative speakers’;
(b) nonnative listeners judged the highly proficient NNS speech (from
the same L1 background) to be as intelligible as the NS; and (c) highly
proficient NNS were considered as (or more) intelligible than NS.
Bent and Bradlow (2003) point out that the interlanguage
speech intelligibility benefit may be explained in terms of phonologic
knowledge shared by the NNS of the same L1 background, which is
more extensive than the knowledge shared by a NNS with a different L1
and a NS of the target language. Thus, NNS of the same L1 background
are able to understand each other’s speech in situations that could be
misinterpreted by a NS or by a NNS of another L1 background.

24
Smith and Rafiqzad (1979), in a study related to Bent and
Bradlow’s interlanguage speech intelligibility benefit, tested the
following proposition: “[…] it is often maintained that the educated
native speaker is more likely to be intelligible to others than the
educated nonnative speaker” (p. 371). This proposition is therefore in
accordance with the mainstream reasoning that in order to be a
successful communicator in an L2 it is crucial to speak as accurately as
a NS of that language. Their findings, nontheless, reveal that for the
nonnative participants the speakers from the same L1 background were
as intelligible as the NSE, which justifies their conclusion: “since native
speaker phonology doesn’t appear to be more intelligible than non-
native phonology, there seems to be no reason to insist that the
performance target in the English classroom be a native speaker” (Smith
& Rafiqzad, 1979, p. 380). Other studies that corroborate the findings
just reported are Harding (2011), Imai et al. (2003), Major et al. (2002),
and Munro et al. (2006).
Some scholars view the two factors discussed above,
namely familiarity with an accent and L1 background advantage as the
same varible (e.g., Cruz & Pereira, 2006). In this study, however, the
two factors will be analyzed separetely so as to obtain more fine grained
results.
The third listener variable is listeners’ L2 proficiency.
Some studies have suggested that low proficiency L2 listeners have an
advantage over high proficiency listeners from the same L1 background,
as well as NS of the L2 (Bent & Bradlow, 2003; Hayes-Harb et al.,
2008; van Wijngaarden et al., 2002). For example, Hayes-Harb et al.
(2008) conducted a study in which Mandarin native speakers performed
an English production task that was later evaluated by Mandarin and
NSE listeners for intelligibility. Among other results, these authors
noticed that low proficiency listeners performed better than other
listeners (NNS and NS) when listening to a low proficiency Mandarin
speaker.
The results presented in this section leads to the proposition
that NNS will be more intelligible, in this order, to 1) BPSE with low
proficiency in the L2; d) BPSE in general regardless of their knowledge

25
of the L2; 3) NSE who are familiar with the BP accent English, and 4)
NSE who are not familiar with the BP accent in English. This
proposition can be more easily understood by looking at Figure 2.
Figure 2 – Level of intelligibility of NNS speech by
different groups of listeners
Even though it seems that by examining listener factors
(e.g., L1 background, familiarity with the speaker, and listener’s level of
proficiency) the focus of the study is on the listener’, in fact, this is a
way of examining the speaker-listener relationship (Bent & Bradlow,
2003). Thus, the variation in intelligibility and comprehensibility will
rely not only on the speakers, but on the relationship between the two
parts involved in the process of producing and understanding speech.
With this in mind, the present study aims to investigate these issues
through the collection of data from different groups of listeners, which
will be better described in the method chapter.

26
2.3.2. Methodological concerns involved in
comprehensibility and intelligibility rating
Another difficulty faced in the area of comprehensibility
and intelligibility studies is caused by the multiplicity of methods used
to collect data. Even when authors adopt the same definition, the
methods applied in their studies are different, making it almost
impossible to compare results and obtain more general conclusions. The
main differences concerns the type of sample and the method used to
collect data on intelligibility and comprehensibility.
As for the type of sample used to collect data, it is
worthwhile to mention that researchers have analyzed intelligibility and
comprehensibility both through samples of spontaneous speech and the
reading of words in isolation, sentences or texts.
At the word-level we find studies with samples containing
minimal pairs. For instance, Reis and Kluge (2008) tested the
intelligibility of 1 BPSE and 1 NSE when heard by a group of 10 BPSE
and a group of 10 Dutch native speakers. The speakers read 6
monosyllabic minimal pair words in isolation (e.g., cam/can). Then,
listeners had to choose between two given alternatives for each word.
The authors found that intelligibility was higher for the Dutch listeners,
although the BPSE listeners had the same L1 as one of the speakers.
Cruz (2005) also conducted a study with minimal pairs, but
these were generated in interviews with a NS and therefore placed in
sentences that provided a context and therefore prevented the listener
from getting confused because of the minimal pair words. According to
this author, although minimal pairs are believed to cause
misunderstandings, this is not the case with words in context. Thus this
issue should be investigated by more scholars so as to deconstruct this
myth.
Other studies have investigated intelligibility data gathered
through samples of reading aloud without minimal pairs (e.g., Bent &
Bradlow, 2003; Derwing & Munro, 1997; Gass & Varonis, 1984;
Tajima, Port, & Dalby, 1997). However, some scholars advocate that

27
speech elicited from speakers performing reading tasks does not
constitute a good sample to analyze intelligibility and
comprehensibility. For example, Algethami, Ingram, and Nguyen
(2010) argue that when reading, L2 speakers have the chance to monitor
themselves, which helps them to avoid deviation from the standard
production. On the other hand, Kenworthy (1987) advises that reading
aloud usually increases speakers' anxiety, which in turn leads them to
make mistakes they would not make otherwise. In addition, the author
highlights that reading aloud is not something people do in their daily
lives. It could also be argued that the sample would not resemble real
life, and that reading tasks might also have an impact on listeners, who
may remember the sentences or missing words by heart after listening to
the same sample many times (Kenworthy, 1987).
Even though reading-aloud tasks have several limitations,
they have the advantage of providing control over the sounds being
studied and the context in which these sounds occur, which allows the
researcher to make comparisons with other speakers and listeners’ data,
as pointed out by Algethami, Ingram, and Nguyen (2010). In addition,
in extemporaneous speech some speakers might avoid producing certain
sounds they have difficulty with, and thus leave the researcher without
the speech samples s/he needs in order to investigate certain
pronunciation features.
Derwing, Munro and Morton have been using speech
samples derived from extemporaneous speech to collect data on
intelligibility and comprehensibility (Derwing & Munro, 1997; Munro
et al., 2006; Munro & Derwing, 1995). In their studies they have asked
speakers from different L1s to narrate a story based on a series of
cartoons. The researchers select some excerpts, and listeners are asked
to orthographically transcribe what they have heard and then assign a
value using a 9-point Likert scale, where 1 means extremely easy to
understand, and 9 means impossible to understand.
Cruz has also been investigating intelligibility through the
assessment of speakers’ free speech. Her method differs in the sense that
speakers are interviewed by a NSE instead of being asked to narrate a
story, along with other methodological steps. For instance, in a study

28
conducted in 2003, listeners were also required to answer questions
about the speech deviations that hindered their understanding of the
speakers’ utterances while looking at the orthographic transcriptions
provided by the researcher. In this research, the results revealed that
word stress affected intelligibility the most.
In another study in which interviews were used as a way of
collecting speech samples, Cruz and Pereira (2006) asked listeners to
transcribe speakers’ utterances and indicate the words they had found a)
hard to understand, b) very hard to understand, and c) impossible to
understand, and then come up with possible explanations for the
mentioned difficulties. One of the purposes of the study was to
investigate the influence of familiarity with the BP accent, which
constituted an advantage for BPSE listeners, who seemed to understand
the BPSE utterances better than the NSE. Another procedure used by
Cruz (2008) to improve the data collected from the listeners’
orthographic transcriptions and the assessment of level of intelligibility
through a 6-point scale, was to ask the listeners to tell the speakers’
nationality. This procedure was used to check listeners’ familiarity with
accent, which was again, found to have a positive impact on
intelligibility.
In order to find a balance between control over the free
speech samples and at the same time avoid monitoring strategies by
speakers, Algethami, Ingram and Nguyen (2010) have proposed another
procedure. In their study, speakers were required to paraphrase some
sentences. According to them, it was intended to “[…] place a moderate
cognitive load on the L2 speakers so that they would be preoccupied
with formulating the sentences rather than with monitoring their
pronunciation. It also offered a way to control the lexical items to be
included in the listening task” (Algethami, Ingram, & Nguyen, 2010, p.
31).
The ideal sample, according to Kenworthy (1987),
demands well-developed research skills. It would be best to test the
speakers’ intelligibility in real interaction with listeners, but it is not
necessary to state all the difficulties of this procedure. In addition,

29
Derwing & Munro (2008) remind us that "while there are many ways of
assessing intelligibility, no one way is fully adequate" (p. 479).
In a study carried out under time constraints (the case of the
present study), it is necessary to have more control over the samples
obtained from the speakers, and therefore I chose a reading aloud
procedure with a set of sentences containing words that form minimal
pairs as a way of testing Cruz’s claims (2005) regarding the use of
minimal pairs in intelligibility data collection, which may confuse
listeners. Subsequently, listeners transcribed the word that was missing
from a sentence they heard and assigned a value from 0 to 9, in which 0
meant very difficult to understand and 9 referred to very easy to
understand. This interpretation of the scale seems more intuitive than
Munro and Derwing’s scale (1995), for example, since 0 is more
intuitively attributed to difficulty.
2.5. Summary of the chapter
It was seen in this chapter that the grapheme <r> has
different pronounciations in BP, and some of them may be transferred to
English when Brazilian speakers attempt to learn this language.
In addition, this chapter discussed the complexity of
defining and measuring intelligibility, and the fact that many definitions
and different methods have been used in data collection. It was pointed
out that this makes it hard to compare results and make
recommendations for teachers regarding the importance of teaching or
not certain segments, taking into consideration that students should be
able to communicate effectivily, rather than following native-like
models. Moreover, several speaker and listener factors were discussed
as having an effect on intelligibility and comprehensibility results,
which must be accounted for when collecting data.

CHAPTER 3
METHOD
The primary objective of this chapter is to provide a
general overview of the method used in the data collection, including
the main characteristics of the participants who provided the data to be
analyzed in this study, as well as the instruments used for data
collection, and the respective procedures for data analysis.
3.1. The participants
The participants had different roles in the data collection and,
therefore, are divided into speakers and listeners. Each group will be
described below.
3.1.1. The speakers
Since the focus of the study is to check the level of
comprehensibility and intelligibility of English words containing non-
target pronunciations of word-initial // as produced by Brazilians, 40
Brazilian speakers of ESL and 2 native speakers of English (one
American and one British English speaker) participated in the data
collection. The Brazilian speakers were: a) 17 students from the Letras
Inglês undergraduate program at the Universidade Federal de Santa
Catarina (UFSC – mostly 2nd
semester); b) 11 students from the
Secretariado Executivo undergraduate program at UFSC (3rd
semester);
c) 9 students from the distance learning Letras Inglês undergraduate
program at UFSC (EaD, from various semesters); d) 2 students from the
Letras Inglês Master’s program at UFSC; and e) 1 student from the
Letras Inglês/Português undergraduate program at UNIFRA (Santa
Maria/RS).

31
BP speakers’ ages ranged from 16 to 47 (M= 26,7). The
majority of the speakers had lived most of their lives in Santa Catarina10
(27 speakers - 69,23%), whereas 7 had lived in Rio Grande do Sul11
(17,94%), 3 in Paraná12
(7,69%), 1 in São Paulo (SP) and 1 in Assu (Rio
Grande do Norte). Concerning gender, 53,84% of the participants were
women (21 speakers), and 46,16% were men (18 speakers). The
speakers’ profiles can be seen in more detail in Appendix A (p. 111).
The American English native speaker was from Utah and had been
living in Brazil for more than a year.
3.1.2. The listeners
As mentioned in Chapter 2 (section 2.3.2), listener
judgments are the basis of research in intelligibility and
comprehensibility and the reliability of this procedure is claimed by
Derwing and Munro (2008, p. 478): “[…] what listeners perceive is
ultimately what matters most. […] This is a very reliable approach to
assessing accentedness and comprehensibility”. In addition, Munro et al.
(2006) highlight the importance of testing intelligibility with listeners
with whom the speakers are more likely to interact with. Thus, in order
to assure the study’s validity and gather valuable data to investigate the
issues of familiarity, L1 background and level of proficiency, various
groups of listeners participated in this study.
10
Cities of Santa Catarina where the participants had spent most of their lives,
in order of frequency: Florianópolis (12), São José (4), Brusque (2), Concórdia
(2), Águas de Chapecó (1), Araranguá (1), Campos Novos (1), Joinville (1),
Palhoça (1), Petrolândia (1), Tijucas (1).
11 Cities of Rio Grande do Sul where the participants had spent most of their
lives, in order of frequency: Porto Alegre (2), São Leopoldo (2), Alegrete (1),
Frederico Westphalen (1), Pelotas (1).
12 Cities of Paraná where the participants had spent most of their lives, in order
of frequency: Cascavel (1), Chopinzinho (1), Curitiba (1).

32
Three groups of listeners took part in this study, formed as
follows: a) one group of 28 native speakers of English, which will be
referred to as NSE; b) one group of 24 advanced Brazilian speakers of
English (Master’s and Doctoral students and former students from the
Graduate Program in Letras Inglês at UFSC, which will be referred to as
PPGI), and c) one group of 21 Brazilian learners of ESL (students from
the advanced level of the Extracurricular English Courses at UFSC,
which will be referred to as Extra from now on). Differently from the
PPGI group, which was formed mainly of English teachers and
linguists, the Extra participants were students from different courses at
UFSC and therefore can be considered less proficient L2 speakers, as
well as less experienced concerning their metalinguistic knowledge in
English. A group with these characteristics is important for this study to
test the impact of listener level of proficiency regarding intelligibility
and comprehensibility, as discussed in section 2.3.1. All listeners
reported having no hearing problems and each group will be described
in detail below.
The PPGI group consisted of 20 women and 4 men, whose
ages ranged from 24 to 49 (M=32.92). The majority of participants from
this group were born in Rio Grande do Sul13
(7) and Santa Catarina14
(6), while the others were from São Paulo15
(4), Paraná16
(3), Rio de
13
Cities of Rio Grande do Sul where the participants were born: Dois Irmãos,
Pelotas, Porto Alegre, Rio Grande, Santa Bárbara, São Luiz Gonzaga, and
Torres. 14
Cities of Santa Catarina where the participants were born, in order of
frequency: Florianópolis (2), Chapecó, Criciúma, Garopaba, and Gaspar. 15
Cities of São Paulo where the participants were born, in order of frequency:
São Paulo (3), and Santos (1). 16
Cities of Paraná where the participants were born, in order of frequency:
Maringá (2), and Londrina (1).

33
Janeiro17
(2), Minas Gerais18
(1) and Piauí19
(1). Most of them speak
another language besides BP and English (79.6%). A more complete
profile can be seen in Appendix B (p.116).
The Extra group consisted of 15 men and 6 women, whose
ages ranged from 18 to 50 (M=25.09). The majority of them were born
in Santa Catarina20
(13 listeners – 61.9%), whereas 2 were born in Rio
Grande do Sul21
(9.52%), 2 in São Paulo city (9.52%), 1 in the capital of
Pará, 1 in the capital of Paraíba, 1 in the capital of Paraná, and 1 in Rio
de Janeiro city. The majority of them speak another language in addition
to BP and English (61.9%). A table with more information regarding
their profiles is provided in Appendix C (p. 118).
NSE listeners’ ages ranged from 18 to 62 (M = 36.28). The
majority of them were born in the United States of America22
(17
17
Cities of Rio de Janeiro where the participants were born: Petrópolis (1), and
Rio de Janeiro (1). 18
City of Minas Gerais where the participant was born: Cruzília. 19
City of Piauí where the participant was born: Teresina. 20
Cities of Santa Catarina where the participants were born, in order of
frequency: Florianópolis (5), Blumenau, Catanduvas, Concórdia, Criciúma,
Joinville, São José, São Miguel do Oeste.
21 Cities of Rio Grande do Sul where the participants were born: Porto Alegre e
Uruguaiana.
22 Cities of the United States of America where the participants were born, in
order of frequency: Chicago – Illinois (2), Frederick - Maryland, Provo - Utah,
Glens Falls – New York, Pawtucket - Rhode Island, Aurora – Illinois, Santa
Ana – California, La Jolla – California, Bronx – New York, Springfield –
Massachusetts, Johnson City – Tennessee, Fairfield – California, St. Louis –
Missouri, Prescott – Arizona, Denver – Colorado, Yonkers – New York.

34
listeners – 60.71%), 7 in England23
(25%), 3 in Australia24
(10.71%),
and 1 in New Zealand25
(3.57%). Unfortunately, it was not possible to
control for gender, so that 35.71% of the participants in this group were
women (10 listeners), and 64.29% were men (18 listeners). According
to their answers, 82.14% of them reported speaking at least one other
language besides English, and 39.28% of them reported speaking BP.
Because of methodological reasons that will be discussed
in more detail in section 3.4, the NSE group was split into two in the
analysis of the results of Research Question 4 in order to investigate the
influence of NSE familiarity with the BP accent on comprehensibility
and intelligibility. The categorization of listeners into familiar listeners
and unfamiliar listeners was based on their answers to the questionnaire.
First, the question alternatives were assigned a value, and then listeners’
answers were operationalized so as to obtain each listener’s total value.
Listeners whose scores ranged from 0 to 6.99 fell into the unfamiliar
category, while listeners’ scores ranging from 7 to 10 were categorized
as familiar listeners. The operationalization of these questions and the
listeners’ classifications appear in Appendix E (p. 123) and F,
respectively (p. 126).
Upon the classification of listeners, each group was formed
by 14 listeners. The group of familiar listeners was formed by Listeners
3, 4, 5, 9, 16, 18, 23, 28, 42, 43, 47 50, 60 and 69, being 11 men and 3
women. The group’s age ranged from 18 to 62 (M=37.5). The group of
unfamiliar listeners was formed by Listeners 6, 13, 21, 32, 38, 39, 49,
52, 53, 58, 59, 61, 71, and 72, being 7 men and 7 women. The group’
23
Cities of England where the participants were born: London – London (2),
West Midlands – Birmingham, Pretty Good – London, Middlesex – London,
Haslemere – Surrey.
24 Cities of Australia where the participants were born: Sydney - New South
Wales, Hobart – Tasmania, Perth - Western Australia.
25 City of New Zealand where the participant was born: Christchurch –
Canterbury.

35
age ranged from 19 to 61 (M=38.14). The NSE profiles can be seen in
more detail in Appendix D (p. 121).
3.2. Instruments
The website “Comprehending L2 Speech”
(www.comprehendingl2speech.com) was designed for collecting data
from speakers and listeners (Appendix G, p. 128). On-line data
collection on intelligibility and comprehensibility was also adopted by
Algethami et al. (2011), but in their study the authors e-mailed the
listeners, who then emailed back their responses. In this study the
website was necessary mainly as a means of collecting data from
listeners who should not have much contact with the BP accent.
Different questionnaires and tests were designed and applied to the
different groups of participants, and each one will be described as
follows.
3.2.1. Instruments for speakers
An online instrument was designed for the speakers, which
was written and answered in BP (Appendix H, p. 129). The instrument
consisted of four parts:
(a) Consent form: The consent form identified the
researcher and the context of the research, confirmed the confidentiality
of participants’ identity, briefly explained the procedures of the data
collection (steps, duration, and other information) and asked for
participants’ permission to use the data provided by them (Appendix H,
p. 129).
(b) Questionnaire about participants’ bio-data: In this
questionnaire, the speakers were asked to fill in their name, date and
place of birth, place where they had lived most of their life (so as to
enable the identification of their BP dialect and possible transfer in the
pronunciation of the rhotics), current residence, level of education,

36
knowledge of foreign languages (including English), and level of
proficiency in each one (Appendix H p. 130-131).
(c) English sentence-reading test: This test consisted of 20
sentences in English, and 20 sentences in BP. The sentences in English
were designed so that they could sound ambiguous, depending on the
pronunciation; that is, 10 of the English sentences contained words
starting with rhotics that could have another meaning in case the
participant pronounced the rhotics as fricatives (‘rabbits’, ‘rug’, ‘ride’,
‘rated’, ‘rats’, ‘roof’, ‘ropes’, ‘rank’, ‘racks’, ‘rights’). In these
sentences, the preceding environment was controlled: it was always a
vowel (e.g., She abandoned two rabbits). In addition, 10 distracter
sentences were added to the test so that the participants would not be
able to identify the sound being investigated, as this could lead them to
monitor themselves and improve their pronunciation, or could make
them nervous and worsen their pronunciation. The sentences can be
seen in Appendix H (p. 132) (the odd sentences contain rhotics in word-
initial position, while the even sentences are the distractor ones).
(d) BP sentence-reading test: The sentences in Portuguese
were designed with the intent to verify the allophone the participants
used to pronounce the <r> grapheme in BP. As in the English sentences,
there were distractor sentences in the BP test too, so that the participants
would not focus on the rhotics, which could lead them not to read the
sentences naturally. Fifteen of the 20 BP sentences (sentences 1, 2, 3, 5,
6, 7, 8, 10, 11, 12, 14, 15, 17, 18, and 19 from Appendix H, p. 133)
contained words with rhotics in different word positions (VrV, VrrV, r_,
_r, VrC), so that it would be easier for the researcher to identify the
speaker’s rhotic allophone.
In both BP and English sentences, the researcher was
careful to create short simple sentences, since too much content and
information could hinder the listeners evaluation of the speakers’
intelligibility and comprehensibility later on. Likewise, simple sentences
were important to help the speakers to read without stumbling very
often with unusual words.

37
3.2.2. Instrument for BP listeners (PPGI and Extra groups)
The instrument to collect data from the Brazilian listeners
consisted of a consent form and a questionnaire to elicit the participants’
bio-data (similar to the ones used with the speakers), plus a listening
task to collect data about comprehensibility and intelligibility, and a
complementary question about comprehensibility and intelligibility of
BPSE. The listening task consisted of instructions, training, and data
collection. The instrument can be seen in Appendix I (p. 134).
The instructions provided the participants with the steps
they would have to follow when performing the comprehensibility and
intelligibility tasks (see the procedures for data collection in section
3.3.2). The recordings used in the instructions were retrieved from the
BBC website (2011). The training gave the participants the chance to
practice the steps of data collection by listening to and evaluating three
excerpts, which were retrieved from “The Speech Accent Archive”
website26
(Weinberg, 2011). The excerpts used in the training section
focused on words different from the ones used in the test, but the task
was similar in the sense that speakers’ recordings of the sentences
containing the rhotic words were played to the listeners. The listeners
saw a screen with a written version of the recorded sentences, each one
with a word replaced by a box, where they were asked to transcribe the
missing words, according to what they had heard. Then the listeners
were asked to rate the comprehensibility of the missing word on a scale
ranging from 0 (very difficult to understand) to 9 (very easy to
understand).
An example of the form containing the intelligibility and
comprehensibility tasks is displayed below in Figure 3. The decision to
use a large scale like this was based on Munro and Derwing's
26
The Speech Accent Archive “uniformly presents a large set of speech
samples from a variety of language backgrounds. Native and non-native
speakers of English read the same paragraph and are carefully transcribed. The
archive is used by people who wish to compare and analyze the accents of
different English speakers (Weinberg, 2011).
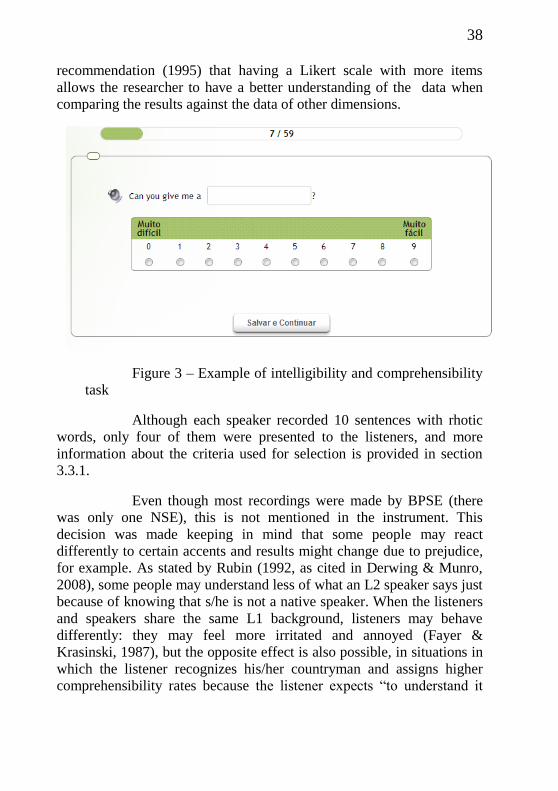
38
recommendation (1995) that having a Likert scale with more items
allows the researcher to have a better understanding of the data when
comparing the results against the data of other dimensions.
Figure 3 – Example of intelligibility and comprehensibility
task
Although each speaker recorded 10 sentences with rhotic
words, only four of them were presented to the listeners, and more
information about the criteria used for selection is provided in section
3.3.1.
Even though most recordings were made by BPSE (there
was only one NSE), this is not mentioned in the instrument. This
decision was made keeping in mind that some people may react
differently to certain accents and results might change due to prejudice,
for example. As stated by Rubin (1992, as cited in Derwing & Munro,
2008), some people may understand less of what an L2 speaker says just
because of knowing that s/he is not a native speaker. When the listeners
and speakers share the same L1 background, listeners may behave
differently: they may feel more irritated and annoyed (Fayer &
Krasinski, 1987), but the opposite effect is also possible, in situations in
which the listener recognizes his/her countryman and assigns higher
comprehensibility rates because the listener expects “to understand it

39
[the speech] better than the other speech samples” (Munro et al., 2006,
p. 127).
Likewise, another listener factor that may interfere with the
results concerning intelligibility and comprehensibility is the knowledge
of other languages (multilingualism), which is why the listeners were
asked about the languages they speak and their level of proficiency in
these languages. Even though this is not the main focus of this study,
this factor will be investigated in further research.
The last part of the data collection with BPSE aimed to
map the main BPSE pronunciation problems that might lead to
unintelligibility and lack of comprehensibility from the perspective of
the BPSE themselves. This question was intended to investigate if BPSE
really think that the way Brazilians pronounce the English // can cause
intelligibility and comprehensibility problems, without focusing only on
this sound, which could influence their answers. Thus, in this task
participants were asked to rank the level of difficulty that some listeners
might have when listening to BPSE that have a hard time pronouncing
certain segments (e.g., pronunciation of vowels), including the
pronunciation of //. Finally, participants were also allowed to give more
examples of other difficulties that they thought that Brazilians face
when learning English (Appendix I, p. 131).
3.2.3. Instrument for NSE listeners
The instrument that was used to collect data from NSE is very
similar to the one just presented in section 3.2.2, but it is in English and
contains questions about NSE familiarity with BP, so that they could be
grouped according to their level of familiarity with BP later on
(Appendix J, p. 134) in order to verify the effect of this variable in the
present study.

40
3.3. Procedures
This section will provide a detailed description of the
procedures followed during speakers and listeners’ data collection, as
well as the procedures regarding the pilot tests that preceded the actual
collection.
3.3.1. Speakers’ data collection
Speakers’ data were collected from September to
December 2011, through the website designed for this research. Even
though the instrument was online, the researcher scheduled individual
appointments with most of the participants so as to have more control
over how the task was performed and to guarantee good quality
recordings. The participants did not know that the focus of the research
was on rhotics, and neither were they allowed to read the sentences
before being recorded; instead, they were told to read the sentences as
naturally as possible, and in the case of the BP sentences, they were
even asked to keep their accent. When participants stuttered, hesitated or
missed a word, the researcher asked them to pause and read the whole
sentence again, so that later on listeners would not benefit from
repetitions of words, for example.
These meetings with the speakers were not possible,
however, with students from the Letras-English distance learning
program, who then answered the online questionnaire and recorded
themselves at home, and sent the recordings through the website. Albeit
the quality of most of the recordings was not as good as the ones
recorded by the researcher herself, they were still useful for the
research. Another feature noticed in this group of participants was that
most students from the distance course had a good performance in the
sentence-reading test concerning pronunciation and intonation, and it is
possible that they had rehearsed the sentences before recording
themselves, despite the instructions.

41
Before data collection, 5 speakers participated in the pilot,
and some adjustments were made to the tasks and the procedures (e.g.,
volume and microphone were adjusted, more instructions were added to
the test). Since these were minor adjustments, the data from these
speakers were still considered useful for this research and were analyzed
along with the other speakers’ data.
After collecting data with 40 BPSE and 1 NSE, the BPSE
recordings were auditorily analyzed. The analysis revealed that from the
400 tokens containing // in word-initial position, only 25 contained
non-target productions of this sound (only 6.25%). All the non-target
pronunciations of word-initial position // were pronounced as a
fricative [. From the 40 BPSE, only 14 of them produced non-
target pronunciations of rhotics in word-initial position (35%). Most of
these participants produced non-target pronunciations when reading the
words ‘rug’ and ‘rated’, while the word “right” was always pronounced
according to standard American English.
As stated in the first hypothesis, it was expected to find
speakers who transferred the BP fricative allophones to pronounce the
English <r> rather than speakers who transferred the other allophones of
this sound (for example, the trill and the tap). This expectation was
based on the fact that all the participants were expected to speak
standard BP (which was evident in their recordings of the sentences in
BP), even though they came from different regions of the country.
The low number of non-target pronunciations found in this
study has two concurrent explanations. It is possible that BPSE do
transfer the sounds of rhotics from BP to English in their daily lives, but
monitored themselves while performing the reading test, a strategy
mentioned by Algethami et al. (2011). Deus (2009) came to this
conclusion after analyzing his data and noticing that there was not as
much transfer as he expected to find.
A second possible explanation refers to speakers’ level of
proficiency. Maybe BPSE produce non-target pronunciations of this
sound in English only at the first stages of their interlanguage

42
(beginners), being able to monitor and correct themselves very soon in
the process of L2 acquisition. In this case, the BP speakers being tested
were not beginners. This insight is related to the fact that the liquids in
general are very frequent in English, more specifically in word-initial
position (Yavas, 2011), and possibly the frequent contact with the
English // in a prominent position might have helped the speakers to
become aware of how different this sound is in the L2, thus improving
the learners’ production.
Although the reading task might have influenced the
speakers, the second justification seems more reasonable when
comparing the results of the study with the frequency of the words in
English as they appear in the frequency list of oral speech of the Corpus
of Contemporary American English - COCA27
(Davies, 2012). It is
common ground that the more frequent a word is in a language, the
faster it will be acquired and produced accurately (Kamil, Pearson,
Moje, & Afflebach, 2011). In fact, from the words tested in this study,
the most frequent one in oral speech according to the corpora is the
word ‘rights’, which was also the word that had no occurrence of non-
target production among the BPSE. Its non-target counterpart ‘heights’,
on the other hand, is far less frequent in the corpora list. Conversely, the
second least frequent word in the corpora is ‘rug’, which was the word
with highest occurrence of non-target pronunciations by the BPSE,
while its non-target pair ‘hug’ is more frequent in the corpora, which
might explain the speakers’ productions. The number of non-target
pronunciations per tested word and their frequency in oral speech
according to COCA can be seen in Table 2.
27
“The Corpus of Contemporary American English (COCA) is the largest
freely-available corpus of English, and the only large and balanced corpus of
American English. The corpus was created by Mark Davies of Brigham Young
University, and it is used by tens of thousands of users every month (linguists,
teachers, translators, and other researchers) (Davies, 2012).

43
Table 2
BPSE Non-Target Pronunciations of Word-Initial // Per
Tested Word Compared to Their Frequency in Oral Speech
Tested
words28
Frequency
of NTP
NTP
(%)
Frequency
in oral
speech
(COCA)
Frequency
of the NT
counterpart
(COCA)
Rug 9 2 472 773
Ropes 4 10 853 8611
Rated 3 7.5 779 6012
Rabbits 2 5 507 1445
Ride 2 5 3408 5504
Rats 2 5 1193 2371
Roof 1 2.5 1875 45
Rank 1 2.5 1204 3
Racks 1 2.5 253 89
Rights 0 0 44329 0
Total 25 6.25
3.3.2. Listeners’ data collection
After an aural analysis, the speakers with more non-target
pronunciations of the rhotics were identified, and their recordings
containing rhotic words produced either accurately or not, plus
distractor sentences were edited and normalized at -6db with an interval
of approximately 3 (three) seconds between each other by using Sound
28
The sentences in which the words were included can be seen in APPENDIX
H.

44
Forge Pro 10.0. These recordings and the NSE recordings were then
randomized and posted on the website. This resulted in a test with 134
tokens, repeated twice (all listeners heard the sentences in the same
order).
The recordings were played at random, so as to avoid order
effects. It should also be noted that participants were asked to transcribe
only the missing word rather than the entire sentence. This was an
attempt to evaluate only the intelligibility and comprehensibility of the
rhotic sounds pronounced by BPSE, without attention to other non-
target pronunciations that might also hinder listeners’ comprehension.
First, 4 students from the last semester of the Letras Inglês
undergraduate program at UFSC and a student from the same course
that had already graduated one year before were asked to access the
website and complete the test at home. One of these participants did not
complete the entire test. Then, 1 Master’s student from PPGI and 2 ex-
PPGI students who had finished their doctoral studies not long ago
completed the whole test, along with a professor from the same
program. Another Master’s student that was invited to participate in the
pilot did not finish the test. These informants also responded the test at
home, by accessing the website.
These participants reported taking more than an hour to
complete the whole test, and this was probably the reason why two of
them gave up in the middle of it. The 3 post-graduate students also gave
informal feedback after completing the test, and the three of them
mentioned these points: (1) the test was too long and the repetition of
sentences contributed to their feeling of ‘exhaustion’; (2) after hearing
the same sentence several times, listeners used their inference skills to
fill in the missing word, regardless of how the listener pronounced it; (3)
some words were really hard to understand and they had to rely on other
resources to transcribe them (they tried to remember the words as
previously pronounced by more intelligible speakers, or tried to pay
attention to the sentence to infer which word would better fit in that
context).

45
Taking this information into consideration, it was decided
to reformulate the test so as to diminish the effect of listeners’ fatigue,
and decreasing the number of repetitions would consequently prevent
listeners from memorizing the missing words. Thus, I selected the
recordings of the sentences containing the words that were more
frequently produced with non-target pronunciations:
a) Can you give me a rug?
b) Do you still have any ropes?
c) She rated his performance so bad!
d) She abandoned two rabbits.
In order to decrease the number of tokens, it was also
necessary to reduce the number of distractor sentences, and the
following ones were kept:
a) I could hear the buzz.
b) We couldn’t find any trace
c) What’s the problem with your knees?
d) This is such a tangle
e) What does the word temple mean?
As can be noticed, the first three distractor sentences are
related to the voicing/devoicing of /s/ and /z/, while the last two involve
the pronunciation of the syllabic //, which BPSE tend to produce as
//. These issues will not be examined in this study though.
Having chosen the sentences to be used in the test, it was
necessary to choose the recordings to be evaluated by the listeners.
Taking into account that only a few participants produced non-target
productions of rhotics, it was not possible to establish a pattern in the
number of target and non-target productions of the chosen words. The
intelligibility and comprehensibility test ended up with the following
distribution of recordings of the sentences containing rhotic words: 3
BPSE non-target pronunciations of the word ‘rug’; 2 BPSE and 1 NSE
target pronunciation of the word ‘rug’; 2 BPSE non-target
pronunciations of the word ‘rated’; 2 BPSE and 1 NSE target
pronunciation of the word ‘rated’; 2 BPSE non-target pronunciations of
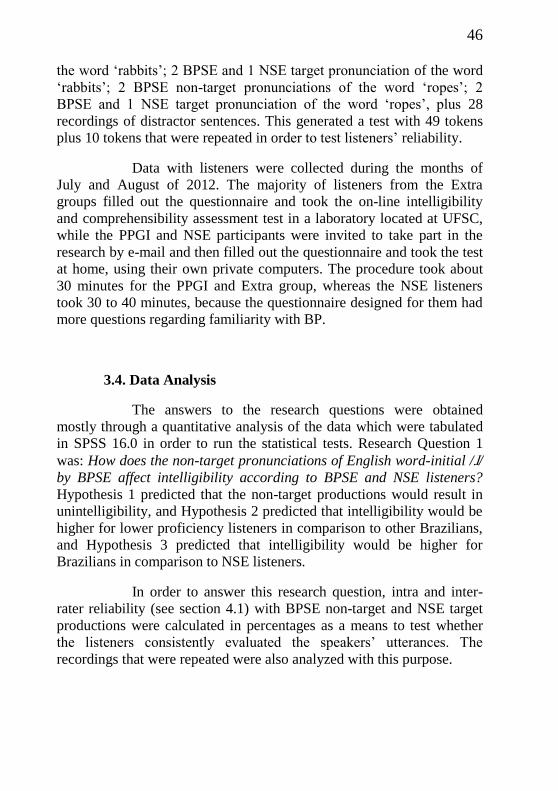
46
the word ‘rabbits’; 2 BPSE and 1 NSE target pronunciation of the word
‘rabbits’; 2 BPSE non-target pronunciations of the word ‘ropes’; 2
BPSE and 1 NSE target pronunciation of the word ‘ropes’, plus 28
recordings of distractor sentences. This generated a test with 49 tokens
plus 10 tokens that were repeated in order to test listeners’ reliability.
Data with listeners were collected during the months of
July and August of 2012. The majority of listeners from the Extra
groups filled out the questionnaire and took the on-line intelligibility
and comprehensibility assessment test in a laboratory located at UFSC,
while the PPGI and NSE participants were invited to take part in the
research by e-mail and then filled out the questionnaire and took the test
at home, using their own private computers. The procedure took about
30 minutes for the PPGI and Extra group, whereas the NSE listeners
took 30 to 40 minutes, because the questionnaire designed for them had
more questions regarding familiarity with BP.
3.4. Data Analysis
The answers to the research questions were obtained
mostly through a quantitative analysis of the data which were tabulated
in SPSS 16.0 in order to run the statistical tests. Research Question 1
was: How does the non-target pronunciations of English word-initial // by BPSE affect intelligibility according to BPSE and NSE listeners?
Hypothesis 1 predicted that the non-target productions would result in
unintelligibility, and Hypothesis 2 predicted that intelligibility would be
higher for lower proficiency listeners in comparison to other Brazilians,
and Hypothesis 3 predicted that intelligibility would be higher for
Brazilians in comparison to NSE listeners.
In order to answer this research question, intra and inter-
rater reliability (see section 4.1) with BPSE non-target and NSE target
productions were calculated in percentages as a means to test whether
the listeners consistently evaluated the speakers’ utterances. The
recordings that were repeated were also analyzed with this purpose.

47
The next step was to classify and code listeners’
transcriptions into 3 groups: a) non-target production transcribed as non-
target (e.g., [] transcribed as ‘hopes’); b) non-target production
transcribed as the target pair (e.g., [] transcribed as ‘ropes’); c)
non-target production transcribed as another word (e.g., []
transcribed as ‘whole’). Then, contingency tables were created with
different speakers’ non-target productions of the same word to check
how intelligible these productions were. These contingency tables also
provided the Chi-square values29
, which were then analyzed according
to Dancey and Reidy’s recommendations (2004).
Listeners’ evaluations of the level of unintelligibility
caused by the non-target pronunciation of “r”30
were taken into account
by calculating the median values assigned by the listeners per group.
Along with this quantitative analysis, a qualitative examination was
carried out by checking if listeners mentioned the production of the
rhotics when answering the last part of the last question (mentioned in
footnote 30): “Besides the mispronunciation of these sounds, are there
any other mispronunciations you think that hinder your understanding of
Brazilians’ speech? Please demonstrate using at least one word that
exemplifies the difficulty”.
The second Research Question was: How does the non-
target pronunciation of English word-initial // by BPSE affect
29
Chi-squares are used to “[…] calculate the difference between the scores you
observed and the scores you would expect in that situation and then see whether
the magnitude of the difference is large or small on the chi-square distribution”
(Larson-Hall, 2010, p. 208).
30 Alternative “c” from the question: “Below you can see some sounds and
sound pairs which are often mispronounced by people who are learning
English. Based on your familiarity with Brazilian Portuguese and/or on the
recordings you listened to, mark the degree to which you think these
mispronunciations would hinder your understanding of Brazilians’ speech on
the scale below.” (Appendix I).

48
comprehensibility according to BPSE and NSE listeners? Hypothesis 4
predicted that less proficient listeners would assign higher
comprehensibility rates, and that Brazilians in general would assign
higher comprehensibility rates than NSE.
Once again intra and inter-rater reliability was tested, this
time through the Cronbach’s alpha test31
, which was run 3 times: first,
with the ratings assigned to one recording that was played twice; second
with ratings assigned to all tested words (accurate and accented
productions), and finally with the rates assigned to the productions of a
NSE.
The next step was to analyze the comprehensibility means,
which required a classification of the values from the scale used to
collect listeners’ comprehensibility evaluations, which were interpreted
as follows: tokens that obtained means ranging from 0 to 1.99 were
considered very difficult to comprehend; means ranging from 2 to 3.99
were considered difficult to comprehend; means ranging from 4 to 5.99
were considered not very easy to comprehend; means ranging from 6 to
7.99 were considered easy to comprehend, and finally, means ranging
from 8 to 9 were considered very easy to comprehend.
Finally, Kruskall-Wallis tests32
were run to investigate
whether the difference among groups of listeners was significant, and
31
Cronbach’s alpha test consists on a “a measure of internal consistency, it is
the ratio of variability attributable to subjects divided by the variability
attributed to the intersection between subjects and items” (Larson-Hall, 2010, p.
391).
32 The Kruskall-Wallis test is “a non-parametric counterpart to the one-way
ANOVA. It should be used when you have one variable with three or more
levels and one dependent variable” (Larson-Hall, 2010, p. 395).

49
Mann-Whitney U tests33
were carried out so as to find out between
which groups the significant differences lay.
Research Question 3 was: How are the dimensions of
comprehensibility and intelligibility associated for the different groups
of listeners? Hypothesis 6 predicted that intelligibility would be
compromised, while comprehensibility scores would be high, especially
for Extra and PPGI listeners.
A first attempt to answer this research question consisted in
creating contingency tables with Chi-square values, but that was not
possible since for some groups intelligibility categories of transcriptions
did not vary. Therefore, this question was answered by comparing the
frequencies of transcriptions of intelligibility scores with
comprehensibility mean scores, in an attempt to find a pattern between
the directions of these two dimensions.
Finally, the last Research Question was: Which group of
NSE listeners has more difficulty in understanding the Brazilian
accented // in English words regarding the dimensions of
comprehensibility and intelligibility? Hypothesis 7 predicted that
familiar NSE listeners would assign higher comprehensibility ratings
and would be able to transcribe more words accurately. The first step to
answer this research consisted in the operationalization of answers given
by the NSE regarding their familiarity with BP and the BP accent, as
already explained in section 3.1.2. Having divided NSE in 2 groups
(familiar and unfamiliar listeners), contingency tables were created with
the types of transcriptions (intelligibility measure), which were then
confronted with comprehensibility means assigned to the BPSE
productions.
33
The Mann-Whitney test “assesses whether there is a statistically significant
difference between the mean ranks of the two conditions” (Dancey & Reidy,
2004, p. 527).
50
3.5. Summary of the chapter
This chapter described the four groups of participants who
took part in this study, namely the speakers (40 BPSE and 1 NSE), the
Extra listeners (21 less proficient L2 speakers), the PPGI listeners (24
high proficiency L2 speakers), and the NSE listeners (28 listeners to be
divided in 2 groups regarding their familiarity with the BP accent to
answer Research Question 4). Different instruments were designed to
gather data from speakers and listeners, and the language of each
instrument matched the participant’s L1, so as to avoid
misinterpretations resulting from lack of knowledge in the L2. The
procedures to collect data consisted in recording the speakers, selecting
the speech samples and then submitting them to listeners’ evaluations
through an intelligibility and comprehensibility test, available in the
website www.comprehendingl2speech.com. The analysis of data was
also discussed in this chapter, which was done mainly through statistical
tests in SPSS. The next chapter reports and discusses the results,
keeping in mind the theoretical issues raised in chapter 2.

51
CHAPTER 4
RESULTS AND DISCUSSION
The aim of this chapter is to present the results of the data
collection and discuss them in the light of the literature summarized in
chapter 2. In order to fullfil this purpose, the research questions and
their hypotheses will be revisited once again, followed by the respective
results and analyses.
4.1. The non-target production of // and the issue of
intelligibility
Having found that some of the BPSE who took part in this
research produced the // sound as a fricative, it is important to
investigate how this non-target production can affect intelligibility for
the three groups of listeners that participated in this study, as stated in
Research Question 1 “How does the non-target pronunciation of English
word-initial // by BPSE affect intelligibility according to BPSE and
NSE listeners?”. Three hypotheses were stated for this question:
H1. The transfer of the fricatives [] or [] as allophones
for the word-initial position // will cause unintelligibility for the
listeners in general (Lieff & Nunes, 1993).
H2. BPSE listeners (PPGI and Extra) will provide more
accurate transcriptions of the BPSE utterances in comparison to the NSE
listeners, since BPSE participants share an L1 background and therefore
will be more attuned to the Brazilian accent in English.
H3. Less proficient listeners (Extra) will perform better
than more proficient L2/NSE listeners in the intelligibility tasks34
, since
34
In this study, task will be defined according to Bygate, Skehan, and Swain
(2001) “a focused, well-defined activity, relatable to pedagogic decision
making, which requires learners to use language, with an emphasis on meaning,

52
they will not be able to notice the difference between [ˈ] and
[ˈ] (Bent & Bradlow, 2003; Hayes-Harb, Smith, Bent, &
Bradlow, 2008; van Wijngaarden, Steeneken, & Houtgast, 2002).
Since the answer to this research question is based on data
provided by listeners, it is vital to check inter-rater and intra-rater
reliability before moving on to the results concerning intelligibility, so
as to verify if these participants were consistent when rating speakers’
productions (Larson-Hall, 2010). As Bachman (2004) explains, inter-
rater reliability analysis helps us to estimate how similar different
groups of raters are when rating in the same task. Conversely, intra-rater
reliability analysis can give us an estimate of how consistent the same
rater is when rating the same task in different times.
Checking intra and inter-rater reliability is one of Munro’s
recommendations (2008) to clarify the findings of intelligibility and
comprehensibility studies. As Munro explains, most researchers do not
report this information, although it may explain differences among
groups of listeners (e.g., listeners from different L1 backgrounds).
Therefore, in the following two sections I report the results concerning
intra and inter-raters’ reliability in the intelligibility data.
4.1.1. Intra and inter-rater reliability with non-target and
target productions
Intra-rater reliability analysis was carried out as a way of
checking if listeners were consistent when transcribing the missing
words. This was done by playing two recordings produced by the same
speaker twice and then comparing the listeners’ orthographic
transcriptions for these audio files. One of the recordings contained the
non-target production of the word ‘ropes’ (produced as [] by
to attain an objective, and which elicits data which may be the basis for
research”.

53
Speaker 36), and the other one contained the target production of the
word ‘rabbits’ (produced as [ˈ] by Speaker 74). Table 3 displays
the comparison between the orthographic transcriptions for the word
‘ropes’, and Table 4 shows the same comparison for the word ‘rabbits’.
In both tables the results are separated per groups of listeners.

54
Table 3
Inter and Intra-Rater Reliability per Group of Listeners for
‘Ropes’ [] (Non-Target Pronunciation) Produced By
Speaker 36
Listeners’
transcriptions of
speakers’ recordings
‘Ropes’ pronounced
as [ˈ] by
Speaker 36
Time 1
‘Ropes’ pronounced
as [ˈ] by
Speaker 36
Time 2
PPGI [] transcribed
as ‘hopes’
23
(95.8%)
23
(95.8%)
[] transcribed
as ‘ropes’
1
(4.2%)
1
(4.2%)
Total 24 24
Extra [] transcribed
as ‘hopes’
20
(95.2%)
21
(100%)
[] transcribed
as ‘ropes’
1
(4.8%) 0
Total 21 21
NSE [] transcribed
as ‘hopes’ 27 (96.4%) 27 (96.4%)
[] transcribed
as ‘ropes’
1
(3.6%)
1
(3.6%)
Total 28 28
Total
listeners [] transcribed
as ‘hopes’
70
(95.9%)
71
(97.3%)
[] transcribed
as ‘ropes’
3
(4.1%)
2
(2.7%)
Total 73 73
Number of participants in each group: PPGI = 24; Extra= 21; NSE= 28.
The non-target pronunciation of ‘ropes’ [], which was
produced by Speaker 36’s and played twice during the data collection,

55
was transcribed similarly by the listeners in both presentations.
According to Table 3, the non-target production of this word was
transcribed as ‘hopes’ by most listeners (70 in the first time and 71 in
the second time), and only a few of them (3 in the first time and 2 in the
second time) transcribed it as the target pronunciation ([ˈ]).
Although the carrier sentence made sense with the target and non-target
production of the word ‘ropes’, probably some listeners were able to
recognize that Speaker 36, who produced [] meant to say
‘ropes’. This could also be a test effect, because this carrier sentence
was presented for the first time with the target production of the word
‘ropes’, which may explain why some listeners were expecting to hear
‘ropes’.
Only one listener from the Extra group transcribed it
differently in the second time, maybe because in the second time this
listener realized that what the speaker meant to say was ‘ropes’, and not
‘hopes’, as he had thought before. This guess could have been
corroborated by the recordings that contained the target production in
the same carrier sentence, produced by the BPSE and the NSE. Thus,
this can be considered a result of the effect of familiarity with the
recordings, given that listeners had to listen to the same sentence
recorded by different speakers at least four times (counting target and
non-target productions). Therefore, except for this listener, it can be
argued that listeners transcribed the same production similarly at both
presentations times, meaning that there is high intra and inter-rater
reliability.
The same analysis was carried out with the NSE accurate
production of the word ‘rabbits’. The recording of this production was
played twice, and therefore, besides expecting listeners to transcribe it
as ‘rabbits’ (since it was accurately produced by a NSE), it was also
expected that they would transcribe it similarly in the second time they
listened to it. If this was the case, then intra and inter-rater reliability
could be considered to be high, which was in fact the result of this
analysis, as can be seen in Table 4.

56
Table 4
Intra and Inter-Rater Reliability per Group of Listeners for
‘Rabbits’ Produced By NSE Speaker 74
Listeners’
transcriptions of
speakers’ recordings
‘Rabbits’
pronounced as
by Speaker
74 - Time 1
‘Rabbits’
pronounced as
by Speaker
74 - Time 2
PPGI transcribed as
‘rabbits’
23
(95,8%)
23
(95,8%)
transcribed as ‘habits’
1
(4,2%)
1
(4,2%)
Total 24 24
Extra transcribed as
‘rabbits’
19
(90,5%)
20
(95,2%)
transcribed as ‘habits’
2
(9,5%)
1
(4,8%)
Total 21 21
NSE transcribed as
‘rabbits’
28
(100%)
28
(100%)
Total 28 28
Total
listeners transcribed as
‘rabbits’
70
(95,9%)
71
(97,3%)
transcribed as ‘habits’
3
(4,1%)
2
(2,7%)
Total 73 73
Number of participants in each group: PPGI = 24; Extra= 21; NSE= 28.

57
The target pronunciation of ‘rabbits’ [ˈ] was also played
twice during the data collection and was transcribed similarly by
listeners in both situations. According to Table 4, the target production
of this word was transcribed as ‘rabbits’ by most listeners (70 in the first
time and 71 in the second time), and only a few of them (3 in the first
time and 2 in the second time) transcribed it as ‘habits’. The difference
lies in the Extra and PPGI groups. Speaker 36 recording of the word
‘rabbits’ was presented to the listeners before its non-target production
(which was recorded by Speaker 16). Thus, a possible explanation for
the fact that these listeners transcribed it as ‘habits’ in the first time they
listened to this target production and to this carrier sentence is that they
got confused with other carrier sentences that contained target and non-
target productions of word-initial // and concluded that, in fact, the
speaker intended to say ‘habits’, instead of ‘rabbits’. In other words,
writing ‘habits’ for a recording that contained its target counterpart
may be the result of a test effect. Another possible
explanation is that these listeners were not paying much attention and
misunderstood the word intended by the speaker. However, the majority
of listeners were able to recognize the intended word both times, which
was expected, since it was produced as the target form. Thus, we can
conclude that besides high intra-rater reliability, there is also high inter-
rater reliability.
Other NSE productions were analyzed so as to complement the
inter-rater reliability analysis. Table 5 below provides information about
the way listeners transcribed other missing words from NSE 74’s
recordings (‘ropes’, ‘rug’, ‘rated’, ‘rabbits’). Note, however, that this
analysis is different from the previous ones discussed in this section, as
it focuses on words produced at a single time only, as our goal is to
analyze the performance of listeners across groups (inter-rater
reliability).

58
Table 5
Inter-Rater Reliability of Listeners’ Transcriptions of the Words
‘Ropes’, ‘Rug’, ‘Rated’, and ‘Rabbits’ Accurately Produced By
NSE in Time 1
Groups
Listeners’
transcriptions
of NSE
recordings
NSE
recording of
‘ropes’
NSE
recording of
‘rug’
NSE
recording of
‘rated’
NSE
recording of
‘rabbits’
PPGI
TP transcribed
accurately1
22
(91.7%)
18
(75%)
18
(75%)
24
(100%)
TP transcribed
as the NT pair2
2
(8.3%)
6
(25%)
6
(25%) 0
N = 24
Extra
TP transcribed
accurately
17
(81%)
18
(85.7%)
15
(71.4%)
19
(90.5%)
TP transcribed
as the NT pair
2
(9.5%)
3
(14.3%)
6
(28.6%)
2
(9.5%)
TP transcribed
as another word3
2
(9.5%) 0 0 0
N = 21
NSE
TP transcribed
accurately
28
(100%)
28
(100%)
28
(100%)
28
(100%)
N = 28
Total
TP transcribed
accurately
67
(91.8%)
64
(87.7%)
61
(83.6%)
71
(97.3%)
TP transcribed
as the NT pair
4
(5.5%)
9
(12.3%)
12
(16.4%)
2
(2.7%)
TP transcribed
as another word
2
(2.7%) 0 0 0
N = 73
TP = Target Production
Number of participants in each group: PPGI = 24; Extra= 21; NSE= 28. 1 For instance, ‘ropes’ transcribed as 'ropes' by the listeners.
2 For instance, ‘ropes’ transcribed as 'hopes' by the listeners.
3 For instance, ‘ropes’ transcribed as 'whole' by the listeners.

59
Here it is possible to see a variation in comparison to Table 3.
Since some listeners from the Extra and PPGI groups transcribed the
accurate productions as their non-target pairs (e.g., ‘ropes’ transcribed as ‘hopes’), and a few listeners from the Extra group (2.7%)
even transcribed the word ‘ropes’ as a completely different word (e.g.,
‘ropes’ transcribed as ‘whole’). Since the Extra group was the
one that had more difficulty in transcribing the target productions
accurately and whose listeners were not as proficient as the others, one
can argue that this can be explained in terms of proficiency level,
meaning that maybe these listeners did not know these words or were
not able to recognize them the first time they heard them. NSE listeners,
on the other hand, transcribed all the words accurately, so that it can be
concluded that they were not influenced by test effects in the case of
these words.
Although some BPSE listeners were not able to accurately
recognize all the tested words that were produced by the NSE speaker,
the percentage of listeners in both BPSE groups that transcribed these
words accurately is still high. In the PPGI group, the percentage of
listeners who transcribed the words correctly ranged from 75% (for
‘rug’ and ‘rated’) to 100% (for ‘rabbits’). In the Extra group, the
percentage of listeners who transcribed the words correctly ranged from
71.4% (for ‘rated’) to 90.5% (for ‘rabbits’). Apparently, ‘rated’ was the
most difficult word for BPSE listeners to understand when pronounced
accurately by a NSE, while ‘rabbits’ was understood by most of them.
In sum, high levels of inter-rater reliability were found in
this study, which means “the more agreement among listeners, the less
“subjectivity” there must be in their judgments, and the more evident it
is that the listeners share a response to particular stimulus properties”
(Munro, 2008, p. 207). In other words, it means that the listeners agreed
with each other in relation to the intelligibility of the missing words.
After analyzing intra and inter-rater reliability, the next step
consists of verifying whether or not the non-target productions affect
intelligibility. The data provided by the three groups of listeners were
then analyzed in the following section.

60
4.1.2. BPSE non-target productions and intelligibility
Given that listeners’ responses were, in general, consistent,
their transcriptions were once more analyzed with the intent of checking
if speakers’ productions of // in word-initial position were intelligible,
even though they were not produced accurately, and also as a way of
verifying if there is a difference in the way the groups of listeners
evaluated intelligibility.
First, listeners’ transcriptions of speakers’ non-target
productions were classified and coded into three groups: a) non-target
production transcribed as non-target (e.g., [] transcribed as
‘hopes’); b) non-target production transcribed as the target pair (e.g.,
[] transcribed as ‘ropes’); c) non-target productions transcribed
as another word (e.g., [] transcribed as ‘whole’). Then,
contingency tables were created with different speakers’ non-target
productions of the same word to check how intelligible these
productions were. The data from the contingency tables were used to
run statistical tests called Chi-square test for group independence, which
“calculate[s] the difference between the scores you observed and the
scores you would expect in a particular situation and divide by the
expected score” (Larson-Hall, 2010, p. 208). In other words, this test
was used to find group differences, in case they exist.
For example, the word ‘ropes’ was produced as ‘hopes’
[] by Speaker 39 and Speaker 16. These recordings were then
transcribed by three groups of listeners (PPGI, Extra, and NSE), and
3X3 and 3X2 group independence Chi-square tests35
were run to verify
if there is a significant difference among these groups concerning the
way they transcribed the word in question.
35
The following variables were entered to run Chi-square tests: 1) Groups of
listeners (with 3 levels) and 2) the types of transcriptions of the 2 non-target
productions of ‘ropes’ (with 3 levels in the first time and 2 levels in the second
time).

61
The analyses of the Chi-square test results were based on
Dancey and Reidy (2004), who advise reporting Cramer’s V36
value for
categorical variables with more than 2 levels. According to these
authors, Cramer’s V value should be squared in order to obtain the
effect size, which accounts for “how much of the variance in one
variable is accounted for by the other variable” (Larson-Hall, 2010, p.
161). For example, if a Chi-square test yields a Cramer’s V value of
.097 we can say that there is no difference among the groups, because
.097 squared equals .009, meaning that the relationship between the
variables being studied is close to zero (close to .10).
This method differs somewhat from the method used by
Munro and Derwing (1995a; 1995b; 1997), and Munro, Derwing, and
Morton (2006) to analyze intelligibility. These authors usually count the
number of correct transcriptions and compute them into percentages, so
that they are able to calculate the average intra-class correlations by
listener groups (Cronbach’s alpha). Even though this method also makes
sense, it does not take into account the way the tested words were
transcribed (they are simply classified into correct or incorrect
transcriptions). Nevertheless, in this study it seems important to look at
the possible transcriptions to hypothesize about the factors that lead the
listeners to perform in that way, and this is why I chose to analyze the
results in more detail. Table 6 displays the frequency of listeners who
transcribed the word ‘ropes’ pronounced as [] as ‘hopes’, ‘ropes’,
or as another word, as well as the Chi-square coefficient.
36
Cramer’s V is “a measure of effect used for tests of association; it is a
correlation coefficient, interpreted in the same way as Pearson’s r” (Dancey &
Reidy, 2004, p. 274).

62
Table 6
Contingency Table with the Frequency of Listeners’ Transcriptions of
‘Ropes’ Pronounced as [] By 2 Different Speakers and The Chi-
Square Coefficients37
Group
Recording of ‘ropes’ pronounced as []
by Speaker 39
Recording of ‘ropes’
pronounced as
[] by Speaker 16
[]
transcribed
as ‘hopes’
[]
transcribed
as ‘ropes’
[]
transcribed as
another word
[]
transcribed
as ‘hopes’
[]
transcribed
as ‘ropes’
PPGI 17
(70.8%)
0
7
(29.2%)
23
(95.8%)
1
(4.2%)
Extra 11
(52.4%)
3
(14.3%)
7
(33.3%)
20
(95.2%)
1
(4.8%)
NSE 20
(71.4%)
3
(10.7%)
5
(17.9%)
27
(96.4%)
1
(3.6%)
Total 48
(65.8%)
6
(8.2%)
19
(26%)
70
(95.9%)
3
(4.1%)
Chi-
Square 2
=5,167; p = .271; df = 4; Cramer’s V = .188;
p = .271
2=.043; p = .979; df = 2;
Cramer’s V=.024; p = .979
Number of participants in each group: PPGI = 24; Extra= 21; NSE= 28.
By analyzing the first part of the table above (Speaker 39’s
production), we notice that the majority of listeners (65.8%) transcribed
the non-target production of ‘ropes’ [] as ‘hopes’, indicating that
replacing the retroflex [] with the fricative [] resulted in
unintelligibility. For some listeners (mainly for the BPSE listeners) this
word was not even understood as its target counterpart ‘ropes’, but as a
completely different word, especially the first time it was presented
37
The SPSS tables containing the results are provided in APPENDIX K.

63
(26%). This may have been a result of the way the whole utterance was
pronounced, meaning that the speaker used the wrong intonation in the
whole sentence, besides pronouncing the preceding word in a non-target
way.
Only 8.2% of the listeners (3 from the Extra group and 3
from the NSE group) were able to infer that the speaker meant to say
‘ropes’ instead of ‘hopes’, and that could be related to the fact that the
target pronunciation of this word was presented before its non-target
counterpart. In the second non-target production of the word ‘ropes’
[] as produced by Speaker 16, even more listeners transcribed it
as ‘hopes’, which supports the previous statement that the replacement
of the retroflex sound with the fricative resulted in unintelligibility. In
the second production, however, listeners no longer transcribed it as
another word, meaning that most of them (95.9%) were sure the speaker
intended to say ‘hopes’. Here, familiarity with the sentences seems to
have played a role.
A 3X3 group independence Chi-square test was carried out
to find out whether there was a significant relationship between the
groups and the way listeners transcribed the word ‘ropes’ pronounced as
[ by Speaker 39. The 2 value of 5.167 had an associated
probability value of .271 (df = 4), showing that such an association is
likely to have arisen as a result of sampling error. Cramer’s V was found
to be .188 (p = .979) – thus only 3.5% of the variation in the frequencies
of transcriptions can be explained by level of proficiency or L1
background sharing. It can therefore be concluded that there is not a
significant association between transcriptions and groups. In other
words, the three groups of listeners transcribed the words in a similar
way.
For the word ‘ropes’ pronounced as by Speaker
16, a 3X2 group independence Chi-square test was run. The 2 value of
.043 had an associated probability value of .979 (df = 2), showing that
such an association is likely to have arisen as a result of sampling error.
Cramer’s V was found to be .024 (p = .979 – thus only .05% of the
variation in the frequencies of transcriptions can be explained by level

64
of proficiency. Therefore there is an even less significant association
between transcriptions and groups regarding the second non-target
production of ‘ropes’. In sum, there is not a significant difference in the
way the three groups of listeners transcribed the two non-target
productions of ‘ropes’, meaning that all of them found the speakers’
productions highly unintelligible. In other words, Hypothesis 1 was
supported.
Hypothesis 2 was formulated based on Bent and Bradlow's
matched interlanguage speech intelligibility benefit (2003), which
predicts that intelligibility is higher for listeners who share an L1
background with the speakers. This hypothesis was not supported here,
since PPGI listeners understood even less than NSE, especially in the
first occurrence of the non-target production of ‘ropes’. Similarly,
Hypothesis 3 took into account studies like the ones conducted by Imai
et al. (2003), and van Wijngaarden et al. (2002), whose results indicated
that listeners who were less proficient in the L2 were able to recognize
more words produced by NNS. Results for the first occurrence of
‘ropes’ appear to be in accordance with this proposition, but the non-
significant chi-square does not allow support for this hypothesis either.
For the second occurrence, the results do not even tend toward to
support of the hypothesis. The same analysis was carried out with 3
non-target productions of ‘rug’ by Speakers 35, 10, and 17, and
the results can be viewed in Table 7.

65
Table 7
Contingency Table with the Frequency of Listeners’ Transcriptions of ‘Rug’ Pronounced as By 3
Speakers38
and the Chi-Square Coefficient39
Group
Recording of ‘rug’ pronounced as by
Speaker 35
Recording of ‘rug’ pronounced as
by Speaker 10
Recording of ‘rug’ pronounced as
by Speaker 17
transcribed
as ‘hug’
transcribed
as ‘rug’
transcribed as
another word
transcribed
as ‘hug’
transcribed
as ‘rug’
transcribed
as another
word
transcribed
as ‘hug’
transcribed
as ‘rug’
transcribed
as another
word
PPGI 24
(100%) 0 0
24
(100%) 0 0
24
(100%) 0 0
Extra 16
(76.2%)
4
(19%)
1
(4.8%)
16
(76.2%)
3
(14,3%)
2
(9.5%)
18
(85.7%)
2
(9.5%)
1
(4.8%)
NSE 27
(96.4%) 0
1
(3.6%)
28
(100%) 0 0
28
(100%) 0 0
Total 67
(91.8%)
4
(6.8%)
2
(1.4%)
68
(93.2%)
3
(4.1%)
2
(2.7%)
70
(95.9%)
2
(2.7%)
1
(1.4%)
Chi-
Square 2=9.920; p = .042; df = 4;
Cramer’s V = .261; p = .042
2=13.291; p = .010; df = 4; Cramer’s V =
.302; p = .010
2=7.747; p = .101; df = 4;
Cramer’s V = .230; p = .101
Number of participants in each group: PPGI = 24; Extra= 21; NSE= 28.
38
The following variables were entered to run Chi-square tests: 1) Groups of listeners (with 3 levels) and 2) the types of
transcriptions of the 3 non-target productions of ‘ropes’ (with 3 levels). 39
The SPSS tables containing the results are provided in APPENDIX K.

66
Table 7 shows that PPGI listeners were unanimous in
transcribing as ‘hug’ in all situations. Only one NSE (3.6%)
transcribed it as ‘rug’ the first time s/he heard it. More variation was
observed among the Extra listeners, since some of them transcribed the
word in question as ‘rug’, and as a word different from its target and
non-target counterpart. The number of listeners who did so decreased as
the same sentence was produced again by a different speaker, which
suggests that familiarity with the content played a role in this test. As for
the Extra listeners who transcribed the tested word as ‘rug’, it is possible
that the effect that they were able to infer that the intended word could
be linked to their lower level of proficiency, as predicted by Hypothesis
3. L1 background, on the other hand, did not appear to influence the
results, since PPGI listeners had almost the same performance as the
NSE listeners. Still, once again the substitution of the retroflex [] with
the fricative [] in the word ‘rug’ made it unintelligible for these
listeners, since most of them thought the speakers meant to say ‘hug’.
The 3X3 group independence Chi-square tests revealed
differences among the groups concerning the way they transcribed this
non-target production. In the first case (Speaker 35), Cramer’s V was
found to be .261 (p = .042). Thus, even though Cramer’s V value can be
considered significant, the relationship between level of proficiency and
intelligibility explains only 6.8% of the results. In the second case
(Speaker 10), Cramer’s V was found to be .302 (p = .010) – thus,
significant but with only 9.12% of the variation in the frequencies of
transcriptions being explained by level of proficiency. In the third case
(Speaker 17), similar results were found. Cramer’s V was .230 (p = .01).
Even though this result is also significant, it only accounts for 5.29% of
the cases, and therefore it can be argued that there is a weak association
between the listeners’ level of proficiency/L1 background advantage
and intelligibility of the non-target production of the word ‘rug’.
Table 8 displays information about the way the non-target
productions of ‘rated’ were transcribed by the three groups of
listeners.

67
Table 8
Contingency Table with the Frequency of Listeners’
Transcriptions of ‘Rated’ Pronounced As By 2
Speakers40
and the Chi-Square Coefficient41
Number of participants in each group: PPGI = 24; Extra= 21; NSE= 28.
The results displayed in Table 8 suggest that all listeners,
except for one from the Extra group transcribed the production
40
The following variables were entered to run Chi-square tests: 1) Groups of
listeners (with 3 levels) and 2) the types of transcriptions of the 2 non-target
productions of ‘ropes’ (with 2 levels in both times).
41 The SPSS tables containing the results are provided in APPENDIX K.
Group
Recording of ‘rated’ pronounced
as by Speaker 16
Recording of ‘rated’ pronounced as
by Speaker 07
transcribed as
‘hated’
transcribed as
‘rated’
transcribed as
‘hated’
transcribed as
‘rated’
PPGI 24
(100%) 0
24
(100%) 0
Extra 20
(95.2%)
1
(4.8%)
20
(95.2%)
1
(4.8%)
NSE 28
(100%) 0
28
(100%) 0
Total 72
(98.6%)
1
(1.4%)
72
(98.6%)
1
(1.4%)
Chi-Square 2=2.511; p = .285; df = 2;
Cramer’s V = .185; p = .285
2=2.511; p = .285; df = 2;
Cramer’s V = .185; p = .285

68
as ‘hated’, corroborating the previous results that showed that
the substitution of the retroflex with the fricative resulted in
unintelligibility. In this case, this was the first time listeners were
exposed to this carrier sentence, meaning that they listened to the non-
target production of the word ‘rated’ before listening to its target
production. This is probably the reason for having fewer listeners
inferring that the speakers meant to say ‘rated’, and this corroborates the
supposition that test effect interfered with the results, although the
conclusion regarding the effect of the substitution of the retroflex // with the fricative // is still valid.
Similarly to the chi-square results reported in Tables 6 and
7, the relationship between listeners’ levels of proficiency/L1
background advantage and intelligibility of the non-target pronunciation
of the word ‘rated’ explains only a small percentage of the cases
(3.42%), and therefore, we can assume that there is a weak and non-
significant association between these variables in this study. Finally, the
results of chi-square tests for the non-target productions of the word
‘rabbits’ are displayed in Table 9.

69
Table 9
Contingency Table with the Frequency of Listeners’
Transcriptions of ‘Rabbits’ Pronounced As ]42
By 2 Speakers and the Chi-Square Coefficient43
Group
Recording of ‘rabbits’
pronounced as by
Speaker 16
Recording of ‘rabbits’ pronounced as
by Speaker 07
transcribed as
‘habits’
transcribed
as ‘rabbits’
transcribed as
‘habits’
transcribed
as ‘rabbits’
transcribed as
another word
PPGI 24
(100%) 0
23
(95.8%)
1
(4.2%)
0
Extra 11
(52.4%)
10
(47.6%)
12
(57.1%)
9
(42.9%)
0
NSE 23
(82.1%)
5
(17.9%)
23
(82.1%)
4
(14.3%)
1
(3.6%)
Total 58
(79.5%)
15
(20.5%)
58
(79.9%)
14
(19.2%)
1
(1.9%)
Chi-
Square 2=15.758; p = .000; df = 2;
Cramer’s V = .465; p = .000
2=13.068; p = .011; df = 4;
Cramer’s V = .299; p = .011
Number of participants in each group: PPGI = 24; Extra= 21; NSE= 28.
Different from the transcriptions for the words ‘rug’ and
‘rated’, more variance was obtained in the way listeners transcribed the
non-target production of the word ‘rabbits’. Most PPGI and NSE
listeners transcribed it as ‘habits’, but surprisingly, almost half of the
Extra listeners transcribed it as ‘rabbits’. Thus, the replacement of the
42
The following variables were entered to run Chi-square tests: 1) Groups of
listeners (with 3 levels) and 2) the types of transcriptions of the 2 non-target
productions of ‘ropes’ (with 2 levels in the first time and 3 levels in the second
time).
43 The SPSS tables containing the results are provided in APPENDIX K (p.
158).

70
retroflex [] with the fricative [] in the word ‘rabbits’ did not affect
Extra listeners’ intelligibility as much as the other productions
previously analyzed did, or as much as the other groups’ intelligibility.
This difference among the groups was confirmed by chi-square tests,
since a Cramer’s V value of .465 was found in the first case (p = .000).
Even though highly significant, it means that the relationship between
level of proficiency/L1 background can explain only 21% of the cases,
which decreases to 8.9% in the second time this non-target production
was transcribed. The fact that the non-target production of the word
‘rabbits’ was more intelligible for Extra listeners than for the other
BPSE and NSE might be linked to the hypothesis that less proficient
listeners recognize more words with non-target pronunciations than
more proficient listeners and even NSE.
In addition to the quantitative analysis of listeners’
transcriptions, their answers to the last item of the questionnaire (see
Appendix J, p. 142-143) were also computed. The questionnaire item
was introduced like this: Below you can see some sounds and sound
pairs which are often mispronounced by people who are learning
English. Based on your familiarity with Brazilian Portuguese and/or on
the recordings you listened to, mark the degree to which you think these
mispronunciations would hinder your understanding of Brazilians’
speech on the scale below Pronunciation of “r” (e.g., river, car)44
. The
scale used by listeners to tell to what extent the non-target production of
// hinders intelligibility ranged from 0 to 9, in which 0 meant “It
hinders a lot” and 9 referred to “It does not hinder”. The analysis reveals
that most of them believe that the non-target production of this sound
really hinders intelligibility, since most of them assigned rates below
5.99, which would correspond to “not very easy to comprehend”, the
Extra group being the one that assigned harsher rates (Table 10). Extra
listeners were the ones who recognized more words, meaning that they
were able to notice that speakers intended to say ‘rabbits’ instead of
‘habits’, an inference that probably required more effort. As a result,
44
Although I asked about other pronunciation problems, my analysis will focus
on what the informants said about the rhotic sound only.

71
they considered the non-target production of this sound a greater source
of unintelligibility in comparison to the other groups.
Table 10
Level of Unintelligibility Caused By the Non-Target
Production of//
Value
PPGIa
Extrab
NSEc
% Cumulative
% %
Cumulative
% %
Cumulative
%
0 25,0 25,0 14,3 14,3 14,3 14,3
1 12,5 37,5 4,8 19,0 7,1 21,4
2 8,3 45,8 14,3 33,3 14,3 35,7
3 12,5 58,3 19,0 52,4 17,9 53,6
4 4,2 62,5 14,3 66,7 7,1 60,7
5 8,3 70,8 9,5 76,2 7,1 67,9
6 4,2 75,0 4,8 81,0 7,1 75,0
7 8,3 83,3 14,3 95,2 7,1 82,1
8 8,3 91,7 4,8 100,0 14,3 96,4
9 8,3 100,0 100,0 3,6 100,0
Total 100,0
a. N=24; b. N=21; c. N=28
When asked about other pronunciation difficulties faced by
Brazilians that could lead to a loss of understanding, some of the
listeners restated the substitution of // with //45
. For instance, Listener
49 from the PPGI group wrote that “[Brazilians] pronounce ‘r’ as ‘h’:
Robert becomes ‘Hobertchi’. Listener 44 from the Extra group simply
stated that “R, they pronounce it wrongly”, and Listener 61 from the
45
The number of listeners who mentioned the non-target production of the
retroflex as a possible source of unintelligibility corresponds to the following
percentages: Extra = 28.57%, NSE = 21.42%, and PPGI = 8.33%.

72
NSE group claimed that “/r/ is probably the most problematic, i.e.
'retired' is pronounced as /hetiud/”.
In sum, when listening to the four tested words (‘ropes’,
‘rug’, rated’ and ‘rabbits’) that contained a non-target pronunciation of
the retroflex [] by different BPSE, most listeners transcribed them as
their non-target counterpart, namely, ‘hopes’, ‘hug’, ‘hated’, and
‘habits’. More variance was found among listeners from the Extra
group, who transcribed the tested word as a completely different one, or
transcribed them as its target counterpart. Moreover, Extra listeners
were the ones who most believed that the non-target production of the
retroflex hinders intelligibility. However, Cronbach’s Alpha results do
not indicate a strong relationship between level of proficiency and
intelligibility of the non-target pronunciation of // in neither of the
tested words. Hazan and Markham (2004, as cited in Munro et al., 2006)
also reported a weak relationship between intelligibility and between-
listener differences, and this led them to state that deviations in speech
may interfere more in intelligibility results than the characteristics
shared by listeners in different groups (Hazan & Markham, 2004, as
cited in Munro et al., 2006, p. 113-114).
Transcribing the tested word differently from its
target/non-target counterpart can also be related to other pronunciation
problems in the word, or even in the whole sentence, so that the listener
could not rely on the context when trying to figure out what the speaker
intended to say. The sentence itself did not provide a very broad context
and may not have helped the listeners much. In addition, the sentence
made sense no matter if the missing word was produced accurately or
accented. Another factor related to this might be the quality of the
recording or the sound device used to listen to the recordings, as well as
background noise, or simply distraction of the listener.
Regarding the transcription of as ‘rabbits’, for
example, one possible explanation is that the Extra listeners were not
able to recognize the difference between [] and [].

73
The most intelligible non-target production for the groups
in general was ‘rabbits’, even though it was pronounced as , for it was transcribed as ‘rabbits’ by 20% of the listeners in the first
time, and 19.2% in the second time it was presented. Conversely, the
least intelligible non-target productions was ‘rated’, pronounced as
, which was transcribed as ‘hated’ by 98% of the listeners both
times it was presented to them. These results could be related to word-
frequency, but, as shown in Table 2 (p.49), ‘rabbits’ is not as frequent as
‘habits’, and therefore, if word-frequency played a role in this study
Extra listeners would not have transcribed ‘rabbits’ so often. This
explanation does work for the least intelligible word though, since its
non-target counterpart is much more frequent in English.
The results presented in this section support Hypothesis 1,
which stated that when dealing with minimal pairs in English, the
substitution of word-initial // with other allophones of the
archiphoneme /R/ in Portuguese (e.g., ‘rug’ pronounced as can be
understood as ‘hug’) would hinder intelligibility. However, results did
not confirm Hypothesis 2, regarding the advantage of L1 background
sharing, and results were not significant enough to confirm Hypothesis 3
concerning level of proficiency, although results seem to point to this
direction. The next section will discuss the results of the second research
question, which focuses on the impact of the non-target pronunciation of
the retroflex // on listeners’ comprehensibility.
4.2. The non-target production of // and the issue of
comprehensibility
The second research question was “how does the non-target
pronunciation of English word-initial // by BPSE affect
comprehensibility according to BPSE and NSE listeners?”. The
hypotheses that followed this question were:
H4. Lower proficiency BPSE (Extra) will assign higher
comprehensibility rates in comparison to the other groups of listeners,

74
because they will not be able to notice the difference between the target
and non-target productions.
H5. Brazilian listeners in general will assign higher
comprehensibility rates to BPSE non-target pronunciation of // in
comparison to NSE (Bent & Bradlow, 2003; Harding, 2011; Imai,
Flege, & Walley, 2003; Major, Fitzmaurice, Bunta, & Balasubramanian,
2002; Munro & Derwing, 2006).
Before discussing the non-target production of // and the
issue of comprehensibility, the scores assigned to one recording that was
played twice were submitted to Cronbach’s alpha test so as to check
intra and inter-rater reliability. In other words, if scores assigned to the
recording were similar in both times it was played (within and across
groups), it could be argued that the listeners were consistent when rating
speakers’ productions.
4.2.1. Rater-reliability with comprehensibility scores
Inter-rater reliability was checked by correlating the rates
assigned by each group of listeners separately, when rating the word
‘ropes’ produced by Speaker 36 in time 1 and time 2. The purpose was
to check whether the same listeners would rate the same token in a
similar manner in both times, thus indicating strong inter-rater
reliability. Bearing this in mind, Cronbach’s alpha test46
was used to test
inter-rater reliability. Larson-Hall (2010) states that there is acceptable
inter-rater reliability when Cronbach’s alpha value is above .70, with a
p-value lower than .05. Table 11 displays the results of the Cronbach’s
alpha test for the word ‘ropes’ pronounced as [ˈ] by Speaker 36
46
Cronbach’s alpha test consists on a “a measure of internal consistency, it is
the ratio of variability attributable to subjects divided by the variability
attributed to the intersection between subjects and items” (Larson-Hall, 2010, p.
391).

75
both times it was presented to the three groups of listeners. The scores
are presented in Appendix L (p. 166) and the SPSS table with
Cronbach’s alpha information is presented in Appendix M (p. 169).

76
Table 11
Intra-Rater Reliability in Scores Assigned to the Same
Recording Repeated Twice per Group of Listeners47
Group Cronbach's
Alpha
Cronbach's
Alpha Based
on
Standardized
Items
Sig. N of Tested
Recordings48
PPGI .822 .822 .000 2
Extra .923 .923 .000 2
NSE .926 .936 .000 2
Number of participants in each group: PPGI = 24; Extra= 21;
NSE= 28.
Given that all Cronbach’s alpha values are significant (p
< .05) and above .80, it can be assumed that listeners assigned similar
values for the same production, meaning that there is high intra-rater
reliability. This result is in agreement with Derwing and Munro (2008),
who advise using listeners’ rates to measure speakers’
comprehensibility, since this method provides reliable results. This
reliability test was also run with all tested words (both target and non-
target productions). Given that the values are also above .85 (p < .05),
Cronbach’s alpha results once again suggest that there is high intra-rater
reliability, as can be seen in Table 12.
47
Variables entered to run Cronbach’s alpha test: Listener’s scores for ‘ropes’
pronounced as [] by Speaker 36 in Time 1 and Time 2.
48 2 refers to the number of productions that were evaluated for
comprehensibility by listeners and computed in order to get the Cronbach’s
alpha value.

77
Table 12
Inter-Rater Reliability in Scores Assigned to All Tested
Words
Grou
p
Cronbach
's Alpha
Cronbach's
Alpha
Based on
Standardiz
ed Items
Sig
.
N of
Tested
Recordings49
PPGI .880 .888 .00
0
26
Extra .881 .887 .00
0
26
NSE .921 .931 .00
0
26
Number of participants in each group: PPGI = 24; Extra= 21;
NSE= 28.
Another way of analyzing listeners’ reliability is to take a
look at the scores assigned by the listeners to the productions of a NSE
(Speaker 74). Although comprehensibility is not only compromised by a
foreign accent and NS themselves might not be totally understood due
to other factors, such as “poor vocal projection, excessive glottal fry
(very low-pitched speech of weak intensity), covering one’s mouth
while speaking, ineffective pausing” (Munro, 2010, p.11), as well as
speaking rate, accent, etc., it was still expected that the NSE productions
would be considered easier to understand than the Brazilians’
productions. Based on this assumption, most scores assigned to the NSE
target productions of the words ‘ropes’, ‘rug’, ‘rated’, and ‘rabbits’ were
expected to be close to 8 in a scale ranging from 0 to 9, in which 0
meant ‘very difficult to comprehend’ and 9 meant ‘very easy to
comprehend’.
49
26 refers to the number of target and non-target productions that were
evaluated for comprehensibility by listeners and computed in order to get the
Cronbach’s alpha value.

78
The comprehensibility mean rates assigned to the NSE
productions are displayed in Table 13 (complete SPSS tables and graphs
are provided in Appendix N, p. 177).
Table 13
Comprehensibility Mean Scores Assigned to the NSE
Productions (Rater-Reliability)
Group
Comp. mean
for ‘ropes’
Comp. mean
for ‘rug’
Comp.
mean for
‘rated’
Comp.
mean for
‘rabbits’
Mean
PPGI
Mean 6,12 6,71 6,79 7,67 6.82
Min. 0 2 0 0
Max. 9 9 9 9
Extra
Mean 6.33 7.38 7.05 7.81 7.14
Min. 0 2 0 2
Max. 9 9 9 9
NSE
Mean 8.18 7.89 8.36 8.32 8.18
Min. 5 6 3 5
Max. 9 9 9 9
Number of listeners in each group: PPGI = 24; Extra= 21; NSE= 28.
In order to analyze the results from Table 12 and other
results that concern the matter of comprehensibility, the values from the
scale used to collect listeners’ comprehensibility evaluations were
interpreted as follows: 0-1.99 = very difficult to comprehend; 2-3.99 =
difficult to comprehend; 4-5.99 = not very easy to comprehend; 6-7.99 =

79
easy to comprehend; 8-9 = very easy to comprehend. In general,
comprehensibility mean scores ranged from ‘easy to comprehend’
(PPGI and Extra scores = 6.82 and 7.14, respectively) to ‘very easy to
comprehend’ (NSE scores = 8.18). Even though higher rates were
expected for NSE productions, it is still possible to argue that listeners
were reliable, since the majority of them assigned values above 5 to
NSE productions.
Having confirmed a high level of rater reliability,
comprehensibility of non-target BPSE productions scores for the
different groups of listeners can now be analyzed.
4.2.2 BPSE non-target productions and comprehensibility
results
In order to obtain the level of comprehensibility of the
tested words, the mean rates for each word were computed, and the
results can be visualized in Table 14.
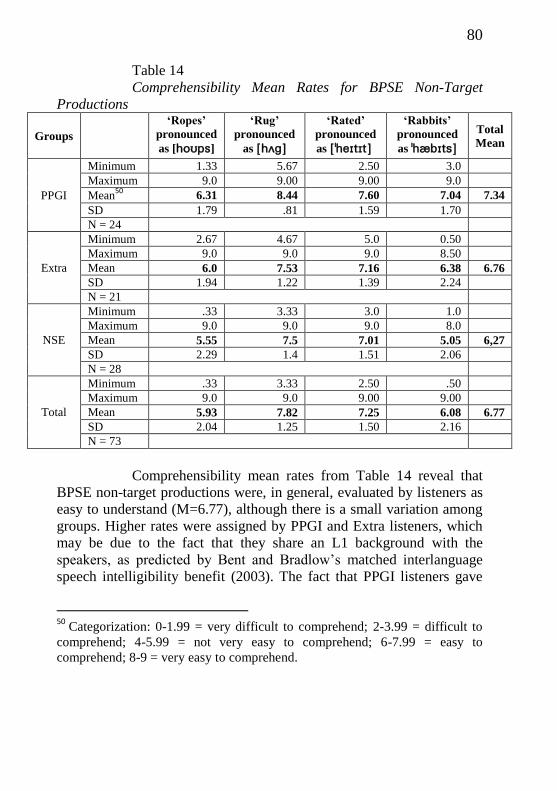
80
Table 14
Comprehensibility Mean Rates for BPSE Non-Target
Productions
Groups
‘Ropes’
pronounced
as []
‘Rug’
pronounced
as
‘Rated’
pronounced
as
‘Rabbits’
pronounced
as Total
Mean
PPGI
Minimum 1.33 5.67 2.50 3.0
Maximum 9.0 9.00 9.00 9.0
Mean50
6.31 8.44 7.60 7.04 7.34
SD 1.79 .81 1.59 1.70
N = 24
Extra
Minimum 2.67 4.67 5.0 0.50
Maximum 9.0 9.0 9.0 8.50
Mean 6.0 7.53 7.16 6.38 6.76
SD 1.94 1.22 1.39 2.24
N = 21
NSE
Minimum .33 3.33 3.0 1.0
Maximum 9.0 9.0 9.0 8.0
Mean 5.55 7.5 7.01 5.05 6,27
SD 2.29 1.4 1.51 2.06
N = 28
Total
Minimum .33 3.33 2.50 .50
Maximum 9.0 9.0 9.00 9.00
Mean 5.93 7.82 7.25 6.08 6.77
SD 2.04 1.25 1.50 2.16
N = 73
Comprehensibility mean rates from Table 14 reveal that
BPSE non-target productions were, in general, evaluated by listeners as
easy to understand (M=6.77), although there is a small variation among
groups. Higher rates were assigned by PPGI and Extra listeners, which
may be due to the fact that they share an L1 background with the
speakers, as predicted by Bent and Bradlow’s matched interlanguage
speech intelligibility benefit (2003). The fact that PPGI listeners gave
50
Categorization: 0-1.99 = very difficult to comprehend; 2-3.99 = difficult to
comprehend; 4-5.99 = not very easy to comprehend; 6-7.99 = easy to
comprehend; 8-9 = very easy to comprehend.
81
higher rates to BPSE productions than Extra listeners may be linked to
the fact that Extra listeners have more difficulty processing the L2
accent, although Extra listeners were more accurate in recognizing
words that were produced with an accent.
When taking a look at the results per word, it is possible to
notice that the non-target production of ‘ropes’ received lower scores in
comparison to the others, and therefore was more difficult for listeners
to comprehend. On the other hand, the non-target production of the
word ‘rug’ was the easiest one for listeners to comprehend. Although
word-frequency explains most of the data obtained in speech
production, it does not relate well with perception results. For instance,
from the 4 tested words, ‘ropes’ is the most frequent one in oral speech
(853 occurrences in COCA), but listeners’ evaluations indicate that it
was the most difficult word to understand. Similarly, ‘rug’ is not
frequent in oral speech (472 occurrences in COCA), which explains
why it was pronounced with an accent so many times (9), but according
to listeners, it was the easiest one to understand. Therefore, this issue
remains unanswered.
Given that BPSE non-target productions of the retroflex // were considered ‘easy’ and ‘very easy’ to comprehend, and that there
was a small variation in the ratings assigned by the groups of listeners,
the next step in the data analyses was to check if this variation was
significant or not. In order to choose the appropriate test to pursue this
objective, the data distribution was analyzed and it was possible to
conclude that it was not normally distributed (see data in Appendix O, p.
191). Based on this information, Kruskall-Wallis tests51
were run to
investigate if the difference among groups was significant. The main
results can be visualized in more detail in Table 15.
51
The Kruskall-Wallis test is “a non-parametric counterpart to the one-way
ANOVA. It should be used when you have one variable with three or more
levels and one dependent variable” (Larson-Hall, 2010, p. 395).

82
Table 15
Differences among Groups of Listeners Regarding the
Comprehensibility Scores (Kruskall-Wallis Test Results)52
Compr. mean
for ‘Ropes’
pronounced as
[ˈ]
Compr. mean for
‘Rug’
pronounced as
Compr. mean for
‘Rated’
pronounced as
Compr. mean for
‘Rabbits’
pronounced as
Compr.
total mean
for non-
target
productions
Chi-
Square 1,517 12,035 3,157 12,816 7,024
df 2 2 2 2 2
Asym
p. Sig. ,468 ,002 ,206 ,002 ,030
Number of listeners in each group: PPGI = 24; Extra= 21;
NSE= 28.
When analyzing the results concerning the overall non-
target productions mean rates (last column in Table 15), one could argue
that significance was achieved (p=.03) and thus there is a difference in
the way the three groups rated speakers for comprehensibility. However,
this was not true for all words when they were analyzed separately,
given that significance was achieved only for the non-target productions
of ‘rug’ (p=.002) and ‘rabbits’ (p=.002). Taking this into account,
Mann-Whitney U tests53
were carried out so as to find out between
which groups the significant difference lies. The summarized results are
reported in Table 16, and the SPSS tables can be seen in more detail in
Appendix P (p. 193).
52
Grouping Variable: Groups
53 The Mann-Whitney test “assesses whether there is a statistically significant
difference between the mean ranks of the two conditions” (Dancey & Reidy,
2004, p. 527).

83
Table 16
Mann-Whitney Test Results
Tests
Asymp. Sig.a
for ‘Ropes’
pronounced
as []
Asymp. Sig. for
‘Rug’
pronounced as
Asymp. Sig. for
‘Rated’
pronounced as
Asymp. Sig. for
‘Rabbits’
pronounced as
Asymp. Sig. for
the 4 non-target
productions
Extra X NSE ,543 ,871 ,831 ,024 ,347
PPGI X NSE ,217 ,002 ,094 ,001 ,008
PPGI X Extra ,592 ,003 ,178 ,232 ,145
a. 2-tailed
Number of listeners in each group: PPGI = 24; Extra= 21; NSE= 28.
Given that more than one test was run, Larson-Hall
(2010) explains that the regular alpha value of .05 should not be
considered statistically significant. Instead, the author recommends
using Bonferroni Adjustments for tests in which few comparisons were
run. In order to adjust the alpha level, “simply divide 0.05 by the
number of tests that you are using and that is your critical value”
(Larson-Hall, 2010, p. 380). Thus, the ideal alpha level in this case
should be lower than .004, since 12 tests were run.
Results from the Kruskall-Wallis test (Table 15) have
suggested that there was a significant difference in comprehensibility
rates assigned to the non-target productions of ‘rug’ and ‘rabbits’ by the
groups. In fact, by analyzing the Mann-Whitney tests, it is possible to
notice that there is a significant difference (p<.01) between the PPGI
and the NSE groups regarding the way listeners evaluated the non-target
productions of the words ‘rug’ and ‘rabbits’, which may be an indicator
of the L1 background advantage. A significant difference was also
found between the PPGI and the Extra group concerning the evaluation
of the non-target productions of ‘rug’, which corroborates the findings
of Imai et al. (2003), for example.
In conclusion, results indicate that NSE were harsher in
their evaluations of NNS speech, which may be linked to the L1

84
background advantage, and therefore Hypothesis 5 was supported.
Contrary to the findings of intelligibility, PPGI assigned higher
comprehensibility scores than Extra listeners and Hypothesis 4 was not
supported. A possible explanation is that the Extra group was not able to
notice the non-target production of the rhotic and they had to spend
more effort to understand what the speakers intended to say.
Having discussed the intelligibility and comprehensibility
of non-target productions, it is now necessary to analyze whether and
how these dimensions are related, as inquired in Research Question 3.
4.3. The non-target production of // and the issues of
intelligibility and comprehensibility
It appears that results from Research Questions 1 and 2 are
contradictory. While the majority of listeners were not able to produce
accurate orthographic transcriptions of what the speakers intended to
say and the intelligibility level in general was low, at the same time
listeners assigned relatively high rates to BPSE productions, meaning
that they considered speakers to be highly comprehensible. In other
words, listeners evaluated the BPSE non-target productions as easy to
understand, but they were not able to recognize what the speakers meant
to say. As a way of investigating this issue, Research Question 3 was
designed: “How are the dimensions of comprehensibility and
intelligibility associated for the different groups of listeners?”. The
hypothesis stated for this question was:
H6. Listeners will transcribe the word according to what
they heard and intelligibility will be compromised, while they will
assign higher rates for comprehensibility, because they will believe they
transcribed what the speaker actually intended to say. In this sense,
lower proficiency listeners will perform better in intelligibility and
comprehensibility tasks than other Brazilians, who will perform better
than the NSE.

85
In order to answer this question, intelligibility data was
compared with comprehensibility means rates. Table 17 shows the
comparison for the non-target production of ‘ropes’.
Table 17
Comparison between Intelligibility and Comprehensibility
Data for ‘Ropes’ Pronounced as []
Group
Recording of ‘ropes’ pronounced as
[] by Speaker 39
Recording of ‘ropes’
pronounced as
[] by Speaker 16
[]
transcribed
as ‘hopes’
[]
transcribed
as ‘ropes’
[]
transcribed as
another word
CMa
[]
transcribed as
‘hopes’
[]
transcribed
as ‘ropes’
CM
PPGI 17
(70.8%)
0
7
(29.2%) 4.75
23
(95.8%)
1
(4.2%) 7.04
Extra 11
(52.4%)
3
(14.3%)
7
(33.3%) 4.62
20
(95.2%)
1
(4.8%) 6.76
NSE 20
(71.4%)
3
(10.7%)
5
(17.9%) 4.57
27
(96.4%)
1
(3.6%) 6.00
Total 48
(65.8%)
6
(8.2%)
19
(26%)
70
(95.9%)
3
(4.1%)
a. Comprehensibility Means
Results from Table 17 suggest that as intelligibility
decreased (i.e., the non-target production was transcribed as ‘hopes’
instead of ‘ropes’), comprehensibility rates increased. For instance,
14.3% of Extra listeners transcribed the word accurately the first time
they heard the non-target production and the comprehensibility mean
rate was 4.62, against 6.76 the second time they heard the non-target
production, in which they accurately transcribed fewer words (4.8%).
Listeners from this group were probably more certain that the second
speaker intended to say ‘hopes’, a result from the use of minimal pairs
and ambiguous sentences in the test. However, results from Table 18 do
not corroborate this idea.

86
Table 18
Comparison between Intelligibility and Comprehensibility Data for ‘Rug’ Pronounced as
Group
Recording of ‘rug’ pronounced as
by Speaker 35
Recording of ‘rug’ pronounced as
by Speaker 10
Recording of ‘rug’ pronounced as
by Speaker 17
transcribed
as ‘hug’
transcribed
as ‘rug’
transcribed
as another
word
CM
transcribed
as ‘hug’
transcribed
as ‘rug’
transcribed
as another
word
CM
transcribed
as ‘hug’
transcribed
as ‘rug’
transcribed
as another
word
CM
PPGI 24
(100%) 0 0 8.71
24
(100%) 0 0 8.62
24
(100%) 0 0 8.00
Extra 16
(76.2%)
4
(19%)
1
(4.8%) 7.43
16
(76.2%)
3
(14.3%)
2
(9.5%) 8.14
18
(85.7%)
2
(9.5%)
1
(4.8%) 7.05
NSE 27
(96.4%) 0
1
(3.6%) 7.32
28
(100%) 0 0 8.18
28
(100%) 0 0 7.00
Total 67
(91.8%)
4
(6.8%)
2
(1.4%)
68
(93.2%)
3
(4.1%)
2
(2.7%)
70
(95.9%)
2
(2.7%)
1
(1.4%)

87
Table 18 shows that the second time that listeners heard the
non-target production of ‘rug’, comprehensibility mean rates increased,
although intelligibility decreased for Extra listeners. PPGI intelligibility
did not change over the 3 recordings, but comprehensibility scores did:
they increased the second time and then decreased the third time. NSE
intelligibility did not change either, and comprehensibility scores
followed the same pattern as the PPGI group. In the case of this
production, there seems to be no association between comprehensibility
and intelligibility results, except for the Extra group, which might be an
effect of the minimal pairs used in the test. Similar results were found
for the non-target production of ‘rated’.
Table 19
Comparison between Intelligibility and Comprehensibility
Data for ‘Rated’ Pronounced as
Group
Recording of ‘rated’
pronounced as
by Speaker 16
Recording of ‘rated’
pronounced as
by Speaker 07
transcribed
as ‘hated’
transcribed
as ‘rated’
CM
transcribed as
‘hated’
transcribed
as ‘rated’
CM
PPGI 24
(100%) 0 8.58
24
(100%) 0 6.63
Extra 20
(95.2%)
1
(4.8%) 8.43
20
(95.2%)
1
(4.8%) 5.90
NSE 28
(100%) 0 7.61
28
(100%) 0 6.43
Total 72
(98.6%)
1
(1.4%)
72
(98.6%)
1
(1.4%)

88
Results from Table 19 reveal the same pattern found in
Table 18. Although intelligibility is stable over the two productions, the
second time comprehensibility scores were lower for all groups, and a
possible explanation lies in test effect, which might have led listeners to
confusion. Nonetheless, Table 20 reports a different pattern.
Table 20
Comparison between Intelligibility and Comprehensibility
Data for ‘Rabbits’ Pronounced as
Group
Recording of ‘rabbits’
pronounced as by Speaker 16
Recording of ‘rabbits’ pronounced as
by Speaker 07
transcribed
as ‘habits’
transcribed
as ‘rabbits’
CM
transcribed
as ‘habits’
transcribed
as ‘rabbits’
transcribed
as another
word
CM
PPGI 24
(100%) 0 7.46
23
(95.8%)
1
(4.2%) 0 6.22
Extra 11
(52.4%)
10
(47.6%) 6.81
12
(57.1%)
9
(42.9%) 0 5.95
NSE 23
(82.1%)
5
(17.9%) 5.57
23
(82.1%)
4
(14.3%)
1
(3.6%) 4.54
Results from Table 20 show that as intelligibility
decreased, comprehensibility mean scores increased. This is a different
pattern, which suggests a test effect, since the listeners probably got
confused with the target and non-target productions and therefore the
comprehensibility rates assigned by then are not logic.
In sum, taking into account the results discussed in this
section, it is not possible to state whether there is or not an association
between the dimensions of comprehensibility and intelligibility, as
found in studies like the ones conducted by Derwing & Munro (1995a,

89
1997), and Hypothesis 6 was not supported. Finally, the results for the
last research question will be discussed.
4.4. The non-target production of // and the issue of
familiarity
Research Question 4 inquired about the effect of
familiarity: “Which group of NSE listeners has more difficulty in
understanding the Brazilian accented // in English words regarding the
influence of familiarity in the dimensions of comprehensibility and
intelligibility?”. The hypothesis for this research question was:
H7. Familiar NSE listeners will be more accurate when
transcribing the tested words (intelligibility measure) and will assign
higher rates to BPSE productions (comprehensibility measure) (Cruz,
2008; Derwing & Munro, 1997; Gass & Varonis, 1984; Munro &
Derwing, 2006).
To answer this research question, the NSE group was
divided according to level of familiarity with BP, resulting in two
groups of 14 listeners each, namely the familiar listeners (NSE-F) and
unfamiliar listeners (NSE-U). Contingency tables with Chi-square
values were created. Comprehensibility mean scores were also
computed as a way of analyzing intelligibility and comprehensibility
together. Table 21 shows the results for the non-target productions of
‘ropes’54
.
54
The details from the Chi-square tests can be viewed in SPSS tables provided
in APPENDIX Q (p. 196).

90
Table 21
Contingency Table of NSE Transcriptions of ‘Ropes’
Pronounced As [], the Chi-Square Coefficient and
Comprehensibility Mean Scores
Group
Recording of ‘ropes’ pronounced as []
by Speaker 39
Recording of ‘ropes’ pronounced as
[] by Speaker 16
[]
transcribed
as ‘hopes’
[]
transcribed
as ‘ropes’
[]
transcribed
as another
word
CM
[]
transcribed
as ‘hopes’
[]
transcribed as
‘ropes’
CM
NSE-F 10
(71.4%)
3
(21.4%)
1
(7.1%) 5.36
13
(92.8%)
1
(7.1%) 5.93
NSE-U 10
(71.4%) 0
4
(28.56%) 3.79
14
(100%) 0 6.07
Total 20
(71.4%)
3
(10.7%)
5
(17.8%)
27
(96.4%)
1
(4.1%)
Chi-
Square 2=4.800; p = .091; df = 2;
Cramer’s V = .414; p = .091
2=1.037; p = .309; df = 1;
Cramer’s V=.192; p = .309
Number of participants in each group: NSE-F = 14; NSE-U=14.
According to Table 21, intelligibility was higher for NSE-F
(21.4% and 7.1%). Comprehensibility mean scores assigned by NSE-F
were higher only in the first production. A 3X2 group independence
Chi-square test was carried out to find out whether there was a
significant relationship between the groups and the way listeners
transcribed the word ‘ropes’ pronounced as [ by Speaker 39.
The 2 value of 4.800 had an associated probability value of .091 (df =
2), showing that this association is likely to have arisen as a result of
sampling error. Cramer’s V was found to be .414 (p = .091) – thus only
17% of the variation in the frequencies of transcriptions can be
explained by familiarity with the BP accent. It can therefore be
concluded that there is not a significant association between
transcriptions and groups.

91
An even weaker association was found for the second
production, to which a 2X2 group independence Chi-square was carried
out. With a 2 value of 1.037 (p= .309; df = 1), this association is likely
to have arisen as a result of sampling error. Cramer’s V was found to be
.192 (p = .091) – thus only 3.7% of the variation in the frequencies of
transcriptions can be explained by familiarity with the BP accent. In
sum, although NSE-F seem to have performed better in the intelligibility
task then NSE-U, the relationship between familiarity with the BP
accent and transcriptions accuracy explains only a small portion of the
results. Although NSE-F assigned higher comprehensibility rates in the
first non-target production (NSE-F=5.36 against NSE-U=3.79), the
opposite happened in the second instance (NSE-U=6.07 against NSE-
F=5.93). Similar results were found in the analysis of the non-target
production of the word ‘rug’ in Table 22.

92
Table 22
Contingency Table of NSE Transcriptions of ‘Rug’
Pronounced as the Chi-Square Coefficient and
Comprehensibility Mean Scores
Group
Recording of ‘rug’ pronounced
as by Speaker 35
Recording of ‘rug’
pronounced as
by Speaker 10
Recording of ‘rug’
pronounced as
by Speaker 17
transcribed
as ‘hug’
transcribed
as ‘rug’
CM
transcribed as
‘hug’
CM
transcribed
as ‘hug’
CM
NSE-F 13
(92.8%)
1
(7.1%) 6.79
14
(100%) 8.14
14
(100%) 7.00
NSE-U 14
(100%) 0 7.86
14
(100%) 8.21
14
(100%) 7.00
Total 27
(96.4%)
1
(4.1%)
28
(100%)
28
(100%)
Chi-
Square 2=.1.037; p = .309; df = 1;
Cramer’s V=.192; p = .309
No statistics were
computed because
this was a constant
No statistics were
computed because
this was a constant
Table 22 shows that NSE-F reacted differently only in the
first production of ‘rug’. Chi-square and Cramer’s V values were the
same as the second production ‘ropes’, presented in Table 21, meaning
that the variable of familiarity accounts for only 3.7% of the data.
Because all listeners from both groups provided the same transcriptions
for the second and third realizations of ‘rug’, statistics could not be
computed. Different from what was predicted in Hypothesis 7, NSE-U
assigned higher rates for comprehensibility, except in the third
production, for which equal scores were assigned by the groups. The
next table displays information about the non-target productions of
‘rated’.

93
Table 23
Contingency Table of NSE Transcriptions of ‘Rated’
Pronounced As the Chi-Square Coefficient and
Comprehensibility Mean Scores
Number of participants in each group: NSE-F = 14; NSE-U=14.
Once again listeners from both groups behaved equally,
and comprehensibility rates assigned by NSE-U were slightly higher.
However, Table 24 reveals different results for the word ‘rabbits’.
Group
Recording of ‘rated’
pronounced as by
Speaker 16
Recording of ‘rated’
pronounced as by
Speaker 07
transcribed as ‘hated’
CM
transcribed as ‘hated’ CM
NSE-F 14
(100%) 7.36
14
(100%) 6.36
NSE-U 14
(100%) 7.86
14
(100%) 6.50
Total 28
(100%)
28
(100%)
Chi-Square No statistics were computed
because this was a constant
No statistics were computed
because this was a constant

94
Table 24
Contingency Table of NSE Transcriptions of ‘Rabbits’
Pronounced As , the Chi-Square Coefficient and
Comprehensibility Mean Scores
Number of participants in each group: NSE-F = 14; NSE-U=14.
The analysis of the transcriptions for the non-target
productions of ‘rabbits’ reveals that listeners from the NSE-F groups
performed slightly better than NSE-U in the intelligibility test. A 2X2
group independence Chi-square test was carried out to find out whether
there was a significant relationship between the groups and the
transcriptions provided for Speaker 39 production. The 2 value of .243
(p= .091; df = 1) shows that this association is likely to have arisen as a
result of sampling error. Cramer’s V was found to be .093 (p = .622),
which suggests that only .08% of the variation in the frequencies of
transcriptions can be explained by familiarity with the BP accent. Thus,
there is not a significant association between transcriptions and groups.
For the second production a 3X2 group independence Chi-square test
Group
Recording of ‘rabbits’
pronounced as by
Speaker 16
Recording of ‘rabbits’ pronounced as
by Speaker 07
transcribed
as ‘habits’
transcribed
as ‘rabbits’
CM
transcribed
as ‘habits’
transcribed
as ‘rabbits’
transcribed
as another
word
CM
NSE-F 11
(78.5%)
3
(21.4%) 6.07
11
(78.5%)
3
(21.4%) 0 4.21
NSE-U 12
(85.7%)
2
(14.2%) 5.07
12
(85.7%)
1
(7.1%)
1
(7.1%) 4.86
Total 23
(82.1%)
5
(17.8%)
23
(82.1%)
4
(14.2%)
1
(3.5%)
Chi-
Square 2=.243; p = .622; df=1; Cramer’s
V= .093; p = .622
2=2.043; p = .360; df = 2;
Cramer’s V = .270; p = .360

95
was carried out, which resulted in a 2 value of 2.043 (p= .360; df = 2),
with a Cramer’s V of .270. Therefore, only 7.3% of the results can be
explained in terms of familiarity with the BP accent. Like the other
analysis, comprehensibility scores do not follow a pattern, since NSE-F
mean score is higher in the first production and lower in the second one.
In sum, apparently, familiarity with BP does not explain the results
presented in this section.
4.5. Summary of the chapter
In summary, these are the main findings reported in this
chapter: a) the substitution of word-initial // with a fricative really
hindered intelligibility, and either L1 background sharing and level of
proficiency did not increase intelligibility as it would be expected; b) in
what concerns comprehensibility, on the other hand, L1 background
sharing seems to have played a role, since NSE were harsher in their
evaluations of NNS speech, but level of proficiency once again did not
interfere on the results; c) when analyzing the results from intelligibility
and comprehensibility, it was not possible to find an association
between these dimensions, and d) similarly to the other variables,
familiarity with BP did not influence the results, contrary to what was
expected. Moreover, throughout the results it is possible to find
evidences that the test should be reformulated in order to avoid test
effects and obtain more reliable results.
Next chapter will discuss the main findings of this research
and point out the limitations of the study, as well as possible
pedagogical implications and ideas for further research.

96
CHAPTER 5
CONCLUSION
The objective of this chapter is to summarize the main
results presented throughout the previous chapters, as well as discuss the
pedagogical implications of these findings, the limitations of the study
and suggestions that may contribute to future research in the area.
5.1. Summary of overall results
Although the focus of this study was not to investigate the
issue of transfer, the first findings concern the transfer of the production
of rhotics from BP to English in word-initial position. After analyzing
the recordings, it was concluded that: a) only a few BPSE transferred
the BP r-sounds to English (in word-initial position), which may be the
result of the type of test administered or the speakers’ L2 proficiency
level b) the non-target pronunciation of word-initial // was the fricative,
since this is also the speakers’ allophone for <r> in BP; c) the words that
were most frequently pronounced with a non-target production of // in
word-initial position were “rug” and “rated”, while the r-sound in the
word “right” was pronounced as a retroflex by all the participants,
probably due to the high occurrence of this word in English.
Other results relate to intelligibility and comprehensibility
of the non-target productions of //. In sum, the non-target production of
the retroflex [] in the four tested words (‘ropes’, ‘rug’, rated’ and
‘rabbits’) resulted mainly in the transcription of ‘hopes’, ‘hug’, ‘hated’,
and ‘habits’, meaning that pronouncing <r> as a glottal fricative causes
unintelligibility, which corroborates Hypothesis 1. The non-target
productions were more intelligible for the Extra group, which may be
due to listeners’ level of proficiency, which is lower in relation to the
other groups (a prediction made in Hypothesis 3). However, Cronbach’s
Alpha results do not indicate a strong relationship between level of
proficiency and intelligibility of the non-target pronunciation of // in
none of the tested words. Data on intelligibility did not confirm
97
Hypothesis 2 either, according to which L1 background sharing would
facilitate BPSE intelligibility.
As for comprehensibility results, it can be said that mean
rates decrease following this order: PPGI, Extra, NSE. A possible
explanation relies on Bent and Bradlow’s (2003) matched interlanguage
speech intelligibility benefit, which argues that listeners who share an
L1 with the speaker will have an advantage over listeners from other
L1s. In fact, this difference was significant between PPGI and NSE
group and between the Extra and PPGI group for the words ‘rug’ and
‘rabbits’ in the first case and for ‘rug’ in the second. Therefore, this
finding seems to support Hypothesis 4 and 5, which concern the L1
background advantage and the less proficient listeners. It was
hypothesized that less proficient listeners had to spend more time and
effort trying to distinguish between the minimal pair, because they were
not able to notice that the listeners were in fact replacing the
pronunciation of the rhotic with the fricative.
When trying to find an association between intelligibility
and comprehensibility, it was not possible to come to a conclusion, for
the two dimensions do not follow a pattern. While in some cases
comprehensibility increases with intelligibility, in others, the two
dimensions go in opposite directions or decrease, contrary to what was
predicted in Hypothesis 7. Similar results were found regarding the
familiarity variable, since there was not a pattern or significant
differences between the familiar and unfamiliar groups of NSE, as
found in studies like the ones conducted by Derwing and Munro (1995a,
1997), for instance. Actually, in some recordings NSE-U performed
better on the intelligibility task in comparison to NSE-F, and Hypothesis
7 was not supported.
Overall, the non-target production of // hindered BPSE
intelligibility and comprehensibility according to listeners. Although
some differences among groups were noticeable in the results, they were
not statistically significant, and therefore it is not possible to state that
the variables of level of proficiency, L1 background advantage and
familiarity with an accent have any influence on the intelligibility and

98
comprehensibility of BPSE speech regarding the production of the
retroflex in word-initial position.
5.2. Pedagogical Implications
Derwing and Munro’s concern (2008) perfectly
illustrates the importance of studies like the present one for ESL
teaching: “We have to know where to put the focus. If not, there is a risk
of teaching things that are salient, but which will not result in actual
improvement in communication for the speaker” (p. 482)”. In the
context of EIL, the objective is to focus on intelligibility, and therefore
to focus on the features that are important to assure communication.
Thus, it is vital to investigate which aspects or productions really affect
intelligibility. The steps to reach this aim, according to the same authors
are: “First, more research should be conducted on intelligibility to
establish the most effective ways of assessing it and to identify the
factors that contribute to it. No single approach to intelligibility
assessment can take into account all the subtleties that might influence a
listener” (Derwing & Munro, 2005, p. 391).
Hence, it is expected that the results gathered in this study
will help teachers to set priorities when teaching BPSE. The results from
this research highlight that the non-target production of the rhotic, at
least in word-initial position, affects intelligibility and comprehensibility
of both NSE and other BPSE from different levels of proficiency.
This research also serves the pedagogical purpose of
offering the perspective from other L2 users, a claim made by Derwing
and Munro (2008). As mentioned earlier, in the context of EIL, not only
the NSE perspective matters, but instead it is vital to consider the effect
of L2 speech on the interlocutors with whom the L2 speaker “is more
likely to interact with” (Munro et al., 2006). For example, in this study,
some cases indicate that sharing an L1 with the speaker might facilitate
intelligibility and comprehensibility, although communication problems
are likely to take place if BP speakers are using English to
communicate. This situation is likely to happen in contexts where BP

99
speakers have to interact with each other and with speakers of other
languages using English as a Lingua Franca, such as international events
or business meetings. Therefore, it is important to understand the
specificities of each group and guarantee that aspects that improve
intelligibility are taught to learners of ESL.
5.3. Limitations of the study and suggestions for further research
The results presented in this thesis suggest that changes in
the method of data collection are necessary to investigate whether or not
the transfer process really occurs with the production of English <r> by
BP speakers as a way to obtain more reliable answers. As mentioned in
the Method Chapter, the use of a sentence-reading task to collect data
from the speakers was important to control for the phonological
environment, the length of the sentences, the position of the rhotic in the
word, among other features. However, more extensive samples
resembling real life interactions are obviously recommended for future
research. As mentioned by Deus (2009), it may be better to record BSPE
while they are producing free speech, since this is a harder task than
reading, and consequently, it could lead them to produce more non-
target productions of word-initial <r>. This procedure was followed by
Osborne (2010), which may explain why this researcher was able to
identify higher percentages of transfer than Deus (2009).
However, a loss of control is implied in tasks using
extemporaneous speech, and the alternative procedure of paraphrasing
proposed by Algethami et al. (2011) seems to be a balanced solution for
this methodological dilemma. In addition, in order to verify if all the
possible pronunciations of word-initial <r> in BP are transferred to
English, it is necessary to collect data from Brazilians who speak
different BP dialects. Testing BPSE of different proficiency levels may
also enlighten us regarding to what extent BPSE transfer the rhotic
sounds from BP to English.
Another problem concerning the method applied in this
research is related to the use of minimal pairs and ambiguous sentences.

100
Cruz (2005) claims that minimal pairs end up biasing the listeners. In
fact, it is really hard to find examples in real life in which minimal pairs
result in misunderstanding due to non-target productions, and it appears
that the data obtained in this study are more related to perception itself
rather than intelligibility. This does not mean that the results reported
here should not be taken into account, but they can be complemented
with future investigations that work with non-ambiguous sentences. As
a matter of fact, a multiplicity of methods can be useful so as to obtain a
more detailed analysis of what hinders intelligibility and
comprehensibility the most.
The fact that more students were able to participate in the
research because of the website is an advantage of using the internet for
research purposes. Students from different university campuses enrolled
in online programs are usually left out because of the distance from the
central campus, even though they are more accustomed to using the
internet for academic purposes than regular students.
There are certainly some limitations, such as the quality of
the recordings (participants need a good microphone, and a silent place
to record themselves); the amount of necessary instruction (without the
assistance of the researcher, participants need more information; and a
special design of the instruments is required); the variety of browsers,
which generates a compatibility problem; the quality of internet access,
among other things. Even so, it can be argued that this study is
innovative for reaching participants that otherwise would not have had
the chance to be part of the study if the data had not been collected
online.
Using a web-site for data gathering was also important to
collect data from NSE listeners who were not (so) familiar with BP. If
these listeners lived in Brazil they would be much more familiar with
BP and a comparison between groups would not have been possible.

101
REFERENCES
Algethami, G., Ingram, J., & Nguyen, T. (2011). The interlanguage
speech intelligibility benefit: the case of Arabic-accented English.
In J. Levis & K. LeVelle (Eds.), Proceedings of the 2nd
Pronunciation in Second Language Learning and Teaching
Conference (Vol. 114, pp. 30–42). Ames. Retrieved from
http://www.pubmedcentral.nih.gov/articlerender.fcgi?artid=27098
66&tool=pmcentrez&rendertype=abstract
Bachman, L. F. (2004). Statistical Analyses for Language Assessment.
Cambridge University Press.
BBC. (2011). Learn English - British Council. Retrieved November 2,
2011, from http://learnenglish.britishcouncil.org/en/stories/scarlett
Becker, M. R. (2011). A questão da inteligibilidade do inglês como
língua franca. VII Congresso Internacional da Abralin Curitiba
2011 (pp. 2789–2800). Curitiba.
Bent, T., & Bradlow, A. R. (2003). The interlanguage speech
intelligibility benefit. The Journal of the Acoustical Society of
America, 114(3), 1600–1610. doi:10.1121/1.1603234
Bent, T., Bradlow, A. R., & Smith, B. L. (2007). Segmental errors in
different word positions and their effects on intelligibility of non-
native speech: All’s well that begins well. In O.-S. Bohn (Ed.),
Language Experience in Second Language Speech Learning: In
Honor of James Emil Flege (pp. 331–347). Amsterdam: John
Benjamins Publishers Company.
Bertani, S. R. (1998). Análise Fonológica do Infinitivo na Fala de Porto
Alegre. Revista Língua e Literatura, 1(1), 20.
Botassini, J. O. M. (2009). Crenças e atitudes lingüísticas quanto ao uso
de róticos. SIGNUM: Estudos Lingüísticos, 12(1), 85–102.
102
Brenner, T. de M. (2005). Variação: a coda [R] em Santa Catarina,
Brasil. Rev. Est. Ling., 13(2), 181–202.
Brescancini, C., & Monaretto, V. N. de O. (2008). Os róticos no sul do
Brasil: panorama e generalizações. SIGNUM: Estudos
Lingüísticos, 11(2), 51–66.
Bygate, M., Skehan, P., & Swain, M. (2001). Introduction. In M.
Bygate, P. Skehan, & M. Swain (Eds.), Researching pedagogic
tasks: second language learning, teaching and testing (pp. 1–20).
Harlow, UK: Pearson.
Cagliari, L. C. (2007). Elementos de Fonética do Português Brasileiro
(p. 194). São Paulo: Paulistana.
Callou, D. M. I., Moraes, J., & Leite, Y. (1996). Variação e
diferenciação dialetal: a pronúncia do /r/ no português do Brasil. In
I. Koch (Ed.), Gramática do português falado (pp. 465–493).
Campinas: UNICAMP.
Callou, D., Moraes, J., & Leite, Y. (1998). Apagamento do R Final no
Dialeto Carioca: um Estudo em Tempo Aparente e em Tempo
Real. DELTA: Documentação de Estudos em Lingüística Teórica e
Aplicada, 14(Special Issue), 00–00. doi:10.1590/S0102-
44501998000300006
Camara-Jr., J. M. (2008). Para o estudo da fonêmica portuguesa.
Petrópolis RJ: Editora Vozes.
Costa, G. B. da. (2009). Reflexões sobre o apagamento do rótico na
escrita das séries iniciais. Revista Philologus, 15(45), 137–145.
Cristófaro-Silva, T. (2005). Fonética e Fonologia do Português. Belo
Horizonte: FALE/UFMG.

103
Cristófaro-Silva, T. (2010). Fonética e Fonologia do Português: roteiro
de estudos e guia de exercícios (10. ed., p. 275). São Paulo:
Editora Contexto.
Cruz, N. C. (2003). An exploratory study of pronunciation intelligibility
in the Brazilian Learner’s English. the ESPecialist, 24(2), 155–
175.
Cruz, N. C. (2005). Minimal pairs: are they suitable to illustrate
meaning confusion derived from mispronunciation in Brazilian
learners’ English? Linguagem & Ensino, 8(2), 171–180.
Cruz, N. C. (2006). Pronúncia de aprendizes brasileiros de inglês e
inteligibilidade: um estudo com dois grupos de ouvintes. Revista
Virtual de Estudos da Linguagem – ReVEL, 4(7), 1–26. Retrieved
from www.revel.inf.br
Cruz, N. C. (2008). Familiaridade do ouvinte e inteligibilidade da
pronúncia de aprendizes brasileiros de inglês. Revista Horizontes
de Lingüística Aplicada, 7(1), 88–103.
Cruz, N. C. (2010). Vowel insertion in the speech of Brazilian learners
of English: a source of unintelligibility? Ilha do Desterro A
Journal of English Language, Literatures in English and Cultural
Studies, (55), 133–152. Retrieved from
http://www.journal.ufsc.br/index.php/desterro/article/viewArticle/
16307
Cruz, Neide Cesar. (2004). Pronunciation intelligibility in spontaneous
speech of Brazilian learners English. Universidade Federal de
Santa Catarina.
Dancey, C. P., & Reidy, J. (2004). Statistics without maths for
Psychology (3rd editio.). Essex - England: Pearson.
104
Davies, M. (2012). Corpus of Contemporary American English
(COCA). Retrieved December 2, 1BC, from
http://corpus.byu.edu/coca/
Delft, L. Van. (2009). The effect of correcting temporal patterns on the
intelligibility of non-native Dutch speech. Utrecht University.
Derwing, T. M., & Munro, M. J. (1997). Accent, Intelligibility, and
Comprehensibility - Evidence from Four L1s. Studies in Second
Language Acquisition, 20, 1–16. Retrieved from
journals.cambridge.org
Derwing, T. M., Munro, M. J., & Thomson, R. I. (2007). A Longitudinal
Study of ESL Learners’ Fluency and Comprehensibility
Development. Applied Linguistics, 29(3), 359–380.
doi:10.1093/applin/amm041
Derwing, Tracey M., & Munro, M. J. (2005). Second Language Accent
and Pronunciation Teaching: A Research-Based Approach. TESOL
Quarterly, 39(3), 379–397. doi:10.2307/3588486
Derwing, Tracey M., & Munro, M. J. (2008). Putting accent in its place:
Rethinking obstacles to communication. Language Teaching,
42(04), 476–490. doi:10.1017/S026144480800551X
Deus, A. F. de. (2009). A transferência do português na leitura das
róticas em posição de ataque no inglês por estudantes brasileiros
de inglês. Universidade Federal do Paraná - UFPR.
Dias, A. T. B. B. B. (2003). Apagamento do fonema /R/ pós-vocálico de
textos orais em informantes em aquisiçao de linguagem. 5o
Encontro do Celsul (Vol. 2003, pp. 176–180). Curitiba.
Eklund, P., Engstrand, O., Gustafsson, K., Ivachova, E., & Karlsson, Å.
(2005). /r/ realizations by Swedish two-year-olds: preliminary
observations. FONETIK 2005 (pp. 63–66).

105
Ellis, R. (1997). Second Language Acquisition. Oxford University Press.
Fayer, J. M., & Krasinski, E. (1987). Native and non-native judgments
of intelligibility and irritation. Language Learning, 37(3), 313–
327.
Fraga, L. (2006). Os róticos no português de Carambeí / PR. Estudos
Lingüísticos, 1113–1122.
Gass, S., & Varonis, E. M. (1984). The effect of familiarity on the
comprehensibility of nonnative speech. Language Learning, 34(1),
65–89.
Gooskens, C., Van Heuven, V. J., Van Bezooijen, R., & Pacilly, J. J. A.
(2010). Is spoken Danish less intelligible than Swedish? Speech
Communication, 52(11-12), 1022–1037.
doi:10.1016/j.specom.2010.06.005
Harding, L. (2011). Accent, listening assessment and the potential for a
shared-L1 advantage: A DIF perspective. Language Testing, 29(2),
163–180. doi:10.1177/0265532211421161
Hayes-Harb, R., Smith, B. L., Bent, T., & Bradlow, A. R. (2008). The
interlanguage speech intelligibility benefit for native speakers of
Mandarin: Production and perception of English word-final
voicing contrasts. J Phon., 36(4), 664–679.
doi:10.1016/j.wocn.2008.04.002.The
Imai, S., Flege, J. E., & Walley, A. (2003). Spoken word recognition of
accented and unaccented speech: Lexical factors affecting native
and non-native listeners. 15th ICPhS Barcelona (pp. 845–848).
Jenkins, J. (2000). Phonology of English as an international language:
new models, new norms, new goals. Oxford: Oxford University
Press.

106
Kamil, M. L., Pearson, P. D., Moje, E. B., & Afflebach, P. P. (2011).
Handbook of Reading Research (Volume 4.). Routledge Falmer.
Kennedy, S., & Trofimovich, P. (2008). Intelligibility ,
Comprehensibility , and Accentedness of L2 Speech: The Role of
Listener Experience and Semantic Context. The Canadian Modern
Language Review / La revue canadienne, 64(3), 459–489.
Kenworthy, J. (1987). Teaching English Pronunciation. Essex:
Longman Group.
Koda, K. (2007). Reading and Language Learning: Crosslinguistic
Constraints on Second Language Reading Development. Language
Learning, 57(Suppl.1), 1–44.
Ladefoged, P. (2001). Vowels and Consonants: An Introduction to the
Sounds of Languages. Oxford, UK: Blackwell.
Ladefoged, P., & Maddieson, I. (1996). The sounds of the world
languages. Blackwell.
Larson-Hall, J. (2010). A Guide to Doing Statistics in Second Language
Research Using SPSS. Language. New York and London:
Routledge. Retrieved from
www.routledge.com/textbooks/9780805861853
Lieff, C. D., & Nunes, Z. A. (1993). English pronunciation and the
Brazilian learner: How to cope with language transfer. Speak Out!,
12, 22–27.
Lindau, M. (1985). The story of /r/. In V. A. Fromkin (Ed.), Phonetic
Linguistics: Essays in Honor of Peter Ladefoged (pp. 157–168).
Orlando: Academic Press.
Major, R. C., Fitzmaurice, S. F., Bunta, F., & Balasubramanian, C.
(2002). The Effects of Nonnative Accents on Listening
107
Comprehension: Implications for ESL Assessment. Tesol
Quarterly, 36(2), 173–190. doi:10.2307/3588329
Matsuura, H. (2007). Intelligibility and individual learner differences in
the EIL context. System, 35(3), 293–304.
doi:10.1016/j.system.2007.03.003
Matsuura, H., Chiba, R., & Matsuda, A. (2010). Evaluative Reactions to
L2 English: American, Hong Kong Chinese, and Japanese Views.
Journal of Commerce, Economics, and Economic History, 79(2),
27–38. Retrieved from http://ir.lib.fukushima-
u.ac.jp/dspace/handle/10270/3480
McKay, S. L. (2003). Toward an appropriate EIL pedagogy: re-
examining common ELT assumptions. International Journal of
Applied Linguistics, 13(1), 1–22. doi:10.1111/1473-4192.00035
Mollica, M. C. de M., & Fernandez, C. de M. (2003). Um caso de
estabilidade fonológica em tempo aparente em tempo real. Revista
de Letras, 1/2(25), 94–98.
Monaretto, V. N. de O. (2009). Descrição da Vibrante no Português do
Sul do Brasil. In L. Bisol & G. Collischonn (Eds.), Português no
Sul do Brasil - Variação Fonológica (pp. 141–151). Porto Alegre:
ediPUCRS. Retrieved from http://www.pucrs.br/orgaos/edipucrs
Monaretto, V. N. de O., Quednau, L. R., & Hora, D. da. (1996). As
Consoantes do Português. In Lêda Bisol (Ed.), Introdução aos
Estudos da Fonologia do Português (2a ed., pp. 205–246). Porto
Alegre: ediPUCRS.
Monguilhott, I. de O. e S. (1998). A influência da etnia na vibrante
catarinense. VIII Seminário de Iniciaçao Científica da UFSC (p.
330). Florianópolis: Imprensa Universitária.

108
Monguilhott, I. de O. e S. (2007). A variação na vibrante
florianopolitana: um estudo sócio-geolinguístico. Revista da
ABRALIN, 6(1), 147–169.
Munro, M. J. (2008). Foreign accent and speech intelligibility. In J. G.
H. Edwards & M. L. Zampini (Eds.), Phonology and Second
Language Acquisition (pp. 193–218). Amsterdam/ Philadelphia.
Munro, M. J. (2010). Intelligibility: Buzzword or buzzworthy? In J.
Levis & K. LeVelle (Eds.), Proceedings of the 2nd Pronunciation
in Second Language Learning and Teaching Conference (pp. 7–
16). Ames, IA: Iowa State University.
Munro, M. J., & Derwing, T. (2006). The functional load principle in
ESL pronunciation instruction: An exploratory study. System,
34(4), 520–531. doi:10.1016/j.system.2006.09.004
Munro, M. J., & Derwing, T. M. (1995a). Processing time, accent, and
comprehensibility in the perception of native and foreign-accented
speech. Language and Speech, 38(3), 289–306.
Munro, M. J., & Derwing, T. M. (1995b). Foreign accent,
comprehensibility, and intelligibility in the speech of second
language learners. Language Learning, 45(1), 73–97.
Munro, M. J., & Derwing, T. M. (2011). The foundations of accent and
intelligibility in pronunciation research. Language Teaching,
44(03), 316–327. doi:10.1017/S0261444811000103
Munro, M. J., Derwing, T. M., & Morton, S. L. (2006). The Mutual
Intelligibility of L2 Speech. Studies in Second Language
Acquisition, 28(01), 111–131. doi:10.1017/S0272263106060049
Nelson, C. L. (2011). Intelligibility in World Englishes. New York and
London: Routledge.

109
Noll, V. (2008). O português brasileiro: formação e contrastes. São
Paulo: Globo.
Osborne, D. M. (2008). Systematic differences between the
interlanguage phonology of a Brazilian Portuguese learner of
English and the phonology of standard American English Denise
M. Osborne. Ilha do Desterro, 55, 111–134.
Osborne, D. M. (2010). The Production of Rhotic Sounds by Brazilian
Speakers of English. Arizona Working Papers in SLA & Teaching,
17, 1–25. Retrieved from
http://w3.coh.arizona.edu/AWP/AWP17/1._The Production of
Rhotic Sounds by Brazilian Speakers of English.pdf
Pedrosa, J. L. R., & Cardoso, W. (2010). Status da consoante pós-
vocálica no português brasileiro: coda ou onset com núcleo não
preenchido foneticamente? Letras de Hoje, 45(1), 71–79.
Reinecke, K. (2006). Os róticos intervocálicos na gramática individual
de Falantes de Blumenau e Lages. Tese de doutorado. 241p.
Universidade Federal de Santa Catarina.
Reis, M. S., & Kluge, D. C. (2008). Intelligibility of Brazilian
Portuguese-accented English realization of nasals in word-final
position by Brazilian and Dutch EFL learners. Revista Crop, 13,
215–229.
Sharifian, F. (2009). English as an international language: Perspectives
and pedagogical issues. Bristol/ New York: Multilingual Matters.
Retrieved from
http://books.google.com/books?hl=en&lr=&id=6zArJ1ZBBpEC&
oi=fnd&pg=PR7&dq=English+as+an+International+Language+-
+Perspectives+and+Pedagogical+Issues&ots=omZQRCFGLg&sig
=zppym1J1IfiDoPY_MeicmRkwU4o

110
Silva, A. H. P., & Albano, E. (1999). Brazilian Portuguese rhotics and
the phonetics/phonology boundary. XIVth ICPhS 99 (pp. 2211–
2214). San Francisco.
Silva-Brustolin, A. K. B. Da. (2009). Ilha de Santa Catarina rodeada por
róticos. Travessias, 07, 98–126.
Smith, L. E., & Nelson, C. L. (1985). International intelligibility of
English: directions and resources. World Englishes, 4(3), 333–342.
doi:10.1111/j.1467-971X.1985.tb00423.x
Smith, L. E., & Rafiqzad, K. (1979). English for Cross-Cultural
Communication: The Question of Intelligibility. Tesol Quarterly,
13(3), 371–380.
Tajima, K., Port, R., & Dalby, J. (1997). Effects of temporal correction
on intelligibility of foreign-accented English. Journal of Phonetics,
25, 1–24.
Toledo, A. do R. (2009). A realização dos róticos em coda silábica na
cidade de Paranaguá – litoral do Paraná. SIGNUM: Estudos
Lingüísticos, 12(1), 403–422.
Valdés, G. (2001). Heritage language students: Profiles and possibilities.
In J. K. Peyton, D. A. Ranard, & S. McGinnis (Eds.), Heritage
languages in America: Preserving a national resource.
Washington, DC: Center for Applied Linguistics.
Van Wijngaarden, S. J., Steeneken, H. J. M., & Houtgast, T. (2002).
Quantifying the intelligibility of speech in noise for non-native
talkers. The Journal of the Acoustical Society of America, 112(6),
3004. doi:10.1121/1.1512289
Weinberger, S. (2011). The Speech Accent Archive. Retrieved July 8,
2011, from http://accent.gmu.edu/

111
Yavas, M. (2011). Applied English Phonology. Oxford: Wiley-
Blackwell.

112
APPENDICES
Appendix A
Speakers’ Profiles
Speakers'
ID Status
Gende
r Age
Place where
the speaker
lived most of
his/her life
Current
education
status
Course
Foreign languages the
participant speaks (besides
BP)
PilotSpeaker
7 BPSE Female 23
Florianópolis -
SC Some College -
In Progress
Secretariado
Executivo English; French
PilotSpeaker
8 BPSE Female 26 Assu - RN
Master’s
Program – In
Progress
Mestrado em
Letras Inglês English
PilotSpeaker
9 BPSE Female 43
Florianópolis -
SC Some College -
In Progress Letras Inglês English
PilotSpeaker
10 BPSE Female 29
Cascavel - PR Some College -
In Progress Letras Inglês English; Spanish; Italian
PilotSpeaker
14 NSE Male 26
Londres -
Londres
Master’s
Program – In
Progress
Mestrado em
Letras Inglês
English; French, Italian;
Portuguese

113
Speaker15 BPSE Female 34 São Paulo - SP Some College -
In Progress Letras Inglês English
Speaker16 BPSE Female 42
Frederico
Westphalen -
RS
Some College -
In Progress Letras Inglês English; German
Speaker17 BPSE Male 46
Porto Alegre -
RS Some College -
In Progress Letras Inglês English; Spanish
Speaker18 BPSE Male 19 Tijucas - SC Some College -
In Progress Letras Inglês English
Speaker19 BPSE Male 18
Petrolândia -
SC Some College -
In Progress Letras Inglês English
Speaker20 BPSE Male 19
Florianópolis -
SC Some College -
In Progress Letras Inglês English
Speaker21 BPSE Male 18 Joinville - SC Some College -
In Progress Letras Inglês English; German; Japonese
Speaker22 BPSE Female 18 São José - SC Some College -
In Progress Letras Inglês English; French
Speaker23 BPSE Male 18 Palhoça - SC Some College -
In Progress Letras Inglês English; Italian

114
Speaker24 BPSE Male 23 São José - SC Some College -
In Progress Letras Inglês English
Speaker25 BPSE Female 18
Florianópolis -
SC Some College -
In Progress Letras Inglês English
Speaker26 BPSE Male 19 Brusque - SC Some College -
In Progress Letras Inglês English; Spanish
Speaker27 BPSE Male 20
Chopinzinho -
PR Some College -
In Progress Letras Inglês English; Spanish
Speaker30 BPSE Female 33
Florianópolis -
SC Some College -
In Progress Letras Inglês English
Speaker32 BPSE Female 47
Florianópolis -
SC Some College -
In Progress
Secretariado
Executivo English
Speaker33 BPSE Male 26 São José - SC Some College -
In Progress
Secretariado
Executivo English; Spanish
Speaker34 BPSE Female 19
Florianópolis -
SC Some College -
In Progress
Secretariado
Executivo English
Speaker35 BPSE Female 22
Florianópolis -
SC Some College -
In Progress
Secretariado
Executivo English; French
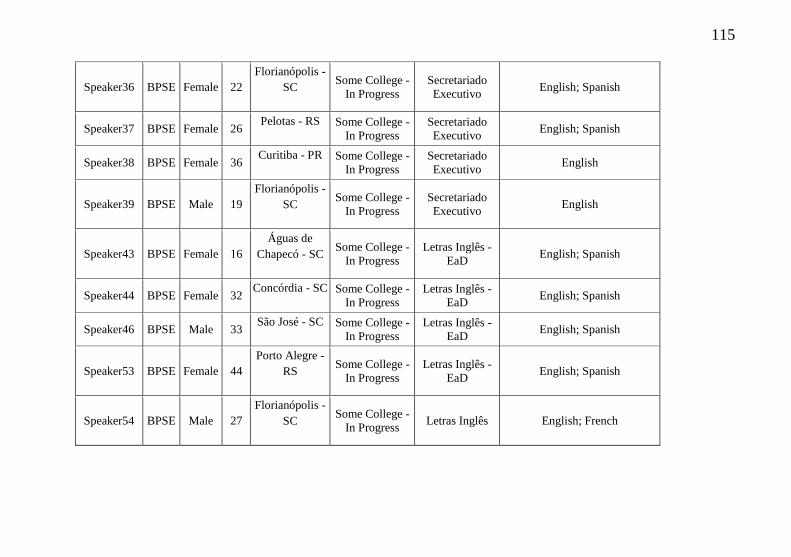
115
Speaker36 BPSE Female 22
Florianópolis -
SC Some College -
In Progress
Secretariado
Executivo English; Spanish
Speaker37 BPSE Female 26 Pelotas - RS Some College -
In Progress
Secretariado
Executivo English; Spanish
Speaker38 BPSE Female 36 Curitiba - PR Some College -
In Progress
Secretariado
Executivo English
Speaker39 BPSE Male 19
Florianópolis -
SC Some College -
In Progress
Secretariado
Executivo English
Speaker43 BPSE Female 16
Águas de
Chapecó - SC Some College -
In Progress
Letras Inglês -
EaD English; Spanish
Speaker44 BPSE Female 32 Concórdia - SC Some College -
In Progress
Letras Inglês -
EaD English; Spanish
Speaker46 BPSE Male 33 São José - SC Some College -
In Progress
Letras Inglês -
EaD English; Spanish
Speaker53 BPSE Female 44
Porto Alegre -
RS Some College -
In Progress
Letras Inglês -
EaD English; Spanish
Speaker54 BPSE Male 27
Florianópolis -
SC Some College -
In Progress Letras Inglês English; French

116
Speaker56 NSE Male 21
Taylosville -
Utah High School
Graduate Portuguese
Speaker71 BPSE Male 20 Alegrete - RS Some College -
In Progress
Letras Inglês
UNINFRA English
Speaker73 BPSE Female 27 Brusque - SC Some College -
In Progress
Letras Inglês -
EaD
English; Spanish; Italian;
German
Speaker74 BPSE Male 19 Concórdia - SC Some College -
In Progress
Letras Inglês -
EaD English; Spanish;
Speaker75 BPSE Female 21
Florianópolis -
SC Some College -
In Progress
Secretariado
Executivo English
Speaker76 BPSE Female 24
Campos Novos
- SC Some College -
In Progress
Secretariado
Executivo English
Speaker81 BPSE Male 34
São Leopoldo -
RS Some College -
In Progress
Letras Inglês -
EaD English
Speaker83 BPSE Male 28 Araranguá - SC Some College -
In Progress
Letras Inglês -
EaD English; Spanish;
Speaker88 BPSE Male 39
São Leopoldo -
RS Some College -
In Progress
Letras Inglês -
EaD English

117
Appendix B
PPGI Profiles
Listener’s
ID Age
Gende
r
Place where the
participant lived
most of his/her life
Current
Education
Status
Foreign languages
the participant
speaks (besides BP)
Listener3 33 F Rio de Janeiro - RJ Doctoral
Degree Spanish, English
Listener4 25 M Teresina - PI Masters
Degree English, Spanish
Listener5 25 F Garopaba - SC Doctoral
Degree English
Listener8 30 F Petrópolis - RJ
Masters
Degree English, Spanish,
French
Listener10 26 F Gaspar - SC
Doctoral
Degree English, Spanish,
German
Listener11 44 F Florianópolis - SC
Doctoral
Degree English
Listener12 28 F Florianópolis - SC
Masters
Degree English, French
Listener13 41 F Florianópolis - SC
Doctoral
Degree Spanish, English,
Italian
Listener15 31 F Rio Grande - RS
Masters
Degree English
Listener16 26 M Dois Irmãos - RS
Masters
Degree German, English,
Spanish
Listener21 40 F Blumenau - SC
Doctoral
Degree English, French
Listener25 33 F Porto Alegre - RS
Doctoral
Degree English, French

118
Listener39 29 F Chapecó - SC
Masters
Degree English, Spanish
Listener49 49 F Panambi - RS
Masters
Degree English, French,
Spanish, German
Listener50 39 M Porto Alegre - RS
Masters
Degree English
Listener51 44 M São Paulo - SP
Masters
Degree English, Spanish
Listener52 29 F São Lourenço - MG
Masters
Degree English, Spanish
Listener54 47 F São Paulo - SP
Masters
Degree English, Spanish
Listener56 28 F Criciúma - SC
Doctoral
Degree English, Spanish
Listener62 32 F
São Bento do Sul -
SC
Masters
Degree English, French
Listener64 30 F Pelotas - RS
Masters
Degree English
Listener68 33 F Santos - SP
Masters
Degree English, Spanish
Listener71 30 F Torres - RS
Masters
Degree English, Spanish
Listener75 41 F Maringá - PR
Doctoral
Degree English, Spanish,
Japanese, French
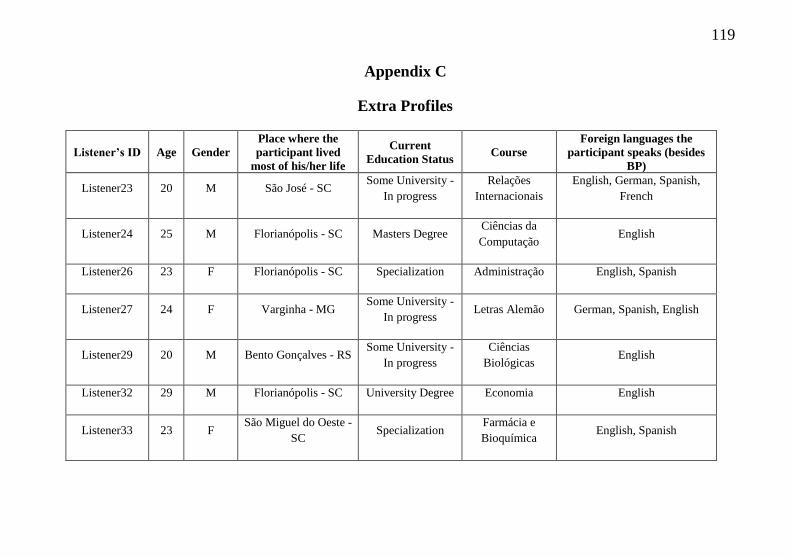
119
Appendix C
Extra Profiles
Listener’s ID Age Gender
Place where the
participant lived
most of his/her life
Current
Education Status Course
Foreign languages the
participant speaks (besides
BP)
Listener23 20 M São José - SC Some University -
In progress
Relações
Internacionais
English, German, Spanish,
French
Listener24 25 M Florianópolis - SC Masters Degree Ciências da
Computação English
Listener26 23 F Florianópolis - SC Specialization Administração English, Spanish
Listener27 24 F Varginha - MG Some University -
In progress Letras Alemão German, Spanish, English
Listener29 20 M Bento Gonçalves - RS Some University -
In progress
Ciências
Biológicas English
Listener32 29 M Florianópolis - SC University Degree Economia English
Listener33 23 F São Miguel do Oeste -
SC Specialization
Farmácia e
Bioquímica English, Spanish

120
Listener41 20 M São Paulo - SP Some University -
In progress
Engenharia de
Produção
Mecânica
English
Listener43 24 F Concórdia - SC Some University -
In progress
Ciências
Econômicas English
Listener44 27 M Florianópolis - SC Other Curso para
concurso English
Listener45 31 F Florianópolis - SC Specialization Economia e
Gestão Publica English, Italian
Listener47 20 M Manaus - AM Some University -
In progress
Engenharia de
Produção
Mecânica
English
Listener58 31 M Uruguaiana - RS Doctoral Degree Engenharia de
Alimentos English, Spanish
Listener59 50 M Florianópolis - SC Masters Degree Sistemas de
Informação English, Spanish
Listener60 20 M Florianópolis - SC Some University -
In progress Matemática English, French

121
Listener63 19 M Tijucas - SC Some University -
In progress
Ciências da
Computação English, Spanish
Listener65 22 M Criciúma - SC Some University -
In progress
Engenharia de
Controle e
Automação
English, Spanish
Listener67 36 M Catanduvas - SC Masters Degree Ciências da
Computação English
Listener69 25 M São Paulo - SP Specialization Engenharia Civil English, Japanese
Listener72 23 F Florianópolis - SC University Degree Administração English, Spanish
Listener74 22 M São José - SC Some University -
In progress Administração English, Spanish, French

122
Appendix D
NSE Profiles
Listener’s
ID Age Gender Birth Place
Level of
Education Course
FA
MIL
IAR
LIS
TE
NE
RS
NListener3 21 M Frederick -
Maryland - USA High School
NListener4 22 M Provo - Utah -
USA
Some University
- In progress
Mechanical
Engineering
NListener5 32 F
West Midlands -
Birmingham -
England
Some University
- In progress Letras
NListener9 50 M
Pawtucket -
Rhode Island -
USA
Some University
- In progress
Project
Management
NListener16 60 F
High Wycombe -
Bucksinghamshire
- UK
Specialization
Life long
learning
teaching
diploma and
blended-
learning
NListener18 48 M
Sydney - New
South Wales -
Australia
Doctoral Degree Literature
NListener23 25 F Santa Ana -
California - USA Masters Degree
Gestão de
Design
NListener28 33 M La Jolla -
California - USA Masters Degree
Computer
Science
NListener42 28 M Bronx - NY - US Other
Computer
Electronics
technician
NListener43 62 M Pretty Good -
London - England Specialization
BA Social
Sciences &
PGCE
NListener47 61 M
Springfield -
Massachusetts -
USA
Doctoral Degree English
Literature
NListener50 18 M London - London
- England
Some University
- In progress History
NListener60 23 M St. Louis -
Missouri - USA
Some University
- In progress Linguistics
NListener69 42 M Denver -
Colorado - USA Doctoral Degree SLA

123
Listeners’
ID Age Gender Birth Place
Level of
Education Course
UN
FA
MIL
IAR
LIS
TE
NE
RS
NListener6 19 F Glens Falls - NY
- USA
Some University
- In progress Radiology
NListener13 21 M Aurora - Illinois -
USA
Some University
- In progress College
NListener21 55 M Chicago - Illinois
- USA
University
Degree
Criminal
Justice,
Sociology
NListener32 61 F
Hobart -
Tasmania -
Australia
Tech School
Graduation
Cabinet
Maker
NListener38 39 M
Perth - Western
Australia -
Australia
Some University
- Incomplete
Information
Technology
NListener39 22 M Chicago - Illinois
- USA
Some University
- In progress Philosophy
NListener49 24 M Johnson City -
Tennessee - USA
University
Degree
Physics and
Spanish
Literature
NListener52 53 F
Middlesex -
London -
England
Specialization Music
NListener53 55 F Haslemere -
Surrey - UK Masters Degree
Psychology
of Education
NListener58 21 M Christchurch -
Canterbury - NZ
Some University
- In progress
Defence
Studies and
German
NListener59 40 F Fairfield -
California - USA Doctoral Degree
English
Linguistics
NListener61 30 F Prescott -
Arizona - USA Post-Doctoral Linguistics
NListener71 47 M London - London
- England
University
Degree English
NListener72 47 F Yonkers - NY -
USA
University
Degree Finance

124
Appendix E
Operationalization of listeners’ answers regarding
their knowledge of BP and Brazilians’ accent in English so as to
split them into 2 groups and analyze the familiarity variable. A
value was assigned to the questions and respective options in
order to obtain the total number (0-10), which was then classified
like this: listeners’ scores ranging from 0 to 6,99 fell into the
unfamiliar category, while listeners’ scores ranging from 7 to 10
were categorized as familiar listeners.
1. Please list the other languages you speak in the order you
have learned them and mark the option that corresponds
to your proficiency level in each language (1,00).
a) Very good = 1
b) Good = 0,66
c) Not so good = 0,33
d) The listener does not speak Portuguese = 0
2. How long have you been studying/speaking Portuguese?
(1,00)
a) less than a month = 0,25
b) 1 to 3 months = 0,50
c) 3 to 6 months = 0,75
d) More than 6 months = 1,00
e) The listener does not speak Portuguese = 0
3. Have you ever been to Brazil?55
55
In this question only one answer was taken into consideration, meaning that
if the listener reported that s/he had lived and visited Brazil, only the value
assigned for option 3.2 was counted. The second option received a higher value
because listeners who lived in Brazil probably had more contact with the
Brazilian accent in comparison to those who only visited Brazil.
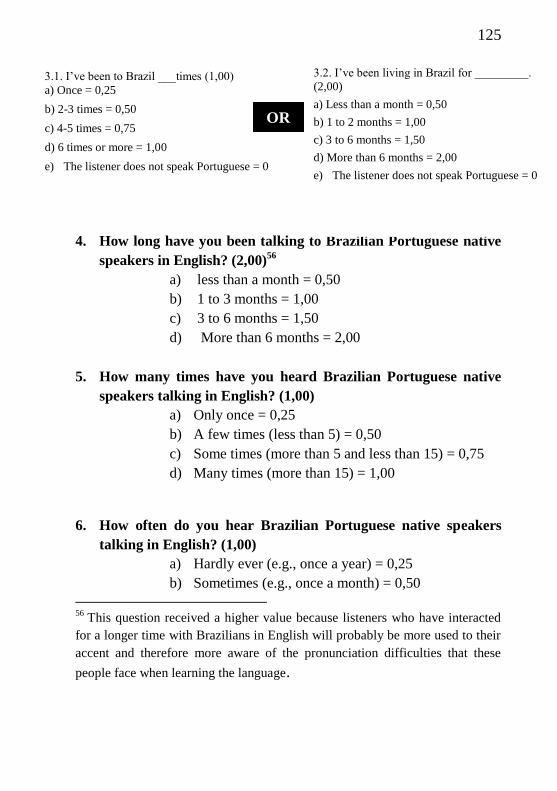
125
4. How long have you been talking to Brazilian Portuguese native
speakers in English? (2,00)56
a) less than a month = 0,50
b) 1 to 3 months = 1,00
c) 3 to 6 months = 1,50
d) More than 6 months = 2,00
5. How many times have you heard Brazilian Portuguese native
speakers talking in English? (1,00)
a) Only once = 0,25
b) A few times (less than 5) = 0,50
c) Some times (more than 5 and less than 15) = 0,75
d) Many times (more than 15) = 1,00
6. How often do you hear Brazilian Portuguese native speakers
talking in English? (1,00)
a) Hardly ever (e.g., once a year) = 0,25
b) Sometimes (e.g., once a month) = 0,50
56
This question received a higher value because listeners who have interacted
for a longer time with Brazilians in English will probably be more used to their
accent and therefore more aware of the pronunciation difficulties that these
people face when learning the language.
3.1. I’ve been to Brazil ___times (1,00)
a) Once = 0,25
b) 2-3 times = 0,50
c) 4-5 times = 0,75
d) 6 times or more = 1,00
e) The listener does not speak Portuguese = 0
3.2. I’ve been living in Brazil for _________.
(2,00)
a) Less than a month = 0,50
b) 1 to 2 months = 1,00
c) 3 to 6 months = 1,50
d) More than 6 months = 2,00
e) The listener does not speak Portuguese = 0
OR
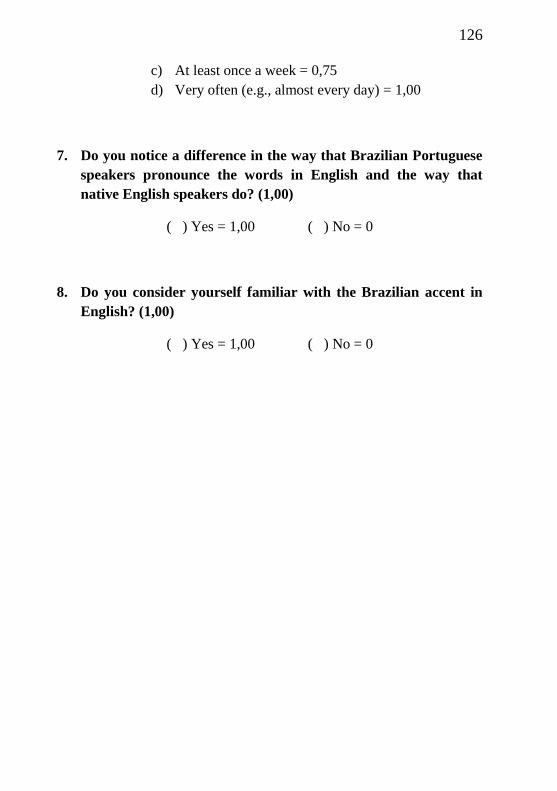
126
c) At least once a week = 0,75
d) Very often (e.g., almost every day) = 1,00
7. Do you notice a difference in the way that Brazilian Portuguese
speakers pronounce the words in English and the way that
native English speakers do? (1,00)
( ) Yes = 1,00 ( ) No = 0
8. Do you consider yourself familiar with the Brazilian accent in
English? (1,00)
( ) Yes = 1,00 ( ) No = 0
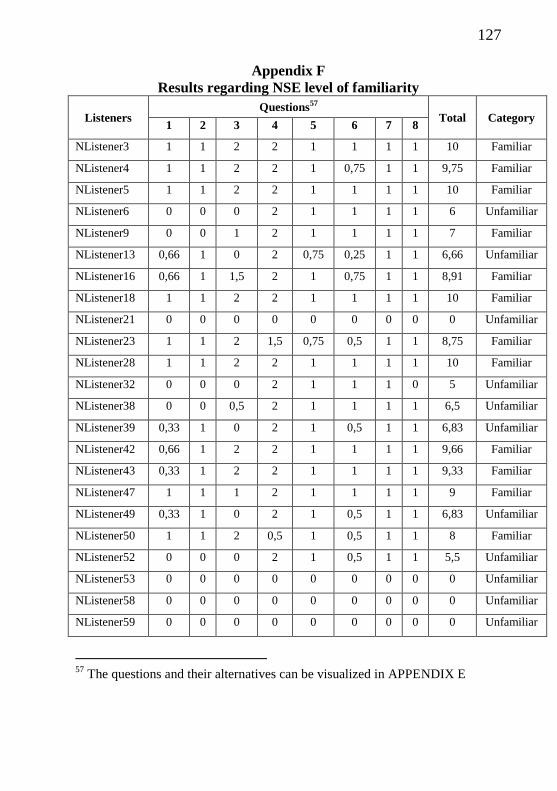
127
Appendix F
Results regarding NSE level of familiarity
Listeners Questions57
Total Category 1 2 3 4 5 6 7 8
NListener3 1 1 2 2 1 1 1 1 10 Familiar
NListener4 1 1 2 2 1 0,75 1 1 9,75 Familiar
NListener5 1 1 2 2 1 1 1 1 10 Familiar
NListener6 0 0 0 2 1 1 1 1 6 Unfamiliar
NListener9 0 0 1 2 1 1 1 1 7 Familiar
NListener13 0,66 1 0 2 0,75 0,25 1 1 6,66 Unfamiliar
NListener16 0,66 1 1,5 2 1 0,75 1 1 8,91 Familiar
NListener18 1 1 2 2 1 1 1 1 10 Familiar
NListener21 0 0 0 0 0 0 0 0 0 Unfamiliar
NListener23 1 1 2 1,5 0,75 0,5 1 1 8,75 Familiar
NListener28 1 1 2 2 1 1 1 1 10 Familiar
NListener32 0 0 0 2 1 1 1 0 5 Unfamiliar
NListener38 0 0 0,5 2 1 1 1 1 6,5 Unfamiliar
NListener39 0,33 1 0 2 1 0,5 1 1 6,83 Unfamiliar
NListener42 0,66 1 2 2 1 1 1 1 9,66 Familiar
NListener43 0,33 1 2 2 1 1 1 1 9,33 Familiar
NListener47 1 1 1 2 1 1 1 1 9 Familiar
NListener49 0,33 1 0 2 1 0,5 1 1 6,83 Unfamiliar
NListener50 1 1 2 0,5 1 0,5 1 1 8 Familiar
NListener52 0 0 0 2 1 0,5 1 1 5,5 Unfamiliar
NListener53 0 0 0 0 0 0 0 0 0 Unfamiliar
NListener58 0 0 0 0 0 0 0 0 0 Unfamiliar
NListener59 0 0 0 0 0 0 0 0 0 Unfamiliar
57
The questions and their alternatives can be visualized in APPENDIX E

128
NListener60 1 1 0,25 2 1 0,75 1 1 8 Familiar
NListener61 0 0 0 2 1 0,75 1 1 5,75 Unfamiliar
NListener69 0,33 1 0,25 2 1 0,75 1 1 8 Familiar
NListener71 0 0 0,25 2 1 1 1 0 5,25 Unfamiliar
NListener72 0 0 0 0 0 0 0 0 0 Unfamiliar

129
Appendix G
Homepage of the website Comprehending L2 Speech, designed for the research, available at
www.comprehendingl2speech.com:

130
Appendix H
Speakers’ Instrument

131

132

133

134

135
Appendix I
PPGI and Extra Instrument

136

137

138

139

140
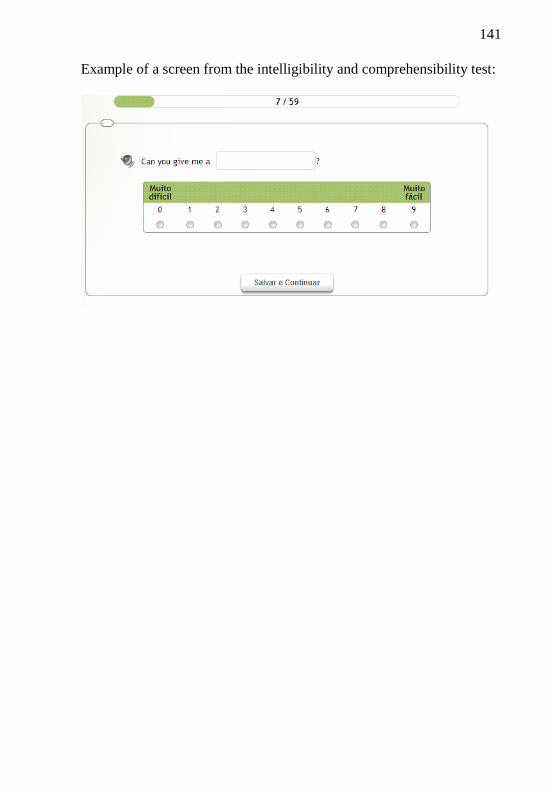
141
Example of a screen from the intelligibility and comprehensibility test:
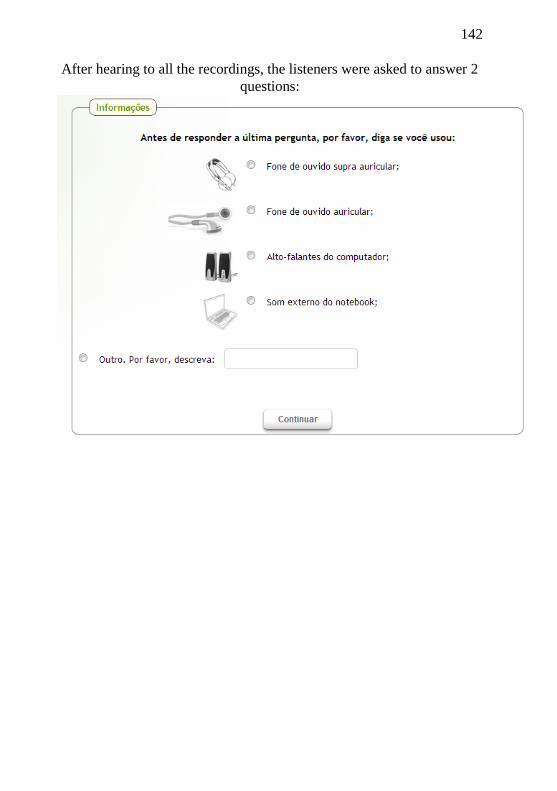
142
After hearing to all the recordings, the listeners were asked to answer 2
questions:

143

144
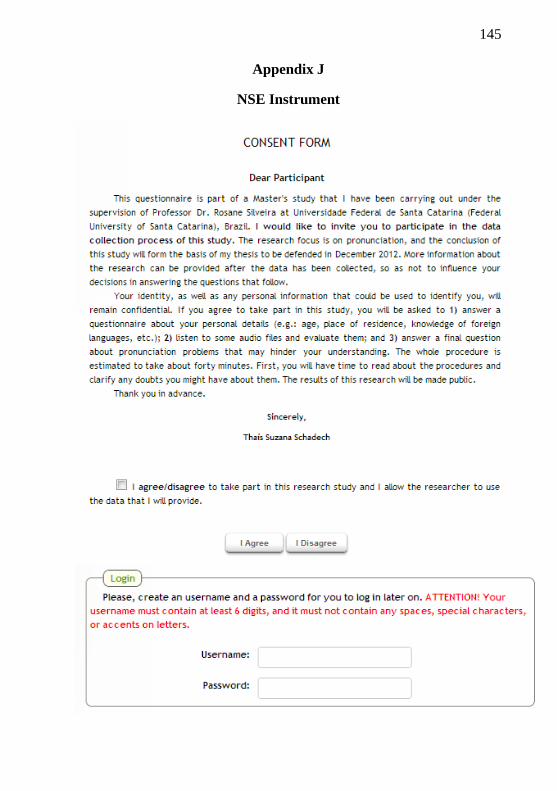
145
Appendix J
NSE Instrument
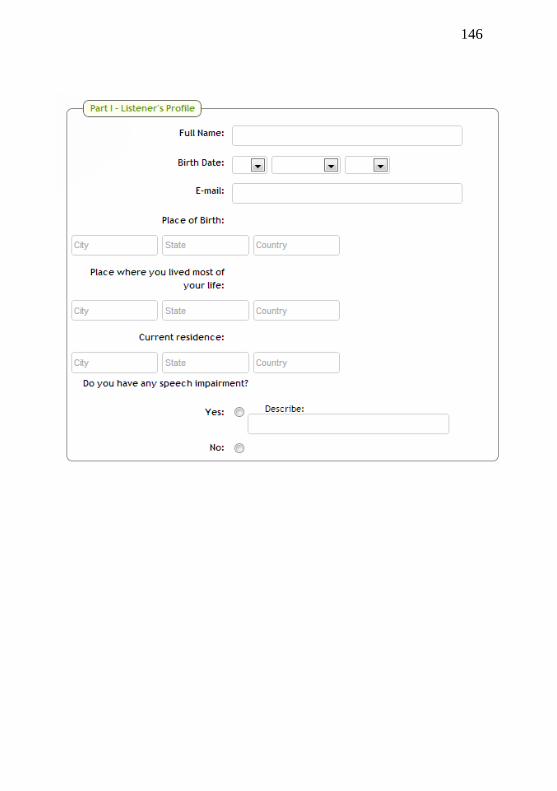
146

147

148

149

150

151
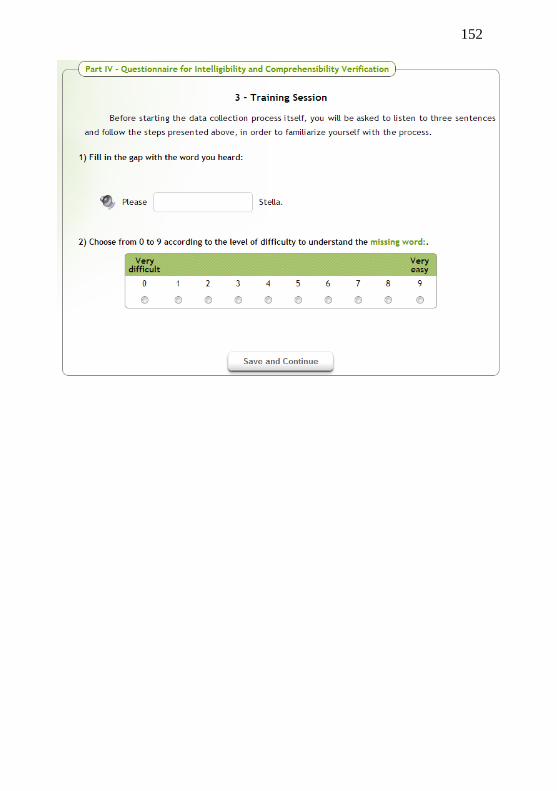
152

153
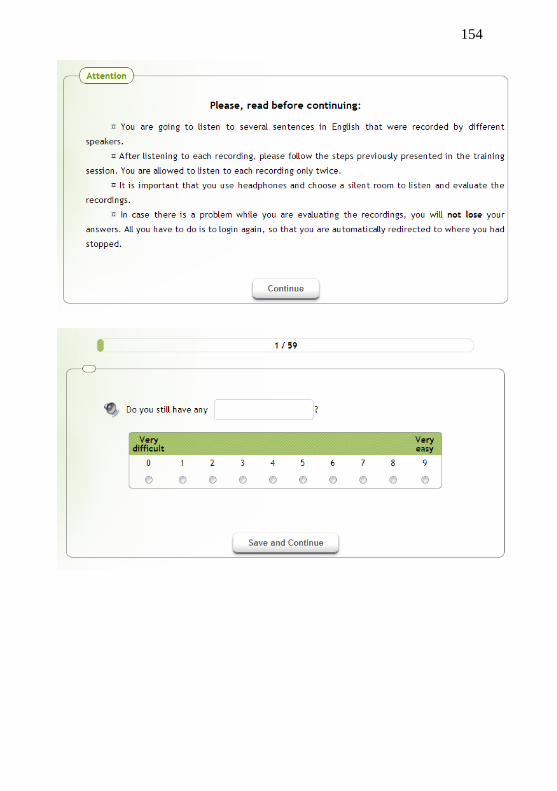
154

155
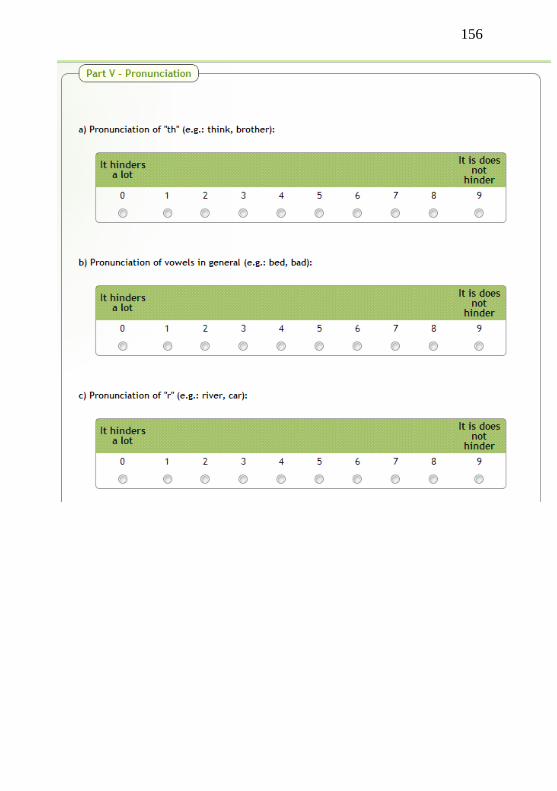
156

157

158

159
Appendix K
Chi-square Results
1) Results reported in Table 4 (p. 11)
a) Recording of ‘ropes’ pronounced as [] by Speaker 39
Chi-Square Tests
Value df
Asymp. Sig. (2-
sided)
Pearson Chi-Square 5,167a 4 ,271
Likelihood Ratio 7,037 4 ,134
Linear-by-Linear Association 2,000 1 ,157
N of Valid Cases 73
a. 3 cells (33,3%) have expected count less than 5. The minimum
expected count is 1,73.
Symmetric Measures
Value Approx. Sig.
Nominal by Nominal Phi ,266 ,271
Cramer's V ,188 ,271
N of Valid Cases 73

160
b) Recording of ‘ropes’ pronounced as [] by Speaker
16
Chi-Square Tests
Value df
Asymp. Sig. (2-
sided)
Pearson Chi-Square ,043a 2 ,979
Likelihood Ratio ,043 2 ,979
Linear-by-Linear Association ,013 1 ,909
N of Valid Cases 73
a. 3 cells (50,0%) have expected count less than 5. The minimum
expected count is ,86.
Symmetric Measures
Value Approx. Sig.
Nominal by Nominal Phi ,024 ,979
Cramer's V ,024 ,979
N of Valid Cases 73
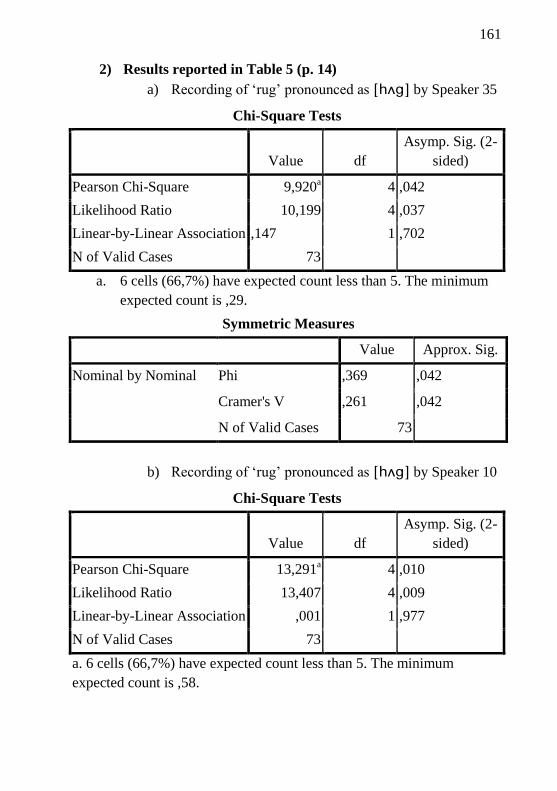
161
2) Results reported in Table 5 (p. 14)
a) Recording of ‘rug’ pronounced as by Speaker 35
Chi-Square Tests
Value df
Asymp. Sig. (2-
sided)
Pearson Chi-Square 9,920a 4 ,042
Likelihood Ratio 10,199 4 ,037
Linear-by-Linear Association ,147 1 ,702
N of Valid Cases 73
a. 6 cells (66,7%) have expected count less than 5. The minimum
expected count is ,29.
Symmetric Measures
Value Approx. Sig.
Nominal by Nominal Phi ,369 ,042
Cramer's V ,261 ,042
N of Valid Cases 73
b) Recording of ‘rug’ pronounced as by Speaker 10
Chi-Square Tests
Value df
Asymp. Sig. (2-
sided)
Pearson Chi-Square 13,291a 4 ,010
Likelihood Ratio 13,407 4 ,009
Linear-by-Linear Association ,001 1 ,977
N of Valid Cases 73
a. 6 cells (66,7%) have expected count less than 5. The minimum
expected count is ,58.

162
Symmetric Measures
Value Approx. Sig.
Nominal by Nominal Phi ,427 ,010
Cramer's V ,302 ,010
N of Valid Cases 73
c) Recording of ‘rug’ pronounced as by Speaker 17
Chi-Square Tests
Value df
Asymp. Sig. (2-
sided)
Pearson Chi-Square 7,747a 4 ,101
Likelihood Ratio 7,801 4 ,099
Linear-by-Linear Association ,001 1 ,970
N of Valid Cases 73
a. 6 cells (66,7%) have expected count less than 5. The minimum
expected count is ,29.

163
Symmetric Measures
Value Approx. Sig.
Nominal by Nominal Phi ,326 ,101
Cramer's V ,230 ,101
N of Valid Cases 73
3) Results reported in Table 6 (p. 16)
a) Recording of ‘rated’ pronounced as by
Speaker 16
Chi-Square Tests
Value df
Asymp. Sig. (2-
sided)
Pearson Chi-Square 2,511a 2 ,285
Likelihood Ratio 2,527 2 ,283
Linear-by-Linear Association ,004 1 ,948
N of Valid Cases 73
a. 3 cells (50,0%) have expected count less than 5. The minimum
expected count is ,29.
Symmetric Measures
Value Approx. Sig.
Nominal by Nominal Phi ,185 ,285
Cramer's V ,185 ,285
N of Valid Cases 73

164
b) Recording of ‘rated’ pronounced as by
Speaker 07
Chi-Square Tests
Value df
Asymp. Sig. (2-
sided)
Pearson Chi-Square 2,511a 2 ,285
Likelihood Ratio 2,527 2 ,283
Linear-by-Linear Association ,004 1 ,948
N of Valid Cases 73
a. 3 cells (50,0%) have expected count less than 5. The minimum
expected count is ,29.
Symmetric Measures
Value Approx. Sig.
Nominal by Nominal Phi ,185 ,285
Cramer's V ,185 ,285
N of Valid Cases 73

165
4) Results reported in Table 7 (p. 18)
a) Recording of ‘rabbits’ pronounced as by
Speaker 16
Chi-Square Tests
Value df
Asymp. Sig.
(2-sided)
Pearson Chi-Square 15,758a 2 ,000
Likelihood Ratio 18,813 2 ,000
Linear-by-Linear
Association 2,037 1 ,154
N of Valid Cases 73
a. 2 cells (33,3%) have expected count less than 5. The minimum
expected count is 4,32.
Symmetric Measures
Value Approx. Sig.
Nominal by Nominal Phi ,465 ,000
Cramer's V ,465 ,000
N of Valid Cases 73
b) Recording of ‘rabbits’ pronounced as by Speaker 07

166
Chi-Square Tests
Value df
Asymp. Sig.
(2-sided)
Pearson Chi-Square 13,068a 4 ,011
Likelihood Ratio 13,226 4 ,010
Linear-by-Linear
Association ,182 1 ,670
N of Valid Cases 73
a. 5 cells (55,6%) have expected count less than 5. The minimum
expected count is ,29.
Symmetric Measures
Value Approx. Sig.
Nominal by Nominal Phi ,423 ,011
Cramer's V ,299 ,011
N of Valid Cases 73

167
Appendix L
Intra-rater reliability with listeners’ rates for the repeated recording of the
word ‘ropes’ per group
1) PPGI listeners’ rates to ‘ropes’ pronounced as []
PPGI Listeners ‘Ropes’ pronounced as []
by Speaker 36 Time 1
‘Ropes’ pronounced as []
by Speaker 36 Time 2
Listener03 9 9
Listener04 8 9
Listener05 8 7
Listener08 8 8
Listener10 9 7
Listener11 9 9
Listener12 9 9
Listener13 4 5
Listener15 1 3
Listener16 7 6
Listener21 2 3
Listener25 9 8
Listener39 7 1
Listener49 9 9
Listener50 8 8
Listener51 9 9
Listener52 4 7
Listener54 5 7
Listener56 6 5
Listener62 8 9
Listener64 7 9
Listener68 7 9
Listener71 9 9
Listener75 7 7
2) Extra listeners’ rates to ‘ropes’ pronounced as []

168
Extra
Listeners
‘Ropes’ pronounced as
[] by Speaker 36
Time 1
‘Ropes’ pronounced as
[] by Speaker 36
Time 2
Listener23 3 2
Listener24 6 4
Listener26 9 9
Listener27 9 9
Listener29 6 8
Listener32 9 9
Listener33 7 5
Listener41 6 3
Listener43 5 4
Listener44 9 9
Listener45 7 7
Listener47 7 8
Listener58 7 7
Listener59 3 5
Listener60 9 8
Listener63 9 9
Listener65 9 8
Listener67 8 8
Listener69 5 6
Listener72 0 2
Listener74 9 9

169
3) NSE listeners’ rates to ‘ropes’ pronounced as []
NSE Listeners ‘Ropes’ pronounced as
[] by Speaker 36 Time 1
‘Ropes’ pronounced as []
by Speaker 36 Time 2
NListener03 1 0
NListener04 7 5
NListener05 8 8
NListener06 7 7
NListener09 6 8
NListener13 8 7
NListener16 5 6
NListener18 7 8
NListener21 2 5
NListener23 6 6
NListener28 6 6
NListener32 9 9
NListener38 6 5
NListener39 0 0
NListener42 8 8
NListener43 6 5
NListener47 9 9
NListener49 8 8
NListener50 0 0
NListener52 6 4
NListener53 9 9
NListener58 7 8
NListener59 7 8
NListener60 7 6
NListener61 6 6
NListener69 7 5
NListener71 2 6
NListener72 8 9
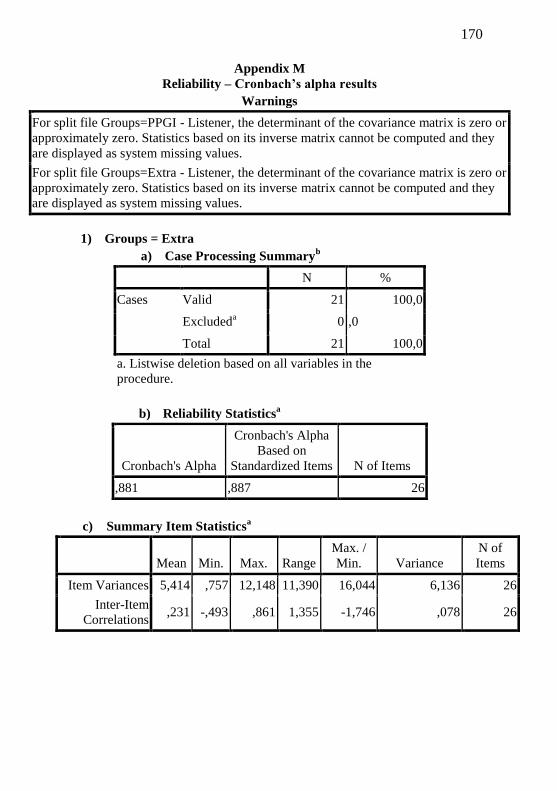
170
Appendix M
Reliability – Cronbach’s alpha results
Warnings
For split file Groups=PPGI - Listener, the determinant of the covariance matrix is zero or
approximately zero. Statistics based on its inverse matrix cannot be computed and they
are displayed as system missing values.
For split file Groups=Extra - Listener, the determinant of the covariance matrix is zero or
approximately zero. Statistics based on its inverse matrix cannot be computed and they
are displayed as system missing values.
1) Groups = Extra
a) Case Processing Summaryb
N %
Cases Valid 21 100,0
Excludeda 0 ,0
Total 21 100,0
a. Listwise deletion based on all variables in the
procedure.
b) Reliability Statisticsa
Cronbach's Alpha
Cronbach's Alpha
Based on
Standardized Items N of Items
,881 ,887 26
c) Summary Item Statisticsa
Mean Min. Max. Range
Max. /
Min. Variance
N of
Items
Item Variances 5,414 ,757 12,148 11,390 16,044 6,136 26
Inter-Item
Correlations ,231 -,493 ,861 1,355 -1,746 ,078 26

171
d) Item-Total Statisticsa
Scale Mean if
Item Deleted
Scale Variance
if Item Deleted
Corrected Item-
Total
Correlation
Squared
Multiple
Correlation
Cronbach's
Alpha if Item
Deleted
Hated1C 171,52 904,062 ,304 . ,880
Hopes1C 175,33 914,833 -,012 . ,890
Hug1C 172,52 910,662 ,086 . ,883
Hopes2C 173,19 852,662 ,426 . ,877
Hug2C 171,81 920,762 -,021 . ,884
Habits1C 173,14 860,529 ,350 . ,879
Hated2C 174,05 861,748 ,373 . ,879
Hopes2_1C 173,33 853,933 ,427 . ,877
Hug3C 172,90 883,690 ,234 . ,882
Habits2C 174,00 861,300 ,390 . ,878
Ropes1C 173,62 814,948 ,652 . ,871
Rug1C 172,95 874,748 ,257 . ,882
Rabbits1C 172,38 854,648 ,481 . ,876
Rug2C 173,86 797,429 ,654 . ,870
Rated1C 174,57 852,257 ,277 . ,884
Rabbits2C 172,48 829,062 ,622 . ,872
Rug3C 172,57 816,757 ,779 . ,868
Rated2C 172,90 847,590 ,400 . ,878
Rated3C 172,43 822,357 ,715 . ,870
Rabbits3C 172,14 863,529 ,547 . ,875
Rug4C 173,10 813,690 ,772 . ,868
Ropes2C 172,48 843,162 ,697 . ,872
Ropes3C 174,05 853,248 ,529 . ,875
Rabbits1_2C 171,76 877,290 ,500 . ,877
Rated4C 172,71 822,314 ,699 . ,870
Ropes4C 173,00 831,500 ,604 . ,873

172
e) Intraclass Correlation Coefficientd
Intraclass
Correlationa
95% Confidence
Interval F Test with True Value 0
Lower
Bound
Upper
Bound Value df1 df2 Sig
Single Measures ,222b ,129 ,391 8,403 20 500 ,000
Average
Measures ,881
c ,793 ,943 8,403 20 500 ,000
Two-way mixed effects model where people effects are random and measures
effects are fixed.
a. Type C intraclass correlation coefficients using a consistency definition-the between-
measure variance is excluded from the denominator variance.
b. The estimator is the same, whether the interaction effect is present or not.
c. This estimate is computed assuming the interaction effect is absent, because it is not
estimable otherwise.
1) Group = PPGI
a) Case Processing Summaryb
N %
Cases Valid 24 100,0
Excludeda 0 ,0
Total 24 100,0
a. Listwise deletion based on all variables in the
procedure.
b) Reliability Statisticsa
Cronbach's Alpha
Cronbach's Alpha
Based on
Standardized Items N of Items
,880 ,888 26
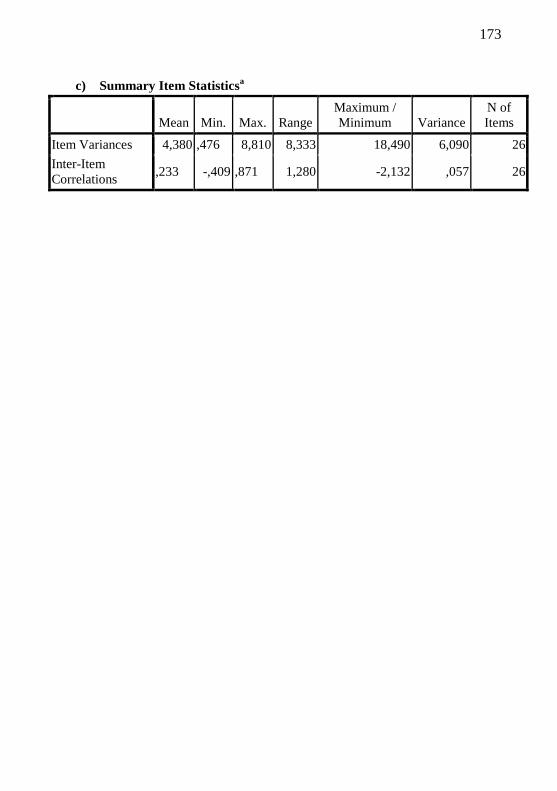
173
c) Summary Item Statisticsa
Mean Min. Max. Range
Maximum /
Minimum Variance
N of
Items
Item Variances 4,380 ,476 8,810 8,333 18,490 6,090 26
Inter-Item
Correlations ,233 -,409 ,871 1,280 -2,132 ,057 26
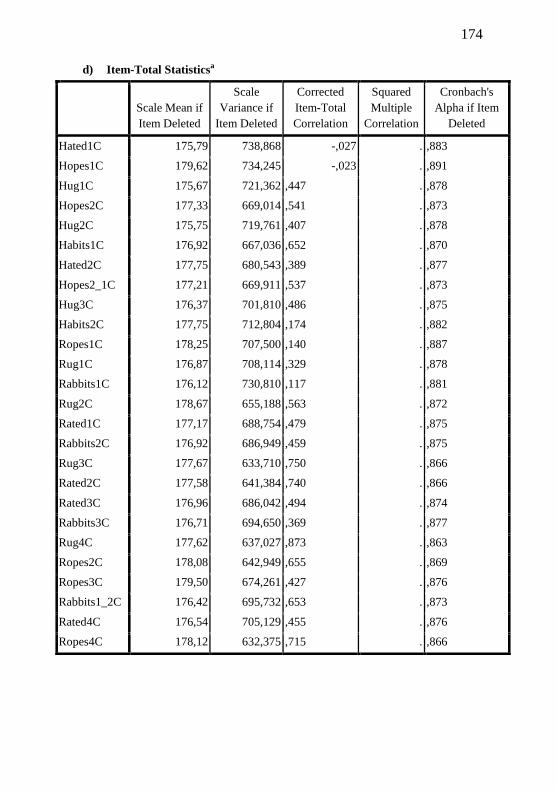
174
d) Item-Total Statisticsa
Scale Mean if
Item Deleted
Scale
Variance if
Item Deleted
Corrected
Item-Total
Correlation
Squared
Multiple
Correlation
Cronbach's
Alpha if Item
Deleted
Hated1C 175,79 738,868 -,027 . ,883
Hopes1C 179,62 734,245 -,023 . ,891
Hug1C 175,67 721,362 ,447 . ,878
Hopes2C 177,33 669,014 ,541 . ,873
Hug2C 175,75 719,761 ,407 . ,878
Habits1C 176,92 667,036 ,652 . ,870
Hated2C 177,75 680,543 ,389 . ,877
Hopes2_1C 177,21 669,911 ,537 . ,873
Hug3C 176,37 701,810 ,486 . ,875
Habits2C 177,75 712,804 ,174 . ,882
Ropes1C 178,25 707,500 ,140 . ,887
Rug1C 176,87 708,114 ,329 . ,878
Rabbits1C 176,12 730,810 ,117 . ,881
Rug2C 178,67 655,188 ,563 . ,872
Rated1C 177,17 688,754 ,479 . ,875
Rabbits2C 176,92 686,949 ,459 . ,875
Rug3C 177,67 633,710 ,750 . ,866
Rated2C 177,58 641,384 ,740 . ,866
Rated3C 176,96 686,042 ,494 . ,874
Rabbits3C 176,71 694,650 ,369 . ,877
Rug4C 177,62 637,027 ,873 . ,863
Ropes2C 178,08 642,949 ,655 . ,869
Ropes3C 179,50 674,261 ,427 . ,876
Rabbits1_2C 176,42 695,732 ,653 . ,873
Rated4C 176,54 705,129 ,455 . ,876
Ropes4C 178,12 632,375 ,715 . ,866

175
e) Intraclass Correlation Coefficientd
Intraclass
Correlationa
95% Confidence
Interval F Test with True Value 0
Lower
Bound Upper Bound Value df1 df2 Sig
Single Measures ,219b ,132 ,373 8,306 23 575 ,000
Average Measures ,880c ,798 ,939 8,306 23 575 ,000
Two-way mixed effects model where people effects are random and measures
effects are fixed.
a. Type C intraclass correlation coefficients using a consistency definition-the between-
measure variance is excluded from the denominator variance.
b. The estimator is the same, whether the interaction effect is present or not.
c. This estimate is computed assuming the interaction effect is absent, because it is not
estimable otherwise.
2) NSE Group
a) Case Processing Summaryb
N %
Cases Valid 28 100,0
Excludeda 0 ,0
Total 28 100,0
a. Listwise deletion based on all variables in the
procedure.
b) Reliability Statisticsa
Cronbach's Alpha
Cronbach's
Alpha Based on
Standardized
Items N of Items
,921 ,931 26
c) Summary Item Statisticsa
Mean Minimum Maximum Range
Maximum /
Minimum Variance
N of
Items
Item Variances 3,246 ,935 8,258 7,323 8,830 5,059 26
Inter-Item
Correlations ,342 -,128 ,862 ,990 -6,720 ,032 26

176
d) Item-Total Statisticsa
Scale Mean
if Item
Deleted
Scale Variance if
Item Deleted
Corrected
Item-Total
Correlation
Squared
Multiple
Correlation
Cronbach's
Alpha if
Item
Deleted
Hated1C 178,11 697,210 ,477 ,985 ,919
Hopes1C 181,14 643,757 ,597 ,922 ,918
Hug1C 178,39 675,210 ,513 ,989 ,919
Hopes2C 179,71 647,249 ,636 ,990 ,917
Hug2C 177,54 703,443 ,535 ,983 ,919
Habits1C 180,14 669,831 ,604 ,991 ,917
Hated2C 179,29 655,323 ,721 ,995 ,915
Hopes2_1C 179,61 661,877 ,523 ,989 ,919
Hug3C 178,71 664,878 ,738 ,965 ,915
Habits2C 181,18 654,226 ,518 ,989 ,920
Ropes1C 177,54 704,480 ,550 ,997 ,919
Rug1C 177,79 701,656 ,583 ,977 ,918
Rabbits1C 177,54 711,517 ,373 ,979 ,921
Rug2C 179,21 658,989 ,629 ,957 ,917
Rated1C 178,21 685,582 ,567 ,930 ,918
Rabbits2C 177,86 703,164 ,561 ,990 ,919
Rug3C 177,82 698,152 ,634 ,957 ,918
Rated2C 177,36 689,423 ,645 ,987 ,917
Rated3C 177,64 709,571 ,451 ,894 ,920
Rabbits3C 177,39 723,433 ,215 ,982 ,922
Rug4C 178,61 684,618 ,697 ,980 ,916
Ropes2C 178,07 703,328 ,482 ,956 ,919
Ropes3C 180,36 660,905 ,687 ,992 ,915
Rabbits1_2C 177,86 702,720 ,445 ,991 ,920
Rated4C 177,46 706,406 ,608 ,973 ,919
Ropes4C 178,32 693,411 ,484 ,959 ,919
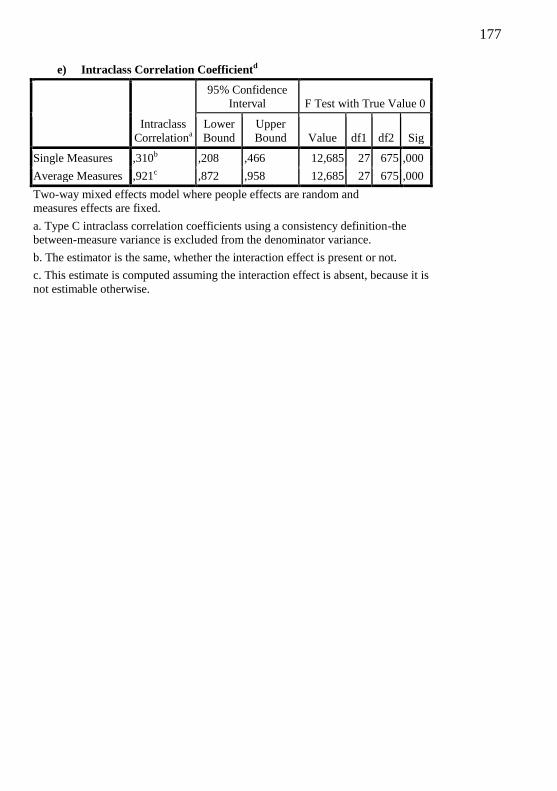
177
e) Intraclass Correlation Coefficientd
Intraclass
Correlationa
95% Confidence
Interval F Test with True Value 0
Lower
Bound
Upper
Bound Value df1 df2 Sig
Single Measures ,310b ,208 ,466 12,685 27 675 ,000
Average Measures ,921c ,872 ,958 12,685 27 675 ,000
Two-way mixed effects model where people effects are random and
measures effects are fixed.
a. Type C intraclass correlation coefficients using a consistency definition-the
between-measure variance is excluded from the denominator variance.
b. The estimator is the same, whether the interaction effect is present or not.
c. This estimate is computed assuming the interaction effect is absent, because it is
not estimable otherwise.
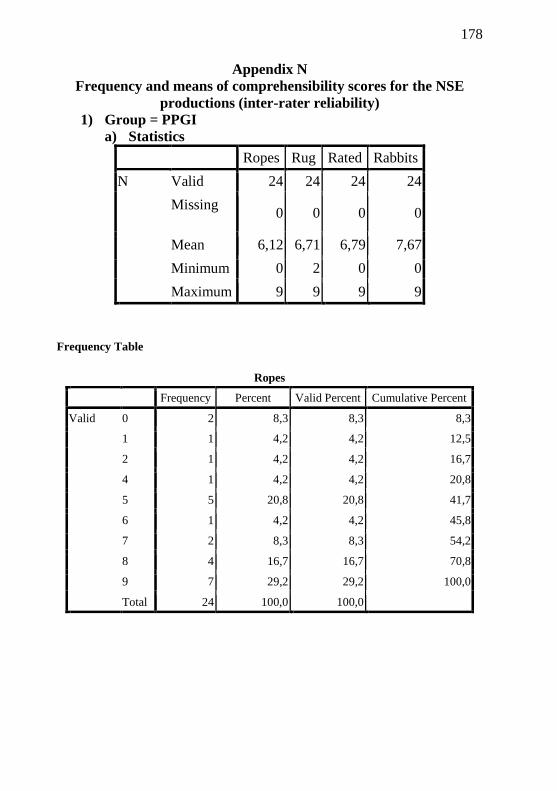
178
Appendix N
Frequency and means of comprehensibility scores for the NSE
productions (inter-rater reliability)
1) Group = PPGI
a) Statistics
Ropes Rug Rated Rabbits
N Valid 24 24 24 24
Missing 0 0 0 0
Mean 6,12 6,71 6,79 7,67
Minimum 0 2 0 0
Maximum 9 9 9 9
Frequency Table
Ropes
Frequency Percent Valid Percent Cumulative Percent
Valid 0 2 8,3 8,3 8,3
1 1 4,2 4,2 12,5
2 1 4,2 4,2 16,7
4 1 4,2 4,2 20,8
5 5 20,8 20,8 41,7
6 1 4,2 4,2 45,8
7 2 8,3 8,3 54,2
8 4 16,7 16,7 70,8
9 7 29,2 29,2 100,0
Total 24 100,0 100,0
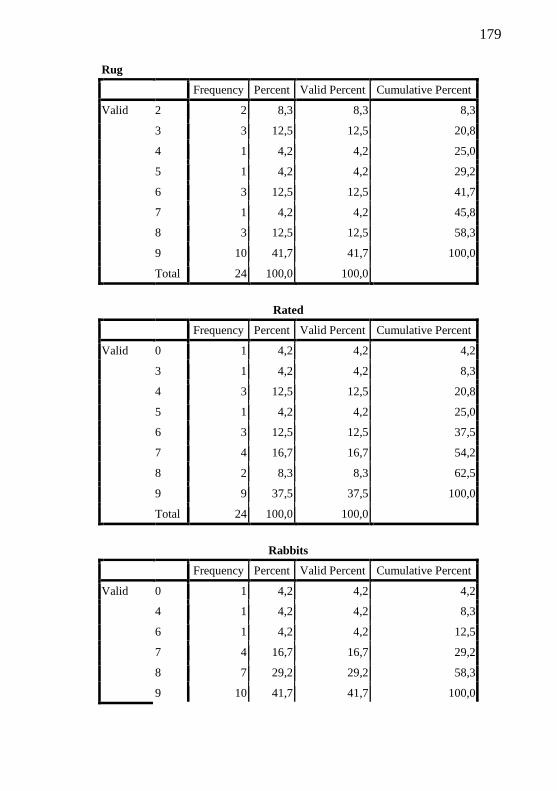
179
Rug
Frequency Percent Valid Percent Cumulative Percent
Valid 2 2 8,3 8,3 8,3
3 3 12,5 12,5 20,8
4 1 4,2 4,2 25,0
5 1 4,2 4,2 29,2
6 3 12,5 12,5 41,7
7 1 4,2 4,2 45,8
8 3 12,5 12,5 58,3
9 10 41,7 41,7 100,0
Total 24 100,0 100,0
Rated
Frequency Percent Valid Percent Cumulative Percent
Valid 0 1 4,2 4,2 4,2
3 1 4,2 4,2 8,3
4 3 12,5 12,5 20,8
5 1 4,2 4,2 25,0
6 3 12,5 12,5 37,5
7 4 16,7 16,7 54,2
8 2 8,3 8,3 62,5
9 9 37,5 37,5 100,0
Total 24 100,0 100,0
Rabbits
Frequency Percent Valid Percent Cumulative Percent
Valid 0 1 4,2 4,2 4,2
4 1 4,2 4,2 8,3
6 1 4,2 4,2 12,5
7 4 16,7 16,7 29,2
8 7 29,2 29,2 58,3
9 10 41,7 41,7 100,0

180
Rug
Frequency Percent Valid Percent Cumulative Percent
Valid 2 2 8,3 8,3 8,3
3 3 12,5 12,5 20,8
4 1 4,2 4,2 25,0
5 1 4,2 4,2 29,2
6 3 12,5 12,5 41,7
7 1 4,2 4,2 45,8
8 3 12,5 12,5 58,3
9 10 41,7 41,7 100,0
Total 24 100,0 100,0
a) Bar Charts

181

182
2) Group = Extra
a) Statistics
Ropes1C Rug3C Rated2C Rabbits3C
N Valid 21 21 21 21
Missing 0 0 0 0
Mean 6,33 7,38 7,05 7,81
Minimum 0 2 0 2
Maximum 9 9 9 9
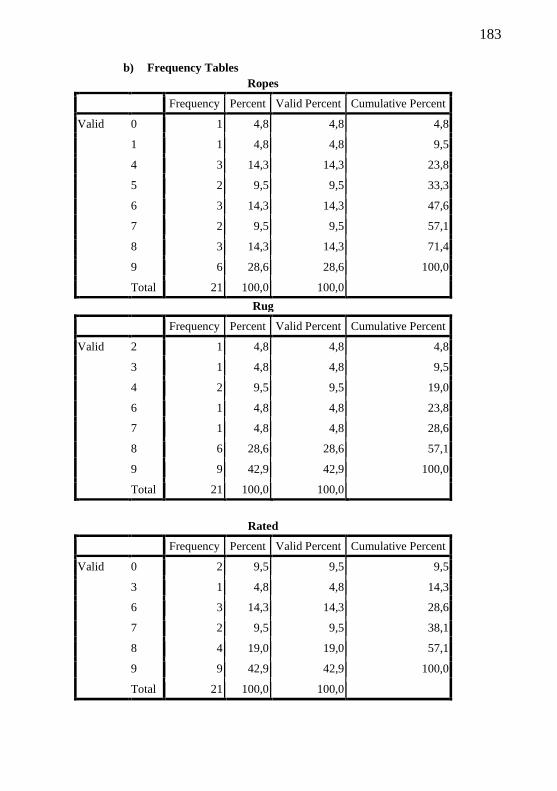
183
b) Frequency Tables
Ropes
Frequency Percent Valid Percent Cumulative Percent
Valid 0 1 4,8 4,8 4,8
1 1 4,8 4,8 9,5
4 3 14,3 14,3 23,8
5 2 9,5 9,5 33,3
6 3 14,3 14,3 47,6
7 2 9,5 9,5 57,1
8 3 14,3 14,3 71,4
9 6 28,6 28,6 100,0
Total 21 100,0 100,0
Rug
Frequency Percent Valid Percent Cumulative Percent
Valid 2 1 4,8 4,8 4,8
3 1 4,8 4,8 9,5
4 2 9,5 9,5 19,0
6 1 4,8 4,8 23,8
7 1 4,8 4,8 28,6
8 6 28,6 28,6 57,1
9 9 42,9 42,9 100,0
Total 21 100,0 100,0
Rated
Frequency Percent Valid Percent Cumulative Percent
Valid 0 2 9,5 9,5 9,5
3 1 4,8 4,8 14,3
6 3 14,3 14,3 28,6
7 2 9,5 9,5 38,1
8 4 19,0 19,0 57,1
9 9 42,9 42,9 100,0
Total 21 100,0 100,0

184
Ropes
Frequency Percent Valid Percent Cumulative Percent
Valid 0 1 4,8 4,8 4,8
1 1 4,8 4,8 9,5
4 3 14,3 14,3 23,8
5 2 9,5 9,5 33,3
6 3 14,3 14,3 47,6
7 2 9,5 9,5 57,1
8 3 14,3 14,3 71,4
9 6 28,6 28,6 100,0
Rabbits
Frequency Percent Valid Percent Cumulative Percent
Valid 2 1 4,8 4,8 4,8
6 3 14,3 14,3 19,0
7 1 4,8 4,8 23,8
8 7 33,3 33,3 57,1
9 9 42,9 42,9 100,0
Total 21 100,0 100,0
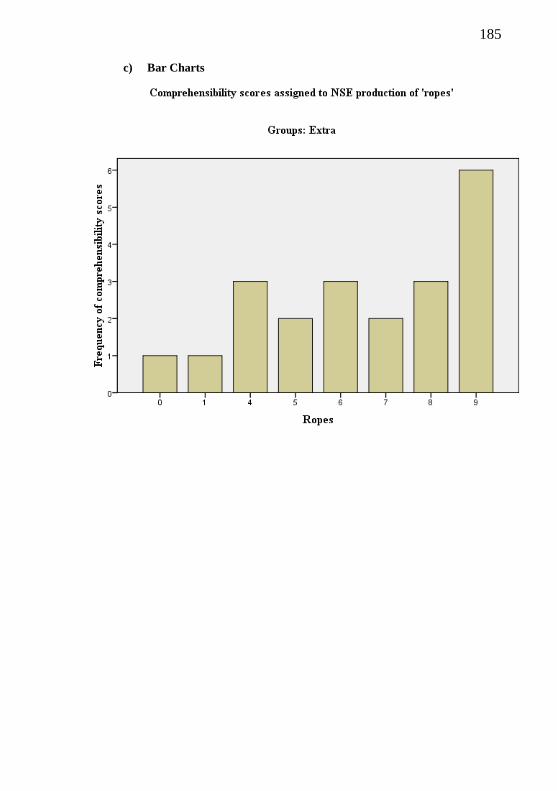
185
c) Bar Charts

186

187
3) Group = NSE
a) Statistics
Ropes1C Rug3C Rated2C Rabbits3C
N Valid 28 28 28 28
Missing 0 0 0 0
Mean 8,18 7,89 8,36 8,32
Minimum 5 6 3 5
Maximum 9 9 9 9

188
b) Frequency Tables
Ropes
Frequency Percent Valid Percent Cumulative Percent
Valid 5 1 3,6 3,6 3,6
6 2 7,1 7,1 10,7
7 3 10,7 10,7 21,4
8 7 25,0 25,0 46,4
9 15 53,6 53,6 100,0
Total 28 100,0 100,0
Rug
Frequency Percent Valid Percent Cumulative Percent
Valid 6 5 17,9 17,9 17,9
7 5 17,9 17,9 35,7
8 6 21,4 21,4 57,1
9 12 42,9 42,9 100,0
Total 28 100,0 100,0
Rated
Frequency Percent Valid Percent
Cumulative
Percent
Valid 3 1 3,6 3,6 3,6
5 1 3,6 3,6 7,1
7 2 7,1 7,1 14,3
8 4 14,3 14,3 28,6
9 20 71,4 71,4 100,0
Total 28 100,0 100,0
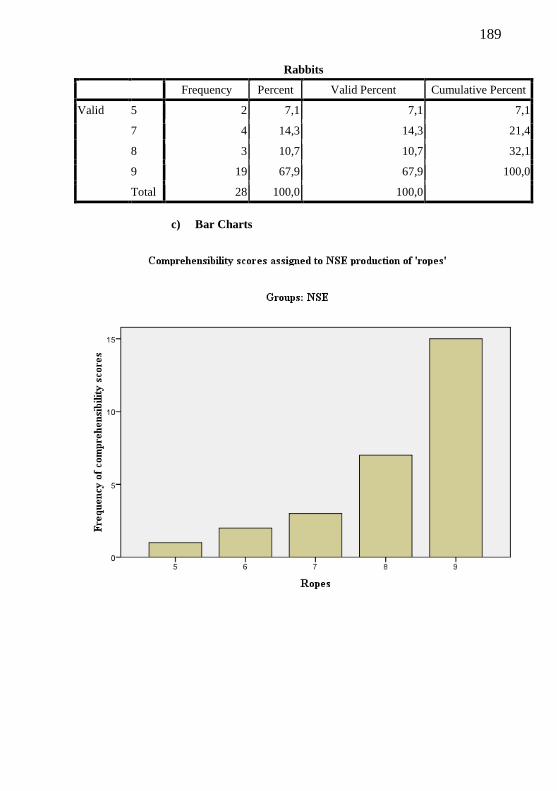
189
Rabbits
Frequency Percent Valid Percent Cumulative Percent
Valid 5 2 7,1 7,1 7,1
7 4 14,3 14,3 21,4
8 3 10,7 10,7 32,1
9 19 67,9 67,9 100,0
Total 28 100,0 100,0
c) Bar Charts

190

191

192
Appendix O
Descriptive Statistics
1) Group = PPGI N Range Minimum Maximum Mean
Std.
Deviation Variance Skewness Kurtosis
Statistic Statistic Statistic Statistic Statistic Statistic Statistic Statistic
Std.
Error Statistic
Std.
Error
Compr. Total Mean for Non-target
productions 24 4,54 4,33 8,88 7,3524 1,08702 1,182 -,971 ,472 1,190 ,918
Compr. Total Mean for Target
productions 24 4,69 4,12 8,81 6,9245 1,32197 1,748 -,513 ,472 -,708 ,918
Valid N (listwise) 24
2) Group = Extra N Range Minimum Maximum Mean
Std.
Deviation Variance Skewness Kurtosis
Statistic Statistic Statistic Statistic Statistic Statistic Statistic Statistic
Std.
Error Statistic
Std.
Error
Compr. Total Mean for Non-target
productions 21 5,04 3,67 8,71 6,7718 1,30495 1,703 -,676 ,501 ,124 ,972
Compr. Total Mean for Target
productions 21 6,25 2,75 9,00 7,0149 1,59882 2,556 -1,286 ,501 1,700 ,972
Valid N (listwise) 21

193
3) Group = NSE N Range Minimum Maximum Mean
Std.
Deviation Variance Skewness Kurtosis
Statistic Statistic Statistic Statistic Statistic Statistic Statistic Statistic
Std.
Error Statistic
Std.
Error
compr. Total Mean for Non-target
productions 28 6,04 2,46 8,50 6,2827 1,56661 2,454 -,759 ,441 -,143 ,858
compr. Total Mean for Target
productions 28 3,25 5,56 8,81 7,6496 ,93917 ,882 -1,001 ,441 ,286 ,858
Valid N (listwise) 28
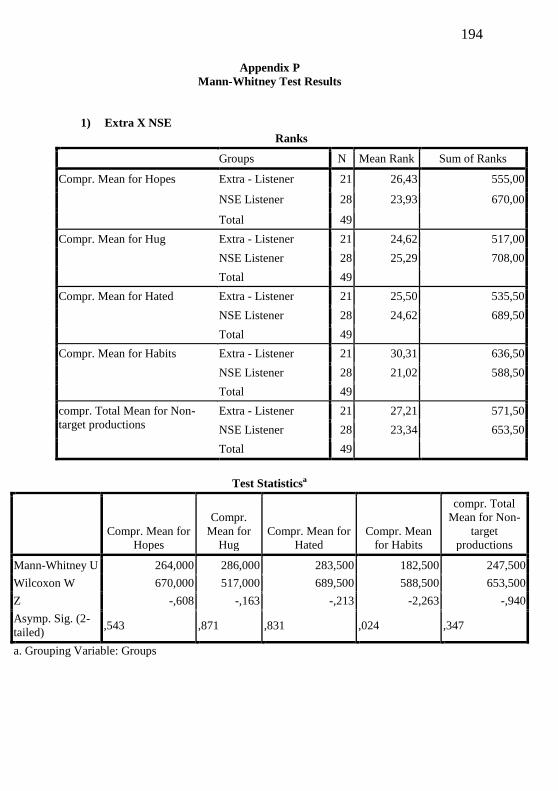
194
Appendix P
Mann-Whitney Test Results
1) Extra X NSE
Ranks
Groups N Mean Rank Sum of Ranks
Compr. Mean for Hopes Extra - Listener 21 26,43 555,00
NSE Listener 28 23,93 670,00
Total 49
Compr. Mean for Hug Extra - Listener 21 24,62 517,00
NSE Listener 28 25,29 708,00
Total 49
Compr. Mean for Hated Extra - Listener 21 25,50 535,50
NSE Listener 28 24,62 689,50
Total 49
Compr. Mean for Habits Extra - Listener 21 30,31 636,50
NSE Listener 28 21,02 588,50
Total 49
compr. Total Mean for Non-
target productions
Extra - Listener 21 27,21 571,50
NSE Listener 28 23,34 653,50
Total 49
Test Statisticsa
Compr. Mean for
Hopes
Compr.
Mean for
Hug
Compr. Mean for
Hated
Compr. Mean
for Habits
compr. Total
Mean for Non-
target
productions
Mann-Whitney U 264,000 286,000 283,500 182,500 247,500
Wilcoxon W 670,000 517,000 689,500 588,500 653,500
Z -,608 -,163 -,213 -2,263 -,940
Asymp. Sig. (2-
tailed) ,543 ,871 ,831 ,024 ,347
a. Grouping Variable: Groups
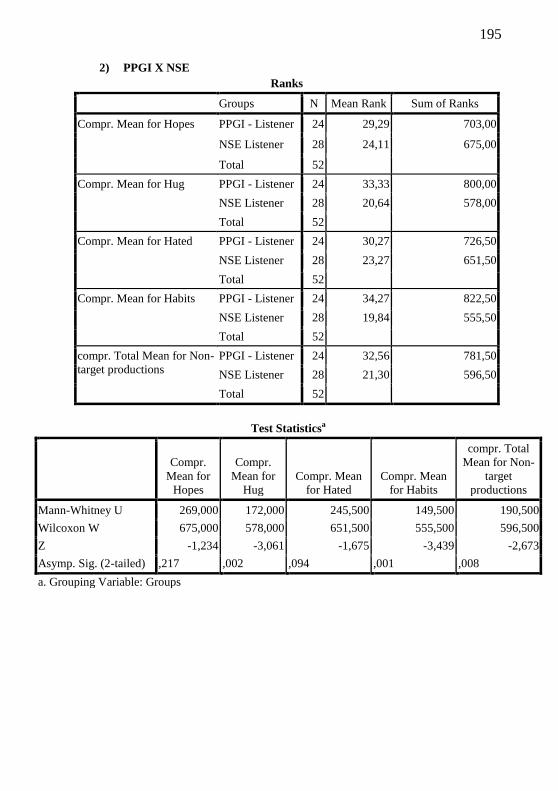
195
2) PPGI X NSE
Ranks
Groups N Mean Rank Sum of Ranks
Compr. Mean for Hopes PPGI - Listener 24 29,29 703,00
NSE Listener 28 24,11 675,00
Total 52
Compr. Mean for Hug PPGI - Listener 24 33,33 800,00
NSE Listener 28 20,64 578,00
Total 52
Compr. Mean for Hated PPGI - Listener 24 30,27 726,50
NSE Listener 28 23,27 651,50
Total 52
Compr. Mean for Habits PPGI - Listener 24 34,27 822,50
NSE Listener 28 19,84 555,50
Total 52
compr. Total Mean for Non-
target productions
PPGI - Listener 24 32,56 781,50
NSE Listener 28 21,30 596,50
Total 52
Test Statisticsa
Compr.
Mean for
Hopes
Compr.
Mean for
Hug
Compr. Mean
for Hated
Compr. Mean
for Habits
compr. Total
Mean for Non-
target
productions
Mann-Whitney U 269,000 172,000 245,500 149,500 190,500
Wilcoxon W 675,000 578,000 651,500 555,500 596,500
Z -1,234 -3,061 -1,675 -3,439 -2,673
Asymp. Sig. (2-tailed) ,217 ,002 ,094 ,001 ,008
a. Grouping Variable: Groups

196
3) PPGI X Extra
Ranks
Groups N Mean Rank Sum of Ranks
Compr. Mean for Hopes PPGI - Listener 24 23,98 575,50
Extra - Listener 21 21,88 459,50
Total 45
Compr. Mean for Hug PPGI - Listener 24 28,33 680,00
Extra - Listener 21 16,90 355,00
Total 45
Compr. Mean for Hated PPGI - Listener 24 25,44 610,50
Extra - Listener 21 20,21 424,50
Total 45
Compr. Mean for Habits PPGI - Listener 24 25,17 604,00
Extra - Listener 21 20,52 431,00
Total 45
compr. Total Mean for Non-
target productions
PPGI - Listener 24 25,67 616,00
Extra - Listener 21 19,95 419,00
Total 45
Test Statisticsa
Compr.
Mean for
Hopes
Compr.
Mean for
Hug
Compr. Mean
for Hated
Compr. Mean
for Habits
compr. Total
Mean for Non-
target
productions
Mann-Whitney U 228,500 124,000 193,500 200,000 188,000
Wilcoxon W 459,500 355,000 424,500 431,000 419,000
Z -,536 -2,962 -1,345 -1,194 -1,457
Asymp. Sig. (2-
tailed) ,592 ,003 ,178 ,232 ,145
a. Grouping Variable: Groups

197
Appendix Q
Chi-Square Results – NSE familiarity
1) ‘ropes’ pronounced as []
a) ‘ropes’ pronounced as [] by Speaker 39
Chi-Square Tests
Value df
Asymp. Sig. (2-
sided)
Pearson Chi-Square 4,800a 2 ,091
Likelihood Ratio 6,086 2 ,048
Linear-by-Linear Association 4,418 1 ,036
N of Valid Cases 28
a. 4 cells (66,7%) have expected count less than 5. The minimum expected
count is 1,50.
Symmetric Measures
Value Approx. Sig.
Nominal by Nominal Phi ,414 ,091
Cramer's V ,414 ,091
N of Valid Cases 28
b) ‘ropes’ pronounced as [] by Speaker 16
Chi-Square Tests
Value df
Asymp. Sig.
(2-sided)
Exact Sig.
(2-sided) Exact Sig. (1-sided)
Pearson Chi-Square 1,037a 1 ,309
Continuity Correctionb ,000 1 1,000
Likelihood Ratio 1,423 1 ,233
Fisher's Exact Test 1,000 ,500
Linear-by-Linear
Association 1,000 1 ,317
N of Valid Cases 28
a. 2 cells (50,0%) have expected count less than 5. The minimum expected count is ,50.
b. Computed only for a 2x2 table

198
Symmetric Measures
Val
ue Approx. Sig.
Nominal by Nominal Phi -
,19
2
,309
Cramer's V ,19
2 ,309
N of Valid Cases 28
2) ‘rug’ pronounced as a) ‘rug’ pronounced as by Speaker 35
Chi-Square Tests
Value df
Asymp. Sig.
(2-sided)
Exact Sig.
(2-sided)
Exact Sig. (1-
sided)
Pearson Chi-Square 1,037a 1 ,309
Continuity Correctionb ,000 1 1,000
Likelihood Ratio 1,423 1 ,233
Fisher's Exact Test 1,000 ,500
Linear-by-Linear
Association 1,000 1 ,317
N of Valid Cases 28
a. 2 cells (50,0%) have expected count less than 5. The minimum expected count is ,50.
b. Computed only for a 2x2 table
Symmetric Measures
Value Approx. Sig.
Nominal by Nominal Phi -,192 ,309
Cramer's V ,192 ,309
N of Valid Cases 28

199
b) ‘rug’ pronounced as by Speaker 10
Chi-Square Tests
Value
Pearson Chi-Square .a
N of Valid Cases 28
a. No statistics are computed because
Hug2 is a constant.
Symmetric Measures
Value
Nominal by Nominal Phi .a
N of Valid Cases 28
a. No statistics are computed because Hug2 is a constant.
c) ‘rug’ pronounced as by Speaker 17
Chi-Square Tests
Value
Pearson Chi-Square .a
N of Valid Cases 28
a. No statistics are computed because
Hug3 is a constant.
Symmetric Measures
Value
Nominal by Nominal Phi .a
N of Valid Cases 28
a. No statistics are computed because Hug3 is a constant.

200
3) ‘rated’ pronounced as a) ‘rated’ pronounced as by Speaker 16
Chi-Square Tests
Value
Pearson Chi-Square .a
N of Valid Cases 28
a. No statistics are computed because
Hated1 is a constant.
Symmetric Measures
Value
Nominal by Nominal Phi .a
N of Valid Cases 28
a. No statistics are computed because Hated1 is a constant.
b) ‘rated’ pronounced as by Speaker 07
Chi-Square Tests
Value
Pearson Chi-Square .a
N of Valid Cases 28
a. No statistics are computed because
Hated2 is a constant.
Symmetric Measures
Value
Nominal by Nominal Phi .a
N of Valid Cases 28
a. No statistics are computed because Hated2 is a constant.

201
4) ‘rabbits’ pronounced as a) ‘rabbits’ pronounced as by Speaker 16
Chi-Square Tests
Value df
Asymp. Sig. (2-
sided)
Exact Sig.
(2-sided)
Exact Sig. (1-
sided)
Pearson Chi-Square ,243a 1 ,622
Continuity Correctionb ,000 1 1,000
Likelihood Ratio ,245 1 ,621
Fisher's Exact Test 1,000 ,500
Linear-by-Linear
Association ,235 1 ,628
N of Valid Cases 28
a. 2 cells (50,0%) have expected count less than 5. The minimum expected count is 2,50.
b. Computed only for a 2x2 table
Symmetric Measures
Value Approx. Sig.
Nominal by Nominal Phi -,093 ,622
Cramer's V ,093 ,622
N of Valid Cases 28
b) ‘rabbits’ pronounced as by Speaker 07
Chi-Square Tests
Value df
Asymp. Sig. (2-
sided)
Pearson Chi-Square 2,043a 2 ,360
Likelihood Ratio 2,476 2 ,290
Linear-by-Linear Association 1,855 1 ,173
N of Valid Cases 28
a. 4 cells (66,7%) have expected count less than 5. The minimum expected
count is ,50.

202
Symmetric Measures
Value Approx. Sig.
Nominal by Nominal Phi ,270 ,360
Cramer's V ,270 ,360
N of Valid Cases 28