Embed Size (px)
Citation preview

Um
inho
| 2
013
Cat
herin
e Fe
rrei
raT
hio
l-dis
ulp
hid
e o
xid
ore
du
cta
ses:
pro
du
ctio
n,
pu
rifi
cati
on
an
d s
tru
ctu
ral a
na
lysi
s o
f a
co
ld a
da
pte
d D
sbA
.
Universidade do Minho Escola de Ciências
Catherine Oliveira Ferreira
Abril de 2013
Thiol-disulphide oxidoreductases: production, purification and structural analysis of a cold adapted DsbA.
UNIVERSIDADE DO MINHO
Escola de Ciências
CATHERINE OLIVEIRA FERREIRA
Thiol-disulphide oxidoreductases: production, purification and structural analysis of a cold adapted DsbA.
Master Thesis
Master in Molecular Genetics
Work done under supervision of:
Doutor Tony Collins
Professora Doutora Margarida Casal
Abril 2013
i
DECLARAÇÃO Nome
Catherine Oliveira Ferreira
Endereço electrónico: [email protected]
Número do Cartão de Cidadão: 13845225
Título da tese: Thiol-disulphide oxidoreductases: production, purification and
structural analysis of a cold adapted DsbA.
Orientadores:
Doutor James Anthony Collins
Professora Doutora Margarida Paula Pedra Amorim Casal
Ano de conclusão: 2013
Designação do Mestrado: Genética Molecular
É AUTORIZADA A REPRODUÇÃO PARCIAL DESTA TESE/TRABALHO (indicar,
caso tal seja necessário, nº máximo de páginas, ilustrações, gráficos, etc.),
APENAS PARA EFEITOS DE INVESTIGAÇÃO, MEDIANTE DECLARAÇÃO
ESCRITA DO INTERESSADO, QUE A TAL SE COMPROMETE;
Universidade do Minho, ___/___/______
Assinatura: _____________________________________________
ii
ACKNOWLEDGEMENTS/AGRADECIMENTOS
‘Serei prosa serei verso? Instrumento útil neste Universo.
Guiada num controverso caminhar, tendo em missão seu guião findar.
Dia de hoje, que será sempre um só,
Produto palpável dos sonhos passados. Desses, tantos se desmoronaram num pó,
e a tantos outros permanecem meus quereres abraçados.’
Catherine Ferreira
De um jeito poético começo por descrever a forma como encaro cada desafio.
Tendo em mente que tudo se resume à descoberta incansável do nosso caminho, do
nosso lugar. Este caminho de linhas tortas que se constrói das nossas vontades, das
nossas opções mas que nunca é resultado de um só ‘eu’. Nesta viagem beneficiamos
da ajuda, dos conselhos e da força daqueles com que a vida nos quis cruzar. Começo
assim por agradecer a quem permitiu que este passo fosse possível, a quem tão bem
me recebeu e me integrou. Agradeço imenso aos meus orientadores pela
indispensável presença que tanto me auxiliou neste percurso. À Professora Doutora
Margarida Casal pelas palavras amigas que sempre reservou para mim, e pelo
contagiante sorriso com que sempre me recebeu. Não dispenso valorizar-lhe a boa
disposição, a serenidade e os certeiros conselhos que tanto me auxiliaram. Ao
Professor Doutor Tony Collins pela incansável paciência, pela constante
disponibilidade e pelo esforço acrescido que sempre demonstrou em contornar todas
as situações inesperadas tão comuns de qualquer percurso. Agradeço também a
todos que floriram os meus dias no laboratório. Assim, agradeço do fundo do coração
aos que me arrancaram sorrisos em dias mais difíceis, aos que me presentearam com
a sua presença e cuja personalidade de cada um fez daquele laboratório um lugar tão
bom e tão melhor. À Joana Sá Pessoa, ao Raul Machado, ao João Silva, ao André
Costa, ao Pedro Castro e ao Fernando Branca. De uma forma geral agradeço a forma
tão especial como fui recebida, integrada e tratada. Enchem-me de alegria, antecipada
saudade e da certeza de que todos os momentos estarão sempre carinhosamente
guardados na minha memória.
Agradeço com um especial carinho a todas as pessoas que de uma forma ou
de outra contribuíram no sentido de me ajudar neste percurso. Á Joana Tulha, à Filipa
Pereira, à Andreia Pacheco, à Dulce Cunha, à Sara Alves, ao Flávio Azevedo, à
iii
Helena Pereira e à Catarina Carneiro. Sem esquecer todos os técnicos que fizeram
parte desta jornada, reconhecendo-lhes o tão importante trabalho que sempre tiveram
e com o qual nada disto seria possível.
À Professora Doutora Maria João Sousa pela recepção no Mestrado em
Genética Molecular.
‘Quando o sonho abraça a fé, a coragem é véstia mais bela. Atributo invejado
por quem vive só da razão. De quem vê e não entende, de quem toca e não sente, de
quem passa sem viver. Pois se o sonho é meu e a fé minha loucura… a coragem
enaltece o brilho de quem tem morada em mim. Dos que me vêm de verdade, dos que
me sentem no infinito e me entendem sem perguntar. Nesse olhar, nesse abraço,
nessas palavras plenas de silêncio. Na promessa de alinhar na primeira fila de cada
batalha vossa, sei que vos terei em cada luta minha. Pois é desse brilho que vivo. E
quanto mais invejado e incompreendido mais intenso e desejado será o seu brilho.
Selvagens almas, misteriosos seres… sem vocês não seria mais eu.’
Catherine Ferreira
Agradeço o que as palavras não conseguem descrever, à minha família,
especialmente aos meus pais, pois o seu apoio a todos os níveis foi sem dúvida
essencial. Aos meus irmãos pois não teria o mesmo sentido sem eles. Aos meus avós
que sempre me apoiaram também. Dedico todo este esforço a eles e em especial à
minha avó e à minha bisavó, esperando que se orgulhem desta batalha.
Aos meus amigos que em todos os momentos estiveram presentes, que foram
incansáveis na ajuda, que albergaram a maior paciência e mesmo assim se
mantiveram firmes ao meu lado. Por todos os momentos bons e menos bons.
Agradeço assim à Rita Cunha, ao Pedro Castro, ao António Rego e à Sara Peixoto.
Um agradecimento especial ao Pedro Martinez que no momento certo surgiu,
que do seu jeito único me estendeu a mão e que desde então se mantém fielmente ao
meu lado. Para o que der e vier sei que estarás sempre lá.
Ao João digo que são poucas as palavras capazes de descrever a minha
gratidão. Que nada seria possível se nos dias mais difíceis eu não encaminhasse a
minha mente para um futuro melhor. E acredito tanto nele. É nesse futuro que
descanso e vejo a paz e a felicidade de que preciso.
iv
ABSTRACT
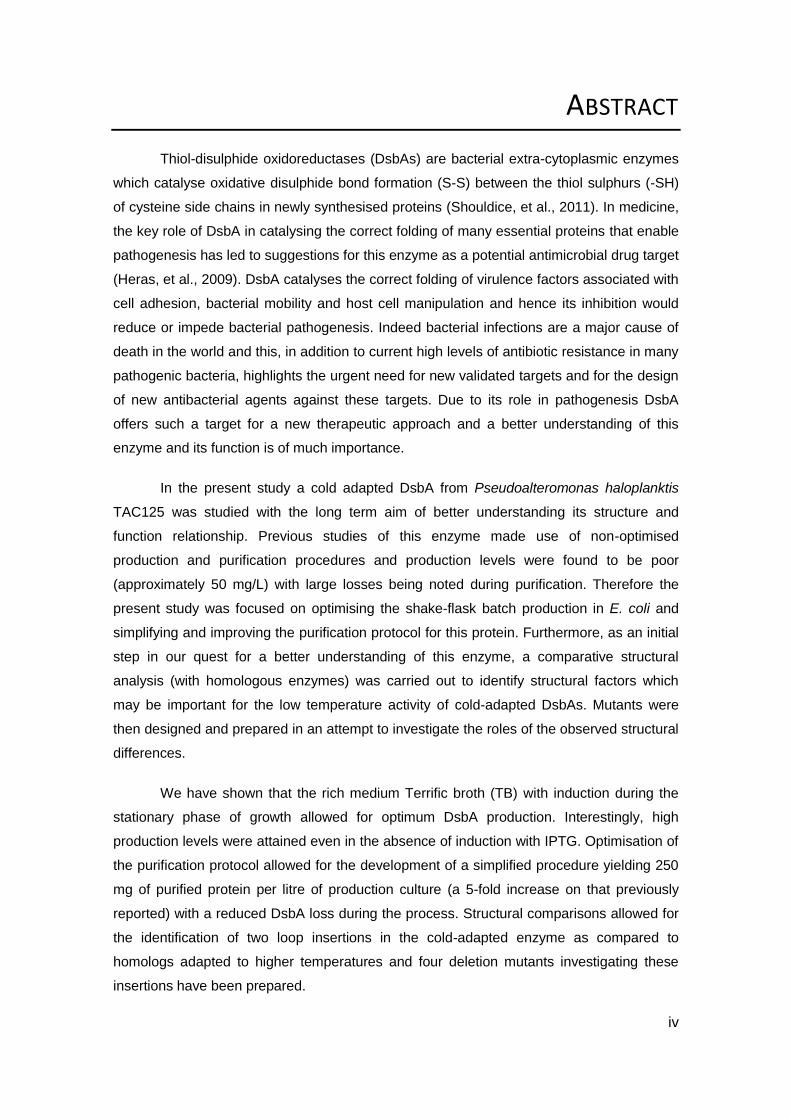
Thiol-disulphide oxidoreductases (DsbAs) are bacterial extra-cytoplasmic enzymes
which catalyse oxidative disulphide bond formation (S-S) between the thiol sulphurs (-SH)
of cysteine side chains in newly synthesised proteins (Shouldice, et al., 2011). In medicine,
the key role of DsbA in catalysing the correct folding of many essential proteins that enable
pathogenesis has led to suggestions for this enzyme as a potential antimicrobial drug target
(Heras, et al., 2009). DsbA catalyses the correct folding of virulence factors associated with
cell adhesion, bacterial mobility and host cell manipulation and hence its inhibition would
reduce or impede bacterial pathogenesis. Indeed bacterial infections are a major cause of
death in the world and this, in addition to current high levels of antibiotic resistance in many
pathogenic bacteria, highlights the urgent need for new validated targets and for the design
of new antibacterial agents against these targets. Due to its role in pathogenesis DsbA
offers such a target for a new therapeutic approach and a better understanding of this
enzyme and its function is of much importance.
In the present study a cold adapted DsbA from Pseudoalteromonas haloplanktis
TAC125 was studied with the long term aim of better understanding its structure and
function relationship. Previous studies of this enzyme made use of non-optimised
production and purification procedures and production levels were found to be poor
(approximately 50 mg/L) with large losses being noted during purification. Therefore the
present study was focused on optimising the shake-flask batch production in E. coli and
simplifying and improving the purification protocol for this protein. Furthermore, as an initial
step in our quest for a better understanding of this enzyme, a comparative structural
analysis (with homologous enzymes) was carried out to identify structural factors which
may be important for the low temperature activity of cold-adapted DsbAs. Mutants were
then designed and prepared in an attempt to investigate the roles of the observed structural
differences.
We have shown that the rich medium Terrific broth (TB) with induction during the
stationary phase of growth allowed for optimum DsbA production. Interestingly, high
production levels were attained even in the absence of induction with IPTG. Optimisation of
the purification protocol allowed for the development of a simplified procedure yielding 250
mg of purified protein per litre of production culture (a 5-fold increase on that previously
reported) with a reduced DsbA loss during the process. Structural comparisons allowed for
the identification of two loop insertions in the cold-adapted enzyme as compared to
homologs adapted to higher temperatures and four deletion mutants investigating these
insertions have been prepared.
v
RESUMO
As tiol-dissulfito oxidorredutases (DsbAs) são enzimas bacterianas extra
citoplasmáticas que catalisam a formação oxidativa de pontes dissulfito (S-S) entre os
grupos tióilicos (-SH) das cadeias laterais das cisteínas em proteínas recentemente
sintetizadas (Shouldice, et al., 2011). Na medicina, o papel chave da DsbA prende-se com
a catálise do correcto rearranjo de muitas proteínas essenciais na patogénese, têm assim
surgido sugestões de que esta enzima possa ser um alvo de potenciais drogas
antimicrobianas (Heras, et al., 2009). A DsbA é catalisadora do correcto rearranjo de
factores de virulência associados à adesão celular, mobilidade bacteriana e manipulação
das células hospedeiras. Na verdade, as infecções bacterianas são já a maior causa de
morte no mundo e este facto, em junção com o actual alto nível de resistência a
antibióticos por parte de várias bactérias patogénicas, enaltece a urgente necessidade
tanto de validar novos alvos como de objectivar o desenho de novos agentes
antibacterianos que actuem nesses alvos. Devido ao seu papel na patogénese, a DsbA,
sendo um possível alvo apresenta-se assim uma nova abordagem terapêutica destacando-
se a elevada importância de um melhor entendimento desta enzima e da sua função.
No presente estudo, foi estudada uma DsbA adaptada ao frio proveniente da
bactéria Pseudoalteromonas haloplanktis TAC125 objectivando-se a longo prazo um
melhor entendimento da relação entre a sua estrutura e função. Estudos anteriores
centrados nesta enzima têm feito uso de processos de produção e purificação não
optimizados tendo resultado em baixos níveis de produção (aproximadamente 50 mg/L),
com grandes perdas observadas no processo de purificação. Assim sendo, o actual estudo
centrou-se tanto na optimização da produção em batch em E. coli como em simplificar e
melhorar o protocolo de purificação para esta proteína. Além disso, como parte inicial da
nossa investigação focada na obtenção de um melhor entendimento desta enzima, uma
comparativa análise estrutural (com enzimas homólogas) foi levada a cabo de modo a
identificar os factores estruturais que possam ser importantes na actividade a baixas
temperaturas desta DsbA naturalmente adaptada ao frio. Os mutantes foram então
desenhados na tentativa de investigar o papel das diferenças estruturais observadas.
Demonstrou-se neste estudo que a junção do meio rico Terrific Broth (TB) com
indução na fase estacionária de crescimento permitiu um nível óptimo de produção da
DsbA. Interessantemente, elevados níveis de produção foram alcançados inclusive na
ausência de indução. No entanto, altos níveis de produção foram também observados

vi
aquando da indução com 1 mM de IPTG na fase de declínio exponencial. A optimização
do protocolo de purificação permitiu o desenvolvimento de um simplificado procedimento,
rendendo 250 mg de proteína purificada por litro de cultura d produção (5 vezes mais) com
a reduzida perda de proteína ao longo do processo. Comparações estruturais permitiram a
identificação de duas inserções em loop’s da enzima adaptada ao frio quando comparada
com os homólogos adaptados a temperaturas mais elevadas. Neste sentido, quatro
mutantes centrados na investigação desses locais foram concebidos.
vii
ABBREVIATIONS AND SYMBOLS
TRX – Thioredoxin
-SH – Thiol group of cysteine
S-S – Disulphide bond between cystines
E. coli – Escherichia coli
Cys – Cysteine
Val – Valine
Lys – Lysine
Leu – Leucine
Ala – Alanine
Ser – Serine
His – Histidine
Asp – Aspargine
pKa – Dissociation constant
NMR – Nuclear Magnetic Resonance
PhDsbA – DsbA protein from Pseudoalteromonas haloplanktis
PhDsbB - DsbB protein from Pseudoalteromonas haloplanktis
Tcp – Toxin co-regulated pilus
B. pertussis – Bordetella pertussis
kcat – enzymatic reaction rate
A - Frequency factor related to the frequency of collision of the reactants and to the
probability of the reactants being in the appropriate orientation to react
T – Temperature
R - Universal gas constant
Ea - Activation energy necessary for the reaction
IPTG - isopropyl β-D-1-thiogalactopyranoside

viii
kDa – Atomic mass unit
LB – Lysogeny broth
TB – Terrific broth
SB – Super broth
HPLC – High-performance liquid chromatography
FPLC – Fast protein liquid chromatography
DTNB - 5,5’–dithiobis–2–nitrobenzoic acid
TNB – 2-nitro-5-thiobenzoic acid
NaCl – Sodium chloride
pI – Isoelectric point
HIC – Hydrophobic interaction chromatography
IEX – Ion exchange chromatography
WT – Wild type
K2HPO4.3H2O – dipotassium phosphate trihydrate
KH2PO4 – potassium dihydrogen phosphate
UV – Ultra violet
Vis – Visible
EDTA - Ethylenediamine tetraacetic acid
DTT – Dithiothreitol
MOPS - 3-(N-morpholino)propanesulfonic acid
BSA – Bovine serum albumin
DNA – deoxyribonucleic acid
RPM – Rotations per minute
CH3COOK – Potassium acetate
CaCl2 – Calcium chloride
RbCl2 – Rubidium chloride
PNK - T4 polynucleotide kinase

ix
PCR – Polymerase chain reaction
MnCl2 – Magnesium chloride
G – Guanidine
C – Cytosine
H2O – Water
Tris-HCl – Tris-hydrochloride
DNTP’s – deoxyribonucleotides
Tm – Melting temperature
MgSO4 – Magnesium sulphate
GSSG – Oxidised glutathione
GSH – Reduced glutathione
DSC – Differential Scanning Calorimetry
BLAST - Basic Local Alignment Search Tool

x
TABLE OF CONTENTS
Chapter 1: State of the art ..................................................................................................... 1
THIOL-DISULPHIDE OXIDOREDUCTASE (EC 1.8.4.-) ........................................................ 2
1. 1.
1. 1. 1. Why study DsbA? ............................................................................................................. 5
1. 1. 2. A comparative study: understanding DsbAs and cold-adaptation ................................... 7
1. 1. 3. Understanding life in cold environments ......................................................................... 8
1. 1. 4. THE pET22b(+)/E. coli BL21(DE3) EXPRESSION SYSTEM ................................................. 11
1. 1. 5. MEASUREMENT OF DsbA ACTIVITY ................................................................................ 14
1. 1. 6. PSYCHROPHILIC DsbA PURIFICATION ............................................................................. 14
1. 1. 7. OBJECTIVES ..................................................................................................................... 15
Chapter 2: Materials and methods ...................................................................................... 17
2. 1. BIOLOGICAL MATERIAL .................................................................................................. 18
2. 1. 1. Escherichia coli strains .......................................................................................... 18
2. 1. 2. DsbA Production: optimisation of medium, aeration and induction (time, period)
19
2. 1. 3. SDS-PAGE analysis................................................................................................. 21
2. 1. 4. DsbA PURIFICATION .............................................................................................. 23
2. 1. 5. DsbA reducing activity assay ................................................................................. 25
2. 1. 6. Sugar detection assay ........................................................................................... 26
2. 1. 7. Bradford assay for protein quantification ............................................................. 27
2. 1. 8. MUTANT CONSTRUCTION ..................................................................................... 27
Chapter 3: results and discussion ........................................................................................ 35
3.1. PRODUCTION OPTIMIZATION ...................................................................................... 36
3.2. PHDSBA PURIFICATION OPTIMIZATION ........................................................................ 42
3.3. MUTANT CONSTRUCTION ............................................................................................ 44
3.4. ACTIVITY ASSAY ............................................................................................................ 48
Chapter 4: Final remarks and future perspectives ............................................................... 50
Bibliography ......................................................................................................................... 55

1
Chapter 1: State of the art
2
THIOL-DISULPHIDE OXIDOREDUCTASE (EC 1.8.4.-)
1. 1. Thiol-disulphide oxidoreductases (DsbAs) are bacterial extra-cytoplasmic
enzymes which catalyse disulphide bond formation in newly synthesised proteins. Of
small size (typically around 21 kDa), they belong to the thioredoxin (TRX) superfamily
of structurally related proteins (Collet & Bardwell, 2002) and have been mainly isolated
from Gram-negative bacteria, with those from Escherichia coli and Vibrio cholerae
being the most studied (Shouldice, et al., 2011; Ruddock, et al., 1996). DsbA homologs
have also been identified in Gram-positive organisms, but, in contrast, these have been
poorly studied.
The first report of DsbA was made when the enzyme’s gene sequence was
identified in E. coli and its function determined through the analysis of dsbA- mutants
(Bardwell, et al., 1991). These mutants showed a defect in the construction of
disulphide bonds in newly synthesized periplasmic proteins and hence the function of
DsbA was correlated to the oxidative formation of disulphide bonds, i.e. covalent
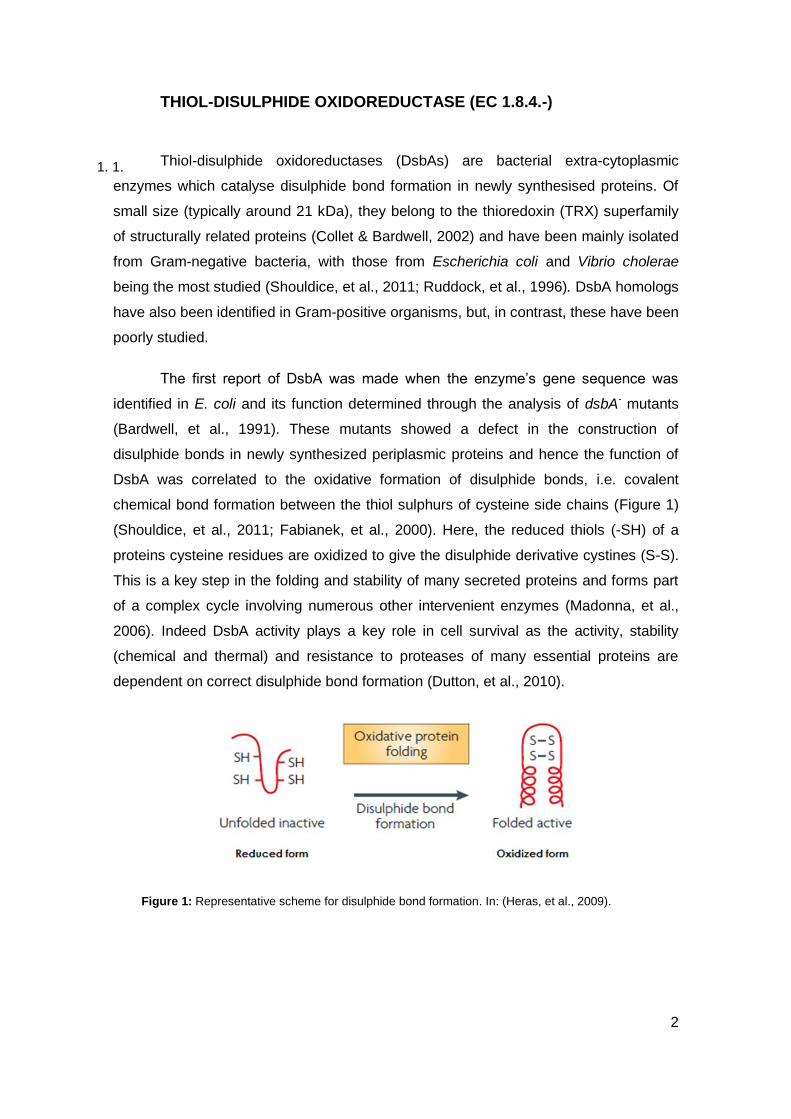
chemical bond formation between the thiol sulphurs of cysteine side chains (Figure 1)
(Shouldice, et al., 2011; Fabianek, et al., 2000). Here, the reduced thiols (-SH) of a
proteins cysteine residues are oxidized to give the disulphide derivative cystines (S-S).
This is a key step in the folding and stability of many secreted proteins and forms part
of a complex cycle involving numerous other intervenient enzymes (Madonna, et al.,
2006). Indeed DsbA activity plays a key role in cell survival as the activity, stability
(chemical and thermal) and resistance to proteases of many essential proteins are
dependent on correct disulphide bond formation (Dutton, et al., 2010).
Figure 1: Representative scheme for disulphide bond formation. In: (Heras, et al., 2009).
3
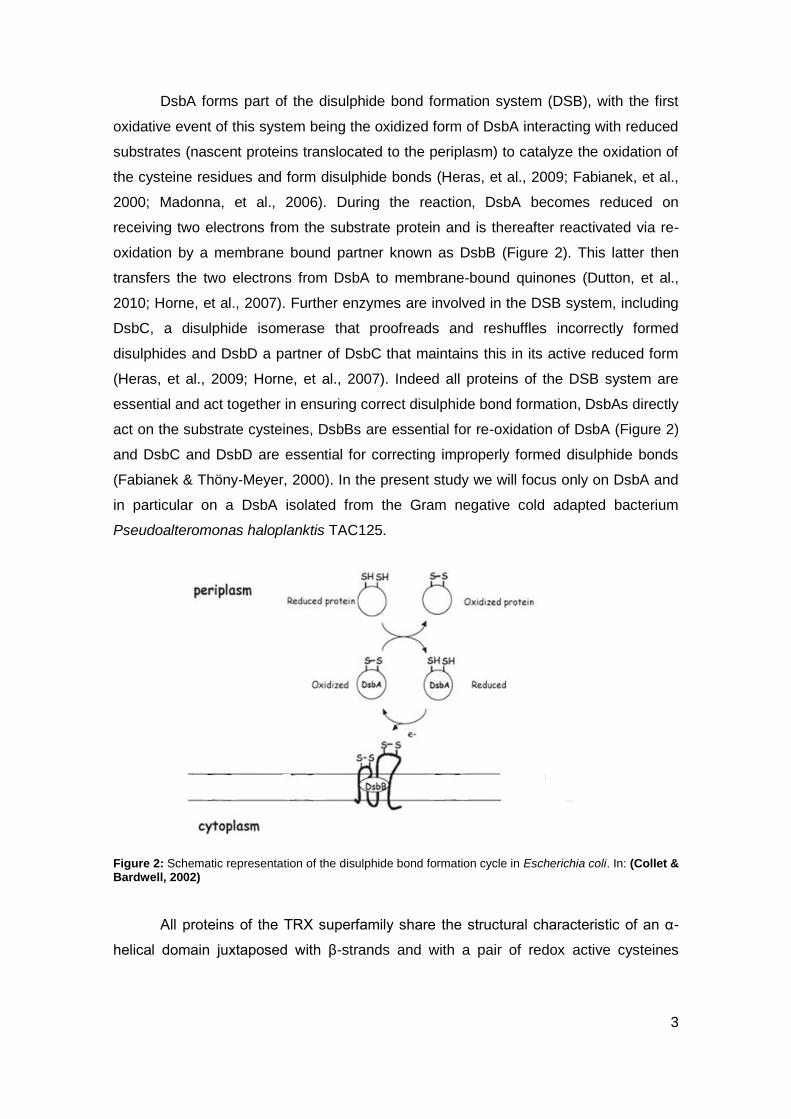
DsbA forms part of the disulphide bond formation system (DSB), with the first
oxidative event of this system being the oxidized form of DsbA interacting with reduced
substrates (nascent proteins translocated to the periplasm) to catalyze the oxidation of
the cysteine residues and form disulphide bonds (Heras, et al., 2009; Fabianek, et al.,
2000; Madonna, et al., 2006). During the reaction, DsbA becomes reduced on
receiving two electrons from the substrate protein and is thereafter reactivated via re-
oxidation by a membrane bound partner known as DsbB (Figure 2). This latter then
transfers the two electrons from DsbA to membrane-bound quinones (Dutton, et al.,
2010; Horne, et al., 2007). Further enzymes are involved in the DSB system, including
DsbC, a disulphide isomerase that proofreads and reshuffles incorrectly formed
disulphides and DsbD a partner of DsbC that maintains this in its active reduced form
(Heras, et al., 2009; Horne, et al., 2007). Indeed all proteins of the DSB system are
essential and act together in ensuring correct disulphide bond formation, DsbAs directly
act on the substrate cysteines, DsbBs are essential for re-oxidation of DsbA (Figure 2)
and DsbC and DsbD are essential for correcting improperly formed disulphide bonds
(Fabianek & Thöny-Meyer, 2000). In the present study we will focus only on DsbA and
in particular on a DsbA isolated from the Gram negative cold adapted bacterium
Pseudoalteromonas haloplanktis TAC125.
Figure 2: Schematic representation of the disulphide bond formation cycle in Escherichia coli. In: (Collet & Bardwell, 2002)
All proteins of the TRX superfamily share the structural characteristic of an α-
helical domain juxtaposed with β-strands and with a pair of redox active cysteines

4
(Cys-X-X-Cys) located at the N-terminal end of the first helix at the active site of the
enzyme (Figure 3) (Heras, et al., 2009; Guddat, et al., 1997; Ruddock, et al., 1996).
Figure 3: Common structural organization of DsbA fold. At left: Helices are illustrated in green and β sheets in brown. The locations of the catalytic CxxC motif (shown by a yellow sphere) and the cis-Pro loop (arrow) are also specified. Data from: (Gruber, et al., 2006). On the right: Crystal structure representation of oxidized Vibrio cholerae DsbA. The elements of secondary structure are sequentially numbered from
the N terminus. Helices are presented with black numbers and the grey numbers denote strands. The active site is presented in a CPK representation. In: (Horne, et al., 2007).
DsbAs are the most oxidizing proteins known, probably as a result of the CXXC
motif structure and, more precisely, due to an unusually low pKa of the most N-terminal
cysteine in the active site (Collet & Bardwell, 2002). The high reactivity of this Cys is
due to an electrostatic interaction with a nearby His which stabilizes the Cys in its
thiolate anion form (Guddat, et al., 1997). The redox potential of the enzyme also
depends on the type of residues, XX, flanked by the two cysteines of the general motif
(Ito & Inaba, 2008). Indeed the canonical sequence of the active site motif for TRX
enzymes is C-P-H-C (Paxman, et al., 2009; Madonna, et al., 2006) but variations in the
third residue (i.e the histidine) have been observed. In fact, Guddat and collaborators
showed in 1997 that a mutation of the histidine residue of the active site motif leads to
a significant decrease in the redox potential of these mutants (Guddat, et al., 1997).
As mentioned above, generally disulphide bonded proteins are more stable than
their non-disulphide bonded forms yet it has been reported that the disulphide bond of
DsbA is very unstable and that the stability of this protein is increased on disulphide

5
bond reduction (Zapun, et al., 1993). Furthermore, a previous study showed that
oxidised DsbA from E. coli is more rapidly cleaved by proteases than its reduced form.
These results suggest a lower stability and higher flexibility of the oxidized form of the
enzyme which may have importance in its disulphide bond donation activity and in the
the accommodation of substrate (Horne, et al., 2007).
1. 1. 1. WHY STUDY DsbA?
DsbAs have been the focus of much study over recent years, not only because
of their fundamental interest, but also because of their potential applied importance.
From a fundamental point of view, a better understanding of the implications of this
enzyme in protein folding is of obvious importance. In relation to its applied interest, its
potential for developments in the fields of biotechnology and medicine has led to a
drastic increase in interest in this enzyme.
In biotechnology, the use of DsbA in catalysing the correct folding of disulphide
bond containing proteins has led to suggestions for co-expression of this enzyme
during recombinant protein production, for its use as an additive in cell free protein
production systems (Kuroita, et al., 2007) and even for the refolding of misfolded
proteins (Antonio-Pérez, et al., 2012). Indeed studies have shown that the use of this in
cell free systems leads to higher production levels (approximately two fold higher) of
active properly folded disulphide containing proteins (Kuroita, et al., 2007). Obviously,
such increases in production levels warrants the use of DsbA as a tool in protein
production procedures and the development of further more cheaply produced and
more highly active DsbAs is called for.
In medicine, the key role of DsbA in catalysing the correct folding of many
essential proteins, and in particular those that enable pathogenesis (i.e. the virulence
factors), in pathogenic organisms has led to suggestions for this enzyme as a potential
antimicrobial drug target (Lasica & Jagusztyn-Krynicka, 2007); Heras, et al., 2009;
Shouldice, et al., 2011). DsbA has an essential role in pathogenesis as it catalyses the
correct folding of virulence factors associated with adhesion (e.g. fimbriae, intimin),
bacterial mobility (flagella) and host cell manipulation (e.g. toxins, such as the cholera
and pertussis toxins) (see below for a more in-depth discussion) (Heras, et al., 2009;
Shouldice, et al., 2011). Blocking DsbA activity would therefore interfere with the
functioning of these virulence factors and hence impede the pathogens ability to cause
disease. Indeed previous studies have demonstrated that hosts with defective DsbA
6
display reduced virulence in animal infection models (Bardwell, et al., 1991; Lin, et al.,
2008; Heras, et al., 2009; Shouldice, et al., 2011). Therefore, better understanding
DsbA and its inhibition opens up exciting new possibilities for novel antibacterial agents
(Früh, et al., 2010). Indeed bacterial infections are a major cause of death in the world
and this, in addition to current high levels of antibiotic resistance in many pathogenic
bacteria, highlights the urgent need for new validated targets and for the design of new
antibacterial agents against these targets. Due to its role in pathogenesis DsbA offers
such a target for a new therapeutic approach. Nevertheless, it is important to note that
drugs acting against DSB may not necessarily kill pathogens, but instead would
impede or reduce bacterial pathogenesis by interfering with multiple essential virulence
factors encoded by the pathogens (Heras, et al., 2009). However, this may not be a
disadvantage as it may even result in less evolutionary pressure for bacteria to develop
resistance (Heras, et al., 2009).
Some examples of virulence factors, how they intervene in the disease causing
process and documented examples of the role of DsbA in their correct functioning will
now be discussed.
1. 1. 2. 1. DsbA in cell adhesion
For a large number of bacterial pathogens the first and possibly the most important
step is adhesion to the host cell. This process is essential for host colonisation and in
establishing the disease. Adhesion is initially mediated by pili or fimbriae which are hair
like structures typically made up of multiple protein subunits that propagate from the
surface of the bacterium (Heras, et al., 2009). E. coli DsbA is reported to be important
in the formation of disulphide bonds in the P fimbrial adhesion subunit protein PapG
that recognises and binds to carbohydrates in the urinary tract surface (Heras, et al.,
2009). DsbA has also been shown to be important in fimbriae construction in another
urinary tract pathogen, Proteus mirabilis and plays a critical role in functional pili
assembly for Vibrio cholerae colonisation mediated by the toxin co-regulated pilus
(Tcp).
1. 1. 2. 2. DsbA in host cell manipulation
Following adhesion the success of bacterial colonisation is mainly dependent on
the capacity to manipulate the hosts. Here, mass cell damage and destruction induced
by secreted toxins and proteases occurs. Indeed, numerous secreted virulence factors
and the secretion systems required for their discharge necessitates the DSB system to

7
catalyse their correct folding and function. This necessity shows their important role in
this more advanced stage of bacterial pathogenesis.
Pathogens dispose of six different methods for secreting the toxins required for
cell damage and DsbA activity is reported to be important in both type II and type III
secretion systems (Lasica & Jagusztyn-Krynicka, 2007; Durand, et al., 2009). Type II
secretion systems export proteins from the periplasm via a multimeric complex
(Durand, et al., 2009) while type III secretion uses a multi-subunit molecular syringe
like structure that directly injects the virulence proteins into the cytosol of eukaryotic
cells (Heras, et al., 2009). In both of these cases DsbA is essential for correct folding of
protein subunits which themselves are essential for the establishment of the correct
structural conformation and function of the secretion apparatuses (Heras, et al., 2009).
Furthermore, DsbA also acts as a catalyst in the structural assembly of many of the
actual toxins to be secreted. Examples include functional assembly of: the cholera toxin
of Vibrio cholera, the heat-labile enterotoxin assembly in E. coli and functional
disulphide bond formation in almost the entire complex structure of the pertussis toxin
of B. pertussis. Here, DsbA plays an important role in the structural assembly of a
complex structure that includes six subunits and eleven intramolecular disulphide
bonds (Heras, et al., 2009).
1. 1. 2. 3. DsbA in cellular spread and survival
Attachment through fimbriae permits bacteria to establish infections in cells.
However mobility, which is the opposite phenotype, is also very important for virulence
and bacterial fitness because it enables the bacteria to spread across the host cells
(Heras, et al., 2009). Studies in several bacteria show that mutation of dsbA impedes
functional flagella production and hence also bacterial mobility. As an example, in E.
coli, DsbA is reported to be required for catalysing the formation of disulphide bonds in
the FlgI protein that acts as the flagellar P-ring motor, for cell mobility (Dailey & Berg,
1993).
1. 1. 2. A COMPARATIVE STUDY: UNDERSTANDING DsbAs AND COLD-
ADAPTATION
As part of a long term goal of obtaining a better understanding of DsbAs so as
to enable the development of their use in protein production and, more importantly, in
the design of novel antibacterial agents, a comparative study of a cold adapted and
8
mesophilic homolog has been initiated (Collins et al, 2010). To attain the objectives, the
structures-stabilities-functions and also dynamics of both the oxidised and reduced
states of the two DsbA homologs, adapted to low (~5°C) and moderate temperatures
(~37°C), will be compared. The results obtained will give clues on Nature’s strategies
for modifying proteins to attain a desired catalytic rate within the environmental
constraints and will help show how evolution optimises and balances dynamics,
stability and activity (Tomatis, et al., 2008). Mutagenesis studies will then be carried out
to better investigate these observations. DsbA is a well studied enzyme, both at the
structural and biochemical levels (Heras, et al., 2009; Horne, et al., 2007; Schirra, et
al., 1998) but most previous studies have focused on individual enzymes under specific
conditions and we believe that an in-depth comparative approach should offer a more
‘complete picture’ and better pinpoint those regions important for function and stability.
This, in turn, should aid in identifying the most appropriate regions for targeting by
inhibitor.
The comparative studies should also allow for a better comprehension of life in
the extremes and in particular of enzyme adaptation to various temperatures. More
specifically, the study of a cold adapted DsbA should enable a better understanding of
the molecular determinants of low temperature adaptation in enzymes. Furthermore,
the expected high activity of the cold-adapted enzyme could allow for the development
of a novel highly active tool for cell free protein synthesis of disulphide bond containing
proteins.
A more in-depth discussion of the state of the art in cold-adaptation will now be
presented.
1. 1. 3. UNDERSTANDING LIFE IN COLD ENVIRONMENTS
Life on Earth is ubiquitous, it is not restricted to those regions which we, as
humans, classify as being normal but it is also found in those ‘extreme regions’ on
Earth such as the deep seas, the polar regions, the volcanic regions or/and the saline
pools. On the one hand, these regions constitute the major portion of the Earth’s
surface and are far from being sterile (Lonhienne, et al., 2000), but on the other hand,
to survive these various extremes, these organisms had to adapt at all levels of
organization; from structural to physiological adaptation. The present study is focused
on adaptation to low temperatures and how organisms are able to not only tolerate, but
to grow and maintain high enzyme activities in this permanently extreme condition.

9
Cold-adapted microorganisms capable of growing at 0ºC were identified by Forster as
early as 1887 when he isolated them from fish (Zecchinon, et al., 2001). In fact, for
some cold adapted organisms, low temperatures are not only optimal, but mandatory,
for continued cell proliferation, with moderate to high temperatures (e.g., >12 °C (Xu, et
al., 2003)) being inhibitory. These unique organisms, called psychrophiles, have
effectively colonized cold environments thanks to successful adjustments which
counteract the negative effects of low temperatures. These negative effects include a
reduction of reaction rates, alterations in enzyme-substrate interaction strength,
increase in solvent viscosity and a modified solubility of proteins, gases and salts and
finally also, protein cold-denaturation (Georlette, et al., 2004). Psychrophiles have
overcome all these challenges and reveal metabolic fluxes at low temperatures more or
less comparable to those shown by mesophilic species living at moderate temperatures
(Zecchinon, et al., 2001). Indeed, bacterial cell densities as high as 107 ml-1 have been
found in the Antarctic oceans, similar to the densities of temperate waters (Gerday, et
al., 2000).
The enzymes produced by psychrophilic organisms have adapted to
temperatures close to the freezing point of water and typically display high catalytic
rates and low stability as compared to their higher temperature adapted homologs i.e
enzymes from mesophiles and thermophiles. Indeed many enzymes are incapable of
carrying out their function under these low temperature conditions due to the reduced
kinetic energy available at low temperatures, this effectively ‘freezing’ enzymatic
motion. Currently it is hypothesised that psychrophilic enzymes have evolved an
increased flexibility to overcome this (Collins, et al., 2003), thereby allowing for a high
activity but also leading to the observed reduced stability. A reduced number or
strength of intramolecular interactions are frequently reported for these enzymes as
compared to their higher temperature adapted homologs (Gerday, et al., 1997) and it
has ben hypothesized that these reduced interactions allow for the proposed flexibility
of these enzymes and hence the enhanced activity at low temperatures. The actual
molecular basis for the adaptation is enzyme specific however it still completely
understood and direct evidence of the proposed increased flexibility is scant, with
previous attempts to demonstrate this leading to conflicting results.
1. 1. 4. 1. The psychrophilic – mesophilic pair
This study is centred on a cold adapted thiol-disulphide oxidoreductase from a
Gram negative psychrophilic bacterium (Pseudoalteromonas haloplanktis TAC125)
10
which has been isolated from an Antarctic coastal sea water sample collected in the
vicinity of the French Antarctic station at Dumont d’Urville in Terre Adélie, Antarctica
(66º 40’ S; 140º 01’ E) (Médigue, et al., 2005; Collins, et al., 2003). The gene encoding
the cold-adapted enzyme has been cloned and the protein overexpressed using the
pET22b(+)/E. coli BL21(DE3) expression system and purified from the periplasmic
extracts. Production was carried out with Terrific Broth medium, using isopropyl β-D-1-
thiogalactopyranoside (IPTG) for induction, and purification involved a combination of
hydrophobic interaction chromatography and anion exchange chromatography. The
production and purification procedures were not optimised and production levels were
approximately 50 mg/L with large losses during purification being noted. Furthermore,
precipitation of the protein, and in particular of the oxidised form, led to large losses of
protein over time and no biochemical, dynamics or activity studies were carried out on
this protein. Backbone and side-chain 1H, 15N and 13C NMR assignments for the
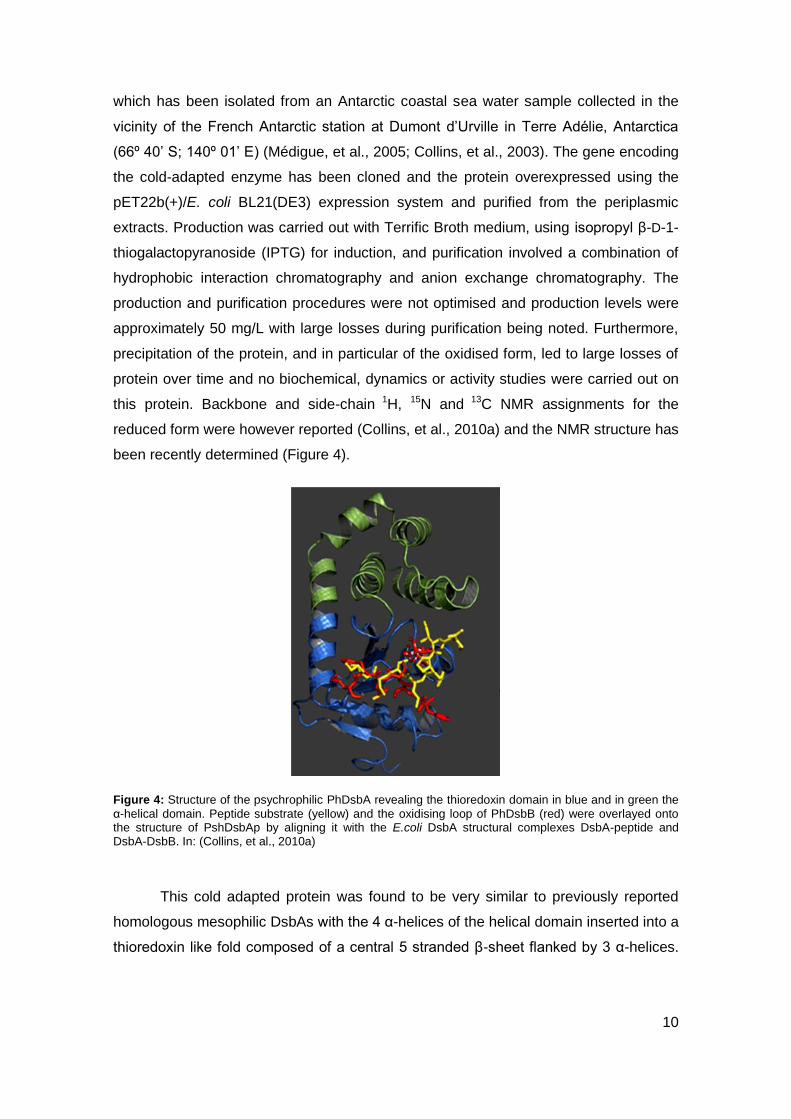
reduced form were however reported (Collins, et al., 2010a) and the NMR structure has
been recently determined (Figure 4).
Figure 4: Structure of the psychrophilic PhDsbA revealing the thioredoxin domain in blue and in green the
α-helical domain. Peptide substrate (yellow) and the oxidising loop of PhDsbB (red) were overlayed onto the structure of PshDsbAp by aligning it with the E.coli DsbA structural complexes DsbA-peptide and DsbA-DsbB. In: (Collins, et al., 2010a)
This cold adapted protein was found to be very similar to previously reported
homologous mesophilic DsbAs with the 4 α-helices of the helical domain inserted into a
thioredoxin like fold composed of a central 5 stranded β-sheet flanked by 3 α-helices.
11
In addition, this contains the consensus DsbA active site sequence (i.e. Cys-Pro-His-
Cys) at a break in the first α-helix in the thioredoxin-like domain.
In contrast to the psychrophilic DsbA, a large number of mesophilic DsbAs have
been studied in detail, both at the structural and biochemical levels (Heras, et al., 2009;
Horne, et al., 2007; Schirra, et al., 1998). Examples include DsbAs from Vibrio cholera
(Horne, et al., 2007), Escherichia. coli (Mössner, et al., 1998; Fabianek, et al., 2000),
Neisseria meningitidis (Vivian, et al., 2009) Salmonella enterica serovar Typhimurium
(Heras, et al., 2010) and Staphylococcus aureus (Williams, et al., 2010). Of these, that
from Vibrio cholera is one of the best understood, with both NMR and crystallographic
structures of both the oxidised and reduced states being reported as well as
investigations of activity, stability and dynamics (by NMR) (Horne, et al., 2007). This
mesophilic Vibrio cholerae DsbA is to be used for comparison in this project, it has
already been cloned, successfully overexpressed in E. coli and purified, and protocols
for these have already been optimised and reported (Horne, et al., 2007).
The availability of in-depth information for mesophilic enzymes homologous to
the cold adapted protein of the present study and in particular for the Vibrio cholera
DsbA should allow for a more comprehensive comparative analysis of the activity,
stability, structure and dynamics of the enzymes. This should enable a better
understanding of structure and function relationships in DsbAs as well as of cold
adaptation in this enzyme.
1. 1. 4. THE pET22B(+)/E. COLI BL21(DE3) EXPRESSION SYSTEM
The first report of the Gram-negative, rod-shaped bacterium, Escherichia coli,
was made in 1885 by Theodor Escherich. Escherichia coli is an abundant inhabitant of
the mammalian colon and is one of the most thoroughly studied organisms known
(Jeong, et al., 2009). It is well understood, easy to manipulate, grows rapidly on
relatively cheap media (Khow & Suntrarachun, 2012) and is described as one of the
most efficient vehicles for over-expression of both eukaryotic and prokaryotic proteins
(Miroux & Walker, 1996). The current term ‘over-expression’ is here mentioned to
define the capacity to produce target proteins at levels much higher than those of its
own repertoire of proteins. Studies reveal that monomeric proteins that contain few
cysteines and have an average size smaller than 60 kDa will give good production in
an E. coli expression host (Bell, 2001). Indeed, in some cases up to 60 % of the total
protein produced can be constituted by the recombinant protein.
12
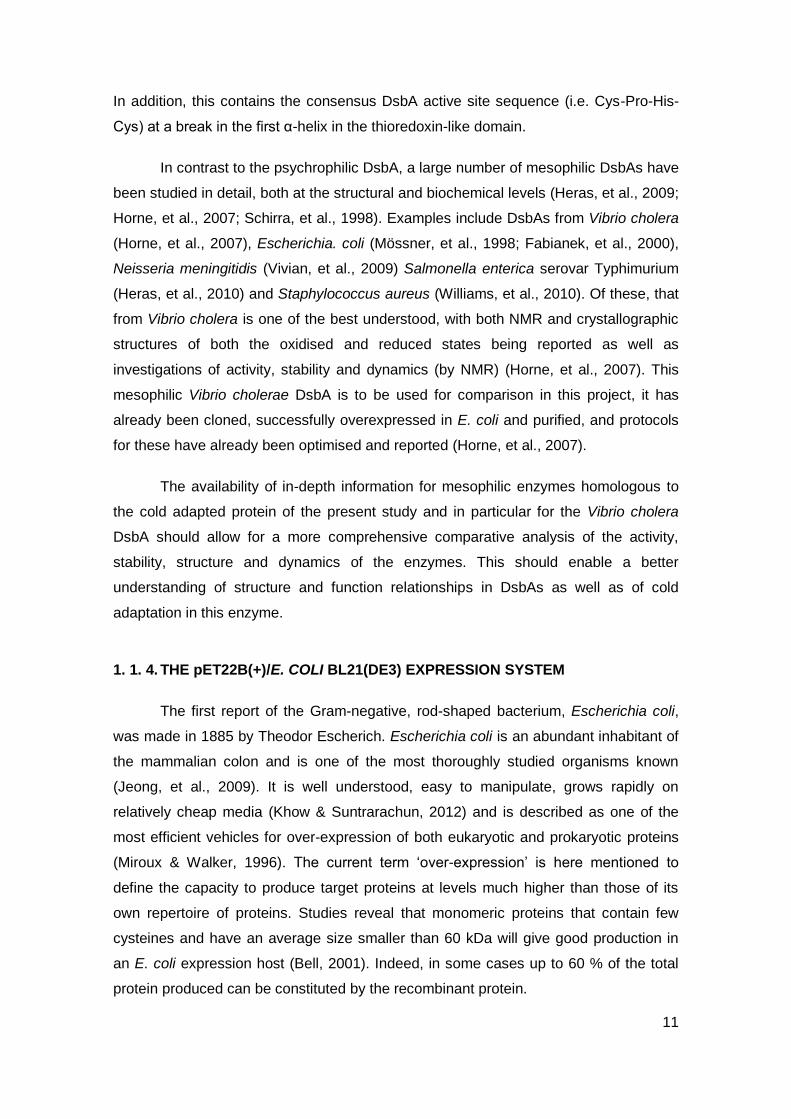
The pET22b(+)/E. coli BL21(DE3) expression system based on the
bacteriophage T7 promoter expression system is one of the most widely used
laboratory systems for recombinant protein expression in E. coli. This is based on an
inducible machinery that permits control of target gene expression. It consists of a lac
operator sequence directly downstream of the T7 promoter, and the gene for the lac
repressor (termed lacI) all encoded on the expression vector. The E.coli BL21
expression host used with this system contains a chromosomal copy of the T7 DE3
lysogen which comprises the T7 polymerase gene under control of the E. coli lacUV5
promoter as well as a chromosomal copy of the lacI repressor gene. In DE3 lysogens
the lac repressor acts not only at the lacUV5 promoter in the host chromosome and
thereby repressing T7 RNA polymerase gene transcription by the host polymerase, but
also at the vector at the T7lac promoter, blocking the transcription of the target gene.
The lacUV5 and T7 lac promoters are inducible with IPTG or lactose, the addition of
which to the growth medium ‘inactivates’ the lac I repressor and induces the production
of the T7 RNA polymerase whereupon binding to the T7 lac promoter transcribes the
target DNA (Figure 5).
Figure 5: Representative scheme of IPTG induction in the pET/E. coli BL21(DE3) expression system. In:
(Novagen, 2003)
Production with this system can make use of batch or fed-batch approaches,
with batch production in shake flasks being the most common at a laboratory scale.
Typically, the most frequently used shake flask production approach uses lysogeny
13
broth (LB) with IPTG induction at the mid-exponential phase of growth (Teulé, et al.,
2009) but the use of richer media such as terrific broth (TB) or super broth (SB) has
recently become common place. While being a highly used and efficient method for
recombinant protein production in E. coli, this system does however sometimes suffer
from low yields of protein product (mg/L) (Teulé, et al., 2009), with yields being
dependent on the actual system used, the target protein, induction conditions and
environmental factors. In fact, process optimisation to maximise productivity is an
essential first step in the production of any recombinant protein.
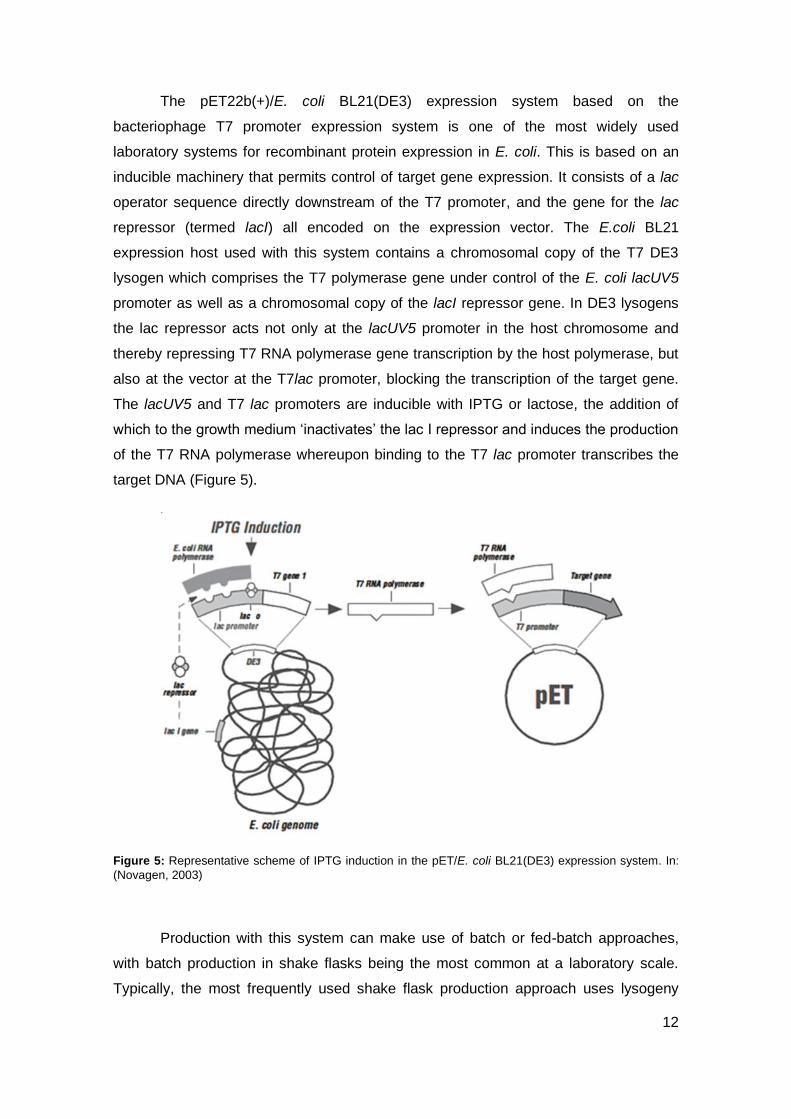
In the case of the cold-adapted DsbA of the present study, the specific
expression system used is the pET22b(+)/E. coli BL21(DE3) system already described
above. Here, the use of the pET22b(+) expression vector allows for expression of
unmodified and untagged DsbA in the host periplasm (Novagen, 2003). The wild-type
signal sequence of DsbA which targets the produced protein to the periplasmic space
and is removed during the translocation process is used.
Figure 6: Schematic representation of pET22b(+) plasmid. In: (Novagen, 2003)
14
1. 1. 5. MEASUREMENT OF DsbA ACTIVITY
Several assays have previously been described for measuring DsbA activity.
These assays are centred on the observation and/or quantification of the
conformational and/or chemical differences between the two states of the protein, more
precisely the reduced and oxidised states. The oxidised state displays a disulphide
bond in the active site of DsbA and can oxidise any substrate that exhibits two free
cysteines, itself becoming reduced in the process. Several strategies to measure DsbA
activity have been reported, these include: an insulin activity assay, Ellmans assay,
HPLC analysis, a fluorimetric assay, an SDS-PAGE based detection method and an
assay using a synthetic fluorescent peptide. In this study the insulin assay will be used
to monitor the reducing activity of the protein studied.
1. 1. 6. PSYCHROPHILIC DsbA PURIFICATION
Chromatography, which separates compounds on the basis of their differential
partitioning between two phases (i.e. a mobile phase and a stationary phase), will be
used to purify the cold adapted DsbA from the E. coli endogenous proteins. A variety of
chromatographic approaches can be used for protein purification, including gel filtration
chromatography, ion-exchange chromatography, hydrophobic interaction
chromatography and affinity chromatography. Of these, hydrophobic interaction and
ion-exchange chromatographies have been previously investigated for purification of
the cold adapted homologs DsbA and will be encountered in this study.
Hydrophobic interaction chromatography (HIC): This technique makes use of subtle
differences in protein surface hydrophobicity for separation. Here a reversible
interaction occurs between exposed hydrophobic patches on the protein and
hydrophobic ligands (e.g. phenyl, octyl, butyl, isopropyl etc.) on the column matrix. It is
very similar to reverse phase chromatography but the ligands used are much less
hydrophobic and hence less extreme elution conditions are required, thereby avoiding
the denaturing conditions often used in reverse phase chromatography. Hydrophobic
binding in HIC is often facilitated by use of neutral salts effective in ‘salting out’ (e.g.
ammonium sulphate, NaCl), with these reducing protein solvation and leading to higher
exposure of protein hydrophobic groups and thus improving binding. Reduction of the
salt concentration is used in protein elution and these are eluted in order of increasing
hydrophobicity (Amersham Pharmacia Biotech, 2000).
15
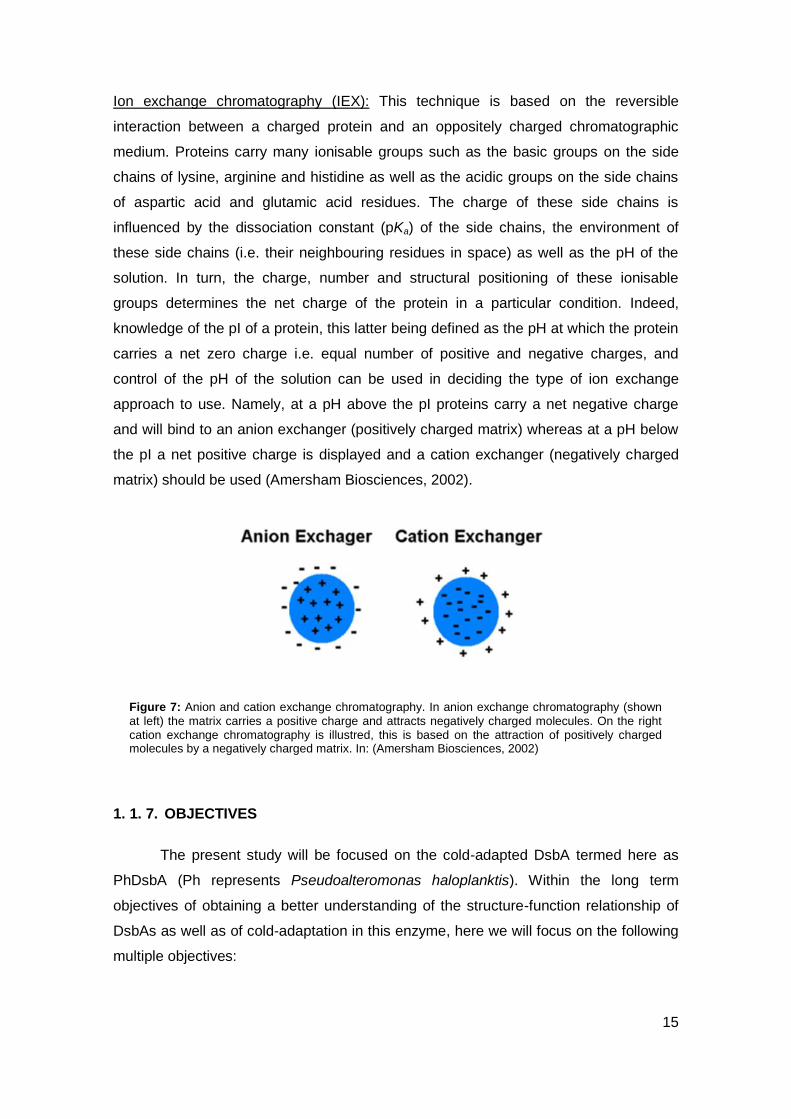
Ion exchange chromatography (IEX): This technique is based on the reversible
interaction between a charged protein and an oppositely charged chromatographic
medium. Proteins carry many ionisable groups such as the basic groups on the side
chains of lysine, arginine and histidine as well as the acidic groups on the side chains
of aspartic acid and glutamic acid residues. The charge of these side chains is
influenced by the dissociation constant (pKa) of the side chains, the environment of
these side chains (i.e. their neighbouring residues in space) as well as the pH of the
solution. In turn, the charge, number and structural positioning of these ionisable
groups determines the net charge of the protein in a particular condition. Indeed,
knowledge of the pI of a protein, this latter being defined as the pH at which the protein
carries a net zero charge i.e. equal number of positive and negative charges, and
control of the pH of the solution can be used in deciding the type of ion exchange
approach to use. Namely, at a pH above the pI proteins carry a net negative charge
and will bind to an anion exchanger (positively charged matrix) whereas at a pH below
the pI a net positive charge is displayed and a cation exchanger (negatively charged
matrix) should be used (Amersham Biosciences, 2002).
1. 1. 7. OBJECTIVES
The present study will be focused on the cold-adapted DsbA termed here as
PhDsbA (Ph represents Pseudoalteromonas haloplanktis). Within the long term
objectives of obtaining a better understanding of the structure-function relationship of
DsbAs as well as of cold-adaptation in this enzyme, here we will focus on the following
multiple objectives:
Figure 7: Anion and cation exchange chromatography. In anion exchange chromatography (shown
at left) the matrix carries a positive charge and attracts negatively charged molecules. On the right cation exchange chromatography is illustred, this is based on the attraction of positively charged molecules by a negatively charged matrix. In: (Amersham Biosciences, 2002)
16
Optimisation of the batch production in shake flask of PhDsbA with the
pET/E. coli BL21(DE3) expression system
Current production levels are approximately 50 mg/L and here culture medium,
culture aeration (via medium volume to flask volume ratio), induction time and induction
period will be investigated in an attempt to improve production levels
Development of a simplified purification protocol for PhDsbA
An initial attempt to purify this protein involved periplasmic extraction, HIC,
dialysis and IEX, but this was found to result in large losses of PhDsbA. Here we will
attempt to develop a simplified efficient purification protocol for this study.
Identify determinants of cold-adaptation.
A comparative structural analysis of PhDsbA with its mesophilic homologs and
in particular with that from Vibrio cholera will be carried out so as to identify mutations
or alterations which may be important in adaptation to low temperatures. Primary,
secondary and tertiary structures will be compared.
Construction of mutants
Mutants identified in the structural comparison will be constructed so as to allow
for identification of their role in the protein.

17
Chapter 2: Materials and methods
18
2. 1. BIOLOGICAL MATERIAL
2. 1. 1. Escherichia coli strains
In this study, the principal working strain used was E. coli BL21 (DE3), a
descendent strain from the native E. coli strain B (Daegelen, et al., 2009).
Transformants of this working strain that were constructed and used in this study to
produce wild-type and mutant DsbA are described in Table 1.
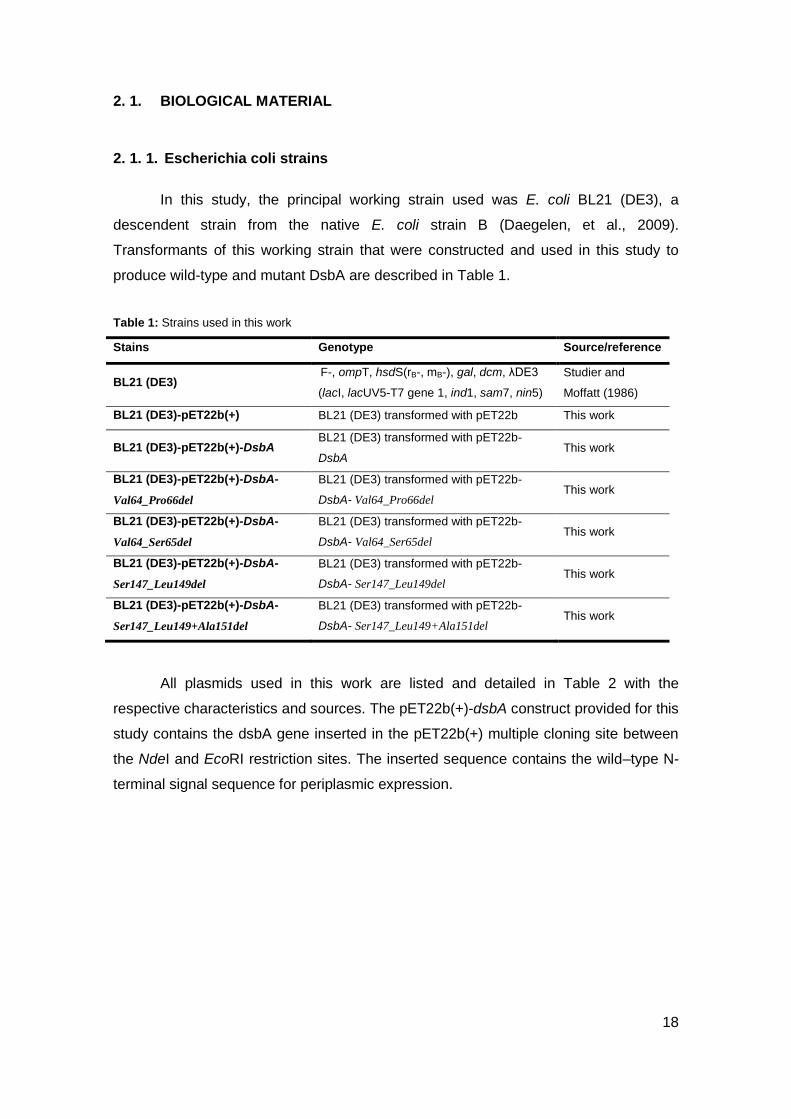
Table 1: Strains used in this work
Stains Genotype Source/reference
BL21 (DE3) F-, ompT, hsdS(rB-, mB-), gal, dcm, λDE3
(lacI, lacUV5-T7 gene 1, ind1, sam7, nin5)
Studier and
Moffatt (1986)
BL21 (DE3)-pET22b(+) BL21 (DE3) transformed with pET22b This work
BL21 (DE3)-pET22b(+)-DsbA BL21 (DE3) transformed with pET22b-
DsbA This work
BL21 (DE3)-pET22b(+)-DsbA-
Val64_Pro66del
BL21 (DE3) transformed with pET22b-
DsbA- Val64_Pro66del This work
BL21 (DE3)-pET22b(+)-DsbA-
Val64_Ser65del
BL21 (DE3) transformed with pET22b-
DsbA- Val64_Ser65del This work
BL21 (DE3)-pET22b(+)-DsbA-
Ser147_Leu149del
BL21 (DE3) transformed with pET22b-
DsbA- Ser147_Leu149del This work
BL21 (DE3)-pET22b(+)-DsbA-
Ser147_Leu149+Ala151del
BL21 (DE3) transformed with pET22b-
DsbA- Ser147_Leu149+Ala151del This work
All plasmids used in this work are listed and detailed in Table 2 with the
respective characteristics and sources. The pET22b(+)-dsbA construct provided for this
study contains the dsbA gene inserted in the pET22b(+) multiple cloning site between
the NdeI and EcoRI restriction sites. The inserted sequence contains the wild–type N-
terminal signal sequence for periplasmic expression.
19
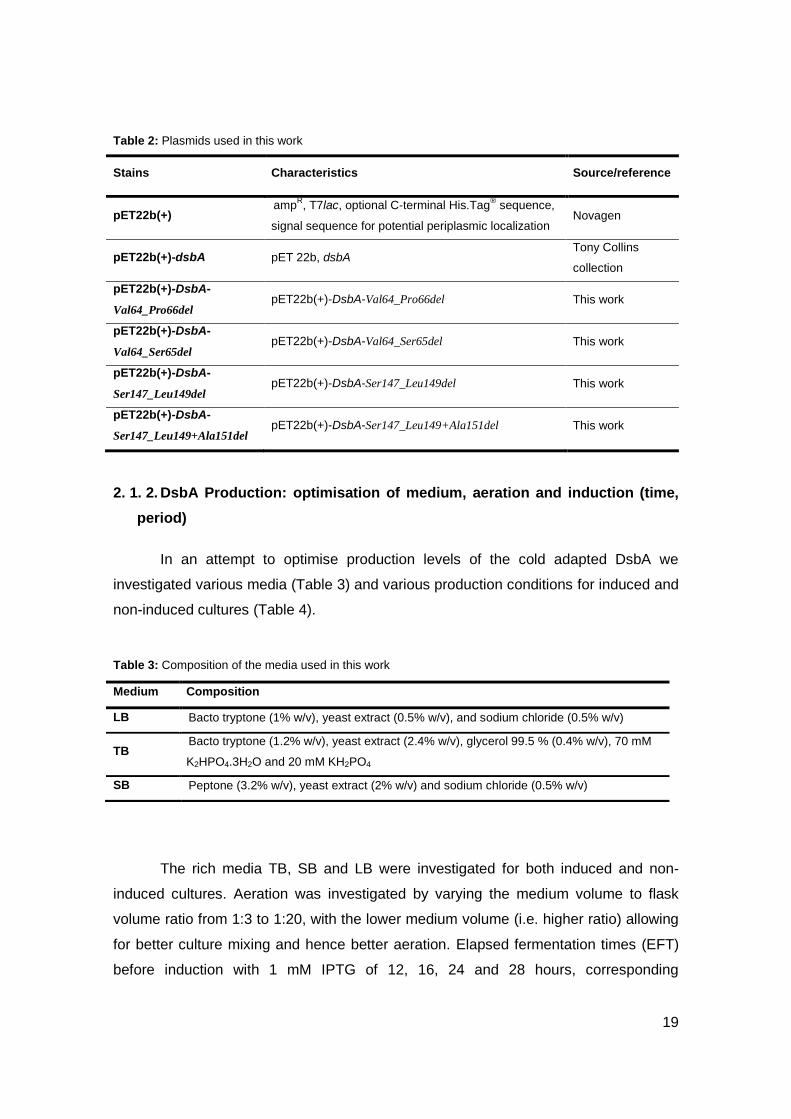
Table 2: Plasmids used in this work
Stains Characteristics Source/reference
pET22b(+) amp
R, T7lac, optional C-terminal His.Tag
® sequence,
signal sequence for potential periplasmic localization Novagen
pET22b(+)-dsbA pET 22b, dsbA Tony Collins
collection
pET22b(+)-DsbA-
Val64_Pro66del pET22b(+)-DsbA-Val64_Pro66del This work
pET22b(+)-DsbA-
Val64_Ser65del pET22b(+)-DsbA-Val64_Ser65del This work
pET22b(+)-DsbA-
Ser147_Leu149del pET22b(+)-DsbA-Ser147_Leu149del This work
pET22b(+)-DsbA-
Ser147_Leu149+Ala151del pET22b(+)-DsbA-Ser147_Leu149+Ala151del This work
2. 1. 2. DsbA Production: optimisation of medium, aeration and induction (time,
period)
In an attempt to optimise production levels of the cold adapted DsbA we
investigated various media (Table 3) and various production conditions for induced and
non-induced cultures (Table 4).
Table 3: Composition of the media used in this work
The rich media TB, SB and LB were investigated for both induced and non-
induced cultures. Aeration was investigated by varying the medium volume to flask
volume ratio from 1:3 to 1:20, with the lower medium volume (i.e. higher ratio) allowing
for better culture mixing and hence better aeration. Elapsed fermentation times (EFT)
before induction with 1 mM IPTG of 12, 16, 24 and 28 hours, corresponding
Medium Composition
LB Bacto tryptone (1% w/v), yeast extract (0.5% w/v), and sodium chloride (0.5% w/v)
TB Bacto tryptone (1.2% w/v), yeast extract (2.4% w/v), glycerol 99.5 % (0.4% w/v), 70 mM
K2HPO4.3H2O and 20 mM KH2PO4
SB Peptone (3.2% w/v), yeast extract (2% w/v) and sodium chloride (0.5% w/v)

20
respectively, to the early, mid, declining exponential and stationary phases of growth
were also examined and compared to non-induced cultures. Induction periods of 2, 4, 6
and 12 hours after induction with 1 mM isopropyl β-D-1-thiogalactopyranoside (IPTG)
were investigated. Cultivations in the absence of induction were carried out to
determine growth curves. Biomass (OD600nm) and DsbA production levels (SDS-PAGE)
were compared for all production optimisation conditions.
PROTOCOL:
Plate out glycerol cultures or fresh transformants of the producing strains on LB-
agar plates containing 100 µg/mL of ampicillin as the selection marker and
incubate overnight at 37 ºC.
Inoculate 100 mL LB+ampicillin preculture in a 500 ml erlenmeyer with a cfu of
the plate culture. Incubate for approximately 15 hours at 25 ºC and 200 rpm.
Inoculate production cultures (in 500 mL erlenmeyers) to an initial OD600nm of
0.1. Incubate at 20 ºC and 200 rpm (25 mm orbital).
Induce when required with 1 mM IPTG. Collect 0.5 mL cell pellet samples at 2,
4, 6 and 12 hours after induction for determination of production levels by SDS-
PAGE. Monitor biomass levels throughout the productions by measuring
OD600nm.
21
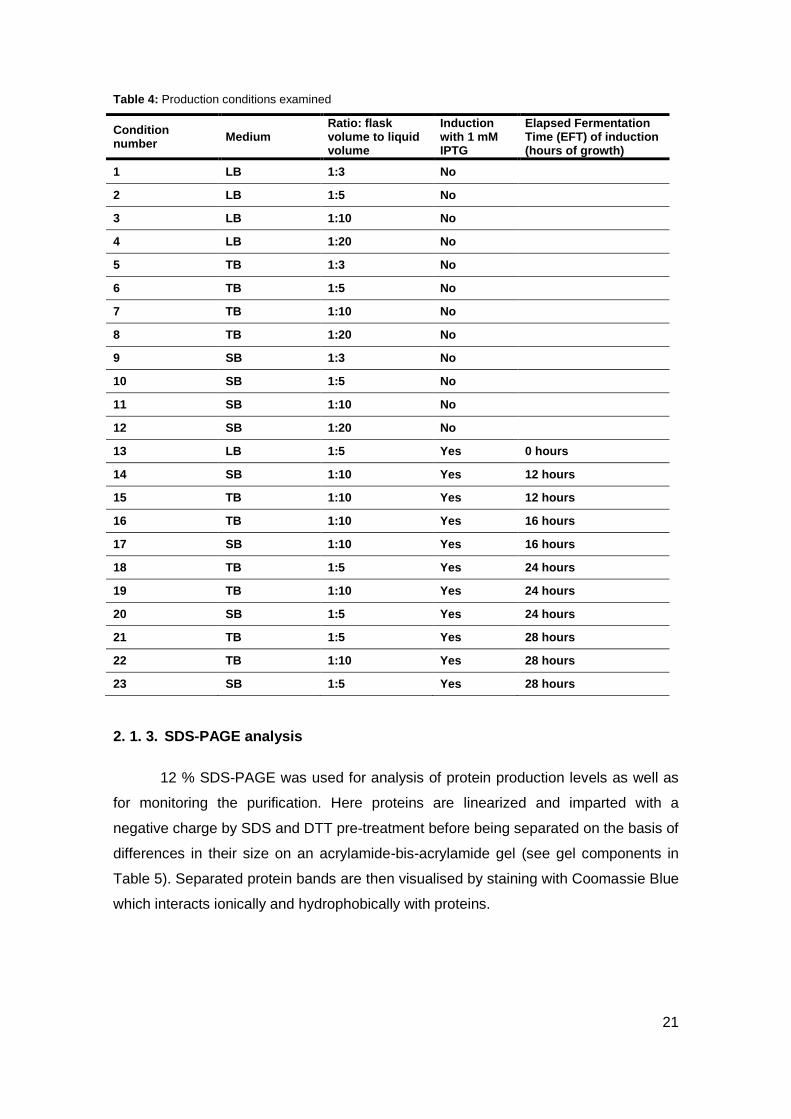
Table 4: Production conditions examined
Condition number
Medium Ratio: flask volume to liquid volume
Induction with 1 mM IPTG
Elapsed Fermentation Time (EFT) of induction (hours of growth)
1 LB 1:3 No
2 LB 1:5 No
3 LB 1:10 No
4 LB 1:20 No
5 TB 1:3 No
6 TB 1:5 No
7 TB 1:10 No
8 TB 1:20 No
9 SB 1:3 No
10 SB 1:5 No
11 SB 1:10 No
12 SB 1:20 No
13 LB 1:5 Yes 0 hours
14 SB 1:10 Yes 12 hours
15 TB 1:10 Yes 12 hours
16 TB 1:10 Yes 16 hours
17 SB 1:10 Yes 16 hours
18 TB 1:5 Yes 24 hours
19 TB 1:10 Yes 24 hours
20 SB 1:5 Yes 24 hours
21 TB 1:5 Yes 28 hours
22 TB 1:10 Yes 28 hours
23 SB 1:5 Yes 28 hours
2. 1. 3. SDS-PAGE analysis
12 % SDS-PAGE was used for analysis of protein production levels as well as
for monitoring the purification. Here proteins are linearized and imparted with a
negative charge by SDS and DTT pre-treatment before being separated on the basis of
differences in their size on an acrylamide-bis-acrylamide gel (see gel components in
Table 5). Separated protein bands are then visualised by staining with Coomassie Blue
which interacts ionically and hydrophobically with proteins.
22
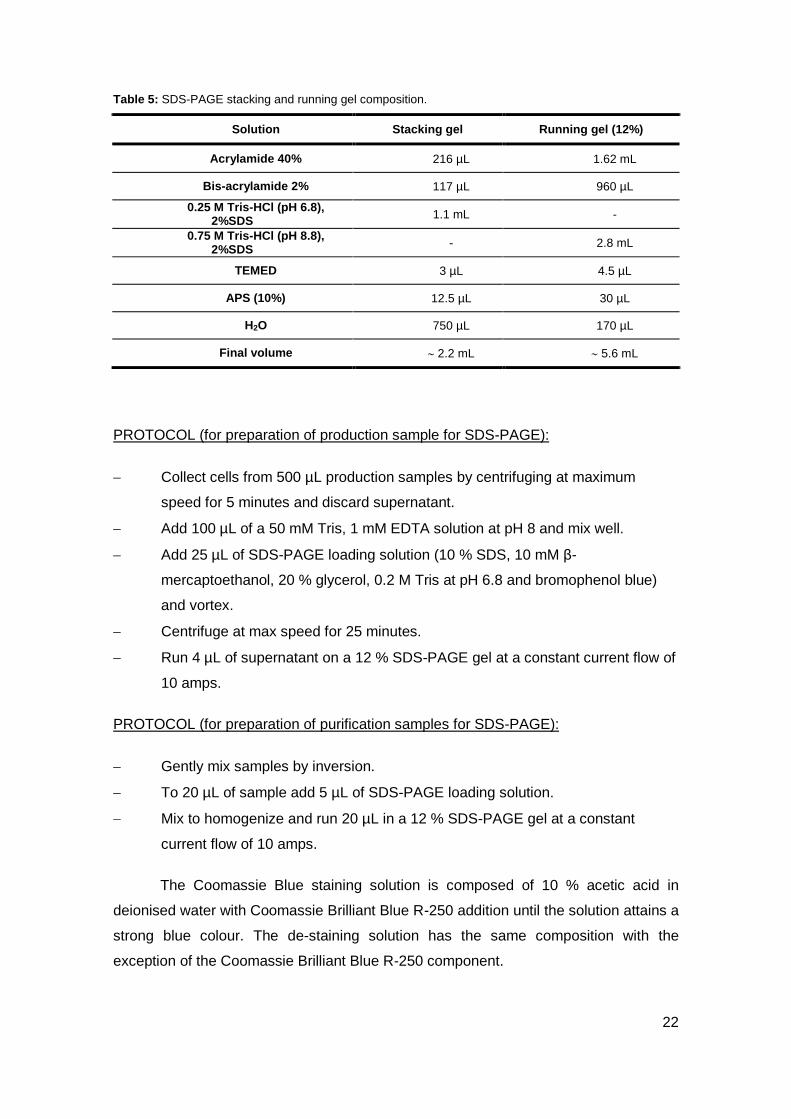
Table 5: SDS-PAGE stacking and running gel composition.
Solution Stacking gel Running gel (12%)
Acrylamide 40% 216 µL 1.62 mL
Bis-acrylamide 2% 117 µL 960 µL
0.25 M Tris-HCl (pH 6.8), 2%SDS
1.1 mL -
0.75 M Tris-HCl (pH 8.8), 2%SDS
- 2.8 mL
TEMED 3 µL 4.5 µL
APS (10%) 12.5 µL 30 µL
H2O 750 µL 170 µL
Final volume 2.2 mL 5.6 mL
PROTOCOL (for preparation of production sample for SDS-PAGE):
Collect cells from 500 µL production samples by centrifuging at maximum
speed for 5 minutes and discard supernatant.
Add 100 µL of a 50 mM Tris, 1 mM EDTA solution at pH 8 and mix well.
Add 25 µL of SDS-PAGE loading solution (10 % SDS, 10 mM β-
mercaptoethanol, 20 % glycerol, 0.2 M Tris at pH 6.8 and bromophenol blue)
and vortex.
Centrifuge at max speed for 25 minutes.
Run 4 µL of supernatant on a 12 % SDS-PAGE gel at a constant current flow of
10 amps.
PROTOCOL (for preparation of purification samples for SDS-PAGE):
Gently mix samples by inversion.
To 20 µL of sample add 5 µL of SDS-PAGE loading solution.
Mix to homogenize and run 20 µL in a 12 % SDS-PAGE gel at a constant
current flow of 10 amps.
The Coomassie Blue staining solution is composed of 10 % acetic acid in
deionised water with Coomassie Brilliant Blue R-250 addition until the solution attains a
strong blue colour. The de-staining solution has the same composition with the
exception of the Coomassie Brilliant Blue R-250 component.
23
ImageJ was employed for quantification of Coomassie Blue stained protein
bands.
2. 1. 4. DsbA PURIFICATION
A previously used purification protocol was optimised in this project. This
involved the following steps: DsbA periplasmic extraction, hydrophobic interaction
chromatography, dialysis for buffer exchange and ion exchange chromatography.
A Pharmacia Biotech FPLC system composed of a LCC-501 Plus LKB
controller, two P500 pumps, a UV-M II optical unit, a FRAC 100 fraction collector and a
Rec 102 chart recorder was used for all chromatographic steps.
2. 1. 4. 1. DsbA periplasmic extraction
An osmotic shock when transferring cells from a high sucrose concentration to a
dilute MgSO4 solution in conjunction with a thermal shock by rapidly decreasing the
temperature from approximately 25 ºC (room temperature) to 4 ºC allows for liberation
of periplasmic proteins.
PROTOCOL:
Collect cells by centrifugation at 7000 rpm for 5 minutes at 4 ºC.
Add 1/40th the volume of the initial culture volume of 30 mM Tris-HCl at pH 8
and gently ressuspend pellet, on ice, with a Pasteur pipette.
Add 1/40th the volume of initial culture volume of 2×PEB and mix by gentle
inversion. (2×PEB is composed of 30 mM Tris-HCl at pH8, 40 % of sucrose and
2 mM EDTA)
Transfer to 40 mL centrifuge tubes and leave for 20 minutes at room
temperature.
Centrifuge at 14000 rpm for 30 minutes at 20 ºC and discard supernatant.
Immediately add 1/20th the volume of initial culture volume of cold 5 mM MgSO4
and mix well.
Leave tubes for 20 minutes on ice.
Centrifuge tubes at 14000 rpm for 40 minutes at 4 ºC.
Retain supernatant.
24
Add 0.1 mM calcium and 5 -10 units of DNase (Fermentas®) and incubate for 10
minutes at room temperature.
Store at 4 ºC.
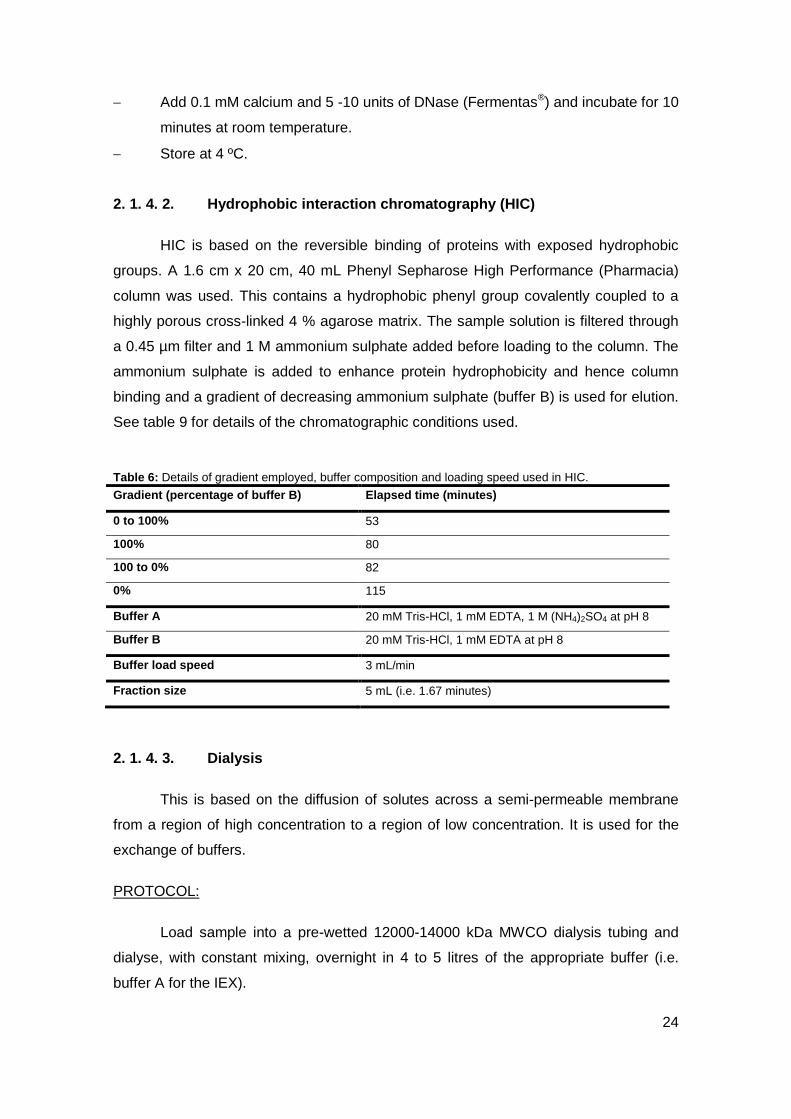
2. 1. 4. 2. Hydrophobic interaction chromatography (HIC)
HIC is based on the reversible binding of proteins with exposed hydrophobic
groups. A 1.6 cm x 20 cm, 40 mL Phenyl Sepharose High Performance (Pharmacia)
column was used. This contains a hydrophobic phenyl group covalently coupled to a
highly porous cross-linked 4 % agarose matrix. The sample solution is filtered through
a 0.45 µm filter and 1 M ammonium sulphate added before loading to the column. The
ammonium sulphate is added to enhance protein hydrophobicity and hence column
binding and a gradient of decreasing ammonium sulphate (buffer B) is used for elution.
See table 9 for details of the chromatographic conditions used.
Table 6: Details of gradient employed, buffer composition and loading speed used in HIC.
Gradient (percentage of buffer B) Elapsed time (minutes)
0 to 100% 53
100% 80
100 to 0% 82
0% 115
Buffer A 20 mM Tris-HCl, 1 mM EDTA, 1 M (NH4)2SO4 at pH 8
Buffer B 20 mM Tris-HCl, 1 mM EDTA at pH 8
Buffer load speed 3 mL/min
Fraction size 5 mL (i.e. 1.67 minutes)
2. 1. 4. 3. Dialysis
This is based on the diffusion of solutes across a semi-permeable membrane
from a region of high concentration to a region of low concentration. It is used for the
exchange of buffers.
PROTOCOL:
Load sample into a pre-wetted 12000-14000 kDa MWCO dialysis tubing and
dialyse, with constant mixing, overnight in 4 to 5 litres of the appropriate buffer (i.e.
buffer A for the IEX).

25
2. 1. 4. 4. Ion exchange chromatography (IEX)
Ion-exchange chromatography separates proteins based on their charge. A
1.6 cm x 20 cm, 40 mL DEAE Fast Flow Sepharose (Pharmacia) column was used.
This anion exchanger contains the positively charged reactive group
diethylaminoethanol (DEAE) covalently linked to a sepharose (a polysaccharide
polymer) matrix. A gradient of increasing NaCl concentration (buffer B) is used for
protein elution.
In the present study the pH of the equilibration buffer used was optimised to
maximise DsbA binding: pH 7.2, 7.5 and 8.0 were investigated.
Table 7: Details of the gradient employed, buffer composition and running speed used in IEX.
Gradient (percentage of buffer B) Elapsed time (minutes)
0 to 50% 56
50 to 100% 59
100% 79
100 to 0% 81
0% 105
Buffer A 10 mM MOPS, 1 mM EDTA tested at pH 7.2; 7.5 and 8.
Buffer B 10 mM MOPS, 1 mM EDTA, 1 M NaCl tested at pH 7.2;
7.5 and 8.
Buffer load speed 5 mL/min
Fraction size 5 mL (i.e. 1 minute)
2. 1. 5. DsbA reducing activity assay
DsbA reducing activity was confirmed according to a procedure described by
Arne Holmgren in 1979. This assay is based on the reduction of insulin disulphide
bonds by DsbA under the conditions used and measuring the resultant insulin
precipitation by monitoring the increase in absorbance at 650 nm. DTT is used to
recycle oxidised DsbA following catalysis.
The assay was used to monitor the purification process as well as to determine
the activity of wild-type and mutant DsbAs.

26
PROTOCOL (for insulin solution preparation at 10 mg/mL):
Add 50 mg of insulin to 4 mL of 0.05 M Tris-HCl at pH 8.
Add 1M HCl to adjust pH between a range of 2 or 3.
Immediately add 1M NaOH to adjust pH to 8.
Bring the volume to 5 mL with deionized water.
PROTOCOL:
Add a known concentration of DsbA to a 1 mL cuvette and add 2 mM EDTA,
0.75 mg/mL insulin and 20 mM MOPS at pH 7 to bring the final volume to 1 mL.
Mix gently by inversion and blank the spectrophotometer at 650 nm with this
solution
Add 0.33 mM DTT, mix by inversion.
Immediately monitor the change in A650nm over time. A Genesys 20 (R)
spectrophotometer from Thermo Spectronic (R) was used.
A negative control with all components except DsbA should also be monitored.
2. 1. 6. Sugar detection assay
Sugar detection was performed according to a protocol first described in 1956
by Dubois and collaborators (Dubois, et al., 1956). This is a quantitative and sensitive
colorimetric test where sulphuric acid in the presence of phenol is used for sugar
detection. The sugars are converted to hydroxymethylfufurals in the hot acidic
conditions and form a green product on interaction with phenol. Even small quantities
of sugars can be detected and quantified based on the direct relationship between the
enhancement of colour (A490nm) and the sugar quantity.
PROTOCOL:
To 1 mL of sample solution (in water) add 1 mL of a 5 % phenol solution.
Add 5 mL of 96 % sulphuric acid to each tube and mix well.
Leave 10 minutes at room temperature, mix and place in a water bath at 25 to
30 ºC for 20 minutes.
Blank spectrophotometer with water.
Read absorbance at 490 nm.

27
Calculate the amount of total carbohydrate using a standard curve prepared
using 0.02 – 0.1 mg/mL glucose.
All reactions were carried out in glass tubes in a laminar flow hood.
2. 1. 7. Bradford assay for protein quantification
The Bradford assay was used to calculate protein concentration
spectrophotometrically at 595 nm. This method is based on the reaction between the
NH3+ and possibly also the aromatic groups of amino-acids with the coomassie blue
reagent (Kruger, 2002). For this purpose a standard curve with known concentrations
of BSA was used.
Bradford Reagent: Dissolve 100 mg Coomassie Blue G-250 in 50 ml 95% ethanol, add
100 ml 85% (w/v) phosphoric acid to this solution and dilute the mixture with 850 mL of
water. Leave to agitate overnight and filter twice.
PROTOCOL:
Place 5 to 20 µL of sample solution in a 1 mL cuvette and bring to a final
volume of 100 µL with distilled water.
Add 1 mL of Bradford solution and mix immediately.
Leave at room temperature to allow reaction to develop for 10 minutes.
Blank spectrophotometer with the mixture without enzyme sample solution.
Read absorbance at 595 nm and calculate concentration from a standard curve
prepared with BSA concentrations of 5 to 500 µg/ml.
2. 1. 8. MUTANT CONSTRUCTION
In an attempt to better understand adaptation to temperature, structural
differences between DsbAs adapted to various temperatures were identified and a
number of mutants designed and prepared so as to investigate these differences. This
involved a number of steps.
Mutant selection: sequence and structure comparisons so as to identify
structural differences in DsbAs adapted to various temperatures.
Design of PCR primers for introduction of desired mutations.
28
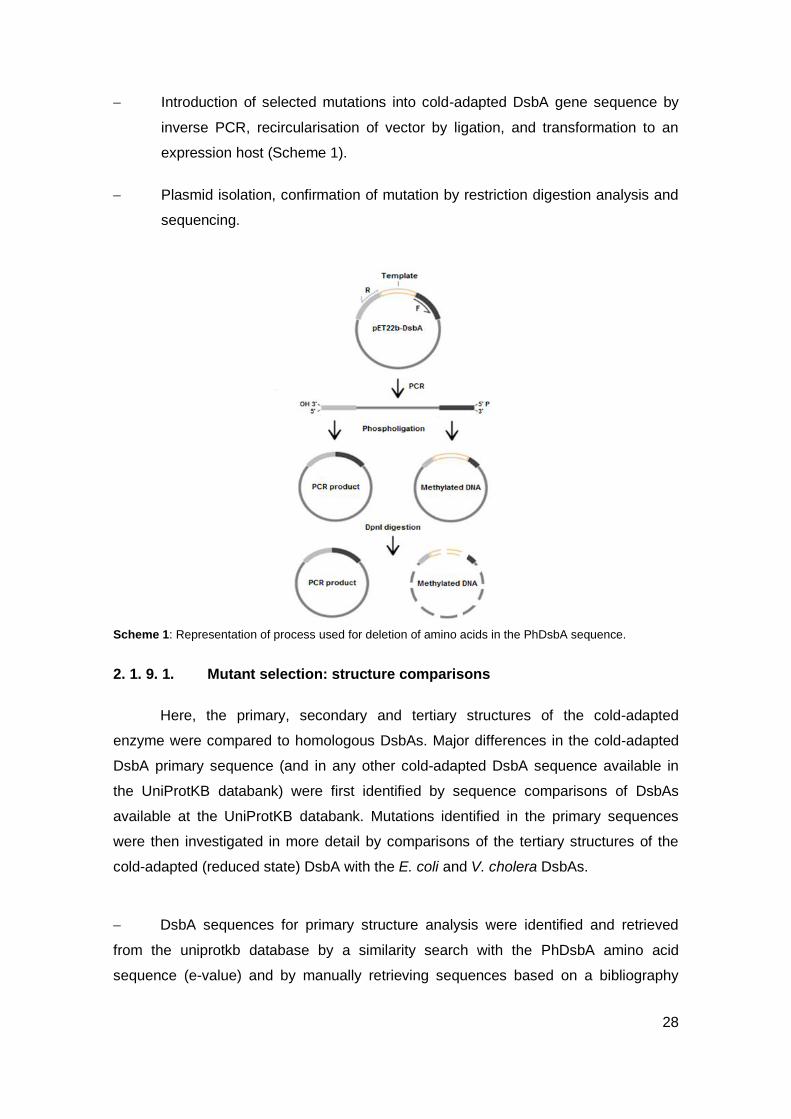
Introduction of selected mutations into cold-adapted DsbA gene sequence by
inverse PCR, recircularisation of vector by ligation, and transformation to an
expression host (Scheme 1).
Plasmid isolation, confirmation of mutation by restriction digestion analysis and
sequencing.
Scheme 1: Representation of process used for deletion of amino acids in the PhDsbA sequence.
2. 1. 9. 1. Mutant selection: structure comparisons
Here, the primary, secondary and tertiary structures of the cold-adapted
enzyme were compared to homologous DsbAs. Major differences in the cold-adapted
DsbA primary sequence (and in any other cold-adapted DsbA sequence available in
the UniProtKB databank) were first identified by sequence comparisons of DsbAs
available at the UniProtKB databank. Mutations identified in the primary sequences
were then investigated in more detail by comparisons of the tertiary structures of the
cold-adapted (reduced state) DsbA with the E. coli and V. cholera DsbAs.
DsbA sequences for primary structure analysis were identified and retrieved
from the uniprotkb database by a similarity search with the PhDsbA amino acid
sequence (e-value) and by manually retrieving sequences based on a bibliography

29
search. Cold-adapted and mesophilic sequences were identified among these by a
bibliography search.
Amino acid sequence comparisons were carried out with the basic local
alignment search tool (blast) available at the NCBI
(http://blast.ncbi.nlm.nih.gov/blast.cgi?page=proteins). The blastp 2.2.26 algorithm with
the Blosum62 (blocks of amino acid substitution matrix number 62) matrix was used
with default parameters.
2. 1. 9. 2. Design of PCR primers
Primers were designed so as to allow for introduction of the desired mutations
in the cold-adapted DNA sequence in pET22b(+) by inverse PCR. Fast PCR and
Primer3 were used for design and analysis of primers and the Finnzymes Tm calculator
(http://www.diagnostics.finnzymes.fi/tm_determination_old.html) was used for
annealing temperature calculation. This latter allows for calculation of the annealing
temperature when using polymerases such as the Phusion polymerase as the DNA
binding domain fused to this leads to a tighter binding and hence higher melting and
annealing temperatures. Complementarity of primers as calculated with the Fast PCR
program was taken into account in minimising dimer formation, this has a scoring range
from 0 (no propensity for formation) to 7 (high propensity). Primers of 20 to 30 bp with a
GC content of 40 to 60 % were chosen where possible, primer pairs with similar
melting temperatures were designed where possible.
2. 1. 9. 3. Site directed mutagenesis
Mutations were introduced on the circular DsbA-pET22b(+) template by inverse
PCR using the appropriate primers resulting in linearised mutated product (see
Scheme I). Phusion High-Fidelity DNA Polymerase (kindly provided by Professor Björn
Johansson) was used as this allows for high fidelity, highly processive replication of
large fragments. It consists of a novel Pyrococcus furiosus DNA polymerase fused to a
DNA binding domain. PCR was carried out with a 96 well PCR thermal cycler
(MyCycler from Bio-Rad®) and standard conditions were used as recommended by the
polymerase supplier and as described below (Table 8 and 9).

30
Table 8: Details of PCR mix.
Compound Concentration Volume added Final concentration in
total solution
dNTP mix 10 mM 1 µL 0.2 mM
Ultra-pure H2O 35 µL
Phusion HF Buffer 5× 10 µL 1×
Template 33 ng/µL 0.5 µL 16.5 ng
Reverse Primer 20 µM 1.25 µL 0.5 µM
Forward Primer 20 µM 1.25 µL 0.5 µM
Phusion HF DNA
polymerase
(Finnzymes)
2000 units/mL 1 µL 2 units
Total volume 50 µL
Table 9: PCR cycle details
As already mentioned, the annealing temperature was calculated according to
the Finnzymes online calculator. To ensure best results the Phusion HF DNA
polymerase supplier recommends using the lower Tm given by the calculator for
annealing when primers have less than 20 nucleotides. However, for primers greater
than 20 nucleotides it is recommended to use an annealing temperature 3 ºC higher
than the lower Tm given by the calculator program.
PCR step Temperature Time
Pre-denaturation 98 ºC 2 minutes
Denaturation 98 ºC 30 seconds
Annealing Calculated using Finnzymes Tm
calculator 20 seconds
Extension 72 ºC 2 minutes and 30
seconds
Final extension 72 ºC 10 minutes
4 ºC ∞
31
2. 1. 9. 4. Re-circularization of PCR product
Re-circularisation of DNA is carried out by use of a polynucleotide kinase (PNK)
that phosphorylates the 5’ phosphate and a ligase (T4 ligase) that links this to the 3’
hydroxyl group of the linear PCR product.
PROTOCOL:
To 18.5 µL of PCR product in an eppendorf tube add 2.5 µL of 10× ligase buffer
and 2 µL of T4 polynucleotide kinase (PNK) at 10 units/µL (both from
Fermentas®).
Leave 30 minutes at 37 ºC.
Add 2 µL of PNK (10 units/µL) and leave for 30 minutes at 37 ºC.
Add 2 µL of T4 ligase (Fermentas®) and leave at 37 ºC for 2 hours.
Following phospholigation the restriction digestion enzyme DpnI was added to
digest the methylated DNA of the template used in the PCR reaction. Buffer Tango
(final concentration 1×) and 10 units of DpnI per 10 µL of reaction mix were added and
incubated for 1 hour at 37 ºC (both the digestion enzyme and respective buffer are
from Fermentas®).
2. 1. 9. 5. Preparation of E. coli competent cells and transformation
E. coli BL21 (DE3) competent cells were prepared using a rapid procedure first
described in 1987 (Hanahan, 1983). In this procedure the transformation efficiency of
the cells is enhanced by using rubidium chloride. Some modifications were made to the
original protocol and the complete procedure utilized is described below.
PROTOCOL:
Inoculate 5 mL LB with a cfu of E. coli BL21 (DE3).
Grow over night at 37 ºC in an orbital incubator at 200 rpm.
Transfer 300 µL to a 2 L Erlenmeyer flask containing 400 mL LB and incubate in
an orbital incubator at 37 ºC, 200 rpm until an OD600 of 0.4 – 0.6 is reached.
Divide culture in 8 frozen 50 mL falcons.
Centrifuge for 5 minutes at 4500 rpm at 4 ºC
Discard supernatant
Ressuspend pellet in TEB1 solution (Table 10) with mixing.
32
Incubate tubes for 5 minutes on ice.
Centrifuge 5 minutes at 4500 rpm and 4 ºC.
Discard supernatant.
Add 20 mL of TEB2 solution (Table 10) to the first falcon, ressuspend, transfer
to the second falcon, ressuspend and so on until all pellets are ressuspended.
Incubate during 45 to 60 minutes on ice.
Distribute into eppendorfs, 100-200µL to each.
Store frozen at -80 ºC.
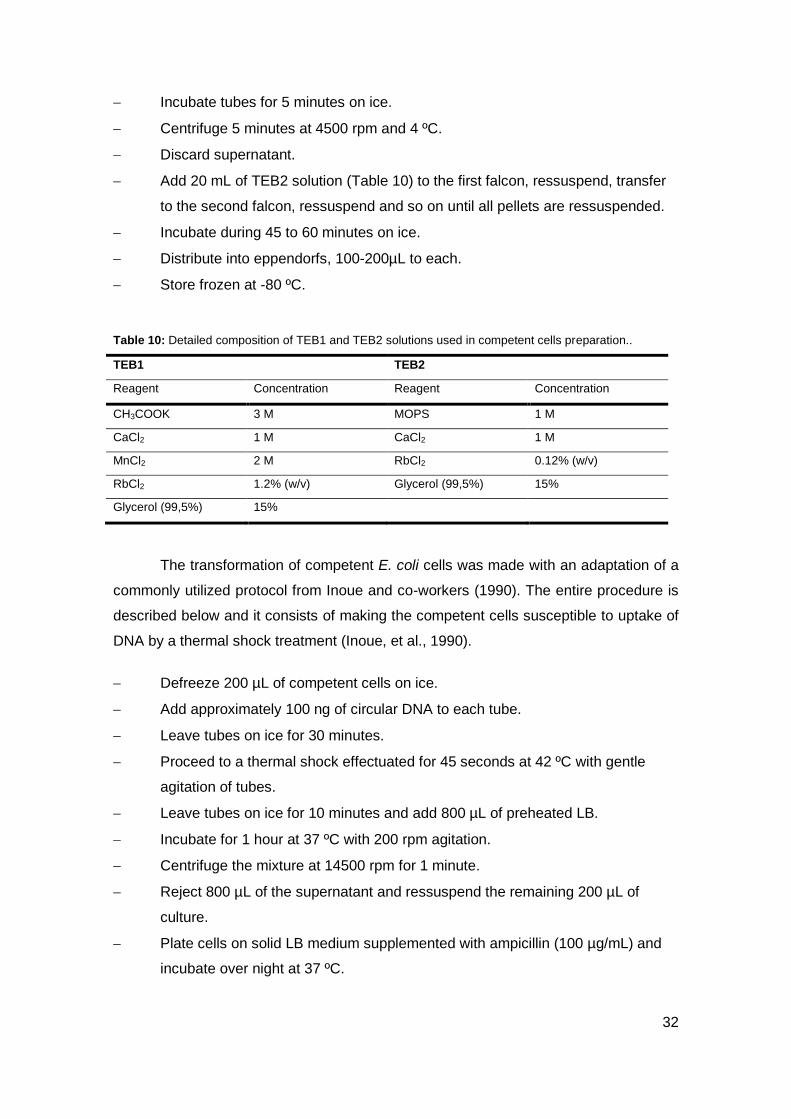
Table 10: Detailed composition of TEB1 and TEB2 solutions used in competent cells preparation..
TEB1 TEB2
Reagent Concentration Reagent Concentration
CH3COOK 3 M MOPS 1 M
CaCl2 1 M CaCl2 1 M
MnCl2 2 M RbCl2 0.12% (w/v)
RbCl2 1.2% (w/v) Glycerol (99,5%) 15%
Glycerol (99,5%) 15%
The transformation of competent E. coli cells was made with an adaptation of a
commonly utilized protocol from Inoue and co-workers (1990). The entire procedure is
described below and it consists of making the competent cells susceptible to uptake of
DNA by a thermal shock treatment (Inoue, et al., 1990).
Defreeze 200 µL of competent cells on ice.
Add approximately 100 ng of circular DNA to each tube.
Leave tubes on ice for 30 minutes.
Proceed to a thermal shock effectuated for 45 seconds at 42 ºC with gentle
agitation of tubes.
Leave tubes on ice for 10 minutes and add 800 µL of preheated LB.
Incubate for 1 hour at 37 ºC with 200 rpm agitation.
Centrifuge the mixture at 14500 rpm for 1 minute.
Reject 800 µL of the supernatant and ressuspend the remaining 200 µL of
culture.
Plate cells on solid LB medium supplemented with ampicillin (100 µg/mL) and
incubate over night at 37 ºC.
33
2. 1. 9. 6. Plasmid isolation
Plasmid isolation from Escherichia coli was carried out with the GenEluteTM
Plasmid miniprep kit (Sigma®). This kit provides a simple method based on the affinity
to silica of the smaller sized plasmids (as compared to the chromosomal DNA) of a cell
lysate for isolating plasmid DNA from recombinant E. coli cultures. Bacterial cells are
collected through centrifugation, exposed to an alkaline-SDS lysis solution and the
DNA adsorbed to silica in the presence of high salt concentrations. Thereafter,
contaminants are removed through a simple wash step and bound plasmid is eluted
using a solution of low salt concentration.
PROTOCOL:
Grow 6 mL of inoculated LB supplemented with 100 µg/mL of ampicillin over
night at 37 ºC in an orbital incubator agitating at 200 rpm.
Pass culture to 2 mL collection tubes centrifuge at 12000 × g for 5 minutes and
discard supernatant.
Ressuspend cells with 200 µL of the ressuspension solution (supplied with
RNase A) and pipette up and down or vortex the mixture.
Add 200 µL of the lysis solution and invert gently to mix. Allow to clear for less
than 5 minutes.
Add 350 µL of neutralization solution and invert tubes 4 to 6 times to mix.
Centrifuge tubes for 10 minutes at maximum speed and discard supernatant.
Prepare binding columns by adding 500 µL of the column preparation solution
supplied and centrifuge at 12000 × g for 1 minute.
Discard flow-through, transfer cleared lysate into binding columns and spin for
30 seconds to 1 minute. Discard flow-through.
Add 750 µL of wash solution supplemented with ethanol to columns and
centrifuge 30 seconds to 1 minute then discard flow-through.
Spin for 1 minute to remove residual ethanol.
Transfer column to new collection tube.
Add 50 µL of elution solution (ultrapure water) and spin for 1 minute.
DNA concentration was quantified using a NanoDrop ND-1000
spectrophotometer. Absorbances at 260 nm (for DNA quantification) and 280 nm (for
analysis of protein contamination) were determined.

34
2. 1. 9. 7. Mutation confirmation
So as to confirm a correct introduction of mutations the isolated plasmids were
subjected to restriction digestion analysis where possible. The software programs
Geneious and SerialCloner were employed for identification of restriction enzymes for
use in the mutation analysis.
PROTOCOL:
In an eppendorf tube join 10 µL of the DNA sample (plasmid isolate) with 2.5 µL
of ultra-pure water, 10 units of the appropriate enzyme and 1.5 µL of the
appropriate buffer (10×) for the enzyme used (buffer A from Roche® with EaeI
and buffer R from Fermentas® with BsuRI).
Leave for 3 hours at 37 ºC.
Digested DNA was run on a 2 % agarose gel using Loading Dye 6× Orange
(final concentration 1×) from Thermo Scientific to load samples and GeneRuler 1kb
DNA ladder Plus as a molecular weight marker. Results from gels were observed with
a UV transluminator.
Sequencing of the DsbA gene sequence of the selected clones was carried out
using the T7 forward primer by Eurofins MWG Operon so as to ensure correct
introduction of the desired mutations and absence of other mutations.

35
Chapter 3: results and discussion

36
3.1. PRODUCTION OPTIMIZATION
The objectives of this task were to maximise batch production of PhDsbA in
shake flasks at 20 ºC by optimising various process variables for non-induced and
induced cultures. In particular we examined 1) various rich media; 2) various liquid
volume to flask volume ratios so as to optimise aeration; 3) cultivation time (for non-
induced cultures); 4) elapsed fermentation time at induction (i.e. stage of growth when
induced); and 5) induction period (hours after induction). Both the biomass levels
(OD600nm) and target protein production levels (SDS-PAGE, Coomassie Blue staining)
were monitored.
3. 1. 1. Non-Induced PhDsbA Production Optimisation
Here both the medium and aeration conditions allowing for maximum biomass
and PhDsbA production by non-induced E. coli BL21(DE3)/pET22b(+)-PhDsbA
cultures in shake flasks were investigated and compared.
The 20 ºC growth curves for non-induced cultures in the media tested (i.e. LB,
TB and SB) at various levels of aeration (i.e. liquid volume to flask volume ratios of 1:3,
1:5, 1:10 and 1:20) are shown in Figure 9. It can be seen that highest biomass levels
were achieved with TB and SB, with growth rates increasing with higher levels of
aeration. Growth curves were generally similar for TB and SB but, interestingly, at the
highest liquid volume to flask volume ratio tested (1:20) TB was found to allow for a
significantly higher biomass production than TB and LB.

37
Figure 8: Comparisons of growth curves at 20 ºC for non-induced cultures in three different rich
media (LB, SB and TB) at four ratios of medium volume to flask volume i.e. 1:3 (A), 1:5 (B), 1:10 (C) and 1:20 (D). The green triangles represent growth in SB, the red squares characterize growth in TB and the blue diamonds denote the growth in LB.
SDS-PAGE was used to analyse PhDsbA production levels at various time
points throughout the non-induced cultures cultivations (every 2 hours until 28 hours of
growth) and Figure 10 shows the results for the time points of highest production (‘best
producers’) at each of the conditions tested. Interestingly, PhDsbA was found to start
accumulating during the mid-log phase even in the absence of induction, with
maximum production being observed in the stationary phase before a reduction in the
late stationary phase (not shown). Highest PhDsbAp production was obtained with TB
with a medium volume to flask volume ratio of 1:5.

38
Figure 9: 12% SDS- PAGE of cellular extracts from non-induced cultures under the various production
conditions tested. The time point of highest production is shown in each case i.e. samples taken during the stationary phase. A represents a medium to flask volume ratio of 1:3; B, a ratio of 1:5; C, a ratio of 1:10 and D a ratio of 1:20. The black boxes indicate the position of the bands corresponding to PhDsbA.
Figure 10 gives an overview of the quantitative comparison of biomass and
PhDsbA production levels for the ‘best PhDsbA producers’ under the various conditions
examined and Figure 11 and 12 show the variation of these when using TB, the
medium allowing for highest production.
Figure 10: Comparison of maximum biomass (black points) and PhDsbA (grey bars) production levels
obtained with the various media (LB, TB, SB) and aeration conditions (1:3, 1:5, 1:10, 1:20) examined. The PhDsbA production levels (grey bars) were compared using SDS-PAGE and ImageJ for quantification and are expressed as a percentage of the hignest production level observed. Maximum biomass levels attained (black points) are reported as the highest OD600nm observed during culturing.
0
2
4
6
8
10
12
0
20
40
60
80
100
120
Max
imu
m O
D 6
00
nm
Ph
Dsb
A P
rod
uct
ion
: P
erc
en
tage
of
max
imu
m

39
.
Figure 11: Comparison of maximum OD600nm observed with non-induced TB cultures under the various
medium volume to flask volume ratios tested.
Figure 12: Comparison of maximum PhDsbA production levels observed with various medium volume to
flask volume ratios for non-induced TB cultures.
It can be seen that while increased aeration allows for improved biomass levels,
highest PhDsbA production with the non-induced TB culture is attained at a reduced
medium volume to flask volume ratio.
3. 1. 2. Induced PhDsbA Production Optimisation
Having examined production under non-induced conditions we then
investigated production upon induction with 1 mM IPTG. Here various media, levels of
aeration and the induction time and period were investigated. Inductions times were at
0 hours, 12 hours (early log phase), 16 hours (late log), 24 hours (stationary) and 28
hours (late stationary phase) of elapsed fermentation time and samples were collected
after 2, 4, 6 and 12 hours of an induction period.
0
2
4
6
8
10
12
TB 1:3 TB 1:5 TB 1:10 TB 1:20
Max
imu
m O
D 6
00
nm
0
20
40
60
80
100
120
TB 1:3 TB 1:5 TB 1:10 TB 1:20
Pe
rce
nta
ge o
f m
axim
um
p
rod
uct
ion

40
Figure 13 gives examples of some of the results for the SDS-PAGE analyses
while Figure 14 gives a comparative overview of the principal results obtained. In all
cases the ‘best producing’ conditions are shown, corresponding to 4 to 6 hours after
induction.
Figure 13: 12% SDS-PAGE analysis of induced cultures. The band corresponding to PhDsbA is indicated
within the black boxes.
Figure 14: Comparison of maximum PhDsbA production (bars) and maximum OD600nm (black squares)
upon induction at distinct cultivation times with the various cultivation conditions shown in Figure 14.
0
2
4
6
8
10
12
0
20
40
60
80
100
120
OD
60
0 n
m
Per
cen
tage
of
max
imu
m p
rod
uct
ion

41
It can be seen that optimum PhDsbA production levels were obtained with TB
medium induced during the stationary phase of growth.
3. 1. 3. Induced versus Non-induced PhDsbA production
The optimised production conditions for induced and non-induced cultures were
compared and as can be seen from Figure 15 and 16 a slightly improved production
was obtained with the induced culture.
Figure 15: 12% SDS-PAGE comparison of optimised induced and non-induced PhDsbA productions. The
band corresponding to PhDsbA is indicated within the black box. Gels were stained with Coomassie Blue.
Figure 16: Comparison of relative levels of PhDsbA production with the optimised induced and non-
induced production conditions.
0
20
40
60
80
100
120
TB 1:5 induced at 28 h. TB 1:5 without induction
Pe
rce
nta
ge o
f m
axim
um
p
rod
uct
ion

42
3.2. PHDSBA PURIFICATION OPTIMIZATION
A purification protocol for PhDsbA was developed here. This involved
periplasmic extraction, HIC at pH 8.0 in the presence of ammonium sulphate and IEX
at pH 8.0.
3. 2. 1. Hydrophobic Interaction Chromatography (HIC)
HIC was carried out in the presence of 1 M ammonium sulphate at pH 8.0 with
elution being achieved with a gradient of decreasing ammonium sulphate
concentration. Figure 18 shows the chromatogram and SDS-PAGE analysis of
fractions indicated PhDsbA to elute in 0 % ammonium sulphate in a large peak
corresponding to fractions 32 to 50.
Figure 17: HIC chromatogram for purification of PhDsbA from the periplasmic extract. HIC was carried
with 10 mM MOPS buffer at pH 8.0 with a decreasing ammonium sulphate gradient for elution. The transparent blue square represents the fractions containing PhDsbA as determined by SDS-PAGE..
3. 2. 2. Ion Exchange Chromatography (IEX)
Previously, purification of PhDsbA involved IEX at pH 7.2 but we observed large
losses of the protein (approx. 40 %) in the void at this pH due to poor matrix binding.
Therefore we investigated various pHs in an attempt to improve protein recovery during
IEX.
0
0,2
0,4
0,6
0,8
1
1,2
0
0,2
0,4
0,6
0,8
1
1,2
1,4
1,6
0 10 20 30 40 50 60
(NH
4) 2
SO4
con
cen
trat
ion
(M
) __
Ab
s 2
80
nm
__
Fraction number
HIC elution profile for PhDsbA
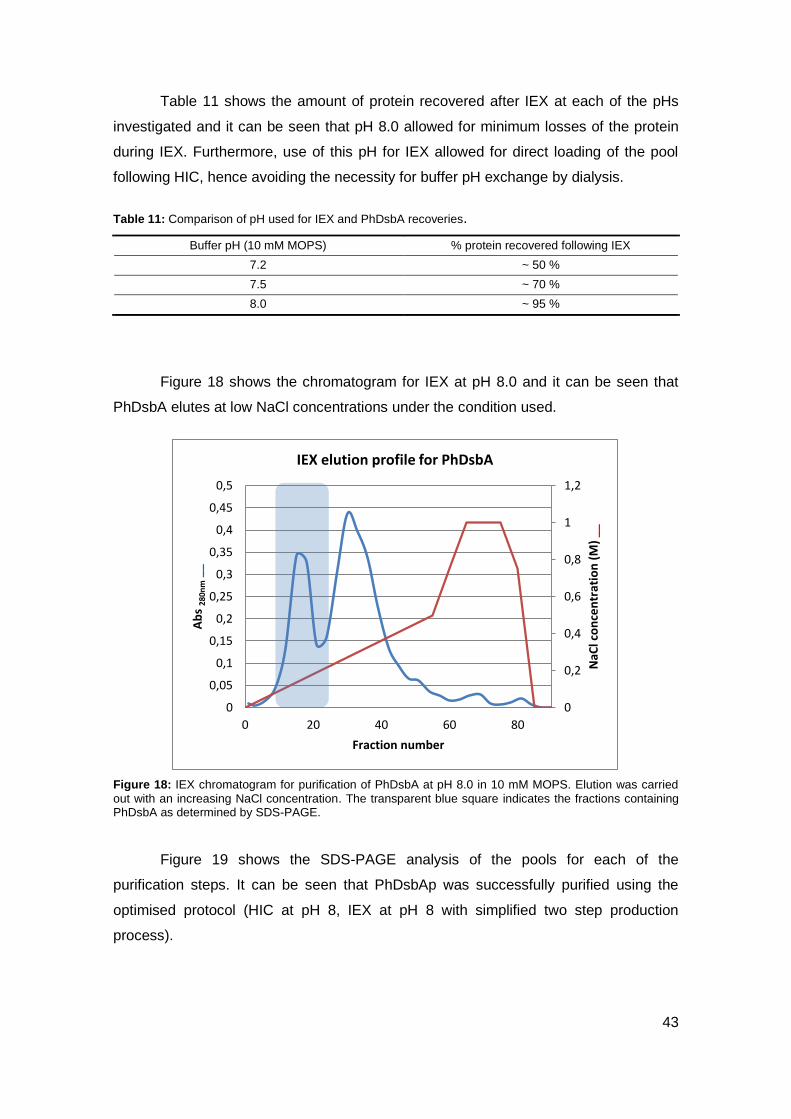
43
Table 11 shows the amount of protein recovered after IEX at each of the pHs
investigated and it can be seen that pH 8.0 allowed for minimum losses of the protein
during IEX. Furthermore, use of this pH for IEX allowed for direct loading of the pool
following HIC, hence avoiding the necessity for buffer pH exchange by dialysis.
Table 11: Comparison of pH used for IEX and PhDsbA recoveries.
Buffer pH (10 mM MOPS) % protein recovered following IEX
7.2 ~ 50 %
7.5 ~ 70 %
8.0 ~ 95 %
Figure 18 shows the chromatogram for IEX at pH 8.0 and it can be seen that
PhDsbA elutes at low NaCl concentrations under the condition used.
Figure 18: IEX chromatogram for purification of PhDsbA at pH 8.0 in 10 mM MOPS. Elution was carried
out with an increasing NaCl concentration. The transparent blue square indicates the fractions containing PhDsbA as determined by SDS-PAGE.
Figure 19 shows the SDS-PAGE analysis of the pools for each of the
purification steps. It can be seen that PhDsbAp was successfully purified using the
optimised protocol (HIC at pH 8, IEX at pH 8 with simplified two step production
process).
0
0,2
0,4
0,6
0,8
1
1,2
0
0,05
0,1
0,15
0,2
0,25
0,3
0,35
0,4
0,45
0,5
0 20 40 60 80
NaC
l co
nce
ntr
atio
n (
M)
__
Ab
s 2
80
nm
__
Fraction number
IEX elution profile for PhDsbA
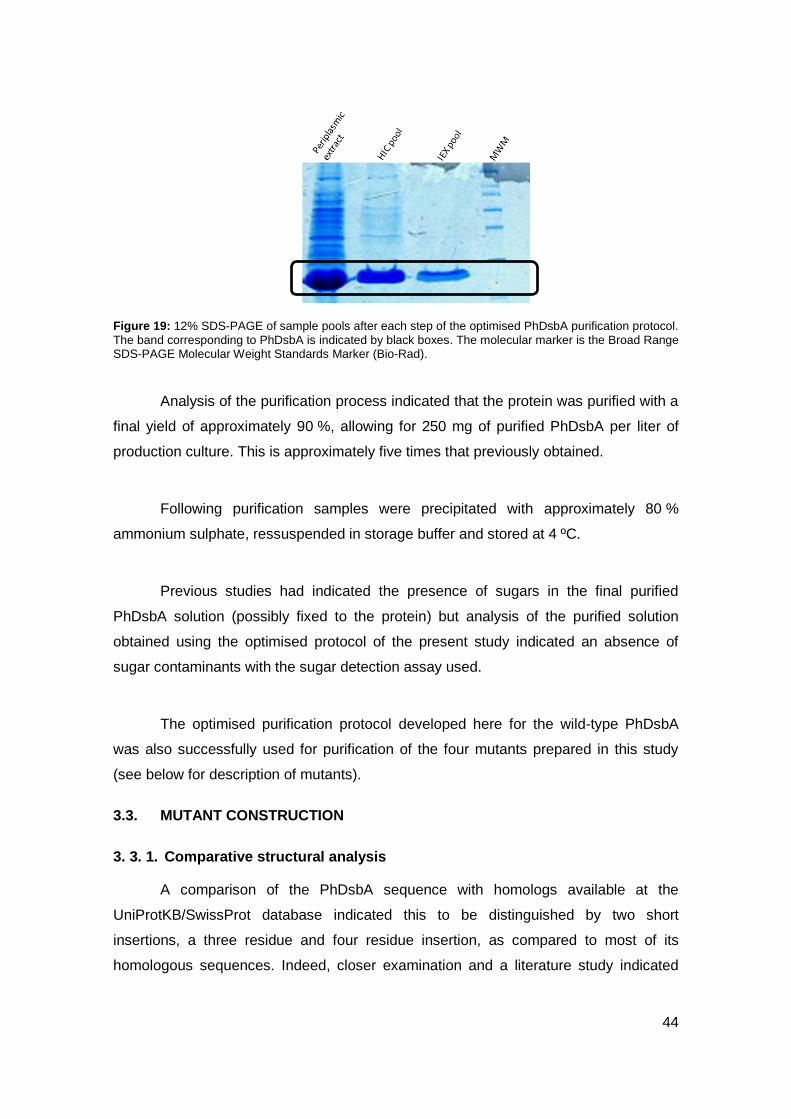
44
Figure 19: 12% SDS-PAGE of sample pools after each step of the optimised PhDsbA purification protocol.
The band corresponding to PhDsbA is indicated by black boxes. The molecular marker is the Broad Range SDS-PAGE Molecular Weight Standards Marker (Bio-Rad).
Analysis of the purification process indicated that the protein was purified with a
final yield of approximately 90 %, allowing for 250 mg of purified PhDsbA per liter of
production culture. This is approximately five times that previously obtained.
Following purification samples were precipitated with approximately 80 %
ammonium sulphate, ressuspended in storage buffer and stored at 4 ºC.
Previous studies had indicated the presence of sugars in the final purified
PhDsbA solution (possibly fixed to the protein) but analysis of the purified solution
obtained using the optimised protocol of the present study indicated an absence of
sugar contaminants with the sugar detection assay used.
The optimised purification protocol developed here for the wild-type PhDsbA
was also successfully used for purification of the four mutants prepared in this study
(see below for description of mutants).
3.3. MUTANT CONSTRUCTION
3. 3. 1. Comparative structural analysis
A comparison of the PhDsbA sequence with homologs available at the
UniProtKB/SwissProt database indicated this to be distinguished by two short
insertions, a three residue and four residue insertion, as compared to most of its
homologous sequences. Indeed, closer examination and a literature study indicated

45
that the observed insertions were only found in DsbA sequences isolated from
organisms inhabiting low temperature environments (i.e. marine
psychrophiles/psychrotrophs).
Figure 20: Partial sequence alignment of various DsbAs, represented here by their UniProt identifier
codes, showing a possible 3 amino acid insertion in ‘cold’ DsbAs. Codes shown with a blue background represent DsbAs identified in organism inhabiting low temperature environments and those shown with a green background are the mesophilic DsbAs. PhDsbA is represented here as Q6ZYL6. The blue stripe seen in the middle of the sequences represents a possible insertion site as observed with this alignment.
Figure 21: Partial sequence alignment of various DsbAs, represented here by their UniProt identifier
codes, showing a possible 4 amino acid insertion site in ‘cold’ DsbAs. Codes shown with a blue background represent DsbAs identified in organism inhabiting low temperature environments and those shown with a green background are the mesophilic DsbAs. PhDsbA is represented here as Q6ZYL6. The blue stripe seen in the middle of the sequences represents a possible insertion site as observed with this alignment.
Tertiary structure comparisons of PhDsbA with its mesophilic homologs (Figure
22 - 24 indicated these insertions to be located in an inter-domain loop (the 3 residue
insertion) and at the end of the long backbone α-helix (the 4 residue insertion).
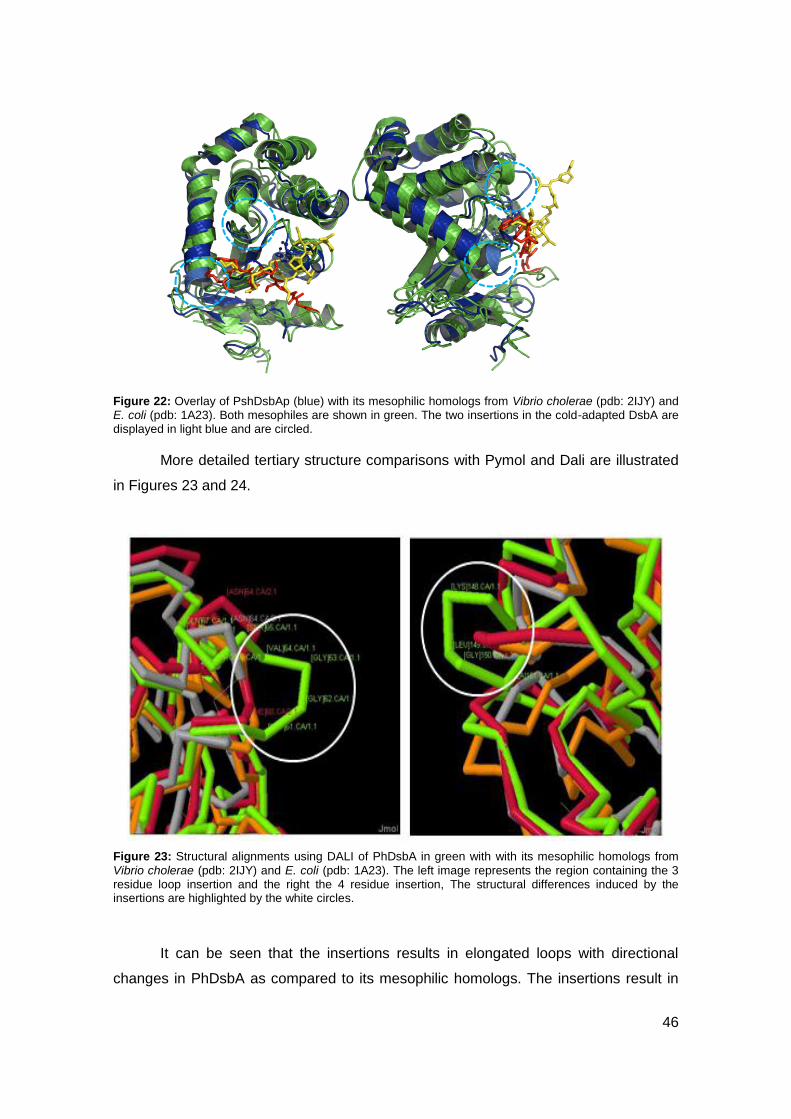
46
Figure 22: Overlay of PshDsbAp (blue) with its mesophilic homologs from Vibrio cholerae (pdb: 2IJY) and E. coli (pdb: 1A23). Both mesophiles are shown in green. The two insertions in the cold-adapted DsbA are displayed in light blue and are circled.
More detailed tertiary structure comparisons with Pymol and Dali are illustrated
in Figures 23 and 24.
Figure 23: Structural alignments using DALI of PhDsbA in green with with its mesophilic homologs from
Vibrio cholerae (pdb: 2IJY) and E. coli (pdb: 1A23). The left image represents the region containing the 3 residue loop insertion and the right the 4 residue insertion, The structural differences induced by the insertions are highlighted by the white circles.
It can be seen that the insertions results in elongated loops with directional
changes in PhDsbA as compared to its mesophilic homologs. The insertions result in
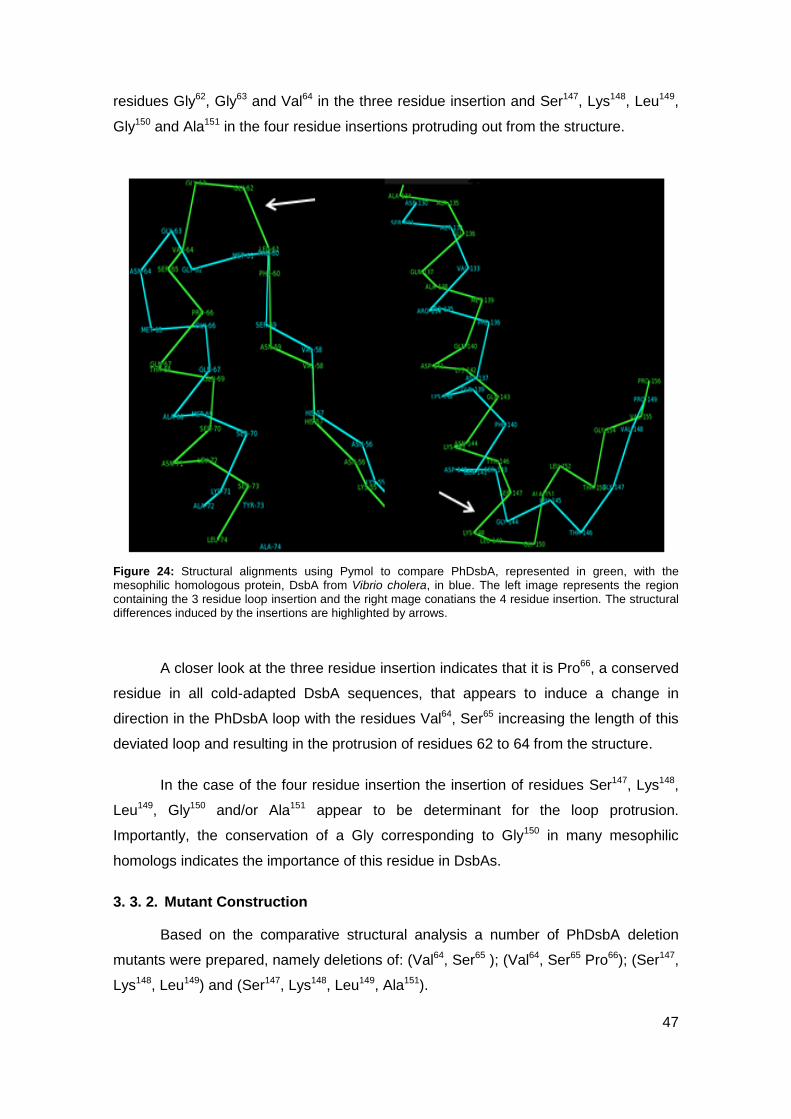
47
residues Gly62, Gly63 and Val64 in the three residue insertion and Ser147, Lys148, Leu149,
Gly150 and Ala151 in the four residue insertions protruding out from the structure.
Figure 24: Structural alignments using Pymol to compare PhDsbA, represented in green, with the mesophilic homologous protein, DsbA from Vibrio cholera, in blue. The left image represents the region containing the 3 residue loop insertion and the right mage conatians the 4 residue insertion. The structural differences induced by the insertions are highlighted by arrows.
A closer look at the three residue insertion indicates that it is Pro66, a conserved
residue in all cold-adapted DsbA sequences, that appears to induce a change in
direction in the PhDsbA loop with the residues Val64, Ser65 increasing the length of this
deviated loop and resulting in the protrusion of residues 62 to 64 from the structure.
In the case of the four residue insertion the insertion of residues Ser147, Lys148,
Leu149, Gly150 and/or Ala151 appear to be determinant for the loop protrusion.
Importantly, the conservation of a Gly corresponding to Gly150 in many mesophilic
homologs indicates the importance of this residue in DsbAs.
3. 3. 2. Mutant Construction
Based on the comparative structural analysis a number of PhDsbA deletion
mutants were prepared, namely deletions of: (Val64, Ser65 ); (Val64, Ser65 Pro66); (Ser147,
Lys148, Leu149) and (Ser147, Lys148, Leu149, Ala151).
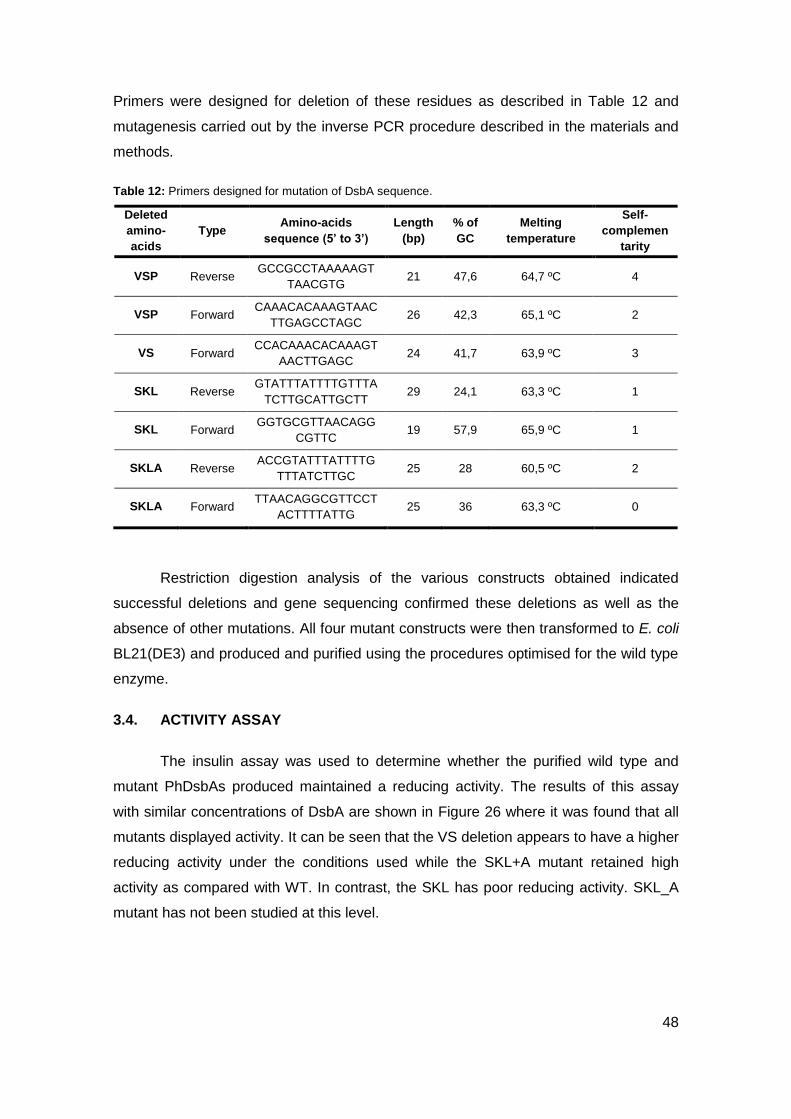
48
Primers were designed for deletion of these residues as described in Table 12 and
mutagenesis carried out by the inverse PCR procedure described in the materials and
methods.
Table 12: Primers designed for mutation of DsbA sequence.
Deleted
amino-
acids
Type Amino-acids
sequence (5’ to 3’)
Length
(bp)
% of
GC
Melting
temperature
Self-
complemen
tarity
VSP Reverse GCCGCCTAAAAAGT
TAACGTG 21 47,6 64,7 ºC 4
VSP Forward CAAACACAAAGTAAC
TTGAGCCTAGC 26 42,3 65,1 ºC 2
VS Forward CCACAAACACAAAGT
AACTTGAGC 24 41,7 63,9 ºC 3
SKL Reverse GTATTTATTTTGTTTA
TCTTGCATTGCTT 29 24,1 63,3 ºC 1
SKL Forward GGTGCGTTAACAGG
CGTTC 19 57,9 65,9 ºC 1
SKLA Reverse ACCGTATTTATTTTG
TTTATCTTGC 25 28 60,5 ºC 2
SKLA Forward TTAACAGGCGTTCCT
ACTTTTATTG 25 36 63,3 ºC 0
Restriction digestion analysis of the various constructs obtained indicated
successful deletions and gene sequencing confirmed these deletions as well as the
absence of other mutations. All four mutant constructs were then transformed to E. coli
BL21(DE3) and produced and purified using the procedures optimised for the wild type
enzyme.
3.4. ACTIVITY ASSAY
The insulin assay was used to determine whether the purified wild type and
mutant PhDsbAs produced maintained a reducing activity. The results of this assay
with similar concentrations of DsbA are shown in Figure 26 where it was found that all
mutants displayed activity. It can be seen that the VS deletion appears to have a higher
reducing activity under the conditions used while the SKL+A mutant retained high
activity as compared with WT. In contrast, the SKL has poor reducing activity. SKL_A
mutant has not been studied at this level.
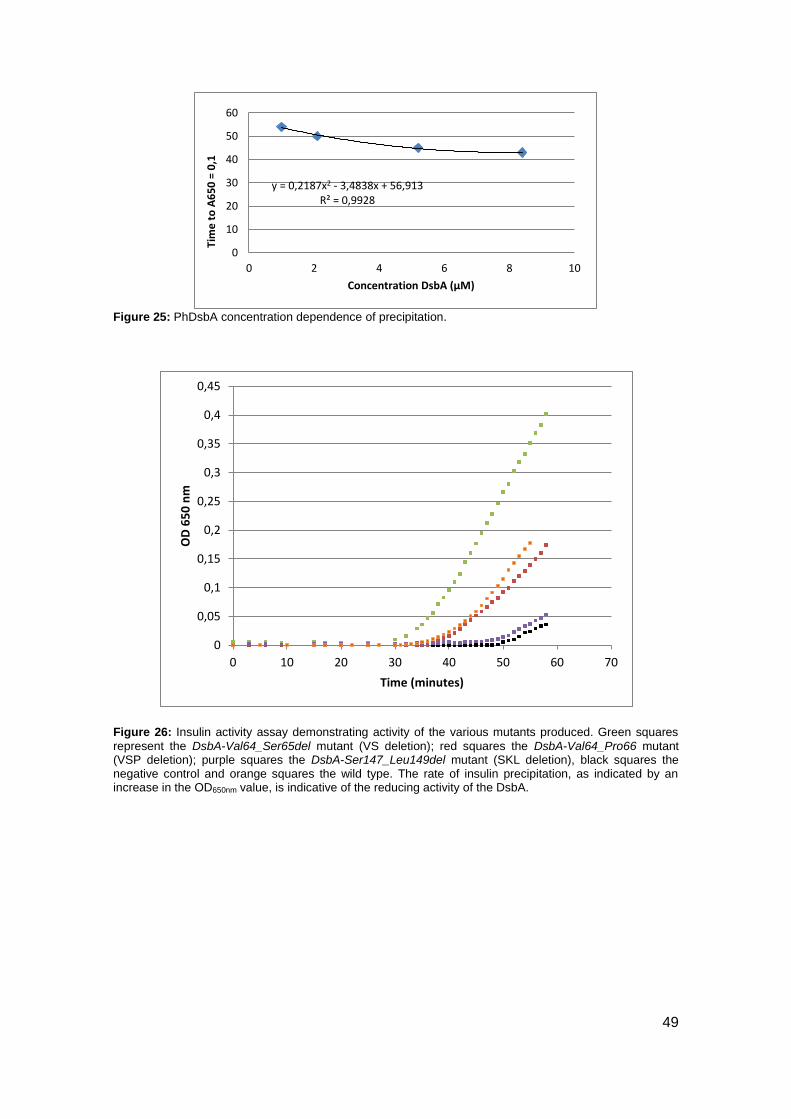
49
Figure 25: PhDsbA concentration dependence of precipitation.
Figure 26: Insulin activity assay demonstrating activity of the various mutants produced. Green squares
represent the DsbA-Val64_Ser65del mutant (VS deletion); red squares the DsbA-Val64_Pro66 mutant (VSP deletion); purple squares the DsbA-Ser147_Leu149del mutant (SKL deletion), black squares the negative control and orange squares the wild type. The rate of insulin precipitation, as indicated by an increase in the OD650nm value, is indicative of the reducing activity of the DsbA.
y = 0,2187x2 - 3,4838x + 56,913 R² = 0,9928
0
10
20
30
40
50
60
0 2 4 6 8 10
Tim
e t
o A
65
0 =
0,1
Concentration DsbA (µM)
0
0,05
0,1
0,15
0,2
0,25
0,3
0,35
0,4
0,45
0 10 20 30 40 50 60 70
OD
65
0 n
m
Time (minutes)

50
Chapter 4: Final remarks and future
perspectives

51
DsbAs catalyse disulphide bond formation in newly synthesised proteins and
due to the importance of these covalent bonds in the structure, stability and activity of
many proteins they are of much fundamental and applied interest. Approximately 30%
of currently produced pharmaceutical proteins contain disulphide bonds and hence the
use of DsbAs as an aid in recombinant protein production has a strong potential. More
recently, their crucial role in the correct folding and functioning of virulence factors
produced by pathogenic bacteria has opened up a potential role in medicine and in
particular in the development of antimicrobial agents. In an attempt to better
understand DsbAs and their structure-function relationship and hence to develop their
potential in the above mentioned fields we have initiated a comparative study of DsbAs
adapted to various temperatures. We are using homologous cold-adapted and
mesophilic DsbAs as model enzymes as we believe that such a comparative study
would reveal much more information and better identify determinants of activity and
stability in DsbAs as compared to studies of individual enzymes.
As an initial part in our overall study of DsbAs, the present study is focused on
two main areas:
1) developing and optimising the production and purification protocols for a
recombinantly produced cold-adapted DsbA from Pseudoalteromonas
haloplanktis (PhDsbA).
2) identifying structural determinants of cold-adaptation and construction of a
number of mutants so as to allow for future studies investigating these.
In the first part of the study the production of the cold-adapted DsbA with the E.
coli BL21(DE3)/pET22b(+) expression system was investigated in shake flasks. Even
though this expression system is based on a controlled induction we nevertheless
obtained strong production even in the absence of added inducer. In fact this has
already been noted in the past by other groups (Collins, et al., 2013; Guda, et al., 1995;
Nair, et al., 2009) and has been attributed to low levels of lactose contamination in the
media used. While this was not examined here, it is possibly also the cause of the
‘uninduced’ production observed as complex unrefined media ingredients such as
yeast extract and tryptone peptone were used. As might be expected, maximum cell
growth was observed with the richer media TB and SB as compared to LB, with TB
showing the highest levels at the highest medium volume to flask volume ratios (i.e.
highest aeration rates) tested. Even though SB is a richer medium (higher
concentrations of yeast extract and tryptone peptone) the higher biomass levels

52
achieved with TB is probably a result of the buffered (phosphate buffer) and glycerol
supplemented nature of this. These reduce the negative effects of the co-products
produced (namely acetate) at the higher growth rates achieved when higher medium
volume to flask volume ratios are used (Collins et al, 2013). Finally, DsbA periplasmic
expression was found to increase with increasing aeration up to a medium volume to
flask volume ratio of 1:5 only, with a decreased production being noted thereafter. This
reduced yield of periplasmic protein is attributed to losses to the extracellular
environment at the higher medium volume to flask volume ratios tested and is probably
a result of a greater physical force on the cells under these conditions.
Similar results and conclusions to those observed with the ‘non-induced’
productions were obtained for the induced production optimisation study i.e. optimal
growth and production was obtained with TB with intermediate (1:5) medium volume to
flask volume ratios. Highest production was observed with induction during the
stationary phase of growth with at least 4 to 6 hours of induction. Typically recombinant
protein production is induced during the exponential phase of growth as it is believed
that this is when the transcription and translational machinery are most active
(Babaeipour, et al., 2007). Nevertheless, previous studies have demonstrated that
expression systems with ampicillin as the selection marker display a rapid loss of the
production plasmid immediately following induction and thereby drastically decreased
product formation following induction (Collins et al, 2013). This obviously diminishes
the effectiveness of early induction and long post induction times and indicates that
protein production levels with these systems are strongly dependent on cell density
before induction. The attainment of a high cell density before induction thus maximises
production levels as was seen in the present study.
A combination of hydrophobic interaction chromatography (HIC) and ion-
exchange chromatography (IEX) have been previously described for the purification of
mesophilic DsbAs from E. coli (Wunderlich & Glockshuber, 1993) and Vibrio cholera
(Horne et al, 2007) and hence this approach was investigated for the purification of the
homologous cold-adapted DsbA of this study. Following osmotic shock for extraction of
the periplasmic protein and addition of 1 M ammonium sulphate for improved column
binding, HIC with a decreasing ammonium sulphate concentration allowed for removal
of the majority of contaminating proteins. Initial attempts involving dialysis and anion
exchange chromatography at pH 7.2 resulted in losses of up to 50% of the protein of
interest in the void and hence higher pHs were investigated for improved column
53
binding. Anion exchange at a pH of 8.0 not only allowed for almost complete DsbA
recovery but also allowed for the direct loading of the HIC pool to the IEX column,
thereby avoiding the requirement for dialysis and hence simplifying the purification
procedure. Following this IEX step, sufficiently pure DsbA, as demonstrated by SDS-
PAGE analysis, was recovered with a yield of approximately 90%. Approximately
250 mg of purified DsbA per litre of production culture was obtained using the
optimised production and purification protocols developed in this study, this equating to
about 5 times that obtained during initial tests.
In the second part of the study an investigation into the structural determinants
of cold-adaptation in DsbAs was initiated. Sequence and structure alignments clearly
show the cold-adapted enzyme to be distinguished by two short insertions in regions
believed to be important in DsbA activity. An insertion of 3 residues occurs in an inter-
domain loop which is believed to be important in substrate binding and inter-domain
movement while the second insertion (4 residues) occurs at the interface of the C-
terminal end of a long backbone α-helix and at the start of a long loop believed to be
important in catalytic activity. It is possible to hypothesise that these insertions allow for
improved inter-domain movement, improved substrate binding and improved
movement of the loop important in enzyme activity and hence allow for the improved
flexibility required for activity at low temperatures. Interestingly, these insertions were
found to be conserved in all DsbAs isolated to date from low temperature environments
and hence points to a central role of these Insertions in temperature adaptation of
DsbAs. These loop regions are obviously important for DsbA activity and hence we
have designed and prepared a number of deletion mutants in which these insertions
were targeted. Four mutants were prepared, produced and purified and shown to be
active. Interestingly one of the mutants was found to have a higher reducing activity
than the wild-type enzyme under the conditions used while all others displayed a lower
reducing activity. Further, more in-depth studies are required to characterise these
mutants and compare them to their mesophilic and psychrophilic homologs in an
attempt to better understand their role. In particular, studies comparing both the
reducing and oxidising activities at various temperatures, most probably by HPLC
(Zapun et al, 1993), as well as comparative stability studies (DSC, CD, irreversible
inactivation) are required to obtain a better understanding of the effects of the
mutations and to better characterise structure-function relationships in DsbAs. The
information gained could enable a better design of DsbA inhibitors in the future,
possibly even targeting the loop regions identified in this study. Finally, it is suggested

54
that in the future the cold-adapted enzyme be investigated for use in cell free protein
production systems as the expected high activity of this enzyme should offer
advantages over currently used mesophilic DsbAs.

55
Bibliography

56
Alexeeva, S., Hellingwerf, K. & Teixeira de Mattos, M., 2002. Quantitative
Assessment of Oxygen Availability: Perceived Aerobiosis and Its Effect on Flux
Distribution in the Respiratory Chain of Escherichia coli. Journal of bacteriology,
Volume 184, pp. 1402-1406.
Amersham Biosciences, 2002. Ion exchange chromatography. s.l.:s.n.
Amersham Pharmacia Biotech, 2000. Hydrophobic interaction chromatography.
s.l.:s.n.
Antonio-Pérez, A., Ramón-Luing, L. A. & Ortega-López, J., 2012.
Chromatographic refolding of rhodanese and lysozyme assisted by the GroEL apical
domain, DsbA and DsbC immobilized on cellulose.. Journal of chromatography A,
Volume 1248, pp. 122-129.
Babaeipour, V. et al., 2007. A proposed feeding strategy for the overproduction
of recombinant proteins in Escherichia coli. Biotechnology and Applied Biochemistry.
Bardwell, J., McGovern, K. & Beckwith, J., 1991. Identification of a protein
required for disulfide bond formation in vivo. Cell, Volume 67, pp. 581-589.
Bell, P., 2001. E. coli expression systems. In: Molecular Biology Problem
Solver: A Laboratory Guide. s.l.:Wiley-Liss, Inc., pp. 461-490.
Bentahir, M. et al., 2000. Structural, Kinetic, and Calorimetric Characterization
of the Cold-active Phosphoglycerate Kinase from the Antarctic Pseudomonas sp.
TACII18. The journal of biological chemistry, Volume 275, p. 11147–11153.
Boehr, D., Dyson, J. & Wright, P., 2006. An NMR Perspective on Enzyme
Dynamics. Chemical review, Volume 106, pp. 3055-3079.
Collet, J.-F. & Bardwell, J., 2002. Oxidative protein folding in bacteria. Molecular
microbiology, Volume 44, pp. 1-8.
Collins, T. et al., 2013. Batch production of a silk-elastin-like protein in E. coli
BL21(DE3): key parameters for optimisation. Microbial Cell Factories .
57
Collins, T. et al., 2010a. NMR Solution Structure of a Cold-Adapted Thiol-
Disulphide Oxidoreductase. s.l.:s.n.
Collins, T., Matzapetakis, M. & Santos, H., 2010b. Backbone and side chain 1H,
15N and 13C assignments for a thiol-disulphide oxidoreductase from the Antarctic
bacterium Pseudoalteromonas haloplanktis TAC125. Biomolecular NMR assignments,
Volume 4, pp. 151-154.
Collins, T., Meuwis, M.-A., Gerday, C. & Feller, G., 2003. Activity, Stability and
Flexibility in Glycosidases Adapted to Extreme Thermal Environments. Journal of
molecular biology, Volume 328, p. 419–428.
Daegelen, P. et al., 2009. Tracing Ancestors and Relatives of Escherichia coli
B, and the Derivation of B Strains REL606 and BL21(DE3). Journal of Molecular
Biology, pp. 634-643.
Dailey, F. E. & Berg, H. C., 1993. Mutants in disulphide bond formation that
disrupt flagellar assembly in Escherichia coli. Proceedings of the National Academy of
Sciences, Volume 90, pp. 1043-1047.
D'Amico, S. et al., 2002. Molecular basis of cold adaptation. Philosophical
transactions of the royal society, Volume 357, pp. 917-925.
D'Amico, S. et al., 2006. Psychrophilic microorganisms: challenges for life.
Embo reports, Volume 7, p. 385–389.
Daniell, H. et al., 1997. Hyperexpression of a synthetic protein-based polymer
gene. Methods in molecular biology , Volume 63, pp. 359-371.
Davail, S., Feller, G., Narinx, E. & Gerday, C., 1994. Cold Adaptation of
Proteins: purification, characterization, and sequence of the heat-labile subtilisin from
the antarctic psychrophile Bacillus TA41. The journal of biological chemistry, Volume
269, pp. 17448-17453.
Dubois, M. et al., 1956. Colorimetric Method for Determination of Sugars and
Related Substances. Analytical Chemistry, Volume 28, pp. 350-356.
58
Durand, E. et al., 2009. Structural biology of bacterial secretion systems in
gram-negative pathogens– potential for new drug targets. Infectious Disorders - Drug
Targets, Volume 9, pp. 518-547.
Dutton, R. et al., 2010. Inhibition of bacterial disulfide bond formation by the
anticoagulant warfarin. Proceedings of the National Academy of Sciences, Volume
107, pp. 297-301.
Fabianek, R., Hennecke, H. & Thöny-Meyer, L., 2000. Periplasmic protein
thiol:disulphide oxidoreductases of Escherichia coli. FEMS Microbiology reviews,
Volume 24, pp. 303-316.
Fabianek, R. H. H. & Thöny-Meyer, L., 2000. Periplasmic protein thiol:disul¢de
oxidoreductases of Escherichia coli. FEMS Microbiology reviews, Volume 24, pp. 303-
316.
Feller, G., 2007. Life at low temperatures: is disorder the driving force?.
Extremophiles, Volume 11, p. 211–216.
Feller, G., Arpigny, J.-L., Narinx, E. & Gerday, C., 1997. Molecular adaptations
of enzymes from psychrophilic organisms. Comparative Biochemistry and Physiology .
A, Volume 118, pp. 495-499.
Fields, P., 2001. Review: Protein function at thermal extremes: balancing
stability and flexibility. Comparative biochemistry and physiology, Volume 129, pp. 417-
431.
Fields, P. & Somero, G., 1998. Hot spots in cold adaptation: Localized
increases in conformational flexibility in lactate dehydrogenase A4 orthologs of
Antarctic notothenioid fishes. Proceedings of the National Academy of Sciences of
U.S.A., Volume 95, p. 11476–11481.
Früh, V. et al., 2010. Application of fragment-based drug discovery to
membrane proteins: identification of ligands of the integral membrane enzyme DsbB.
Chemistry and biology, Volume 17, pp. 881-891.
García-Arribas, O. et al., 2007. Thermodynamic stability of a cold-adapted
protein, type III antifreeze protein, and energetic contribution of salt bridges. Protein
science, Volume 16, pp. 227-238.

59
Georlette, D. et al., 2004. Some like it cold: biocatalysis at low temperatures.
Microbiological reviews, Volume 28, pp. 25-42.
Gerday, C. et al., 1997. Psychrophilic enzymes: a thermodynamic challenge.
Biochimica et biophysica acta, Volume 1342, p. 119–131.
Gerday, C. et al., 2000. Cold-adapted enzymes: from fundamentals to
biotechnology. Trens in Biotechnology, Volume 18, pp. 103-107.
Glazyrina, J. et al., 2010. High cell density cultivation and recombinant protein
production with Escherichia coli in a rocking-motion-type bioreactor. Microbial Cell
Factories.
Gruber, C. et al., 2006. Protein disulfide isomerase: the structure of oxidative
folding. Trends in biochemical sciences, Volume 31, pp. 455-464.
Guda, C. et al., 1995. Hyper expression of an environmentally friendly synthetic
polymer gene.. Biotechnol Lett .
Guddat, L. et al., 1997. Structural analysis of three His32 mutants of DsbA:
Support for an electrostatic role of His32 in DsbA stability. Protein Science, Volume 6,
pp. 1893-1900.
Hanahan, D., 1983. Studies on transformation of Escherichia coli with
plasmids.. Journal of molecular biology, pp. 557-580.
Hanahan, D., 1983. Studies on transformation of Escherichia coli with
plasmids.. Jornal of molecular biology, pp. 557-580.
Harrison, D. E. & Pirt, S. J., 1967. The influence of dissolved oxygen
concentration on the respiration and glucose metabolism of Klebsiella aerogenes
during growth. Journal of general microbiology, Volume 46, pp. 193-211.
Henikoff, S. & Henikoff, J., 1992. Amino acid substitution matrices from protein
blocks. Proceedings of the National Academy of Sciences, Volume 89, pp. 10915-
10919.
Heras, B. et al., 2009. DSB proteins and bacterial pathogenicity. Microbiology,
Volume 7, pp. 215-225.
60
Heras, B. et al., 2010. Structural and Functional Characterization of Three DsbA
Paralogues from Salmonella enterica Serovar Typhimurium. Journal of Biological
Chemistry, Volume 285, p. 18423–18432.
Holmgren, A., 1979. Thioredoxin Catalyzes the Reduction of Insulin Disulfides
by Dithiothreitol and Dihydrolipoamide. The journal of biological chemistry, Volume
254, pp. 9627-9632.
Horne, J. et al., 2007. Probing the Flexibility of the DsbA Oxidoreductase from
Vibrio cholerae—a 15N - 1H Heteronuclear NMR Relaxation Analysis of Oxidized and
Reduced Forms of DsbA. Journal of molecular biology, Volume 371, pp. 703-716.
Inaba, K. & Ito, K., 2002. Paradoxical redox properties of DsbB and DsbA in the
protein disulfide-introducing reaction cascade. European Molecular Biology
Organization Journal, Volume 21, pp. 2646-2654.
Inaba, K. & Ito, K., 2008. Structure and mechanisms of the DsbB-DsbA disulfide
bond generation machine. Biochimica et Biophysica acta, Volume 1783, pp. 520-529.
Inoue, H., Nojima, H. & Okamaya, H., 1990. High efficiency transformation of
Escherichia coli with plasmids. Gene, pp. 8-23.
Ito, K. & Inaba, K., 2008. The disulfide bond formation (Dsb) system. Current
Opinion in Structural Biology, Volume 18, p. 450–458.
Jeong, H. et al., 2009. Genome Sequences of Escherichia coli B strains
REL606 and BL21(DE3). Journal of molecular biology, Volume 394, pp. 644-652.
Khow, O. & Suntrarachun, S., 2012. Strategies for production of active
eukaryotic proteins in bacterial expression system. Asian Pacific Journal of Tropical
Biomedicine, pp. 159-162.
Kruger, N., 2002. The bradford method for protein quantification. In: The protein
protocols handbook. s.l.:Humana Press Inc., pp. 15-21.
Kuroita, T. et al., 2007. Functional similarities of a thermostable protein-disulfide
oxidoreductase identified in the archaeon Pyrococcus horikoshii to bacterial DsbA
enzymes. Extremophiles.
61
Lasica, A. & Jagusztyn-Krynicka, E., 2007. The role ofDsb proteins of Gram-
negative bacteria in the process of pathogenesis. FEMS Microbology review, Volume
31, pp. 626-636.
Lin, D., Rao, C. & Slauch, J., 2008. The Salmonella SPI1 type three secretion
system responds to periplasmic disulfide bond status via the flagellar apparatus and
the RcsCDB aystem. Journal of bacteriology, Volume 190, pp. 87-97.
Lonhienne, T., Gerday, C. & Feller, G., 2000. Psychrophilic enzymes: revisiting
the thermodynamic parameters of activation may explain local flexibility. Biochimica et
biophysica acta, Volume 1543, pp. 1-10.
Madonna, S. et al., 2006. The thiol-disulfide oxidoreductase system in the cold-
adapted bacterium Pseudoalteromonas haloplanktis TAC 125: discovery of a novel
disulfide oxidoreductase enzyme. Extremophiles, Volume 10, pp. 41-51.
Médigue, C. et al., 2005. Coping with cold: The genome of the versatile marine
Antarctica bacterium Pseudoalteromonas haloplanktis TAC125. Genome Research,
Volume 15, p. 1325–1335.
Miroux, B. & Walker, J., 1996. Over-production of Proteins in Escherichia coli:
Mutant Hosts that Allow Synthesis of some Membrane Proteins and Globular Proteins
at High Levels. Journal of Molecular Biology, Volume 260, pp. 289-298.
Mössner, E., Huber-Wunderlich, M. & Glockshuber, R., 1998. Characterization
of Escherichia coli thioredoxin variants mimicking the active-sites of other thiol/disulfide
oxidoreductases. Protein Science, Volume 7, pp. 1233-1244.
Nair, R. et al., 2009. Yeast extract mediated autoinduction of lacUV5 promoter:
an insight.. N Biotechnol .
Noguchi, A., Nishino, T. & Nakayama, T., 2009. Kinetic and thermodynamic
characterization of the cold activity acquired upon single amino-acid substitution near
the active site of a thermostable α-glucosidase. Journal of Molecular Catalysis B,
Volume 56, p. 300–306.
Novagen, 2003. pET system manual. s.l.:s.n.

62
Parrilli, E., Duilio, A. & Tutino, M., 2008. Heterologous protein expression in
psychrophilic hosts. s.l.:Springer.
Paxman, J. et al., 2009. The Structure of the Bacterial Oxidoreductase Enzyme
DsbA in Complex with a Peptide Reveals a Basis for Substrate Specificity in the
Catalytic Cycle of DsbA Enzymes. The journal of biological chemistry, Volume 284, p.
17835–17845.
Poleksic, A., 2009. Island method for estimating the statistical significance of
profile-profile alignment scores. BMC bioinformatics, pp. 100-112.
Reckenfelderbäumer, N. et al., 2000. Identification and Functional
Characterization of Thioredoxin from Trypanosoma brucei brucei. The journal of
biological chemistry, Volume 275, p. 7547–7552.
Ruddock, L., Hirst, T. & Freedman, R., 1996. pH-dependence of the dithiol-
oxidizing activity of DsbA (a periplasmic protein thiol : disulphide oxidoreductase) and
protein disulphide-isomerase : studies with a novel simple peptide substrate.
Biochemical journal, Volume 315, pp. 1001-1005.
Schirra, H. et al., 1998. Structure of Reduced DsbA from Escherichia coli in
Solution. Biochemistry, Volume 37, p. 6263–6276.
Shouldice, S. et al., 2011. Structure and function of DsbA, a key bacterial
oxidative folding catalyst. Antioxidants & redox signaling, Volume 14, pp. 1730-1752.
Siddiqui, K., Bokhari, S., Afzal, A. & Singh, S., 2004. A Novel Thermodynamic
Relationship Based on Kramers Theory for Studying Enzyme Kinetics under High
Viscosity. IUBMB Life, Volume 56, pp. 403-407.
Soini, J., Ukkonen, K. & Neubaeur, P., 2008. High cell density media for
Escherichia coli are generally designed for aerobic cultivations – consequences for
large-scale bioprocesses and shake flask cultures. Microbial Cell Factories.
Teulé, F. et al., 2009. A protocol for the production of recombinant spider silk-
like proteins for artificial fiber spinning. Nature protocols, Volume 4, pp. 341-355.
Tomatis, P. E. et al., 2008. Adaptive protein evolution grants organismal fitness
by improving catalysis and flexibility.. Chemical Biology, Volume 20605, pp. 105-152.
63
Uribe, S. & Sampedro, J., 2003. Measuring Solution Viscosity and its Effect on
Enzyme Activity. Biological Procedures Online, pp. 108-115.
Vivian, J. et al., 2009. Structure and Function of the Oxidoreductase DsbA1
from Neisseria meningitidis. Journal of Molecular Biology, Volume 394, p. 931–943.
Williams, M., Chalmers, D., Martin, J. & Scanlon, M., 2010. Backbone and side
chain 1H, 15N and 13C assignments for the oxidised and reduced forms of the
oxidoreductase protein DsbA from Staphylococcus aureus. Biomolecular NMR
Assignments , Volume 4, pp. 25-28.
Wunderlich, M. & Glockshuber, R., 1993. Redox properties of protein disulfide
isomerase (DsbA) from Escherichia coli.. Protein Sci.
Wu, X., Liu, N., He, Y. & Chen, Y., 2009. Cloning, expression, and
characterization of a novel diketoreductase from Acinetobacter baylyi. Acta Biochimica
et Biophysica Sinica, Volume 41, pp. 163-170.
Xu, Y., Feller, G., Gerday, C. & Glansdorff, N., 2003. Moritella cold-active
dihydrofolate reductase: are there natural limits of catalytic efficiency at low
temperature?. Journal of bacteriology, Volume 185, pp. 5519-5526.
Zapun, A., Bardwell, J. & Creighton, T., 1993. The reactive and destabilizing
disulphide bond of DsbA, a protein required for rotein disulphide bond formation in vivo.
Biochemistry, Volume 32, pp. 5083-5092.
Zapun, A., Cooper, L. & Creighton, T., 1994. Replacement of the Active-Site
Cysteine Residues of DsbA, a Protein Required for Disulfide Bond Formation in Vivo.
Biochemistry jornal, Volume 33, pp. 1907-1914.
Zecchinon, L. et al., 2001. Did psychrophilic enzymes really win the challenge?.
Extremophiles, Volume 5, p. 313–321.

![Barnstead Water Purification Systems [PT-BR]...USA/Canada +1 866 984 3766 Autres pays d’Asie +852 2885 4613 ... • Produz tanto água Tipo 1 como 2 ... de 12 L/hr • Produz tanto](https://img.document.onl/doc/110x75/601b56f78ef48d535a343d02/barnstead-water-purification-systems-pt-br-usacanada-1-866-984-3766-autres.jpg)