Embed Size (px)
Citation preview
A N N U A L R E V I E W 2 0 1 4
Fiscal Year Ended December 31, 2014
Tokyo Tatemono Co., Ltd.
010_0479001372704.indd 1 2015/05/19 21:38:58
MANAGEMENT REVIEW
Operating EnvironmentJapan’s economy in FY2014 continued to make a modest recovery buoyed by an improvement in corporate earnings. The corporate sector benefited from continued depreciation of the yen’s value and ongoing highs in the stock market, reflecting government economic policies and the Bank of Japan’s monetary easing measures. On the reverse side, after the implementation of the consumption tax hike, there was weakness in certain areas of private spending. In the real estate industry, the rental office market con-tinued to make a recovery. Vacancy rates in central Tokyo dropped another notch and the level of rent for some offices rose. In the residential housing market, although there were concerns, such as a sharp rise in construction costs, the contract rate remained steady, owing in part to a still-low interest rate. Meanwhile, the real estate investment market was brisk, including active property transactions owing to a favorable fundraising environment.
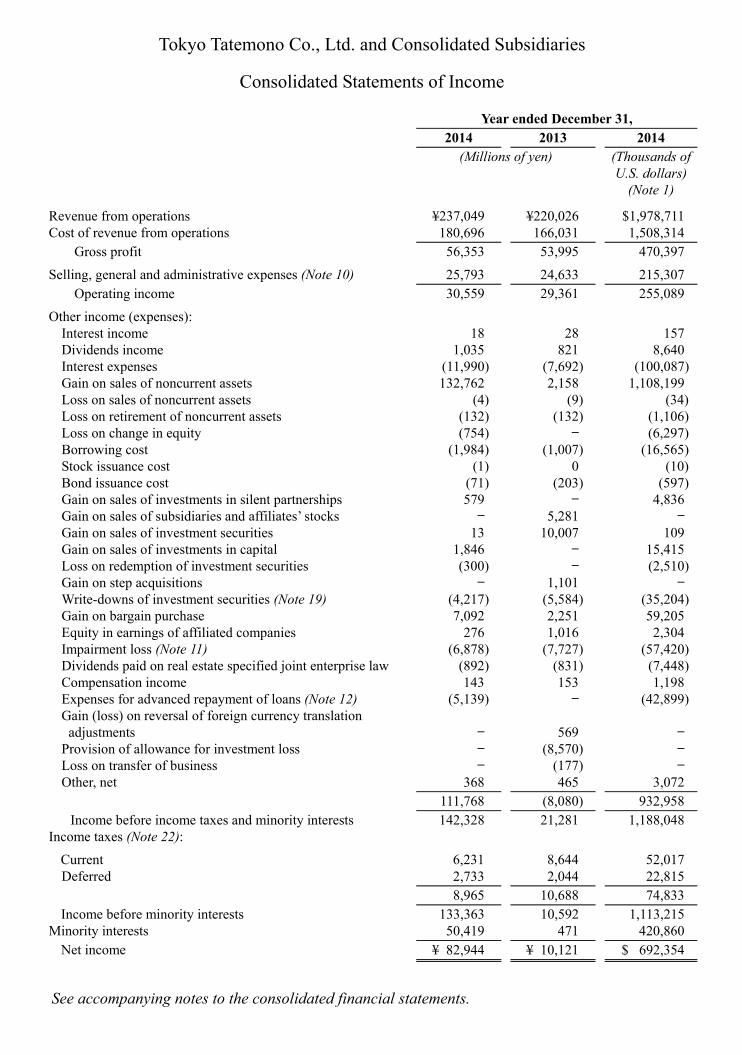
ResultsAmid this business environment, in the fiscal year under review Tokyo Tatemono attained year-on-year growth in revenues and operating income on a consolidated basis. Reflecting a substantial increase in leasing revenue in the Commercial Properties segment, owing to the conversion of the SPC into a consolidated subsidiary during the fiscal year, the Company posted revenue from operations of ¥237,049 million (US$ 1,978,711 thousand), a rise of 7.7% from ¥ 220,026 million in the previous year, and operating income of ¥30,559 million (US$ 255,089 thousand), a growth of 4.1% from ¥29,361 million in the previous year. Meanwhile, consolidated recurring income totaled ¥17,317 million (US$ 144,555 thousand), a decline of 21.1% from ¥21,959 million, due in part to an increase in financial cost associated with the conversion of the SPC into a consolidated subsidiary. However, net income was ¥82,944 million (US$ 692,354 thousand), an increase of 719.5% from ¥10,121 million in the previous year, reflecting a gain on the sale of fixed assets in the Commercial Properties segment owing to the partial sale of The Otemachi Tower (Chiyoda Ward, Tokyo) and Nakano Central Park (Nakano Ward, Tokyo).
OutlookThe Group has been striving to improve its business foundations to achieve further growth in the future by bolstering its earnings capabilities and financial strength through innovations centering on structural reforms focused on core competencies and the optimization of value chains
by promoting the Group medium-term business plan called “Restart - Challenging Innovation -” for fiscal 2012 to fiscal 2014. In Commercial Properties, the Group completed and operated large projects which it had been promoting for a long period of time, such as Otemachi Tower (Chiyoda Ward, Tokyo), Tokyo Square Garden (Chuo Ward, Tokyo) and Nakano Central Park (Nakano Ward, Tokyo), as planned and strengthened its asset portfolio. In Residence, the Group focused on business using its advanced expertise, as indicated by the realization of Japan’s largest rebuilding project in Tama New Town (Tama City, Tokyo), and embarked on a full-fledged approach to the senior business using M&A, etc. As a result, with respect to the quantitative targets for this plan, the consolidated D/E ratio achieved the target as we gave priority to the enhancement of our financial strength. However, we recognize that further bolstering our earnings capabilities is necessary as consolidated operating income fell below the target.
FoundationsIn the future in Japan, the sophistication and diversification of the demand level for soft and other services are expected, in addition to the declining population and the expanding senior market. In the real estate market, while an increase in the real estate stock market and the diversification of assets for investment in the real estate investment market are expected, rising land prices due to intensifying competition over site acquisition and continuously high construction costs are concerns. In this operating environment, the Group has formulated a new medium-term business plan called “Becoming the Tokyo Tatemono Group to be Selected Again Next Time - Providing Astonishing Value with Innovative Group Synergy-” for the five years from fiscal 2015 to fiscal 2019. To be selected again next time by customers, we will provide “appealing value which will astonish customers” by operating businesses that will pursue high-quality soft and other services, in addition to hardware quality, through the organic cooperation of the diverse businesses of the Group. As a quantitative target, we will aim to achieve consolidated operating income of ¥50 billion.
010_0479001372704.indd 1 2015/05/19 21:38:59
FINANCIAL REVIEW
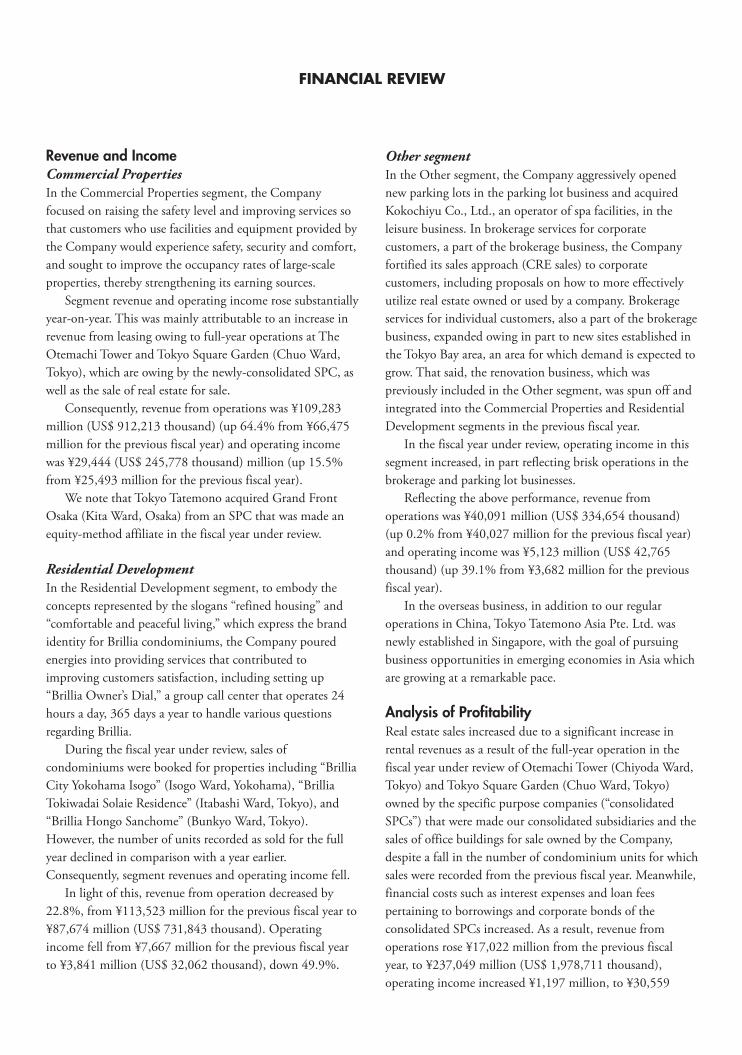
Revenue and IncomeCommercial PropertiesIn the Commercial Properties segment, the Company focused on raising the safety level and improving services so that customers who use facilities and equipment provided by the Company would experience safety, security and comfort, and sought to improve the occupancy rates of large-scale properties, thereby strengthening its earning sources. Segment revenue and operating income rose substantially year-on-year. This was mainly attributable to an increase in revenue from leasing owing to full-year operations at The Otemachi Tower and Tokyo Square Garden (Chuo Ward, Tokyo), which are owing by the newly-consolidated SPC, as well as the sale of real estate for sale. Consequently, revenue from operations was ¥109,283 million (US$ 912,213 thousand) (up 64.4% from ¥66,475 million for the previous fiscal year) and operating income was ¥29,444 (US$ 245,778 thousand) million (up 15.5% from ¥25,493 million for the previous fiscal year). We note that Tokyo Tatemono acquired Grand Front Osaka (Kita Ward, Osaka) from an SPC that was made an equity-method affiliate in the fiscal year under review.
Residential DevelopmentIn the Residential Development segment, to embody the concepts represented by the slogans “refined housing” and “comfortable and peaceful living,” which express the brand identity for Brillia condominiums, the Company poured energies into providing services that contributed to improving customers satisfaction, including setting up “Brillia Owner’s Dial,” a group call center that operates 24 hours a day, 365 days a year to handle various questions regarding Brillia. During the fiscal year under review, sales of condominiums were booked for properties including “Brillia City Yokohama Isogo” (Isogo Ward, Yokohama), “Brillia Tokiwadai Solaie Residence” (Itabashi Ward, Tokyo), and “Brillia Hongo Sanchome” (Bunkyo Ward, Tokyo). However, the number of units recorded as sold for the full year declined in comparison with a year earlier. Consequently, segment revenues and operating income fell. In light of this, revenue from operation decreased by 22.8%, from ¥113,523 million for the previous fiscal year to ¥87,674 million (US$ 731,843 thousand). Operating income fell from ¥7,667 million for the previous fiscal year to ¥3,841 million (US$ 32,062 thousand), down 49.9%.
Other segmentIn the Other segment, the Company aggressively opened new parking lots in the parking lot business and acquired Kokochiyu Co., Ltd., an operator of spa facilities, in the leisure business. In brokerage services for corporate customers, a part of the brokerage business, the Company fortified its sales approach (CRE sales) to corporate customers, including proposals on how to more effectively utilize real estate owned or used by a company. Brokerage services for individual customers, also a part of the brokerage business, expanded owing in part to new sites established in the Tokyo Bay area, an area for which demand is expected to grow. That said, the renovation business, which was previously included in the Other segment, was spun off and integrated into the Commercial Properties and Residential Development segments in the previous fiscal year. In the fiscal year under review, operating income in this segment increased, in part reflecting brisk operations in the brokerage and parking lot businesses. Reflecting the above performance, revenue from operations was ¥40,091 million (US$ 334,654 thousand) (up 0.2% from ¥40,027 million for the previous fiscal year) and operating income was ¥5,123 million (US$ 42,765 thousand) (up 39.1% from ¥3,682 million for the previous fiscal year). In the overseas business, in addition to our regular operations in China, Tokyo Tatemono Asia Pte. Ltd. was newly established in Singapore, with the goal of pursuing business opportunities in emerging economies in Asia which are growing at a remarkable pace.
Analysis of ProfitabilityReal estate sales increased due to a significant increase in rental revenues as a result of the full-year operation in the fiscal year under review of Otemachi Tower (Chiyoda Ward, Tokyo) and Tokyo Square Garden (Chuo Ward, Tokyo) owned by the specific purpose companies (“consolidated SPCs”) that were made our consolidated subsidiaries and the sales of office buildings for sale owned by the Company, despite a fall in the number of condominium units for which sales were recorded from the previous fiscal year. Meanwhile, financial costs such as interest expenses and loan fees pertaining to borrowings and corporate bonds of the consolidated SPCs increased. As a result, revenue from operations rose ¥17,022 million from the previous fiscal year, to ¥237,049 million (US$ 1,978,711 thousand), operating income increased ¥1,197 million, to ¥30,559
010_0479001372704.indd 2 2015/05/19 21:38:59
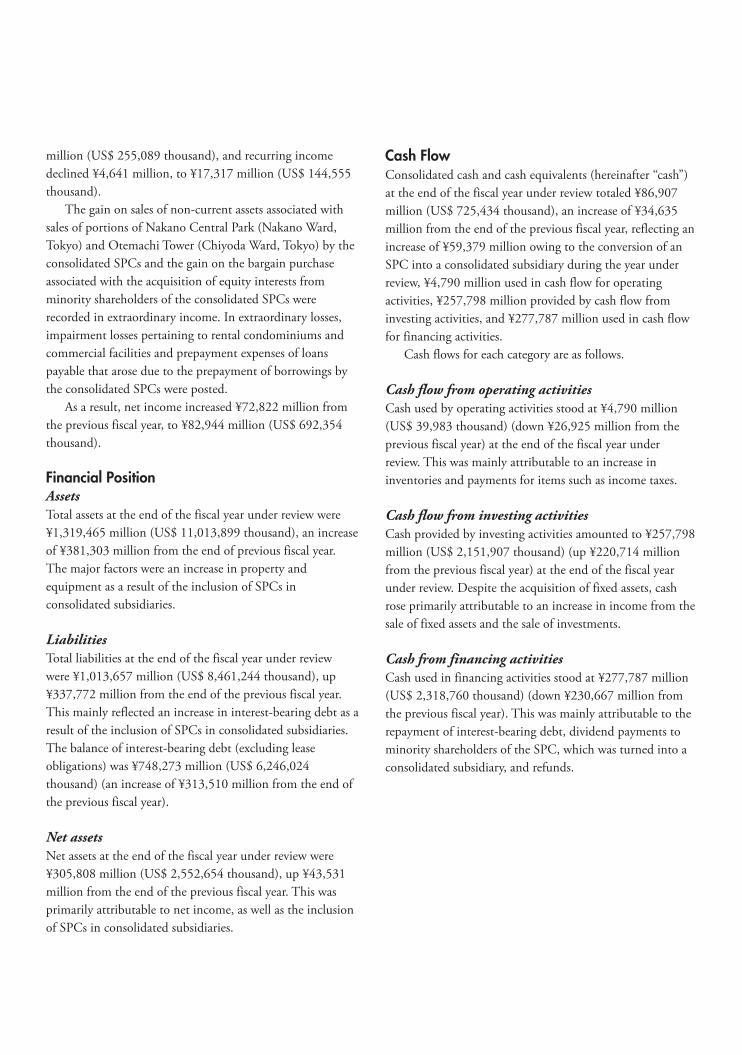
million (US$ 255,089 thousand), and recurring income declined ¥4,641 million, to ¥17,317 million (US$ 144,555 thousand). The gain on sales of non-current assets associated with sales of portions of Nakano Central Park (Nakano Ward, Tokyo) and Otemachi Tower (Chiyoda Ward, Tokyo) by the consolidated SPCs and the gain on the bargain purchase associated with the acquisition of equity interests from minority shareholders of the consolidated SPCs were recorded in extraordinary income. In extraordinary losses, impairment losses pertaining to rental condominiums and commercial facilities and prepayment expenses of loans payable that arose due to the prepayment of borrowings by the consolidated SPCs were posted. As a result, net income increased ¥72,822 million from the previous fiscal year, to ¥82,944 million (US$ 692,354 thousand).
Financial PositionAssetsTotal assets at the end of the fiscal year under review were ¥1,319,465 million (US$ 11,013,899 thousand), an increase of ¥381,303 million from the end of previous fiscal year. The major factors were an increase in property and equipment as a result of the inclusion of SPCs in consolidated subsidiaries.
LiabilitiesTotal liabilities at the end of the fiscal year under review were ¥1,013,657 million (US$ 8,461,244 thousand), up ¥337,772 million from the end of the previous fiscal year. This mainly reflected an increase in interest-bearing debt as a result of the inclusion of SPCs in consolidated subsidiaries. The balance of interest-bearing debt (excluding lease obligations) was ¥748,273 million (US$ 6,246,024 thousand) (an increase of ¥313,510 million from the end of the previous fiscal year).
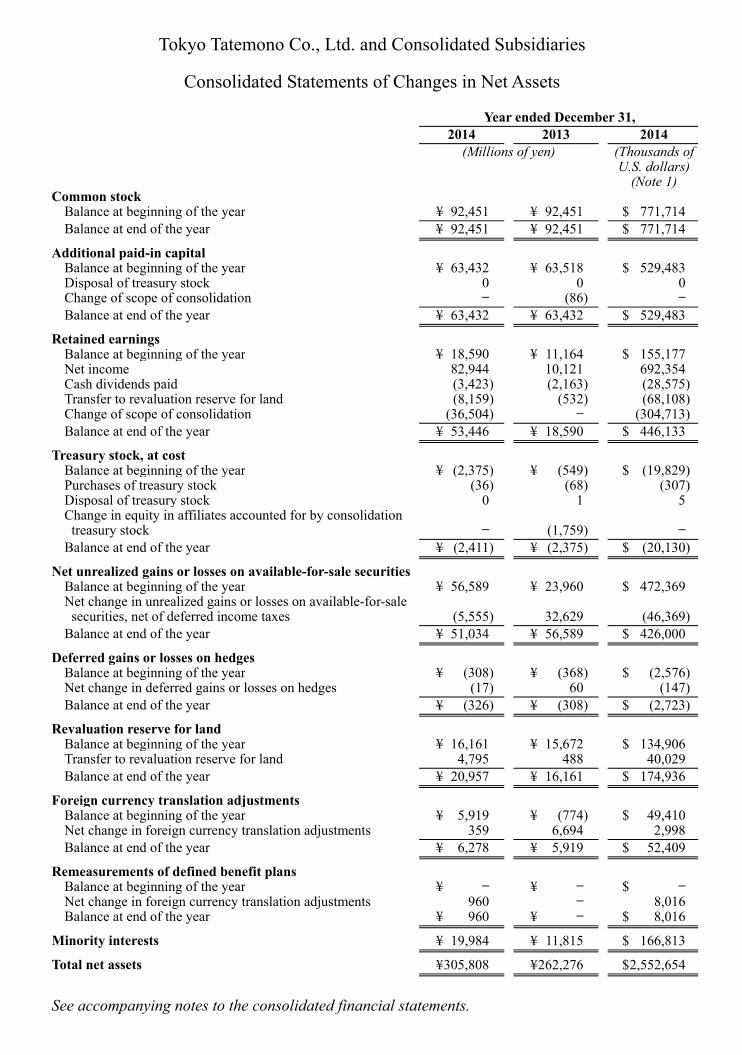
Net assetsNet assets at the end of the fiscal year under review were ¥305,808 million (US$ 2,552,654 thousand), up ¥43,531 million from the end of the previous fiscal year. This was primarily attributable to net income, as well as the inclusion of SPCs in consolidated subsidiaries.
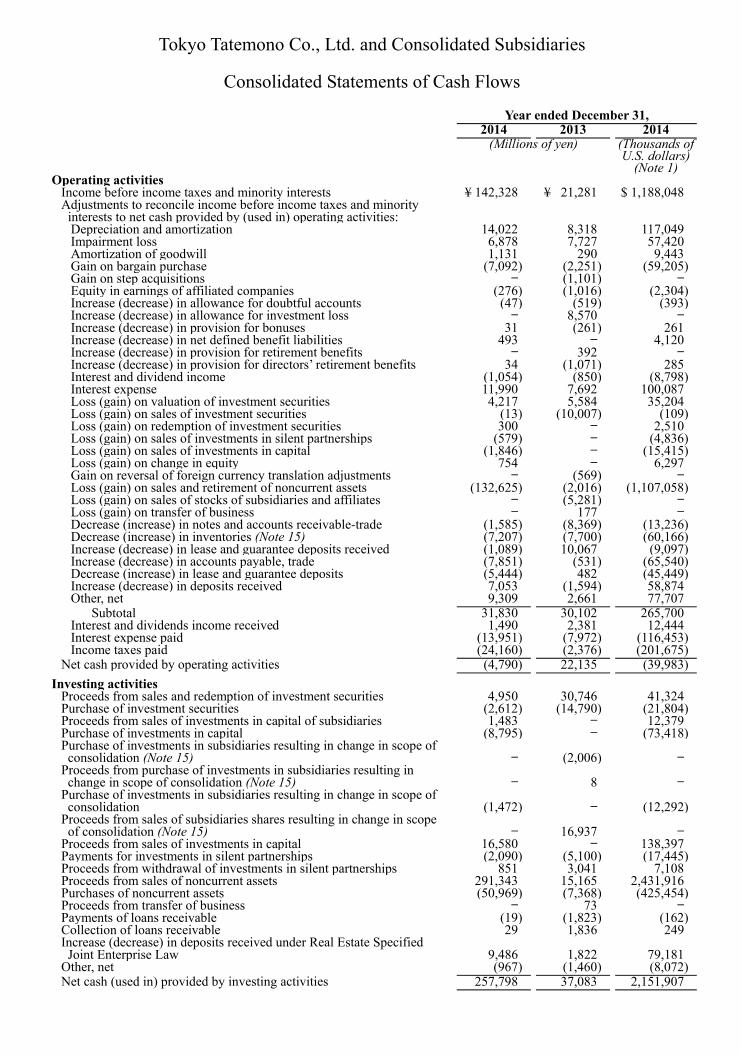
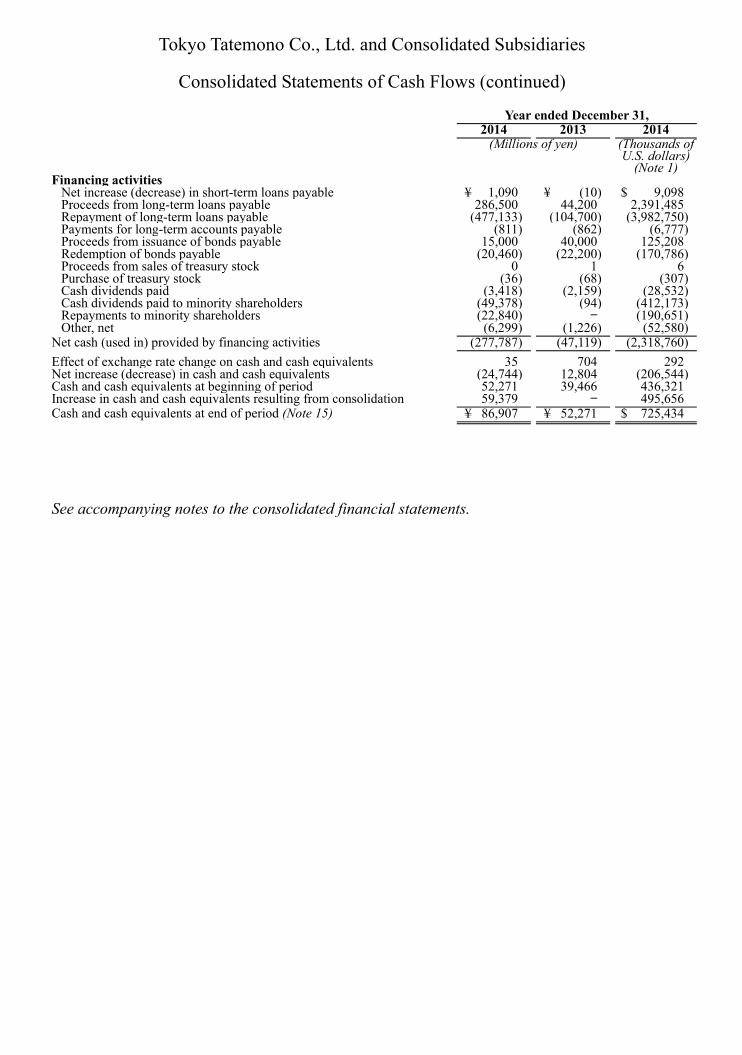
Cash FlowConsolidated cash and cash equivalents (hereinafter “cash”) at the end of the fiscal year under review totaled ¥86,907 million (US$ 725,434 thousand), an increase of ¥34,635 million from the end of the previous fiscal year, reflecting an increase of ¥59,379 million owing to the conversion of an SPC into a consolidated subsidiary during the year under review, ¥4,790 million used in cash flow for operating activities, ¥257,798 million provided by cash flow from investing activities, and ¥277,787 million used in cash flow for financing activities. Cash flows for each category are as follows.
Cash flow from operating activitiesCash used by operating activities stood at ¥4,790 million (US$ 39,983 thousand) (down ¥26,925 million from the previous fiscal year) at the end of the fiscal year under review. This was mainly attributable to an increase in inventories and payments for items such as income taxes.
Cash flow from investing activitiesCash provided by investing activities amounted to ¥257,798 million (US$ 2,151,907 thousand) (up ¥220,714 million from the previous fiscal year) at the end of the fiscal year under review. Despite the acquisition of fixed assets, cash rose primarily attributable to an increase in income from the sale of fixed assets and the sale of investments.
Cash from financing activitiesCash used in financing activities stood at ¥277,787 million (US$ 2,318,760 thousand) (down ¥230,667 million from the previous fiscal year). This was mainly attributable to the repayment of interest-bearing debt, dividend payments to minority shareholders of the SPC, which was turned into a consolidated subsidiary, and refunds.
010_0479001372704.indd 3 2015/05/19 21:38:59
2
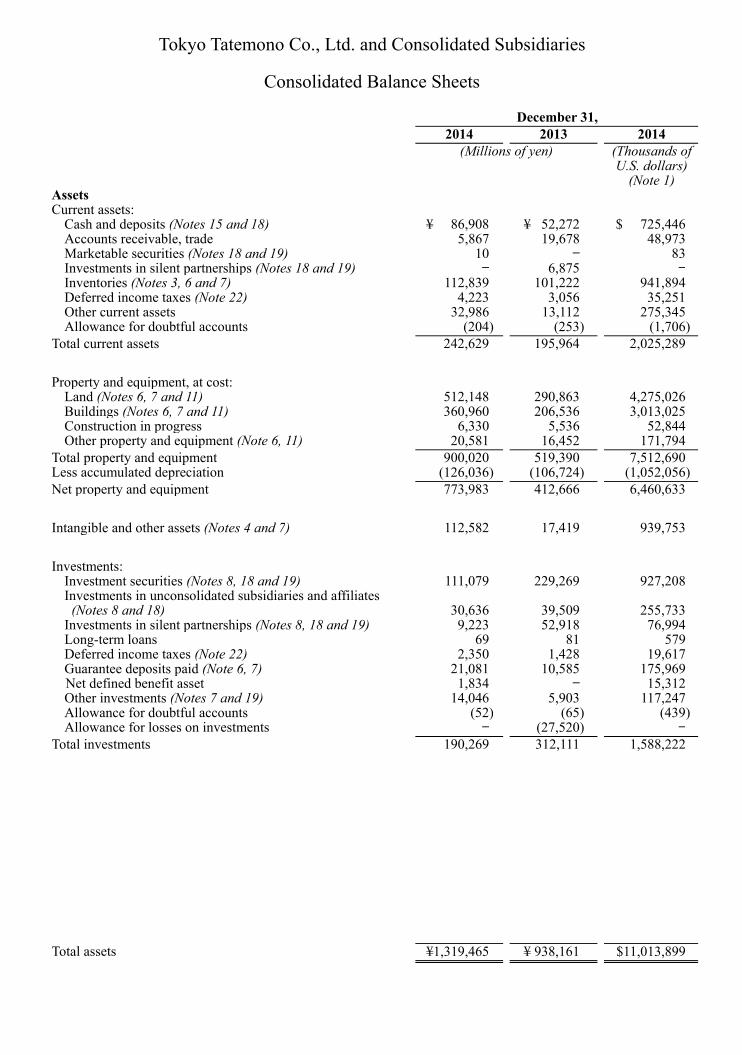
Tokyo Tatemono Co., Ltd. and Consolidated Subsidiaries
Consolidated Balance Sheets December 31, 2014 2013 2014 (Millions of yen) (Thousands of
U.S. dollars) (Note 1)
Assets Current assets:
Cash and deposits (Notes 15 and 18) ¥ 86,908 ¥ 52,272 $ 725,446Accounts receivable, trade 5,867 19,678 48,973Marketable securities (Notes 18 and 19) 10 — 83Investments in silent partnerships (Notes 18 and 19) — 6,875 —Inventories (Notes 3, 6 and 7) 112,839 101,222 941,894Deferred income taxes (Note 22) 4,223 3,056 35,251Other current assets 32,986 13,112 275,345Allowance for doubtful accounts (204) (253) (1,706)
Total current assets 242,629 195,964 2,025,289
Property and equipment, at cost: Land (Notes 6, 7 and 11) 512,148 290,863 4,275,026Buildings (Notes 6, 7 and 11) 360,960 206,536 3,013,025Construction in progress 6,330 5,536 52,844Other property and equipment (Note 6, 11) 20,581 16,452 171,794
Total property and equipment 900,020 519,390 7,512,690Less accumulated depreciation (126,036) (106,724) (1,052,056)Net property and equipment 773,983 412,666 6,460,633
Intangible and other assets (Notes 4 and 7) 112,582 17,419 939,753
Investments: Investment securities (Notes 8, 18 and 19) 111,079 229,269 927,208Investments in unconsolidated subsidiaries and affiliates
(Notes 8 and 18) 30,636 39,509 255,733Investments in silent partnerships (Notes 8, 18 and 19) 9,223 52,918 76,994Long-term loans 69 81 579Deferred income taxes (Note 22) 2,350 1,428 19,617Guarantee deposits paid (Note 6, 7) 21,081 10,585 175,969Net defined benefit asset 1,834 — 15,312Other investments (Notes 7 and 19) 14,046 5,903 117,247Allowance for doubtful accounts (52) (65) (439)Allowance for losses on investments — (27,520) —
Total investments 190,269 312,111 1,588,222
Total assets ¥1,319,465 ¥ 938,161 $11,013,899
010_0479001372704.indd 4 2015/05/19 21:38:59
3
December 31, 2014 2013 2014 (Millions of yen) (Thousands of
U.S. dollars) (Note 1)
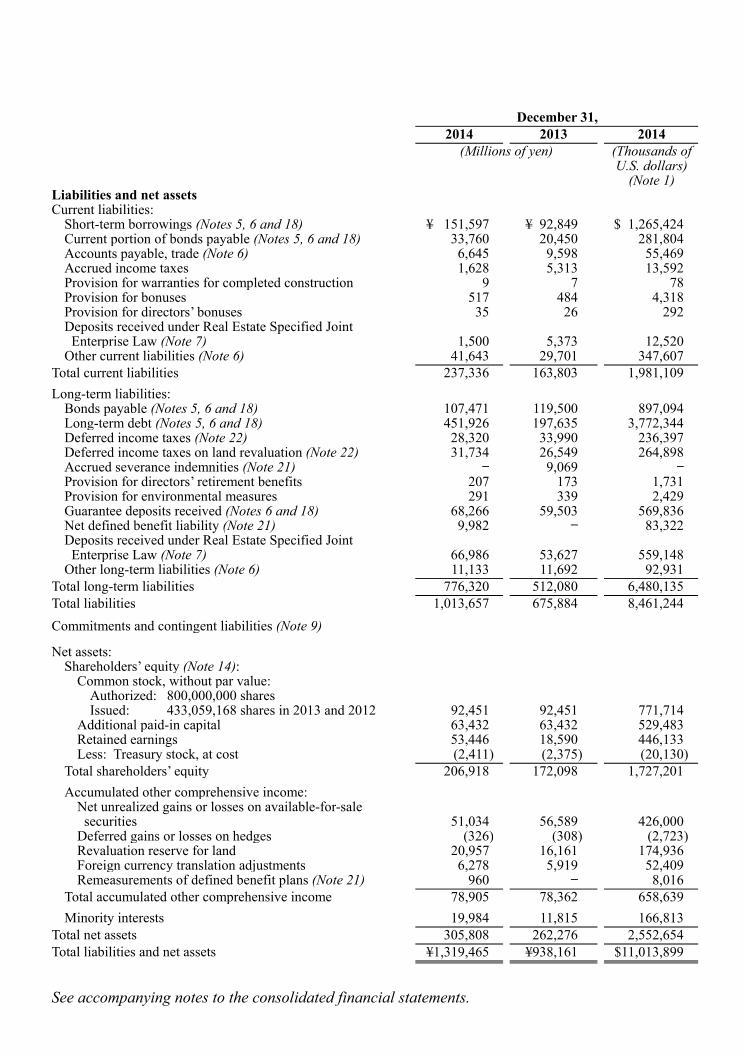
Liabilities and net assets Current liabilities:
Short-term borrowings (Notes 5, 6 and 18) ¥ 151,597 ¥ 92,849 $ 1,265,424Current portion of bonds payable (Notes 5, 6 and 18) 33,760 20,450 281,804Accounts payable, trade (Note 6) 6,645 9,598 55,469Accrued income taxes 1,628 5,313 13,592Provision for warranties for completed construction 9 7 78Provision for bonuses 517 484 4,318Provision for directors’ bonuses 35 26 292Deposits received under Real Estate Specified Joint
Enterprise Law (Note 7) 1,500 5,373 12,520Other current liabilities (Note 6) 41,643 29,701 347,607
Total current liabilities 237,336 163,803 1,981,109Long-term liabilities:
Bonds payable (Notes 5, 6 and 18) 107,471 119,500 897,094Long-term debt (Notes 5, 6 and 18) 451,926 197,635 3,772,344Deferred income taxes (Note 22) 28,320 33,990 236,397Deferred income taxes on land revaluation (Note 22) 31,734 26,549 264,898Accrued severance indemnities (Note 21) — 9,069 —Provision for directors’ retirement benefits 207 173 1,731Provision for environmental measures 291 339 2,429Guarantee deposits received (Notes 6 and 18) 68,266 59,503 569,836Net defined benefit liability (Note 21) 9,982 — 83,322Deposits received under Real Estate Specified Joint
Enterprise Law (Note 7) 66,986 53,627 559,148Other long-term liabilities (Note 6) 11,133 11,692 92,931
Total long-term liabilities 776,320 512,080 6,480,135Total liabilities 1,013,657 675,884 8,461,244Commitments and contingent liabilities (Note 9)
Net assets: Shareholders’ equity (Note 14):
Common stock, without par value: Authorized: 800,000,000 shares Issued: 433,059,168 shares in 2013 and 2012 92,451 92,451 771,714
Additional paid-in capital 63,432 63,432 529,483Retained earnings 53,446 18,590 446,133Less: Treasury stock, at cost (2,411) (2,375) (20,130)
Total shareholders’ equity 206,918 172,098 1,727,201Accumulated other comprehensive income:
Net unrealized gains or losses on available-for-sale securities 51,034 56,589 426,000
Deferred gains or losses on hedges (326) (308) (2,723)Revaluation reserve for land 20,957 16,161 174,936Foreign currency translation adjustments 6,278 5,919 52,409Remeasurements of defined benefit plans (Note 21) 960 — 8,016
Total accumulated other comprehensive income 78,905 78,362 658,639Minority interests 19,984 11,815 166,813
Total net assets 305,808 262,276 2,552,654Total liabilities and net assets ¥1,319,465 ¥938,161 $11,013,899
See accompanying notes to the consolidated financial statements.
010_0479001372704.indd 5 2015/05/19 21:38:59
4
Tokyo Tatemono Co., Ltd. and Consolidated Subsidiaries
Consolidated Statements of Income Year ended December 31, 2014 2013 2014 (Millions of yen) (Thousands of
U.S. dollars) (Note 1)
Revenue from operations ¥237,049 ¥220,026 $1,978,711 Cost of revenue from operations 180,696 166,031 1,508,314
Gross profit 56,353 53,995 470,397
Selling, general and administrative expenses (Note 10) 25,793 24,633 215,307 Operating income 30,559 29,361 255,089
Other income (expenses): Interest income 18 28 157 Dividends income 1,035 821 8,640 Interest expenses (11,990) (7,692) (100,087) Gain on sales of noncurrent assets 132,762 2,158 1,108,199 Loss on sales of noncurrent assets (4) (9) (34) Loss on retirement of noncurrent assets (132) (132) (1,106) Loss on change in equity (754) — (6,297) Borrowing cost (1,984) (1,007) (16,565) Stock issuance cost (1) 0 (10) Bond issuance cost (71) (203) (597) Gain on sales of investments in silent partnerships 579 — 4,836 Gain on sales of subsidiaries and affiliates’ stocks — 5,281 — Gain on sales of investment securities 13 10,007 109 Gain on sales of investments in capital 1,846 — 15,415 Loss on redemption of investment securities (300) — (2,510) Gain on step acquisitions — 1,101 — Write-downs of investment securities (Note 19) (4,217) (5,584) (35,204) Gain on bargain purchase 7,092 2,251 59,205 Equity in earnings of affiliated companies 276 1,016 2,304 Impairment loss (Note 11) (6,878) (7,727) (57,420) Dividends paid on real estate specified joint enterprise law (892) (831) (7,448) Compensation income 143 153 1,198 Expenses for advanced repayment of loans (Note 12) (5,139) — (42,899) Gain (loss) on reversal of foreign currency translation
adjustments — 569 — Provision of allowance for investment loss — (8,570) — Loss on transfer of business — (177) — Other, net 368 465 3,072
111,768 (8,080) 932,958 Income before income taxes and minority interests 142,328 21,281 1,188,048
Income taxes (Note 22):
Current 6,231 8,644 52,017 Deferred 2,733 2,044 22,815
8,965 10,688 74,833 Income before minority interests 133,363 10,592 1,113,215
Minority interests 50,419 471 420,860 Net income ¥ 82,944 ¥ 10,121 $ 692,354
See accompanying notes to the consolidated financial statements.
010_0479001372704.indd 6 2015/05/19 21:38:59
5
Tokyo Tatemono Co., Ltd. and Consolidated Subsidiaries
Consolidated Statements of Comprehensive Income Year ended December 31, 2014 2013 2014 (Millions of yen) (Thousands of
U.S. dollars) (Note 1)
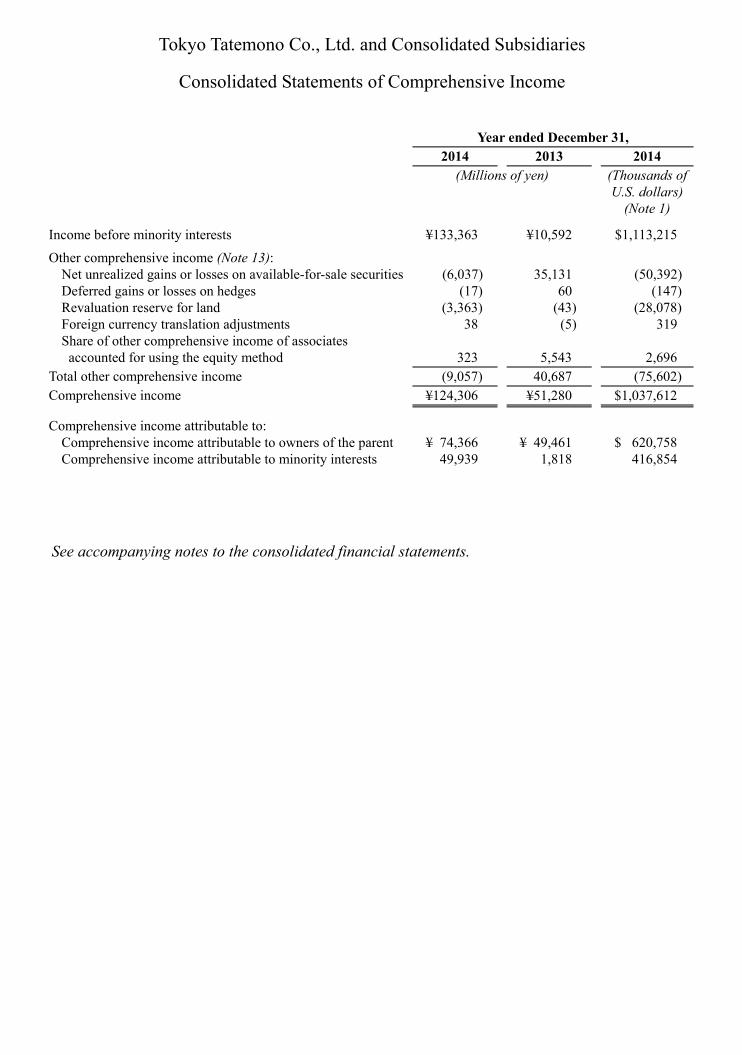
Income before minority interests ¥133,363 ¥10,592 $1,113,215
Other comprehensive income (Note 13): Net unrealized gains or losses on available-for-sale securities (6,037) 35,131 (50,392) Deferred gains or losses on hedges (17) 60 (147) Revaluation reserve for land (3,363) (43) (28,078) Foreign currency translation adjustments 38 (5) 319 Share of other comprehensive income of associates
accounted for using the equity method
323
5,543
2,696 Total other comprehensive income (9,057) 40,687 (75,602) Comprehensive income ¥124,306 ¥51,280 $1,037,612
Comprehensive income attributable to: Comprehensive income attributable to owners of the parent ¥ 74,366 ¥ 49,461 $ 620,758 Comprehensive income attributable to minority interests 49,939 1,818 416,854
See accompanying notes to the consolidated financial statements.
010_0479001372704.indd 7 2015/05/19 21:38:59
6
Tokyo Tatemono Co., Ltd. and Consolidated Subsidiaries
Consolidated Statements of Changes in Net Assets Year ended December 31, 2014 2013 2014 (Millions of yen) (Thousands of
U.S. dollars) (Note 1)
Common stock Balance at beginning of the year ¥ 92,451 ¥ 92,451 $ 771,714Balance at end of the year ¥ 92,451 ¥ 92,451 $ 771,714
Additional paid-in capital Balance at beginning of the year ¥ 63,432 ¥ 63,518 $ 529,483Disposal of treasury stock 0 0 0Change of scope of consolidation — (86) —Balance at end of the year ¥ 63,432 ¥ 63,432 $ 529,483
Retained earnings Balance at beginning of the year ¥ 18,590 ¥ 11,164 $ 155,177Net income 82,944 10,121 692,354Cash dividends paid (3,423) (2,163) (28,575)Transfer to revaluation reserve for land (8,159) (532) (68,108)Change of scope of consolidation (36,504) — (304,713)Balance at end of the year ¥ 53,446 ¥ 18,590 $ 446,133
Treasury stock, at cost Balance at beginning of the year ¥ (2,375) ¥ (549) $ (19,829)Purchases of treasury stock (36) (68) (307)Disposal of treasury stock 0 1 5Change in equity in affiliates accounted for by consolidation
treasury stock —
(1,759) — Balance at end of the year ¥ (2,411) ¥ (2,375) $ (20,130)
Net unrealized gains or losses on available-for-sale securities Balance at beginning of the year ¥ 56,589 ¥ 23,960 $ 472,369Net change in unrealized gains or losses on available-for-sale
securities, net of deferred income taxes (5,555)
32,629 (46,369) Balance at end of the year ¥ 51,034 ¥ 56,589 $ 426,000
Deferred gains or losses on hedges Balance at beginning of the year ¥ (308) ¥ (368) $ (2,576)Net change in deferred gains or losses on hedges (17) 60 (147)Balance at end of the year ¥ (326) ¥ (308) $ (2,723)
Revaluation reserve for land Balance at beginning of the year ¥ 16,161 ¥ 15,672 $ 134,906Transfer to revaluation reserve for land 4,795 488 40,029Balance at end of the year ¥ 20,957 ¥ 16,161 $ 174,936
Foreign currency translation adjustments Balance at beginning of the year ¥ 5,919 ¥ (774) $ 49,410Net change in foreign currency translation adjustments 359 6,694 2,998Balance at end of the year ¥ 6,278 ¥ 5,919 $ 52,409
Remeasurements of defined benefit plans Balance at beginning of the year ¥ — ¥ — $ —Net change in foreign currency translation adjustments 960 — 8,016Balance at end of the year ¥ 960 ¥ — $ 8,016
Minority interests ¥ 19,984 ¥ 11,815 $ 166,813
Total net assets ¥ 305,808 ¥ 262,276 $ 2,552,654
See accompanying notes to the consolidated financial statements.
010_0479001372704.indd 8 2015/05/19 21:38:59
7
Tokyo Tatemono Co., Ltd. and Consolidated Subsidiaries
Consolidated Statements of Cash Flows Year ended December 31, 2014 2013 2014 (Millions of yen) (Thousands of
U.S. dollars) (Note 1)
Operating activities Income before income taxes and minority interests ¥ 142,328 ¥ 21,281 $ 1,188,048Adjustments to reconcile income before income taxes and minority interests to net cash provided by (used in) operating activities:
Depreciation and amortization 14,022 8,318 117,049Impairment loss 6,878 7,727 57,420Amortization of goodwill 1,131 290 9,443Gain on bargain purchase (7,092) (2,251) (59,205)Gain on step acquisitions — (1,101) —Equity in earnings of affiliated companies (276) (1,016) (2,304)Increase (decrease) in allowance for doubtful accounts (47) (519) (393)Increase (decrease) in allowance for investment loss — 8,570 —Increase (decrease) in provision for bonuses 31 (261) 261Increase (decrease) in net defined benefit liabilities 493 — 4,120Increase (decrease) in provision for retirement benefits — 392 —Increase (decrease) in provision for directors’ retirement benefits 34 (1,071) 285Interest and dividend income (1,054) (850) (8,798)Interest expense 11,990 7,692 100,087Loss (gain) on valuation of investment securities 4,217 5,584 35,204Loss (gain) on sales of investment securities (13) (10,007) (109)Loss (gain) on redemption of investment securities 300 — 2,510Loss (gain) on sales of investments in silent partnerships (579) — (4,836)Loss (gain) on sales of investments in capital (1,846) — (15,415)Loss (gain) on change in equity 754 — 6,297Gain on reversal of foreign currency translation adjustments — (569) —Loss (gain) on sales and retirement of noncurrent assets (132,625) (2,016) (1,107,058)Loss (gain) on sales of stocks of subsidiaries and affiliates — (5,281) —Loss (gain) on transfer of business — 177 —Decrease (increase) in notes and accounts receivable-trade (1,585) (8,369) (13,236)Decrease (increase) in inventories (Note 15) (7,207) (7,700) (60,166)Increase (decrease) in lease and guarantee deposits received (1,089) 10,067 (9,097)Increase (decrease) in accounts payable, trade (7,851) (531) (65,540)Decrease (increase) in lease and guarantee deposits (5,444) 482 (45,449)Increase (decrease) in deposits received 7,053 (1,594) 58,874Other, net 9,309 2,661 77,707
Subtotal 31,830 30,102 265,700Interest and dividends income received 1,490 2,381 12,444Interest expense paid (13,951) (7,972) (116,453)Income taxes paid (24,160) (2,376) (201,675)
Net cash provided by operating activities (4,790) 22,135 (39,983)Investing activities
Proceeds from sales and redemption of investment securities 4,950 30,746 41,324Purchase of investment securities (2,612) (14,790) (21,804)Proceeds from sales of investments in capital of subsidiaries 1,483 — 12,379Purchase of investments in capital (8,795) — (73,418)Purchase of investments in subsidiaries resulting in change in scope of consolidation (Note 15) — (2,006) —
Proceeds from purchase of investments in subsidiaries resulting in change in scope of consolidation (Note 15) — 8 —
Purchase of investments in subsidiaries resulting in change in scope of consolidation (1,472) — (12,292)
Proceeds from sales of subsidiaries shares resulting in change in scope of consolidation (Note 15) — 16,937 —
Proceeds from sales of investments in capital 16,580 — 138,397Payments for investments in silent partnerships (2,090) (5,100) (17,445)Proceeds from withdrawal of investments in silent partnerships 851 3,041 7,108Proceeds from sales of noncurrent assets 291,343 15,165 2,431,916Purchases of noncurrent assets (50,969) (7,368) (425,454)Proceeds from transfer of business — 73 —Payments of loans receivable (19) (1,823) (162)Collection of loans receivable 29 1,836 249Increase (decrease) in deposits received under Real Estate Specified Joint Enterprise Law 9,486 1,822 79,181
Other, net (967) (1,460) (8,072)Net cash (used in) provided by investing activities 257,798 37,083 2,151,907
010_0479001372704.indd 9 2015/05/19 21:38:59
8
Tokyo Tatemono Co., Ltd. and Consolidated Subsidiaries
Consolidated Statements of Cash Flows (continued) Year ended December 31, 2014 2013 2014 (Millions of yen) (Thousands of
U.S. dollars) (Note 1)
Financing activities Net increase (decrease) in short-term loans payable ¥ 1,090 ¥ (10) $ 9,098Proceeds from long-term loans payable 286,500 44,200 2,391,485Repayment of long-term loans payable (477,133) (104,700) (3,982,750)Payments for long-term accounts payable (811) (862) (6,777)Proceeds from issuance of bonds payable 15,000 40,000 125,208Redemption of bonds payable (20,460) (22,200) (170,786)Proceeds from sales of treasury stock 0 1 6Purchase of treasury stock (36) (68) (307)Cash dividends paid (3,418) (2,159) (28,532)Cash dividends paid to minority shareholders (49,378) (94) (412,173)Repayments to minority shareholders (22,840) — (190,651)Other, net (6,299) (1,226) (52,580)
Net cash (used in) provided by financing activities (277,787) (47,119) (2,318,760)Effect of exchange rate change on cash and cash equivalents 35 704 292Net increase (decrease) in cash and cash equivalents (24,744) 12,804 (206,544)Cash and cash equivalents at beginning of period 52,271 39,466 436,321Increase in cash and cash equivalents resulting from consolidation 59,379 — 495,656Cash and cash equivalents at end of period (Note 15) ¥ 86,907 ¥ 52,271 $ 725,434 See accompanying notes to the consolidated financial statements.
010_0479001372704.indd 10 2015/05/19 21:38:59
9
Tokyo Tatemono Co., Ltd. and Consolidated Subsidiaries
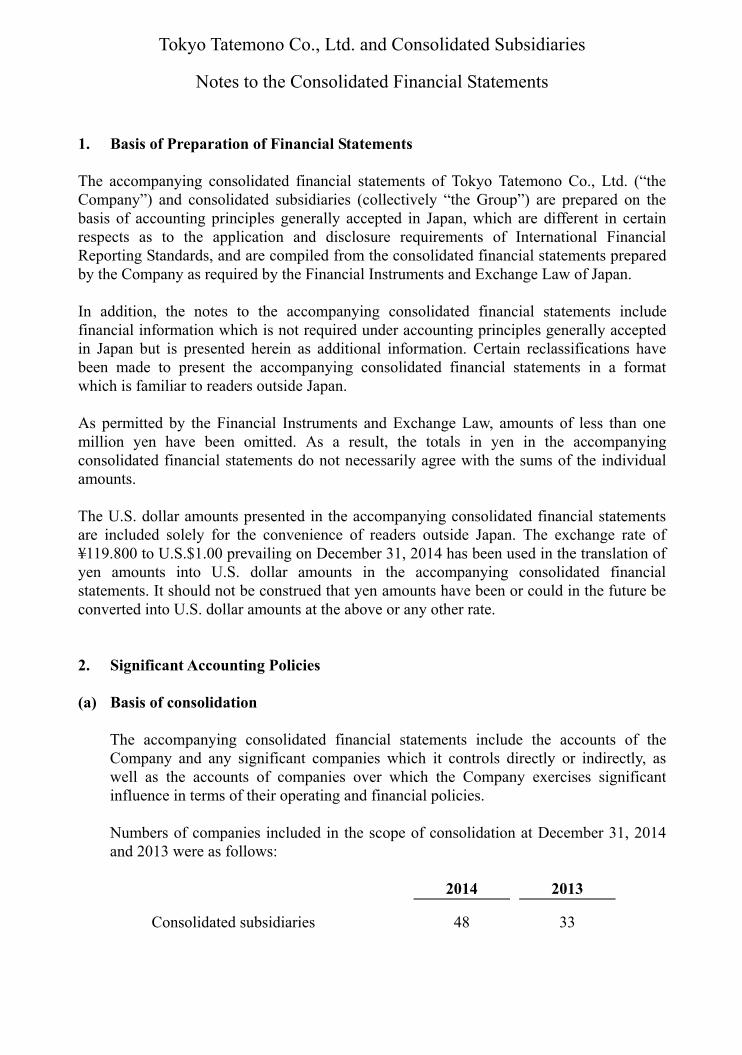
Notes to the Consolidated Financial Statements 1. Basis of Preparation of Financial Statements The accompanying consolidated financial statements of Tokyo Tatemono Co., Ltd. (“the Company”) and consolidated subsidiaries (collectively “the Group”) are prepared on the basis of accounting principles generally accepted in Japan, which are different in certain respects as to the application and disclosure requirements of International Financial Reporting Standards, and are compiled from the consolidated financial statements prepared by the Company as required by the Financial Instruments and Exchange Law of Japan. In addition, the notes to the accompanying consolidated financial statements include financial information which is not required under accounting principles generally accepted in Japan but is presented herein as additional information. Certain reclassifications have been made to present the accompanying consolidated financial statements in a format which is familiar to readers outside Japan. As permitted by the Financial Instruments and Exchange Law, amounts of less than one million yen have been omitted. As a result, the totals in yen in the accompanying consolidated financial statements do not necessarily agree with the sums of the individual amounts. The U.S. dollar amounts presented in the accompanying consolidated financial statements are included solely for the convenience of readers outside Japan. The exchange rate of ¥119.800 to U.S.$1.00 prevailing on December 31, 2014 has been used in the translation of yen amounts into U.S. dollar amounts in the accompanying consolidated financial statements. It should not be construed that yen amounts have been or could in the future be converted into U.S. dollar amounts at the above or any other rate. 2. Significant Accounting Policies (a) Basis of consolidation The accompanying consolidated financial statements include the accounts of the
Company and any significant companies which it controls directly or indirectly, as well as the accounts of companies over which the Company exercises significant influence in terms of their operating and financial policies.
Numbers of companies included in the scope of consolidation at December 31, 2014
and 2013 were as follows:
2014 2013
Consolidated subsidiaries 48 33
010_0479001372704.indd 11 2015/05/19 21:38:59
10
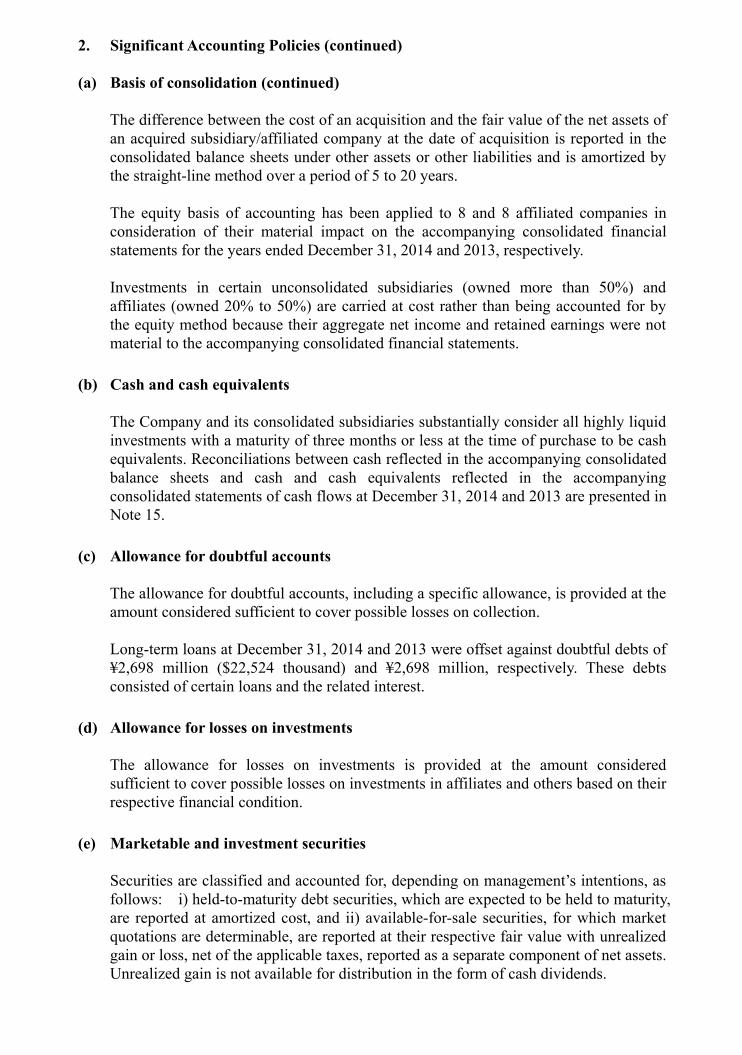
2. Significant Accounting Policies (continued) (a) Basis of consolidation (continued) The difference between the cost of an acquisition and the fair value of the net assets of
an acquired subsidiary/affiliated company at the date of acquisition is reported in the consolidated balance sheets under other assets or other liabilities and is amortized by the straight-line method over a period of 5 to 20 years.
The equity basis of accounting has been applied to 8 and 8 affiliated companies in
consideration of their material impact on the accompanying consolidated financial statements for the years ended December 31, 2014 and 2013, respectively.
Investments in certain unconsolidated subsidiaries (owned more than 50%) and
affiliates (owned 20% to 50%) are carried at cost rather than being accounted for by the equity method because their aggregate net income and retained earnings were not material to the accompanying consolidated financial statements.
(b) Cash and cash equivalents The Company and its consolidated subsidiaries substantially consider all highly liquid
investments with a maturity of three months or less at the time of purchase to be cash equivalents. Reconciliations between cash reflected in the accompanying consolidated balance sheets and cash and cash equivalents reflected in the accompanying consolidated statements of cash flows at December 31, 2014 and 2013 are presented in Note 15.
(c) Allowance for doubtful accounts The allowance for doubtful accounts, including a specific allowance, is provided at the
amount considered sufficient to cover possible losses on collection. Long-term loans at December 31, 2014 and 2013 were offset against doubtful debts of
¥2,698 million ($22,524 thousand) and ¥2,698 million, respectively. These debts consisted of certain loans and the related interest.
(d) Allowance for losses on investments The allowance for losses on investments is provided at the amount considered
sufficient to cover possible losses on investments in affiliates and others based on their respective financial condition.
(e) Marketable and investment securities Securities are classified and accounted for, depending on management’s intentions, as
follows: i) held-to-maturity debt securities, which are expected to be held to maturity, are reported at amortized cost, and ii) available-for-sale securities, for which market quotations are determinable, are reported at their respective fair value with unrealized gain or loss, net of the applicable taxes, reported as a separate component of net assets. Unrealized gain is not available for distribution in the form of cash dividends.
010_0479001372704.indd 12 2015/05/19 21:38:59
11
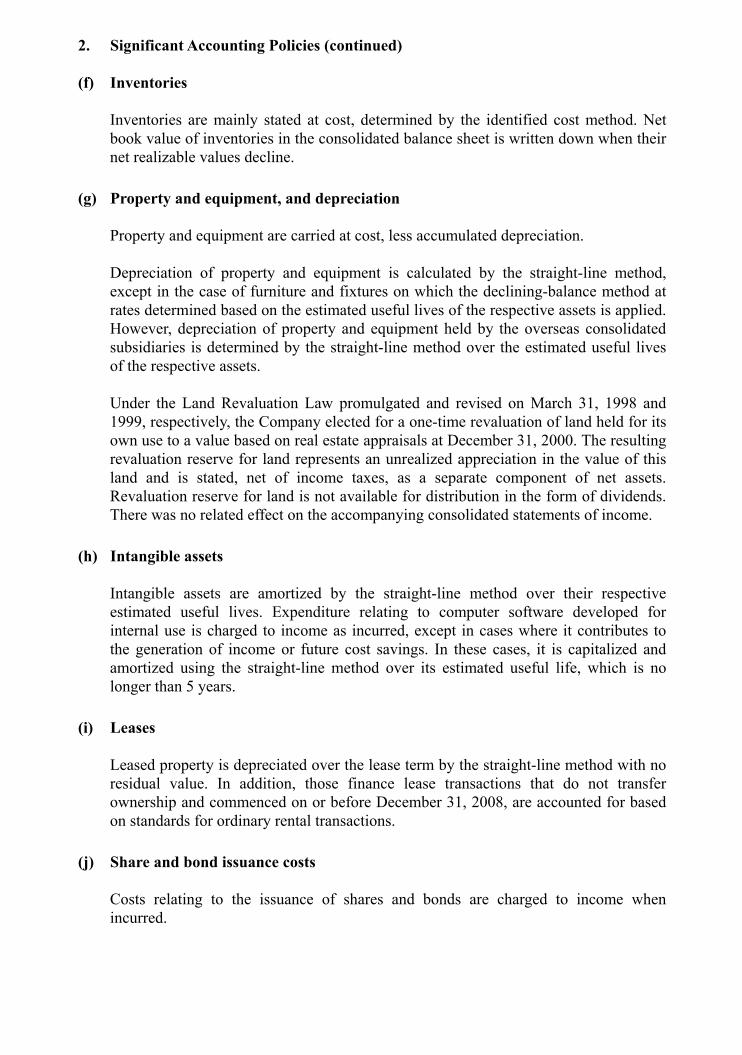
2. Significant Accounting Policies (continued) (f) Inventories Inventories are mainly stated at cost, determined by the identified cost method. Net
book value of inventories in the consolidated balance sheet is written down when their net realizable values decline.
(g) Property and equipment, and depreciation Property and equipment are carried at cost, less accumulated depreciation. Depreciation of property and equipment is calculated by the straight-line method,
except in the case of furniture and fixtures on which the declining-balance method at rates determined based on the estimated useful lives of the respective assets is applied. However, depreciation of property and equipment held by the overseas consolidated subsidiaries is determined by the straight-line method over the estimated useful lives of the respective assets.
Under the Land Revaluation Law promulgated and revised on March 31, 1998 and
1999, respectively, the Company elected for a one-time revaluation of land held for its own use to a value based on real estate appraisals at December 31, 2000. The resulting revaluation reserve for land represents an unrealized appreciation in the value of this land and is stated, net of income taxes, as a separate component of net assets. Revaluation reserve for land is not available for distribution in the form of dividends. There was no related effect on the accompanying consolidated statements of income.
(h) Intangible assets Intangible assets are amortized by the straight-line method over their respective
estimated useful lives. Expenditure relating to computer software developed for internal use is charged to income as incurred, except in cases where it contributes to the generation of income or future cost savings. In these cases, it is capitalized and amortized using the straight-line method over its estimated useful life, which is no longer than 5 years.
(i) Leases Leased property is depreciated over the lease term by the straight-line method with no
residual value. In addition, those finance lease transactions that do not transfer ownership and commenced on or before December 31, 2008, are accounted for based on standards for ordinary rental transactions.
(j) Share and bond issuance costs Costs relating to the issuance of shares and bonds are charged to income when
incurred.
010_0479001372704.indd 13 2015/05/19 21:38:59
12
2. Significant Accounting Policies (continued) (k) Derivatives and hedging activities The Company defers unrealized gains or losses resulting from changes in fair value of
derivative financial instruments until the related losses or gains on the hedged items are recognized, if derivative financial instruments meet certain criteria for hedges.
Interest-rate swaps which meet specific matching criteria and qualify for hedge
accounting treatment are not remeasured at market value; however, the differentials paid or received under the respective swap agreements are recognized and included as interest expense or income.
The Company enters into interest-rate swap contracts to manage its exposure to
interest-rate fluctuation with respect to certain of its liabilities. It is the Company’s policy to utilize derivatives only for the purpose of reducing market risk.
(l) Accrued severance indemnities
(i) Attribution method of the estimated amount of retirement benefits
The straight-line method for attributing the estimated amount of retirement benefits to periods has been applied up to the end of the fiscal year ended December 31, 2014 to calculate the retirement benefit obligation.
(ii) Accounting method for actuarial gain or loss and prior service costs
Prior service costs are amortized as incurred by the straight-line method over a certain period (10 years) within the eligible employees’ average remaining period of service.
Actuarial gain or loss are amortized in the year following the year in which the gain or loss is recognized by the straight-line method over a certain period (10 years) within the eligible employees’ average remaining period of service.
(iii) Adoption of a simplified method for small businesses,
Certain consolidated subsidiaries calculate the net defined benefit liability and retirement benefit costs using a simplified method, which assumes retirement benefit obligation to be equal to the benefits payable if all eligible employees voluntarily terminated their employment at the fiscal year end.
(m) Net income per share Computations of basic net income per share are based on the weighted-average
number of shares of common stock outstanding during each year. Diluted net income per share is computed based on the weighted-average number of shares of common stock outstanding during each year after giving effect to the dilutive potential of shares to be issued.
010_0479001372704.indd 14 2015/05/19 21:38:59
13
2. Significant Accounting Policies (continued) (n) Income taxes Deferred income taxes are determined based on the differences between the amounts
determined for financial reporting purposes and the tax bases of assets and liabilities and are measured using the enacted tax rates and laws which will be in effect when the differences are expected to reverse.
(o) Accounting treatment for consumption taxes
Consumption taxes are accounted for by the tax exclusion method. However, the tax inclusion method is used for certain tax-exempt consolidated subsidiaries.
(p) Reclassifications Certain reclassifications of the consolidated financial statements for the year ended
December 31, 2013 have been made to conform with the presentation for the year ended December 31, 2014.
(q) Changes in accounting principles
(Adoption of Accounting Standard for Consolidated Financial Statements) Effective the fiscal year ended December 31, 2014, the Company has adopted the Revised Accounting Standard for Consolidated Financial Statements (ASBJ Statement No. 22 issued on March 25, 2011), the Revised Guidance on Disclosures about Certain Special Purpose Entities (ASBJ Guidance No. 15 issued on March 25, 2011), the Revised Guidance on Determining a Subsidiary and an Affiliate (ASBJ Guidance No. 22 issued on March 25, 2011) and the Revised Practical Solution on Application of the Control Criteria and Influence Criteria to Investment Associations (ASBJ PITF No. 20 issued on March 25, 2011). As a result, the Company consolidated seven special purpose entities and six silent partnerships (hereinafter collectively referred to as “SPCs for Consolidation”), such as Nakano Ekimae Kaihatsu Tokutei Mokuteki Kaisha, Kyobashi Kaihatsu Tokutei Mokuteki Kaisha, Shinjuku Center Building Tokutei Mokuteki Kaisha, Meieki 2-chome Kaihatsu Tokutei Mokuteki Kaisha and a silent partnership (TK) operated by Tokyo Prime Stage Y.K. Concerning the adoption of these accounting standards, etc. to SPCs for Consolidation, based on the transitional treatment stipulated in Paragraph 44-4 (3) of the Revised Accounting Standard for Consolidated Financial Statements, the assets, liabilities and minority interests of the Company’s newly consolidated SPCs were reevaluated using appropriate book values on the accompanying consolidated financial statements at the beginning of the year on the adoption. As a result, retained earnings at the beginning of the fiscal year ended December 31, 2014 decreased by ¥36,504 million ($304,713 thousand).
010_0479001372704.indd 15 2015/05/19 21:38:59
14
2. Significant Accounting Policies (continued) (q) Changes in accounting principles (continued)
(Adoption of Accounting Standard for Retirement Benefits) Effective the fiscal year ended December 31, 2014 the Company has adopted the Accounting Standard for Retirement Benefits (ASBJ Statement No. 26 issued on May 17, 2012, hereinafter the “Accounting Standard for Retirement Benefits”) and the Guidance on Accounting Standard for Retirement Benefits (ASBJ Guidance No. 25 issued on May 17, 2012, hereinafter the “Guidance on Retirement Benefits”) (however, excluding the provisions stated in the main body of Paragraph 35 of the Accounting Standard for Retirement Benefits and the main body of Paragraph 67 of the Guidance on Retirement Benefits). Under these standards, the Company has applied the revised accounting method for recording the retirement benefit obligation, after deducting the plan assets, as net defined benefit liability or asset, and recording unrecognized actuarial gain or loss and unrecognized prior service costs as net defined benefit liability or asset. Concerning the adoption of the Accounting Standard for Retirement Benefits, etc. based on the transitional treatment stipulated in Paragraph 37 of the Accounting Standard for Retirement Benefits, the effect of such changes have been recorded in remeasurements of defined benefit plans in accumulated other comprehensive income for the fiscal year ended December 31, 2014. As a result, a net defined benefit liability of ¥9,982 million ($83,322 thousand) and a net defined benefit asset of ¥1,834 million ($15,312 thousand) were recognized, and accumulated other comprehensive income increased by ¥960 million ($8,016 thousand) as of December 31, 2014. Net assets per share increased by ¥2.24 ($0.018).
(r) Accounting standards issued but not yet adopted
(Accounting Standard for Retirement Benefits)
• The Accounting Standard for Retirement Benefits (ASBJ Statement No. 26 issued on May 17, 2012)
• The Guidance on Accounting Standard for Retirement Benefits (ASBJ Guidance No. 25 issued on May 17, 2012)
(1) Summary
These accounting standards and guidance have been revised centering on the accounting method for unrecognized actuarial differences and unrecognized prior service costs, the calculation method for the retirement benefit obligation and service costs and the enhancement of disclosure from the standpoint of improving financial reporting and in light of international movements.
010_0479001372704.indd 16 2015/05/19 21:38:59
15
2. Significant Accounting Policies (continued) (r) Accounting standards issued but not yet adopted (continued)
(2) Planned date of adoption
The revision of the calculation method for retirement benefit obligation and service costs is due to be applied from the beginning of the fiscal year ending December 31, 2015.
(3) Effect of adoption of the accounting standard
The amount of the impact was being evaluated at the time of preparing the accompanying consolidated financial statements.
(Accounting Standard for Business Combinations)
• Accounting Standard for Business Combinations (ASBJ Statement No. 21 issued on September 13, 2013)
• Accounting Standard for Consolidated Financial Statements (ASBJ Statement No. 22 issued on September 13, 2013)
• Accounting Standard for Business Divestitures (ASBJ Statement No. 7 issued on September 13, 2013)
• Accounting Standard for Earnings Per Share (ASBJ Statement No. 2 issued on September 13, 2013)
• Guidance on Accounting Standard for Business Combinations and Accounting Standard for Business Divestitures (ASBJ Guidance No. 10 issued on September 13, 2013)
• Guidance on Accounting Standard for Earnings Per Share (ASBJ Guidance No. 4 issued on September 13, 2013)
(1) Summary
These accounting standards and guidance have been revised with respect to the treatment of changes in equity held by the parent company in subsidiaries when control is retained, the treatment of acquisition-related expenses, and the treatment of the disclosure of net income, changes in terminology from minority interest to non-controlling interests and the finalization of tentative accounting treatment related to the additional acquisition of shares in subsidiaries.
(2) Planned date of adoption
These revisions are due to be applied from the beginning of the fiscal year ending December 31, 2015. The tentative accounting treatment described in the standard is due to be applied to business combinations implemented after the beginning of the fiscal year ending December 31, 2015.
(3) Effect of adoption of the accounting standard
The amount of the impact was being evaluated at the time of preparing the accompanying consolidated financial statements.
010_0479001372704.indd 17 2015/05/19 21:39:00
16
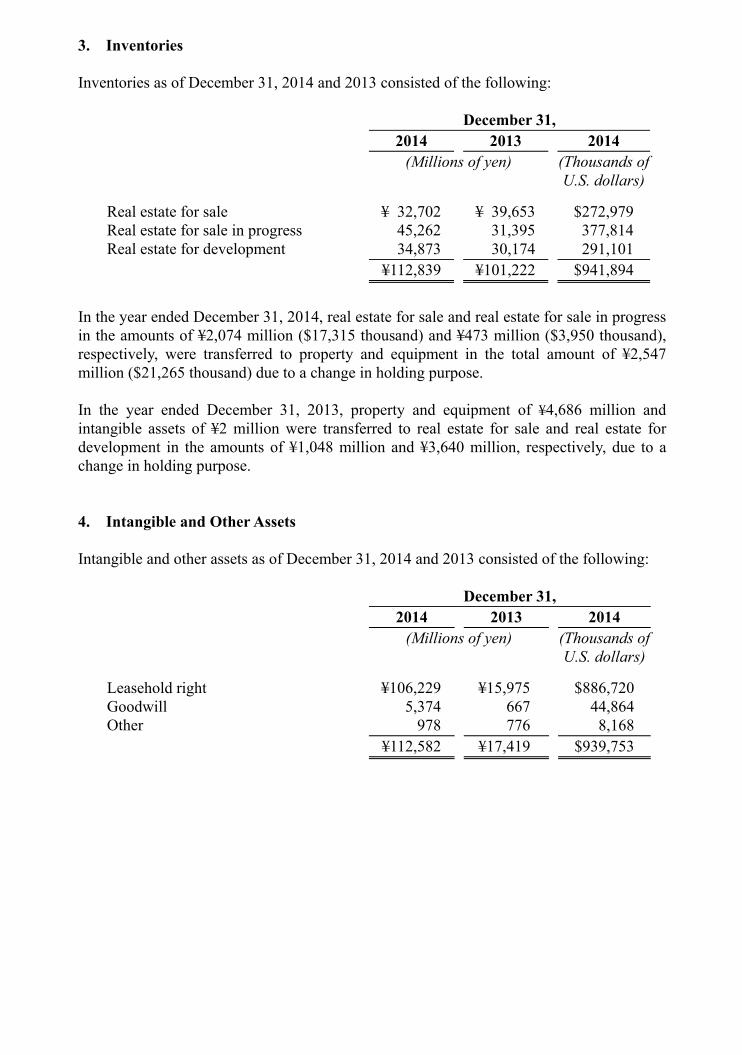
3. Inventories Inventories as of December 31, 2014 and 2013 consisted of the following:
December 31, 2014 2013 2014 (Millions of yen) (Thousands of
U.S. dollars)
Real estate for sale ¥ 32,702 ¥ 39,653 $272,979 Real estate for sale in progress 45,262 31,395 377,814 Real estate for development 34,873 30,174 291,101 ¥112,839 ¥101,222 $941,894
In the year ended December 31, 2014, real estate for sale and real estate for sale in progress in the amounts of ¥2,074 million ($17,315 thousand) and ¥473 million ($3,950 thousand), respectively, were transferred to property and equipment in the total amount of ¥2,547 million ($21,265 thousand) due to a change in holding purpose. In the year ended December 31, 2013, property and equipment of ¥4,686 million and intangible assets of ¥2 million were transferred to real estate for sale and real estate for development in the amounts of ¥1,048 million and ¥3,640 million, respectively, due to a change in holding purpose. 4. Intangible and Other Assets Intangible and other assets as of December 31, 2014 and 2013 consisted of the following:
December 31, 2014 2013 2014 (Millions of yen) (Thousands of
U.S. dollars)
Leasehold right ¥106,229 ¥15,975 $886,720 Goodwill 5,374 667 44,864 Other 978 776 8,168 ¥112,582 ¥17,419 $939,753
010_0479001372704.indd 18 2015/05/19 21:39:00
17
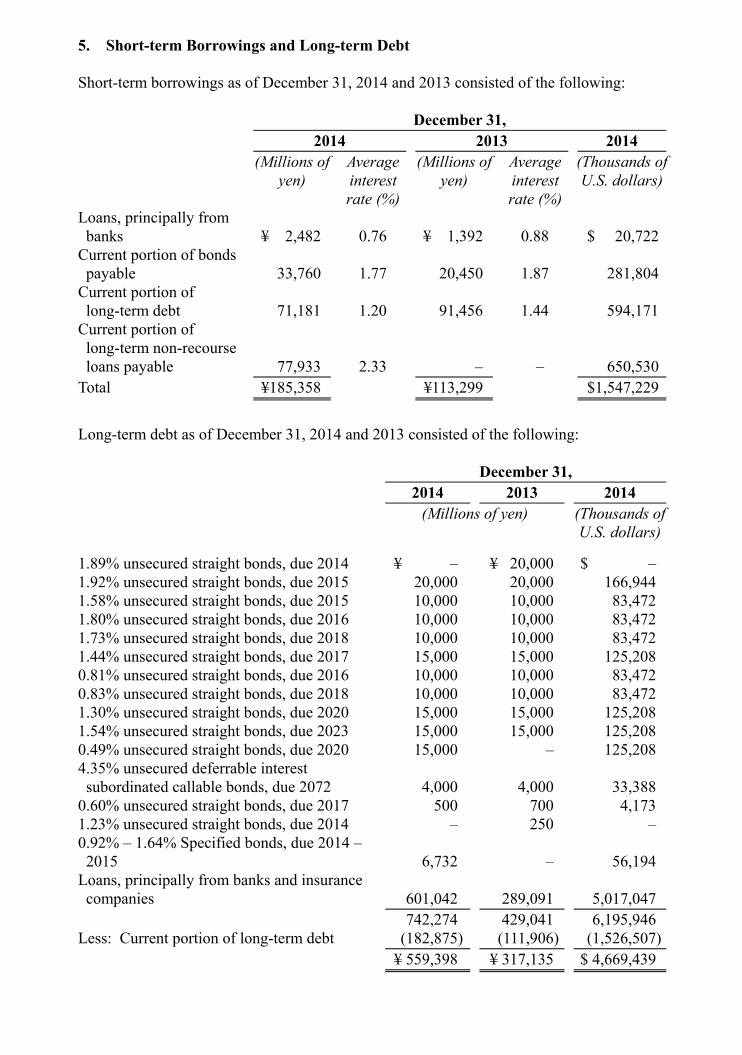
5. Short-term Borrowings and Long-term Debt Short-term borrowings as of December 31, 2014 and 2013 consisted of the following: December 31, 2014 2013 2014 (Millions of
yen) Average interest rate (%)
(Millions of yen)
Average interest rate (%)
(Thousands of U.S. dollars)
Loans, principally from banks ¥ 2,482 0.76 ¥ 1,392 0.88 $ 20,722
Current portion of bonds payable 33,760 1.77 20,450 1.87 281,804
Current portion of long-term debt 71,181 1.20 91,456 1.44 594,171
Current portion of long-term non-recourse loans payable
77,933
2.33
–
–
650,530 Total ¥185,358 ¥113,299 $1,547,229
Long-term debt as of December 31, 2014 and 2013 consisted of the following: December 31, 2014 2013 2014
(Millions of yen) (Thousands of
U.S. dollars)
1.89% unsecured straight bonds, due 2014 ¥ – ¥ 20,000 $ – 1.92% unsecured straight bonds, due 2015 20,000 20,000 166,944 1.58% unsecured straight bonds, due 2015 10,000 10,000 83,472 1.80% unsecured straight bonds, due 2016 10,000 10,000 83,472 1.73% unsecured straight bonds, due 2018 10,000 10,000 83,472 1.44% unsecured straight bonds, due 2017 15,000 15,000 125,208 0.81% unsecured straight bonds, due 2016 10,000 10,000 83,472 0.83% unsecured straight bonds, due 2018 10,000 10,000 83,472 1.30% unsecured straight bonds, due 2020 15,000 15,000 125,208 1.54% unsecured straight bonds, due 2023 15,000 15,000 125,208 0.49% unsecured straight bonds, due 2020 15,000 – 125,208 4.35% unsecured deferrable interest subordinated callable bonds, due 2072 4,000 4,000 33,388
0.60% unsecured straight bonds, due 2017 500 700 4,173 1.23% unsecured straight bonds, due 2014 – 250 – 0.92% – 1.64% Specified bonds, due 2014 – 2015 6,732 – 56,194
Loans, principally from banks and insurance companies
601,042
289,091
5,017,047
742,274 429,041 6,195,946 Less: Current portion of long-term debt (182,875) (111,906) (1,526,507) ¥ 559,398 ¥ 317,135 $ 4,669,439
010_0479001372704.indd 19 2015/05/19 21:39:00
18
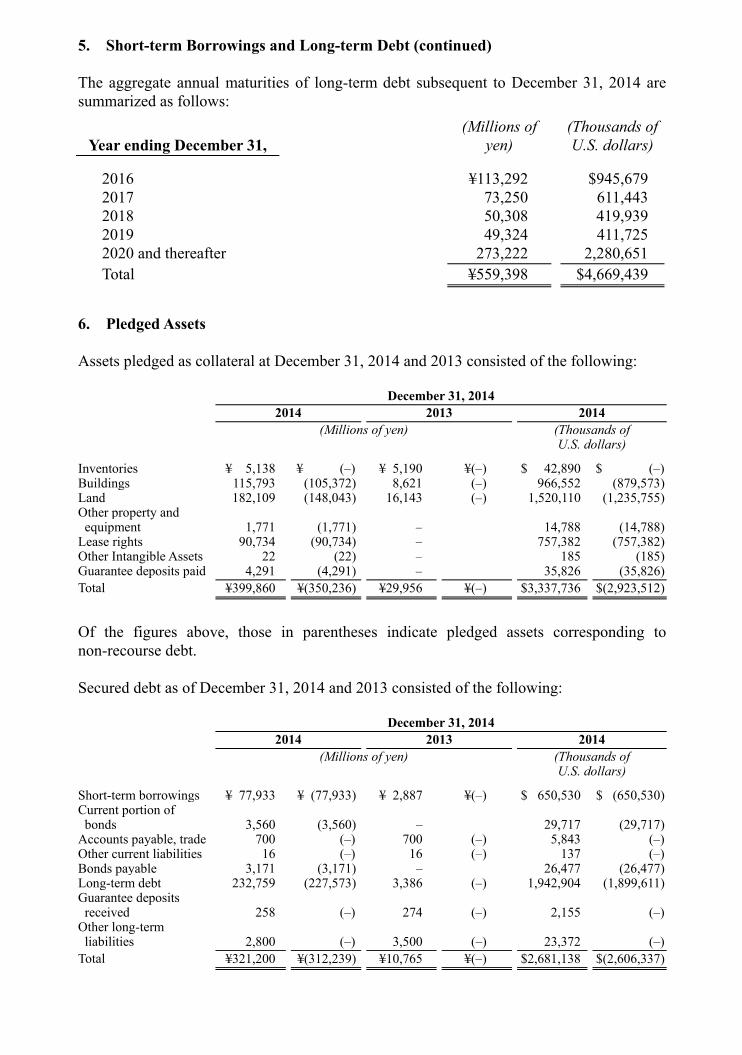
5. Short-term Borrowings and Long-term Debt (continued) The aggregate annual maturities of long-term debt subsequent to December 31, 2014 are summarized as follows:
Year ending December 31,
(Millions of yen)
(Thousands of U.S. dollars)
2016 ¥113,292 $945,679 2017 73,250 611,443 2018 50,308 419,939 2019 49,324 411,725 2020 and thereafter 273,222 2,280,651 Total ¥559,398 $4,669,439
6. Pledged Assets Assets pledged as collateral at December 31, 2014 and 2013 consisted of the following: December 31, 2014 2014 2013 2014 (Millions of yen) (Thousands of
U.S. dollars)
Inventories ¥ 5,138 ¥ (–) ¥ 5,190 ¥(–) $ 42,890 $ (–)Buildings 115,793 (105,372) 8,621 (–) 966,552 (879,573)Land 182,109 (148,043) 16,143 (–) 1,520,110 (1,235,755)Other property and equipment 1,771 (1,771) – 14,788 (14,788)
Lease rights 90,734 (90,734) – 757,382 (757,382)Other Intangible Assets 22 (22) – 185 (185)Guarantee deposits paid 4,291 (4,291) – 35,826 (35,826)Total ¥399,860 ¥(350,236) ¥29,956 ¥(–) $3,337,736 $(2,923,512)
Of the figures above, those in parentheses indicate pledged assets corresponding to non-recourse debt. Secured debt as of December 31, 2014 and 2013 consisted of the following: December 31, 2014 2014 2013 2014 (Millions of yen) (Thousands of
U.S. dollars)
Short-term borrowings ¥ 77,933 ¥ (77,933) ¥ 2,887 ¥(–) $ 650,530 $ (650,530)Current portion of bonds 3,560 (3,560) – 29,717 (29,717)
Accounts payable, trade 700 (–) 700 (–) 5,843 (–)Other current liabilities 16 (–) 16 (–) 137 (–)Bonds payable 3,171 (3,171) – 26,477 (26,477)Long-term debt 232,759 (227,573) 3,386 (–) 1,942,904 (1,899,611)Guarantee deposits received 258 (–) 274 (–) 2,155 (–)
Other long-term liabilities
2,800 (–) 3,500 (–)
23,372 (–)
Total ¥321,200 ¥(312,239) ¥10,765 ¥(–) $2,681,138 $(2,606,337)
010_0479001372704.indd 20 2015/05/19 21:39:00
19
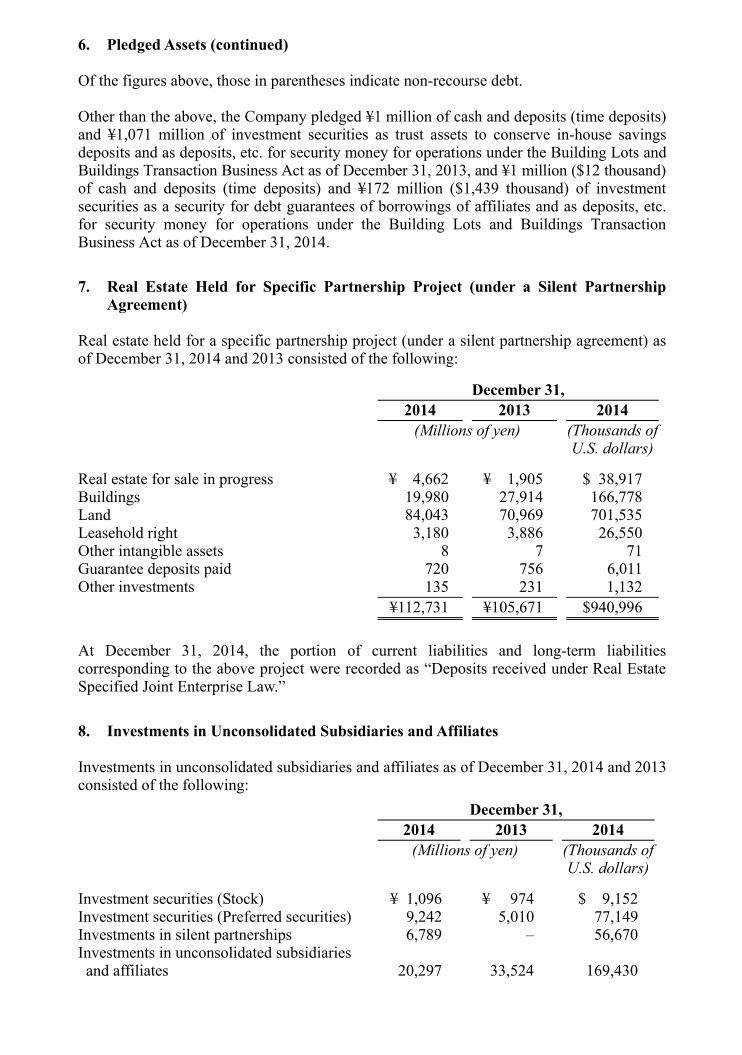
6. Pledged Assets (continued) Of the figures above, those in parentheses indicate non-recourse debt. Other than the above, the Company pledged ¥1 million of cash and deposits (time deposits) and ¥1,071 million of investment securities as trust assets to conserve in-house savings deposits and as deposits, etc. for security money for operations under the Building Lots and Buildings Transaction Business Act as of December 31, 2013, and ¥1 million ($12 thousand) of cash and deposits (time deposits) and ¥172 million ($1,439 thousand) of investment securities as a security for debt guarantees of borrowings of affiliates and as deposits, etc. for security money for operations under the Building Lots and Buildings Transaction Business Act as of December 31, 2014. 7. Real Estate Held for Specific Partnership Project (under a Silent Partnership
Agreement) Real estate held for a specific partnership project (under a silent partnership agreement) as of December 31, 2014 and 2013 consisted of the following: December 31, 2014 2013 2014 (Millions of yen) (Thousands of
U.S. dollars)
Real estate for sale in progress ¥ 4,662 ¥ 1,905 $ 38,917 Buildings 19,980 27,914 166,778 Land 84,043 70,969 701,535 Leasehold right 3,180 3,886 26,550 Other intangible assets 8 7 71 Guarantee deposits paid 720 756 6,011 Other investments 135 231 1,132 ¥112,731 ¥105,671 $940,996 At December 31, 2014, the portion of current liabilities and long-term liabilities corresponding to the above project were recorded as “Deposits received under Real Estate Specified Joint Enterprise Law.” 8. Investments in Unconsolidated Subsidiaries and Affiliates Investments in unconsolidated subsidiaries and affiliates as of December 31, 2014 and 2013 consisted of the following: December 31, 2014 2013 2014 (Millions of yen) (Thousands of
U.S. dollars)
Investment securities (Stock) ¥ 1,096 ¥ 974 $ 9,152 Investment securities (Preferred securities) 9,242 5,010 77,149 Investments in silent partnerships 6,789 – 56,670 Investments in unconsolidated subsidiaries and affiliates 20,297 33,524 169,430
010_0479001372704.indd 21 2015/05/19 21:39:00
20
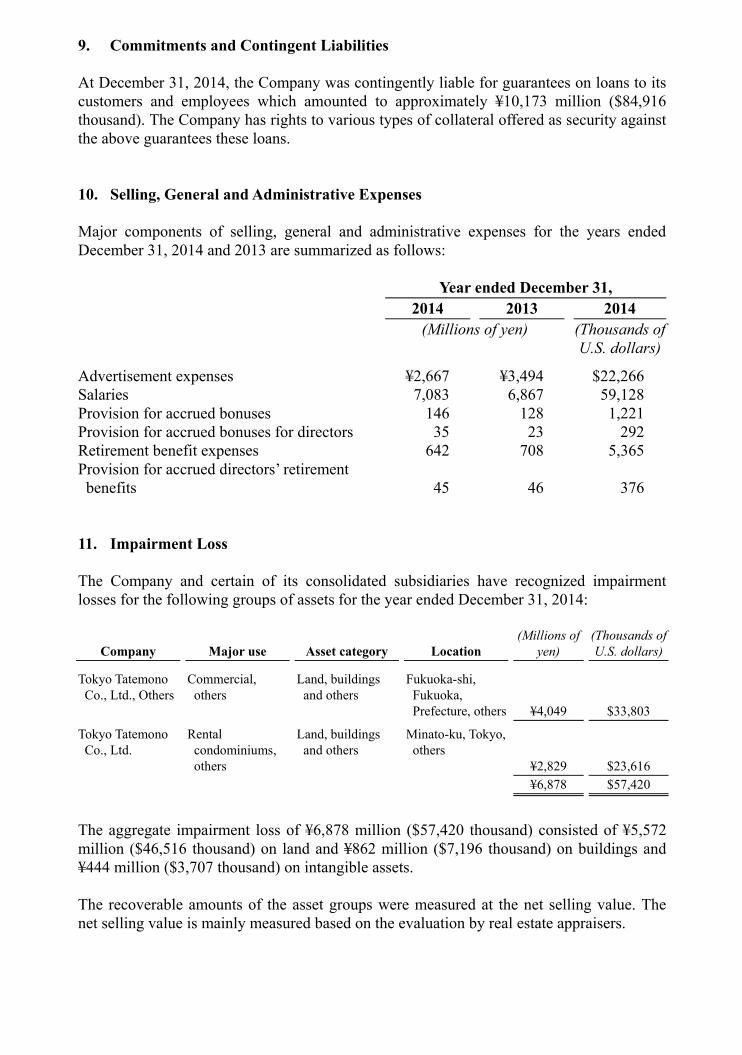
9. Commitments and Contingent Liabilities At December 31, 2014, the Company was contingently liable for guarantees on loans to its customers and employees which amounted to approximately ¥10,173 million ($84,916 thousand). The Company has rights to various types of collateral offered as security against the above guarantees these loans. 10. Selling, General and Administrative Expenses Major components of selling, general and administrative expenses for the years ended December 31, 2014 and 2013 are summarized as follows: Year ended December 31, 2014 2013 2014
(Millions of yen) (Thousands of
U.S. dollars)
Advertisement expenses ¥2,667 ¥3,494 $22,266 Salaries 7,083 6,867 59,128 Provision for accrued bonuses 146 128 1,221 Provision for accrued bonuses for directors 35 23 292 Retirement benefit expenses 642 708 5,365 Provision for accrued directors’ retirement benefits 45 46 376
11. Impairment Loss The Company and certain of its consolidated subsidiaries have recognized impairment losses for the following groups of assets for the year ended December 31, 2014:
Company Major use Asset category Location (Millions of
yen) (Thousands ofU.S. dollars)
Tokyo Tatemono Co., Ltd., Others
Commercial, others
Land, buildings and others
Fukuoka-shi, Fukuoka, Prefecture, others
¥4,049
$33,803
Tokyo Tatemono Co., Ltd.
Rental condominiums, others
Land, buildings and others
Minato-ku, Tokyo, others
¥2,829
$23,616 ¥6,878 $57,420
The aggregate impairment loss of ¥6,878 million ($57,420 thousand) consisted of ¥5,572 million ($46,516 thousand) on land and ¥862 million ($7,196 thousand) on buildings and ¥444 million ($3,707 thousand) on intangible assets. The recoverable amounts of the asset groups were measured at the net selling value. The net selling value is mainly measured based on the evaluation by real estate appraisers.
010_0479001372704.indd 22 2015/05/19 21:39:00
21
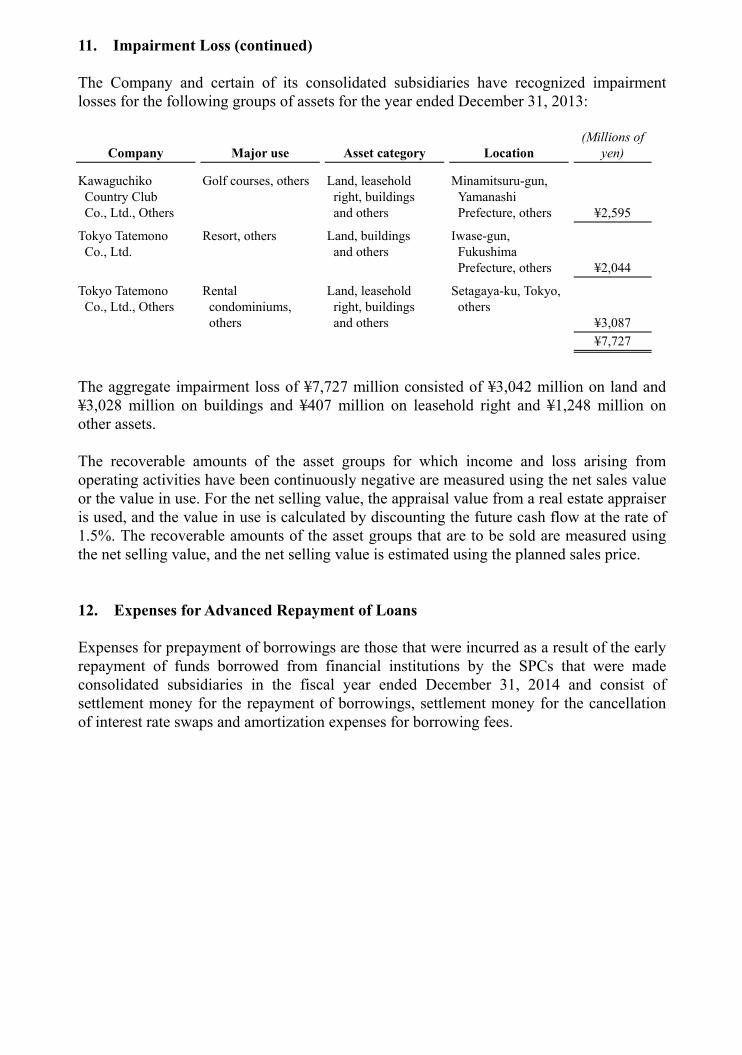
11. Impairment Loss (continued) The Company and certain of its consolidated subsidiaries have recognized impairment losses for the following groups of assets for the year ended December 31, 2013:
Company Major use Asset category Location (Millions of
yen)
Kawaguchiko Country Club Co., Ltd., Others
Golf courses, others Land, leasehold right, buildings and others
Minamitsuru-gun, Yamanashi Prefecture, others
¥2,595
Tokyo Tatemono Co., Ltd.
Resort, others Land, buildings and others
Iwase-gun, Fukushima Prefecture, others
¥2,044
Tokyo Tatemono Co., Ltd., Others
Rental condominiums, others
Land, leasehold right, buildings and others
Setagaya-ku, Tokyo, others
¥3,087 ¥7,727
The aggregate impairment loss of ¥7,727 million consisted of ¥3,042 million on land and ¥3,028 million on buildings and ¥407 million on leasehold right and ¥1,248 million on other assets. The recoverable amounts of the asset groups for which income and loss arising from operating activities have been continuously negative are measured using the net sales value or the value in use. For the net selling value, the appraisal value from a real estate appraiser is used, and the value in use is calculated by discounting the future cash flow at the rate of 1.5%. The recoverable amounts of the asset groups that are to be sold are measured using the net selling value, and the net selling value is estimated using the planned sales price. 12. Expenses for Advanced Repayment of Loans Expenses for prepayment of borrowings are those that were incurred as a result of the early repayment of funds borrowed from financial institutions by the SPCs that were made consolidated subsidiaries in the fiscal year ended December 31, 2014 and consist of settlement money for the repayment of borrowings, settlement money for the cancellation of interest rate swaps and amortization expenses for borrowing fees.
010_0479001372704.indd 23 2015/05/19 21:39:00
22
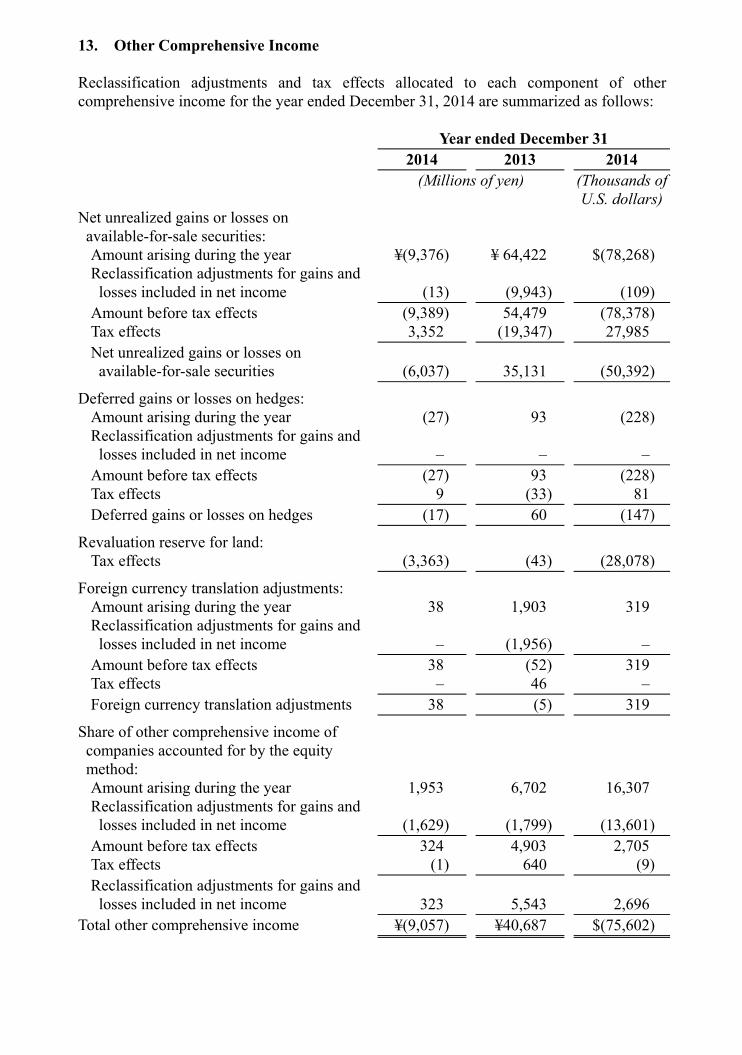
13. Other Comprehensive Income Reclassification adjustments and tax effects allocated to each component of other comprehensive income for the year ended December 31, 2014 are summarized as follows: Year ended December 31 2014 2013 2014 (Millions of yen) (Thousands of
U.S. dollars)Net unrealized gains or losses on available-for-sale securities:
Amount arising during the year ¥(9,376) ¥ 64,422 $(78,268) Reclassification adjustments for gains and losses included in net income
(13)
(9,943)
(109)
Amount before tax effects (9,389) 54,479 (78,378) Tax effects 3,352 (19,347) 27,985 Net unrealized gains or losses on available-for-sale securities
(6,037)
35,131
(50,392)
Deferred gains or losses on hedges: Amount arising during the year (27) 93 (228) Reclassification adjustments for gains and losses included in net income
–
–
–
Amount before tax effects (27) 93 (228) Tax effects 9 (33) 81 Deferred gains or losses on hedges (17) 60 (147)
Revaluation reserve for land: Tax effects (3,363) (43) (28,078)
Foreign currency translation adjustments: Amount arising during the year 38 1,903 319 Reclassification adjustments for gains and losses included in net income
–
(1,956)
–
Amount before tax effects 38 (52) 319 Tax effects – 46 – Foreign currency translation adjustments 38 (5) 319
Share of other comprehensive income of companies accounted for by the equity method:
Amount arising during the year 1,953 6,702 16,307 Reclassification adjustments for gains and losses included in net income
(1,629)
(1,799)
(13,601)
Amount before tax effects 324 4,903 2,705 Tax effects (1) 640 (9) Reclassification adjustments for gains and losses included in net income
323
5,543
2,696
Total other comprehensive income ¥(9,057) ¥40,687 $(75,602)
010_0479001372704.indd 24 2015/05/19 21:39:00
23
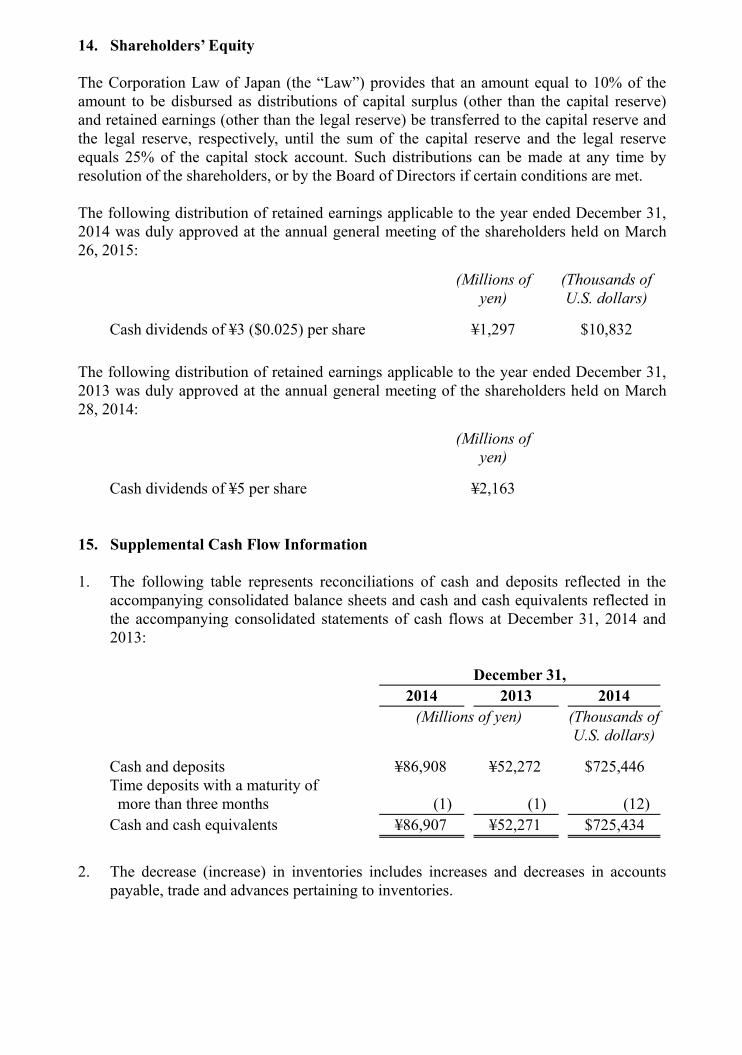
14. Shareholders’ Equity The Corporation Law of Japan (the “Law”) provides that an amount equal to 10% of the amount to be disbursed as distributions of capital surplus (other than the capital reserve) and retained earnings (other than the legal reserve) be transferred to the capital reserve and the legal reserve, respectively, until the sum of the capital reserve and the legal reserve equals 25% of the capital stock account. Such distributions can be made at any time by resolution of the shareholders, or by the Board of Directors if certain conditions are met. The following distribution of retained earnings applicable to the year ended December 31, 2014 was duly approved at the annual general meeting of the shareholders held on March 26, 2015:
(Millions of yen)
(Thousands ofU.S. dollars)
Cash dividends of ¥3 ($0.025) per share ¥1,297 $10,832 The following distribution of retained earnings applicable to the year ended December 31, 2013 was duly approved at the annual general meeting of the shareholders held on March 28, 2014:
(Millions of yen)
Cash dividends of ¥5 per share ¥2,163 15. Supplemental Cash Flow Information 1. The following table represents reconciliations of cash and deposits reflected in the
accompanying consolidated balance sheets and cash and cash equivalents reflected in the accompanying consolidated statements of cash flows at December 31, 2014 and 2013:
December 31, 2014 2013 2014 (Millions of yen) (Thousands of
U.S. dollars)
Cash and deposits ¥86,908 ¥52,272 $725,446 Time deposits with a maturity of more than three months
(1)
(1)
(12)
Cash and cash equivalents ¥86,907 ¥52,271 $725,434
2. The decrease (increase) in inventories includes increases and decreases in accounts
payable, trade and advances pertaining to inventories.
010_0479001372704.indd 25 2015/05/19 21:39:00
24
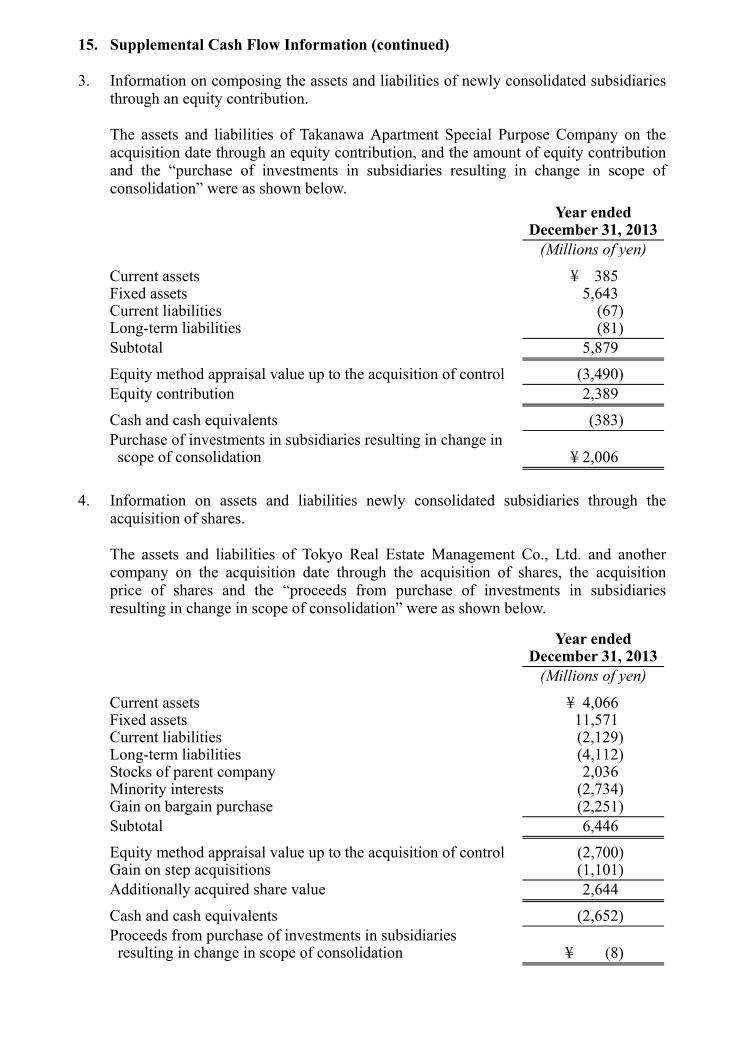
15. Supplemental Cash Flow Information (continued) 3. Information on composing the assets and liabilities of newly consolidated subsidiaries
through an equity contribution. The assets and liabilities of Takanawa Apartment Special Purpose Company on the
acquisition date through an equity contribution, and the amount of equity contribution and the “purchase of investments in subsidiaries resulting in change in scope of consolidation” were as shown below. Year ended
December 31, 2013 (Millions of yen)
Current assets ¥ 385 Fixed assets 5,643 Current liabilities (67) Long-term liabilities (81) Subtotal 5,879
Equity method appraisal value up to the acquisition of control (3,490) Equity contribution 2,389
Cash and cash equivalents (383) Purchase of investments in subsidiaries resulting in change in scope of consolidation
¥ 2,006
4. Information on assets and liabilities newly consolidated subsidiaries through the
acquisition of shares. The assets and liabilities of Tokyo Real Estate Management Co., Ltd. and another
company on the acquisition date through the acquisition of shares, the acquisition price of shares and the “proceeds from purchase of investments in subsidiaries resulting in change in scope of consolidation” were as shown below.
Year ended
December 31, 2013 (Millions of yen)
Current assets ¥ 4,066 Fixed assets 11,571 Current liabilities (2,129) Long-term liabilities (4,112) Stocks of parent company 2,036 Minority interests (2,734) Gain on bargain purchase (2,251) Subtotal 6,446 Equity method appraisal value up to the acquisition of control (2,700) Gain on step acquisitions (1,101) Additionally acquired share value 2,644
Cash and cash equivalents (2,652) Proceeds from purchase of investments in subsidiaries resulting in change in scope of consolidation
¥ (8)
010_0479001372704.indd 26 2015/05/19 21:39:00
25
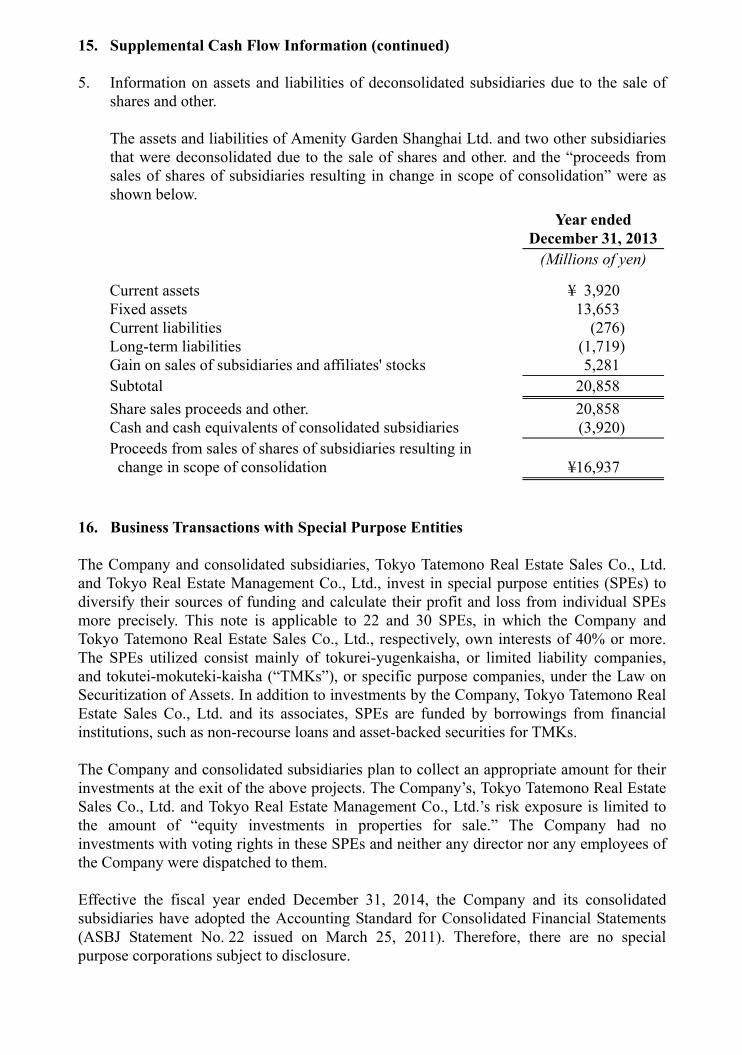
15. Supplemental Cash Flow Information (continued) 5. Information on assets and liabilities of deconsolidated subsidiaries due to the sale of
shares and other. The assets and liabilities of Amenity Garden Shanghai Ltd. and two other subsidiaries
that were deconsolidated due to the sale of shares and other. and the “proceeds from sales of shares of subsidiaries resulting in change in scope of consolidation” were as shown below. Year ended
December 31, 2013 (Millions of yen)
Current assets ¥ 3,920 Fixed assets 13,653 Current liabilities (276) Long-term liabilities (1,719) Gain on sales of subsidiaries and affiliates' stocks 5,281 Subtotal 20,858 Share sales proceeds and other. 20,858 Cash and cash equivalents of consolidated subsidiaries (3,920) Proceeds from sales of shares of subsidiaries resulting in change in scope of consolidation
¥16,937
16. Business Transactions with Special Purpose Entities The Company and consolidated subsidiaries, Tokyo Tatemono Real Estate Sales Co., Ltd. and Tokyo Real Estate Management Co., Ltd., invest in special purpose entities (SPEs) to diversify their sources of funding and calculate their profit and loss from individual SPEs more precisely. This note is applicable to 22 and 30 SPEs, in which the Company and Tokyo Tatemono Real Estate Sales Co., Ltd., respectively, own interests of 40% or more. The SPEs utilized consist mainly of tokurei-yugenkaisha, or limited liability companies, and tokutei-mokuteki-kaisha (“TMKs”), or specific purpose companies, under the Law on Securitization of Assets. In addition to investments by the Company, Tokyo Tatemono Real Estate Sales Co., Ltd. and its associates, SPEs are funded by borrowings from financial institutions, such as non-recourse loans and asset-backed securities for TMKs. The Company and consolidated subsidiaries plan to collect an appropriate amount for their investments at the exit of the above projects. The Company’s, Tokyo Tatemono Real Estate Sales Co., Ltd. and Tokyo Real Estate Management Co., Ltd.’s risk exposure is limited to the amount of “equity investments in properties for sale.” The Company had no investments with voting rights in these SPEs and neither any director nor any employees of the Company were dispatched to them. Effective the fiscal year ended December 31, 2014, the Company and its consolidated subsidiaries have adopted the Accounting Standard for Consolidated Financial Statements (ASBJ Statement No. 22 issued on March 25, 2011). Therefore, there are no special purpose corporations subject to disclosure.
010_0479001372704.indd 27 2015/05/19 21:39:00
26
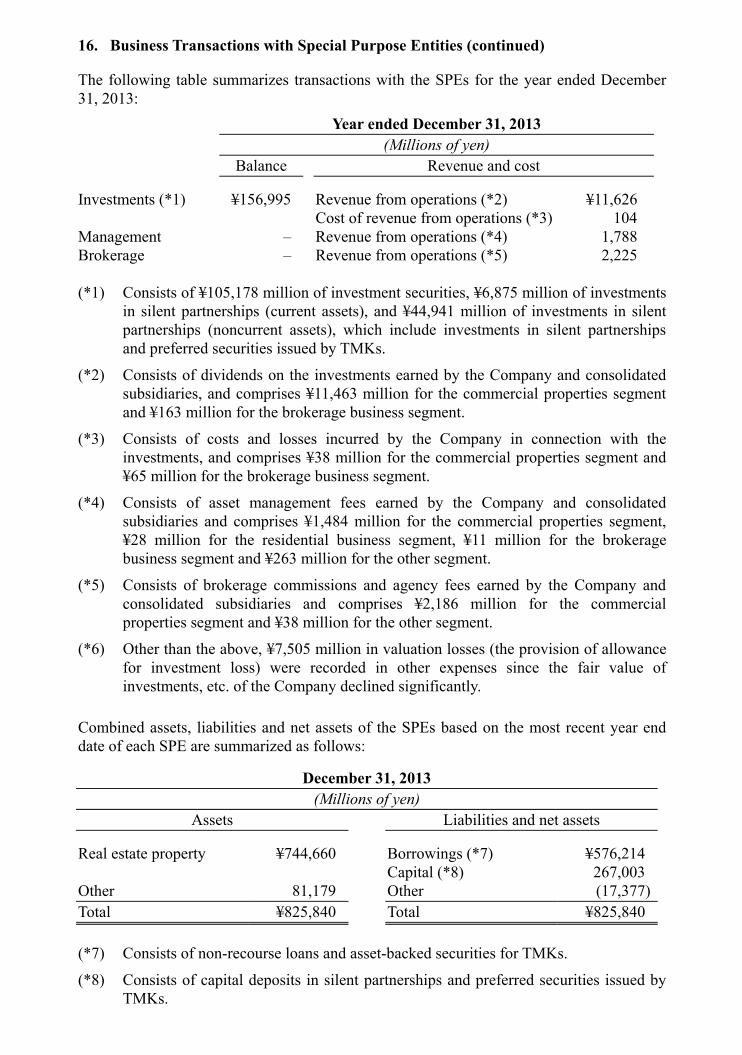
16. Business Transactions with Special Purpose Entities (continued) The following table summarizes transactions with the SPEs for the year ended December 31, 2013: Year ended December 31, 2013 (Millions of yen) Balance Revenue and cost
Investments (*1) ¥156,995 Revenue from operations (*2) ¥11,626 Cost of revenue from operations (*3) 104 Management – Revenue from operations (*4) 1,788 Brokerage – Revenue from operations (*5) 2,225 (*1) Consists of ¥105,178 million of investment securities, ¥6,875 million of investments
in silent partnerships (current assets), and ¥44,941 million of investments in silent partnerships (noncurrent assets), which include investments in silent partnerships and preferred securities issued by TMKs.
(*2) Consists of dividends on the investments earned by the Company and consolidated subsidiaries, and comprises ¥11,463 million for the commercial properties segment and ¥163 million for the brokerage business segment.
(*3) Consists of costs and losses incurred by the Company in connection with the investments, and comprises ¥38 million for the commercial properties segment and ¥65 million for the brokerage business segment.
(*4) Consists of asset management fees earned by the Company and consolidated subsidiaries and comprises ¥1,484 million for the commercial properties segment, ¥28 million for the residential business segment, ¥11 million for the brokerage business segment and ¥263 million for the other segment.
(*5) Consists of brokerage commissions and agency fees earned by the Company and consolidated subsidiaries and comprises ¥2,186 million for the commercial properties segment and ¥38 million for the other segment.
(*6) Other than the above, ¥7,505 million in valuation losses (the provision of allowance for investment loss) were recorded in other expenses since the fair value of investments, etc. of the Company declined significantly.
Combined assets, liabilities and net assets of the SPEs based on the most recent year end date of each SPE are summarized as follows:
December 31, 2013 (Millions of yen)
Assets Liabilities and net assets
Real estate property ¥744,660 Borrowings (*7) ¥576,214 Capital (*8) 267,003 Other 81,179 Other (17,377) Total ¥825,840 Total ¥825,840 (*7) Consists of non-recourse loans and asset-backed securities for TMKs.
(*8) Consists of capital deposits in silent partnerships and preferred securities issued by TMKs.
010_0479001372704.indd 28 2015/05/19 21:39:00
27
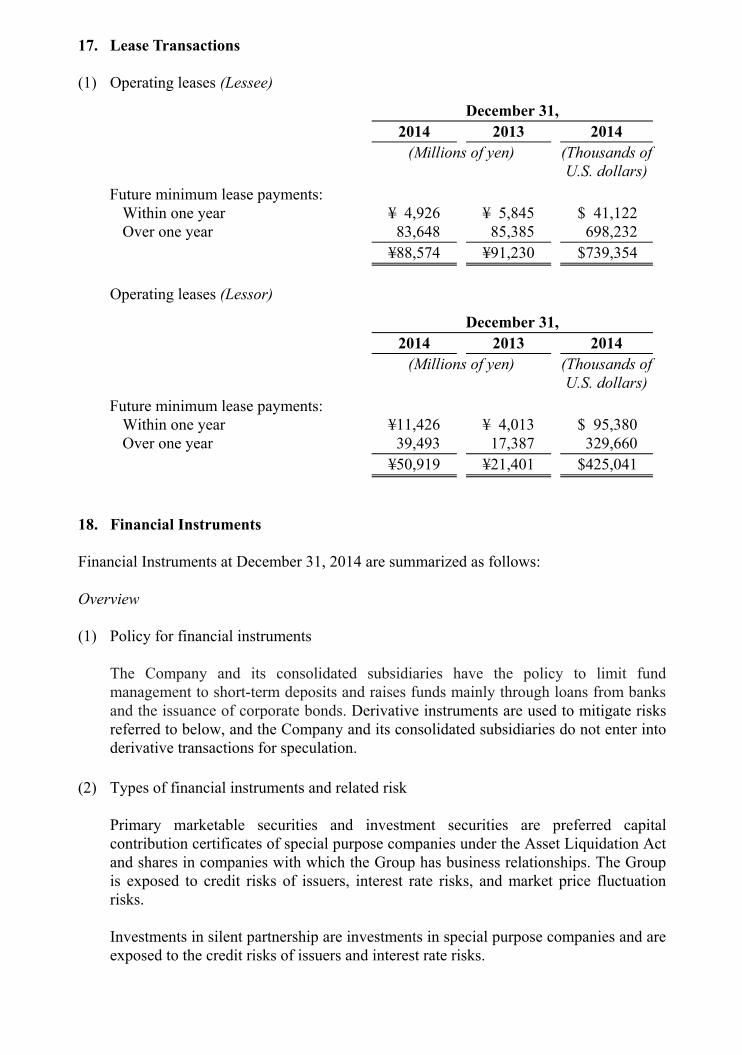
17. Lease Transactions (1) Operating leases (Lessee)
December 31, 2014 2013 2014 (Millions of yen) (Thousands of
U.S. dollars)Future minimum lease payments:
Within one year ¥ 4,926 ¥ 5,845 $ 41,122 Over one year 83,648 85,385 698,232
¥88,574 ¥91,230 $739,354 Operating leases (Lessor)
December 31, 2014 2013 2014 (Millions of yen) (Thousands of
U.S. dollars)Future minimum lease payments:
Within one year ¥11,426 ¥ 4,013 $ 95,380 Over one year 39,493 17,387 329,660
¥50,919 ¥21,401 $425,041 18. Financial Instruments Financial Instruments at December 31, 2014 are summarized as follows: Overview (1) Policy for financial instruments The Company and its consolidated subsidiaries have the policy to limit fund
management to short-term deposits and raises funds mainly through loans from banks and the issuance of corporate bonds. Derivative instruments are used to mitigate risks referred to below, and the Company and its consolidated subsidiaries do not enter into derivative transactions for speculation.
(2) Types of financial instruments and related risk Primary marketable securities and investment securities are preferred capital
contribution certificates of special purpose companies under the Asset Liquidation Act and shares in companies with which the Group has business relationships. The Group is exposed to credit risks of issuers, interest rate risks, and market price fluctuation risks.
Investments in silent partnership are investments in special purpose companies and are
exposed to the credit risks of issuers and interest rate risks.
010_0479001372704.indd 29 2015/05/19 21:39:00
28
18. Financial Instruments (continued) Overview (continued) Short-term borrowings are mainly used for funding working capital. Long-term debt
and bonds payable are mainly used for capital expenditures. Debts with floating interest rates are subject to interest-rate risk, however, the Company and its consolidated subsidiaries utilize derivatives (interest rate swaps) as hedging instruments for some long-term debt with floating interest rates to fix the cash flows of interest payments.
(3) Risk management for financial instruments
(a) Monitoring of credit risk
(the risk that customers or counterparties may default)
Each operating department monitors the status of major counterparties and manages the due dates and balances of receivables. The Group seeks to identify, at an early stage, any collectability issues due to the worsening financial conditions of counterparties to mitigate credit risk.
(b) Monitoring of market risks
(the risks arising from fluctuations in foreign exchange rates, interest rates and others)
To minimize the risks arising from fluctuations in interest rates on loans payable, the Group uses interest rate swaps. In relation to marketable securities and investment securities, the Group regularly monitors the fair values and financial situation of the issuers (counterparties). The Group reviews the status of its holdings of financial instruments considering market trends and relationships with counterparties.
(c) Monitoring of liquidity risk
(the risk that the Group may not be able to meet its obligations on scheduled due dates)
Based on the report from each division, the Group prepares and updates its cash flow plans on a timely basis to manage liquidity risk.
(4) Supplementary explanation of the estimated fair value of financial instruments The fair value of financial instruments is based on their quoted market price, if
available. When there is no quoted market price available, fair value is reasonably estimated. Since various assumptions and factors are used in estimating the fair value, different assumptions and factors could result in different fair value.
010_0479001372704.indd 30 2015/05/19 21:39:00
29
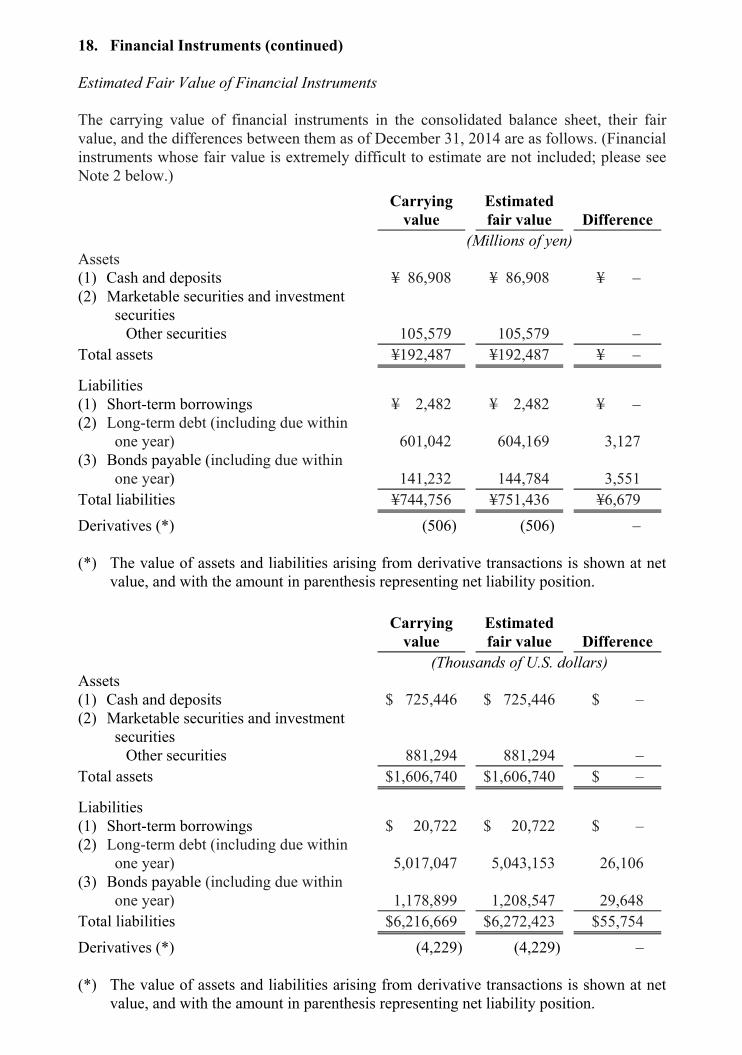
18. Financial Instruments (continued) Estimated Fair Value of Financial Instruments The carrying value of financial instruments in the consolidated balance sheet, their fair value, and the differences between them as of December 31, 2014 are as follows. (Financial instruments whose fair value is extremely difficult to estimate are not included; please see Note 2 below.)
Carrying
value Estimated fair value Difference
(Millions of yen) Assets (1) Cash and deposits ¥ 86,908 ¥ 86,908 ¥ – (2) Marketable securities and investment
securities
Other securities 105,579 105,579 – Total assets ¥192,487 ¥192,487 ¥ –
Liabilities (1) Short-term borrowings ¥ 2,482 ¥ 2,482 ¥ – (2) Long-term debt (including due within
one year) 601,042 604,169 3,127 (3) Bonds payable (including due within
one year)
141,232
144,784
3,551 Total liabilities ¥744,756 ¥751,436 ¥6,679 Derivatives (*) (506) (506) – (*) The value of assets and liabilities arising from derivative transactions is shown at net
value, and with the amount in parenthesis representing net liability position.
Carrying
value Estimated fair value Difference
(Thousands of U.S. dollars) Assets (1) Cash and deposits $ 725,446 $ 725,446 $ – (2) Marketable securities and investment
securities
Other securities 881,294 881,294 – Total assets $1,606,740 $1,606,740 $ –
Liabilities (1) Short-term borrowings $ 20,722 $ 20,722 $ – (2) Long-term debt (including due within
one year) 5,017,047 5,043,153 26,106 (3) Bonds payable (including due within
one year)
1,178,899
1,208,547
29,648 Total liabilities $6,216,669 $6,272,423 $55,754 Derivatives (*) (4,229) (4,229) – (*) The value of assets and liabilities arising from derivative transactions is shown at net
value, and with the amount in parenthesis representing net liability position.
010_0479001372704.indd 31 2015/05/19 21:39:00

30
18. Financial Instruments (continued) Estimated Fair Value of Financial Instruments (continued) Notes: 1. Methods to determine the estimated fair value of financial instruments and other
matters related to securities and derivative transactions Assets
Cash and deposits
Since these items are settled in a short period of time, their carrying value approximates fair value.
Marketable securities and investment securities
The fair value of stocks is based on quoted market prices. The fair value of debt securities is mainly based on prices provided by the financial institutions making markets in these securities. Liabilities
Short-term borrowings Since these items are settled in a short period of time, their carrying value approximates fair value.
Long-term debt (including due within one year) Since variable interest rates of certain long-term debt are determined based on current interest rates in a short period of time, their carrying value approximates fair value. The fair value of long-term debt with fixed interest rates is based on the present value of the total of principal and interest discounted by the interest rate to be applied if similar new debt were entered into.
Bonds payable (including due within one year) The fair value of bonds payable is based on the quoted market price. Derivatives The fair value of derivatives is based on prices provided by the financial institution. The estimated fair value of interest rate swap contracts is included in the estimated fair value of long-term debt since amounts in such derivative contracts accounted for short-cut method are handled together with long-term debt as hedged items.
010_0479001372704.indd 32 2015/05/19 21:39:00
31
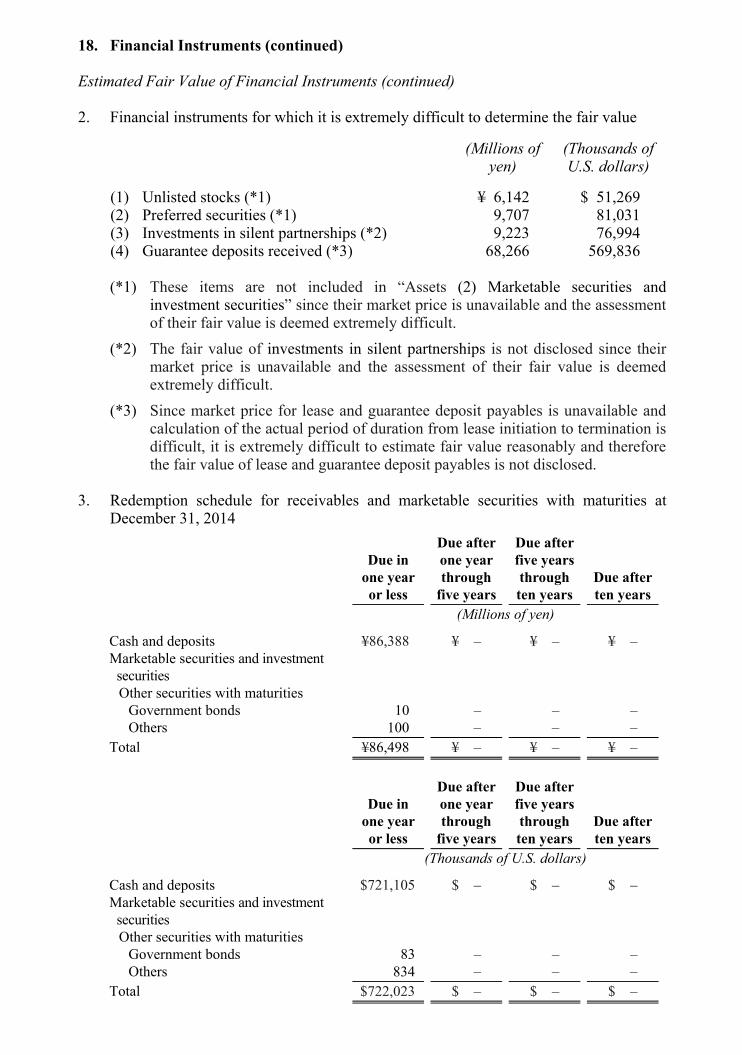
18. Financial Instruments (continued) Estimated Fair Value of Financial Instruments (continued) 2. Financial instruments for which it is extremely difficult to determine the fair value
(Millions of yen)
(Thousands of U.S. dollars)
(1) Unlisted stocks (*1) ¥ 6,142 $ 51,269 (2) Preferred securities (*1) 9,707 81,031 (3) Investments in silent partnerships (*2) 9,223 76,994 (4) Guarantee deposits received (*3) 68,266 569,836 (*1) These items are not included in “Assets (2) Marketable securities and
investment securities” since their market price is unavailable and the assessment of their fair value is deemed extremely difficult.
(*2) The fair value of investments in silent partnerships is not disclosed since their market price is unavailable and the assessment of their fair value is deemed extremely difficult.
(*3) Since market price for lease and guarantee deposit payables is unavailable and calculation of the actual period of duration from lease initiation to termination is difficult, it is extremely difficult to estimate fair value reasonably and therefore the fair value of lease and guarantee deposit payables is not disclosed.
3. Redemption schedule for receivables and marketable securities with maturities at
December 31, 2014
Due in one year or less
Due after one year through
five years
Due after five years through ten years
Due after ten years
(Millions of yen)
Cash and deposits ¥86,388 ¥ – ¥ – ¥ – Marketable securities and investment
securities
Other securities with maturities Government bonds 10 – – – Others 100 – – –
Total ¥86,498 ¥ – ¥ – ¥ –
Due in one year or less
Due after one year through
five years
Due after five years through ten years
Due after ten years
(Thousands of U.S. dollars)
Cash and deposits $721,105 $ – $ – $ – Marketable securities and investment
securities
Other securities with maturities Government bonds 83 – – – Others 834 – – –
Total $722,023 $ – $ – $ –
010_0479001372704.indd 33 2015/05/19 21:39:00
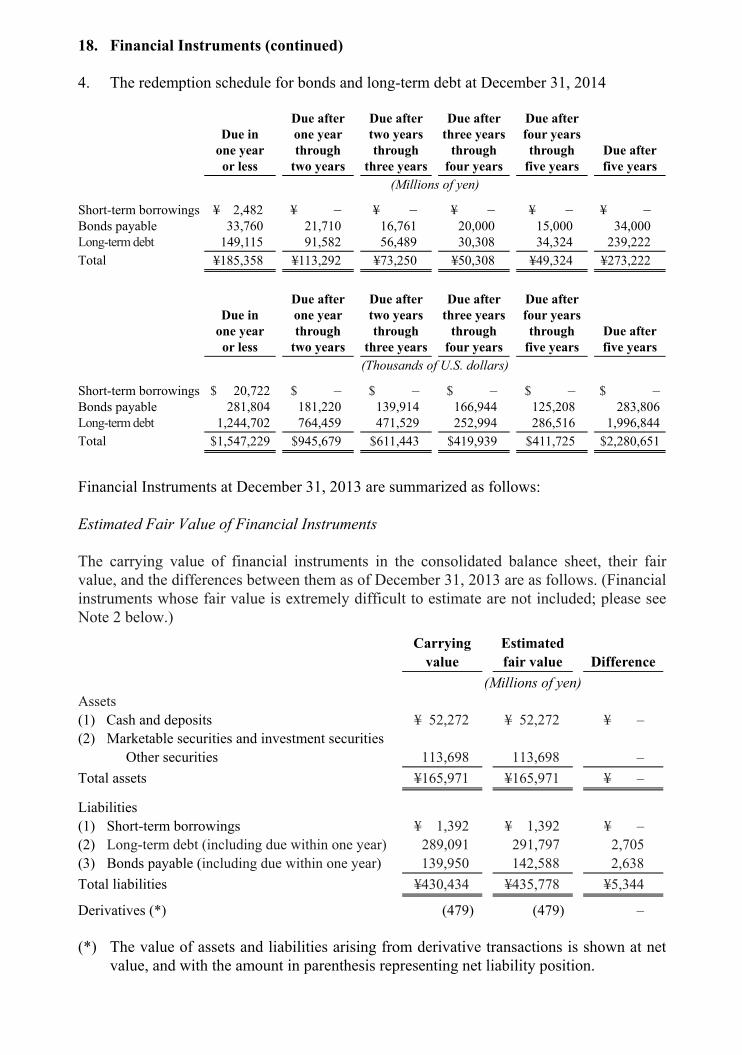
32
18. Financial Instruments (continued) 4. The redemption schedule for bonds and long-term debt at December 31, 2014
Due in one year or less
Due after one year through
two years
Due after two years through
three years
Due after three years
through four years
Due after four years through
five years Due after five years
(Millions of yen)
Short-term borrowings ¥ 2,482 ¥ – ¥ – ¥ – ¥ – ¥ – Bonds payable 33,760 21,710 16,761 20,000 15,000 34,000 Long-term debt 149,115 91,582 56,489 30,308 34,324 239,222 Total ¥185,358 ¥113,292 ¥73,250 ¥50,308 ¥49,324 ¥273,222
Due in one year or less
Due after one year through
two years
Due after two years through
three years
Due after three years
through four years
Due after four years through
five years Due after five years
(Thousands of U.S. dollars)
Short-term borrowings $ 20,722 $ – $ – $ – $ – $ –Bonds payable 281,804 181,220 139,914 166,944 125,208 283,806Long-term debt 1,244,702 764,459 471,529 252,994 286,516 1,996,844Total $1,547,229 $945,679 $611,443 $419,939 $411,725 $2,280,651
Financial Instruments at December 31, 2013 are summarized as follows: Estimated Fair Value of Financial Instruments The carrying value of financial instruments in the consolidated balance sheet, their fair value, and the differences between them as of December 31, 2013 are as follows. (Financial instruments whose fair value is extremely difficult to estimate are not included; please see Note 2 below.)
Carrying
value Estimated fair value Difference
(Millions of yen) Assets (1) Cash and deposits ¥ 52,272 ¥ 52,272 ¥ – (2) Marketable securities and investment securities
Other securities 113,698 113,698 – Total assets ¥165,971 ¥165,971 ¥ –
Liabilities (1) Short-term borrowings ¥ 1,392 ¥ 1,392 ¥ – (2) Long-term debt (including due within one year) 289,091 291,797 2,705 (3) Bonds payable (including due within one year) 139,950 142,588 2,638 Total liabilities ¥430,434 ¥435,778 ¥5,344
Derivatives (*) (479) (479) – (*) The value of assets and liabilities arising from derivative transactions is shown at net
value, and with the amount in parenthesis representing net liability position.
010_0479001372704.indd 34 2015/05/19 21:39:01
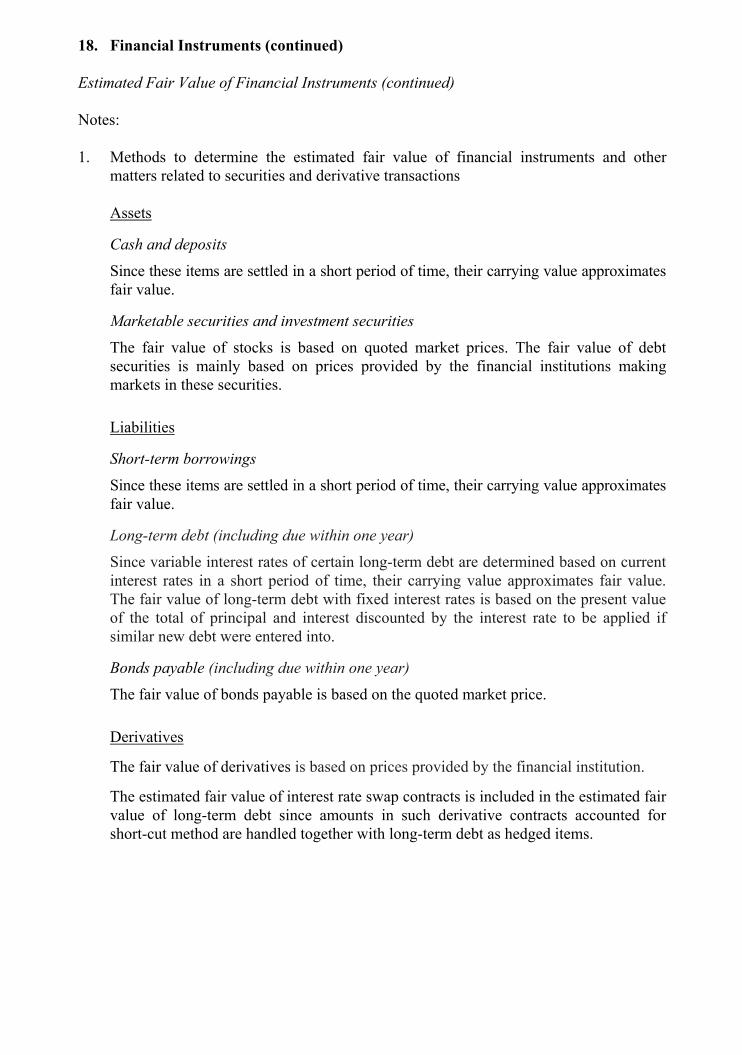
33
18. Financial Instruments (continued) Estimated Fair Value of Financial Instruments (continued) Notes: 1. Methods to determine the estimated fair value of financial instruments and other
matters related to securities and derivative transactions Assets
Cash and deposits
Since these items are settled in a short period of time, their carrying value approximates fair value.
Marketable securities and investment securities
The fair value of stocks is based on quoted market prices. The fair value of debt securities is mainly based on prices provided by the financial institutions making markets in these securities. Liabilities
Short-term borrowings Since these items are settled in a short period of time, their carrying value approximates fair value.
Long-term debt (including due within one year) Since variable interest rates of certain long-term debt are determined based on current interest rates in a short period of time, their carrying value approximates fair value. The fair value of long-term debt with fixed interest rates is based on the present value of the total of principal and interest discounted by the interest rate to be applied if similar new debt were entered into.
Bonds payable (including due within one year) The fair value of bonds payable is based on the quoted market price. Derivatives
The fair value of derivatives is based on prices provided by the financial institution.
The estimated fair value of interest rate swap contracts is included in the estimated fair value of long-term debt since amounts in such derivative contracts accounted for short-cut method are handled together with long-term debt as hedged items.
010_0479001372704.indd 35 2015/05/19 21:39:01
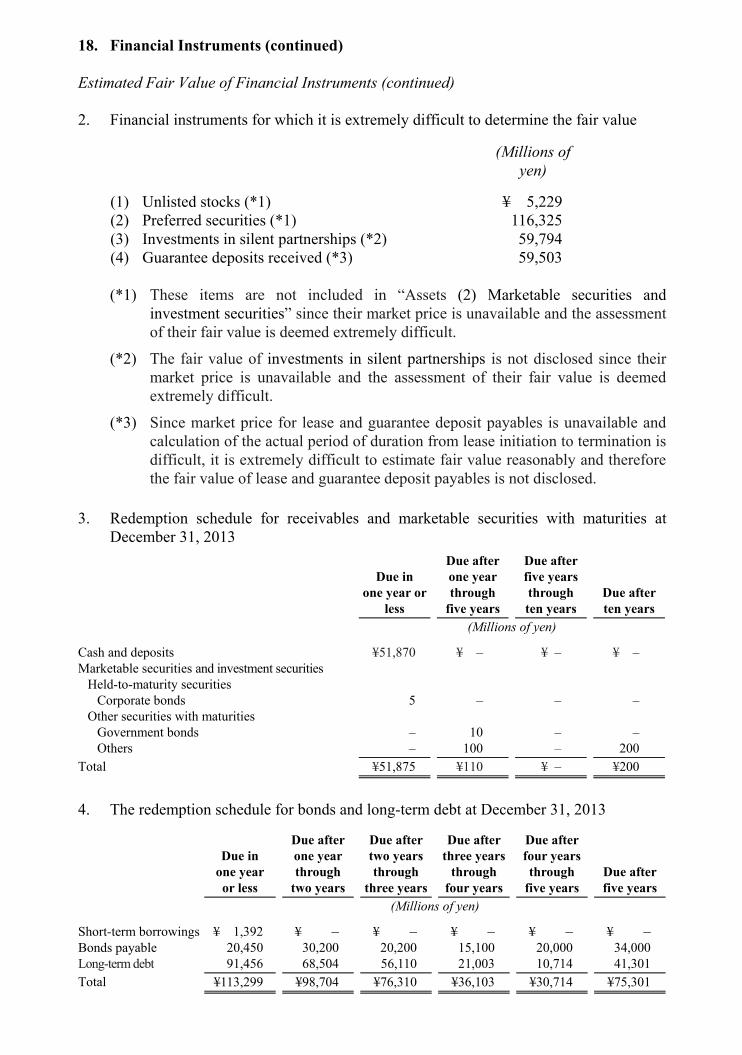
34
18. Financial Instruments (continued) Estimated Fair Value of Financial Instruments (continued) 2. Financial instruments for which it is extremely difficult to determine the fair value
(Millions of yen)
(1) Unlisted stocks (*1) ¥ 5,229 (2) Preferred securities (*1) 116,325 (3) Investments in silent partnerships (*2) 59,794 (4) Guarantee deposits received (*3) 59,503 (*1) These items are not included in “Assets (2) Marketable securities and
investment securities” since their market price is unavailable and the assessment of their fair value is deemed extremely difficult.
(*2) The fair value of investments in silent partnerships is not disclosed since their market price is unavailable and the assessment of their fair value is deemed extremely difficult.
(*3) Since market price for lease and guarantee deposit payables is unavailable and calculation of the actual period of duration from lease initiation to termination is difficult, it is extremely difficult to estimate fair value reasonably and therefore the fair value of lease and guarantee deposit payables is not disclosed.
3. Redemption schedule for receivables and marketable securities with maturities at
December 31, 2013
Due in one year or
less
Due after one year through
five years
Due after five years through ten years
Due after ten years
(Millions of yen)
Cash and deposits ¥51,870 ¥ – ¥ – ¥ – Marketable securities and investment securities
Held-to-maturity securities Corporate bonds 5 – – –
Other securities with maturities Government bonds – 10 – – Others – 100 – 200
Total ¥51,875 ¥110 ¥ – ¥200
4. The redemption schedule for bonds and long-term debt at December 31, 2013
Due in one year or less
Due after one year through
two years
Due after two years through
three years
Due after three years
through four years
Due after four years through
five years Due after five years
(Millions of yen)
Short-term borrowings ¥ 1,392 ¥ – ¥ – ¥ – ¥ – ¥ – Bonds payable 20,450 30,200 20,200 15,100 20,000 34,000 Long-term debt 91,456 68,504 56,110 21,003 10,714 41,301 Total ¥113,299 ¥98,704 ¥76,310 ¥36,103 ¥30,714 ¥75,301
010_0479001372704.indd 36 2015/05/19 21:39:01
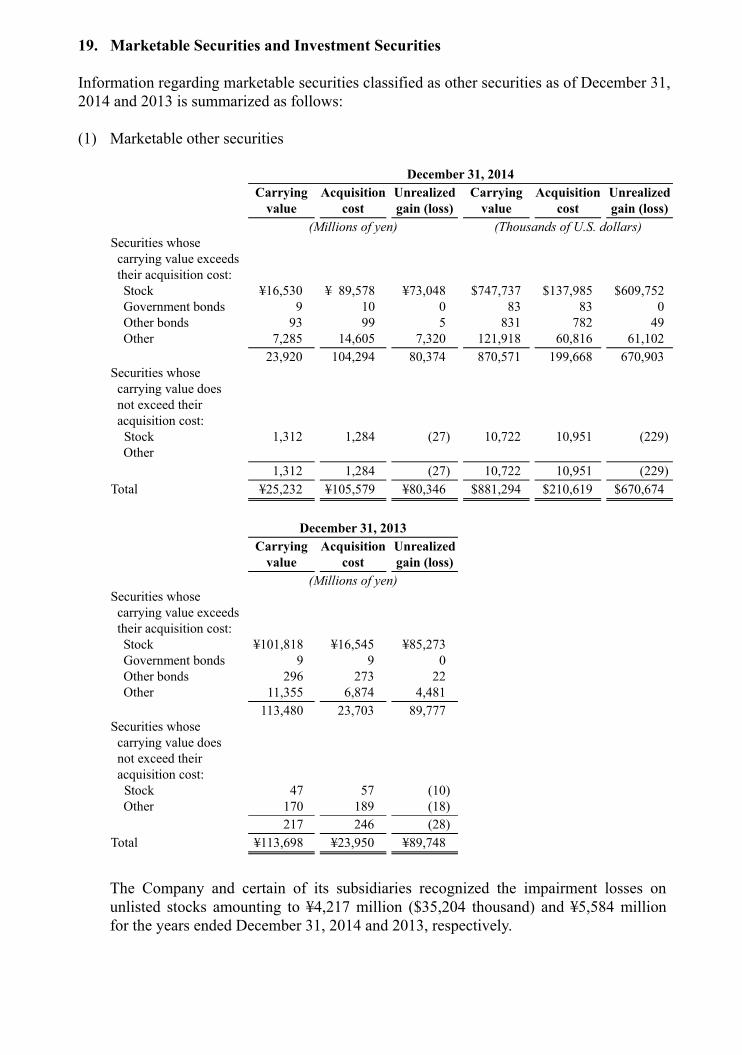
35
19. Marketable Securities and Investment Securities Information regarding marketable securities classified as other securities as of December 31, 2014 and 2013 is summarized as follows: (1) Marketable other securities
December 31, 2014
Carrying
value Acquisition
cost Unrealized gain (loss)
Carrying value
Acquisition cost
Unrealized gain (loss)
(Millions of yen) (Thousands of U.S. dollars) Securities whose carrying value exceeds their acquisition cost:
Stock ¥16,530 ¥ 89,578 ¥73,048 $747,737 $137,985 $609,752Government bonds 9 10 0 83 83 0Other bonds 93 99 5 831 782 49Other 7,285 14,605 7,320 121,918 60,816 61,102
23,920 104,294 80,374 870,571 199,668 670,903Securities whose carrying value does not exceed their acquisition cost:
Stock 1,312 1,284 (27) 10,722 10,951 (229)Other
1,312 1,284 (27) 10,722 10,951 (229)Total ¥25,232 ¥105,579 ¥80,346 $881,294 $210,619 $670,674
December 31, 2013
Carrying
value Acquisition
cost Unrealized gain (loss)
(Millions of yen) Securities whose carrying value exceeds their acquisition cost:
Stock ¥101,818 ¥16,545 ¥85,273 Government bonds 9 9 0 Other bonds 296 273 22 Other 11,355 6,874 4,481
113,480 23,703 89,777 Securities whose carrying value does not exceed their acquisition cost:
Stock 47 57 (10)Other 170 189 (18)
217 246 (28)Total ¥113,698 ¥23,950 ¥89,748
The Company and certain of its subsidiaries recognized the impairment losses on
unlisted stocks amounting to ¥4,217 million ($35,204 thousand) and ¥5,584 million for the years ended December 31, 2014 and 2013, respectively.
010_0479001372704.indd 37 2015/05/19 21:39:01
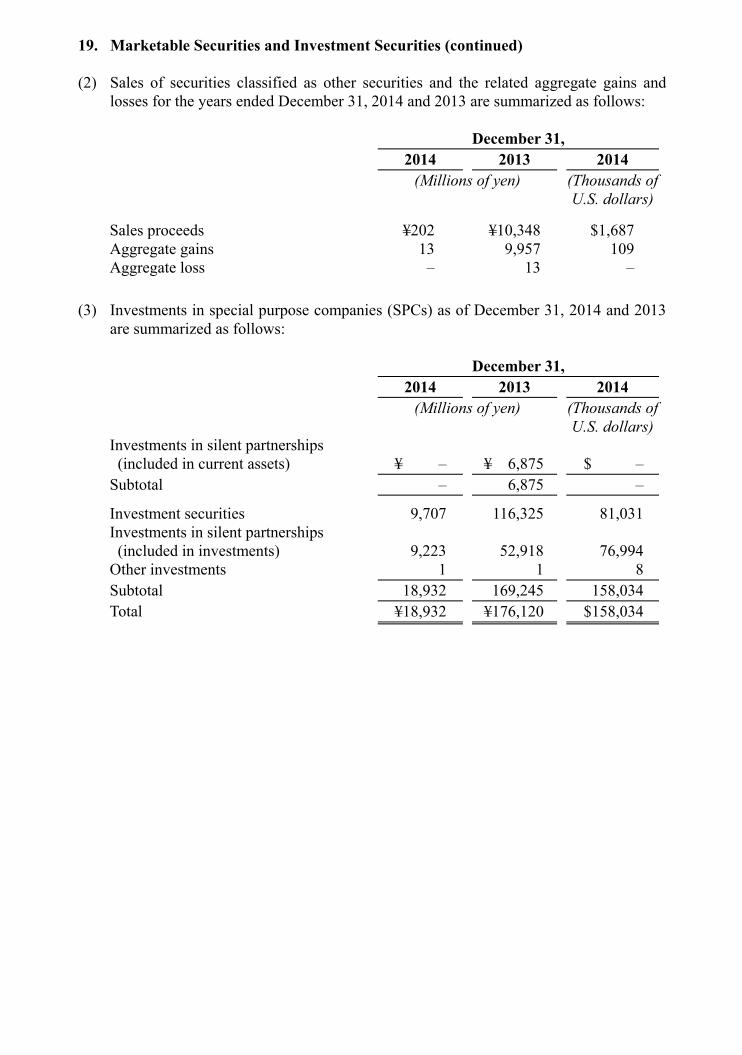
36
19. Marketable Securities and Investment Securities (continued) (2) Sales of securities classified as other securities and the related aggregate gains and
losses for the years ended December 31, 2014 and 2013 are summarized as follows:
December 31, 2014 2013 2014 (Millions of yen) (Thousands of
U.S. dollars)
Sales proceeds ¥202 ¥10,348 $1,687 Aggregate gains 13 9,957 109 Aggregate loss – 13 –
(3) Investments in special purpose companies (SPCs) as of December 31, 2014 and 2013
are summarized as follows:
December 31, 2014 2013 2014 (Millions of yen) (Thousands of
U.S. dollars)Investments in silent partnerships (included in current assets)
¥ –
¥ 6,875
$ –
Subtotal – 6,875 –
Investment securities 9,707 116,325 81,031 Investments in silent partnerships (included in investments) 9,223 52,918 76,994
Other investments 1 1 8 Subtotal 18,932 169,245 158,034 Total ¥18,932 ¥176,120 $158,034
010_0479001372704.indd 38 2015/05/19 21:39:01
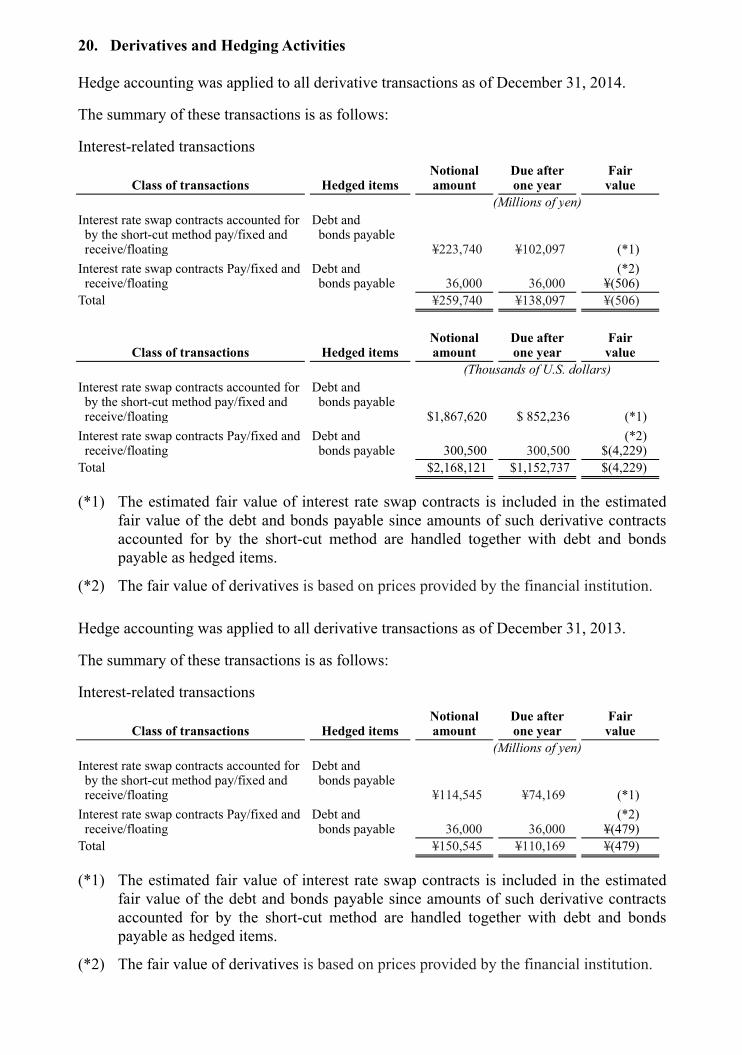
37
20. Derivatives and Hedging Activities Hedge accounting was applied to all derivative transactions as of December 31, 2014. The summary of these transactions is as follows: Interest-related transactions
Class of transactions Hedged items Notional amount
Due after one year
Fairvalue
(Millions of yen) Interest rate swap contracts accounted for by the short-cut method pay/fixed and receive/floating
Debt and bonds payable
¥223,740 ¥102,097 (*1)Interest rate swap contracts Pay/fixed and receive/floating
Debt and bonds payable
36,000
36,000
(*2) ¥(506)
Total ¥259,740 ¥138,097 ¥(506)
Class of transactions Hedged items Notional amount
Due after one year
Fairvalue
(Thousands of U.S. dollars) Interest rate swap contracts accounted for by the short-cut method pay/fixed and receive/floating
Debt and bonds payable
$1,867,620 $ 852,236 (*1)Interest rate swap contracts Pay/fixed and receive/floating
Debt and bonds payable 300,500
300,500
(*2) $(4,229)
Total $2,168,121 $1,152,737 $(4,229)
(*1) The estimated fair value of interest rate swap contracts is included in the estimated fair value of the debt and bonds payable since amounts of such derivative contracts accounted for by the short-cut method are handled together with debt and bonds payable as hedged items.
(*2) The fair value of derivatives is based on prices provided by the financial institution. Hedge accounting was applied to all derivative transactions as of December 31, 2013. The summary of these transactions is as follows: Interest-related transactions
Class of transactions Hedged items Notional amount
Due after one year
Fairvalue
(Millions of yen) Interest rate swap contracts accounted for by the short-cut method pay/fixed and receive/floating
Debt and bonds payable
¥114,545 ¥74,169 (*1)Interest rate swap contracts Pay/fixed and receive/floating
Debt and bonds payable
36,000
36,000
(*2) ¥(479)
Total ¥150,545 ¥110,169 ¥(479)
(*1) The estimated fair value of interest rate swap contracts is included in the estimated fair value of the debt and bonds payable since amounts of such derivative contracts accounted for by the short-cut method are handled together with debt and bonds payable as hedged items.
(*2) The fair value of derivatives is based on prices provided by the financial institution.
010_0479001372704.indd 39 2015/05/19 21:39:01
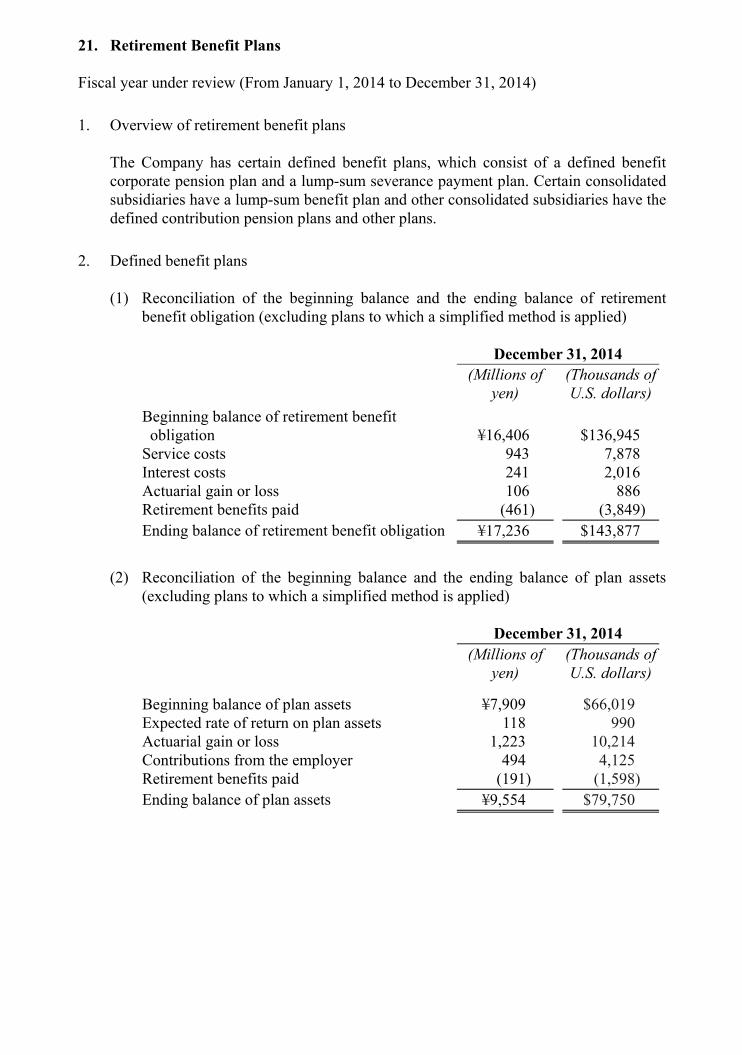
38
21. Retirement Benefit Plans Fiscal year under review (From January 1, 2014 to December 31, 2014) 1. Overview of retirement benefit plans The Company has certain defined benefit plans, which consist of a defined benefit
corporate pension plan and a lump-sum severance payment plan. Certain consolidated subsidiaries have a lump-sum benefit plan and other consolidated subsidiaries have the defined contribution pension plans and other plans.
2. Defined benefit plans
(1) Reconciliation of the beginning balance and the ending balance of retirement
benefit obligation (excluding plans to which a simplified method is applied)
December 31, 2014 (Millions of
yen) (Thousands of U.S. dollars)
Beginning balance of retirement benefit obligation ¥16,406 $136,945
Service costs 943 7,878 Interest costs 241 2,016 Actuarial gain or loss 106 886 Retirement benefits paid (461) (3,849) Ending balance of retirement benefit obligation ¥17,236 $143,877
(2) Reconciliation of the beginning balance and the ending balance of plan assets
(excluding plans to which a simplified method is applied)
December 31, 2014 (Millions of
yen) (Thousands of U.S. dollars)
Beginning balance of plan assets ¥7,909 $66,019 Expected rate of return on plan assets 118 990 Actuarial gain or loss 1,223 10,214 Contributions from the employer 494 4,125 Retirement benefits paid (191) (1,598) Ending balance of plan assets ¥9,554 $79,750
010_0479001372704.indd 40 2015/05/19 21:39:01
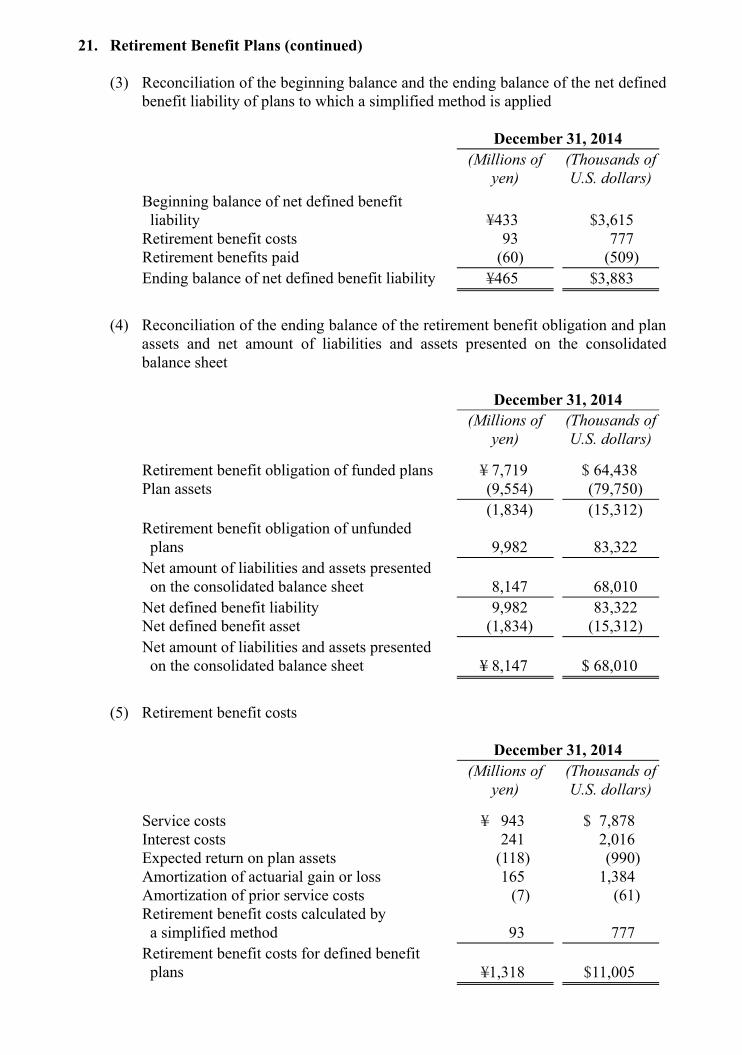
39
21. Retirement Benefit Plans (continued)
(3) Reconciliation of the beginning balance and the ending balance of the net defined benefit liability of plans to which a simplified method is applied
December 31, 2014 (Millions of
yen) (Thousands of U.S. dollars)
Beginning balance of net defined benefit liability ¥433 $3,615
Retirement benefit costs 93 777 Retirement benefits paid (60) (509) Ending balance of net defined benefit liability ¥465 $3,883
(4) Reconciliation of the ending balance of the retirement benefit obligation and plan
assets and net amount of liabilities and assets presented on the consolidated balance sheet
December 31, 2014 (Millions of
yen)(Thousands of U.S. dollars)
Retirement benefit obligation of funded plans ¥ 7,719 $ 64,438 Plan assets (9,554) (79,750) (1,834) (15,312) Retirement benefit obligation of unfunded plans
9,982
83,322
Net amount of liabilities and assets presented on the consolidated balance sheet
8,147
68,010
Net defined benefit liability 9,982 83,322 Net defined benefit asset (1,834) (15,312) Net amount of liabilities and assets presented on the consolidated balance sheet
¥ 8,147
$ 68,010
(5) Retirement benefit costs
December 31, 2014 (Millions of
yen) (Thousands of U.S. dollars)
Service costs ¥ 943 $ 7,878 Interest costs 241 2,016 Expected return on plan assets (118) (990) Amortization of actuarial gain or loss 165 1,384 Amortization of prior service costs (7) (61) Retirement benefit costs calculated by a simplified method
93
777
Retirement benefit costs for defined benefit plans
¥1,318
$11,005
010_0479001372704.indd 41 2015/05/19 21:39:01
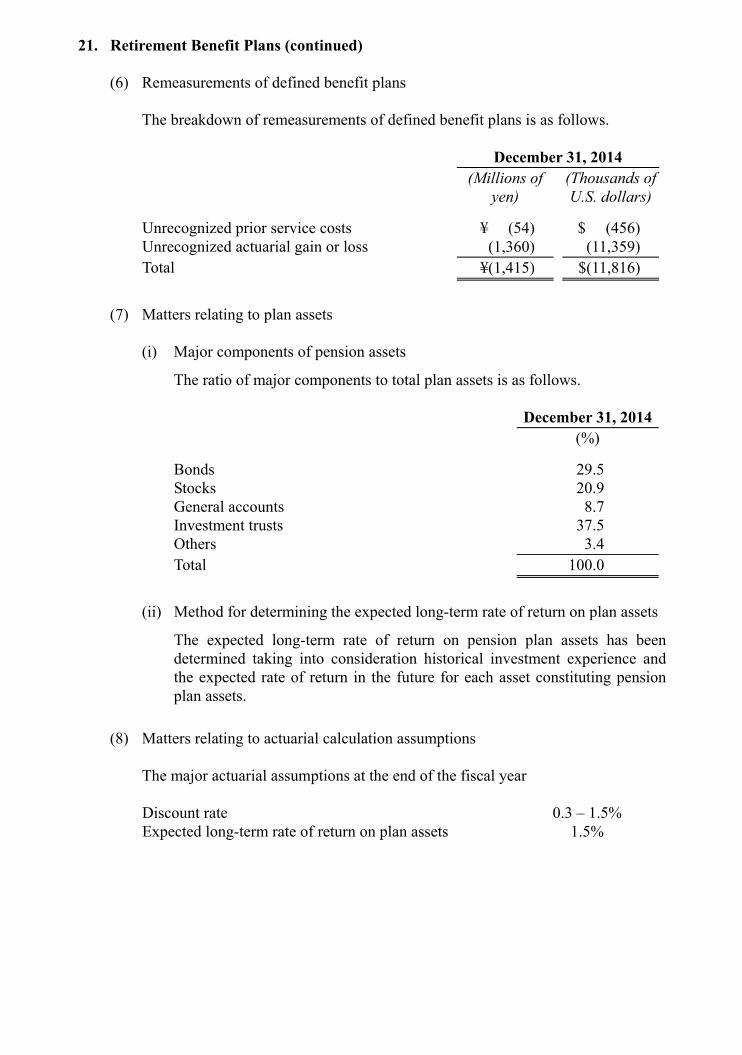
40
21. Retirement Benefit Plans (continued)
(6) Remeasurements of defined benefit plans The breakdown of remeasurements of defined benefit plans is as follows.
December 31, 2014 (Millions of
yen)(Thousands of U.S. dollars)
Unrecognized prior service costs ¥ (54) $ (456) Unrecognized actuarial gain or loss (1,360) (11,359) Total ¥(1,415) $(11,816)
(7) Matters relating to plan assets
(i) Major components of pension assets
The ratio of major components to total plan assets is as follows.
December 31, 2014 (%)
Bonds 29.5 Stocks 20.9 General accounts 8.7 Investment trusts 37.5 Others 3.4 Total 100.0
(ii) Method for determining the expected long-term rate of return on plan assets
The expected long-term rate of return on pension plan assets has been determined taking into consideration historical investment experience and the expected rate of return in the future for each asset constituting pension plan assets.
(8) Matters relating to actuarial calculation assumptions The major actuarial assumptions at the end of the fiscal year
Discount rate 0.3 – 1.5% Expected long-term rate of return on plan assets 1.5%
010_0479001372704.indd 42 2015/05/19 21:39:01
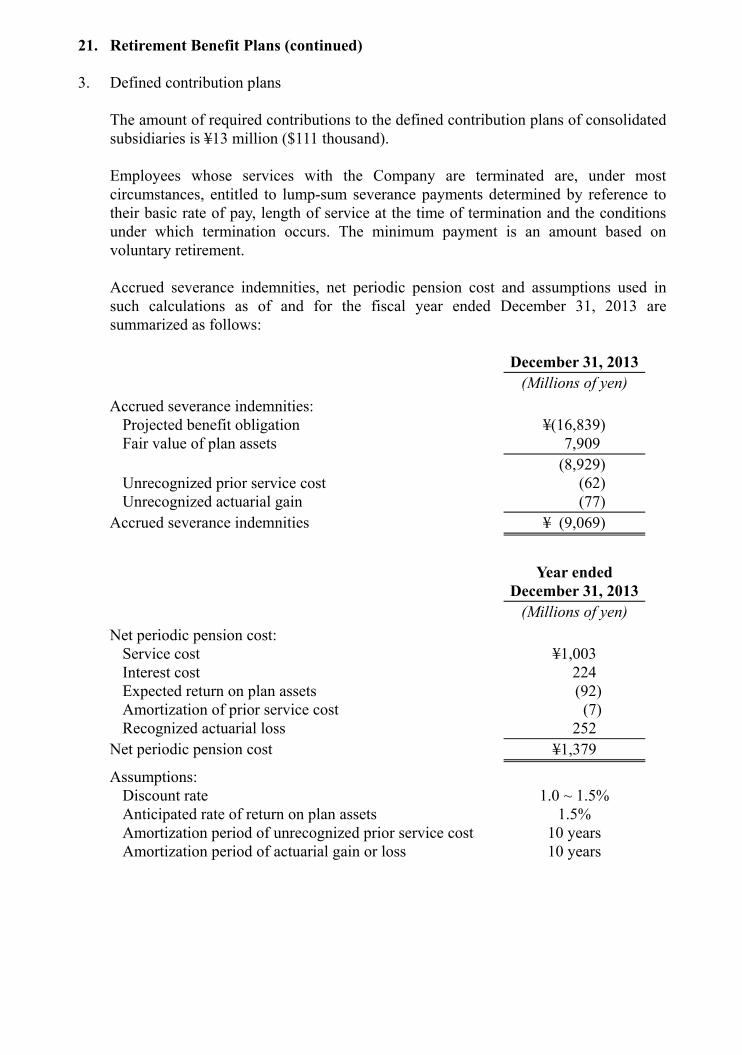
41
21. Retirement Benefit Plans (continued) 3. Defined contribution plans The amount of required contributions to the defined contribution plans of consolidated
subsidiaries is ¥13 million ($111 thousand). Employees whose services with the Company are terminated are, under most
circumstances, entitled to lump-sum severance payments determined by reference to their basic rate of pay, length of service at the time of termination and the conditions under which termination occurs. The minimum payment is an amount based on voluntary retirement.
Accrued severance indemnities, net periodic pension cost and assumptions used in
such calculations as of and for the fiscal year ended December 31, 2013 are summarized as follows:
December 31, 2013 (Millions of yen) Accrued severance indemnities:
Projected benefit obligation ¥(16,839) Fair value of plan assets 7,909 (8,929) Unrecognized prior service cost (62) Unrecognized actuarial gain (77)
Accrued severance indemnities ¥ (9,069)
Year ended
December 31, 2013 (Millions of yen) Net periodic pension cost:
Service cost ¥1,003 Interest cost 224 Expected return on plan assets (92) Amortization of prior service cost (7) Recognized actuarial loss 252
Net periodic pension cost ¥1,379
Assumptions: Discount rate 1.0 ~ 1.5% Anticipated rate of return on plan assets 1.5% Amortization period of unrecognized prior service cost 10 years Amortization period of actuarial gain or loss 10 years
010_0479001372704.indd 43 2015/05/19 21:39:01
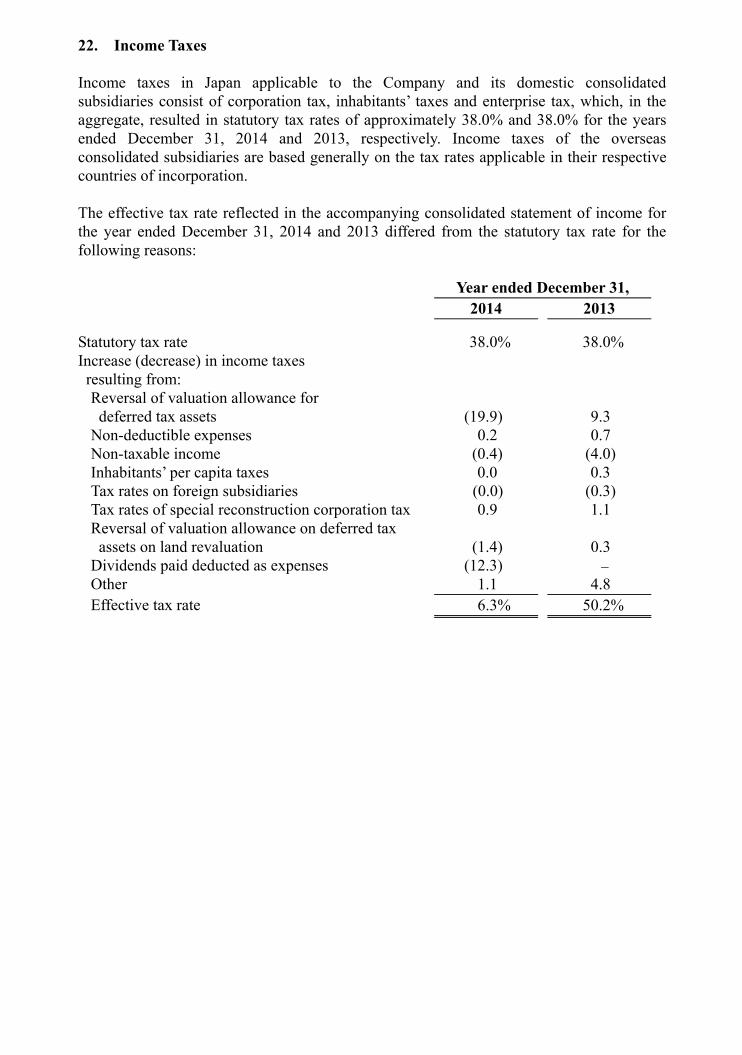
42
22. Income Taxes Income taxes in Japan applicable to the Company and its domestic consolidated subsidiaries consist of corporation tax, inhabitants’ taxes and enterprise tax, which, in the aggregate, resulted in statutory tax rates of approximately 38.0% and 38.0% for the years ended December 31, 2014 and 2013, respectively. Income taxes of the overseas consolidated subsidiaries are based generally on the tax rates applicable in their respective countries of incorporation. The effective tax rate reflected in the accompanying consolidated statement of income for the year ended December 31, 2014 and 2013 differed from the statutory tax rate for the following reasons: Year ended December 31, 2014 2013
Statutory tax rate 38.0% 38.0% Increase (decrease) in income taxes resulting from: Reversal of valuation allowance for deferred tax assets (19.9) 9.3
Non-deductible expenses 0.2 0.7 Non-taxable income (0.4) (4.0) Inhabitants’ per capita taxes 0.0 0.3 Tax rates on foreign subsidiaries (0.0) (0.3) Tax rates of special reconstruction corporation tax 0.9 1.1 Reversal of valuation allowance on deferred tax assets on land revaluation (1.4) 0.3
Dividends paid deducted as expenses (12.3) – Other 1.1 4.8 Effective tax rate 6.3% 50.2%
010_0479001372704.indd 44 2015/05/19 21:39:01
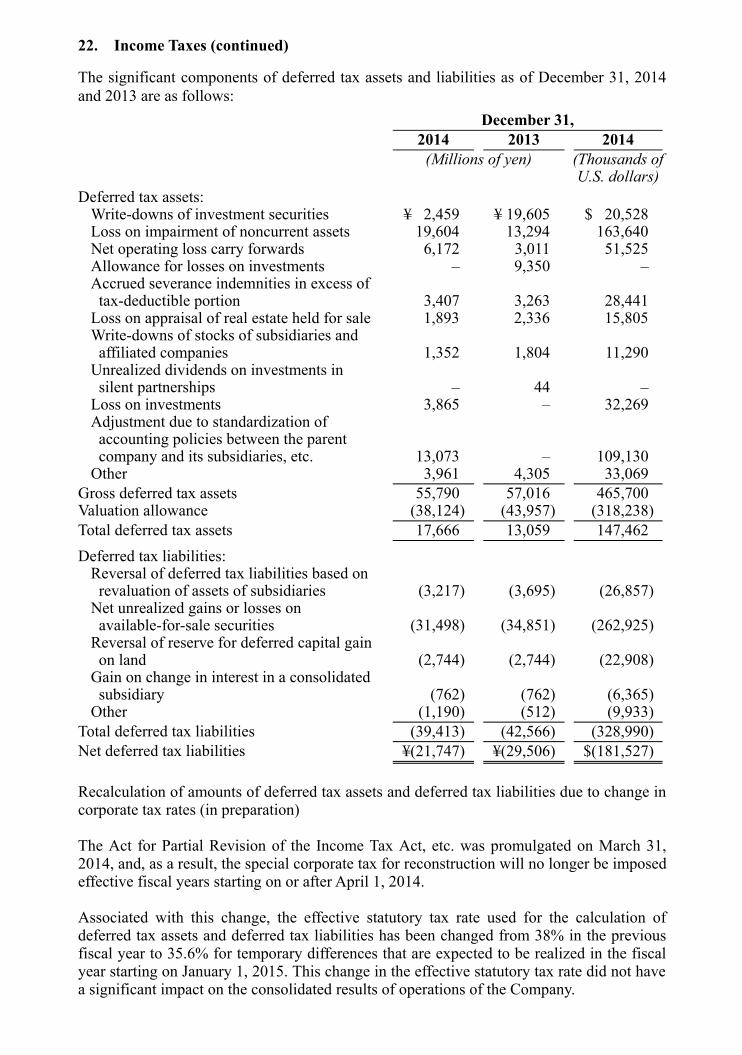
43
22. Income Taxes (continued) The significant components of deferred tax assets and liabilities as of December 31, 2014 and 2013 are as follows: December 31, 2014 2013 2014 (Millions of yen) (Thousands of
U.S. dollars)Deferred tax assets:
Write-downs of investment securities ¥ 2,459 ¥ 19,605 $ 20,528Loss on impairment of noncurrent assets 19,604 13,294 163,640Net operating loss carry forwards 6,172 3,011 51,525Allowance for losses on investments – 9,350 –Accrued severance indemnities in excess of tax-deductible portion 3,407 3,263 28,441
Loss on appraisal of real estate held for sale 1,893 2,336 15,805Write-downs of stocks of subsidiaries and affiliated companies 1,352 1,804 11,290
Unrealized dividends on investments in silent partnerships – 44 –
Loss on investments 3,865 – 32,269Adjustment due to standardization of accounting policies between the parent company and its subsidiaries, etc. 13,073 – 109,130
Other 3,961 4,305 33,069Gross deferred tax assets 55,790 57,016 465,700Valuation allowance (38,124) (43,957) (318,238)Total deferred tax assets 17,666 13,059 147,462Deferred tax liabilities:
Reversal of deferred tax liabilities based on revaluation of assets of subsidiaries (3,217) (3,695) (26,857)
Net unrealized gains or losses on available-for-sale securities (31,498) (34,851) (262,925)
Reversal of reserve for deferred capital gain on land (2,744) (2,744) (22,908)
Gain on change in interest in a consolidated subsidiary (762) (762) (6,365)
Other (1,190) (512) (9,933)Total deferred tax liabilities (39,413) (42,566) (328,990)Net deferred tax liabilities ¥(21,747) ¥(29,506) $(181,527) Recalculation of amounts of deferred tax assets and deferred tax liabilities due to change in corporate tax rates (in preparation) The Act for Partial Revision of the Income Tax Act, etc. was promulgated on March 31, 2014, and, as a result, the special corporate tax for reconstruction will no longer be imposed effective fiscal years starting on or after April 1, 2014. Associated with this change, the effective statutory tax rate used for the calculation of deferred tax assets and deferred tax liabilities has been changed from 38% in the previous fiscal year to 35.6% for temporary differences that are expected to be realized in the fiscal year starting on January 1, 2015. This change in the effective statutory tax rate did not have a significant impact on the consolidated results of operations of the Company.
010_0479001372704.indd 45 2015/05/19 21:39:01
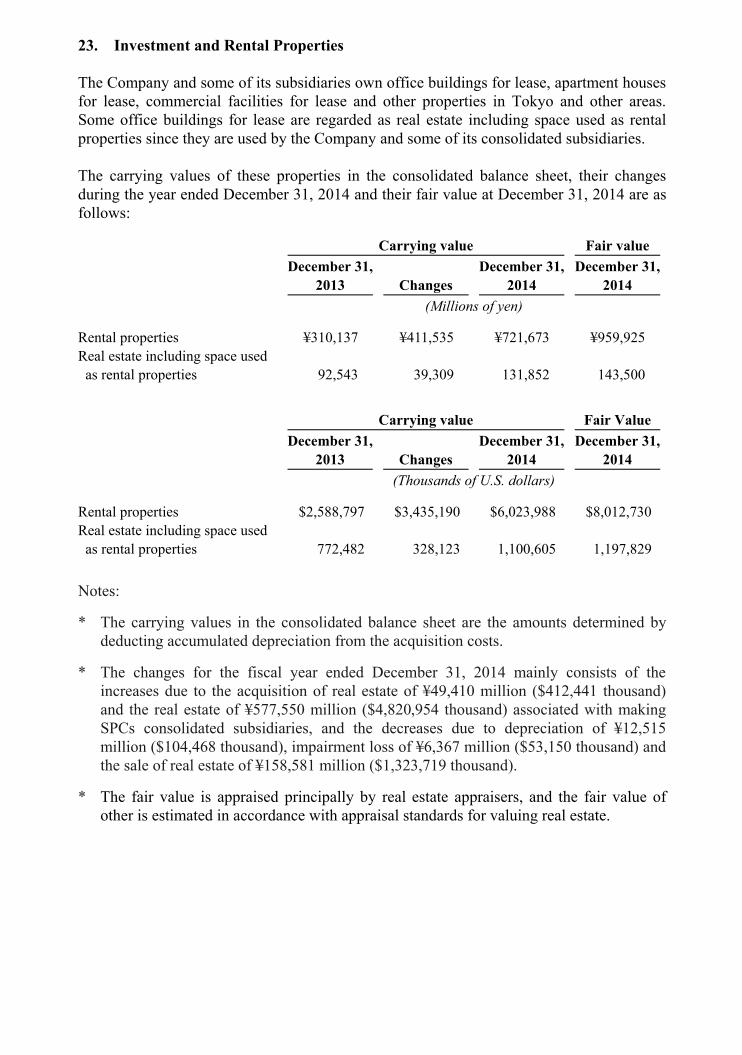
44
23. Investment and Rental Properties The Company and some of its subsidiaries own office buildings for lease, apartment houses for lease, commercial facilities for lease and other properties in Tokyo and other areas. Some office buildings for lease are regarded as real estate including space used as rental properties since they are used by the Company and some of its consolidated subsidiaries. The carrying values of these properties in the consolidated balance sheet, their changes during the year ended December 31, 2014 and their fair value at December 31, 2014 are as follows: Carrying value Fair value
December 31,
2013 Changes December 31,
2014 December 31,
2014 (Millions of yen)
Rental properties ¥310,137 ¥411,535 ¥721,673 ¥959,925 Real estate including space used
as rental properties 92,543 39,309 131,852 143,500
Carrying value Fair Value
December 31,
2013 Changes December 31,
2014 December 31,
2014 (Thousands of U.S. dollars)
Rental properties $2,588,797 $3,435,190 $6,023,988 $8,012,730 Real estate including space used
as rental properties 772,482 328,123 1,100,605 1,197,829 Notes:
* The carrying values in the consolidated balance sheet are the amounts determined by deducting accumulated depreciation from the acquisition costs.
* The changes for the fiscal year ended December 31, 2014 mainly consists of the increases due to the acquisition of real estate of ¥49,410 million ($412,441 thousand) and the real estate of ¥577,550 million ($4,820,954 thousand) associated with making SPCs consolidated subsidiaries, and the decreases due to depreciation of ¥12,515 million ($104,468 thousand), impairment loss of ¥6,367 million ($53,150 thousand) and the sale of real estate of ¥158,581 million ($1,323,719 thousand).
* The fair value is appraised principally by real estate appraisers, and the fair value of other is estimated in accordance with appraisal standards for valuing real estate.
010_0479001372704.indd 46 2015/05/19 21:39:01
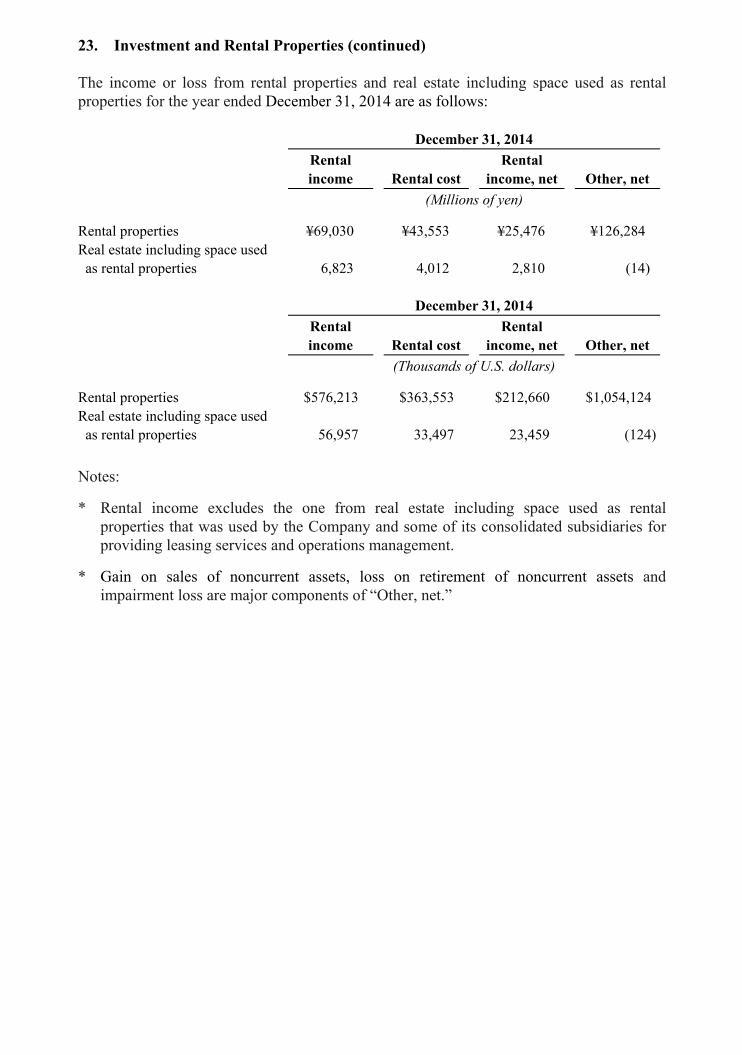
45
23. Investment and Rental Properties (continued) The income or loss from rental properties and real estate including space used as rental properties for the year ended December 31, 2014 are as follows: December 31, 2014
Rental income Rental cost
Rental income, net Other, net
(Millions of yen)
Rental properties ¥69,030 ¥43,553 ¥25,476 ¥126,284 Real estate including space used
as rental properties 6,823 4,012 2,810 (14) December 31, 2014
Rental income Rental cost
Rental income, net Other, net
(Thousands of U.S. dollars)
Rental properties $576,213 $363,553 $212,660 $1,054,124 Real estate including space used
as rental properties 56,957 33,497 23,459 (124) Notes:
* Rental income excludes the one from real estate including space used as rental properties that was used by the Company and some of its consolidated subsidiaries for providing leasing services and operations management.
* Gain on sales of noncurrent assets, loss on retirement of noncurrent assets and impairment loss are major components of “Other, net.”
010_0479001372704.indd 47 2015/05/19 21:39:01
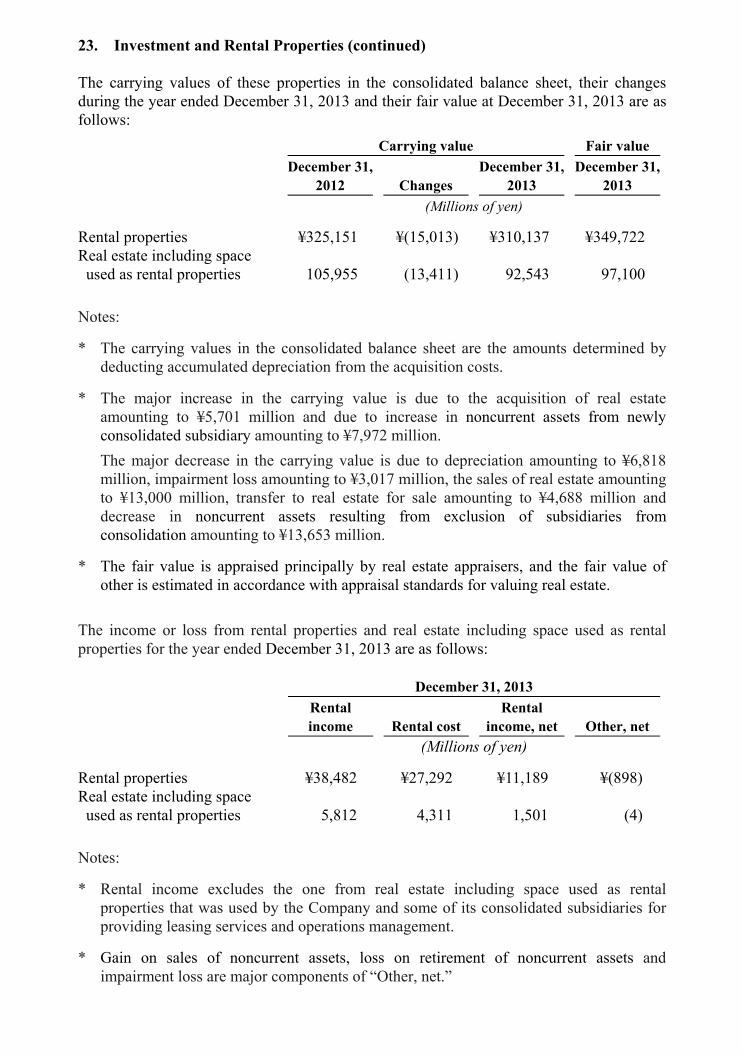
46
23. Investment and Rental Properties (continued) The carrying values of these properties in the consolidated balance sheet, their changes during the year ended December 31, 2013 and their fair value at December 31, 2013 are as follows: Carrying value Fair value
December 31,
2012 Changes December 31,
2013 December 31,
2013 (Millions of yen)
Rental properties ¥325,151 ¥(15,013) ¥310,137 ¥349,722 Real estate including space used as rental properties 105,955 (13,411) 92,543 97,100
Notes:
* The carrying values in the consolidated balance sheet are the amounts determined by deducting accumulated depreciation from the acquisition costs.
* The major increase in the carrying value is due to the acquisition of real estate amounting to ¥5,701 million and due to increase in noncurrent assets from newly consolidated subsidiary amounting to ¥7,972 million.
The major decrease in the carrying value is due to depreciation amounting to ¥6,818 million, impairment loss amounting to ¥3,017 million, the sales of real estate amounting to ¥13,000 million, transfer to real estate for sale amounting to ¥4,688 million and decrease in noncurrent assets resulting from exclusion of subsidiaries from consolidation amounting to ¥13,653 million.
* The fair value is appraised principally by real estate appraisers, and the fair value of other is estimated in accordance with appraisal standards for valuing real estate.
The income or loss from rental properties and real estate including space used as rental properties for the year ended December 31, 2013 are as follows: December 31, 2013
Rental income Rental cost
Rental income, net Other, net
(Millions of yen)
Rental properties ¥38,482 ¥27,292 ¥11,189 ¥(898) Real estate including space used as rental properties 5,812 4,311 1,501 (4)
Notes:
* Rental income excludes the one from real estate including space used as rental properties that was used by the Company and some of its consolidated subsidiaries for providing leasing services and operations management.
* Gain on sales of noncurrent assets, loss on retirement of noncurrent assets and impairment loss are major components of “Other, net.”
010_0479001372704.indd 48 2015/05/19 21:39:01
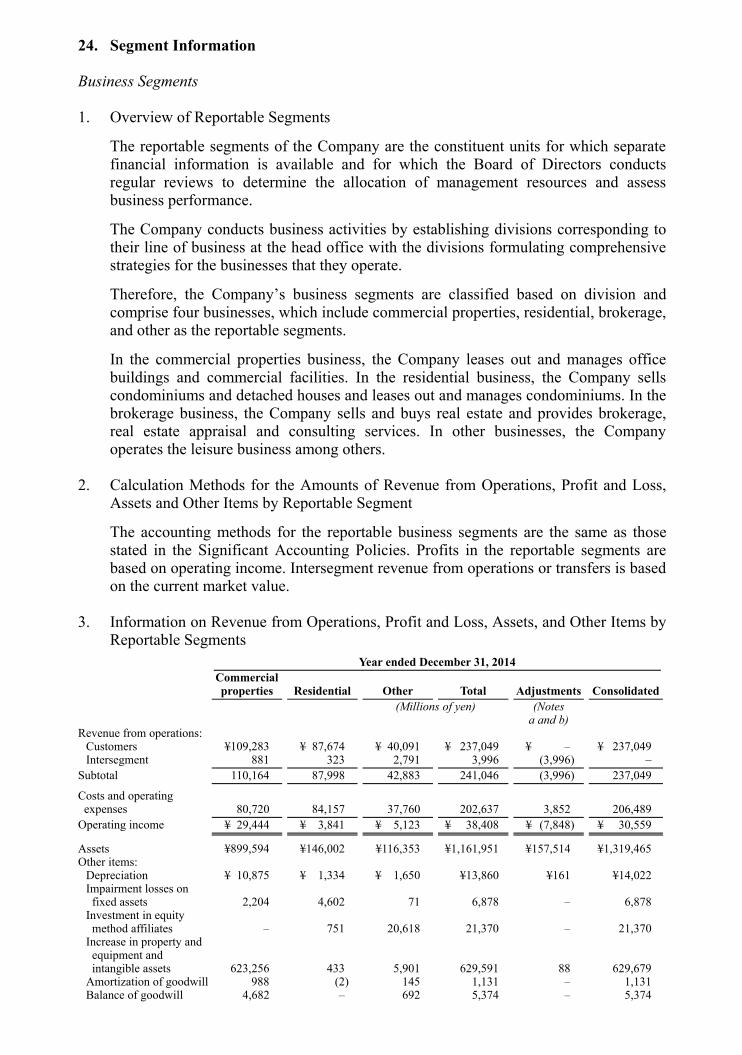
47
24. Segment Information Business Segments 1. Overview of Reportable Segments
The reportable segments of the Company are the constituent units for which separate financial information is available and for which the Board of Directors conducts regular reviews to determine the allocation of management resources and assess business performance.
The Company conducts business activities by establishing divisions corresponding to their line of business at the head office with the divisions formulating comprehensive strategies for the businesses that they operate.
Therefore, the Company’s business segments are classified based on division and comprise four businesses, which include commercial properties, residential, brokerage, and other as the reportable segments.
In the commercial properties business, the Company leases out and manages office buildings and commercial facilities. In the residential business, the Company sells condominiums and detached houses and leases out and manages condominiums. In the brokerage business, the Company sells and buys real estate and provides brokerage, real estate appraisal and consulting services. In other businesses, the Company operates the leisure business among others.
2. Calculation Methods for the Amounts of Revenue from Operations, Profit and Loss,
Assets and Other Items by Reportable Segment
The accounting methods for the reportable business segments are the same as those stated in the Significant Accounting Policies. Profits in the reportable segments are based on operating income. Intersegment revenue from operations or transfers is based on the current market value.
3. Information on Revenue from Operations, Profit and Loss, Assets, and Other Items by
Reportable Segments Year ended December 31, 2014
Commercial properties Residential Other Total Adjustments Consolidated
(Millions of yen) (Notes a and b)
Revenue from operations: Customers ¥109,283 ¥ 87,674 ¥ 40,091 ¥ 237,049 ¥ – ¥ 237,049Intersegment 881 323 2,791 3,996 (3,996) –
Subtotal 110,164 87,998 42,883 241,046 (3,996) 237,049
Costs and operating expenses
80,720
84,157
37,760
202,637
3,852
206,489
Operating income ¥ 29,444 ¥ 3,841 ¥ 5,123 ¥ 38,408 ¥ (7,848) ¥ 30,559
Assets ¥899,594 ¥146,002 ¥116,353 ¥1,161,951 ¥157,514 ¥1,319,465Other items:
Depreciation ¥ 10,875 ¥ 1,334 ¥ 1,650 ¥13,860 ¥161 ¥14,022Impairment losses on fixed assets 2,204 4,602 71 6,878 – 6,878
Investment in equity method affiliates – 751 20,618 21,370 – 21,370
Increase in property and equipment and intangible assets 623,256 433 5,901 629,591 88 629,679
Amortization of goodwill 988 (2) 145 1,131 – 1,131Balance of goodwill 4,682 – 692 5,374 – 5,374
010_0479001372704.indd 49 2015/05/19 21:39:01
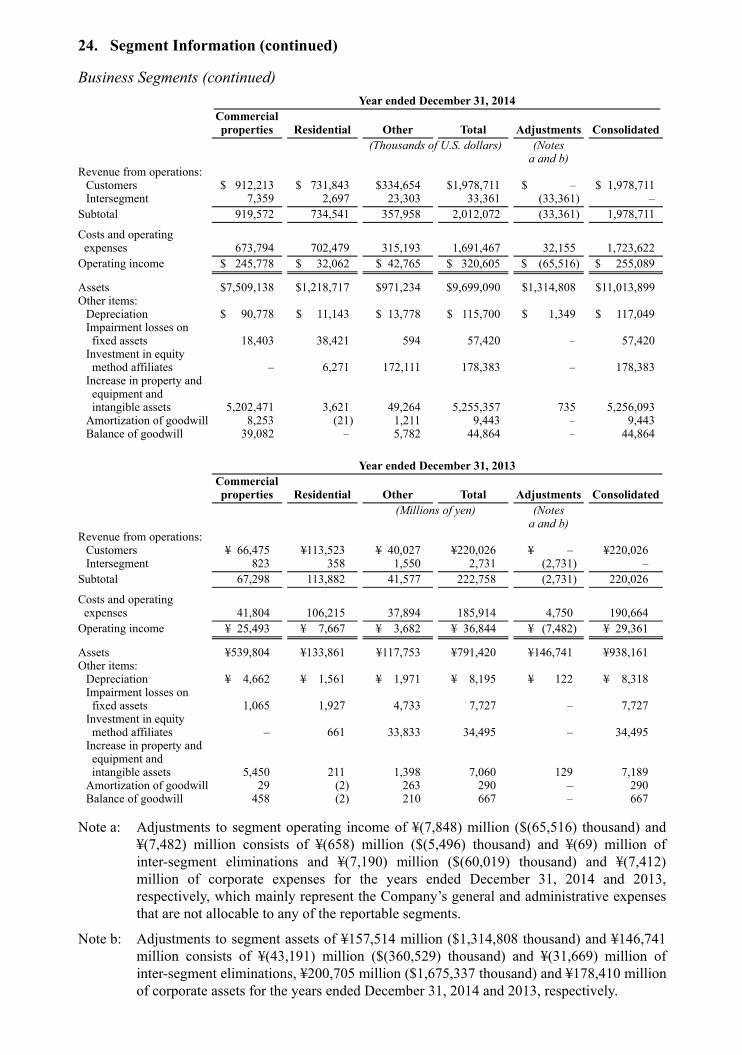
48
24. Segment Information (continued) Business Segments (continued) Year ended December 31, 2014
Commercial properties Residential Other Total Adjustments Consolidated
(Thousands of U.S. dollars) (Notes a and b)
Revenue from operations: Customers $ 912,213 $ 731,843 $334,654 $1,978,711 $ – $ 1,978,711Intersegment 7,359 2,697 23,303 33,361 (33,361) –
Subtotal 919,572 734,541 357,958 2,012,072 (33,361) 1,978,711
Costs and operating expenses
673,794 702,479
315,193 1,691,467
32,155 1,723,622
Operating income $ 245,778 $ 32,062 $ 42,765 $ 320,605 $ (65,516) $ 255,089
Assets $7,509,138 $1,218,717 $971,234 $9,699,090 $1,314,808 $11,013,899Other items:
Depreciation $ 90,778 $ 11,143 $ 13,778 $ 115,700 $ 1,349 $ 117,049Impairment losses on fixed assets 18,403 38,421 594 57,420 – 57,420
Investment in equity method affiliates – 6,271 172,111 178,383 – 178,383
Increase in property and equipment and intangible assets 5,202,471 3,621 49,264 5,255,357 735 5,256,093
Amortization of goodwill 8,253 (21) 1,211 9,443 – 9,443Balance of goodwill 39,082 – 5,782 44,864 – 44,864
Year ended December 31, 2013
Commercial properties Residential Other Total Adjustments Consolidated
(Millions of yen) (Notes a and b)
Revenue from operations: Customers ¥ 66,475 ¥113,523 ¥ 40,027 ¥220,026 ¥ – ¥220,026Intersegment 823 358 1,550 2,731 (2,731) –
Subtotal 67,298 113,882 41,577 222,758 (2,731) 220,026
Costs and operating expenses
41,804
106,215
37,894
185,914
4,750
190,664
Operating income ¥ 25,493 ¥ 7,667 ¥ 3,682 ¥ 36,844 ¥ (7,482) ¥ 29,361
Assets ¥539,804 ¥133,861 ¥117,753 ¥791,420 ¥146,741 ¥938,161Other items:
Depreciation ¥ 4,662 ¥ 1,561 ¥ 1,971 ¥ 8,195 ¥ 122 ¥ 8,318Impairment losses on fixed assets 1,065 1,927 4,733 7,727 – 7,727
Investment in equity method affiliates – 661 33,833 34,495 – 34,495
Increase in property and equipment and intangible assets 5,450 211 1,398 7,060 129 7,189
Amortization of goodwill 29 (2) 263 290 – 290Balance of goodwill 458 (2) 210 667 – 667
Note a: Adjustments to segment operating income of ¥(7,848) million ($(65,516) thousand) and ¥(7,482) million consists of ¥(658) million ($(5,496) thousand) and ¥(69) million of inter-segment eliminations and ¥(7,190) million ($(60,019) thousand) and ¥(7,412) million of corporate expenses for the years ended December 31, 2014 and 2013, respectively, which mainly represent the Company’s general and administrative expenses that are not allocable to any of the reportable segments.
Note b: Adjustments to segment assets of ¥157,514 million ($1,314,808 thousand) and ¥146,741 million consists of ¥(43,191) million ($(360,529) thousand) and ¥(31,669) million of inter-segment eliminations, ¥200,705 million ($1,675,337 thousand) and ¥178,410 million of corporate assets for the years ended December 31, 2014 and 2013, respectively.
010_0479001372704.indd 50 2015/05/19 21:39:01
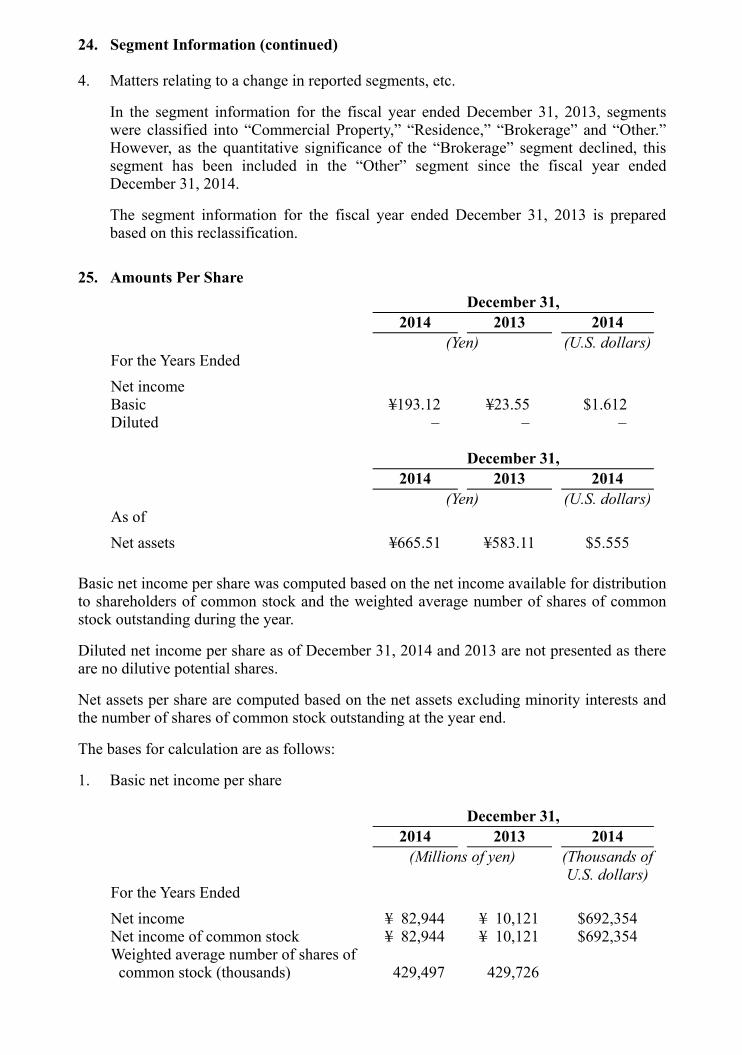
49
24. Segment Information (continued) 4. Matters relating to a change in reported segments, etc. In the segment information for the fiscal year ended December 31, 2013, segments
were classified into “Commercial Property,” “Residence,” “Brokerage” and “Other.” However, as the quantitative significance of the “Brokerage” segment declined, this segment has been included in the “Other” segment since the fiscal year ended December 31, 2014.
The segment information for the fiscal year ended December 31, 2013 is prepared
based on this reclassification. 25. Amounts Per Share
December 31, 2014 2013 2014 (Yen) (U.S. dollars)For the Years Ended Net income Basic ¥193.12 ¥23.55 $1.612 Diluted – – –
December 31, 2014 2013 2014 (Yen) (U.S. dollars)As of Net assets ¥665.51 ¥583.11 $5.555
Basic net income per share was computed based on the net income available for distribution to shareholders of common stock and the weighted average number of shares of common stock outstanding during the year. Diluted net income per share as of December 31, 2014 and 2013 are not presented as there are no dilutive potential shares. Net assets per share are computed based on the net assets excluding minority interests and the number of shares of common stock outstanding at the year end. The bases for calculation are as follows: 1. Basic net income per share
December 31, 2014 2013 2014 (Millions of yen) (Thousands of
U.S. dollars)For the Years Ended Net income ¥ 82,944 ¥ 10,121 $692,354 Net income of common stock ¥ 82,944 ¥ 10,121 $692,354 Weighted average number of shares of common stock (thousands) 429,497 429,726
010_0479001372704.indd 51 2015/05/19 21:39:02
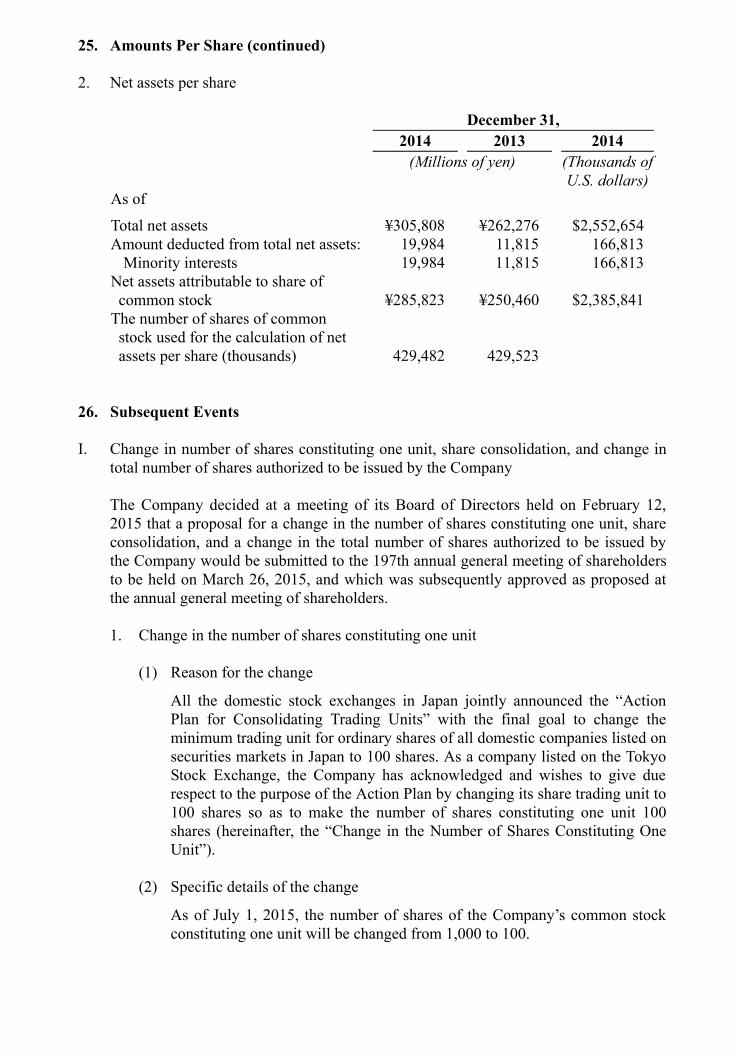
50
25. Amounts Per Share (continued) 2. Net assets per share
December 31, 2014 2013 2014 (Millions of yen) (Thousands of
U.S. dollars)As of
Total net assets ¥305,808 ¥262,276 $2,552,654 Amount deducted from total net assets: 19,984 11,815 166,813
Minority interests 19,984 11,815 166,813 Net assets attributable to share of common stock ¥285,823 ¥250,460 $2,385,841
The number of shares of common stock used for the calculation of net assets per share (thousands) 429,482 429,523
26. Subsequent Events I. Change in number of shares constituting one unit, share consolidation, and change in
total number of shares authorized to be issued by the Company The Company decided at a meeting of its Board of Directors held on February 12,
2015 that a proposal for a change in the number of shares constituting one unit, share consolidation, and a change in the total number of shares authorized to be issued by the Company would be submitted to the 197th annual general meeting of shareholders to be held on March 26, 2015, and which was subsequently approved as proposed at the annual general meeting of shareholders.
1. Change in the number of shares constituting one unit
(1) Reason for the change
All the domestic stock exchanges in Japan jointly announced the “Action Plan for Consolidating Trading Units” with the final goal to change the minimum trading unit for ordinary shares of all domestic companies listed on securities markets in Japan to 100 shares. As a company listed on the Tokyo Stock Exchange, the Company has acknowledged and wishes to give due respect to the purpose of the Action Plan by changing its share trading unit to 100 shares so as to make the number of shares constituting one unit 100 shares (hereinafter, the “Change in the Number of Shares Constituting One Unit”).
(2) Specific details of the change
As of July 1, 2015, the number of shares of the Company’s common stock constituting one unit will be changed from 1,000 to 100.
010_0479001372704.indd 52 2015/05/19 21:39:02
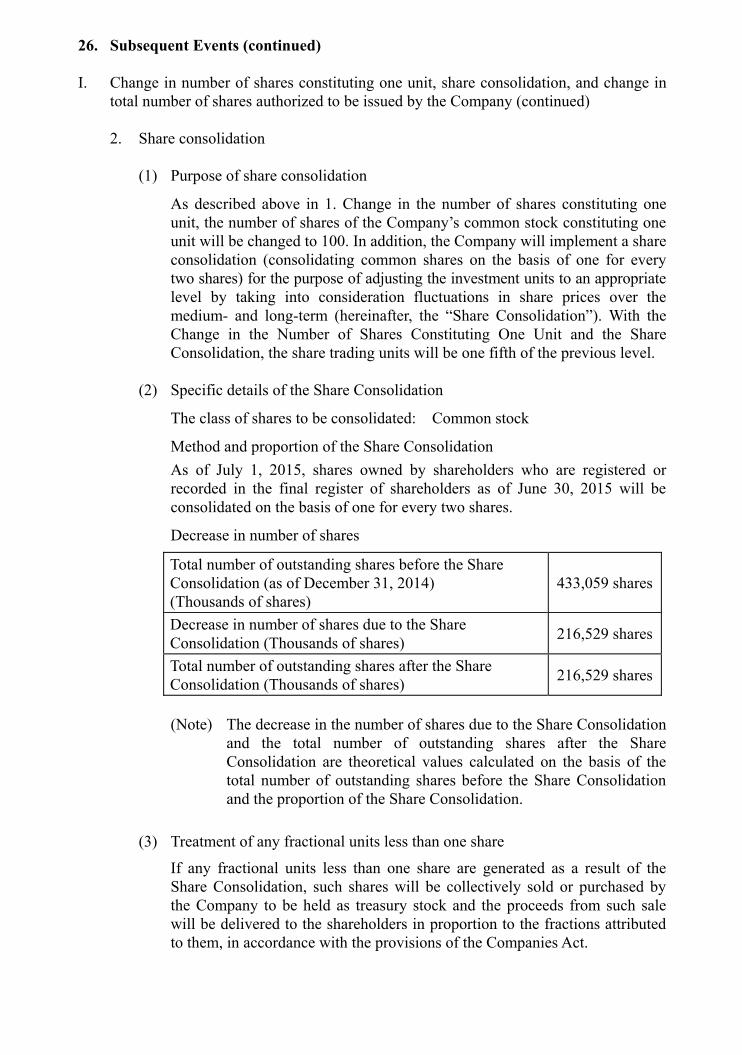
51
26. Subsequent Events (continued) I. Change in number of shares constituting one unit, share consolidation, and change in
total number of shares authorized to be issued by the Company (continued)
2. Share consolidation
(1) Purpose of share consolidation
As described above in 1. Change in the number of shares constituting one unit, the number of shares of the Company’s common stock constituting one unit will be changed to 100. In addition, the Company will implement a share consolidation (consolidating common shares on the basis of one for every two shares) for the purpose of adjusting the investment units to an appropriate level by taking into consideration fluctuations in share prices over the medium- and long-term (hereinafter, the “Share Consolidation”). With the Change in the Number of Shares Constituting One Unit and the Share Consolidation, the share trading units will be one fifth of the previous level.
(2) Specific details of the Share Consolidation
The class of shares to be consolidated: Common stock
Method and proportion of the Share Consolidation As of July 1, 2015, shares owned by shareholders who are registered or
recorded in the final register of shareholders as of June 30, 2015 will be consolidated on the basis of one for every two shares.
Decrease in number of shares
Total number of outstanding shares before the Share Consolidation (as of December 31, 2014) (Thousands of shares)
433,059 shares
Decrease in number of shares due to the Share Consolidation (Thousands of shares) 216,529 shares
Total number of outstanding shares after the Share Consolidation (Thousands of shares) 216,529 shares
(Note) The decrease in the number of shares due to the Share Consolidation
and the total number of outstanding shares after the Share Consolidation are theoretical values calculated on the basis of the total number of outstanding shares before the Share Consolidation and the proportion of the Share Consolidation.
(3) Treatment of any fractional units less than one share
If any fractional units less than one share are generated as a result of the Share Consolidation, such shares will be collectively sold or purchased by the Company to be held as treasury stock and the proceeds from such sale will be delivered to the shareholders in proportion to the fractions attributed to them, in accordance with the provisions of the Companies Act.
010_0479001372704.indd 53 2015/05/19 21:39:02
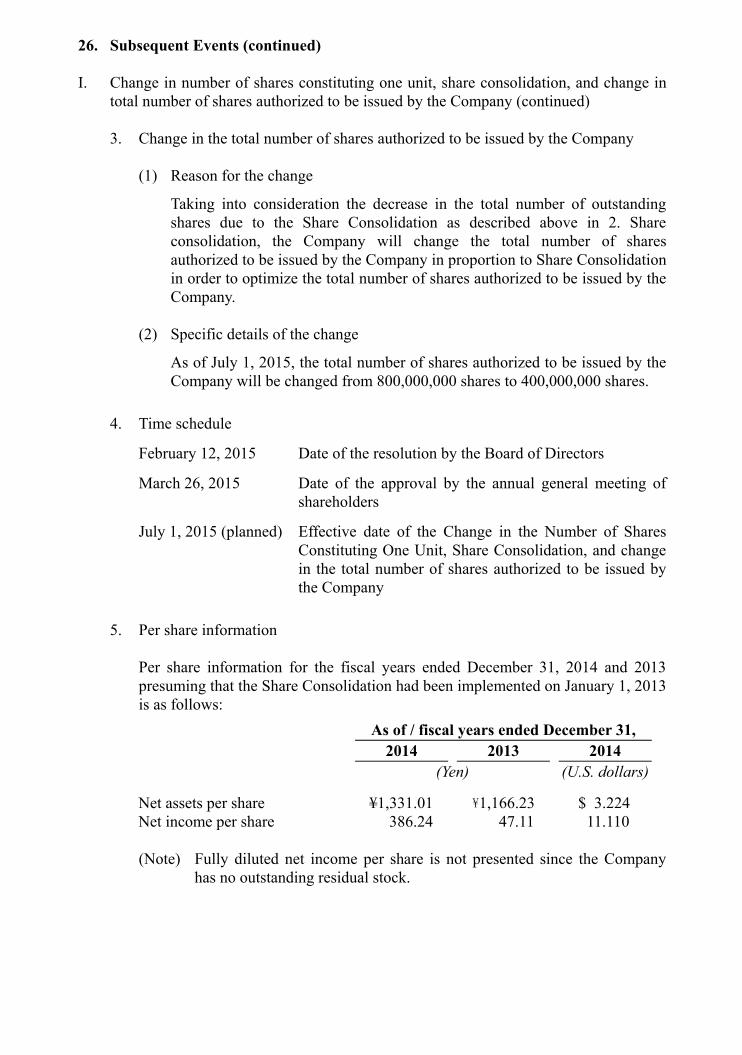
52
26. Subsequent Events (continued) I. Change in number of shares constituting one unit, share consolidation, and change in
total number of shares authorized to be issued by the Company (continued)
3. Change in the total number of shares authorized to be issued by the Company
(1) Reason for the change
Taking into consideration the decrease in the total number of outstanding shares due to the Share Consolidation as described above in 2. Share consolidation, the Company will change the total number of shares authorized to be issued by the Company in proportion to Share Consolidation in order to optimize the total number of shares authorized to be issued by the Company.
(2) Specific details of the change
As of July 1, 2015, the total number of shares authorized to be issued by the Company will be changed from 800,000,000 shares to 400,000,000 shares.
4. Time schedule
February 12, 2015 Date of the resolution by the Board of Directors
March 26, 2015 Date of the approval by the annual general meeting of shareholders
July 1, 2015 (planned) Effective date of the Change in the Number of Shares Constituting One Unit, Share Consolidation, and change in the total number of shares authorized to be issued by the Company
5. Per share information Per share information for the fiscal years ended December 31, 2014 and 2013
presuming that the Share Consolidation had been implemented on January 1, 2013 is as follows:
As of / fiscal years ended December 31, 2014 2013 2014 (Yen) (U.S. dollars)
Net assets per share ¥1,331.01 \1,166.23 $ 3.224 Net income per share 386.24 47.11 11.110
(Note) Fully diluted net income per share is not presented since the Company
has no outstanding residual stock.
010_0479001372704.indd 54 2015/05/19 21:39:02
53
26. Subsequent Events (continued) II. Acquisition of treasury stock The Company decided at the meeting of its Board of Directors held on February 12,
2015 to acquire the shares of its stock held by its consolidated subsidiaries in accordance with the provisions of Article 156, as applied pursuant to Article 163, of the Companies Act, as follows. The Company acquired the shares on February 24, 2015.
1. Reasons for the acquisition of treasury stock
In accordance with the provisions of paragraph 3, Article 135 of the Companies Act, the Company acquired shares of its common stock held by its consolidated subsidiaries.
The shares of its common stock so acquired will be allocated as part of the shares to be allotted through the share exchange with Tokyo Tatemono Real Estate Sales Co., Ltd. as described below in III. Conclusion of share exchange agreement.
2. Specific details of the acquisition of treasury stock
(1) Class of shares acquired
Common stock of the Company (2) Total number of shares acquired
4,682,481 shares (the ratio to the total number of outstanding shares (excluding treasury stock): 1.1%)
Of the above, shares acquired from Tokyo Tatemono Real Estate Sales Co., Ltd.: 2,502,481 shares
Of the above, shares acquired from Tokyo Building Service Co., Ltd.: 2,180,000 shares
(3) Total value of shares acquired
¥4,232 million ($35,325 thousand) (4) Time schedule for the acquisition of treasury stock
February 12, 2015 (date of the conclusion of the sales agreement) February 24, 2015 (date of the transfer of rights) (5) Method of acquisition
Negotiated transactions
010_0479001372704.indd 55 2015/05/19 21:39:02
54
26. Subsequent Events (continued) III. Conclusion of share exchange agreement The Company decided at the meeting of its Board of Directors held on February 12,
2015 to make Tokyo Tatemono Real Estate Sales Co., Ltd. (hereinafter, “Tokyo Tatemono Real Estate Sales”) a wholly-owned subsidiary of the Company through a share exchange. On the same day, the Company entered into the share exchange agreement (hereinafter, the “Share Exchange Agreement”).
1. Purpose of the Share Exchange
Significant changes are expected in the business environment surrounding the real estate industry over the medium and long terms, such as expansions in existing house distribution and home improvement markets, and an increase in demand for housing for senior citizens. Meanwhile, there are concerns about the contraction of the market for new condominiums for sale due to low birth rates as well as an aging and declining population base in Japan. Furthermore, changes in customer needs in terms of management, operation and consulting services related to real estate in addition to changes of needs with regard to the size and quality of buildings are also anticipated.
Under such circumstances, the Company and Tokyo Tatemono Real Estate Sales have discussed measures for flexibly responding to the changes in the business environment and achieving further growth by making use of the strengths of both companies since around May 2014, prior to launching the new medium term management plan, which commenced in the fiscal year ended December 31, 2014.
As a result, both companies reached the conclusion that an optimal allocation of management resources and the development of strategies would contribute to an increase in their enterprise value under the significantly changing business environment, by means of the optimization of value chains through the integration of functions dispersed within the Group, the enhancement of operational synergies, and the incorporation of a holding company structure, compared with each company continuing to separately employ its own know-how and expertise. Consequently, both companies also concluded that making Tokyo Tatemono Real Estate Sales a wholly-owned subsidiary of the Company and enhancing flexibility in organization management would be the best solution.
2. Method of Share Exchange and details of allotment of shares pertaining to Share
Exchange, etc.
(1) Method of the Share Exchange
In accordance with the share exchange agreement dated on February 12, 2015, the Company will acquire the shares of Tokyo Tatemono Real Estate Sales held by the shareholders as of the Share Exchange effective date of July 1, 2015 and the Company’s stock will be allocated and delivered to the shareholders of Tokyo Tatemono Real Estate Sales.
The Share Exchange is to be implemented in the form of a short form share exchange prescribed in the provisions of paragraph 3, Article 796 of the Companies Act, without obtaining the approval of a general meeting of shareholders of the Company.
010_0479001372704.indd 56 2015/05/19 21:39:02
55
26. Subsequent Events (continued) III. Conclusion of share exchange agreement (continued)
(2) Details of the allotment of shares pertaining to the Share Exchange
The Company (wholly owning parent company)
Tokyo Tatemono Real Estate Sales (wholly owned subsidiary)
Share exchange ratio (before the Share Consolidation) 1 0.610
Share exchange ratio (after the Share Consolidation) 1 0.305
(Note 1) Each share of Tokyo Tatemono Real Estate Sales common stock
will be converted into 0.61 of a share of common stock of the Company before the effective date (July 1, 2015) of the Share Consolidation (consolidating common shares on the basis of one for every two shares) (0.305 of a share of common stock of the Company after the effective date of Share Consolidation) and will be allotted and delivered to shareholders from new shares to be issued and the treasury stock held by the Company. However, no shares of Tokyo Tatemono Real Estate Sales held by the Company will be allotted through the Share Exchange.
(Note 2) The share exchange ratios above may be revised upon consultation between the Company and Tokyo Tatemono Real Estate Sales in the event of a significant change in conditions on which the calculation is based.
(3) Treatment of stock acquisition rights and bonds with stock acquisition rights
on the Share Exchange
Tokyo Tatemono Real Estate Sales, which will become a wholly-owned subsidiary of the Company, has not issued any stock acquisition rights or bonds with stock acquisition rights.
3. Basis for allotment of shares pertaining to the Share Exchange
(1) Basis and reason for the allotment of shares
To ensure fairness in the consideration of the Share Exchange and fairness of other elements thereof, the Company has engaged a third-party appraiser and a legal advisor, respectively.
010_0479001372704.indd 57 2015/05/19 21:39:02
56
26. Subsequent Events (continued) III. Conclusion of share exchange agreement (continued)
The appraiser used the average market price method to calculate the share exchange ratio for the common stock of the Company and Tokyo Tatemono Real Estate Sales, since there is a market price for the shares of both companies, as well as a discounted cash flow analysis (hereinafter, the “DCF method”) to reflect the valuation of the future business activities of the two companies. The average market price method was based on the closing price of the common stock of each company on the Tokyo Stock Exchange on February 10, 2015 (the “Base Date”) and the simple average daily closing prices of the common stock of each company for the one-week period up to and including the Base Date, the one-month period up to and including the Base Date, the three-month period up to and including the Base Date, and the six-month period up to and including the Base Date. In the DCF method, calculations are made based on the future prospects of the financial conditions of the Company and Tokyo Tatemono Real Estate Sales.
Tokyo Tatemono Real Estate Sales separately engaged a third-party appraiser and a legal advisor, respectively, to ensure the fairness of the consideration of the Share Exchange and fairness of other elements thereof.
The appraiser used the market value method since the stock of both companies is listed on the stock market and their market price is readily available. The appraiser also used the DCF method to reflect the valuation of the future business activities of the two companies.
The market value method was based on the closing price of the common stock of each company on the Tokyo Stock Exchange on February 6, 2015 (the “Base Date”) and the simple average daily closing prices of the common stock of each company for the one-month, three-month and six-month periods up to and including the Base Date. In the DCF method, the enterprise value and equity value were analyzed using the present value of the free cash flows that each company is expected to produce in the future, discounted at a certain discount rate level and based on the forecasts of financial conditions prepared by the Company and Tokyo Tatemono Real Estate Sales.
(2) Delisting
As a result of the Share Exchange, the common stock of Tokyo Tatemono Real Estate Sales will be delisted on June 26, 2015 (with June 25, 2015 as the final trading date) through prescribed procedures in accordance with the delisting criteria of the Tokyo Stock Exchange. After the delisting, shares of Tokyo Tatemono Real Estate Sales will not be traded on the Tokyo Stock Exchange.
010_0479001372704.indd 58 2015/05/19 21:39:02
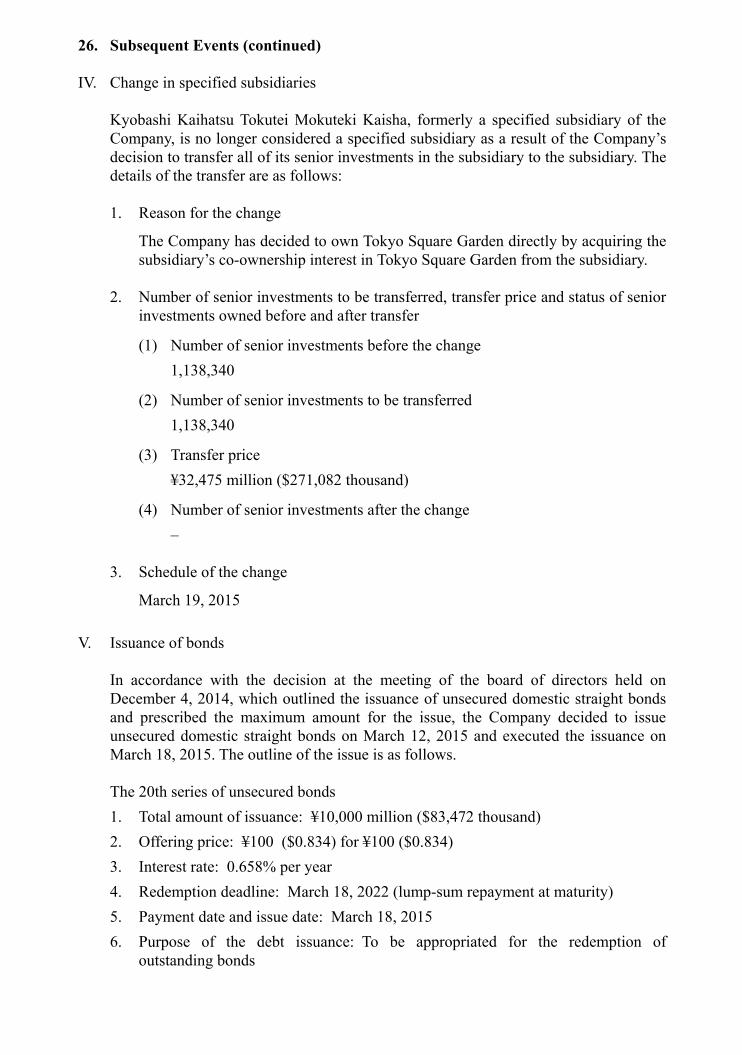
57
26. Subsequent Events (continued) IV. Change in specified subsidiaries Kyobashi Kaihatsu Tokutei Mokuteki Kaisha, formerly a specified subsidiary of the
Company, is no longer considered a specified subsidiary as a result of the Company’s decision to transfer all of its senior investments in the subsidiary to the subsidiary. The details of the transfer are as follows:
1. Reason for the change
The Company has decided to own Tokyo Square Garden directly by acquiring the subsidiary’s co-ownership interest in Tokyo Square Garden from the subsidiary.
2. Number of senior investments to be transferred, transfer price and status of senior
investments owned before and after transfer
(1) Number of senior investments before the change 1,138,340
(2) Number of senior investments to be transferred 1,138,340
(3) Transfer price ¥32,475 million ($271,082 thousand)
(4) Number of senior investments after the change –
3. Schedule of the change
March 19, 2015 V. Issuance of bonds In accordance with the decision at the meeting of the board of directors held on
December 4, 2014, which outlined the issuance of unsecured domestic straight bonds and prescribed the maximum amount for the issue, the Company decided to issue unsecured domestic straight bonds on March 12, 2015 and executed the issuance on March 18, 2015. The outline of the issue is as follows.
The 20th series of unsecured bonds
1. Total amount of issuance: ¥10,000 million ($83,472 thousand) 2. Offering price: ¥100 ($0.834) for ¥100 ($0.834) 3. Interest rate: 0.658% per year 4. Redemption deadline: March 18, 2022 (lump-sum repayment at maturity) 5. Payment date and issue date: March 18, 2015 6. Purpose of the debt issuance: To be appropriated for the redemption of
outstanding bonds
010_0479001372704.indd 59 2015/05/19 21:39:02
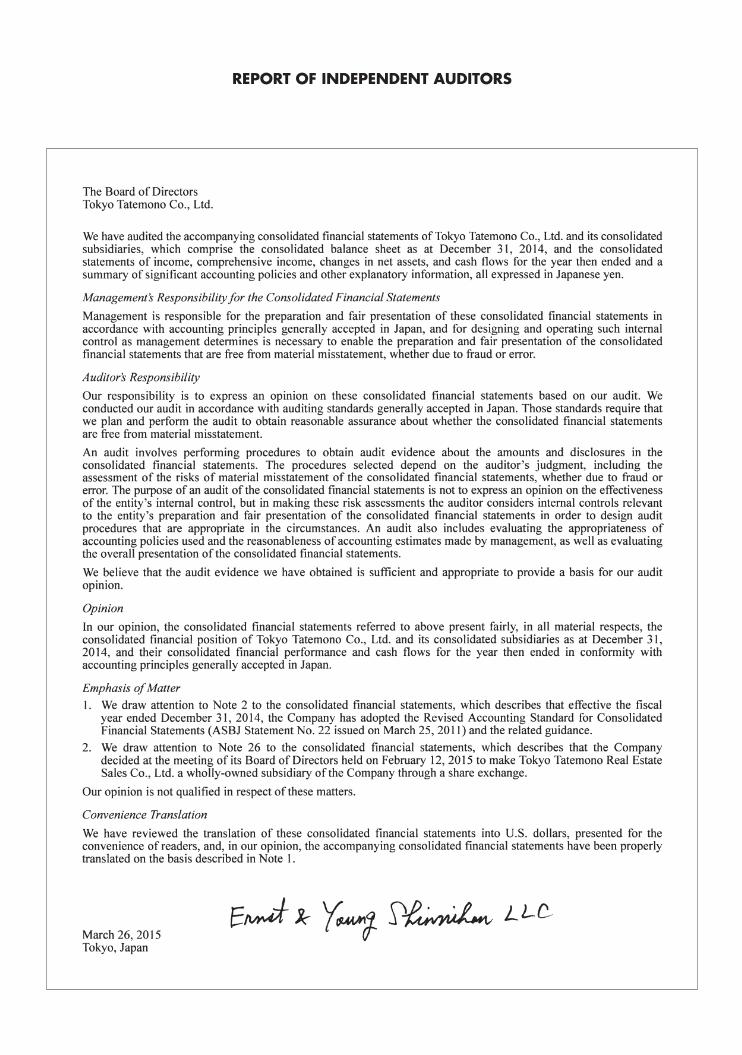
Tokyo Tatemono Co., Ltd.
REPORT OF INDEPENDENT AUDITORS
010_0479001372704.indd 60 2015/05/19 21:39:03
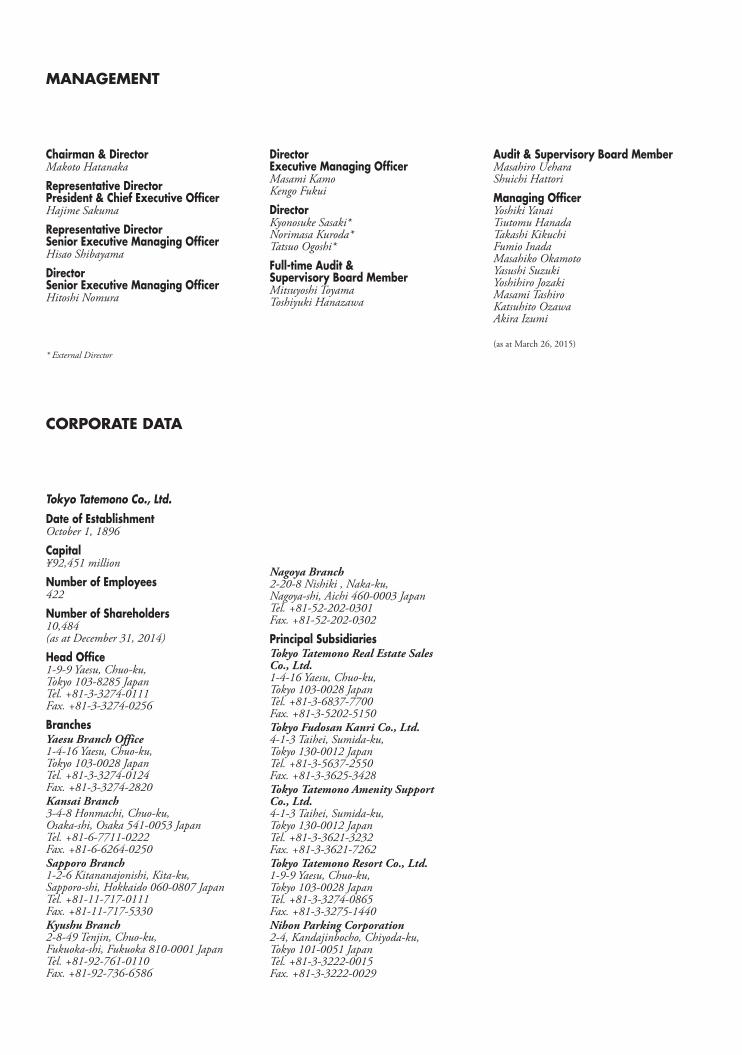
MANAGEMENT
CORPORATE DATA
Chairman & DirectorMakoto Hatanaka
Representative Director President & Chief Executive OfficerHajime Sakuma
Representative Director Senior Executive Managing OfficerHisao Shibayama
Director Senior Executive Managing OfficerHitoshi Nomura
Director Executive Managing OfficerMasami KamoKengo Fukui
DirectorKyonosuke Sasaki*Norimasa Kuroda*Tatsuo Ogoshi*
Full-time Audit & Supervisory Board MemberMitsuyoshi ToyamaToshiyuki Hanazawa
Audit & Supervisory Board MemberMasahiro UeharaShuichi Hattori
Managing OfficerYoshiki YanaiTsutomu HanadaTakashi KikuchiFumio InadaMasahiko OkamotoYasushi SuzukiYoshihiro JozakiMasami TashiroKatsuhito OzawaAkira Izumi
(as at March 26, 2015)
Tokyo Tatemono Co., Ltd.Date of EstablishmentOctober 1, 1896
Capital¥92,451 million
Number of Employees422
Number of Shareholders10,484(as at December 31, 2014)
Head Office1-9-9 Yaesu, Chuo-ku,Tokyo 103-8285 JapanTel. +81-3-3274-0111Fax. +81-3-3274-0256
BranchesYaesu Branch Office1-4-16 Yaesu, Chuo-ku,Tokyo 103-0028 JapanTel. +81-3-3274-0124Fax. +81-3-3274-2820Kansai Branch3-4-8 Honmachi, Chuo-ku,Osaka-shi, Osaka 541-0053 JapanTel. +81-6-7711-0222Fax. +81-6-6264-0250Sapporo Branch1-2-6 Kitananajonishi, Kita-ku,Sapporo-shi, Hokkaido 060-0807 JapanTel. +81-11-717-0111Fax. +81-11-717-5330Kyushu Branch2-8-49 Tenjin, Chuo-ku,Fukuoka-shi, Fukuoka 810-0001 JapanTel. +81-92-761-0110Fax. +81-92-736-6586
Nagoya Branch2-20-8 Nishiki , Naka-ku,Nagoya-shi, Aichi 460-0003 JapanTel. +81-52-202-0301Fax. +81-52-202-0302
Principal SubsidiariesTokyo Tatemono Real Estate Sales Co., Ltd.1-4-16 Yaesu, Chuo-ku, Tokyo 103-0028 JapanTel. +81-3-6837-7700Fax. +81-3-5202-5150Tokyo Fudosan Kanri Co., Ltd.4-1-3 Taihei, Sumida-ku,Tokyo 130-0012 JapanTel. +81-3-5637-2550Fax. +81-3-3625-3428Tokyo Tatemono Amenity Support Co., Ltd.4-1-3 Taihei, Sumida-ku,Tokyo 130-0012 JapanTel. +81-3-3621-3232Fax. +81-3-3621-7262Tokyo Tatemono Resort Co., Ltd.1-9-9 Yaesu, Chuo-ku,Tokyo 103-0028 JapanTel. +81-3-3274-0865Fax. +81-3-3275-1440Nihon Parking Corporation2-4, Kandajinbocho, Chiyoda-ku,Tokyo 101-0051 JapanTel. +81-3-3222-0015Fax. +81-3-3222-0029
* External Director
010_0479001372704.indd 61 2015/05/19 21:39:03
Printed in Japan
http://www.tatemono.com
010_0479001372704.indd 62 2015/05/19 21:39:03