Embed Size (px)
Citation preview
Universidade de Aveiro
2014
Departamento de Biologia
Vanessa Silva
Carregosa
Tolerance and response of clams in Ria de Aveiro to
salinity changes
Tolerância e resposta de amêijoas na Ria de Aveiro
a alterações de salinidades


Declaração
Declaro que este relatório é integralmente da minha autoria, estando devidamente
referenciadas as fontes e obras consultadas, bem como identificadas de modo claro as
citações dessas obras. Não contém, por isso, qualquer tipo de plágio quer de textos
publicados, qualquer que seja o meio dessa publicação, incluindo meios eletrónicos, quer
de trabalhos académicos.
________________________________________________________________
Aveiro, 25 de Julho de 2014


Universidade de Aveiro
2014
Departamento de Biologia
Vanessa Silva
Carregosa
Tolerance and response of clams in Ria de Aveiro to
salinity changes
Tolerância e resposta de amêijoas na Ria de Aveiro
a alterações de salinidades
Dissertação apresentada à Universidade de Aveiro para cumprimento dos
requisitos necessários à obtenção do grau de Mestre em Biologia Marinha,
realizada sob a orientação científica da Doutora Rosa de Fátima Lopes de
Freitas (Investigadora Auxiliar do Departamento de Biologia e CESAM da
Universidade de Aveiro) e co-orientação científica da Professora Doutora
Etelvina Maria Paula de Almeida Figueira (Professora Auxiliar do Departamento
de Biologia e CESAM da Universidade de Aveiro).


Dedico este trabalho aos meus pais, por me terem dado a oportunidade de o
concretizar. De coração, obrigada por tudo.
Onde sou a mim mesma devolvida Em sal, espuma e concha regressada
À praia inicial da minha vida
Sophia de Mello Breyner Andresen


o júri
presidente Professror Doutor João António de Almeida Serôdio
professor auxiliar no Departamento de Biologia da Universidade de Aveiro
Professora Doutora Sara Cristina Ferreira Marques Antunes
professora auxiliar convidada no Departamento de Biologia da Faculdade de Ciências
da Universidade do Porto
Professora Doutora Rosa de Fátima Lopes de Freitas
investigadora auxiliar no CESAM - Centro de Estudos do Ambiente e do Mar,
Universidade de Aveiro


agradecimentos
Está a chegar ao fim uma longa etapa que me fez crescer, aprender e lutar por cada objectivo definido. Alcançada a meta, é altura de agradecer a todos os que contibuíram direta ou indirectamente para que esta conquista fosse possível. Um enorme agradecimento à Doutora Rosa Freitas e à Doutora Etelvina Figueira, pela orientação, pela disponibilidade, pelo incentivo e pela amizade também. Sem a vossa ajuda não teria conseguido o que consegui durante este percurso. Foi um privilégio aprender convosco.À Doutora Ana Gil, pela orientação ciêntifica no trabalho de metabolómica. À Joana Pinto, pela ajuda e pelas horas (semanas, até) passadas na sala de RMN e à Sara Pereira, que mesmo à distância me conseguiu dar uma preciosa ajuda. Aos meus pais, agradeço eternamente por me terem dado esta oportunidade, por terem acreditado em mim, por estarem presentes em cada momento.. Obrigada do fundo do coração, por fazerem de mim a pessoa que sou hoje. À minha irmã pelos momentos de lazer dentro de um pavilhão, a fazer-me vibrar com o jogo que já é parte da nossa vida há muito tempo, ou até em casa em simples bricadeiras com o nosso companheiro de quatro patas. A toda a minha restante família, por me restaurar energias a cada fim de semana, pelos convívios, pelas risadas, por todo o carinho em cada encontro e em cada telefonema. Um obrigada muito especial aquela, cujo carinho demonstrado é incondicional e muito maior de que qualquer incapacidade. Aos meus colegas e amigos de laboratório, Cátia Velez, Ângela Almeida, Paulo Cardoso, Liliana Arede, Cláudia Cruz, Roberto Martins, Bruno Campino, Luísa Magalhães, Adília Pires, Anthony Moreira, Stefania Chiesa, José Santos e todos os que passaram por lá. Obrigada pela ajuda e companheirismo no laboratório ao longo deste caminho e um obrigada especial à Cátia, Ângela, Paulo e Roberto pelos jantares e passeios, porque foi e é importante para mim ter uma amizade como a vossa. Diana Dias, Ana Rita Alves e Márcia Silva, obrigada por fazerem parte desta história. Espero ter conseguido passar-vos um bocadinho desta felicidade e que o vosso percurso seja tão ou mais feliz do que o meu. A toda a restante “família” praxistica (são muitos para nomear, mas têm todos um lugar especial), obrigada por todos os momentos na UA, na praça do peixe, ou em qualquer outro lugar de Aveiro. Ana Aires, Ricardo Marques, Décio Rodrigues, obrigada por também terem aturado um bocadinho de mim, na “casa do povo”. .


Aos amigos de sempre, Tiago Almeida, Jacqueline Silva, André Gonçalves, Daniela Machado, Fábio Correia e Hugo Oliveira, obrigada pela paciência, por me aturarem mesmo durante todo o tempo em que estive ausente. Obrigada por todos os momentos a cada reencontro. Cristina Oliveira, a um primeiro ano atribulado no início, mas muito divertido, obrigada. Aos que me proporcionaram um dos melhores verões (ainda que curto), João Rodrigues, Thiago, Débora Nogueira, Mariana Rodrigues, a malta do Vale Alto e de Góis. Obrigada por marcarem de alguma forma este percurso. Aos enormes, Joni Marques, Eva Garcia, Luís Lopes, Ana João, Fábio Alves, Tiago Pedrosa, Carina Costa, Ana Pereira, obrigada pelas noites de festa, de copos, pelas viagens, pela amizade, pela partilha de casa, pelas brincadeiras, pelas aventuras, pelas surpresas, pelas confidências, por fazerem parte deste percurso, mesmo nos momentos menos bons. Partilhado convosco, este trabalho tem um sabor especial. Que no futuro nos possamos encontrar muitas vezes e com um sabor especial, com sabor a Aveiro. Que cada reencontro seja o inicio de uma nova aventura (“No great story starts with a salad”). Obrigada por fazerem parte deste meu Mundo. A todos os que passaram pela melhor casa de Aveiro, obrigada pela aventura que nos proporcionaram em (quase) todos os dias de existência daquela “residêncial”. Não posso deixar de agradecer à entidade que me proporcionou todas estas oportunidades, Universidade de Aveiro e todos os docentes e colegas/amigos de curso que contribuiram também para este percurso. Aveiro passou a ser a minha segunda casa, a cidade que me acolheu durante estes anos. “Happiness is only real when shared.” Frase batida, mas com muita verdade. Foi uma honra ter tido a sorte de me cruzar com pessoas incríveis, especiais em cada pormenor, que me fizeram crescer, que fizeram desta aventura a melhor de todas.


palavras-chave
Venerupis decussata, Venerupis corrugata, Venerupis philippinarum, bivalves, biomarcadores, osmorregulação, Ressonância Magnética Nuclear, stress oxidativo, metabolómica
Resumo
As respostas dos organismos aquáticos a alterações naturais, nomeadamente, alterações de salinidade, têm recebido pouca atenção, inversamente à preocupação que tem vindo a crescer em relação aos impactos da contaminação em populações marinhas bentónicas. De facto, a salinidade é um dos factores ambientais dominantes que mais afetam os bivalves marinhos, o que limita a sua distribuição espacial no ecossistema. As marés combinadas com entradas de água doce, de rios ou períodos de chuva longos e estações secas extremas, podem alterar drasticamente a salinidade da água, provocando alterações nas populações de bivalves bentónicos, nomeadamente intertidais. Além disso, a salinidade de um determinado ambiente irá restringir a distribuição espacial das espécies, o que é especialmente importante quando se avalia a propagação de uma espécie invasora num ambiente novo. A fim de entender como espécies nativas (Venerupis decussata e Venerupis corrugata) e invasoras (Venerupis phiippinarum) de molluscos lidam com as mudanças de salinidade, foram investigados parâmetros fisiológicos, bioquímicos e metablómicos. Os resultados obtidos mostraram que V. decussata e V. philippinarum apresentaram elevada mortalidade em salinidades baixas (0 e 7), mas toleram as salinidades mais altas (35 e 42). Por outro lado, V. corrugata apresentou elevadas taxas de mortalidade tanto em salinidades baixas (0 e 7) como em salinidades altas (35 e 42). A quantificação do teor de Na e K, revelou que ao longo do gradiente de salinidade, a V. decussata foi a espécie com maior capacidade de manter a homeostasia iónica. Os parâmetros bioquímicos também mostraram que V. decussata foi a espécie que melhor lidou com as mudanças de salinidade enquanto a V. corrugata foi a mais sensível. Além disso, os resultados obtidos mostraram que as ameijoas, sob condições adversas de salinidade, podem alterar os seus mecanismos bioquímicos, nomeadamente aumentando as suas defesas antioxidantes, para lidar com um maior stress oxidativo resultante das condições de hipo e hipersalinidade. Entre os parâmetros fisiológicos e bioquímicos analisados (glicogénio, glucose, proteinas, níveis de peroxidação lípidica (LPO), atividade de enzimas antioxidantes; glutationa total, reduzida e oxidada), LPO, superoxide dismutase (SOD) e glutathiona S-transferase (GST) mostraram ser biomarcadores úteis para avaliar os impactos de salinidade em bivalves. Os efeitos das alterações de salinidade no perfil metabólico das três espécies foram também estudados através de Ressonância Magnética Nuclear de
1H
(RMN). A análise multivariada dos espectros de RMN permitiu a observação de alterações em relação à exposição de ameijoas a diferentes concentrações de salinidade. Quando expostos a baixas salinidades, as reservas energéticas destes organismos podem ser esgotadas, aumentando o desequilíbrio osmótico, afetando o desempenho metabólico e aumentando o stress oxidativo. V. corrugata mostrou ser a amêijoa mais sensível a mudanças de salinidade. O intervalo de salinidades entre 21 e 28 foi o ideal para V. decussata e V. philippinarum e a salinidade 21 foi a ideal para V. corrugata. Este estudo mostrou que as mudanças de salinidade têm impactos diferentes em espécies nativas e invasoras.


keywords
Venerupis decussata, Venerupis corrugata, Venerupis philippinarum, bivalves,
biomarkers, osmoregulation, Nuclear Magnetic Resonance, oxidative stress,
metabolomics.
abstract
Unlike the concern that has been growing in relation to the impacts of contamination in marine benthic populations, the responses of aquatic organisms to natural alterations, namely changes in salinity, have received little attention. In fact, salinity is one of the dominant environmental factors that most affect marine bivalves, limiting their spatial distribution in the environment. Tide combined with fresh water inputs, from rivers or heavy rainy periods, and extreme dry seasons can dramatically alter the salinity of water, causing alterations in the benthic populations, namely intertidal bivalves. Furthermore, salinity of a given environment will restrict the spatial distribution of the species, which is especially important when assessing the spread of an invasive species into a new environment. In order to understand how native (Venerupis decussata and Venerupis corrugata) and invasive (Venerupis philippinarum) clam species cope with salinity changes, physiological, biochemical and metabolomic patterns were investigated. The results obtained showed that V. decussata and V. philippinarum presented high mortality at low (0 and 7) but tolerate high (35 and 42) salinities. On the other hand, V. corrugata presented high mortality rates both at low (0 and 7) and high salinities (35 and 42). The quantification of Na and K content revealed that, along the salinity gradient, V. decussata was the species with higher ability to maintain the ionic homeostasis. The biochemical parameters also showed that V. decussata was the clam that best cope with salinity changes and V. corrugata was the most sensitive. Furthermore, the results obtained showed that clams under salinity stressful conditions can alter their biochemical mechanisms, such as increasing their antioxidant defences, to cope with the higher oxidative stress resulting from hypo and hypersaline conditions. Among the physiological and biochemical parameters analysed (glycogen, glucose and protein content; lipid peroxidation (LPO) levels, antioxidant enzymes activity; total, reduced and oxidized glutathione), superoxide dismutase (SOD), LPO and glutathione S-transferase (GST) showed to be useful biomarkers to assess salinity impacts in clams. The effects of salinity changes in the metabolic profile of the three species were also studied using
1H Nuclear Magnetic Resonance (NMR)
spectroscopy of clam extracts. Multivariate analysis of the NMR spectra enabled metabolite changes to be observed in relation to clams exposure to different salinity concentrations. When exposed to low salinities, energy reserves of clams may be exhausted, increasing the osmotic imbalance, affecting the metabolic performance and increasing the oxidative stress. V. corrugata showed to be the most sensitive clam to salinity changes. The optimal salinity for V. decussata and V. philippinarum was between 21 and 28 and for V. corrugata was salinity 21. This study showed that changes in salinity have different impacts in native and invasive species

Contents
1. INTRODUCTION ........................................................................................................ 1
1.1. Aquatic Systems under global changes .................................................................................. 2
1.1.1. Climate changes: salinity alterations ....................................................................................... 2
1.1.2. Alien species ............................................................................................................................ 4
1.2. Bivalves as bioindicators ........................................................................................................ 5
1.2.1. Responses of bivalves to salinity alterations ........................................................................... 6
1.2.2. Tested species ......................................................................................................................... 9
1.3. Objectives ............................................................................................................................ 13
2. MATERIALS AND METHODS ................................................................................... 15
2.1. Study area ............................................................................................................................ 16
2.2. Sampling procedure ............................................................................................................. 17
2.3. Laboratory procedures ......................................................................................................... 18
2.3.1. Sediments grain size and Organic matter content ................................................................ 20
2.3.2. Quantification of elements ................................................................................................... 21
2.3.3. Metabolomic, physiological and biochemical analysis .......................................................... 22
2.3.3.1. Physiological and biochemical analysis ........................................................................... 22
2.3.3.2. Nuclear Magnetic Resonance (NMR) Spectroscopy ........................................................ 31
2.4. Data analysis ........................................................................................................................ 33
3. RESULTS ................................................................................................................. 36
3.1. Environmental data ............................................................................................................. 37
3.2. Biometric data ..................................................................................................................... 37
3.3. Mortality .............................................................................................................................. 37
3.4. Elemens content .................................................................................................................. 38
3.5. Biochemical and physiological analysis ................................................................................ 43
3.5.1. Total protein content and peptide alterations ...................................................................... 43
3.5.2. Total carbohydrates content (Glycogen) ............................................................................... 46
3.5.3. Glucose content .................................................................................................................... 47
3.5.1. Lipid peroxidation ................................................................................................................. 48
3.5.2. Catalase (CAT) activity ........................................................................................................... 50
3.5.3. Superoxide dismutase (SOD) activity .................................................................................... 51
3.5.1. Glutathione S-transferase (GSTs) activity.............................................................................. 52
3.5.2. Total glutathione (GSHt)........................................................................................................ 54
3.5.1. Reduced glutathione (GSH) ................................................................................................... 55
3.5.1. Ratio of reduced glutathione (GSH) / oxidized glutathione (GSSG) ...................................... 56


3.6. Nuclear magnetic resonance (NMR) spectroscopy ............................................................... 58
3.6.1. Aqueous extracts ................................................................................................................... 58
3.6.2. Lipid extracts ......................................................................................................................... 64
3.7. Data analysis ........................................................................................................................ 67
4. DISCUSSION ........................................................................................................... 71
4.1. Context ................................................................................................................................ 72
4.2. Mortality .............................................................................................................................. 72
4.3. Osmotic balance .................................................................................................................. 73
4.4. Physiological performance ................................................................................................... 75
4.5. Oxidative stress ................................................................................................................... 77
5. CONCLUSIONS ....................................................................................................... 83
5.1. Conclusions .......................................................................................................................... 84
5.2. Future considerations .......................................................................................................... 86
6. REFERENCES .......................................................................................................... 87
7. ANNEXES .............................................................................................................. 102
7.1. Papers on peer reviewed journals (Science Citation Index® (Thompson ISI)) ..................... 104
7.2. Participation in International Meetings ............................................................................. 105
7.2.1. Oral Communications .......................................................................................................... 105
7.2.2. Posters ................................................................................................................................. 105


List of Figures
Figure 1. Clam species ............................................................................................................... 10
Figure 2. Study area ................................................................................................................... 16
Figure 3. Harvesting the organisms ........................................................................................... 18
Figure 4. Measurement and Weight of organisms. ................................................................... 18
Figure 5. Experimental design for clams exposure to different salinities ................................. 19
Figure 6. Destruction of organic matter and dry separation of sediments ............................... 20
Figure 7. Oxidative stress ........................................................................................................... 23
Figure 8. Mortality rate .............................................................................................................. 37
Figure 9. Concentration of Na, K, Ca and Mg. ........................................................................... 38
Figure 10. A - Protein content.................................................................................................... 45
Figure 11. Glycogen content ...................................................................................................... 44
Figure 12. Glucose content ........................................................................................................ 45
Figure 13. Lipid peroxidation ..................................................................................................... 47
Figure 14. Catalase activity ........................................................................................................ 48
Figure 15. Supeoxide Dismutase activity ................................................................................... 50
Figure 16. Glutathione S-transferase activity ............................................................................ 51
Figure 17. Total glutathione content ......................................................................................... 52
Figure 18. Reduced glutathione content ................................................................................... 54
Figure 19. GSH/GSSG ratio ......................................................................................................... 55
Figure 20. 1H Nuclear Magnetic Resonance spectra of aqueous extracts obtained from Venerupis philippinarum exposed to different salinities: A: 0, B: 7, C: 28, D: 42 ............................. 56
Figure 21. 1H Nuclear Magnetic Resonance spectra of aqueous extracts obtained from Venerupis decussata (A), Venerupis philippinarum (B) and Venerupis corrugata (C), exposed to salinity 28 ......................................................................................................................................... 59
Figure 22. 1H Nuclear Magnetic Resonance spectra of lipid extracts obtained from Venerupis philippinarum exposed to different salinities: A: 0, B: 7, C: 28, D: 42 .............................................. 63


Figure 23. 1H Nuclear Magnetic Resonance spectra of lipid extracts obtained from Venerupis decussata (A), Venerupis philippinarum (B) and Venerupis corrugata (C), exposed to salinity 28… 64
Figure 24. Centroids ordination diagram (PCO, Principal Coordinates analysis) based on the physiological and biochemical responses of the three species ....................................................... 65
Figure 25. MVA including all aqueous extracts tested in NMR spectroscopy, UV-scaled data. A, PCA scores plot; B, PLS-DA scores plot ............................................................................................. 66
Figure 26. MVA including all lipid extracts tested in NMR spectroscopy, UV-scaled data. A, PCA scores plot; B, PLS-DA scores plot ............................................................................................. 67

List of Tables
Table 1. Classification of sediments. .......................................................................................... 21 Table 2. Environmental parameters of the sampling site ......................................................... 36 Table 3. Concentration of Na, K, Ca and Mg .............................................................................. 40 Table 4. Protein content ............................................................................................................ 42 Table 5. Glycogen content ......................................................................................................... 44 Table 6. Glucose content ........................................................................................................... 46 Table 7. Lipid peroxidation. ....................................................................................................... 47 Table 8. Catalase activity. .......................................................................................................... 49 Table 9. Superoxide dismutase activity ..................................................................................... 50 Table 10. Glutathione S-transferase activity. ............................................................................ 51 Table 11. Total glutathione content .......................................................................................... 53 Table 12. Reduced glutathione content .................................................................................... 54 Table 13. GSH/GSSG ratio .......................................................................................................... 55 Table 14. Changes in metabolites as viewed by 1H NMR spectroscopy of aqueous V.
philippinarum extracts exposed at different salinities (0, 7 and 42) comparing to organisms of the same species exposed at salinity 28................................................................................................. 58
Table 15. Changes in metabolites as viewed by 1H NMR spectroscopy of aqueous extracts of
Venerupis decussata and Venerupis corrugata comparing with Venerupis philippinarum, all exposed at salinity 28. ...................................................................................................................... 61


List of Abbreviations
BSA – Bovine Serum Albumin
CAT – Catalase
CDNB – 1-chloro-2,4-dinitrobenzene
DTPA – Diethylene Triamine Pentaacetic Acid
DTT – Dithiothreitol
EDTA – Ethylenediamine Tetraacetic Acid
GSH – Reduced Glutathione
GSH/GSSG – Reduced Glutathione/Oxidized Glutathione ratio
GSSG – Oxidized Glutathione
GST – Glutathione S-Transferase
KIO4 – Potassium Periodate
KOH – Potassium Hydroxide
LPO – Lipid Peroxidation
MDA – Malondialdehyde
MVA – Multivariate analysis
NADPH – Nicotinamide Adenine Dinucleotide Phosphate
NBT – Nitro Blue Tetrazolium
NMR – Nuclear Magnetic Resonance
OCR - Oxygen Consumption Rate
PCA – Principal Components Analysis
PCO – Principal Coordinates analysis
PLS-DA – Partial Least Squares - Discriminant Analysis
PVP – Polyvinylpyrrolidone
ROS – Reactive Oxigen Species
SOD – Superoxide Dismutase
TBA – Thiobarbituric Acid
TBARS – ThioBarbituric Acid Reactive Substances
TCA – Trichloroacetic Acid


1. Introduction

Introduction
2
1.1. Aquatic Systems under global changes
1.1.1. Climate changes: salinity alterations
The alterations on climate are a global problem and have been studied in the last few decades
(Hull and Tortoriello, 1979; Beare and Heaney, 2002; Milly et al., 2002; Booij, 2005; Kay et al.,
2006; Solomon et al., 2007). Behind these alterations is the increase of greenhouse gas
concentrations provoked by anthropogenic activities (Houghton et al., 1996; Beare and Heaney,
2002; Karl and Trenberth, 2003; Booij, 2005; Solomon et al., 2007). The consequences of these
events may occur at several levels, as described by the International Panel on Climate Change
(IPCC, 2007). The increase of sea level, evapotranspiration, runoff and river discharge, changes in
ocean circulation, extreme precipitation, changes in sea surface temperature, wind speed and
even changes in nutrient supply and distribution of plankton are some of the changes predicted
by IPCC (2002; 2008). IPCC also predicted that global climate changes will occur in the next
hundred years and the main alterations in marine environment include water acidification and
changes in water salinity (Booij, 2005; Kay et al., 2006). It is expected that the increase of mean
sea level will intensify flooding and provoke flood of low-lying coastal areas, erosion of lagoon
sand barriers and invasion of saltwater in estuaries and aquifers, which will cause a freshwater
lack and loss of natural ecosystems in these environments (Nicholls et al., 2007; FitzGerald et al.,
2008; Nicholls, 2010). Thus, due to erosion of barriers in lagoon systems and intensification of
flooding, it is expected the increase of salinity in estuaries (Hull and Tortoriello, 1979; Beare and
Heaney, 2002). In fact, estuaries are particularly affected by climate changes, especially by salinity
fluctuations, due to tidal inputs and mainly due to long periods of extreme precipitation,
decreasing the salinity of the water, and dry and hot seasons increasing the salt concentration.
Thus the organisms that live in these ecosystems, periodically experience hypo and hypersaline
stresses.
In a warmer world dominated by human influences, longer periods of precipitation and more
intense variations of salinity are predicted to become seriously frequent. These events will
certainly affect the organisms living in ecosystems where the salinity fluctuations are common.
Due to these changes, it is very important and extremely urgent to study the effects of salinity
fluctuations in aquatic organisms, especially those living in estuaries and lagoon systems, like
bivalves.

Introduction
3
The impact of climate change on salinity shifts is studied since 1979 (Hull and Tortoriello,
1979) and since then, other studies have been performed in this field of work and it is known that
salinity profoundly affects chemical, physical and biological dynamics of estuaries (Gibson and
Najjar, 2000). Johnson et al. (1991) affirmed that the effect on density, circulation and
stratification is the most important physical consequence of salinity. Furthermore, biological
dynamics are affected, since salt concentrations in a transitional water system affect the density
and occurrence of populations in ecological niches according to their salinity tolerance (Attrill and
Rundle, 2002). Nicholls et al. (2007) affirmed that salt concentration alterations, induced by
climate change, affect the ecological equilibrium of transitional water systems, forcing organisms
living in these very productive environments, to readapt in relation of their distribution. Velasco
et al. (2006) investigated the biomass of primary producers in a hypersaline stream and concluded
that the main factor determining the composition and structure of macroinvertebrate
communities in a protected area in Spain (Rambla Salada) was salinity. Furthermore, it has been
shown that salinity alterations disrupts the organisms affecting their distribution, survival, growth
and reproduction (Hall and Burns, 2002; Gonçalves et al., 2007; Brucet et al., 2010). The exposure
of larvae states to salinity changes have influence in the survival capacity, growth and
development of organisms (Giménez and Anger, 2001; Giménez and Torres, 2002; Giménez,
2003). Giménez and Anger (2001) discovered that higher losses of carbon and nitrogen at lower
(15 and 20) than at higher (32) salinities leads to a loss of biomass during embryogenesis of the
estuarine crab Chasmagnathus granulata and concluded that salinity changes may have effects in
the survival of early larvae in the field. Giménez and Torres (2002) also studied the influence of
salinity in C. granulata during embryonic development and found that a group of physiological
and development processes and variability in biomass are affected in embryos when exposed to a
salinity stress, which may influence the survival and growth in advanced stages of its life cycle.
When assessing the spread of an invasive species into a new environment salinity is one of
the major factors limiting the spatial distribution of marine species (Widdows and Shick, 1985;
Berger and Kharazova, 1997). Thus, the study of interactions between the alien and native marine
species under stressful conditions, namely salinity shifts, has become a focus of interest,
especially when it comes to economically relevant species.
Introduction
4
1.1.2. Alien species
One of the major threats to biological diversity is now acknowledged to be biological invasions
caused by alien species, which has been recognized as an important element of global change
(Pravoni et al., 2006). Elliot (2003) describes that there are many aspects in which introduced
marine organisms can be regarded as being no different from chemical pollutants and encourages
the use of the term biological pollution.
Exotic, alien, or allochthonous species are defined as species that are introduced out of their
native habitat by the man (intentionally or accidentally) or naturally (Ruiz et al., 1997; Occhipinti-
Ambrogi and Savini, 2003). When this introduction become a threat to biodiversity, economy
or/and public health, the species are identified as invasive.
Marine species are probably the easiest group of animals to transport to a new environment.
Since the beginning of ship traveling organisms have been accidentally transported on ballast of
the ships, making the marine invasions historical (Bax et al., 2003). Navigation, aquaculture,
channels building, some recreation activities, discharges of ballast water, tourism and sportive
fishery represent some of the vectors that contribute to the introduction of exotic marine
organisms (Leppäkoski, 1991; Bax et al., 2003; Ruiz et al., 1997). Thousands of freshwater,
estuarine and marine species have been established far away from their native regions (Elton,
1958; Carlton and Geller, 1993).
Some of the exotic species adapt to the new habitat becoming part of the ecosystem,
coexisting with the native species. However, some non-native species just compete with the
native becoming invasive if they have more favourable characteristics (Bax et al., 2003). Like
Charles Darwin proposed, natural selection will command the most adapted species to live in
certain habitat and under certain conditions. For example, the native species can lose their priori
advantage in an environment where they were well-adapted if anthropogenic alterations rapidly
alter the environmental conditions and they had to compete with exotic species (Pravoni et al.,
2006). This means that if the environmental conditions suddenly changed, the exotic species will
compete with the native because the former are as well or better adapted to the new conditions
(Byers, 2002). Invasions can be considered threats for native species. The alteration on ecosystem
properties and consequent influence in other species include reduction of food availability,
changes on concentrations of phytoplankton and zooplankton; change in flow of nutrients,
influencing the biogeochemical cycle; quality of physical resources, including free space,
Introduction
5
temperature and light (Gutiérrez et al., 2003; Crooks, 2002). The invasions also have impacts on
economic and social issues, affecting the activities involved on marine environments – fisheries,
aquaculture, tourism activities and recreational activities (Bax et al., 2003). Invasive species are
not only directly involved in social impacts, but they have also an indirect responsibility on the
decrease of local people’s well-being, degrading and reducing the quality of their natural
environment.
On the other hand, in some cases, alien species could also be positive. It can be one reason to
create new economic activities and consequently, increase workstations related to this activities
and others like project management of exotic marine species (Bax et al., 2003). Positive effects of
invasion of exotic species also include the opportunity of native species to escape to predation,
taking advantage of shells of living molluscs that provide a structural barrier. It can also create
other micro-habitats on the empty spaces between shells and protect other organisms from
waves, currents, temperature and others stresses (Gutiérrez et al., 2003).
The most part of marine exotic species are found in the tidal and subtidal zones (Bax et al.,
2003). Streftaris et al. (2005), showed that zoobenthos represents about 57 % of the non-
indigenous species in European seas, being the dominant group of organisms invading new
habitats. The same study demonstrated that the Mollusca phylum represents 23 % of all alien
species in seas of Europe.
Bivalves are one of the examples of invasion in oceans, colonising several aquatic ecosystems
with particularly ecological and economic impacts (Sousa et al., 2009). Some invasions of bivalves
are positive for invertebrate density and species richness, but on the other hand, there are cases
of bivalves invasions associated with decreases, or even extinction, of some species (Solidoro et
al., 2000; Pravoni et al., 2006; Sousa et al., 2009).
1.2. Bivalves as bioindicators
Bivalves are characterised by the presence of two shells or valves, articulated in its dorsal
portion by a corneal ligament. Their shells are constituted by one layer with protein composition
and two layers composed by calcium carbonate (CaCO3) (Gosling, 2003; González, 2012). They
filter the water catching organic matter and phytoplankton as food. In species that live buried in
sediment, feeding and breathing are performed through two siphons (one inhalant and other
exhalant). Bivalves can be found in fresh or seawater, and their survival capacity and life quality

Introduction
6
depends on environmental (abiotic) and biological (biotic) factors. The three species under
analysis in this study are gonochoric (with separated sexes in different organisms), although
hermaphroditism is rarely detected (González, 2012). In bivalves, fertilization occurs externally
after females and males discharge the gametes in water and especially during de summer
(González, 2012). When gametes are fertilized, larval development initiates with cleavage of the
embryo yielding a trochophore pyriform, an invertebrate free-swimming larva. The straight-
hinged larva or Dlarva stage (D-stage, the second larval form) presents already two valves
protecting a complete digestive system, and the velum, a locomotor and feeding organ. During
this stage while the larvae swim, feeding and growing, a protuberance in shell near the hinge,
called umbo, develops until larvae approach maturity. A foot and gills are formed in the maturity
stage. Metamorphosis occurs when the branchia is developed and the velum is lost. In this phase
of their life cycle, clams change to a sedentary benthic life style. Thanks to the foot, postlarvae
organisms (with similar appearance to adults) bury in sediment and rapidly become adults
(Gosling, 2003; González, 2012).
The sessile condition and feeding habits (filtration), put bivalves constantly subjected to
environmental stressful conditions, such as fluctuations in water temperature, oxygen
concentrations and salinity, predators, alterations on food availability and the quality of the
surrounding environment (Almeida et al., 2007). Salinity, temperature, dissolved oxygen, light and
pH are some of the abiotic factors that influence the biological processes of bivalves and their
activity and the presence of parasites, competitors and quantity of food available represent the
potential biotic threats (Berger and Kharazova, 1997).
1.2.1. Responses of bivalves to salinity alterations
Bivalves, such as many other organisms, have the ability to adapt themselves to different
alterations in the surrounding environment, based on regulating processes, which maintain
physiological homeostasis of individuals (Manduzio et al., 2005). These organisms are examples of
benthic species and have been considered good aquatic bioindicators for having a wide
geographical distribution, tolerance to several adverse conditions, great capacity of
bioaccumulation, sedentary behaviour and single sampling (Pruell et al., 1986; Usero et al., 1997;
Gómez-Ariza et al., 2000; Reid et al., 2003; Luedeking and Koehler, 2004; Albentosa et al., 2007;
Liu et al., 2011; Kamel et al., 2012; Antunes et al., 2013; McEneff et al., 2014).
Introduction
7
Because molluscs bivalves are filterers and due to their habitat characteristics and functional
morphology, these organisms become a “mirror” of the environment. The analysis of several
organic parts of bivalves, allows to obtain indicators of the condition of sediment and water
column where they inhabit. Their bioaccumulation action, as the capacity of concentrating many
elements existing in the environment (e.g. metals or organic compounds), make these organisms
very important indicators of pollution levels in their ecosystem.
Typical responses of aquatic organisms to salinity changes include, besides mortality,
biochemical, physiological and metabolic responses and the reduction of feeding activity and
growth rates (Shumway, 1977a, 1977b; Navarro, 1988; Guerin and Stickle, 1992; Matozzo et al.,
2007; Carregosa et al., 2014a). In particular, marine organisms living in estuaries are subjected to
tidal and rain periods, causing short-term and long-term changes in salt concentrations. These
events force these organisms to appeal to physiological mechanisms to be able to survive under
these stress conditions (Navarro and Gonzalez, 1998).
The abiotic factors have consequences in the bivalves accumulation capacity, since it may
limit the filtration rate. Thus, the monitoring of the bivalves’ health is an important indicator of
microbiological and chemical quality of their production areas. Since bivalves are among
organisms that are highly influenced by salinity fluctuations, because they are mostly estuarine or
near shore nature, it is important to understand the implications of such alterations on these
organisms.
Bivalves may immediately close their valves when the surrounding salinity concentration
changes as a mechanism of defence against osmotic stress (Kim et al., 2001; Gosling, 2003).
Akberali (1978) and Elston et al. (2003) demonstrated, respectively, that Scrobicularia plana and
Venerupis philippinarum are able to close their valves when exposed to low salinities so that they
can resist to this osmotic stress. Kim et al. (2001) suggested that valves closure in V. philippinarum
when it is exposed to low salinities (5, 10, 15 and 20), resulting into a reduction of Oxygen
Consumption Rate (OCR), and respiration rate.
Navarro (1988) showed that when the mussel Choromytilus chorus was exposed to a range of
salinities (15, 18, 24 and 30), low feeding activity and high metabolic rate at lower salinities,
promoted a decrease growth efficiency. Similar results were found by Navarro and Gonzalez
(1998). These authors exposed the scallop Argopecten purpuratus to different salinity
concentrations (18, 21, 24, 27 and 30) and concluded that its scope for growth was negatively
affected by lower salinities (18 to 24) due to low feeding activity, loss of energy in excretion and

Introduction
8
respiration activity, ingestion and absorption rates. Long periods of exposure to low salinity have
important effects on the performance and osmoregulatory mechanisms, inducing a significant
decrease of the ingestion and scope for growth rates of Chlamys opercularis and Patinopecten
caurinus (Shumway, 1977b; Bernard, 1983). As described by Sarà et al. (2008), the scope for
growth of the Brachidontes pharaonis is negatively affected by low salinity (15) in a range of
salinities from 37 to 15.
Since water is considered the most important molecule of life, its internal loss on cells is
certainly a threat to organisms (Yancey, 2005) and cope with this changes is extremely important
for survival of organisms exposed to such alterations. Osmoregulation is one of the protection
mechanisms, and perhaps the most effective one, working for survival of marine organisms under
salinity alterations (Shumway, 1977a; Berger and Kharazova, 1997). Normally, osmoregulation in a
new environment, namely with different salt concentration, is performed by inorganic cations,
such as Na, Cl, and K (Evans et al., 2005; Bianchini et al., 2008). However, osmoregulation
performed by inorganic cations represents a less energy costly mechanism than the one regulated
by organic compounds (Carregosa et al., 2014a). Additionally, major osmotic components in cells
of multicellular organisms are organic osmolytes, although the extracellular fluids are mostly
composed by inorganic compounds, such as NaCl (Yancey, 2005). Osmoregulation achieved by
organic molecules, include the functioning of osmolytes, is used by organisms to maintain cell
volume when they are under osmolarity stress (Yancey, 2005). Organic osmolytes have unique
properties such as protecting metabolic reactions and counteracting the destabilizing forces on
macromolecules, which confers them an important role on the prevention of cellular damage
(Carregosa et al., 2014a).
Osmoconformers are organisms that adapt their fluids osmolarity according to the external
environment. This type of organisms are most commonly found in the oceans and include
vertebrates and some arthropods (Yancey, 2005). Whereas some osmoregulators in oceans
(sharks, hagfishes, skates, fishes…) have regulator organs, namely gills and kidneys, which
maintain the osmolarity of their internal body fluids, avoiding in general, the use of organic
compounds, osmoconformers need these molecules to regulate their metabolism and match their
body osmolarity to the surrounding environment. Organic osmolytes include, among others, small
carbohydrates like sugars and amino acids (for example, glycine, proline, taurine) (Yancey et al.,
1982; 2001). These compounds have a very diffuse occurrence. While some organic osmolytes,
such as glycine and betaine, are found in every kingdoms of life, others like taurine is more
common in marine organisms and in some mammalian organs (Yancey, 2005).

Introduction
9
Aquatic organisms under osmotic pressure can also respond to these adverse conditions with
oxidative stress. The study of different stages related to this mechanism can give relevant
information about their physiological status. Oxygen plays an important role in the species
diversification and in their distribution on the ecosystems (Manduzio et al., 2005). Many biological
reactions and processes have oxygen as base, making this molecule essential to aerobic
organisms, but it can also be dangerous due to its great oxidizing capacities (Abele, 2000;
Manduzio et al., 2005).
Reactive Oxygen Species (ROS), atoms or molecules that are extremely unstable and
potentially reactive (Manduzio et al., 2005; Almeida et al., 2007), are generated by all the
reactions involving oxygen consumption (Abele, 2000). Organisms rely on a respiratory chain and
enzymatic systems to use oxygen, but they also need some mechanisms to deal or eliminate the
toxic effects of oxygen (Ďuračková, 2008). When this mechanisms are not balanced meaning that
preference is given to the formation of oxidants, allowing the generation of reactive metabolites
of oxygen and nitrogen (ROS and RNS, Reactive Nitrogen Species), oxidative stress can be
established, leading to oxidation of key cell components like proteins, fatty acids and DNA (Sies,
1997; Hayes et al., 2004; Manduzio et al., 2005; Wakamatsu et al., 2008; Niki, 2012; Antunes et
al., 2013). Oxidants are also produced as a result of aerobic metabolism, being a common
outcome during the development of natural physiological processes in cell, but in adverse
conditions, it can be produced at higher levels (Sies, 1997), forcing the cell to fight against this
uncontrolled production of oxidants to avoid cell damage (Storey, 1996). Superoxide anion radical
(O2•ˉ), hydrogen peroxide (H2O2) and hydroxyl radical (•HO) formation are intermediate steps for
oxygen reduction (Sies, 1997; Griendling and FitzGerald, 2003). Free radicals become toxic to the
cell when the protective mechanisms fail, leading to a damage on molecules, cells, organs and
even to death of the organisms. Damages in mitochondria caused by superoxide, can lead to
apoptosis – cellular suicide (Abele, 2002). One way of interception of toxic free radicals is
performed by enzymatic antioxidants. Superoxide dismutases, catalases and glutathione
peroxidases are the main classes of antioxidant enzymes. Specialized antioxidant defences pass
through catalase (CAT), that detoxificate H2O2, superoxide dismutase (SOD), for decomposition of
O2•ˉ, oxidized glutathione (GSSG), glutathione S-transferase (GST) (Sies, 1997; Griendling and
FitzGerald, 2003).
1.2.2. Tested species

Introduction
10
The clams Venerupis decussata, Venerupis corrugata and Venerupis philippinarum were used
in the present study. These species belong to Animalia kingdom, Mollusca phylum, Bivalvia class,
Veneroida order, Veneridae family, Venerupis genus (ITIS report). Several studies demonstrated
that these species are found worl-wide (Flassch and Leborgne, 1992; Usero et al., 1997; Allam et
al., 2000; Elston et al., 2003; Pravoni et al., 2006; Delgado and Pérez-Camacho, 2007; Bebianno
and Barreira, 2009; Dang et al., 2010; Figueira and Freitas, 2013).
Venerupis decussata (Linnaeus, 1758) (Figure 1C), formerly known as Ruditapes decussatus,
also known as grooved carpet shell or European clam (Usero et al., 1997) is characterized by its
yellowish colour with brown stains, radial and concentric ridges. It is an euryhaline species that
lives in sheltered areas of the coast, bays, estuaries and river mouths. This bivalve lives buried in
sediment up to 12 cm. Feeding and breathing are performed by two siphons separated along its
whole length. The fertilization of this species occurs in water, where females lay their oocytes and
males deposit the sperm, since they have separated sexes.
V. decussata is native from Europe and it is distributed along Atlantic coast from Norway to
Congo, English Channel, Mediterranean Sea and in Red Sea (Parache, 1982; Gosling, 2002). This
species is mainly produced in France, Spain, Portugal and in the Mediterranean basin (Schuller,
1998; FAO 2011). The European clam has a great economic value and a consequent high
commercial value, representing an important resource (Matias et al., 2009; 2013). In Portugal, this
species is hardly produced and harvested, representing a large portion of the aquaculture
production (27 % in 2009; DGPA, 2011), being the Ria de Aveiro one of the main production areas
(Matias et al., 2009; 2013).
Figure 1. Clam species: A - Venerupis corrugata; B - Venerupis philippinarum; C - Venerupis decussata.

Introduction
11
Venerupis philippinarum (Adams & Reeve, 1850) (Figure 1B), formerly known as Ruditapes
philippinarum, is characterised by a solid, equivalve and inequilateral shell, with many variations
in colour and pattern, generally brownish. This species, also known as Japanese carpet shell or
Manila clam, lives buried in sediment approximately at 4 cm to surface in intertidal and subtidal
zones.
The manila clam is native from Indo-Pacific regions (Gosling 2003), being the wild populations
found in Asiatic coast (Philippines, South and East China Seas, Yellow Sea, Sea of Japan, Sea of
Okhotsk and around Southern Kuril Islands) (FAO).
Manila clam was accidentally introduced in east part of Pacific coast, North America, in the
beginning of 1930s, imported together with Pacific oysters, Crassostera gigas (Flassch and
Leborgne, 1992). Late, due to the unstable yields and overfishing of European V. decussata, force
the intencional import of V. philippinarum with aquaculture proposes (Breber, 1985; Pellizzato et
al., 1989; Gosling, 2003). At the beginning of 1970s this species was introduced in France (Bodoy
et al., 1981; Flassch and Leborgne, 1992; Gosling 2002) and rapidly spread along European coastal
systems, becoming in some places the main contributor to the local fisheries. Because this species
showed to have a faster growing that V. decussata, other countries, like Ireland, Italy, England,
Spain (Flassch and Leborgne, 1992; ICES, 2011) also imported it into European waters following
the large aquaculture hatchery. Thus, presently, V. philippinarum is one of the mollusc species
that have been able to settle far away from its natural habitat (Melià and Gatto, 2005; Melià et
al., 2004) being one of the most exploited bivalves species (Usero et al., 1997; Allam et al., 2000;
Pravoni et al., 2006; Dang et al., 2010; Figueira et al., 2012; Moschino et al., 2012; Figueira and
Freitas, 2013; FAO, 2014a).
The great capacity of V. philippinarum to introduce itself into a new environment, coupled
with its fast growth give to this species a high commercial value (Usero et al., 1997), which have
been changed sharply the exploitation of living resources in aquatic ecosystems, with Manila clam
representing 2.36 million tonnes of produced organisms in 2002 (FAO, 2010).
It is unknown when and how Manila clam was introduced in Portugal, but it was registered for
the first time in the Tagus estuary in 2000, in extensive intertidal and shallow areas (ICES, 2011).
At the same time that abundance of V. philippinarum increased, it was noticed a massive decrease
in abundance of the native V. decussata (Pravoni et al., 2006; ICES, 2011), living in sympatric in
same places. This species is the most commonly cultured clam species (Clam fisheries and
Aquaculture), being the fourth species more produced in world in 2011 with 3.68 million tonnes
among fishes, crustaceans, molluscs and others (FAO, 2013). Some authors have been described

Introduction
12
V. philippinarum as being more capable to survive to physical, environmental and anthropogenic
stressors than other species, which make this species able to take the ecological niche of native
species in the locals where V. philippinarum was introduced (Solidoro et al., 2000; Pravoni et al.,
2006).
Venerupis corrugata (Gmelin, 1791) (Figure 1A), formerly known as Venerupis pullastra, is
also known as pullet carpet shell (and), present an equivalve and not equilateral shell and its
coloration can vary from cream to light brown, grey or yellowish white, with darker bands
representing the growth stages. Unlike V. decussata and V. philippinarum, the siphons of this
species are joined along their entire length, except in the end zone. The outside of the shell,
periostracum, is fine and flat with concentric and irregular ridges usually more pronounced in the
posterior area and radial ridges very fine. It leaves buried in sand and silty mud, up to 5 cm and it
can be found from the low tide mark to nearly 40 m of depth of water column.
This species is distributed from the North of Norway to Atlantic coast of Morocco undergoing
by Iberian Peninsula and the majority of the harvesting of this species occurs in Portugal, Spain,
France and Italy (FAO, 2010). The intensive capture of this species started in 1926 (Anacleto et al.,
2013; FAO, 2014c).
According to FAO, in 2009 the production of fishes and molluscs in Portugal represented
almost 100 % of total aquaculture production. According the last update information (INE, 2013),
42 % of the total shellfish production represents the national annual production of clams in
Portugal, being extremely important to the national socioeconomic framework, since it implies,
directly or indirectly, thousands of employees.
The organisms included in Bivalvia phylum are economically relevant in Portugal, representing
a significant part of national fishery (IPIMAR, 2008). These organisms are part of Portuguese
cuisine, being much appreciated by their consumers especially in summer (Nunes and Campos,
2008).

Introduction
13
1.3. Objectives
Unexpected and irreversible consequences are expected for the native communities when
different stressors act together, namely biological invasions and salinity alterations (Occhipinti-
Ambrogi and Savani, 2003; Whitfield et al., 2007). Indeed, salinity is one of the most relevant
environmental factors that have impact in marine organisms, restricting their spatial distribution
(Widdows and Shick, 1985; Berger and Kharazova, 1997). Thus, salinity changes in aquatic systems
are especially important when assessing the spread of an invasive species in a new environment.
For this reason, the present work was conducted with the aim to investigate the influence of
salinity alterations in native (V. decussata and Venerupis corrugata) and invasive (Venerupis
philippinarum) clam species. The three clam species, collected at the Ria de Aveiro (where they
live in sympatry), were exposed to a range of salinities under controlled laboratory conditions. To
assess the salinity effects on these species, ionic content, physiological, biochemical and
metabolic alterations were investigated. Powerful tools, such as RMN, were used to assess the
biological impacts of salinity changes on these three Veneridae clams aiming to identify the
mechanisms activated as response to this osmotic stress.

Introduction
14
2. Materials and Methods
Materials and Methods
16
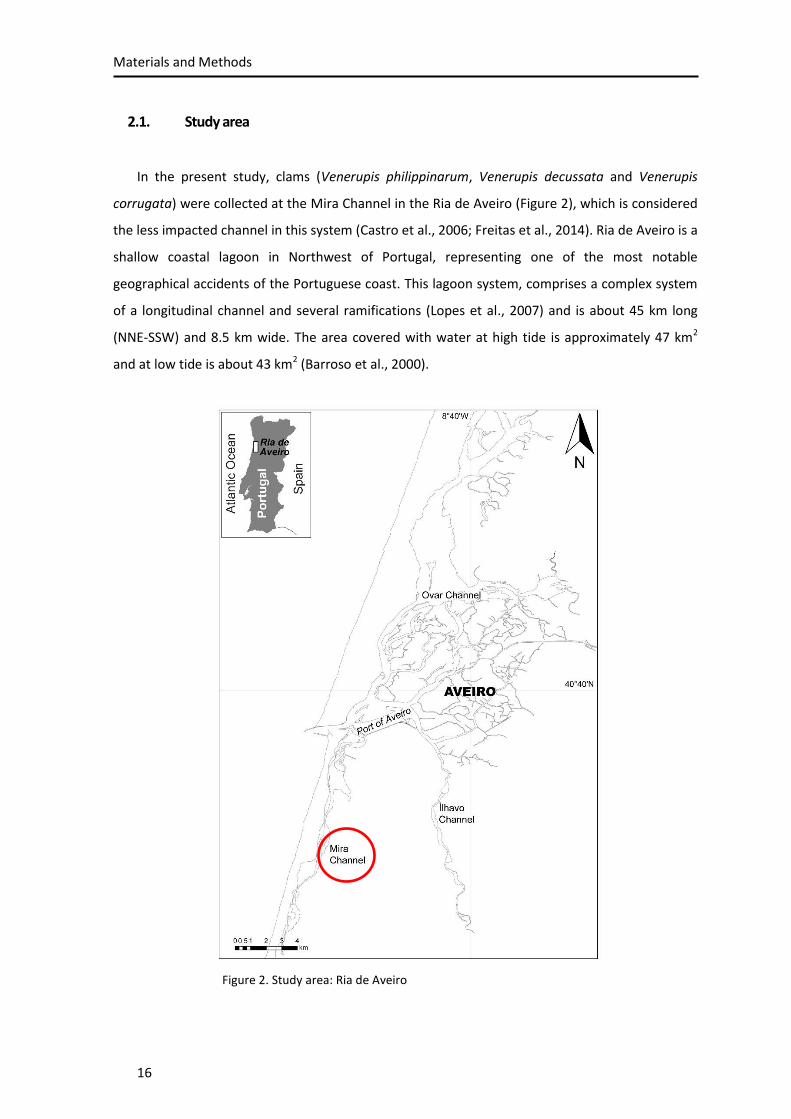
2.1. Study area
In the present study, clams (Venerupis philippinarum, Venerupis decussata and Venerupis
corrugata) were collected at the Mira Channel in the Ria de Aveiro (Figure 2), which is considered
the less impacted channel in this system (Castro et al., 2006; Freitas et al., 2014). Ria de Aveiro is a
shallow coastal lagoon in Northwest of Portugal, representing one of the most notable
geographical accidents of the Portuguese coast. This lagoon system, comprises a complex system
of a longitudinal channel and several ramifications (Lopes et al., 2007) and is about 45 km long
(NNE-SSW) and 8.5 km wide. The area covered with water at high tide is approximately 47 km2
and at low tide is about 43 km2 (Barroso et al., 2000).
Figure 2. Study area: Ria de Aveiro

Materials and Methods
17
The Ria de Aveiro presents significant intertidal zones (mud flats and salt marshes) and it is
connected to the Atlantic Ocean only through a narrow channel with 1.3 km of length, 350 m
width and 20 m of depth (Dias et al., 2000). The water exchange is performed through the
navigation channel, by the tidal inputs (Dias et al., 1999) and there are many rivers and streams
that flow into Ria de Aveiro, being Rio Vouga, Antuã and Fontão (on North) and Rio Boco (on
South) the principal fluxes (Rebelo and Pombo, 2001).
It is notorious the seasonal and spatial salinity variation in the Ria de Aveiro (Dias et al., 2011).
The adjacent rivers, periods of rain, hot and dry seasons and sea water inputs are the agents
responsible for the wide range of salinities (0-36) in this ecosystem. However, the water
circulation is dominated by the sea water penetrating the Ria de Aveiro (70 x 106 m3 in spring
tides) comparatively with the input of freshwater (1.8 x 10⁶ m3 per tidal circle) (Moreira et al.,
1993). In terms of seasonal variation, during the winter and at the beginning of Spring the lowest
salinities are found, while the highest values of salinity are registered during late Spring and
Summer (Dias et al., 2011). As a consequence of the spatial gradient of salinity (from about 0 at
the freshwater discharges from the tributaries, and about 36 at the connection with sea), this
lagoon system represents a habitat for many different species. Here, like in all marine habitats,
the benthic community distribution (including the species used in this research) is strongly
influenced by the hydrodynamics and salinity gradient (Rodrigues et al., 2011), which is one of the
most important factor for spatial distribution of the species.
2.2. Sampling procedure
In the present study, clams were collected from a subtidal area. Although the three species
live in sympatry in this lagoon, they may not co-existe in the same site. Considering this, the
sampling area was selected taking into account the co-existence of the 3 species to ensure that
they were under the same conditions. A total of approximately 200 organisms were collected in
the sampling site and at same time (October of 2012). In order to minimize the effect of body size
on biochemical and physiological responses to salinity changes, organisms of similar size were
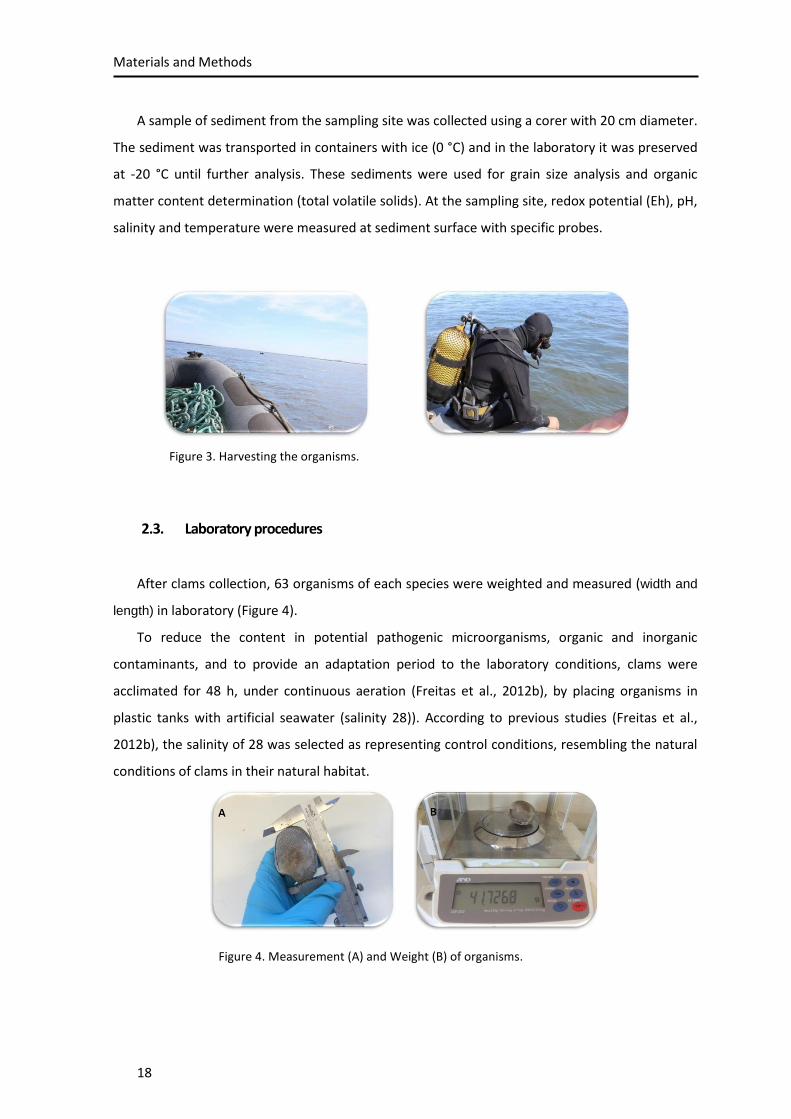
collected. The harvest was carried out by professional divers (Figure 3). The species were
confirmed and brushed carefully on board to remove fine sediments and transported to the
laboratory in ice-cold plastic containers.
Materials and Methods
18
A sample of sediment from the sampling site was collected using a corer with 20 cm diameter.
The sediment was transported in containers with ice (0 °C) and in the laboratory it was preserved
at -20 °C until further analysis. These sediments were used for grain size analysis and organic
matter content determination (total volatile solids). At the sampling site, redox potential (Eh), pH,
salinity and temperature were measured at sediment surface with specific probes.
2.3. Laboratory procedures
After clams collection, 63 organisms of each species were weighted and measured (width and
length) in laboratory (Figure 4).
To reduce the content in potential pathogenic microorganisms, organic and inorganic
contaminants, and to provide an adaptation period to the laboratory conditions, clams were
acclimated for 48 h, under continuous aeration (Freitas et al., 2012b), by placing organisms in
plastic tanks with artificial seawater (salinity 28)). According to previous studies (Freitas et al.,
2012b), the salinity of 28 was selected as representing control conditions, resembling the natural
conditions of clams in their natural habitat.
Figure 3. Harvesting the organisms.
Figure 4. Measurement (A) and Weight (B) of organisms.

Materials and Methods
19
After acclimation, the organisms were exposed during 144 hours to salinity assays (Elston et
al., 2003), consisting of the exposure of 9 organisms/salinity level (3 replicates per level, 3
individuals/replicate). The salinities used were: 0, 7, 14, 21, 28, 35 and 42 (Figure 5). It is
important to note that salinity is considered to be dimensionless, being defined by UNESCO
Practical Salinity Scale of 1978 (PSS78) as a conductivity ratio (NASA, 2010).
A plastic container with 1 L of water was used for each replicate. Water was prepared with
commercial salt (Tropical Marin – sea salt, the pharmaceutical grade sea salt especially for
modern reef aquaria). A temperature of 18 ± 1 °C was maintained during acclimation and
experimental periods, each container was maintained under continuous aeration and the
photoperiod was fixed to 12 h light and 12 h dark. During the experiment, the water of each
container was renewed every other day and dead organisms were removed from the containers
whenever the water was changed. Organisms were considered dead when their shells gaped and
failed to shut again after external stimulus. At the end of the experiment, surviving organisms
were frozen at -80 °C for further analysis.
Figure 5. Experimental design for clams exposure to different salinities (0, 7, 14, 21, 28, 35 and 42).

Materials and Methods
20
2.3.1. Sediments grain size and Organic matter content
To determine sediment grain size of the sampling site, the procedure described by Quintino et
al. (1989) was followed. The sediment was weighed (approximately 120 g), washed with
destilated water and the chemical destruction of organic matter was performed with successive
increasing concentrations of hydrogen peroxide (H2O2): 30, 60 and 120 volumes (Figure 6A). After
H2O2 addition, the samples were dried in an oven at 60 °C until obtaining a constant weight (from
24 to 48 h) and the total weight was determined (P1). The chemical dispersion of sediments was
carried out for 24 h with decahydrate pyrophosphate tetra-sodium (30 g/L) - agent which allows
disaggregation of particles. A wet sieving was performed, by wet sieving through a 63 µm mesh
and the material retained at this mesh was dried again in an oven at 60 °C until obtain a constant
weight (P2). The weight of fraction lower than 63 µm was determined by the difference between
P1 and P2. Sediments with diameter higher than 63 µm (P2) were mechanically dry sieved using
sieves with mesh sizes of 63 pm (4 ɸ) and 4 mm (-2 ɸ), with an interval of 1 ɸ (ɸ = -log2 particle
size expressed in mm) (Figure 6B). The fractions retained on each sieve were weighed and the
percentage was determined in relation to the total dry weight. The median (P50) was measured
from the percentages obtained, value where 50 % of the cumulative percentage of the sample is
located. The sediments were classified according to the Wentworth scale, based on the median
value and taking into account the level of fines (Table 1).
Figure 6. A- Destruction of organic matter with H2O2; B- Dry
separation of sediments on a battery of sieves
Materials and Methods
21
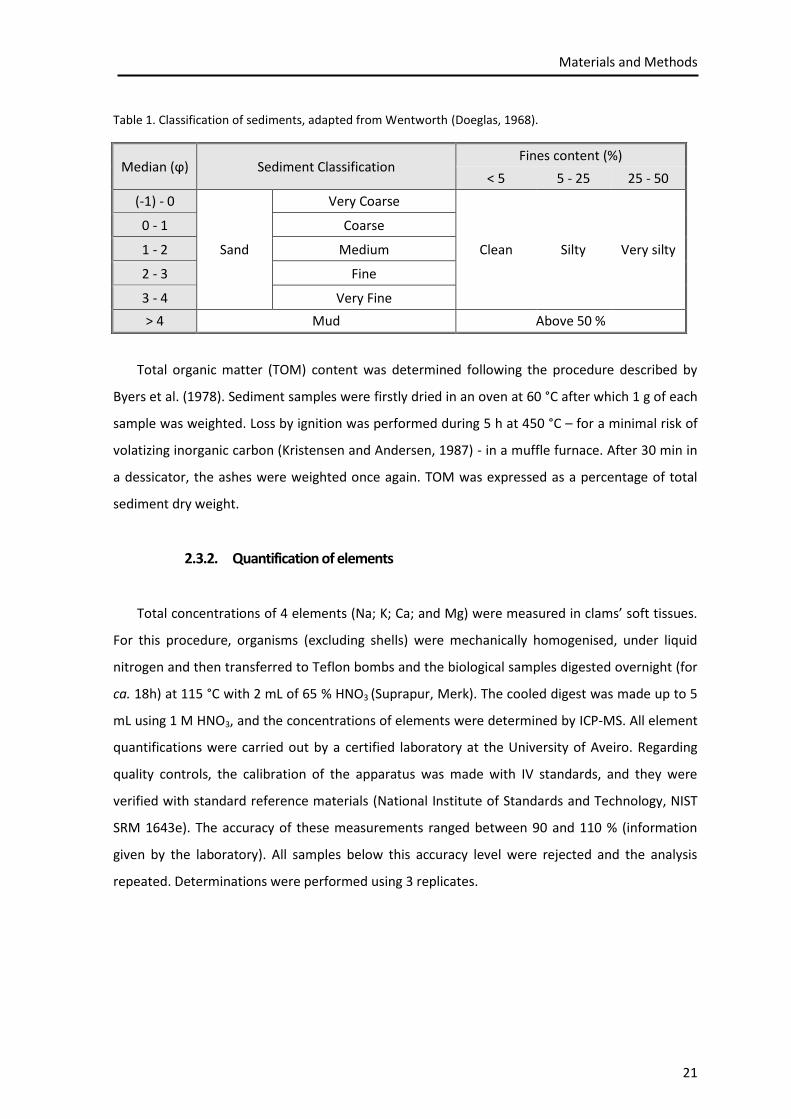
Table 1. Classification of sediments, adapted from Wentworth (Doeglas, 1968).
Total organic matter (TOM) content was determined following the procedure described by
Byers et al. (1978). Sediment samples were firstly dried in an oven at 60 °C after which 1 g of each
sample was weighted. Loss by ignition was performed during 5 h at 450 °C – for a minimal risk of
volatizing inorganic carbon (Kristensen and Andersen, 1987) - in a muffle furnace. After 30 min in
a dessicator, the ashes were weighted once again. TOM was expressed as a percentage of total
sediment dry weight.
2.3.2. Quantification of elements
Total concentrations of 4 elements (Na; K; Ca; and Mg) were measured in clams’ soft tissues.
For this procedure, organisms (excluding shells) were mechanically homogenised, under liquid
nitrogen and then transferred to Teflon bombs and the biological samples digested overnight (for
ca. 18h) at 115 °C with 2 mL of 65 % HNO3 (Suprapur, Merk). The cooled digest was made up to 5
mL using 1 M HNO3, and the concentrations of elements were determined by ICP-MS. All element
quantifications were carried out by a certified laboratory at the University of Aveiro. Regarding
quality controls, the calibration of the apparatus was made with IV standards, and they were
verified with standard reference materials (National Institute of Standards and Technology, NIST
SRM 1643e). The accuracy of these measurements ranged between 90 and 110 % (information
given by the laboratory). All samples below this accuracy level were rejected and the analysis
repeated. Determinations were performed using 3 replicates.
Median (ϕ) Sediment Classification Fines content (%)
< 5 5 - 25 25 - 50
(-1) - 0
Sand
Very Coarse
Clean Silty Very silty
0 - 1 Coarse
1 - 2 Medium
2 - 3 Fine
3 - 4 Very Fine
> 4 Mud Above 50 %
Materials and Methods
22
2.3.3. Metabolomic, physiological and biochemical analysis
Bivalves have been proposed as good sentinel organisms in pollution monitoring studies
through the analysis of biochemical biomarkers. Thus, physiologycal analysis (protein, glycogen
and glucose content), biochemical measurements (lipid peroxidation, LPO; superoxide dismutase,
SOD; catalase, CAT; glutathione S-transferase, GST; total glutathione, GSHt and reduced
glutathione, GSH) and quantification of elements (sodium, Na; potassium, K; calcium, Ca; and
magnesium, Mg) were preformed to analyze the responses of these organisms under salinity
stressful conditions.
To understand the variations in metabolomic patterns of these species, two different high
sensitive technologies were used: two-dimensional gas phase chromatography coupled to
spectrophotometer detector flight time (GC x GC – ToFMS), and Nuclear Magnetic Resonance
(NMR). Volatile organic compounds (VOCs) were analyzed by GC x GC – ToFMS, which represents
a very high resolving power for metabolomic studies employing two orthogonal mechanisms to
detect and separate the compounds in samples (Rocha et al., 2013). NMR is a high resolution
technique which is capable to discriminate the intensity of metabolites like aliphatic, polar and
aromatic compounds and provide information about the molecular structure of organic molecules
and biomolecules in solution.
In the present study the three approaches were used in order to evaluate the effects of
salinity changes in three species of clams living in simpatry in Ria de Aveiro – V. decussata, V.
philippinarum and V. corrugata.
2.3.3.1. Physiological and biochemical analysis
The responses of organisms to biomarkers are essential to assess their physiological status at
molecular, cellular and individual levels (Hamer et al., 2008). Physiological and biochemical
analysis have been used to study mostly the effects of anthropogenic pollution and stresses in
bivalves. Kamel et al. (2012) studied the biochemical responses and antioxidant defence
(glutathione S-transferase, GST) in V. decussata when exposed to treated municipal effluents.
Figueira et al. (2012) investigated the impact of cadmium contamination in two clam species, V.
philippinarum and V. decussata. The effect of metals was also studied in V. decussata by Roméo
and Gnassia-Barelli (1997), Hamza-Chaffai et al. (1999), Moraga et al. (2002), Smaoui-Damak et al.
Materials and Methods
23
(2009) and Figueira et al. (2012). Recent studies by Antunes et al. (2013) used V. decussata and V.
philippinarum to assess the impacts of pharmaceutical drugs on clams.
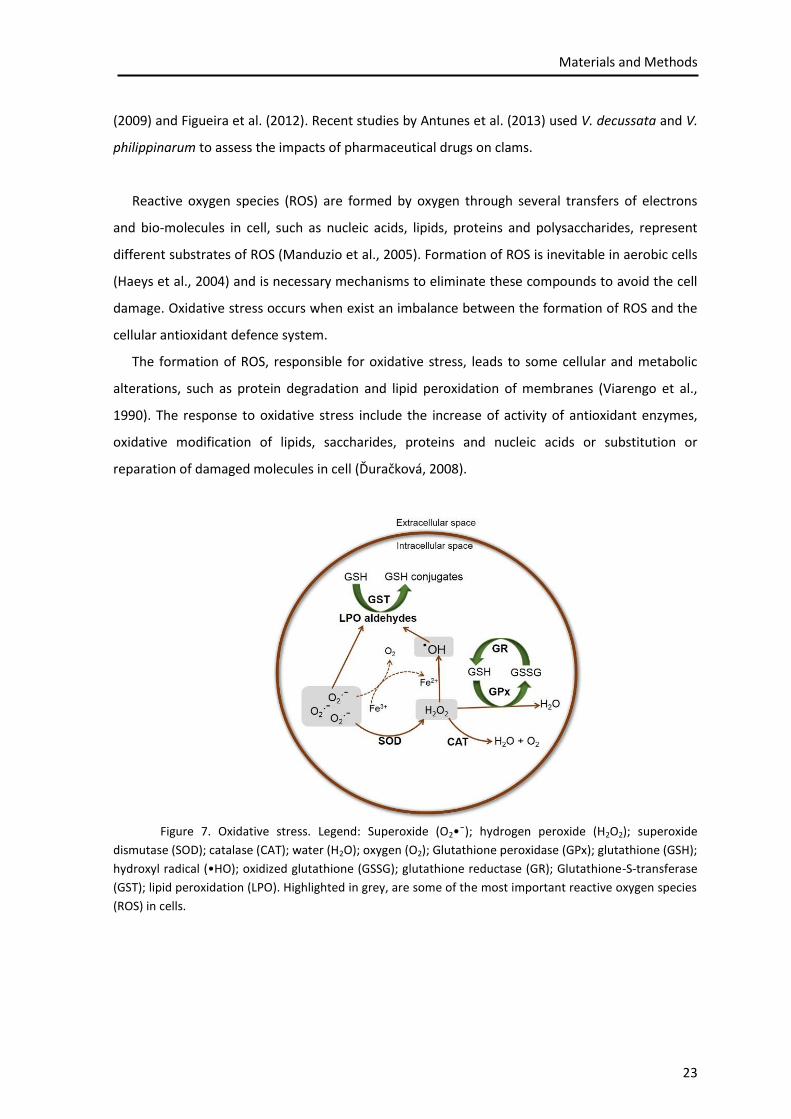
Reactive oxygen species (ROS) are formed by oxygen through several transfers of electrons
and bio-molecules in cell, such as nucleic acids, lipids, proteins and polysaccharides, represent
different substrates of ROS (Manduzio et al., 2005). Formation of ROS is inevitable in aerobic cells
(Haeys et al., 2004) and is necessary mechanisms to eliminate these compounds to avoid the cell
damage. Oxidative stress occurs when exist an imbalance between the formation of ROS and the
cellular antioxidant defence system.
The formation of ROS, responsible for oxidative stress, leads to some cellular and metabolic
alterations, such as protein degradation and lipid peroxidation of membranes (Viarengo et al.,
1990). The response to oxidative stress include the increase of activity of antioxidant enzymes,
oxidative modification of lipids, saccharides, proteins and nucleic acids or substitution or
reparation of damaged molecules in cell (Ďuračková, 2008).
Figure 7. Oxidative stress. Legend: Superoxide (O2•ˉ); hydrogen peroxide (H2O2); superoxide
dismutase (SOD); catalase (CAT); water (H2O); oxygen (O2); Glutathione peroxidase (GPx); glutathione (GSH);
hydroxyl radical (•HO); oxidized glutathione (GSSG); glutathione reductase (GR); Glutathione-S-transferase
(GST); lipid peroxidation (LPO). Highlighted in grey, are some of the most important reactive oxygen species
(ROS) in cells.

Materials and Methods
24
To prevent cell from protein oxidation, lipid peroxidation and DNA damage, provoked by
oxidative stress (Figure 7), antioxidant enzymes, like CAT and SOD work as primary defence
against oxidative damage (Livingstone, 2001), functioning as a strategy to reduce the ROS.
In biological systems, complex reactions involving free radicals, especially oxygen free radicals
(unstable atoms or molecules, with one or more lone electrons), normally results in different
kinds of radicals through several chain mechanisms (Di Giulio et al., 1989; Manduzio et al., 2005).
One of the reactive oxygen species, superoxide radical anion (O2•ˉ), results from one-electron
reduction [Equation 1]. Iron is involved in the production of •HO the Haber-Weiss reaction
(Storey, 1996; Di Giulio et al., 1989; Manduzio et al., 2005). Together with superoxide radical
anion, Fe3+ react, yielding Fe2+ and O2 [Equation 2], which will be used to form •HO. Hydrogen
peroxide is converted to hydroxyl radicals by Fe2+ [Equation 3].
SOD decompose O2•ˉ to H2O2 [Equation 4], which is converted to H2O and molecular O2 by
CAT [Equation 5] (Storey, 1996; Di Giulio et al., 1989; Geret et al., 2003; Manduzio et al., 2005;
Almeida et al., 2007). H2O2 is also reduced to water by GPx in association with GSH oxidation
[Equation 6] (Di Giulio et al., 1989; Geret et al, 2003; Almeida et al., 2007). GSSG is reduced to
GSH by the enzyme GR, helping to maintain the redox status (Di Giulio et al., 1989). Conjugation
of foreign compounds with GSH normally leads to formation of less reactive products that are
excreted. Here, GST have an antioxidant function and conjugate GSH among the end-products of
lipid peroxidation (LPO aldehydes) transforming them into glutathione conjugates, nonpolar
compounds. (Storey, 1996; Griendling and FitzGerald, 2003; Hayes et al., 2004; Almeida et al.,
2007; Wakamatsu et al., 2008). Despite the antioxidant defences, ROS can indirectly affected the
cell, due to reactive secondary metabolites resulting from the oxidation of these macromolecules
(Marnett et al., 2003). GST and GPx are examples of enzyme defences against the degradation
products of oxidative stress (Hayes et al., 2004). Chain reactions that amplify the damages on
lipids, result from the peroxidation of polyunsaturated fatty acids in membranes and become a
problem for the cell (Hayes et al., 2004).
[Equation 1]
[Equation 2]
[Equation 3]

Materials and Methods
25
[Equation 4]
[Equation 5]
[Equation 6]
Evidences of oxidative stress in organisms under analysis in the present study can be studied
observing alterations in antioxidant enzyme activities; antioxidant levels and oxidative damage in
cell.
In the present study, biochemical and physiological analysis were individually performed in
three organisms per condition (one of each replicate). For biochemical measurements, frozen
organisms (soft tissues) were mechanically pulverized under liquid nitrogen and frozen (-80 °C)
until further analysis. For protein, glycogen and glucose quantification, extractions were
performed in proportion of 1:2 (w/v), with sodium phosphate buffer 50 mM, pH 7.0 (disodium
hydrogen phosphate dihydrate 50 mM; sodium dihydrogen phosphate monohydrate 50 mM,
Ethylenediamine tetraacetic acid (EDTA) 1mM, Triron X-100 1% (w/v)). For superoxide dismutase
(SOD), catalase (CAT), glutathione S-transferase (GST) and total glutathione (GSHt), homogenates
were resuspended in potassium phosphate buffer 50 mM (1:2, w/v), pH 7.0 (dipotassium
phosphate 50 mM; potassium dihydrogen phosphate 50 mM; EDTA 1 mM; Triton X-100 1% (v/v);
polyvinylpyrrolidone (PVP) 1% (v/v); Dithiothreitol (DTT) 1 mM). For lipid peroxidation (LPO) and
reduced glutathione (GSH), the soft tissue was diluted in trichloroacetic acid (TCA) 20% v/v (1:2).
All samples were homogenised in an ultrasonic probe (2 cicles of 15 s each) and centrifuged for 10
min at 10 000 g and 4 °C. Supernatants were divided into aliquots and either stored at -80 °C or
used immediately. Whenever necessary, samples were diluted with same potassium phosphate
buffer or TCA as extraction was performed.
Total protein content
Total protein contents were determined by the spectrophotometric Biuret method (Robinson
and Hogden, 1940), using bovine serum albumin (BSA) as standards (0-40 mg/mL). This method is
used to find peptide bonds or to find out the protein content, since each amino acid in the
peptide has the same frequency of peptide bonds.
For each sample 50 μL of extract and 600 μL of Biuret reagent was used. The mixture was
shacked, making up-and-down. The colorimetric reaction was carried out at 30 °C for 10 min and

Materials and Methods
26
absorbance was measured at 540 nm. The final results were expressed in mg per g of fresh
weight.
Polypeptide separation by SDS-PAGE
Proteins were separated by SDS-PAGE, carried out in 4-20 % of polyacrylamide (Mini-
PROTEAN TGX – Bio-Rad) following the procedure described by Laemmli (1970). Gels were stained
with Coomassie brilliant blue R-250 and screened in a Densitometer apparatus (Bio-Rad – Model
GS 710). Molecular mass and relative protein amount corresponding to each band were
compared with a protein standard (NZY Colour Protein Marker II – nzy tech genes & enzymes) and
calculated using Quantity One program software (Bio-Rad) (Figueira et al., 2005).
Total carbohydrate content (Glycogen)
Glycogen was quantified according to the phenol-sulphuric acid method, as described by
Yoshikawa (1959). This method detects almost all carbohydrates (mono-, di-, oligo- and
polisaccharides), but absorbance of each is different. Sulphuric acid breaks the bonds of
polysaccharides, oligosaccharides and disaccharides, turning them into monosaccharides;
dehydrates pentoses into furfural and hexoses to hydroxymethyl furfural. These compounds react
with phenol and produce a yellow-gold colour (Nielsen, 2010).
Glycogen concentrations were determined with comparison against glucose standards (0-5
mg/mL). All the samples were diluted 25 times and 50 μL of V. philippinarum, 10 μL of V.
decussata and V. corrugata (adding 40 µL of phosphate buffer (the same used for extraction) to
make up 50 µL) were used. To every sample, 100 μL of phenol (5 %) and 600 μL of H2SO4 (96 %)
were added and then incubated at room temperature for 30 min. Absorbance was measured
spectrophotometrically at 492 nm and results were expressed as mg per g of fresh weight.
Glucose content
Glucose was quantified using a RTU-glucose kit (bioMérieux SA). Glucose oxidase catalyses the
oxidation of glucose to gluconic acid and hydrogen peroxide (H2O2). Through an oxidative coupling
reaction catalyzed by peroxidase, H2O2 reacts with 4-aminoantipyrine and phenol (included in
RTU-glucose kit). The intensification of colour quinoneimine is proportional to the amount of
glucose present in the sample.
To every sample 10 μL of extract was used and 600 μL RTU-glucose solution was added.
Samples were incubated at room temperature for 20 min and glucose concentrations were

Materials and Methods
27
compared with a glucose standard (0-5 mg/mL). Absorbance was measured
spectrophotometrically at 505 nm and the results were expressed as mg per g of fresh weight.
Lipid peroxidation
LPO is a well-known mechanism of cellular injury and is used as indicator of oxidative damage
in cells and tissues. Malondialdehyde (MDA) maybe is the most abundant aldehyde product, so
therefore, the measure of MDA has been used as an indicator of oxidative stress in invertebrates
(Wheatley, 2000). Lipid peroxidation implies the reorganization of the double bonds of
unsaturated lipids, formation of lipid radicals, the capture of oxygen and possibly, the degradation
of lipid membranes. Following the procedure described by Ohkawa et al. (1979), lipid
peroxidation (LPO) was measured by the quantification of ThioBarbituric Acid Reactive Substances
(TBARS), being addressed as a measure of membrane damage. This method is based on the
reaction of MDA, with 2-thiobarbituric acid (TBA) 0.5 %, derived from LPO, forming TBARS, which
can be read spectrophotometrically because of its characteristic color. To 100 µL of sample
(diluted in TCA 20 %) 400 µL of TBA (0.5 %) and 300 µL of TCA (20 %) was added. The reaction was
performed during 25 min at 96 °C. Samples were immediately transferred to ice, to stop the
reaction. The absorbance was measured at a wavelength of 535 nm, with an extinction coefficient
of 1.56 mM-1 cm-1 and final results were expressed as nmol of MDA per g of fresh weight.
Catalase activity
Catalase is an enzyme that protect the cell from reactive oxygen species (ROS) avoiding
oxidative damages. It promotes the decomposition of hydrogen peroxide (H2O2) to water (H2O)
and oxygen (O2). The method used to measure the activity of catalase is based on the reaction of
this enzyme with methanol in the presence of hydrogen peroxide (H2O2) (Lars et al., 1988).
To 25 µL of extract sample (previously diluted 2 times) and standards of formaldehyde (0-150
μM) was added 125 µL of reaction buffer (50 mM potassium phosphate, pH 7.0), 37.5 µL of
ethanol and 25 µL of H2O2 (35.28 mM) to initiate the reaction. After incubate the samples and
standards at room temperature for 20 min in a stirrer, 37.5 µL of potassium hydroxide (KOH) (10
M) was added to finish the reaction and 37.5 µL of 4-amino-3-hydrazino-5-mercapto-1,2,4-triazole
(purpald) as a chromogen, representing the formaldehyde produced. The samples were incubated
once again for 10 min in a stirrer at room temperature and was added 12.5 µL of potassium
periodate (KIO4), to oxidize the reaction between formaldehyde and purpald and lead to a
coloured compound formation. The standard curve was performed with formaldehyde standards

Materials and Methods
28
and the absorbance was measured in a microplate reader at 540 nm after more 5 minutes of
incubation. The final results were expressed in units (U) of CAT per g of fresh weight, being one
unit defined as the quantity of enzyme responsible for the formation of 1.0 nmol of formaldeyde,
per minute.
Materials and Methods
29
Superoxide dismutase activity
Superoxide dismutase (SOD) is an enzyme with high importance in antioxidant defence. It
catalyses the superoxide (O2•ˉ) into oxygen and hydrogen peroxide (H2O2). Superoxide reduces
NBT2+ in formazan (a chromogenic product which displays a blue colour). SOD, in turn, intercepts
the O2•ˉ blocking the formation of formazan. Thus, the less intense blue colour (meaning less
amount of formazan), the higher content of SOD.
The activity of this enzyme was determined following the method of Beauchamp and
Fridovich (1971) with some modifications and adapted to microplate. This method is based on the
reduction of superoxide anion levels by SOD. To 25 µL of each sample (previously diluted 4 times)
were added 250 µL of reaction buffer (Tris-HCl 50 mM, pH 8.0; diethylene triamine pentaacetic
acid (DTPA) 0.1 mM; hypoxanthine 0.1 mM and nitro blue tetrazolium (NBT) 68.4 μM) and 25 µL
of xanthine oxidase (56.1 mU/mL) to start the reaction, converting the xanthine and oxygen into
uric acid and H2O2 yielding superoxide anions. To 25 µL of standards of SOD (0.25–60 U/mL) was
added 25 µL of extraction buffer, 225 µL of reaction buffer and 25 µL of xanthine oxidase. The
samples and the standards were incubated for 10 min at room temperature in a stirrer. The
standard curve was performed with SOD standards. SOD activity was measured in a microplate
reader at 560 nm and the results were expressed as U per g of fresh tissue. One unit of SOD
activity represents a reduction of 50 % of NBT.
Glutathione S-transferase activity
Glutathione-S-transferase (GST) is an enzyme that is part of a defence strategy and the
efficiency depends on glutathione synthase to provide GSH and also depends on transporters
actions to remove glutathione conjugates from the intracellular space (Hayes and McLellan,
1999). GST converts the tripeptide glutathione (GSH) into xenobiotic compounds, conjugating GSH
with 1-chloro-2,4-dinitrobenzene (CDNB), an electrophilic substrate, forming one thioether (with
an extinction coefficient of 9.6 mM-1cm-1), that can be measured by increasing absorbance at 340
nm.
In the present work, the activity of this enzyme was measured following the procedure
described by Habig et al. (1974) with some modifications to microplate method (96 flat bottom
wells). To 50 µL of extracted sample (previously diluted 4 times) were added 200 µL of a reaction
solution containing 1-Chloro-2,4-dinitrobenzene (CDNB) 60 mM (14.2 % of total volume), reduced
glutathione (GSH) 10 mM (85.3 % of total volume) and potassium phosphate buffer 0.1 M, pH 6.5
(dipotassium phosphate 0.1 M, potassium dihydrogen phosphate 0.1 M) - 0.47 % of total volume.
Materials and Methods
30
Absorbance values were obtained in a microplate reader at 340 nm (ε =9.6 mM-1 cm-1), at
intervals of 10 s for 5 min. The GST activity was expressed in U per g of fresh weight, where U
corresponds to the amount of enzyme that catalyzes the conversion of 1 µmol of substrate per
min.
Total glutathione
Glutathione is an important antioxidant preventing cell damage caused by reactive oxygen
species such as free radicals and peroxides. It exists in reduced (GSH) and oxidized (GSSG) forms.
This enzyme interferes in the synthesis and degradation of proteins, regulation of enzymes and
protection of the cell from ROS (Manduzio et al., 2005).
Total glutathione (GSHt) content (the sum of the two forms) was quantified according to the
5,5’-dithiobis-2-nitrobenzoic acid (DTNB)-glutathione reductase (GR) method described by
Anderson (1985) and adapted to microplate method. Glutathione standards (0-500 µmol L-1) were
prepared to compare against GSHt concentrations. To 23 µL of standards and samples (previously
diluted 2 times) it was added 240 µL of potassium phosphate buffer 50 mM, pH 7.0 (dipotassium
phosphate 50 mM; potassium dihydrogen phosphate 50 mM), 9.23 µL of NADPH (nicotinamide
adenine dinucleotide phosphate) 30 mM, 23 µL of 5,5’-dithiobis-2-nitrobenzoic acid (DTNB) 10
mM and 4.62 μL of GR 10 U mL-1 (together with NADPH, GR transform the GSSG to GSH) and then
incubated for 5 min at room temperature. Absorbance was measured in a microplate reader at
412 nm and the content of GSHt was expressed in µmol per g of fresh weight.
Reduced and oxidized glutathione content
Reduced glutathione content (GSH) was determined adapting the procedure described by
Moron et al. (1979). Glutathione standards (0-500 μmol/L) were prepared in TCA 20 % (v/v) to
compare against the GSH values. 50 μL of supernatant and standards were neutralized with 20 μL
of sodium hydroxide (NaOH) 2M. To this mixture 500 μL of potassium phosphate buffer 50 mM
(pH 7.0) and 50 μL of DTNB 10 mM (with 620 μL as final volume) were added. During 5 min, the
samples and standards were incubated at room temperature. Finally, the absorbance was
measured spectrophotometrically at 412 nm. Values of GSH were expressed as µmol per g of
fresh weight.
Oxidized glutathione (GSSG) was obtained calculating the difference between GSHt and GSH.
GSSG content was expressed as µmol per g of fresh weight.

Materials and Methods
31
2.3.3.2. Nuclear Magnetic Resonance (NMR) Spectroscopy
High resolution Nuclear Magnetic Resonance (NMR) spectroscopy is an important technique
for rapid and non-invasive analysis of complex systems providing information on a large number
of different compounds, with different concentrations (Graça et al., 2008). This technique is based
on the magnetic properties of the atomic nuclei when placed in a strong magnetic field providing
important information about the molecular structure of organic molecules and biomolecules.
NMR has been the dominant method for analysing organic compounds, because in most
situations it is possible to determine the entire structure using a reduce number of analytical
tests. It has also been increasingly used in the area of inorganic chemistry allowing valuable
information to be obtained about molecular structures. Besides the wide use of NMR
spectroscopy in structural chemistry, the technique has also, more recently, been used in
metabolomics applied in several contexts (e.g. drug development and assessment, food analysis
disease research). Specific reports comprise studies related with tumor metavolic profiling (Rocha
et al., 2010) for metabolic profiling and also detailed characterization of food (Duarte et al., 2002;
2006). Although there are already some studies related to the metabolic effects of climate
changes on marine organisms (e.g. Liu et al., 2011a; 2011b studied toxicological effects induced
by mercury exposure of V. philippinarum), metabolic differences have not been studied on marine
species when subjected to a stress caused by salinity fluctuations.
Principals of NMR Spectroscopy
The nuclei of some atoms have the ability to rotate around its axis, when subjected to a
magnetic field, and this property is named as spin. The hydrogen nucleus, the proton (1H) is one of
these nuclei. The nuclear spin is associated to an angular moment, P, and generates a magnetic
moment (μ) characterizing each nucleus. Magnetic (μ) and angular (P) moments are related by
μ=ɣP, where ɣ is the gyromagnetic ratio of the nucleus, a characteristic of the nucleus (Günther,
1998). The angular moment of spin depends on the spin quantum number, I, which takes up
values different from zero for the nuclei with spin. For proton, I = 1/2 (Graça et al., 2008).
By placing a proton in an external magnetic field, its magnetic moment can be oriented
parallel (up) and anti-parallel (down) in relation to the external field. NMR spectroscopy is based
on the occurrence of transitions between these states, by absorbing radiation in the frequency
range of radio waves (60 to 750MHz). The exact value of energy absorbed is strongly dependent
on the chemical environment in which the proton is found and this dependency is translated by a

Materials and Methods
32
quantity called chemical shift. The sample (containing the magnetic nuclei) is excited by selective
absorption of radiation, then returns to the fundamental state, with the emission of radiant
energy in the field of radio frequencies; this gives rise to the absorption peak registered in the
NMR spectrum.
The detailed information that can be obtained - on the molecular structure of the sample, or
on the global internal dynamics of the molecules - is related to the exact determination of the
chemical shifts (in ppm) corresponding to specific frequencies emitted. The 1H NMR spectra
(graph of absorbance according to the chemical shift) is based on the different location of the
peaks, because its position depends on electronic environment around the proton.
In the present study, for NMR analysis 15 samples were selected (9 samples of V.
philippinarum, including 1 at salinity 0, 2 at salinity 7, 3 at salinity 28 and 3 at salinity 42; 3
samples of V. decussata at salinity 28; 3 samples of V. corrugata at salinity 28) in order to study
the range of salinities that the three species tolerate.
The final analysis included the study of V. philippinarum metabolic alterations when subjected
to four different salinities: 0, 7, 28 and 42, to understand the metabolic effect of the salinity; data
of the three species when subjected at salinity 28 were analyzed, aiming to study the differences
between clam species under the same salinity conditions.
Extraction and preparation for NMR analysis
Metabolite extraction was performed using a water/methanol/chloroform method described
by Hines et al. (2007). After grinding the clams’ soft tissue (0.5 g per sample) in liquid nitrogen, 2
mL of methanol, 0.425 mL of distillated water and 1 mL of chloroform were added. The mixture
was sonicated in an ultrasonic probe (2 cycles of 15 s each) and then centrifuged (2 500 g, 4 °C, 10
min). The aqueous layer was removed and transferred into a new tube, and the lower phase was
discarded. To the aqueous phase, 1 mL of chloroform and 1 mL of water were added and the
mixture was vortexed and centrifuged (2 500 g, 4 °C, 10 min), giving rise to two layers. The
aqueous phase and the lipidic phase were separated to different tubes, dried in a centrifugal
concentrator (UNIVAP 100 H) and stored at -80 °C until NMR analysis. Before spectral acquisition,
the dry polar extracts (aqueous phase) were resuspended in 600 µL of sodium phosphate buffer
(0.1 M in D2O, pH 7.4, containing 0.5 mM sodium 3-trimethylsilyl-2,2,3,3-d4-propionate (TSP) as
chemical shift standard); the dry nonpolar extracts (lipid phase) were resuspended in 650 µL
deuterated chloroform (CDCl3), both followed by vortexing and centrifugation (12 000 rpm, 10
Materials and Methods
33
min). For analysis, 550 µL of supernatant of polar extracts and 600 µL of supernatant of nonpolar
extracts were transferred into 5 mm NMR tubes.
To compare different salinities, V. philippinarum was analyzed at salinities 0, 7, 28 and 42. The
differences among the three species were evaluated at salinity 28.
1H NMR spectroscopy
All 1H NMR spectra were acquired on a Bruker Avance DRX-500 spectrometer using a BBI
probe, perating at a frequency of 500.13 MHz for proton. The one-dimensional (1D) 1H NMR
spectra were acquired at 298 K, with a NOESYPR1D pulse sequence (Bruker pulse program library)
and referencing chemical shifts internally to the TSP signal at δ 0.00 for aqueous extracts and
chloroform signal at δ 7.26 for lipids extracts. Water suppression was achieved by irradiation of
the water peak during recycle (RD = 4 s) and mixing time (tm = 100 ms). A 90° pulse lengh of 12 µs
was used and 256 transients were collected into 32 K data points with 14 ppm spectral width. All
1D spectra were processed with a line broadening of 0.3 Hz, manually phased and baseline
corrected. 2D homonuclear (total correlation spectroscopy, TOCSY) and heteronuclear (1H-13C)
correlation spectra were acquired for selected samples in order to aid spectral assignment.
Assignment was based on consultation of the Bruker Biorefcode spectral database and several
other non-comercial databases.
2.4. Data analysis
The GSH/GSSG ratio, considered to be an index of cellular redox status (e.g. Ault and
Lawrence, 2003), was determined based on the data described above.
Data from biochemical and physiological parameters and the element content were
submitted for hypothesis testing using permutation multivariate analysis of variance with the
PERMANOVA+ add-on in PRIMER v6 (Anderson et al., 2008), following the calculation of Euclidean
distance matrices among samples. A one-way hierarchical design was followed, with the salinity
as the main fixed factor. When the main test revealed statistical significant differences (p≤0.05),
pairwise comparisons were performed. The t-statistic in the pair-wise comparisons was evaluated
in terms of significance among different salinities. The null hypothesis tested for each parameter
were “no significant differences exist among salinities”, when comparing the different salinities
for each species and “no significant differences exist among species”, when comparing the three
Materials and Methods
34
species in each salinity. Significance levels (p ≤ 0.05) between salinities or species are presented
with letters. The matrix gathering the biochemical and physiological descriptors, for each species,
per salinity were used to calculate the Euclidean distance similarity matrix. This similarity matrix
was simplified through the calculation of the distance among centroids matrix based on the
species condition, which was then submitted to ordination analysis, performed by Principal
Coordinates (PCO). Pearson correlation vectors of physiological and biochemical descriptors
(correlation > 0.5) were provided as supplementary variables being superimposed on the top of
the PCO graph.
For NMR data analysis, each set of spectra was used to set up the data matrices for the
multivariate analysis (MVA). This method has the advantages of taking all the variables into
account in one single analysis and, more important, allows the construction of predictive models.
Therefore, MVA provides the appropriate tools for metabolomics data analysis.
Thus, for aqueous extracts, all signals in δ 0.5-9.5 region except water spectral region (δ 4.60
– 4.80) were included for analysis; for lipid extracts the region used for analysis was δ 0.5 – 10.0,
except chloroform spectral region (δ 7.03 – 7.48).
Probabilistic quotient normalization (PQN) of the spectra using the median spectrum to
estimate the most probable quotient was carried out and the spectra were aligned by the
recursive segment-wise peak alignment (RSPA) method (Veselkov et al., 2009)to reduce variability
in the peak positions using MATLAB R2012a. The region of δ 4.60- 4.80 and δ 7.03 – 7.48 was
removed to eliminate the effects of imperfect water suppression and chloroform signal,
respectively, prior to normalization and alignment. The resulting datasets were then imported
into SIMCA-P 11.5 (Umetrics, Umeå, Sweden) software for multivariate statistical analysis.
Principal Components Analysis (PCA) is used to obtain an overview of the similarities and
differences between the samples analysed, and Partial Least Squares - Discriminant Analysis (PLS-
DA) is used to explore the differences between classes and exclude confounding factors derived
from differences of each individual differences. The aim of scaling is to avoid the dominance of
the higher intensity signals over lower ones, emphasizing the differences between the spectra in
the next steps of MVA (Veselkov et al., 2011). Unit variance (UV) scaling divides each point of the
data matrix by the standard deviation of the respective column (peaks). All imported data were
autoscaled (i.e unit variance) and Principal Component Analysis (PCA) and Partial-Least Squares-
Discriminant Analysis (PLS-DA) were performed on the datasets. To evaluate the differences
between the samples groups, the separation obtained in PLS-DA scores is not enough, being
Materials and Methods
35
necessary an appropriate validation model. For that propose, R-statistical software (version
2.15.2) was used along with the Plotrix package (Lemon, 2006) to produce PLS-DA loadings plots
color-coded as a function of variable importance in the projection (VIP). The loading plots affords
information about the contribution of each peak to the separation in the scores plots. The
resulting plots provide the information in a same shape as that of a spectrum, together with a
colour code representing the variable importance for the discrimination between the classes.
Scores plots were analysed to see the distribution of each sample under analysis. At this
point, all the results were analysed in two-dimensional scores plots, representing the distribution
of samples in the model. The trends registered between the different classes were evaluated,
validating the model. This validation was performed taking into account the following parameters:
R2X, R2Y and Q2. In PLS-DA model, R2X is the explained variance of X explained and R2Y is the
explained variance of Y. Q2 value represent the validation of R2 and can be used to test the validity
of the model, whereas higher Q2 values are usually associated with best discrimination between
classes.
Loading plots of spectra give to each point a corresponding colour representing their
importance in the separation of the samples. The relevant peaks, those with stronger contribution
to the trend between classes, were integrated and normalized to total spectral area, usingAMIX
3.9.5 (BrukerBioSpin, Rheinstetten, Germany).
Integral variations were subjected to the Shapiro (normal distribution for p>0.05), t-student
and Wilcoxon test (statistical relevance for p≤0.05).
Shapiro test determined if the data followed (p>0.05) or not (p≤0.05) a normal distribution.
For data which followed a normal distribution, the t-student test was applied and for those which
do not followed a normal distribution was applied the Wilcoxon test. The p-value obtained in the
statistical tests provides information about the significance of the differences between the
classes. In the present study, the null hypothesis is “differences between the averages of the
classes are equal to zero”, meaning that the integrals are not significantly different between the
classes. When p-value was lower than 0.05, means that the integrals are significantly different
between the groups.
3. Results

Results
37
3.1. Environmental data
The physic-chemical characteristics of the sampling site, including sediment classification,
percentage of fine particles, median values (), total organic matter (TOM), salinity, redox
potential (Eh), temperature and pH, are presented in Table 2. The results obtained revealed that
sediment from the sampling site was classified as very silty medium sand, with high percentage of
fines (25.93 %) and high organic matter content (> 3 %, cf. Table 2).
Table 2. Environmental parameters of the sampling site: temperature, pH, salinity, redox potential (Eh), percentage of total organic matter (TOM), percentage of fine particles, median value in units of phi (Φ).
Environmental data Temperature (°C) pH Salinity Eh (mV) TOM % Fines % Median
19.9 ± 1 8.45 ± 1.91 28 ± 2 -173.05 ± 14.07 3.34 ± 0.21 25.93 ± 2.31 1.88 ± 0.04
3.2. Biometric data
Concerning the size and weight of the clams collected, V. corrugata was the lightest and the
smallest species, while V. philippinarum was the biggest and the heaviest one. The V. decussata
individuals presented an average weight of 27 ± 3 g, an average length of 49 ± 2 mm and 38 ± 2
mm wide. V. corrugata specimens had an average weight of 10 ± 2 g and measured 38 ± 3 mm in
length with 25 ± 2 mm of wide. V. philippinarum clams presented an average length of 50 ± 2.7
mm, 39 ± 3 mm wide and weight of 37 ± 5 g.
3.3. Mortality
When exposed to different salinities (0, 7, 14, 21, 28, 35 and 42), V. corrugata showed
significantly (p≤0.05) higher mortality than the other two clams (V. philippinarum and V.
decussata) at most of the salinities tested. Differences were especially noticeable at the lowest (0)
and highest salinities (35 and 42) (Figure 8), where V. corrugata presented 100 % of mortality. At
salinity 0, the 3 species showed high mortality rates, being V. decussata the species that revealed
the highest survival capacity, revealing approximately 33 % of mortality against 77.8 % for V.
philippinarum and 100 % for V. corrugata (cf. Figure 8). When exposed to the highest salinities (35
and 42), V. decussata and V. philippinarum presented 100% of survival while V. corrugata

Results
38
presented 100% of mortality, identifying this species as the most sensitive (cf. Figure 8). Although
V. decussata presents 33 % of mortality at salinity 0, is the species that can tolerate a greater
range of salinities.
3.4. Elemens content
For each species, the concentration of the elements Na (A), K (B), Ca (C) and Mg (D) along the
salinity gradient is present in Figure 9.
Along the salinity gradient V. decussata maintained fairly constant the amount of Na, except
at the highest salinity (42), where this species significantly increased (p≤0.05) the content of Na
(Figure 9A). Along the exposure gradient, both V. philippinarum and V. corrugata gradually
increased the Na content with significant differences among salinities, especially between the
lowest (0 and 7) and the highest (≥ 28) salinities for V. philippinarum, and between 7 and 28 for V.
corrugata (cf. Figure 9A). V. decussata showed significant differences from V. philippinarum at
salinities 0, 21, 28 and 35. Along the salinity gradient V. corrugata presented no significant
differences from V. philippinarum, while significant differences were found between V. corrugata
and V. decussata (Table 3).
Figure 8. Mortality rate (%) in Venerupis philippinarum, Venerupis decussata and Venerupis corrugata when
exposed to increasing salinities (0, 7, 14, 21, 28, 35, 42). Values are the mean of three replicates ± standard
deviation. For each species, different letters (a-c) represent significant differences (p≤0.05) among salinities.
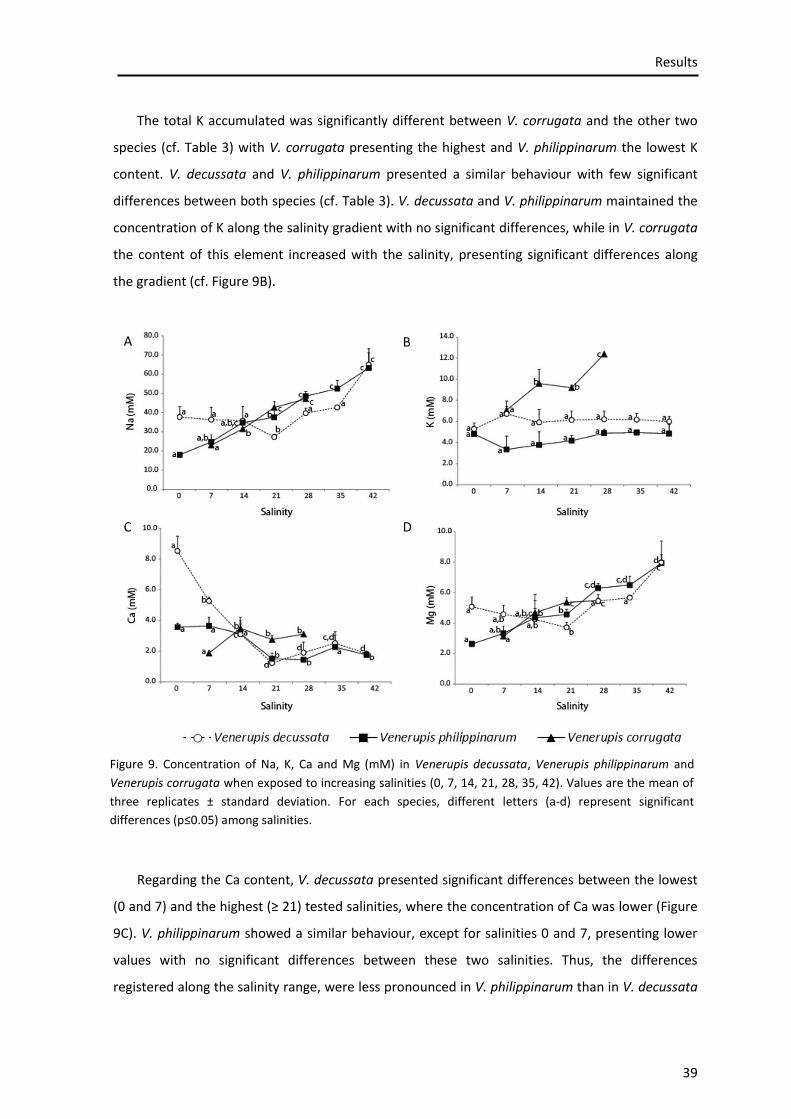
Results
39
The total K accumulated was significantly different between V. corrugata and the other two
species (cf. Table 3) with V. corrugata presenting the highest and V. philippinarum the lowest K
content. V. decussata and V. philippinarum presented a similar behaviour with few significant
differences between both species (cf. Table 3). V. decussata and V. philippinarum maintained the
concentration of K along the salinity gradient with no significant differences, while in V. corrugata
the content of this element increased with the salinity, presenting significant differences along
the gradient (cf. Figure 9B).
Regarding the Ca content, V. decussata presented significant differences between the lowest
(0 and 7) and the highest (≥ 21) tested salinities, where the concentration of Ca was lower (Figure
9C). V. philippinarum showed a similar behaviour, except for salinities 0 and 7, presenting lower
values with no significant differences between these two salinities. Thus, the differences
registered along the salinity range, were less pronounced in V. philippinarum than in V. decussata
Figure 9. Concentration of Na, K, Ca and Mg (mM) in Venerupis decussata, Venerupis philippinarum and
Venerupis corrugata when exposed to increasing salinities (0, 7, 14, 21, 28, 35, 42). Values are the mean of
three replicates ± standard deviation. For each species, different letters (a-d) represent significant
differences (p≤0.05) among salinities.
A B
C D
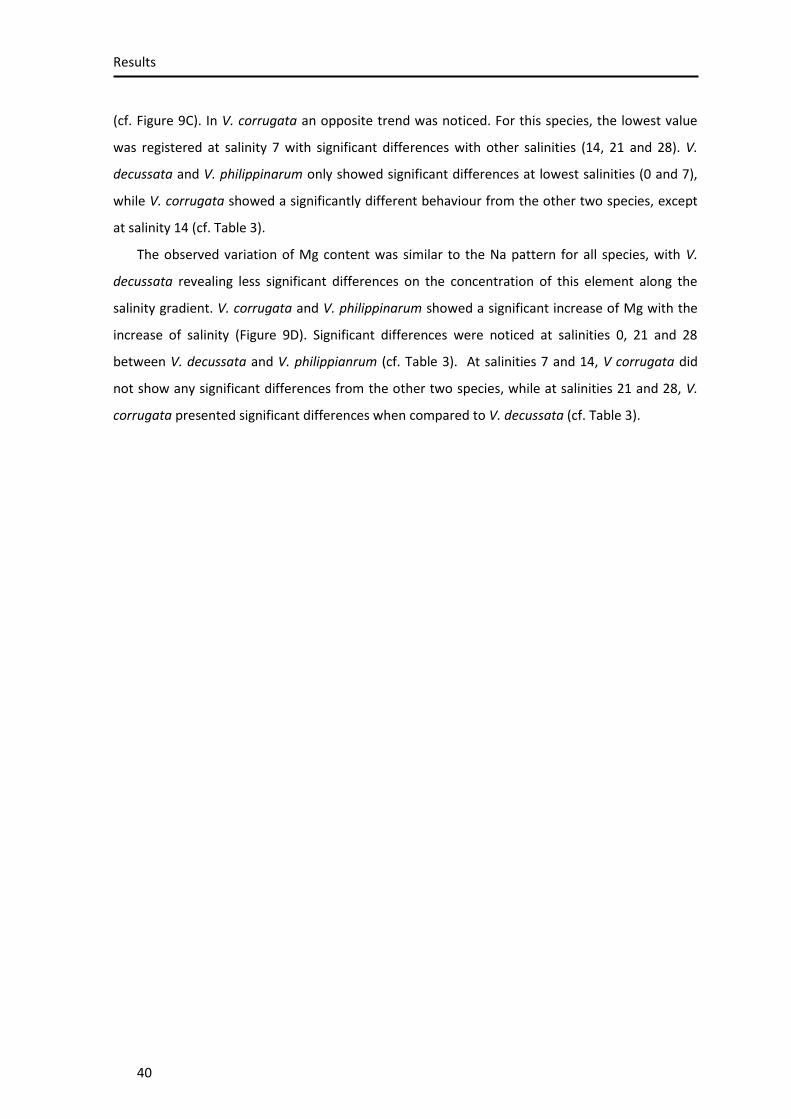
Results
40
(cf. Figure 9C). In V. corrugata an opposite trend was noticed. For this species, the lowest value
was registered at salinity 7 with significant differences with other salinities (14, 21 and 28). V.
decussata and V. philippinarum only showed significant differences at lowest salinities (0 and 7),
while V. corrugata showed a significantly different behaviour from the other two species, except
at salinity 14 (cf. Table 3).
The observed variation of Mg content was similar to the Na pattern for all species, with V.
decussata revealing less significant differences on the concentration of this element along the
salinity gradient. V. corrugata and V. philippinarum showed a significant increase of Mg with the
increase of salinity (Figure 9D). Significant differences were noticed at salinities 0, 21 and 28
between V. decussata and V. philippianrum (cf. Table 3). At salinities 7 and 14, V corrugata did
not show any significant differences from the other two species, while at salinities 21 and 28, V.
corrugata presented significant differences when compared to V. decussata (cf. Table 3).

Results
41
Table 3. Concentration of Na, K, Ca and Mg (mM) in Venerupis decussata, Venerupis philippinarum and
Venerupis corrugata along the salinity range (0, 7, 14, 21, 28, 35 and 42). Values are the mean of three
replicates ± standard deviation. For each element and for each salinity, different letters (a-c) represent
significant differences (p≤0.05) among species.
Element Salinity V. decussata V. philippinarum V. corrugata
Na
0 37.44 ± 5.44a
17.76 ± 0.80b
7 36.09 ± 4.56a
24.47 ± 9.19a,b
22.82 ± 1.37b
14 35.49 ± 0.01a
34.60 ± 12.74a,b
31.26 ± 0.70b
21 26.99 ± 1.55a
37.30 ± 4.75b
42.45 ± 5.33b
28 39.47 ± 2.49a
48.36 ± 2.38b
46.91 ± 2.16b
35 42.46 ± 0.31a
52.25 ± 4.36b
42 64.74 ± 6.13a
63.07 ± 10.10a
K 0 5.32 ± 0.56
a 4.84 ± 0.00
a
7 6.75 ± 0.86a
3.39 ± 0.89b
7.11 ± 1.44a

Results
42
14 5.95 ± 0.87a
3.82 ± 1.24a
9.63 ± 0.23c
21 6.18 ± 1.74a,b
4.21 ± 0.49a
9.23 ± 1.34c
28 6.24 ± 0.76a
4.92 ± 0.26b
12.41 ± 0.16c
35 6.21 ± 0.57a
4.97 ± 0.23b
42 6.02 ± 0.48a
4.88 ± 0.61a
Ca
0 8.50 ±0.96a
3.55 ± 0.19b
7 5.24 ± 0.17a
3.63 ± 1.35b
1.86 ± 1.66c
14 3.08 ± 1.91a
3.12 ± 2.20a
3.47 ± 0.00a
21 1.21 ± 0.10a
1.49 ± 0.36a
2.74 ± 0.20b
28 1.88 ± 0.68a
1.42 ± 0.16a
3.10 ± 0.26b
35 2.51 ± 1.30a
2.24 ± 1.01a
42 1.82 ± 0.05a
1.74 ± 0.11a
Mg
0 5.03 ±0.63a
2.59 ± 0.11b
7 4.53 ± 0.93a
3.29 ± 0.11a
3.10 ± 0.25a
14 4.20 ± 1.21a
4.31 ± 1.51a
4.64 ± 0.03a
21 3.67 ± 0.39a
4.53 ± 0.33b
5.32 ± 0.26b
28 5.40 ± 0.42a
6.25 ± 0.28b
5.43 ± 0.63a,b
35 5.62 ± 0.13a
6.44 ± 0.57a
42 7.93 ± 0.50a
7.88 ± 1.44a

Results
43
3.5. Biochemical and physiological analysis
3.5.1. Total protein content and peptide alterations
For protein content, V. philippinarum and V. decussata evidenced a similar pattern along the
salinity range (Figure 10A). The protein content was constant at lower salinities (0 to 21) and
gradually increased from 28 to 42, with significant (p≤0.05) differences between the lowest (≤ 21)
and the highest (> 21) salinities (cf. Figure 10A). In V. corrugata lower protein content was found
at salinities 7 and 28, where no significant (p>0.05) differences were found to the other species
(Table 4). At salinities 14 and 21, V. corrugata showed a significant higher protein content,
compared to the other two species (cf. Figure 10A). However, this species showed significant
differences along the salinities tolerated (cf. Figure 10A). Table 4 presents the differences, in
terms of protein content, among salinities for each species. V. decussata and V. philippinarum did
not present significant differences between the lowest (0-21), but was registered a significant
increase to higher salinities (28-35), while V. corrugata presented significant differences between
the highest and the lowest (7 and 28) tolerated salinities and the remaining ones (14 and 21), with
the highest value being observed at salinity 14. Similar protein concentrations were found
between salinities 14 and 21 that were significantly higher than at 7 and 28. Significant
differences were not found between the protein pattern of V. decussata and V. philippinarum
along the salinity range and V. corrugata only presented significant differences from the other
two species at salinities 14 and 21 (cf. Table 4).
Regarding polypeptides expression, the levels of the most abundant ones comparing the ones
characterizing individuals under salinity 28 were represented as heatmaps (Figure 10B, C and D).
In V. philippinarum (Figure 10B), for all salinities, ca. 30 % of the proteins did not change their
levels, compared to salinity 28. For the remaining 70 %, most of the changes occurred at the
lower salinities (≤ 21), with the appearance of a new band and the decrease of 64 % of the
polypeptides. At higher salinities (35 and 42), a low number (30%) of polypeptides presented
changes (cf. Figure 10B). For V. decussata (Figure 10C), was registered ca. 48 % of alterations in
polypeptide expression at higher salinities (> 28) and 44 % at lower salinities (< 21). At salinities 35
and 42, 18 % of such changes represented induction and 77 % was related to repression of
polypeptides expression. At lower salinities (0, 7 and 14), repression was represented by 27 % of
alterations and 17 % of that alterations corresponding to induction of polypeptides. At salinity 21
only 14 % of polypeptides demonstrated alterations, with 86 % of polypeptides not showing any
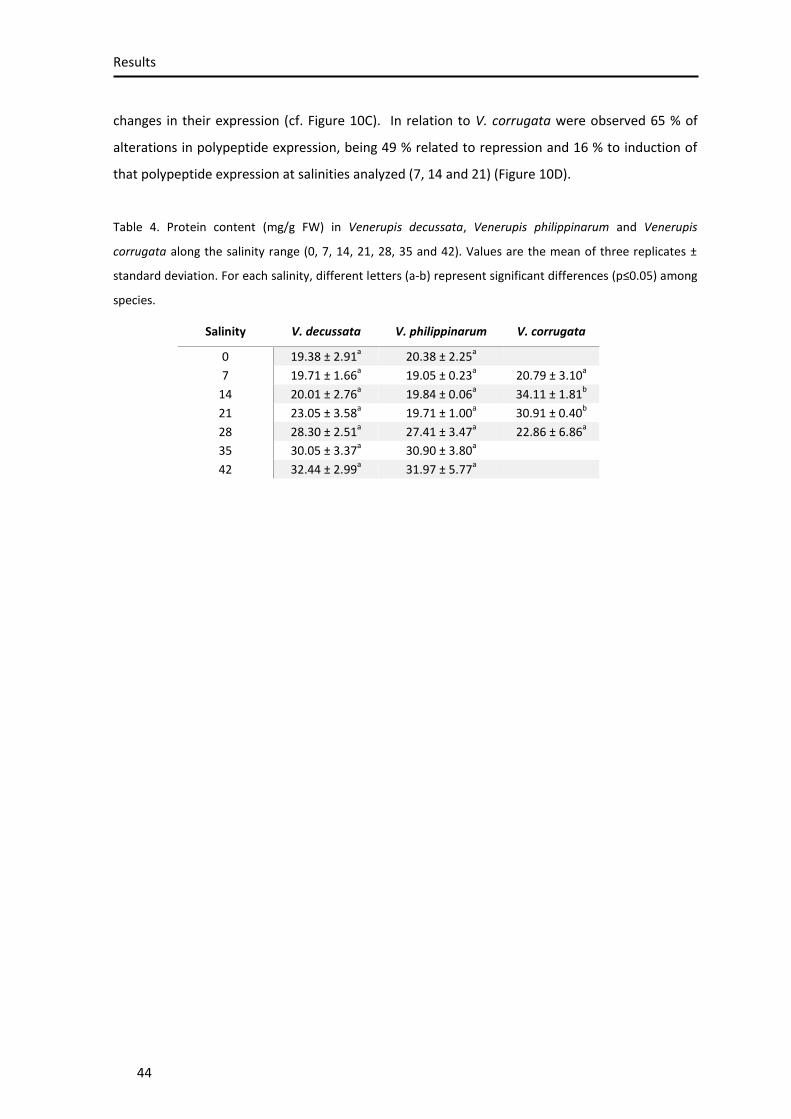
Results
44
changes in their expression (cf. Figure 10C). In relation to V. corrugata were observed 65 % of
alterations in polypeptide expression, being 49 % related to repression and 16 % to induction of
that polypeptide expression at salinities analyzed (7, 14 and 21) (Figure 10D).
Table 4. Protein content (mg/g FW) in Venerupis decussata, Venerupis philippinarum and Venerupis
corrugata along the salinity range (0, 7, 14, 21, 28, 35 and 42). Values are the mean of three replicates ±
standard deviation. For each salinity, different letters (a-b) represent significant differences (p≤0.05) among
species.
Salinity V. decussata V. philippinarum V. corrugata
0 19.38 ± 2.91a
20.38 ± 2.25a
7 19.71 ± 1.66a
19.05 ± 0.23a
20.79 ± 3.10a
14 20.01 ± 2.76a
19.84 ± 0.06a
34.11 ± 1.81b
21 23.05 ± 3.58a
19.71 ± 1.00a
30.91 ± 0.40b
28 28.30 ± 2.51a
27.41 ± 3.47a
22.86 ± 6.86a
35 30.05 ± 3.37a
30.90 ± 3.80a
42 32.44 ± 2.99a
31.97 ± 5.77a

Results
45
Figure 10. A - Protein content (mg/g FW) in Venerupis decussata, Venerupis corrugata and Venerupis
philippinarum when exposed to increasing salinities (0, 7, 14, 21, 28, 35, 42). Values are the mean of three
replicates ± standard deviation; for each species different letters (a-c) represent significant differences
(p≤0.05) among salinities. Protein expression B – in Venerupis philippinarum, when exposed to increasing
salinities (0, 7, 14, 21, 28, 35 and 42); C – in Venerupis decussata, when exposed to salinities (0, 7, 14, 21,
28, 35 and 42); D – in Venerupis corrugata, when exposed to increasing salinities (7, 14, 21 and 28); the
different colours represent repression (white and light grey), no alteration (median grey) or induction (dark
grey and black) of peptides in comparison with salinity 28; p1-p22 represent the different polypeptides
identified; New bands are also marked (nb); values are the mean of n=3.

Results
46
3.5.2. Total carbohydrates content (Glycogen)
In terms of glycogen content (Figure 11 and Table 5), a significant difference (p≤0.05) was
observed between the three species, with V. corrugata presenting the highest values and V.
philippinarum the lowest ones. When compared to the other two species, V. corrugata showed
higher glycogen content that was maintained along the salinity gradient tolerated by this species
without significant differences among the salinities (cf. Figur 11). V. philippinarum presented a
significant increased at salinities 28 and 35 and a significant decrease at salinity 42 (cf. Figure 11),
while V. decussata showed a significant increase of glycogen content at salinity 42.
Table 5. Glycogen content (mg/g FW) in Venerupis decussata, Venerupis philippinarum and Venerupis
corrugata along the salinity range (0, 7, 14, 21, 28, 35 and 42). Values are the mean of three replicates ±
standard deviation. For each salinity, different letters (a-c) represent significant differences (p≤0.05) among
species.
Salinity V. decussata V. philippinarum V. corrugata
0 10.51 ± 4.1a
2.97 ± 0.6b
7 11.76 ± 0.8a
1.81 ± 0.3b
17.79 ± 0.9c
14 11.95 ± 2.3a
4.25 ± 2.53b
17.02 ± 5.1a
21 11.27 ± 1.9a
3.48 ± 0.5b
17.15 ± 3.4a
28 12.23 ± 2.0a
8.10 ± 2.9b
18.80 ± 3.4c
35 15.40 ± 4.51a
11.49 ± 1.74a
42 17.89 ± 1.72a
5.11 ± 1.82b
Figure 11. Glycogen content (mg/g FW) in Venerupis decussata, Venerupis corrugata and Venerupis
philippinarum when exposed to increasing salinities (0, 7, 14, 21, 28, 35, 42). Values are the mean of three
replicates ± standard deviation. For each species, different letters (a-e) represent significant differences
(p≤0.05) among salinities.
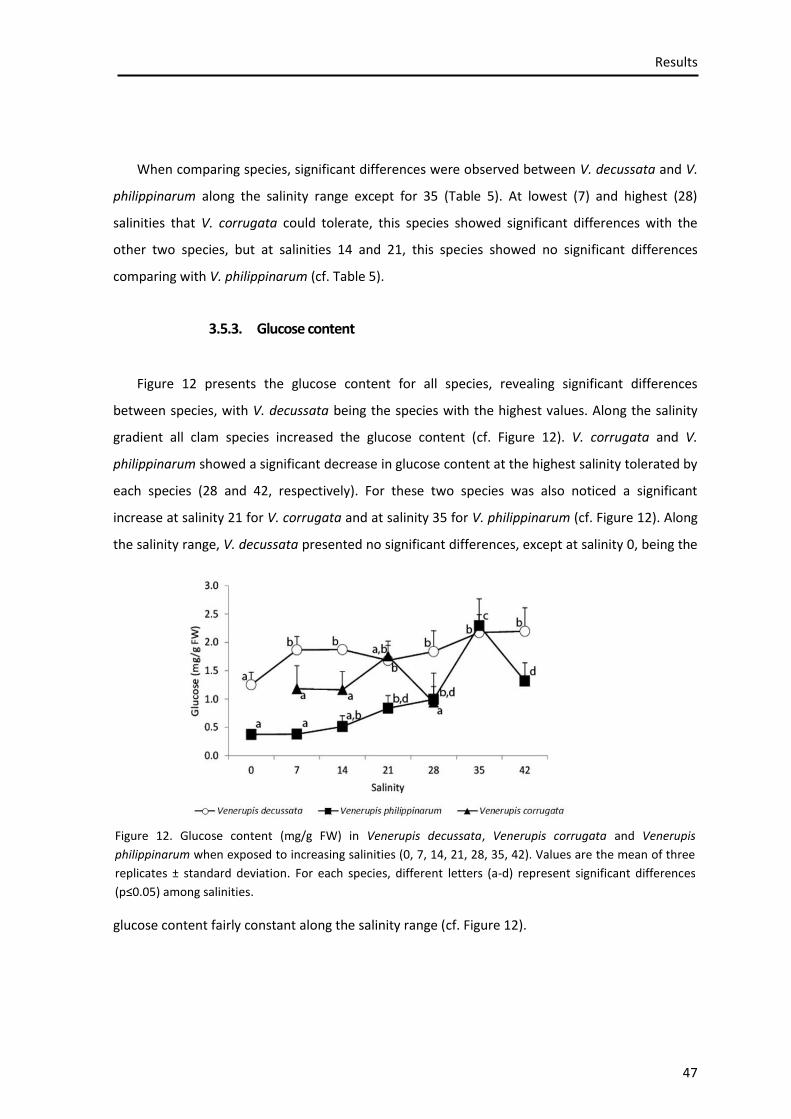
Results
47
When comparing species, significant differences were observed between V. decussata and V.
philippinarum along the salinity range except for 35 (Table 5). At lowest (7) and highest (28)
salinities that V. corrugata could tolerate, this species showed significant differences with the
other two species, but at salinities 14 and 21, this species showed no significant differences
comparing with V. philippinarum (cf. Table 5).
3.5.3. Glucose content
Figure 12 presents the glucose content for all species, revealing significant differences
between species, with V. decussata being the species with the highest values. Along the salinity
gradient all clam species increased the glucose content (cf. Figure 12). V. corrugata and V.
philippinarum showed a significant decrease in glucose content at the highest salinity tolerated by
each species (28 and 42, respectively). For these two species was also noticed a significant
increase at salinity 21 for V. corrugata and at salinity 35 for V. philippinarum (cf. Figure 12). Along
the salinity range, V. decussata presented no significant differences, except at salinity 0, being the
glucose content fairly constant along the salinity range (cf. Figure 12).
Figure 12. Glucose content (mg/g FW) in Venerupis decussata, Venerupis corrugata and Venerupis
philippinarum when exposed to increasing salinities (0, 7, 14, 21, 28, 35, 42). Values are the mean of three
replicates ± standard deviation. For each species, different letters (a-d) represent significant differences
(p≤0.05) among salinities.

Results
48
Comparing V. decussata and V. philippinarum, significant different behaviour were observed,
except at salinity 35, where these two species presented the same values (Table 6). On the
contrary, at salinity 14 V. corrugata presented significant differences comparing with V. decussata
and V. philippinarum (cf. Table 6).
Table 6. Glucose content (mg/g FW) in Venerupis decussata, Venerupis philippinarum and Venerupis
corrugata along the salinity range (0, 7, 14, 21, 28, 35 and 42). Values are the mean of three replicates ±
standard deviation. For each salinity, different letters (a-c) represent significant differences (p≤0.05) among
species.
3.5.1. Lipid peroxidation
Concerning LPO (Figure 13), although the three species showed the same trend, with higher
values at the lowest and the highest salinities, V. corrugata was the species with higher and V.
philippinarum was the one with lowest LPO values. The results showed that V. decussata and V.
philippinarum significantly decreased LPO levels with the increase of salinity up 28, with
significant differences between salinities 0 and 28 (cf. Figure 13). After this decrease, it was
observed a slight increase up to salinity 42, but with no significant differences comparing with
other salinities (≤ 28). V. decussata and V. philippinarum presented a similar pattern although the
former presented more pronounced differences between salinities. V. corrugata presented an
abrupt increase at salinity 28, but the statistical analysis showed no significant differences
comparing the salinity 28 with the other salinities tolerated by this species (7, 14 and 21; cf. Figure
13).
Salinity V. decussata V. philippinarum V. corrugata
0 1.25 ± 0.22a
0.37 ± 0.03b
7 1.87 ± 0.24a
0.38 ± 0.07b
1.18 ± 0.41a
14 1.87 ± 0.07a
0.51 ± 0.19b
1.16 ± 0.32c
21 1.68 ± 0.34a
0.84 ± 0.22b
1.76 ± 0.19a
28 1.84 ± 0.37a
0.99 ± 0.23b
0.94 ± 0.52a,b
35 2.17 ± 0.32a
2.30 ± 0.47a
42 2.19 ± 0.42a
1.32 ± 0.32b
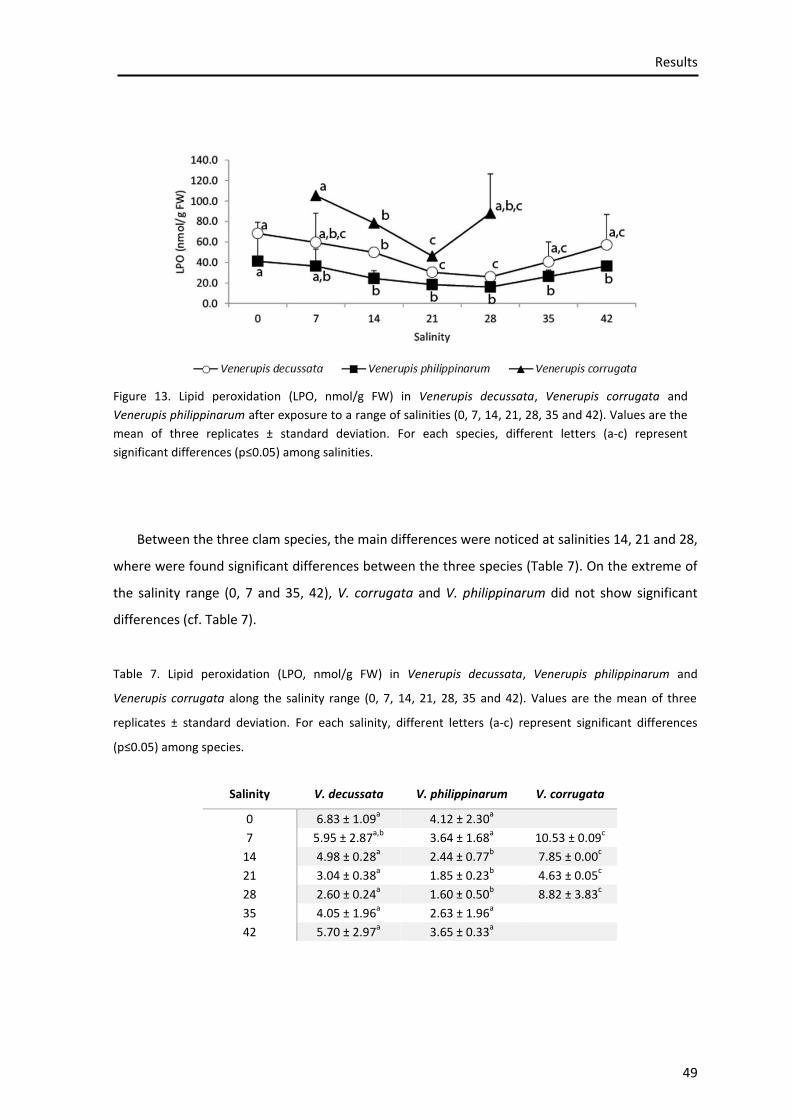
Results
49
Between the three clam species, the main differences were noticed at salinities 14, 21 and 28,
where were found significant differences between the three species (Table 7). On the extreme of
the salinity range (0, 7 and 35, 42), V. corrugata and V. philippinarum did not show significant
differences (cf. Table 7).
Table 7. Lipid peroxidation (LPO, nmol/g FW) in Venerupis decussata, Venerupis philippinarum and
Venerupis corrugata along the salinity range (0, 7, 14, 21, 28, 35 and 42). Values are the mean of three
replicates ± standard deviation. For each salinity, different letters (a-c) represent significant differences
(p≤0.05) among species.
Salinity V. decussata V. philippinarum V. corrugata
0 6.83 ± 1.09a
4.12 ± 2.30a
7 5.95 ± 2.87a,b
3.64 ± 1.68a
10.53 ± 0.09c
14 4.98 ± 0.28a
2.44 ± 0.77b
7.85 ± 0.00c
21 3.04 ± 0.38a
1.85 ± 0.23b
4.63 ± 0.05c
28 2.60 ± 0.24a
1.60 ± 0.50b
8.82 ± 3.83c
35 4.05 ± 1.96a
2.63 ± 1.96a
42 5.70 ± 2.97a
3.65 ± 0.33a
Figure 13. Lipid peroxidation (LPO, nmol/g FW) in Venerupis decussata, Venerupis corrugata and
Venerupis philippinarum after exposure to a range of salinities (0, 7, 14, 21, 28, 35 and 42). Values are the
mean of three replicates ± standard deviation. For each species, different letters (a-c) represent
significant differences (p≤0.05) among salinities.
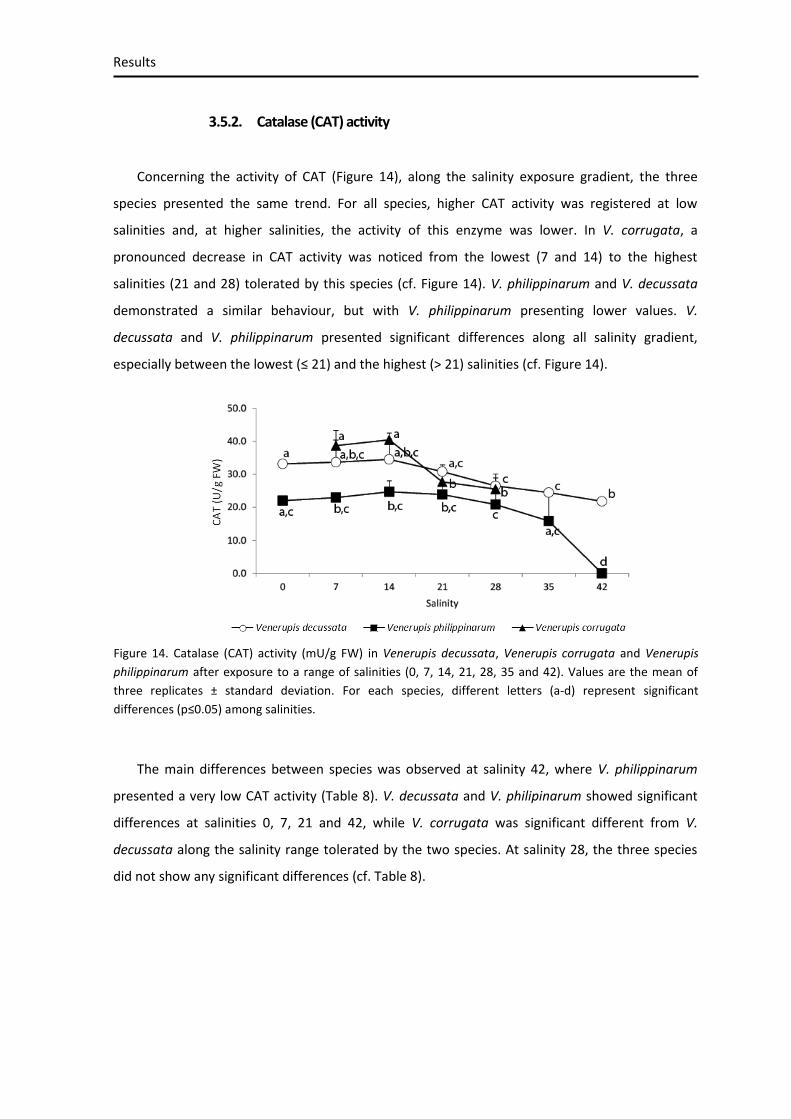
Results
50
3.5.2. Catalase (CAT) activity
Concerning the activity of CAT (Figure 14), along the salinity exposure gradient, the three
species presented the same trend. For all species, higher CAT activity was registered at low
salinities and, at higher salinities, the activity of this enzyme was lower. In V. corrugata, a
pronounced decrease in CAT activity was noticed from the lowest (7 and 14) to the highest
salinities (21 and 28) tolerated by this species (cf. Figure 14). V. philippinarum and V. decussata
demonstrated a similar behaviour, but with V. philippinarum presenting lower values. V.
decussata and V. philippinarum presented significant differences along all salinity gradient,
especially between the lowest (≤ 21) and the highest (> 21) salinities (cf. Figure 14).
The main differences between species was observed at salinity 42, where V. philippinarum
presented a very low CAT activity (Table 8). V. decussata and V. philipinarum showed significant
differences at salinities 0, 7, 21 and 42, while V. corrugata was significant different from V.
decussata along the salinity range tolerated by the two species. At salinity 28, the three species
did not show any significant differences (cf. Table 8).
Figure 14. Catalase (CAT) activity (mU/g FW) in Venerupis decussata, Venerupis corrugata and Venerupis
philippinarum after exposure to a range of salinities (0, 7, 14, 21, 28, 35 and 42). Values are the mean of
three replicates ± standard deviation. For each species, different letters (a-d) represent significant
differences (p≤0.05) among salinities.

Results
51
Table 8. Catalase (CAT) activity (mU/g FW) in Venerupis decussata, Venerupis philippinarum and Venerupis
corrugata along the salinity range (0, 7, 14, 21, 28, 35 and 42). Values are the mean of three replicates ±
standard deviation. For each salinity, different letters (a-b) represent significant differences (p≤0.05) among
species.
3.5.3. Superoxide dismutase (SOD) activity
In the case of activity of SOD enzyme (Figure 15), the three species evidenced the highest
activity at salinity 14. V. decussata showed a very pronounced increase from lower salinities (0
and 7) to salinity 14 and also an abrupt decrease to the highest salinities. Figure 15 shows that V.
philippinarum and V. corrugata followed the same trend of SOD activity than V. decussata, but
less pronounced. For V. corrugata it was observed the lowest value at salinity 7 and significantly
higher values at salinities 14, 21 and 28. For V. philippinarum it was noticed a significant increase
from salinity 0 to salinity 14 and a significant decrease up to salinity 42 (cf. Figure 15).
Between V. decussata and V. philippinarum significant differences along the salinity range
were noticed, except for salinity 42 (Table 9). Significant differences were found between V.
corrugata and V. decussata at all the salinities tolerated by V. corrugata. On the ther hand, V.
corrugata only showed significant differences from V. philippinarum at salinities 7 and 28 (cf.
Table 9).
Salinity V. decussata V. philippinarum V. corrugata
0 33.17 ± 0.90a
22.00 ± 1.05b
7 33.65 ± 9.65a
22.97 ± 0.79b
38.68 ± 4.52a
14 34.54 ± 7.91a 24.71 ± 3.34
a,b 40.45 ± 1.70
a
21 30.82 ± 2.03a
23.89 ± 3.07b
27.72 ± 0.34a,b
28 26.51 ± 2.41a
20.85 ± 9.22a
25.54 ± 3.80a
35 24.48 ± 0.97a
15.88 ± 8.97a
42 21.82 ± 0.11a
0.00 ± 0.11b
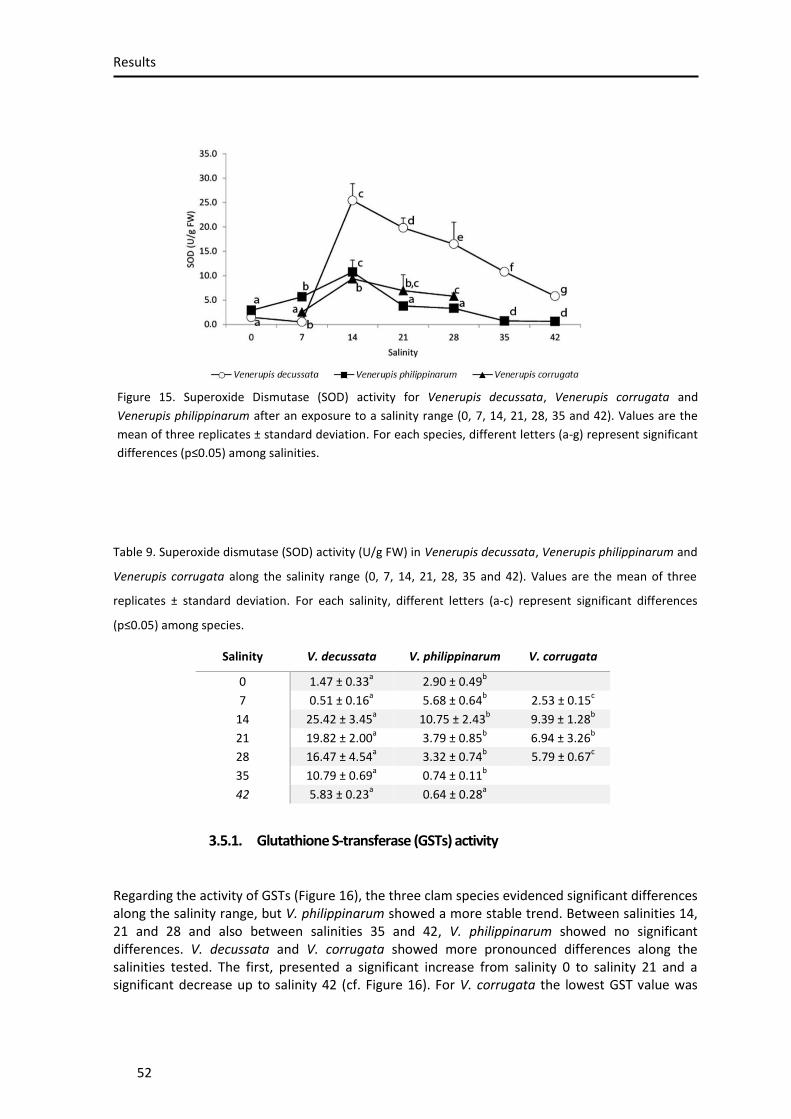
Results
52
Table 9. Superoxide dismutase (SOD) activity (U/g FW) in Venerupis decussata, Venerupis philippinarum and
Venerupis corrugata along the salinity range (0, 7, 14, 21, 28, 35 and 42). Values are the mean of three
replicates ± standard deviation. For each salinity, different letters (a-c) represent significant differences
(p≤0.05) among species.
Salinity V. decussata V. philippinarum V. corrugata
0 1.47 ± 0.33a
2.90 ± 0.49b
7 0.51 ± 0.16a
5.68 ± 0.64b
2.53 ± 0.15c
14 25.42 ± 3.45a
10.75 ± 2.43b
9.39 ± 1.28b
21 19.82 ± 2.00a
3.79 ± 0.85b
6.94 ± 3.26b
28 16.47 ± 4.54a
3.32 ± 0.74b
5.79 ± 0.67c
35 10.79 ± 0.69a
0.74 ± 0.11b
42 5.83 ± 0.23a
0.64 ± 0.28a
3.5.1. Glutathione S-transferase (GSTs) activity
Regarding the activity of GSTs (Figure 16), the three clam species evidenced significant differences along the salinity range, but V. philippinarum showed a more stable trend. Between salinities 14, 21 and 28 and also between salinities 35 and 42, V. philippinarum showed no significant differences. V. decussata and V. corrugata showed more pronounced differences along the salinities tested. The first, presented a significant increase from salinity 0 to salinity 21 and a significant decrease up to salinity 42 (cf. Figure 16). For V. corrugata the lowest GST value was
Figure 15. Superoxide Dismutase (SOD) activity for Venerupis decussata, Venerupis corrugata and
Venerupis philippinarum after an exposure to a salinity range (0, 7, 14, 21, 28, 35 and 42). Values are the
mean of three replicates ± standard deviation. For each species, different letters (a-g) represent significant
differences (p≤0.05) among salinities.

Results
53
found at salinity 21 and seems that this species followed the opposite trend of V. decussata, showing no significant differences between the lowest salinities tolerated by V. corrugata (7 and 14), where the values were significantly higher than at salinity 28 (cf. Figure 16).
The data on Table 10, shows significant differences among the three species along the salinity
range. Comparing V. decussata and V. philippinarum, significant differences were observed at all
the tested salinities. V. corrugata also showed significant differences comparing with the other
two species, except at salinity 21, where V. corrugata did not presented significant differences
comparing with V. decussata (cf. Table 10).
Table 10. Glutathione S-transferase (GST) activity (U/g FW) in Venerupis decussata, Venerupis philippinarum
and Venerupis corrugata along the salinity range (0, 7, 14, 21, 28, 35 and 42). Values are the mean of three
replicates ± standard deviation. For each salinity, different letters (a-c) represent significant differences
(p≤0.05) among species.
Salinity V. decussata V. philippinarum V. corrugata
0 0.45 ± 0.03a
0.31 ± 0.01b
7 0.53 ± 0.07a
0.35 ± 0.01b
0.88 ± 0.01c
14 0.67 ± 0.02a
0.39 ± 0.15b
0.83 ± 0.02c
21 0.78 ± 0.01a
0.29 ± 0.09b
0.68 ± 0.15a
28 0.56 ± 0.03a
0.29 ± 0.08b
1.04 ± 0.10c
35 0.33 ± 0.04a
0.25 ± 0.00b
42 0.30 ± 0.01a
0.01 ± 0.03b
Figure 16. Glutathione S-transferase (GST) activity for Venerupis decussata, Venerupis corrugata and
Venerupis philippinarum when exposed to salinities (0, 7, 14, 21, 28, 35 and 42). Values are the mean of
three replicates ± standard deviation. For each species, different letters (a-e) represent significant
differences (p≤0.05) among salinities.

Results
54
3.5.2. Total glutathione (GSHt)
Concerning GSHt content (Figure 17), it was observed that V. corrugata was the species with
lower levels without significant differences along salinities. However, a smooth decrease from the
lowest (0 and 7) to the highest (21 and 28) salinities was noticed for this species. V. decussata
maintained the GSHt content up to salinity 14, showing no significant differences between these
salinities followed by a significant decrease up to salinity 35 (cf. Figure 17). V. philippinarum
presented an slight increase up to salinity 21, followed by a decrease to salinity 35 and a
significant increase to salinity 42. Both V. decussata and V. philippinarum showed a significant
increase of GSHt content at salinity 42 (cf. Figure 17).
Among the three clam species greater significant differences were noticed at salinity 21 (Table
11). V. decussata and V. philippinarum showed significant differences at salinities ≥ 21, while V.
corrugata presented significant differences at salinities 14, 21 and 28, when compared with V.
philippinarum and, at salinities 14 and 21, comparing with V. decussata (cf. Table 11).
Figure 17. Total glutathione (GSHt) content (µmol/g FW) in Venerupis decussata, Venerupis corrugata and
Venerupis philippinarum. Values are the mean of three replicates ± standard deviation. For each species,
different letters (a-c) represent significant differences (p≤0.05) among salinities.

Results
55
Table 11. Total glutathione (GSHt) content (µmol/g FW) in Venerupis decussata, Venerupis philippinarum
and Venerupis corrugata along the salinity range (0, 7, 14, 21, 28, 35 and 42). Values are the mean of three
replicates ± standard deviation. For each salinity, different letters (a-c) represent significant differences
(p≤0.05) among species.
3.5.1. Reduced glutathione (GSH)
The quantification of GSH (Figure 18) revealed significant differences for three species
between the tested salinities. V. decussata presented a significant GSH increase up to salinity 14
and was also noticed a significant decreased from salinity 14 to salinity 28 and an increase up to
the highest salinity tested (42), without significant differences comparing with other salinities (cf.
Figure 18). V. philippinarum followed the same trend, except between salinities 21 and 35 where
the GSH values were constant. V. corrugata presented a decrease at higher salinity, that this
species tolerates (28), although with no significant differences between the remaining salinities.
Between V. decussata and V. philippinarum, except at salinity 28, no significant differences
were found (Table 12). V. corrugata showed significant differences comparing with V. decussata
at salinities 7 and 14 and when compared with V. philippinarum no significant differences were
found. At salinity 21 no significant differences between the three species were registered (cf.
Table 12).
Salinity V. decussata V. philippinarum V. corrugata
0 0.58 ± 0.04a
0.50 ± 0.02a
7 0.57 ± 0.06a
0.53 ± 0.02a
0.39 ± 0.12a
14 0.55 ± 0.01a
0.55 ± 0.03a
0.39 ± 0.03b
21 0.45 ± 0.04a
0.56 ± 0.03b
0.33 ± 0.05c
28 0.39 ± 0.00a
0.51 ± 0.02b
0.33 ± 0.06a
35 0.42 ± 0.01a
0.49 ± 0.04b
42 0.55 ± 0.00a
0.60 ± 0.02b
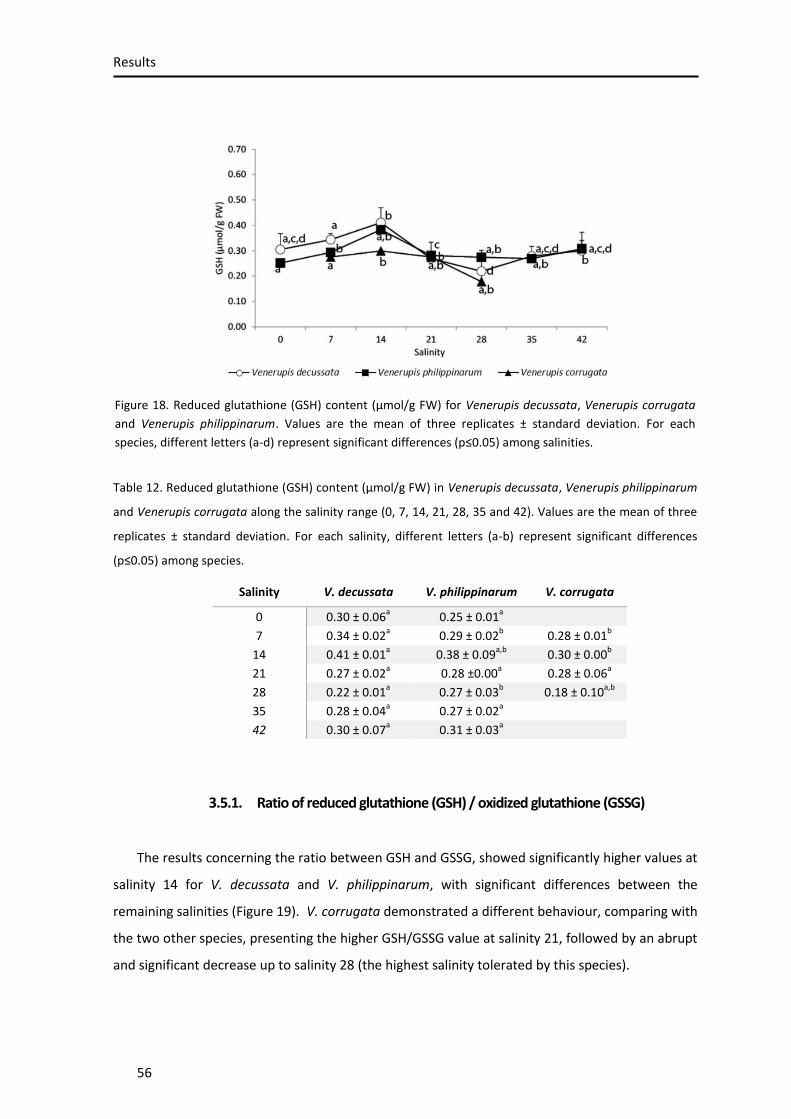
Results
56
Table 12. Reduced glutathione (GSH) content (µmol/g FW) in Venerupis decussata, Venerupis philippinarum
and Venerupis corrugata along the salinity range (0, 7, 14, 21, 28, 35 and 42). Values are the mean of three
replicates ± standard deviation. For each salinity, different letters (a-b) represent significant differences
(p≤0.05) among species.
Salinity V. decussata V. philippinarum V. corrugata
0 0.30 ± 0.06a
0.25 ± 0.01a
7 0.34 ± 0.02a
0.29 ± 0.02b
0.28 ± 0.01b
14 0.41 ± 0.01a
0.38 ± 0.09a,b
0.30 ± 0.00b
21 0.27 ± 0.02a
0.28 ±0.00a
0.28 ± 0.06a
28 0.22 ± 0.01a
0.27 ± 0.03b
0.18 ± 0.10a,b
35 0.28 ± 0.04a
0.27 ± 0.02a
42 0.30 ± 0.07a
0.31 ± 0.03a
3.5.1. Ratio of reduced glutathione (GSH) / oxidized glutathione (GSSG)
The results concerning the ratio between GSH and GSSG, showed significantly higher values at
salinity 14 for V. decussata and V. philippinarum, with significant differences between the
remaining salinities (Figure 19). V. corrugata demonstrated a different behaviour, comparing with
the two other species, presenting the higher GSH/GSSG value at salinity 21, followed by an abrupt
and significant decrease up to salinity 28 (the highest salinity tolerated by this species).
Figure 18. Reduced glutathione (GSH) content (µmol/g FW) for Venerupis decussata, Venerupis corrugata
and Venerupis philippinarum. Values are the mean of three replicates ± standard deviation. For each
species, different letters (a-d) represent significant differences (p≤0.05) among salinities.

Results
57
Comparing the three species under the same salinity range, significant differences were only
detected at salinities 21 and 28, where V. corrugata had a different behaviour from the two other
species, presenting the highest value at salinity 21 and an abrupt decrease up to salinity 28 (cf.
Figure 19 and Table 13).
Table 13. GSH/GSSG ratio in Venerupis decussata, Venerupis philippinarum and Venerupis corrugata along
the salinity range (0, 7, 14, 21, 28, 35 and 42). Values are the mean of three replicates ± standard deviation.
For each salinity, different letters (a-b) represent significant difference (p≤0.05) among species.
Salinity V. decussata V. philippinarum V. corrugata
0 1.22 ± 0.62a
0.99 ± 0.03a
7 1.56 ± 0.41a
1.26 ± 0.29a
2.64 ± 2.21a
14 2.91 ± 0.58a
2.66 ± 1.40a
3.48 ± 1.04a
21 1.63 ± 0.70a
1.01 ± 0.10a
4.43 ± 2.06b
28 1.28 ± 0.12a
1.16 ± 0.21a
0.62 ± 0.16b
35 1.69 ± 0.23a
1.27 ± 0.25a
42 1.30 ± 0.66a
1.07 ± 0.23a
Figure 19. GSH/GSSG ratio for Venerupis decussata, Venerupis corrugata and Venerupis philippinarum.
Values are the mean of three replicates ± standard deviation. For each species, different letters (a-d)
represent significant differences (p≤0.05) among salinities.

Results
58
3.6. Nuclear magnetic resonance (NMR) spectroscopy
3.6.1. Aqueous extracts
Figure 20. 1H Nuclear Magnetic Resonance (NMR) spectra of aqueous extracts obtained from Venerupis
philippinarum exposed to different salinities: A: 0, B: 7, C: 28, D: 42. Each spectrum represents the mean of
the replicates (salinity 0, n=1; salinity 7, n=2; salinity 28, n=3; salinity 42, n=3). Legend: 1, 2, 3, isoleucine
(Ile), leucine (Leu) and valine (Val); 4, ethanol (extraction solvent); 5, threonine (Thr)/lactate; 6, alanine
(Ala); 7, arginine (Arg); 8, glutamine (Gln); 9 acetoacetate (tentative); 10, glutamate (Glu); 11, succinate; 12,
asparagine (Asn); 13, betaine; 14, taurine; 15, hypotaurine; 16, glycine (Gly); 17, homarine; 18, glucose (an
anomer); 19, glycogen (anomeric protons); 20, uridine; 21, inosine/adenosine; 22, tyrosine (Tyr); 23,
phenylalanine (Phe); 24, hypoxanthine; 25, formate. Arrows indicate some of the differences noted by
visual inspection of the spectra.

Results
59
Figure 20 shows representative 1H NMR spectra obtained for V. philippinarum species, when
exposed to salinities 0, 7, 28 and 42. Due to the limited number of replicates, comparison of these
spectra should be considered as exploratory. However, apparent spectral changes between
different salinities may be noted by visual inspection of the spectra (cf. Figure 20), such as those
regarding threonine (peak 5), alanine (peak 6), acetoacetate (peak 9), succinate (peak 11), glucose
and glycogen (peaks 18 and 19) and formate (peak 25). Table 14 lists the variations noted in the
integrals of some metabolites, at low salinities (0 and 7) and at the highest salinity (42), compared
to 28, although most variations are qualitative at this stage and only formic acid showed a
statistically relevant change. Regarding amino acids, deviation from the ideal salinity 28 (either
towards low or high salinity) seems to be associated with generally higher amino acid levels (Thr,
Ala, Glu, Gln, Gly, Tyr), with the exceptions of Asn (decreased non-specifically at three salinities)
and Arg, which showed an apparently specific response to low (↓ Arg) and high (↑ Arg) salinities. In
relation to organic acids, lower (0 and 7) and higher (42) salinities seem accompanied by
increased acetoacetic acid (acetoacetate) and succinic acids (succinate) and a decrease for
salinities 7 and 42 in formic acid (formate), the latter becoming significant at 42 (p = 0.00121).
Other changes seem to be mostly non-specific to salinity, such as the decreases in taurine,
betaine, glucose and glycogen and the increase in adenosine/inosine. On the other hand,
apparent salinity-specific changes are noted either in terms of different magnitudes of change
(namely for formic acid, hypotaurine and homarine) or of decrease or increase of change (for
uridine, hypoxanthine and Arg, as mentioned above).
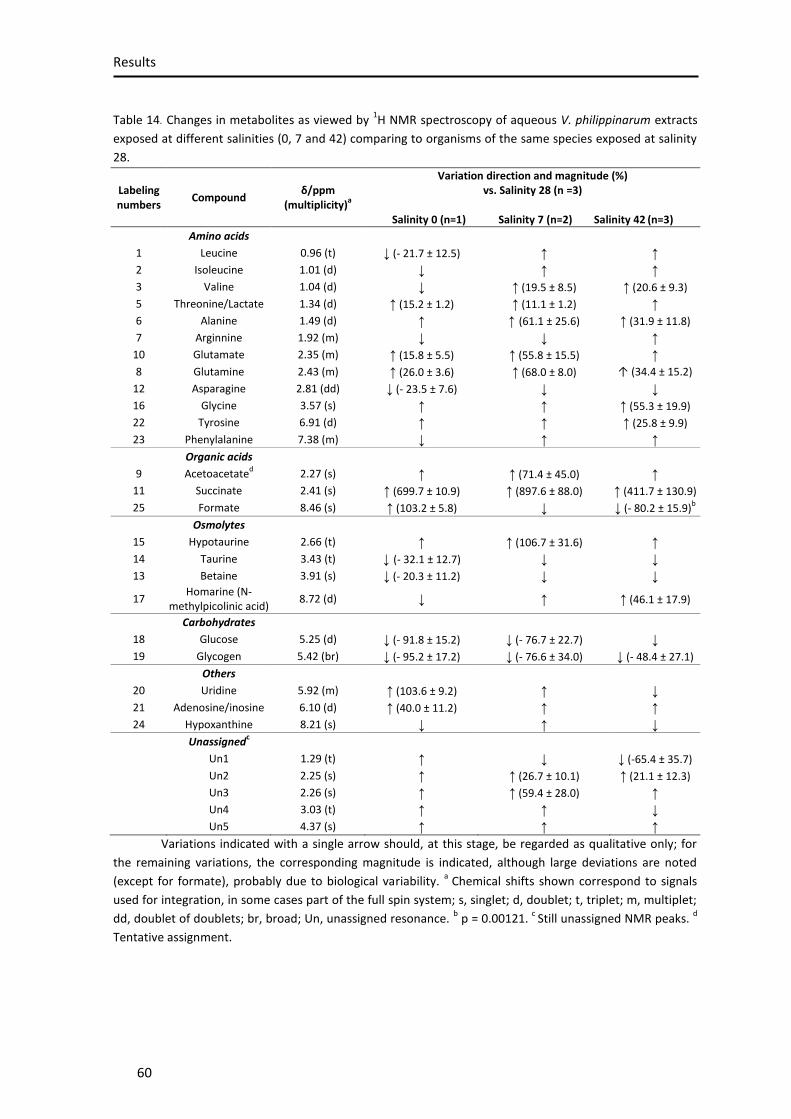
Results
60
Table 14. Changes in metabolites as viewed by 1H NMR spectroscopy of aqueous V. philippinarum extracts
exposed at different salinities (0, 7 and 42) comparing to organisms of the same species exposed at salinity
28.
Labeling numbers
Compound δ/ppm
(multiplicity)a
Variation direction and magnitude (%) vs. Salinity 28 (n =3)
Salinity 0 (n=1) Salinity 7 (n=2) Salinity 42
(n=3)
Amino acids
1 Leucine 0.96 (t) ↓ (- 21.7 ± 12.5) ↑ ↑
2 Isoleucine 1.01 (d) ↓ ↑ ↑
3 Valine 1.04 (d) ↓ ↑ (19.5 ± 8.5) ↑ (20.6 ± 9.3)
5 Threonine/Lactate 1.34 (d) ↑ (15.2 ± 1.2) ↑ (11.1 ± 1.2) ↑
6 Alanine 1.49 (d) ↑ ↑ (61.1 ± 25.6) ↑ (31.9 ± 11.8)
7 Arginnine 1.92 (m) ↓ ↓ ↑
10 Glutamate 2.35 (m) ↑ (15.8 ± 5.5) ↑ (55.8 ± 15.5) ↑
8 Glutamine 2.43 (m) ↑ (26.0 ± 3.6) ↑ (68.0 ± 8.0) ↑ (34.4 ± 15.2)
12 Asparagine 2.81 (dd) ↓ (- 23.5 ± 7.6) ↓ ↓
16 Glycine 3.57 (s) ↑ ↑ ↑ (55.3 ± 19.9)
22 Tyrosine 6.91 (d) ↑ ↑ ↑ (25.8 ± 9.9)
23 Phenylalanine 7.38 (m) ↓ ↑ ↑
Organic acids
9 Acetoacetated 2.27 (s) ↑ ↑ (71.4 ± 45.0) ↑
11 Succinate 2.41 (s) ↑ (699.7 ± 10.9) ↑ (897.6 ± 88.0) ↑ (411.7 ± 130.9)
25 Formate 8.46 (s) ↑ (103.2 ± 5.8) ↓ ↓ (- 80.2 ± 15.9)b
Osmolytes
15 Hypotaurine 2.66 (t) ↑ ↑ (106.7 ± 31.6) ↑
14 Taurine 3.43 (t) ↓ (- 32.1 ± 12.7) ↓ ↓
13 Betaine 3.91 (s) ↓ (- 20.3 ± 11.2) ↓ ↓
17 Homarine (N-
methylpicolinic acid) 8.72 (d) ↓ ↑ ↑ (46.1 ± 17.9)
Carbohydrates
18 Glucose 5.25 (d) ↓ (- 91.8 ± 15.2) ↓ (- 76.7 ± 22.7) ↓
19 Glycogen 5.42 (br) ↓ (- 95.2 ± 17.2) ↓ (- 76.6 ± 34.0) ↓ (- 48.4 ± 27.1)
Others
20 Uridine 5.92 (m) ↑ (103.6 ± 9.2) ↑ ↓
21 Adenosine/inosine 6.10 (d) ↑ (40.0 ± 11.2) ↑ ↑
24 Hypoxanthine 8.21 (s) ↓ ↑ ↓
Unassignedc
Un1 1.29 (t) ↑ ↓ ↓ (-65.4 ± 35.7)
Un2 2.25 (s) ↑ ↑ (26.7 ± 10.1) ↑ (21.1 ± 12.3)
Un3 2.26 (s) ↑ ↑ (59.4 ± 28.0) ↑
Un4 3.03 (t) ↑ ↑ ↓
Un5 4.37 (s) ↑ ↑ ↑
Variations indicated with a single arrow should, at this stage, be regarded as qualitative only; for
the remaining variations, the corresponding magnitude is indicated, although large deviations are noted
(except for formate), probably due to biological variability. a
Chemical shifts shown correspond to signals
used for integration, in some cases part of the full spin system; s, singlet; d, doublet; t, triplet; m, multiplet;
dd, doublet of doublets; br, broad; Un, unassigned resonance. b p = 0.00121.
c Still unassigned NMR peaks.
d
Tentative assignment.
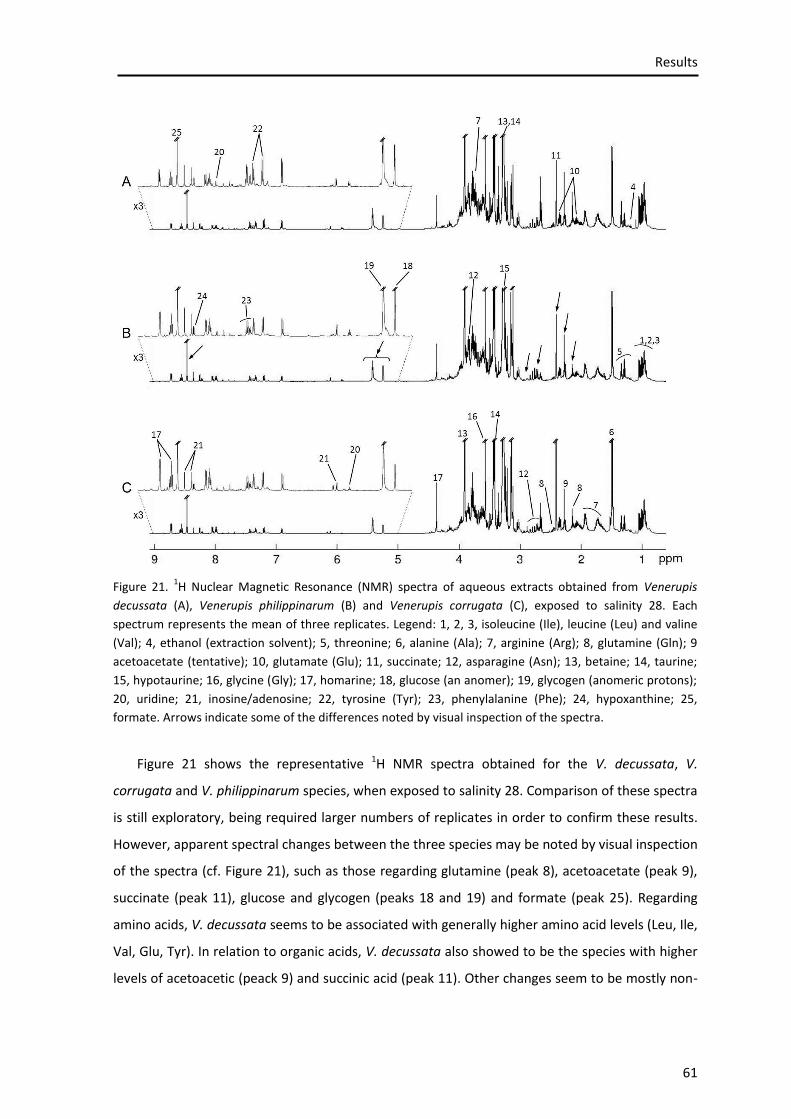
Results
61
Figure 21 shows the representative 1H NMR spectra obtained for the V. decussata, V.
corrugata and V. philippinarum species, when exposed to salinity 28. Comparison of these spectra
is still exploratory, being required larger numbers of replicates in order to confirm these results.
However, apparent spectral changes between the three species may be noted by visual inspection
of the spectra (cf. Figure 21), such as those regarding glutamine (peak 8), acetoacetate (peak 9),
succinate (peak 11), glucose and glycogen (peaks 18 and 19) and formate (peak 25). Regarding
amino acids, V. decussata seems to be associated with generally higher amino acid levels (Leu, Ile,
Val, Glu, Tyr). In relation to organic acids, V. decussata also showed to be the species with higher
levels of acetoacetic (peack 9) and succinic acid (peak 11). Other changes seem to be mostly non-
Figure 21. 1H Nuclear Magnetic Resonance (NMR) spectra of aqueous extracts obtained from Venerupis
decussata (A), Venerupis philippinarum (B) and Venerupis corrugata (C), exposed to salinity 28. Each
spectrum represents the mean of three replicates. Legend: 1, 2, 3, isoleucine (Ile), leucine (Leu) and valine
(Val); 4, ethanol (extraction solvent); 5, threonine; 6, alanine (Ala); 7, arginine (Arg); 8, glutamine (Gln); 9
acetoacetate (tentative); 10, glutamate (Glu); 11, succinate; 12, asparagine (Asn); 13, betaine; 14, taurine;
15, hypotaurine; 16, glycine (Gly); 17, homarine; 18, glucose (an anomer); 19, glycogen (anomeric protons);
20, uridine; 21, inosine/adenosine; 22, tyrosine (Tyr); 23, phenylalanine (Phe); 24, hypoxanthine; 25,
formate. Arrows indicate some of the differences noted by visual inspection of the spectra.

Results
62
specific of species, such as the differences in taurine, betaine, glucose and glycogen and in
adenosine/inosine. On the other hand, apparent species-specific changes are noted in terms of
different magnitudes of change or of direction of change (decrease or increase). Table 15 lists the
variations noted in the integrals of some metabolites, of V. decussata and V. corrugata compared
with V. philippinarum, although most variations are qualitative at this stage and any statistically
relevant change was noticed. Regarding amino acids, V. decussata seems to show generally higher
amino acids levels (Leu, Ile, Val, Thr, Glu, Gln, Gly, Tyr, Phe), while V. corrugata seems to present
mostly lower amino acids levels (Leu, Ile, Val, Thr, Asn, Tyr, Phe). Glu (↑), Gln (↑), Asn (↓) and Gly
(↑) present the same qualitative variation in V. decussata and V. corrugata. In relation to organic
acids, only formic acid showed lower levels in V. decussata and an increase was reported in
acetoacetic and succinic acids in both species, comparing with V. philippinarum. Osmolytes
presented, in general, a decrease in V. decussata (taurine, betaine and homarine) and an increase
in V. corrugata (hypotaurine, taurine and homarine). Glucose, uridinine, adenosine and
hypoxanthine showed the same variation (↓) in V. decussata and V. corrugata.

Results
63
Table 15. Changes in metabolites as viewed by 1H NMR spectroscopy of aqueous extracts of Venerupis
decussata and Venerupis corrugata comparing with Venerupis philippinarum, all exposed at salinity 28.
Labeling numbers
Compound δ/ppm
(multiplicity)a
Variation direction and magnitude (%) vs. V. philippinarum (n =3)
V. decussata (n=3) V. corrugata
(n=3)
Amino acids
1 Leucine 0.96 (t) ↑ ↓
2 Isoleucine 1.01 (d) ↑ ↓
3 Valine 1.04 (d) ↑ ↓
5 Threonine/Lactate 1.34 (d) ↑ ↓
6 Alanine 1.49 (d) ↓ ↑ (191.8 ± 40.6)
7 Arginnine 1.92 (m) ↓ ↑
10 Glutamate 2.35 (m) ↑ ↑
8 Glutamine 2.43 (m) ↑ ↑
12 Asparagine 2.81 (dd) ↓ ↓
16 Glycine 3.57 (s) ↑ (32.0 ± 18.8) ↑ (40.9 ± 18.3)
22 Tyrosine 6.91 (d) ↑ ↓
23 Phenylalanine 7.38 (m) ↑ ↓
Organic acids
9 Acetoacetatec 2.27 (s) ↑ ↑
11 Succinate 2.41 (s) ↑ ↑ (173.2 ± 87.7)
25 Formate 8.46 (s) ↓ ↑
Osmolytes
15 Hypotaurine 2.66 (t) ↑ (248.0 ± 15.0) ↑ (149.7 ± 31.2)
14 Taurine 3.43 (t) ↓ ↑
13 Betaine 3.91 (s) ↓ ↓
17 Homarine (N-
methylpicolinic acid) 8.72 (d) ↓ ↑
Carbohydrates
18 Glucose 5.25 (d) ↓ ↓
Others
20 Uridine 5.92 (m) ↓ ↓
21 Adenosine/inosine 6.10 (d) ↓ ↓
24 Hypoxanthine 8.21 (s) ↓ ↓
Unassignedb
Un1 1.29 (t) ↓ ↑
Un2 2.25 (s) ↑ ↑
Un3 2.26 (s) ↓ ↑
Un4 3.03 (t) ↑ ↑
Un5 4.37 (s) ↓ ↑
Variations indicated with a single arrow should, at this stage, be regarded as qualitative only; for
the remaining variations, the corresponding magnitude is indicated, although large deviations are, probably
due to biological variability. a
Chemical shifts shown correspond to signals used for integration, in some
cases part of the full spin system; s, singlet; d, doublet; t, triplet; m, multiplet; dd, doublet of doublets; br,
broad; Un, unassigned resonance . b
Still unassigned NMR peaks. c Tentative assignment.
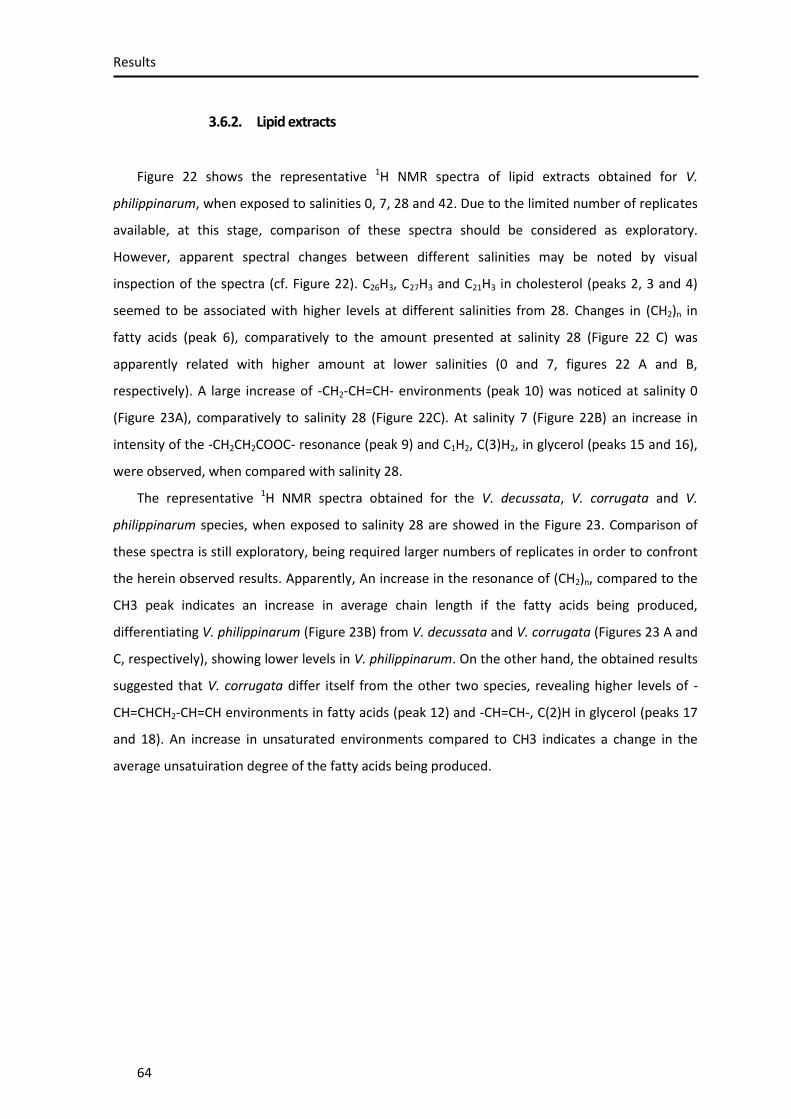
Results
64
3.6.2. Lipid extracts
Figure 22 shows the representative 1H NMR spectra of lipid extracts obtained for V.
philippinarum, when exposed to salinities 0, 7, 28 and 42. Due to the limited number of replicates
available, at this stage, comparison of these spectra should be considered as exploratory.
However, apparent spectral changes between different salinities may be noted by visual
inspection of the spectra (cf. Figure 22). C26H3, C27H3 and C21H3 in cholesterol (peaks 2, 3 and 4)
seemed to be associated with higher levels at different salinities from 28. Changes in (CH2)n in
fatty acids (peak 6), comparatively to the amount presented at salinity 28 (Figure 22 C) was
apparently related with higher amount at lower salinities (0 and 7, figures 22 A and B,
respectively). A large increase of -CH2-CH=CH- environments (peak 10) was noticed at salinity 0
(Figure 23A), comparatively to salinity 28 (Figure 22C). At salinity 7 (Figure 22B) an increase in
intensity of the -CH2CH2COOC- resonance (peak 9) and C1H2, C(3)H2, in glycerol (peaks 15 and 16),
were observed, when compared with salinity 28.
The representative 1H NMR spectra obtained for the V. decussata, V. corrugata and V.
philippinarum species, when exposed to salinity 28 are showed in the Figure 23. Comparison of
these spectra is still exploratory, being required larger numbers of replicates in order to confront
the herein observed results. Apparently, An increase in the resonance of (CH2)n, compared to the
CH3 peak indicates an increase in average chain length if the fatty acids being produced,
differentiating V. philippinarum (Figure 23B) from V. decussata and V. corrugata (Figures 23 A and
C, respectively), showing lower levels in V. philippinarum. On the other hand, the obtained results
suggested that V. corrugata differ itself from the other two species, revealing higher levels of -
CH=CHCH2-CH=CH environments in fatty acids (peak 12) and -CH=CH-, C(2)H in glycerol (peaks 17
and 18). An increase in unsaturated environments compared to CH3 indicates a change in the
average unsatuiration degree of the fatty acids being produced.

Results
65
Figure 22. 1H Nuclear Magnetic Resonance (NMR) spectra of lipid extracts obtained from Venerupis
philippinarum exposed to different salinities: A: 0, B: 7, C: 28, D: 42. Each spectrum represents the mean of
the replicates (salinity 0, n=1; salinity 7, n=2; salinity 28, n=3; salinity 42, n=3). Legend: 1, C18H3 in
cholesterol; 2, 3, 4, C26H3, C27H3, C21H3 in cholesterol; 5, C19H3 in cholesterol; 6, (CH2)n in fatty acids; 7, =CH-
CH2-CH2(CH2) in fatty acids; 8, CO-CH2-CH2 in fatty acids; 9, -CH2CH2COOC- in fatty acids; 10, -CH2-CH=CH- in
fatty acids; 11, CH2-COOC in fatty acids; 12, -CH=CHCH2-CH=CH in fatty acids; 13, phospholipids choline
head group N(CH3)3; 14, methanol (extraction solvent); 15, 16, C1H2, C3H2 in glycerol; 17, 18, -CH=CH-, C2H in
glycerol; 19, still unassigned NMR peaks. Arrows indicate some metabolites where differences were noted
by visual inspection of the spectra.

Results
66
Figure 23. 1H Nuclear Magnetic Resonance (NMR) spectra of lipid extracts obtained from Venerupis
decussata (A), Venerupis philippinarum (B) and Venerupis corrugata (C), exposed to salinity 28. Each
spectrum represents the mean of three replicates. Legend: 1, C18H3 in cholesterol; 2, 3, 4, C26H3, C27H3, C21H3
in cholesterol; 5, C19H3 in cholesterol; 6, (CH2)n in fatty acids; 7, =CH-CH2-CH2(CH2) in fatty acids; 8, CO-CH2-
CH2 in fatty acids; 9, -CH2CH2COOC- in fatty acids; 10, -CH2-CH=CH- in fatty acids; 11, CH2-COOC in fatty
acids; 12, -CH=CHCH2-CH=CH in fatty acids; 13, phospholipids choline head group N(CH3)3; 14, methanol
(extraction solvent); 15, 16, C1H2, C3H2 in glycerol; 17, 18, -CH=CH-, C2H in glycerol; 19, still unassigned NMR
peaks. Arrows indicate some of the differences noted by visual inspection of the spectra.
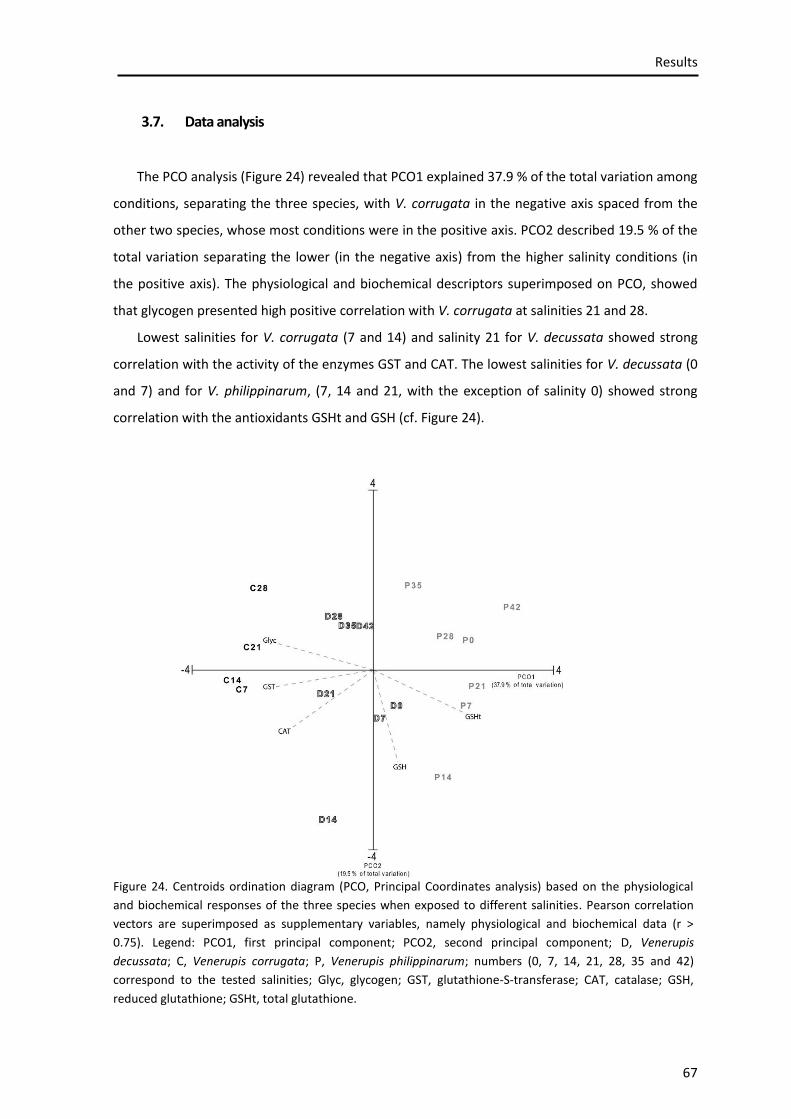
Results
67
3.7. Data analysis
The PCO analysis (Figure 24) revealed that PCO1 explained 37.9 % of the total variation among
conditions, separating the three species, with V. corrugata in the negative axis spaced from the
other two species, whose most conditions were in the positive axis. PCO2 described 19.5 % of the
total variation separating the lower (in the negative axis) from the higher salinity conditions (in
the positive axis). The physiological and biochemical descriptors superimposed on PCO, showed
that glycogen presented high positive correlation with V. corrugata at salinities 21 and 28.
Lowest salinities for V. corrugata (7 and 14) and salinity 21 for V. decussata showed strong
correlation with the activity of the enzymes GST and CAT. The lowest salinities for V. decussata (0
and 7) and for V. philippinarum, (7, 14 and 21, with the exception of salinity 0) showed strong
correlation with the antioxidants GSHt and GSH (cf. Figure 24).
Figure 24. Centroids ordination diagram (PCO, Principal Coordinates analysis) based on the physiological
and biochemical responses of the three species when exposed to different salinities. Pearson correlation
vectors are superimposed as supplementary variables, namely physiological and biochemical data (r >
0.75). Legend: PCO1, first principal component; PCO2, second principal component; D, Venerupis
decussata; C, Venerupis corrugata; P, Venerupis philippinarum; numbers (0, 7, 14, 21, 28, 35 and 42)
correspond to the tested salinities; Glyc, glycogen; GST, glutathione-S-transferase; CAT, catalase; GSH,
reduced glutathione; GSHt, total glutathione.

Results
68
The corresponding PCA for aqueous extracts (Figure 25A) showed the clear separation
between V. corrugata and the other two species at salinity 28 (in black) on PC2. It was also
possible to observe a separation of samples of V. philippinarum at salinity 42 (grey squares) from
salinity 28 on PC1. The PLS-DA scores plot (Figure 25B) confirm the separation between V.
corrugata and both, V. decussata and V. philippinarum at salinity 28 on LV2, with same
separation. Although the separation of salinities 42 and 28 in V. philippinarum was less clear, it
was still possible to observe this separation on LV2. Any other clear separation was detected.
Figure 25. MVA including all aqueous extracts tested in NMR spectroscopy, UV-scaled data. A, PCA scores
plot; B, PLS-DA scores plot (R2x=0.418; R
2y=0.373 Q
2=0.114). Legend: PC1, first component of PCA; PC2,
second component of PCA; LV1, first component of PLS-DA; LV2, second component of PLS-DA; Vd,
Venerupis decussata; Vp, Venerupis philippinarum; Vc, Venerupis corrugata; S0, S7, S28 and S42
correspond to salinities 0, 7, 28 and 42 respectively.
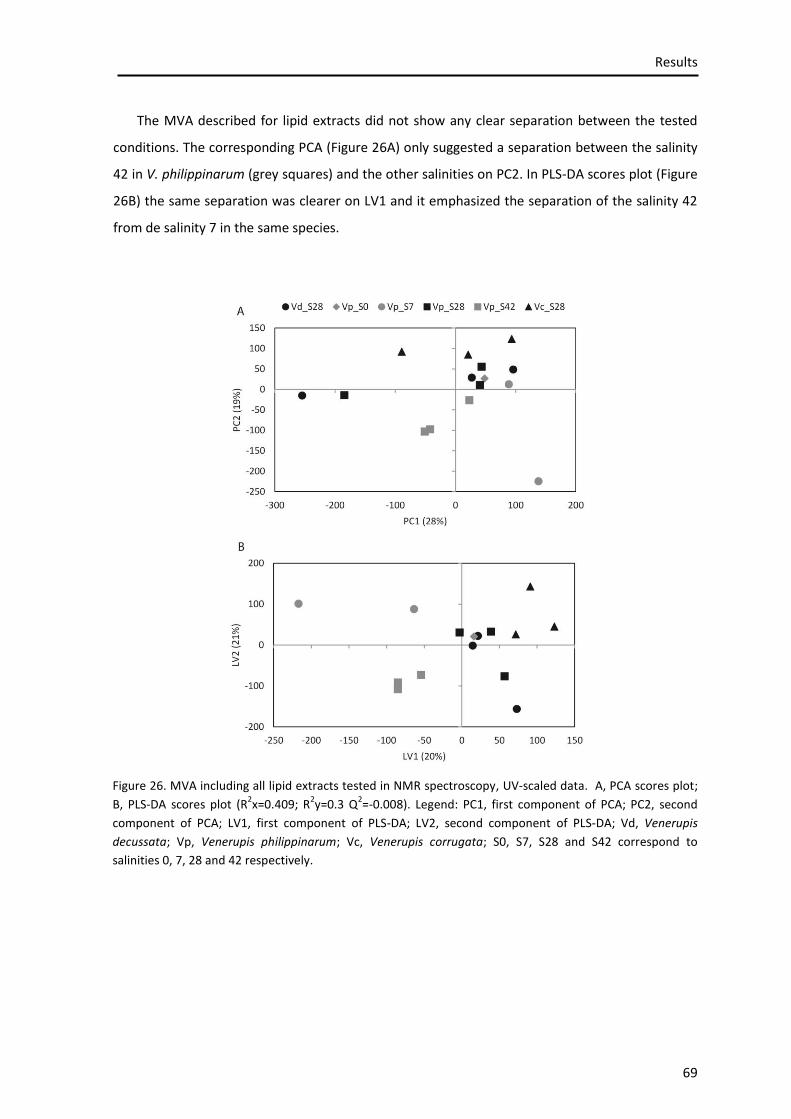
Results
69
The MVA described for lipid extracts did not show any clear separation between the tested
conditions. The corresponding PCA (Figure 26A) only suggested a separation between the salinity
42 in V. philippinarum (grey squares) and the other salinities on PC2. In PLS-DA scores plot (Figure
26B) the same separation was clearer on LV1 and it emphasized the separation of the salinity 42
from de salinity 7 in the same species.
Figure 26. MVA including all lipid extracts tested in NMR spectroscopy, UV-scaled data. A, PCA scores plot;
B, PLS-DA scores plot (R2x=0.409; R
2y=0.3 Q
2=-0.008). Legend: PC1, first component of PCA; PC2, second
component of PCA; LV1, first component of PLS-DA; LV2, second component of PLS-DA; Vd, Venerupis
decussata; Vp, Venerupis philippinarum; Vc, Venerupis corrugata; S0, S7, S28 and S42 correspond to
salinities 0, 7, 28 and 42 respectively.

Results
70
4. Discussion

Discussion
72
4.1. Context
Climate changes have been forcing organisms to rapidly adapt to a new conditions on the
environment. These changes may be related to strong precipitation events with hyposaline stress
conditions or associated to longer hot seasons, causing an increase in salinity. Organisms living in
estuaries, such as bivalves, have constantly to deal with these fluctuations on salinity and indeed,
the alterations will be more pronounced and longer with worsening on the climate changes.
Since the salinity is one of the most important abiotic factors that affect marine organisms
limiting their spatial distribution in the environment (Widdows and Shick, 1985) and having high
influence in the fishery and culture of bivalves (Matozzo et al., 2007; Hamer et al., 2008), it is very
important to understand how salinity changes affect aquatic organisms. When these abiotic
stressors are combined with biotic, like biological invasions, the adaptations to the new
environment can be more difficult to the native species.
Thus, the present study aimed to compare the survival capacity and the physiological,
biochemical and metabolomic alterations of three clams (Venerupis corrugata, V. decussata and
V. philippinarum) inhabiting the same coastal area, exposed to a range of salinities (0, 7, 14, 21,
28, 35 and 42) with the objective of understand the effects of salinity shifts on these species.
4.2. Mortality
The results obtained showed that the native species V. corrugata was the species with lower
survival capacity, presenting 100 % of mortality rates at the extremes of salinity tested (0, 35 and
42) and higher mortality percentage at other salinities (7, 14, 21, 28) when comparing with other
two species, V. decussata and V. philippinarum. The lowest percentage of mortality for this
species was detected at salinity 21, which may indicate optimal conditions for V. corrugata
survival. With 100 % of survival at all salinities, except at 0, V. decussata, one of the native species
in the study area, was the species more capable to tolerate a wide salinity range. With exception
to lower salinities tested (0 and 7), V. philippinarum also showed a great capacity to survive under
different salt concentrations, presenting 0 % of mortality at salinities higher than 7.
At this stage, it becomes clear that the three species used in this study have different
performances when under salinity stress. The three species showed different tolerances to
salinity changes, presenting different mortality rates, especially at low salinities. These differences
Discussion
73
may be explained by the osmotic, physiological, biochemical and metabolic alterations provoked
in each species, as will be discussed.
4.3. Osmotic balance
Euryhaline organisms, those capable of living at different salinities, present a life-dependent
on several adaptations. Osmoregulation based on active ion transport mechanisms is one of these
adaptations (Berguer and Kharazova, 1997). Wu et al. (2013) reported that hypo osmotic stress
can significantly reduce food intake, driving organisms to severe starvation.
The survival of marine organisms, namely bivalves, is dependent on osmotic balance
(Bianchini et al., 2008; Romano and Zeng, 2012) and this balance is mainly achieved with Na in
marine environments. With the obtained results it is possible to observe that in V. decussata, V.
corrugata and V. philippinarum intracellular Na levels were strongly dependent on the external
salinity in the range between 0 and 42, increasing along the increasing salinity exposure. Berger
and Kharazova (1997) demonstrated that in V. philippinarum Na concentrations varied according
to the alterations on salt concentration opposed to K levels, which maintained quite constantly at
the same considered salinity gradient. The results obtained in the present study also showed a
difference between Na and K concentrations. V. decussata and V. philippinarum presented
constant levels of K along the entire salinity range, while the levels of this ion in V. corrugata
increased along with the increase of salt concentration. Like Berger and Kharazova (1997)
proposed, these results suggested that Na plays an important key role in osmotic balance on the
tested organisms, since the rise of Na concentrations seems to be a mechanism to protect cells
from the influence of extremely high salinities. The same authors suggested that Na ions diffuse
into the cell when the salinity is high, and when salinity decreases Na is actively removed. At low
salinities, variation in Na concentrations are probably insufficient to maintain osmotic regulation.
The higher levels of Ca at low salinities (0, 7 and 14) in V. decussata and V. philippinarum may
indicate that osmotic regulation is compensated with this ion instead of Na. V. corrugata did not
follow the trend of the other two species. The levels of Ca at the lowest salinity that this species
can tolerate (7) may justify the imbalance of osmoregulation, since the mechanisms developed by
this species are not capable to compensate the low values of Na. Oxidized products, resulting
from oxidation of phospholipids membranes, leads to the permeability of the membranes, making
easier the input of Ca ions, which may conduct to cellular death (Manduzio et al., 2005). Thus, the
Discussion
74
higher levels of Ca registered for V. decussata and V. philippinarum at lower salinities (0 and 7),
could represent a higher oxidative stress at these salinities.
Works conducted by Elston et al. (2003) boosted the hypothesis that low salinity (10) forced
V. philippinarum to strongly close their shells as a defence response to the changes in the
surrounding environment. Shumway (1977a) also concluded that the concentrations of Na, Ca and
Mg in hemolymph of bivalves are similar to the surrounding environment as long as the organisms
maintain their valves opened. The same author demonstrated that the tested bivalves close their
valves when the salinity dramatically decreases and turn to open when the salinity is tolerable to
them. In the same study, when the seawater varied from 100 % to 30 %, finishing the cycle after
12 h when the sweater return to 100 %, on the second cycle the levels of Na, Ca and Mg stopped
to follow the percentage of seawater. This may indicate that if the salt concentrations were
maintained lower for a longer period of time, probably the clams would not be able to maintain
their valves closed and at the same time, keep a balanced osmoregulation. The present thesis
further demonstrated that Mg levels were proportional to the salinity range used. In other words,
the concentration of Mg in clams was increased along salinity exposure, being similar to the
surrounding environment. This data confirm that the three species under the present study, are
osmoconformers.
In fact, osmoregulation is a high-cost energy process (Nelson and Cox, 2005) and marine
organisms, namely bivalves, under stressful conditions, like changes in surrounding salt
concentrations, are forced to spend more energy resources trying to maintain their euryhaline
characteristics. According to Yancey (2005), some osmoconformer organisms are able to balance
their osmotic pressure using organic osmolytes. The results obtained by 1H NMR spectroscopy in
the present study, showed an increase of isoleucine, leucine and valine, which are also
aminoacids, at salinity 7, comparatively to salinity 28. However, the obtained results showed that
taurine and betaine decreased at lower (7) and higher salinities (42) comparing to salinity 28 in V.
philippinarum samples analysed on NMR approach, which do not comply with the regulation of
osmoregulation achieved by osmolytes. These declines are in agreement with Elston et al. (2003)
works, which also found that the decrease in amino acids was one of the stressful metabolic
alterations of V. philippinarum, when exposed to an altered environment with lower salt
concentrations.

Discussion
75
4.4. Physiological performance
The decrease of functional activity is the most usual reaction of marine molluscs to changes in
salinity (Berger and Kharazova, 1997). Kim et al. (2001) suggested that the shell closure and
consequent reduction of oxygen comsumption rate, works as a defence mechanism conserving
energy somewhat, a way of reducing energy expenditure on respiration processes and activity
when the organisms were exposed to lower salinities. This defence mechanism can explain the
results obtained regarding energy reserves in the three species. In fact, the present thesis
revealed that the glycogen and glucose content in V. philippinarum were lower at salinities below
28, which may indicate that this species protected itself from lower salinities, being forced to call
up reserve energies. In V. decussata the differences in energy content between lower (< 28) and
higher salinities (> 28) were less significant than in V. philippinarum. This may indicate that V.
philippinarum close their valves sooner than V. decussata when the surrounding environment
decreases the concentration on salt. On the other hand, V. corrugata was not responsive in terms
of glycogen content. The glycogen content was maintained along the range of salinities tolerated
by V. corrugata, which may indicate that this species keeps the normal filtration, with no need to
resort energy reserves, like glycogen. However, the glucose content was significantly lower at
salinities below and above 21 in the pattern presented for V. corrugata. It is possible that this
species was appealing to glucose reserves when the environmental conditions were not
favourable to it normal biological functioning.
The results obtained evidenced that clams mobilize stored energy (glycogen) and may also
use protein breakdown to cope with extreme salinity levels. The valve closure not only induces
hypoxiabut also reduces food intake as well. At a limiting situation, energy resources are
exhausted and osmotic imbalance may arise, inducing water influx into the cells, and causing
swelling and cellular rupture (Coughlan et al., 2009). These effects may explain the high mortality
of V. philippinarum at 0 and 7, of V. decussata at salinity 0 and of V. corrugata at low salinities (0,
7 and 14) observed in the present work, revealing that the three species have different limit for
tolerance to changes in salt concentrations. Also Patrick et al. (2005) and Anacleto et al. (2013)
showed that low glycogen contents were associated with mortality events.
Although clams can close their shell valves during long periods of time, this behaviour will
induce hypoxia (Kim et al., 2001), which will have significant effects on cell metabolism. Low O2
concentrations in cells will decrease the oxidative phosphorylation of ATP, which will induce the
accumulation of metabolites that feed the respiratory chain and the activation of alternative

Discussion
76
metabolic pathways of ATP production. Since these routes produce ATP less efficiently than
oxidative phosphorylation and osmoregulation is an energetically expensive process, glycogen
stores have to be rapidly consumed and cells have to resort to protein catabolism as an
alternative source of energy.
Structural and functional changes in proteins are considered stress-related effects as well
(Risso-de Faverney et al., 2000). In fact, our results showed that protein content is increasingly
affected by salinity decrease. The results on the diagrams of protein expression, showed that the
majority of variations occur at lower salinities (≤ 21) in the three species and this can be related to
a decrease in the expression of new proteins, a higher breakdown or both. The results herein
presented revealed that most alterations in protein expression at salinities < 28 for the three
species under analysis, are represented by their repression. Navarro and Gonzalez (1998), in
contrast, reported that when the scallop Argopecten purpuratus was transferred to a lower
salinity (they expanded from south to centre and north of Chile, where salinity is lower) an
increase of protein catabolism and the subsequent increase of amino acids were observed.
The lower activity of the electron respiratory chain decreases the oxidation of amino acids
obtained by protein catabolism, leading to their accumulation, or the accumulation of their
degradation intermediate metabolites, such as succinic acid (in isoleucine, threonine and
methionine metabolism) or formic acid (in serine metabolism). This is consistent with the NMR
results of V. philippinarum exposed to 7 and 42, which have shown higher levels of most amino
acids and their oxidation intermediates (succinic and formic acids), compared to control (28). An
exception is made for asparagine but this amino acid can be converted into glutamate and
glutamine (which are increased) with ATP production. Other amino acids (leucine, lysine,
phenylalanine, tryptophan and tyrosine) may be degraded into ketone bodies (Nelson and Cox,
2005). This is confirmed in the present work by the observed increase in acetoacetic acid with
formation of glutamate (seen to increase). Liu et al. (2011b) reported that alanine and succinic
acid are responsible for most of the end products of glucose and amino acid breakdown in
anaerobic metabolism. Pierce et al. (1992) also found elevated levels of alanine in salinity-stressed
bivalves. Thus, V. philippinarum also seems to obtain energy by anaerobic metabolism. The results
obtained evidenced that low salinity appears to increase nucleotides in V. philippinarum. Indeed,
hypoxanthine, product of adenine/inosine (purine) metabolism and uridine (pyrimidine) increased
at lower (7) salinity, compared to control (28). Dykens and Shick (1988) suggested that anoxia
tolerance may be achieved by the predominance of xanthine dehydrogenase over xanthine
oxidase activity, leading to hypoxanthine accumulation. Uridine increase was also reported to be

Discussion
77
related to hypoxia (Harkness and Lund, 1983). Thus, both hypoxanthine and uridine changes
suggest that at low salinity V. philippinarum experiences anoxic conditions, which may arise from
the closure of shell valves as a mechanism to tolerate salinity.
The ability of these animals to sustain prolonged periods of hypoxia is linked with a
coordinated suppression of many metabolic processes including enzymes, protein synthesis, and
the movement of ions across membranes. Kim et al. (2001) suggested that reduced OCR, due to
shell closure in the Manila clam, could function as a way of “energy conservation” to a certain
extent by reducing energy expenditure on respiration and activity when exposed to lower
salinities. This mechanism can explain why the three species analysed in the present study did not
decrease the energy reserves, such as glycogen, when exposed to lower salinities compared to
glycogen content found at the “optimal salinity conditions” (between 21 and 28). Besides
glycogen be considered the main energy reserve, lipids could also be consider as energy reserve in
bivalves, particularly when feed activity is insufficient to maintain their normal metabolism,
providing even more energy reserve than glycogen (Beninger and Lucas, 1984). In fact, our results
showed a decrease in some fatty acids at lower salinities (0 and 7), in metabolic performance
assessed by 1H NMR spectroscopy for V. philippinarum. This could be an evidence that lipids were
being used as energy reserve when they close their valves to protect themselves of stressful
surrounding environment, limiting the filtration rate.
4.5. Oxidative stress
The overproduction of reactive oxygen species (ROS), represent an important challenge to
organisms, normally leading to oxidative stress, which will cause different cellular dysfunctions
and several adaptive responses (Manduzio et al., 2005; Antunes et al., 2013). Physiologically
stressful conditions, such as salinity changes can increase cellular damage in marine invertebrates
due to an overproduction of ROS, leading to the oxidation of the lipid membranes (Abele et al.
2002, Abele and Puntarulo (2004). Some studies have concluded that clams are capable to deal
with metal contamination, activating defence systems, like antioxidant enzymes, to eliminate the
overproduced ROS and, consequently, reducing the oxidative damage, such as decreasing the lipid
peroxidation (LPO) levels (Figueira et al., 2012). The present study also showed that at the
salinities outside the optimal concentrations for the studied species (between 21 and 28, salinities
causing lower mortalities), clams tend to significantly increase lipid peroxidation, which results
from the higher ROS production. Significantly higher levels of LPO were observed in V. corrugata,

Discussion
78
which may reveal a stronger oxidative stress out of the preferred salinity (21). Although the
differences along the salinity range in V. decussata and V. philippinarum were less marked
comparatively to V. corrugata, it was possible observe the same trend, with salinities 21 and 28
presenting the lowest values of lipid peroxidation. Since LPO has been considered the main cause
of the loss of the cell function, when it was in an oxidative stress situation (Storey, 1996; Freitas et
al., 2012b; Figueira et al., 2012; Carregosa et al, 2014b), these results suggests lower levels of
oxidative stress at salinities between 21 and 28.
The induction of the activity of antioxidant enzymes, like SOD (an enzyme scavenging
superoxide anion) and CAT (an enzyme that catalyses the decomposition of H2O2), also result from
the overproduction of ROS in an oxidative stress situation (Freitas et al., 2012b; Figueira et al.,
2012). Thus, lower levels of these two enzymes, represent lower levels of oxidative stress. The
present study, revealed a significant decrease of SOD’ activity from salinity 14 up to salinity 42 for
both V. philippinarum and V. decussata and up to salinity 28 for V. corrugata, fighting against the
superoxide anion which indicate an increase of oxidative stress at lower salinities. However, low
levels of SOD activity were registered at the lowest salinities (0 and/or 7) for three species.
Monari et al. (2005) showed that anoxia, due to shell closure, significantly decreased total
haemocyte count as well as SOD activity, in the clam Chamelea gallina. The results obtained in the
present work are in agreement with such findings since at the lowest tested salinities (0 and 7)
the three species presented the lowest activity of SOD due to their tendency to remain their
valves closed at low salinities. On the other hand, this decrease in SOD activity may indicate a
response to the provoked stress. As Geret et al. (2003) suggested a decrease of antioxidant
systems can represent a first response to stress caused by pollutants. In V. decussata, the activity
of SOD presented lower levels at low salinities (0 and 7) than at higher salinities (35 and 42),
which can be explained by the overproduction of ROS. The extreme high amount of ROS interfere
with these enzymes, inhibiting them, with consequent increase of oxidative stress, possibly
meaning that the cells were in apoptosis. This is an evidence that the tested organisms are
experiencing a very high stressful environment, justifying thus the mortality rates at low salinities
for the three species.
Several authors have demonstrated the positive relationship between CAT and SOD (Geret et
al., 2002; Geret and Bebianno, 2004; Maria and Bebianno, 2011; Wang et al., 2012). The present
study further revealed that at salinity 14 the three species increased the activity of the
antioxidant enzyme CAT, suggesting a little increase of oxidative stress at this salinity. It was not
observed an extreme decrease of the activity of this enzyme at salinities lower than 14, as well as
Discussion
79
in the activity of SOD, maybe because H2O2 levels were lower that superoxide anion, which
allowed the functioning of CAT. Since the SOD could be inactivated at extreme lower salinities,
O2•ˉ was not reduced to H2O2, whose levels were possibly maintained and CAT was able to
perform its function. Significantly lower levels of CAT, confirm lower oxidative stress at higher
salinities (> 21) comparing with salinities lower than 28. In fact, the increase in the SOD activity
contributed to the strong decrease of the LPO levels, especially at salinities 14 and 21. At higher
salinities (35 and 42) the activity of these antioxidant enzymes significantly decreased
contributing to the increase in the LPO levels. Also Silva et al. (2005) showed that CAT activity in
the oyster Crassostrea rhizophorae was higher at salinity 9 decreasing with the increase of salinity
(15, 25 and 35).
GSTs catalyse the conjugations of glutathione and the result-compounds of cell injury (lipid
peroxidation) (Storey, 1996). The obtained results allowed to observe the occurrence of
significant differences along the salinity gradient and between the three clam species in relation
to GSTs activity. For V. decussata, the highest values were found in salinity 21 and, consequently,
in the remain salinities the activity of GST was lower. According to Hayes et al. (2004), the
inhibition of GST activity may be an indicator of cell damage and toxicity and on opposite its
induction can be related to an adaptive response to an altered environment. The behaviour
observed for V. corrugata, could represent this adaptive response, since the activity of GST was
induced outside of salinity 21. Although V. philippinarum showed slight differences between
salinities under and above 21, this species did not revealed pronounced differences as in two
other species, meaning that this enzyme was not highly responsive to salinity alterations in V.
philippinarum. The present work also evidenced that in V. decussata and V. philippinarum the
higher GSTs activity was accompanied by lower LPO levels, but V. corrugata did not show the
same behaviour. GSTs are a major Phase II detoxication enzymes found mainly in the cytosol and
function as a substrate of antioxidant enzymes to eliminate the reactive oxygen induced by
xenobiotic compounds providing protection against electrophiles and products of oxidative stress
(Hoarau et al., 2002). Thus, the elevation of GSTs activity between salinities 14 and 28 in V.
decussata may strongly contributed to the lower LPO levels found at these salinities.
Furthermore, the decrease in GSTs activity, accompanied by the decrease in the activity of the
antioxidant enzymes SOD and CAT in V. decusssata, may be responsible for the increase in the
LPO levels at the highest tested salinities (35 and 42). For V. philippinarum, the same relationship
was suggested in the results obtained for SOD and CAT activity (decreasing from salinities 14 and
21, respectively, up to salinity 42) and LPO levels (increasing at salinities higher than 28). The
Discussion
80
increase registered at salinity 28 for LPO levels of V. corrugata, may be explained by the decrease
observed in activity of CAT. Concentration of MDA (Malondialdehyde) is the reflection of
unsaturated fatty acids composition in cell, in proportion with the lipid peroxidation levels
(Wheatley, 2000). As LPO is an indicator of oxidative damage, it is possible to suggest that under
different conditions from those at salinities 21 and 28, for V. decussata and V. philippinarum and
21 for V. corrugata, the cell damage could occur and tend to worsen whenever the changes were
higher. Membrane’s function is affected by the presence of lipid hydroperoxides, derived from
lipid peroxidation, which consequently, leads to the leak of some ions into the cell, like Ca2+,
resulting from the decrease of fluidity of the membrane (Storey, 1996). In fact, the results showed
higher amounts of Ca at lower salinities (0 and 7), which may be related with the higher
permeability of the membranes.
Glutathione (GSHt), a tripeptide of glutamate, cysteine and glycine, playing as a detoxification
agent and it has been considered important in osmotic and oxidative stresses (Figueira et al.,
2005; Manduzio et al., 2005). Along the increasing salinity gradient the three studied species tend
to decrease the GSHt content, up to salinity 35 for V. decussata and V. philippinarum and up to 28
for V. corrugata. Similar findings were found by Anthony and Patel (2000) who demonstrated that
at higher salinities (32) glutathione significantly decreased compared to salinity 16 in the clam
species Anadora granosa.
Reduced glutathione (GSH) ensures the cellular status redox, working as a cofactor in the
response to several toxic compounds, being thus considered an important defence against ROS
(Antognelli et al., 2006). In normal redox status of cell, i.e. when the surrounding environment do
not present any stress, high levels of intracellular glutathione are registered, which control the
effects of reactive oxygen species before the oxidative stress occurs (Storey, 1996). Thus, higher
levels of GSH would mean lower levels of oxidative stress. However, GSH presented higher values
at salinity 14 for V. decussata and V. philippinarum, which did not seem to be in agreement with
the values of SOD and CAT, for example. This increase may be achieved by the higher activity of
SOD, which were decreasing superoxide anion and consequently, the oxidative stress. On the
other hand, this increase of GSH in V. decussata and V. philippinarum, can indicate a deficient
performance of glutathione peroxidase (GPx). In other words, the higher levels registered for this
antioxidant at salinity 14, could indicate that, despite de oxidative stress was higher than at
salinities higher than 14, GSH was not used by GPx. The results of GSH for V. corrugata showed
that this species was less responsive than the other two species, V. decussata and V.
philippinarum.
Discussion
81
The GSH/GSSG ratio is considered to be an index of cellular redox status, indicating the level
of oxidative stress in cell (Storey, 1996; Ault and Lawrence, 2003). When the levels of GSSG
increase due to higher amount of oxyradicals, this ratio decreases, meaning higher oxidative
stress in cells (Storey, 1996). V. corrugata showed significantly lower levels of this ratio at salinity
28, probably meaning a higher oxidative stress. The higher value of GSH/GSSG for this species was
found at salinity 21, which may indicate lower oxidative stress in cells, being in agreement with
other markers, like LPO and GST. The results obtained for GSHt showed a significant increase at
salinity 42 for V. decussata and V. philippinarum and for the ratio GSH/GSSG a slight decrease at
the same salinity was observed. This may indicate that GSSG is increased. A similar increase
found in GSH, was registered at salinity 14 for both, V. philippinarum and V. decussata in ratio
between reduced and oxidized glutathione. Along the salinity range, the values were maintained
around 1, which may indicate that GSH and GSSG were balanced. These results do not comply
other markers, such as LPO, SOD and GST which allowed to deduce higher oxidative stress out of
salinities 21 and 28.

Discussion
82

5. Conclusions
Conclusions
84
5.1. Conclusions
As bivalves are very important resources for costal populations around the world, in
economically terms, this kind of studies (assessing the health of the organisms and the effects of
natural stressors) can provide important information about the physiological status of the animals
in a climate change scenario and could be a useful tool for assessing the environmental quality to
potential bivalve farming areas.
The results herein presented, revealed that V. corrugata was the most sensitive clam to
salinity changes, with high mortality rates at the lowest (0 and 7) and the highest (35 and 42)
salinities tested. On the other hand, V. decussata and V. philippinarum were able to tolerate all
salinities higher than 7 and up to salinity 42. The present work showed that clams experiencing
changes in salinity altered their biochemical mechanisms to cope with these stressful conditions.
The mortalities registered at low salinities, may indicate that in fact, the clams’ metabolic
performance is affected and the organisms are not capable to lead with such alterations. The
mortality rates, clearly showed that extremely low salinities represent higher stress to this three
species studied.
This study also evidences that V. decussata and V. philippinarum can survive at salinities
between 14 and 42 for some days, which is a time interval consistent with changes in salinity
caused by heavy rainfall periods, or short episodes of heat.
Surviving organisms can also evidence the effects of exposure to salinities shifts. In fact,
organisms showed alterations in the levels of glucose, glycogen and ions with important biological
functions such as Ca and Mg. These differences will certainly be reflected in the growth
performance of clams and will imply lower productivity in those areas of the ecosystem where
sub-optimal salinities for these three species arise repeatedly.
V. philippinarum tolerates a wide range of salinities, through an apparent mechanism of Na
regulation. At extreme salinities (0, 7 and 42), the ionic osmoregulation seems to be achieved by
Ca increase and shell valve closure, since the metabolites related to the anaerobic metabolism of
glucose and amino acid breakdown are accumulated and the metabolites related to hypoxia
conditions are increased especially at low salinities. The alteration of the metabolite profile, as
viewed by NMR spectroscopy, seems to be a consequence of hypoxia and not of osmotic
adjustment since the accumulation of compatible osmotic compounds, such as betaine and
taurine, decreased relatively to the salinity 28 in V. philippinarum. The overall profile changes
Conclusions
85
means that the NMR-visible profile is sensitive to salinity and, hence, further studies should be
carried out.
The results give evidence that clams mobilize stored energy (glycogen) and may also use
protein breakdown to cope with extreme salinity levels. The valve closure not only induces
hypoxia but also reduces food intake as well and in a limit situation, the osmotic imbalance may
increase, leading to swelling and cellular rupture. These effects may explain the mortality rates of
V. decussata at salinity 0, of V. philippinarum and V. corrugata at 0 and 7, observed in the present
work.
Also, LPO, SOD and GST showed to be very useful biomarkers to salinity stress, with a strong
correlation with the increasing salinity gradient. The clams used in the present study
demonstrated that the optimal salinity range varied between 21 and 28, where these species
presented lower LPO levels and therefore lower mortality.
Studies of the environmental stress in marine organisms are particularly important, specially
to assess the health condition of those species cultivated for human consumption. For this, the
assessment of stress responses related with oxidative stress in marine organisms, furnish
important information useful to examination of the environmental quality. The results here
presented and discussed, with bivalve species from the Ria de Aveiro, indicate that salinity
fluctuations can cause substantial changes in their antioxidant defence systems and oxidative
injury levels.
The biomarkers tested in this study, allow to infer that although tested organisms are
considered euryhaline, they are not capable to adapt to extremely low salinities. This is a
particularly interesting finding, since the comparison of these three clam species allowed to
conclude that, despite they are living together in same areas, they have distinct responses to
salinity alterations. This information is of major importance for the management of this resource
and should be taken into account when defining areas and intensity of capture.
The invasive species used in this study, V. philippinarum, showed to be less tolerant to
changes in salinity than V. decussata, one of the native species studied. Comparing these two
species, V. philippinarum presented higher mortality rate and lower values of almost all of the
physiological and biochemical parameters tested. In a scenario of great salinity changes in areas
where these species live together, might mean a higher problem for V. philippinarum, than for V.
decussata, especially when the changes represent a decrease in salinity. The other native species
under analysis, V. corrugata, showed to have very different responses, compared with V.
Conclusions
86
decussata and V. philippinarum. Thus, this kind of changes will certainly have impacts on the
occurrence of V. corrugata, since the invasive species presented higher survival capacity under
salinity alterations. In fact, local fishermen testify the difficulty of finding this species in Ria de
Aveiro. Although one of the native species (V. decussata) showed higher capacity to deal with
these alterations, comparatively to the exotic species (V. philippinarum), they continue to live in
simpatry in same areas, with higher abundance of the invasive species, according to the local
fishermen. These facts indicate that changes in salinity have different impacts in native and
invasive species, getting worse the competition in the field for those with higher difficulties to
deal with these alterations, as V. corrugata.
5.2. Future considerations
Studies related with salinity fluctuations in marine bivalves should be performed in the future
approaching metabolic alterations by NMR spectroscopy with enough samples to use multivariate
analytical tools to statistically evaluate the alterations registered comparing to biological
variability, since there is not any studies related with this issue.
Regarding to GC x GC – ToFMS data, these should be processed and analysed in order to
understand the alterations in terms of volatile metabolites, which also was not studied yet,
subjecting these three species to a natural stressor, as salinity fluctuations.
It is clear that salinity, is not the only stress that influences the biological functioning of the
tested organisms and others living in the same or similar ecosystems. Thus, field studies shoud be
performed, especially in farming zones, assessing salinity and other environmental conditions
with the aim to found the ideal conditions to better health of the organisms. Also, a combination
of natural stressors and anthropogenic pollution requires further research as it results in several
adverse effects.

6. References

References
88

References
89
Abel D., 2002. The radical life-giver. Nature 420.
Albentosa M, Fernandéz-Reiriz M.J., Labarta U., Pérez-Camacho A., 2007. Response of two species of clams,
Ruditapes decussatus and Venerupis pullastra, to starvation: physiological and biochemical
parameters. Comparative Biochemistry and Physiology, Part B 146, 241-249.
Allam B., Paillard C., Howard A., Pennec M., 2000. Isolation of the pathogen Vibrio tapetis and defense
parameters in brown ring diseased Manila clams Ruditapes philippinarum cultivated in England.
Diseases of Aquatic Organisms 41, 105-113.
Almeida E.A., Bainy A.C.D., Loureiro A.P.M., Martinez G.R., Miyamoto S., Onuki J., Barbosa L.F., Garcia
C.C.M., Prado F.M., Ronsein G.E., Sigolo C.A., Brochini C.B., Martins A.M.G., Medeiros M.H.G., Mascio
P.D., 2007. Oxidative stress in Perna perna and other bivalves as indicators of environmental stress in
the Brazilian marine environment: Antioxidants, lipid peroxidation and DNA damage. Comparative
Biochemistry and Physiology, Part A 146, 588-600.
Anacleto P., Maulvault A.L., Barrento S., Mendes R., Nunes M.L., Rosa R., Marques A., 2013. Physiological
responses to depuration and transport of native and exotic clams at different temperatures.
Aquaculture; doi:10.1016/j.aquaculture.2013.05.035.
Anderson M.E., 1985. Determination of glutathione and glutathione disulfide in biological samples. In:
Meister A, ed. Methods in enzymology, vol. 113. Orlando, FL: Academic Press, 548-55.
Anderson M.J., Gorley R.N., Clarke K.R., 2008. PERMANOVA+ for PRIMER: Guide to software and statistical
methods. Ed by University of Auckland and PRIMER-E, Plymouth.
Anthony K., Patel B., 2000. Combined effect of salinity and cadmium in the presence of other metals (Zn &
Cu) and GSH on lysosomal responses in an arcid blood clam Anadara granosa. Indian Journal of
Fisheries 47, 311-319.
Antognelli C., Francesca B., Andrea P., Roberta F., Vincenzo T., Elvio G., 2006. Activity changes of glyoxalase
system enzymes and glutathione-Stransferase in the bivalve mollusc Scapharca inaequivalvis exposed
to the organophosphate chlorpyrifos. Pesticide Biochemistry and Physiology 86, 72-77.
Antunes S.C., Freitas R., Figueira E., Gonçalves F., Nunes B., 2013. Biochemical effects of acetaminophen in
aquatic species: edible clams Venerupis decussata and Venerupis philippinarum. Environmental
Science and Pollution Research 20, 6658-6666.
Attrill M.J., Rundle S.D., 2002. Ecotone or ecocline: ecological boundaries in estuaries. Estuarine Coastal and
Shelf Science 55, 929‐936.
Ault J.G., Lawrence D.A., 2003. Glutathione distribution in normal and oxidatively stressed cells.
Experimental Cell Research 285, 9-14.
Barroso C.M., Moreira M.H., Gibbs P.E., 2000. Comparison of imposex and intersex development in four
prosobranch species for TBT monitoring of a southern European estuarine system (Ria de Aveiro, NW
Portugal). Marine Ecology Progress Series 201, 221-232.
Bax N., Williamson A., Aguero M., Gonzalez E., Geeves W., 2003. Marine invasive alien species: a threat to
global biodiversity. Marine Policy 27, 313-323.

References
90
Beare S., Heaney A., 2002. Climate change and water resources in the Murray Darling Basin, Australia:
impacts and adaptation. In: Proceedings of 2002 World Congress of Environmental and Resource
Economics, California, 24‐27 June, 33 p.
Beauchamp C., Fridovich I., 1971. Superoxide dismutase: improved assays and an assay applicable to a
crylamide gels. Analytical Biochemistry 44, 276-287.
Bebianno M.J., Barreira L.A., 2009. Polycyclic aromatic hydrocarbons concentrations and biomarker
responses in the clam Ruditapes decussatus transplanted in the Ria Formosa lagoon. Ecotoxicology and
Environmental Safety 72, 1849-1860.
Beninger P.G., Lucas A., 1984. Seasonal variations in condition, reproductive activity, and gross biochemical
composition of two species of adult clam reared in a common habitat: Tapes decussatus L. (Jeffreys)
and Tapes philippinarum (Adams & Reeve). Journal of Experimental Marine Biology and Ecology 79,
19-37.
Berger V.J., Kharazova A.D., 1997. Mechanisms of salinity adaptations in marine molluscs. Hydrobiologia
355, 115-126.
Bianchini A., Lauer M.M., Nery L.E.M., Colares E.P., Monserrat J.M., Filho E.A.S., 2008. Biochemical and
physiological adaptations in the estuarine crab Neohelice granulate during salinity acclimation.
Comparative Biochemistry and Physiology, Part A 151, 423-436.
Bodoy A., Maître-Allain T., Riva A., 1981. Croissance comparée de la palourde européenne Ruditapes
decussatus et de la palourde japonaise Ruditapes philippinarum dans un écosystème artificiel
méditerranéen. Vie Marine 2, 39-51.
Booij M.J., 2005. Impact of climate change on river flooding assessed with different spatial model
resolutions. Journal of Hydrology 303, 176-198.
Brucet S., Boix D., Quintana X.D., Jensen E., Nathansen L.W., Trochine C., Meerhoff M., Gascón S., Jeppesen
E., 2010. Factors influencing zooplankton size structure at contrasting temperatures in coastal shallow
lakes: Implications for effects of climate change. Limnology and Oceanography 55, 1697-1711.
Byers C., Mills E.L., Stewart P.L., 1978. A comparison of methods of determining organic carbon in marine
sediments with suggestions for a standard method. Hydrobiologia 58, 43-47.
Byers J.E., 2002. Impact of non-indigenous species on natives enhanced by anthropogenic alteration of
selection regimes. Oikos 97, 449-458.
Carlton J.T., Geller J.B., 1993. Ecological roulette: the global transport of non-indigenous marine organisms.
Science 261, 78-82.
Carregosa V., Figueira E., Gil A.M., Pereira S., Pinto J., Soares A. M.V.M., Freitas R., 2014a. Tolerance of
Venerupis philippinarum to salinity: osmotic and metabolic aspects. Comparative Biochemistry and
Physiology, Part A 171, 36-43.
Carregosa V., Velez C., Pires A., A.M.V.M Soares, Figueira E., Freitas R., 2014b. Physiological and biochemical
responses of the Polychaete Diopatra neapolitana to organic matter enrichment. Aquatic Toxicology
155, 32-42.

References
91
Castro H., Ramalheira F., Quintino V., Rodrigues A.M., 2006. Amphipod acute and chronic sediment toxicity
assessment in estuarine environmental monitoring: an example from Ria de Aveiro, NW Portugal.
Marine Pollution Bulletin 53, 91-99.
Coughlan B.M., Monroney G.A., Pelt F.N.A.M., O’Brien N.M., Davenport J., O’Halloran J., 2009. The effects
of salinity on the Manila clam (Ruditapes philippinarum) using the neutral red retention assay with
adapted physiological saline solutions. Marine Pollution Bulletim 58, 1680-1684.
Crooks J.A., 2002. Characterizing ecosystem-level consequences of biological invasions: the role of
ecosystem engineers. Oikos 97, 153-166.
Dang C., Montaudouin X., Gam M., Paroissin C., Bru N., Caill-Milly N., 2010. The Manila clam population in
Arcachon Bay (SW France): Can it be kept sustainable? Journal of Sea Research 63, 108-118.
DGPA, 2011. Recursos da Pesca. Série estatística, 2009. Direcção Geral das Pescas e Aquicultura (22 A-B)
(181 pp., Lisboa, (In portuguese)).
Duarte I., Barros A., Belton P. S., Righelato R., Spraul M., Humpfer E., Gil A. M., 2002. High-Resolution
Nuclear Magnetic Resonance Spectroscopy and Multivariate Analysis for the Characterization of Beer.
Journal of Agricultural and Food Chemistry 50, 2475-2481.
Duarte I. F., Delgadillo I., Gil A. M., 2006. Study of natural mango juice spoilage and microbial contamination
with Penicillium expansum by high resolution 1H NMR spectroscopy. Food Chemistry 96, 313-324.
Delgado M., Pérez-Camacho A., 2007. Comparative study of gonadal development of Ruditapes
philippinarum (Adams and Reeve) and Ruditapes decussatus (L.) (Mollusca: Bivalvia): Influence of
temperature. Scientia Marina 71, 471-484.
Dias J.M., Lopes J.F., Dekeyser I., 1999. Hydrological characterisation of Ria de Aveiro, Portugal, in early
summer. Oceanologica Acta 22, 473-485.
Dias J.M., Lopes J.F., Dekeyser I., 2000. Tidal propagation in Ria de Aveiro lagoon, Portugal. Physics and
Chemistry of the Earth, Part B 25, 369-374.
Dias J.M., Rodrigues M., Leandro S., Morgado F., Oliveira A., Queiroga H., 2011. Caracterização Sinóptica
dos Gradientes Ambientais na Ria de Aveiro. Parte I: Salinidade e Temperatura. In: Almeida A., Alves
F.L., Bernardes C., Dias J.M., Gomes N.C.M., Pereira E., Queiroga H., Serôdio J., Vaz N. (Ed.), Atas das
Jornadas da Ria de Aveiro 2011, Universidade de Aveiro, CESAM – Centro de Estudos do Ambiente e
do Mar, Aveiro 141‐150.
Di Giulio R.T., Washburn P.C, Wennings R.G., Winston G.W., Jewell C.S., 1989. Biochemical responses in
aquatic animals: a review of determinants of oxidative stress. Environmental Toxicology and Chemistry
8, 1103-23.
Ďuračková C., 2008. Oxidants, Antioxidants and Oxidative Stress. Gvozdjáková A. (ed.), Mitochondrial
Medicine. Springer Science + Business Media B.V. Chapter 2, 19-54.
Dykens J.A., Shick J.M., 1988. Relevance of purine catabolism to hypoxia and recovery in euryoxic and
stenoxic marine invertebrates, particularly bivalve molluscs. Comparative Biochemistry and
Physiology, Part C 91, 35-41.

References
92
Elliot M., 2003. Biological pollutants and biological pollution – an increasing cause for concern. Marine
Pollution Bulletim 46, 275-280.
Elston R.A., Cheney D.P., Macdonald B.F., Suhrbier A.D., 2003. Tolerance and response of Manila clams,
Venerupis philippinarum (A. Adams and Reeve, 1850) to low salinity. Journal of Shellfish Research 22,
667-674.
Elton C., 1958. The Ecology of Invasions by Animals and Plants. University Chicago Press, 181 p.
Evans D.H., Piermarini P.M., Choe K.P., 2005. The Multifunctional Fish Gill: Dominant Site of Gas Exchange,
Osmoregulation, Acid-Base Regulation, and Excretion of Nitrogenous Waste. Physiological Reviews 85,
97-177.
Figueira E., Cardoso P., Freitas R., 2012. Ruditapes decussatus and Ruditapes philippinarum exposed to
Cadmium: toxicological effects and bioaccumulation patterns. Comparative Biochemistry and
Physiology, Part C 156, 2, 80-86.
Figueira E, Freitas R., 2013. Consumption of Ruditapes philippinarum and Ruditapes decussatus: comparison
of element accumulation and health risk. Environmental Science and Pollution Research 20, 5682-
5691.
Figueira E.M.A.P., Lima A.I.G., Pereira S.I.A., 2005. Cadmium tolerance plasticity in Rhizobium
leguminosarum bv. viciae: glutathione as a detoxifying agent. Canadian Journal of Microbiology 51, 7-
14.
FAO (Food and Agriculture Organization of the United Nations), 2010. Fishery and Aquaculture Statistics
(FAS). Online on
http://www.fao.org/fishery/culturedspecies/Ruditapes_philippinarum/en (Assessed in February of 2014).
FAO (Food and Agriculture Organization of the United Nations) yearbook, 2013. Fishery and Aquaculture
Statistics (FAS), Rome.
FitzGerald, D.M., Fenster, M.S., Argow, B.A. and Buynevich, I.V., 2008. Coastal impacts due to sea‐level rise.
Annual Review of Earth and Planetary Sciences 36, 601‐647.
Flassch J.P., Leborgne Y., 1992. Introduction in Europe, from 1972 to 1980, of the Japanese Manila clam
(Tapes philippinarum) and effects on aquaculture production and natural settlement. ICES Journal of
Marine Science 194, 92-96.
Freitas R., Costa E., Velez C., Santos J., Lima A., Oliveira C., Rodrigues A.M., Quintino V., Figueira E., 2012a.
Looking for suitable biomarkers in benthic macroinvertebrates inhabiting coastal areas with low metal
contamination: Comparison between the bivalve Cerastoderma edule and the Polychaete Diopatra
neapolitana. Ecotoxicology and Environmental Safety 75, 109-118.
Freitas R., Martins R., Campino B., Figueira E., Soares A.M.V.M., Montaudouin X., 2014. Trematodes
communities in cockles (Cerastoderma edule) of Ria de Aveiro (Portugal): influence of a contamination
gradient. Marine Pollution Bulletin 82, 117-126.
References
93
Freitas R., Pinto L.R., Sapaio M., Costa A., Silva M., Rodrigues A.M., Quintino V., Figueira E., 2012b. Effects
of depuration on the element concentration in bivalves: Comparison between sympatric Ruditapes
decussatus and Ruditapes philippinarum. Estuarine, Coastal and Shelf Science 110, 43-53.
Geret F., Bebianno M.J., 2004. Does zinc produce reactive oxygen species in Ruditapes decussatus?
Ecotoxicology and Environmental Safety 57, 399-409.
Geret F., Serafim A., Barreira L., Bebianno M.J., 2002. Response of antioxidant systems to cooper in the gills
of the clam Ruditapes decussatus. Marine Environmental Research 54, 413-417.
Geret F., Serafim A., Bebianno M.J., 2003. Antioxidant enzyme activities, metallothioneins and lipid
peroxidation as biomarkers in Ruditapes decussatus. Ecotoxicology 12, 417-426.
Giménez L., Anger K., 2001. Relationships among salinity, egg size, embryonic development, and larval
biomass in the estuarine crab Chasmagnathus granulata Dana, 1851. Journal of Experimental Marine
Biology and Ecology 260, 241-257.
Giménez L., Torres G., 2002. Larval growth in the estuarine crab Chasmagnathus granulata: the importance
of salinity experienced during embryonic development, and the initial larval biomass. Marine Biology
141, 877-885.
Giménez L., 2003. Potential effects of physiological plastic responses to salinity on population networks of
the estuarine crab Chasmagnathus granulata. Helgoland Marine Research 56, 265-273.
Gómez-Ariza J.L., Giráldez I., Morales E., 2000. Temporal fluctuations of tributyltin in the bivalve Venerupis
decussata at five stations in southwest Spain. Environmental Pollution 108, 279-290.
González F. C., 2012. Marine Biology - Clam Fishery and Aquaculture. Published by Nova Science Publishers,
New York.
Gonçalves A.M.M., Castro B.B., Pardal M.A. & Gonçalves F., 2007. Salinity effects on survival and life history
of two freshwater cladocerans (Daphnia magna and Daphnia longispina). Annales De Limnologie-
International Journal of Limnology 43, 13-20.
Gosling E., 2002. Bivalve molluscs: biology, ecology and culture. Fishing News Books, Oxford.
Gosling E. (Ed.), 2003. Circulation, respiration, excretion and osmoregulation. In: Bivalve Molluscs, Biology,
Ecology and Culture. Blackwell Publishing 201-225.
Graça G., Duarte I. F., Goodfellow B. J., Carreira I. M., Couceiro A. B., Domingues M. R., Spraul M., Tseng L.,
Gil A. M., 2008. Metabolite profiling of human amniotic fluid by hyphenated nuclear magnetic
resonance spectroscopy. Analytical Chemistry 80, 6085-6092.
Griendling K.K., FitzGerald G.A., 2003. Oxidative Stress and Cardiovascular Injury Part I: Basic Mechanisms
and In Vivo Monitoring of ROS. Review: Clinical Cardiology: New Frontiers. Journal of the American
Heart Association 108, 1912-1916.
Guerin J.L., Stickle W.B., 1992. Effects of salinity gradients on the tolerance and bioenergetics of juvenile
blue crabs (Callinectes sapidus) from waters of different environmental salinities. Marine Biology 114,
391-396.
References
94
Günther H., 1998. NMR Spectroscopy: Basic principles, concepts, and Applications in Chemistry.Jonh Wiley
& Sons, 2nd
edition, Chichester.
Habig W.H., Pabst M.J., Jakoby W.B., 1974. Glutathione S-transferases. The first enzymatic step in
mercapturic acid formation. The Journal of Biological Chemistry 249, 7130-7139.
Hall C.J., Burns C.W., 2002. Mortality and growth responses of Daphnia carinata to increases in temperature
and salinity. Freshwater Biology 47, 451-458.
Hamer B., Jakšić Ž., Pavičić-Hamer D., Perić L., Medaković D., Ivanković D., Pavičić J., Zilberberg C.,
Schröderd H.C., Müllerd W.E.G., Smodlakaa N., Batel R., 2008. Effect of hypoosmotic stress by low
salinity acclimation of Mediterranean mussels Mytilus galloprovincialis on biological parameters used
for pollution assessment. Aquatic Toxicology 89, 137-151.
Hamza-Chaffai A., Amiard J.C., Cosson R.P., 1999. Relationship between metallothioneins and metals in a
natural population of the clam Ruditapes decussatus from Sfax coast: a non-linear model using Box-
Cox transformation. Comparative Biochemistry and Physiology, Part C 123, 153-163.
Harkness R.A., Lund R.J., 1983. Cerebrospinal fluid concentrations of hypoxanthine, xanthine, uridine and
inosine: high concentrations of the ATP metabolite, hypoxanthine, after hypoxia. Journal of Clinical
Pathology 36, 1-8.
Hayes J.D., Flanagan J.U., Jowsey I.R., 2004. Glutathione transferases. Annual Review of Pharmacology and
Toxicology 45, 51-88.
Hayes J.D., McLellan L.I., 1999. Glutathione and glutathione-dependent enzymes represent a co-ordinately
regulated defence against oxidative stress. Free Radical Research 31, 273-300.
Hines A., Oladiran G.S., Bignell J.P., Stentiford G.D., Viant M.R., 2007. Direct Sampling of Organisms from
Field and Knowledge of their Phenotype: Key Recommendations for Environmental Metabolomics.
Environmental Science & Technology 41, 3375-3381.
Houghton L.G., Meira Filho L.G., Callander B.A. (Eds.), 1996. Climate change 1995: The science of climate
change. Cambridge University Press, Cambridge.
Hull C.H.J., Tortoriello R.C., 1979. Sea‐level Trend and Salinity in the Delaware Estuary. Delaware River Basin
Commission, 19 p.
ICES (International Council for the Exploration of the Sea), 2011. Report of the working group on
Introduction and Transfers of Marine Organisms (WGITMO), 16 - 18 March, 2011, Nantes, France. ICES
CM 2011/ACOM: 29, 162 p.
IPCC, 2002. Climate change and biodiversity - Technical Paper of Intergovernmental Panel on Climate
Change. IPCC Secretariat, Geneva.
IPCC, 2007. Climate change and water - Technical Paper of the Intergovernmental Panel on Climate Change.
IPCC Secretariat, Geneva. 210pp.
IPCC, 2007. Climate change 2007: synthesis report. In: Core Wroting Team, Pachauri R.K., Reisinger A. (eds).
Contribution of working groups I, II, III to the fourth assessment report of the intergovernamental
panel on climate change. IPCC, Geneva.Kim WS, Huh S–H, Lee TW, 2001. Effects of salinity on
References
95
endogenous rhythm of the Manila clam, Ruditapes philippinarum (Bivalvia: Veneridae). Marine Biology
138, 157-162.
ITIS report. http://www.itis.gov/. Consulted in Maio 2014.
Johnson B.H., Kim K.W., Heath R.E., Hsieh B.B., Butler H.L., 1991. Development and verification of a three-
dimensional numerical hydrodynamic, salinity and temperature model of Chesapeake Bay. Technical
Report HL-91-7, U.S. Army Engineer Waterways Experiment Station.
Kamel N., Jebali J., Banni M., Khedher S.B., Chouba L., Boussetta H., 2012. Biochemical responses and
metals levels in Ruditapes decussatus after exposure to treated municipal effluents. Ecotoxicology and
Environmental Safety 82, 40-46.
Karl T.R., Trenberth K.E., 2003. Modern global climate change. Science 302, 1719-23.
Kay A.L., Jones D.A., Nair S., 2006. RCM rainfall for UK flood frequency estimation. II. Climate change results.
Journal of Hydrology 318, 163-172.
Kim W.S., Huh S.-H., Lee T.W., 2001. Effects of salinity on endogenous rhythm of the Manila clam, Ruditapes
philippinarum (Bivalvia: Veneridae). Marine Biology 138, 157-162.
Kristensen E., Anderson F.Ø., 1987. Determination of organic carbon in marine sediments: a comparison of
two CHN-analyzer methods. Journal of Experimental Biology and Ecology 109, 15-23.
Laemmli U.K., 1970. Cleavage of structural proteins during the assembly of the head of the bacteriophage
T4. Nature (Lond.) 227, 680-685.
Lars H., Johansson L.H., Borg L.A.H., 1988. A spectrophotometric method for determination of catalase
activity in small tissue samples. Analytical Biochemistry 174, 331-336.
Lemon J., 2006. Plotrix: a package in the red light district of R. R-News 6, 8-12.
Leppäkoski E.J., 1991. Introduced species – resource or threat in Brackish-water Seas? Examples from the
Baltic and Black Sea. Marine Pollution Bulletin 23, 219-223.
Liu X., Zhang L., You L., Cong M., Zhao J., Wu H., Li C., Liu D., Yu J., 2011a. Toxicological responses to acute
mercury exposure for three species of Manila clam Ruditapes philippinarum by NMR-based
metabolomics. Environmental Toxicology and Pharmacology 31, 323-332.
Liu X., Zhang L., You L., Yu J., Zhao J., Li L., Wang Q., Li F., Li C., Liu D., Wu H., 2011b. Differential toxicological
effects induced by mercury in gills from three pedigrees of Manila clam Ruditapes philippinarum by
NMR-based metabolomics. Ecotoxicology 20, 177-186.
Liu X., Zhang L., You L., Yu J., Cong M., Wang Q., Li F., Li L., Zhao J., Li C., Wu H., 2011c. Assessment of clam
Ruditapes philippinarum as heavy metal bioindicators using NMR-based metabolomics. Soil, Air, Water
39(8), 759-766.
Livingstone, D.R., 2001. Contaminant-stimulated reactive oxygen species production and oxidative damage
in aquatic organisms. Marine Pollution Bulletin 42, 656-666.
Lopes C.B., Pereira M.E., Vale C., Lillebø I., Pardal M.A., Duarte A.C., 2007. Assessment of spatial
environmental quality status in Ria de Aveiro (Portugal). Scientia Marina 71, 293-304.
References
96
Luedeking A., Koehler A., 2004. Regulation of expression of multixenobiotic resistance (MXR) genes by
environmental factors in the blue mussel Mytilus edulis. Aquatic Toxicology 69, 1-10.
Manduzio H., Rocher B., Durand F., Galap C., Leboulenger F., 2005. The point about oxidative stress in
molluscs. Invertebrate Survival Journal 2, 91-104.
Maria V.L., Bebianno M.J., 2011. Antioxidant and lipid peroxidation responses in Mytilus galloprovincialis
exposed to mixtures of benzo(a)pyrene and copper. Comparative Biochemistry and Physiology, Part C
154, 56-63.
Marnett L.J., Riggins J.N., West J.D., 2003. Endogenous generation of reactive oxidants and electrophiles
and their reactions with DNA and protein. Journal of Clinical Investigation 111, 583-93.
Matias D., Joaquim S., Leitão A., Massapina C., 2009. Effect of geographic origin, temperature and timing of
broodstock collection on conditioning, spawning success and larval viability of Ruditapes decussatus
(Linné, 1758). Aquaculture International 17, 257-271.
Matias D., Joaquim S., Matias A.M., Moura P., Sousa J.T., Sobral P., Leitão A., 2013. The reproductive cycle
of the European clam Ruditapes decussatus (L., 1758) in two Portuguese populations: Implications for
management and aquaculture programs. Aquaculture 406-407, 52-61.
Matozzo V., Monari M., Foschi J., Serrazanetti G.P., Cattani O., Marin M.G., 2007. Effects of salinity on the
clam Chamelea gallina. Part I: alterations in immune responses. Marine Biology 151, 1051-1058.
McEneff G., Barron L., Kelleher B., Paull B., Quinn B., 2014. A year-long study of the spatial occurrence and
relative distribution of pharmaceutical residues in sewage effluent, receiving marine waters and
marine bivalves. Science of the Total Environment 476-477, 317-326.
Melià P., De Leo G.A., Gatto, M., 2004. Density and temperature dependence of vital rates in the Manila
clam Tapes philippinarum: a stochastic demographic model Marine Ecology Progress Series 272, 153-
164.
Melià P., Gatto M., 2005. A stochastic bioeconomic model for the management of clam farming. Ecological
Modelling 184, 163-174.
Milly P.C.D., Wetherald R.T., Dunne K.A., Delworth T.L., 2002. Increasing risk of great floods in a changing
climate. Nature 415, 514–517.
Moraga D., Mdelgi-Lasram E., Romdhane M.S., Abed A.El, Boutet I., Tanguy A., Auffret M., 2002. Genetic
responses to metal contamination in two clams: Ruditapes decussatus and Ruditapes philippinarum.
Marine Environmental Research 54, 521-525.
Moreira M.H., Queiroga H., Machado M.M., Cunha M.R., 1993. Environmental gradientes in a Southern
Europe estuarine system: Ria de Aveiro, Portugal. Implications for soft bottom macrofauna
colonization. Netherlands Journal of Aquatic Ecology 27, 465-482.
Moron M.S., Depierre J.W., Mannervik B., 1979. Levels of glutathione, glutathione reductase and
glutathione S-transferase activities in rat lung and liver. Biochimica et Biophysica Acta 582, 67-78.

References
97
Moschino V., Delaney E., Ros L.D., 2012. Assessing the significance of Ruditapes philippinarum as a sentinel
for sediment pollution: bioaccumulation and biomarker responses. Environmental Pollution 171, 52-
60.
NASA (National Aeronautics and Space Administration), 2010. Practical salinity unit;
http://science.nasa.gov/glossary/practical-salinity-unit/ (Accessed in July 2014).
Navarro J.M., 1988. The effects of salinity on the physiological ecology of Choromytilus chorus (Molina,
1782) (Bivalvia: Mytilidae). Journal of Experimental Marine Biology and Ecology 122, 19-33.
Navarro J.M., Gonzalez C.M., 1998. Physiological responses of the Chilean scallop Argopecten purpuratus to
decreasing salinities. Aquaculture 167, 315-327.
Nelson D.L., Cox M.M., 2005. Lehninger Principles of Biochemistry. 4th
ed. W. H. Freeman & Company.
Nicholls R.J., 2010. Impacts of and responses to sea‐level rise. In: Church J.A., Woodworth P.L., Aarup T.,
Wilson W.S. (Ed.). Understanding sea‐level rise and Variability, Blackwell Publishing Ltd, Wiley, UK, 456
p.
Nicholls R.J., Wong P.P., Burkett V.R., Codignotto J.O., Hay J.E., McLean R.F., Ragoonaden S., Woodroffe
C.D., 2007. Coastal systems and low‐lying areas. In: M.L. Parry M.L., Canziani O.F., Palutikof J.P., van
der Linden P.J., Hanson C.E. (Ed.). Climate Change 2007: Impacts, Adaptation and Vulnerability.
Contribution of Working group II to the Fourth Assessment Report of the Intergovernmental Panel on
Climate Change, Cambridge University Press, Cambridge, UK, 315‐356.
Nielsen S.S., 2010. Phenol-Sulfuric Acid Method for Total Carbohydrates. Food Analysis Laboratory Manual,
Food Science Text Series, 47-53.
Niki E., 2012. Do antioxidants impair signaling by reactive oxygen species and lipid oxidation products? FEBS
Letters 586, 3767-3770.
Occhipinti-Ambrogi A., Savini D., 2003. Biological invasions as a component of global change in stressed
marine ecosystems. Marine Pollution Bulletim 46, 542-551.
Ohkawa H., Ohishi N., Yagi Y., 1979. Assay of lipid peroxides in animal tissue by thiobarbituric acid reaction.
Analytical Biochemistry 95, 351-358
Patrick S., Faury N., Goulletquer P., 2005. Seasonal changes in carbohydrate metabolism and its relationship
with summer mortality of Pacific oyster Crassostrea gigas (Thunberg) in Marennes–Oléron bay
(France). Aquaculture 252, 328-338.
Pierce S.K., Rowland-Faux L.M., O’Brien S.M., 1992. Different salinity tolerance mechanisms in Atlantic and
Chesapeake Bay conspecific oysters: glycine betaine and amino acid pool variations. Marine Biology
113, 107-115.
Pravoni F., Franceschini G., Casale M., Zucchetta M., Torricelli P., Giovanardi O., 2006. An ecological
imbalance induced by a non-native species: the Manila clam in the Venice Lagoon. Biological invasions
8, 595-609.
References
98
Pruell R.J., Lake J.L., Davis W.R., Quinn J.G., 1986. Uptake and depuration of organic contaminants by blue
mussels (Mytilus edulis) exposed to environmentally contaminated sediment. Marine Biology 91, 497-
507.
Quintino V., Rodrigues, A.M., Gentil F., 1989. Assessment of macrozoobenthic communities in the lagoon of
Óbidos, western coast of Portugal. Scientia Marina 53, 645–654.
Rebelo J.E., Pombo L., 2001. Os peixes da Ria de Aveiro. C. M. A. – Pelouro da Cultura.
Reid H.I., Soudant P., Lambert C., Paillard C., Birkbeck T.H., 2003. Salinity effects on immune parameters of
Ruditapes philippinarum challenged with Vibrio tapetis. Diseases of Aquatic Organisms 56, 249-258.
Robinson H.W., Hogden C.G., 1940. The biuret reaction in the determination of serum proteins. Journal of
Chemical Biology 135, 707-725.
Risso-de Faverney C., Lafaurie M., Girard J.P., Rahmani R., 2000. Effects of heavy metals and 3-
methylcholanthrene on expression and induction of CYP1A1 and metallothionein levels in trout
(Oncorhynchus mykiss) hepatocyte cultures. Environmental Toxicology and Chemistry 19, 2239-2248
Rocha C.M., Barros A.S., Gil A.M., Goodfellow B.J., Humpfer E., Spraul M., Carreira I.M., Melo J.B., Bernardo
J., Gomes A., Sousa V., Carvalho L., Duarte I.F., 2010. Metabolic Profiling of Human Lung Cancer Tissue
by 1H High Resolution Magic Angle Spinning (HRMAS) NMR Spectroscopy. Journal of Proteome
Research 9, 319-332.
Rodrigues A.M., Quintino V., Sampaio L., Freitas R., Neves R., 2011. Benthic biodiversity patterns in Ria de
Aveiro, Western Portugal: Environmental-biological relationships. Estuarine, Coastal and Shelf Science
95, 338-348.
Roméo M., Gnassia-Belli M., 1997. Effect of heavy metals on lipid peroxidation in the mediterranean clam
Ruditapes decussatus. Comparative Biochemistry and Physiology, Part C 118, 33-37.
Romano N., Zeng C., 2012. Osmoregulation in decapod crustaceans: implications to aquaculture
productivity, methods for potential improvement and interactions with elevated ammonia exposure.
Aquaculture 334-337, 12-23.
Ruiz G.M., Carlton J.T., Grosholz E.D., Hines A.H., 1997. Global invasions of marine and estuarine habitats by
non-indigenous species: mechanisms, extent, and consequences. American Zoologist 37, 621-632.
Sarà G., Romano C., Widdows J., Staff F.J., 2008. Effect of salinity and temperature on feeding physiology
and scope for growth of an invasive species (Brachidontes pharaonis –MOLLUSCA: BIVALVIA) within
the Mediterranean Sea. Journal of Experimental Marine Biology and Ecology 363, 130-136.
Schuller M. J., 1998. Ostra (Crassostrea sp. and Ostrea sp.) in Manual de Aquacultura, Henriques M.,
Universidade do Porto, 1ª edição, 59-70.
Shumway S., 1977a. Effect of salinity fluctuation on the osmotic pressure and Na+, Ca
2+ and Mg
2+ ion
concentrations in the hemolymph of bivalve molluscs. Marine Biology 41, 153–177.
Shumway S., 1977b. The effects of fluctuating salinity on the tissue water content of eight species of bivalve
molluscs. Journal of Comparative Physiology B 116, 269-285.
Sies H., 1997. Oxidative stress: oxidants and antioxidants. Experimental Physiology 82, 291-295.
References
99
Silva A.Z., Zanette J., Ferreira J.F., Guzenski j., Marques M.,R.F., Bainy A.C.D., 2005. Effects of salinity on
biomarker responses in Crassostrea rhizophorae (Mollusca, Bivalvia) exposed to diesel oil.
Ecotoxicology and Environmental Safety 62, 376-382.
Smaoui-Damak W., Berthet B., Hamza-Chaffai A., 2009. In situ potential use of metallothionein as a
biomarker of cadmium contamination in Ruditapes decussatus. Ecotoxicology and Environmental
Safety 72, 1489-1498.
Solidoro C., Pastres R., Melaku C. D., Pellizzato M., Rossi R., 2000. Modelling the growth of Tapes
philippinarum in the lagoon of Venice. Marine Ecology Progress Series 199, 137-148
Solomon S., Qin D., Manning M., Chen Z., Marquis M., Averyt K.B., Tignor M., Miller H.L., 2007. Climate
change 2007: The physical science basis. Contribution of working group I to the fourth assessment
report of the Intergovernmental Panel on Climate Change. Cambridge University Press, Cambridge,
United Kingdom and New York, NY, USA, 996 p.
Sousa R., Gutiérrez J.L., Aldridge D.C., 2009. Non-indigenous invasive bivalves as ecosystem engineers.
Biological Invasions 11, 2367-2385.
Storey K.B., 1996. Oxidative stress: animal adaptations in nature. Brazilian Journal of Medical and Biological
Research 29, 1715-1733.
Streftaris N., Zenetos A., Papathanassiou E., 2005. Globalisation in Marine Ecosystems: The story of non-
indigenous marine species across European seas. In: Gibson R.N., Atkinson R.J.A., Gordon J.D.M. (eds)
Oceanography and Marine Biology: An Annual Review. Taylor and Francis 43, 419-453
Usero J., González-Regalado E., Garcia I., 1997. Trace metals in the bivalve molluscs Ruditapes decussatus
and Ruditapes philippinarum from the Atlantic coast of Southern Spain. Environment International 23,
291-298
Velasco J., Millán A., Hernández J., Gutiérrez C., Abellán P., Sánchez D., Ruiz M., 2006. Response of biotic
communities to salinity changes in a Mediterranean hypersaline stream. Saline Systems 2, 12.
Veselkov K. A., Lindon J. C., Ebbels T. M. D., Crockford D., Volynkin V. V., Holmes E., Davies D. B., Nicholson
J. K., 2009. Recursive segment-wise peak alignment of biological 1H NMR spectra for improved
metabolic biomarker recovery. Analytical Chemistry 81, 56-66.
Veselkov K. A., Vingara L. K., Masson P., Robinette S. L., Want E., Li J. V., Barton R. H., Boursier-Neyret C.,
Walther B., Ebbels T. M., Pelczer I. N., Holmes E., Lindon J. C., Nicholson J. K., 2011. Optimized
preprocessing of ultra-performance liquid chromatography/mass spectrometry urinary metabolic
profiles for improved information recovery. Analytical Chemistry 83, 5864-5872.
Viarengo A., Canesi L., Pertica M., Poli G., Moore M.N., Orunesu M., 1990. Heavy metal effects on lipid
peroxidation in the tissues of Mytilus galloprovincialis Lam. Comparative Biochemistry and Physiology,
Part C 97, 37-42.
Wakamatsu T.H., Dogru M., Tsubota K., 2008. Tearful relations: oxidative stress, inflammation and eye
diseases. Arquivos Brasileiros de Oftalmologia. 71, 72-79.

References
100
Wang Z., Yan C., Vulpe C.D., Yan Y., Chi Q., 2012. Incorporation of in situ exposure and biomarkers response
in clams Ruditapes philippinarum for assessment of metal pollution in coastal areas from the Maluan
Bay of China. Marine Pollution Bulletin 64, 90-98.
Wheatley R.A., 2000. Some recent trends in the analytical chemistry of lipid peroxidation. Trends in
Analytical Chemistry 19, 617-628.
Whitfield P.E., Hare J.A., David A.W., Harter S.L., Munõz R.C., Addison C.M., 2007. Abundance estimates of
the Indo-Pacific lionfish Pterois volitans/miles complex in the Western North Atlantic. Biological
Invasions 9, 53-64.
Widdows J., Shick J.M., 1985. Physiological responses of Mytilus edulis and Cardmium edule to aerial
exposure. Marine Biology 85, 217.
Wu H., Liu X., Zhao J., Yu J., 2011. NMR-based metabolomic investigations on the differential responses in
adductor muscles from two pedigrees of Manila clam Ruditapes philippinarum to cadmium and zinc.
Marine Drugs 9, 1566-1579.
Wu H., Liu X., Zhang X., Ji C., Zhao J., Yu J., 2013. Proteomic and metabolomic responses of clam Ruditapes
philippinarum to arsenic exposure under different salinities. Aquatic Toxicology 136-137, 91-100.
Yancey P.H., 2005. Organic osmolytes as compatible, metabolic and counracting cytoprotectants in high
osmolarity and other stresses. The Journal of Experimental Biology 208, 2819-2830.
Yoshikawa H., 1959. Glycogen. Tokyo, Rinsho Ikagaku Kyodoisho 150-152.
2000-2004. Global Ballast Water Management Project: The Problem. Online, Available
http://globallast.imo.org/index.asp?page=problem.htm&menu=true

References
101

7. Annexes

Annexes
103

Annexes
104
7.1. Papers on peer reviewed journals (Science Citation Index® (Thompson ISI))
Carregosa V., Figueira E., Gil A.M., Pereira S., Pinto J., Soares A.M.V.M, Freitas R.,
2014. Tolerance of Venerupis philippinarum to salinity: osmotic and metabolic aspects.
Comparative Biochemistry and Physiology - Part A: Molecular & Integrative Physiology 171, 36-
43. IF 2012: 2.167, Percentile 84%
http://dx.doi.org/ 10.1016/j.cbpa.2014.02.009
Carregosa V., Velez C., Pires A., A.M.V.M Soares, Figueira E., Freitas R. (2014). Physiological
and biochemical responses of the Polychaete Diopatra neapolitana to organic matter enrichment.
Aquatic Toxicology 155, 32-42. IF 2012: 3.730, Percentile 97%
http://dx.doi.org/ 10.1016/j.aquatox.2014.05.029
Carregosa V., Velez C., Soares A.M.V.M., Figueira E., Freitas R., 2014. Physiological and
biochemical responses of three Veneridae clams exposed to salinity changes. Comparative
Biochemistry and Physiology - Part B: Biochemistry & Molecular Biology, In Press. IF 2012: 2.069,
Percentile 82%
http://dx.doi.org/ 10.1016/j.cbpb.2014.08.001
Annexes
105
7.2. Participation in International Meetings
7.2.1. Oral Communications
Carregosa V., Figueira E., Gil A., Freitas R., 2013. Tolerance and response of native (Ruditapes
decussatus and Venerupis pullastra) and invasive (Ruditapes philippinarum) clams to salinity
changes. PRIMO’17, Pollutant responses in marine organisms. 5-8 May 2013, Faro, Portugal.
7.2.2. Posters
Carregosa V., Figueira E., Soares A. M. V. M., Freitas R., 2014. Salinity variation: effects on two
clam species, Venerupis decussata and Venerupis philippinarum. ICEH CISA, International Congress
on Environmental Health. 24-26 September 2014, Porto, Portugal. Accepted
Annexes
106
ACI APL09
TOLERANCE AND RESPONSE OF NATIVE (RUDITAPES DECUSSATUS AND VENERUPIS
PULLASTRA) AND INVASIVE (RUDITAPES PHILIPPINARUM) CLAMS TO SALINITY
CHANGES
V. Carregosa1, E. Figueira1, A. Gil2, R.
Freitas3
1Department of Biology, University of Aveiro, 3810-193Aveiro, Portugal
2Department of Chemistry, University of Aveiro, 3810-193 Aveiro, Portugal 3Department of Biology & CESAM, University of Aveiro, 3810-193Aveiro, Portugal *Presenting author: [email protected]
Keywords: Bivalves, environmental changes, biochemical and metabolomics
patterns.
Unlike the concern that has been growing in relation to the impacts of contamination in
marine benthic populations, the responses of aquatic organisms to natural alterations, namely
changes in salinity, have received little attention. In fact, salinity is one of the dominant
environmental factors that most affect marine bivalves, limiting their spatial distribution in the
environment. The ebb and flood of the tide combined with fresh water inputs, from rivers or heavy
rainy periods, and extreme dry seasons can dramatically alter the salinity of water, causing
alterations in the benthic populations, namely intertidal bivalves. Furthermore, salinity of a given
environment will restrict the spatial distribution of the species, which is especially important when
assessing the spread of an invasive species into a new environment. In order to understand how
native (Ruditapes decussatus and Venerupis pullastra) and invasive (R. philippinarum) clam species
cope with salinity changes, biochemical and metabolomic patterns were investigated. The
results obtained showed that Ruditapes species presented high mortality at lower salinities (0, 7)
but tolerate high salinities (35, 42). On the other hand, V. pullastra presented high mortality rates
both at low (0, 7) and high salinities (35, 42). The quantification of Na and K content revealed that,
along the salinity gradient, R. decussatus was the species with higher ability to maintain the ionic
homeostasis. The biochemical parameters also showed that R. decussatus was the clam that
best cope with salinity changes and V. pullastra was the most sensitive. Metabolomic patterns
were obtained by 1H Nuclear Magnetic Resonance (NMR) spectroscopy of clam extracts.
Multivariate analysis of the NMR spectra enabled metabolite changes to be observed in relation to
clam exposure to different salinity concentrations. The relevance of these metabolite change s, in
relation to salinity response and resistance metabolic signatures, is discussed.