Embed Size (px)
Citation preview

Genetic and morphological differentiation of themangrove crab Perisesarma guttatum (Brachyura:Sesarmidae) along an East African latitudinal gradient
INÊS C. SILVA1*, NATACHA MESQUITA2,3 and JOSÉ PAULA1
1Centro de Oceanografia – Laboratório Marítimo da Guia, Faculdade de Ciências da Universidadede Lisboa, Avenida Nossa Senhora do Cabo 939, 2750-374 Cascais, Portugal2Museu Nacional de História Natural, Universidade de Lisboa, Rua da Escola Politécnica 58,1269-102 Lisboa, Portugal3Centro de Biologia Ambiental, Faculdade de Ciências da Universidade de Lisboa, Campo Grande,1749-016 Lisboa, Portugal
Received 3 April 2009; accepted for publication 8 August 2009bij_1338 28..46
The genetic structure and morphometric differentiation of mangrove crab Perisesarma guttatum populationswere examined among shelf connected locations along a latitudinal gradient on the East African coast. Over 2200specimens were sampled from 23 mangrove sites for geometric morphometrics analysis. Population geneticanalyses of mitochondrial cytochrome c oxidase subunit I (COI) DNA sequences were used to evaluate connectivityamong populations. A total of 73 haplotypes were detected, and almost no haplotypes were found in commonbetween two highly supported phylogeographic clades: southern Mozambique (Inhaca Island and Maputo Bay) anda northern clade that included north Mozambique, Tanzania and Kenya. These two clades were identified basedon the species’ populations pairwise genetic differentiation and geographical location. FST values were considerablyhigh between the two clades, indicating the presence of significant population genetic structure between Kenya andSouth Mozambique. However, each clade was composed of genetically similar populations along the latitudinalgradient, and no significant population structure was found within each clade because the FST values were notsignificant. The morphometric analysis corroborated the division into two clades (i.e. Inhaca Island/Maputo Bayand northern populations) and also detected less shape variation among populations that were few kilometresapart. The significant spatial genetic structuring between the southern and the northern populations of P. guttatumalong the geographic gradient under study, combined with morphological differences, suggests that these popula-tions may be considered as cryptic species. © 2010 The Linnean Society of London, Biological Journal of theLinnean Society, 2010, 99, 28–46.
ADDITIONAL KEYWORDS: geometric morphometrics – hydrologic phenomena – larval dispersal – mtDNACOI gene – population structure.
INTRODUCTION
Perisesarma guttatum is an omnivorous speciesusually associated with the root system of Rhizophoramucronata, which, similar to other sesarmid andgrapsid crabs, plays an important role in the ecolo-gical processes related to leaf turnover (Lee, 1998).
However, very little is known about the biology ofmost of these tropical crabs, and even their syste-matic classification is still not settled, despite therecent steps made to clarify phylogenetic relation-ships (Schubart et al., 2006). Furthermore, it shouldbe noted that Perisesarma samawati individuals havebeen considered as P. guttatum until 2004, when P.samawati was described (Gillikin & Schubart, 2004).Accordingly, the majority of the literature dealingwith P. guttatum most likely includes both species*Corresponding author. E-mail: [email protected]
Biological Journal of the Linnean Society, 2010, 99, 28–46. With 7 figures
© 2010 The Linnean Society of London, Biological Journal of the Linnean Society, 2010, 99, 28–4628
(Gillikin & Schubart, 2004). Perisesarma guttatum isendemic to East Africa, occurring from Somalia downto the north coast of South Africa, in Madagascar andin the Red Sea (Vannini & Valmori, 1981).
Perisesarma guttatum has five zoeal stages lastingfrom 22–25 days, and one megalopa stage (Lago,1993). Females release the larvae around the new andfull moons and larvae migrate offshore, most likelybecause of intolerance to the low salinity level ofmangrove waters and to optimize larval dispersal(Flores, Saraiva & Paula, 2002). Larvae in the mega-lopa stage reinvade the mangrove habitat selectivelysettling in nearshore habitats, near their respectiveadult populations (Paula, Dray & Queiroga, 2001).This implies specific and differential transport andthe recognition of appropriate chemical or other envi-ronmental cues for settlement (Paula et al., 2001).Thus, dispersal is expected to occur as a result ofocean currents and the admixture of larvae fromsource populations before recruitment to adulthabitat. Thereby, this life history may promotehigh levels of gene flow and homogenization of localpopulations (Avise, 2004). Nevertheless, physical andbiological factors that promote genetic and morpho-logical differentiation among contiguous populationsare still poorly understood (Dawson, 2001; Waterset al., 2005). Prior research on crustacean decapods(Fratini & Vannini, 2002; Gopurenko & Hughes,2002) has indicated a restriction in gene flow andan inferred lack of interpopulation dispersal, evenbetween geographically close sites, despite the highpotential for dispersal. The opposite genetic pattern,however, characterized by low levels of populationdifferentiation as a result of high larval dispersalcapacity and recent common ancestry of haplotypes,can also be found in crabs (Cassone & Boulding,2006).
Oceanic currents can have different effects on thegenetic structure of marine populations. They can beresponsible for the dispersion of planktonic larvae,acting as gene-exchange corridors or, alternatively,can constitute extrinsic and invisible physical bar-riers to gene flow (Palumbi, 1994). Along the EastAfrican coastline, three main current systems influ-encing the coast can affect the dispersal potential ofplanktonic larvae (Lutjeharms, 2006): (1) the warmAgulhas Current, which flows southwards fromMozambique along the eastern coast of South Africa;(2) the Mozambique Current, through the Mozam-bique Channel, with a contribution coming from eastof Madagascar, the East Madagascar Current; and(3) the Equatorial Convergence, which at the southcoast of Tanzania splits, proceeding northwards andsouthwards along the Tanzanian and Mozambicancoastlines. In particular, the Agulhas Current hasa marked influence on the distribution of a number of
species in the South West Indian and South AtlanticOceans (Lutjeharms, 2006). First, certain species mayhave evolved adaptations to the Agulhas Currentsystem, using it as a mean of transportation duringtheir particular life cycles; second, the current maycarry organisms such as larvae within its waters(Lutjeharms, 2006).
Several studies have combined molecular and mor-phological characters to analyse population structure(Jordaens, van Riel & Backeljau, 2003; Pinheiro et al.,2005; Sousa et al., 2007; Vasconcellos et al., 2008).The combined use of genetic and morphological dataallows the interpretation of patterns of variabilityand also the recognition (or not) of discrete groupsof individuals along coastal areas. Contradictoryinformation can arise, however, from genetic and mor-phological data. In particular, phenotypic plasticity,defined as the production of multiple phenotypes froma single genotype depending on environmental condi-tions (Miner et al., 2005), can occur. As an example,Silva & Paula (2008) showed that phenotypic varia-tion observed in the chelae of Carcinus maenas andPachygrapsus marmoratus was not corroborated bymitochondrial (mt)DNA genetic data. Other examplesof observed morphological differentiation not yet sup-ported by molecular markers include closely-relatedspecies of brachyuran crabs (Reuschel & Schubart,2006) and varunid crabs (Spivak & Schubart, 2003),and the UK populations of the shore crab Carcinusmaenas (Brian et al., 2006). In this latter study, theauthors suggested that the pattern of morphologicalvariability of the species was largely determined bylocal environmental conditions. On the other side,morphological similarity might be a misleading mea-surement of relatedness among specimens, as demon-strated by Schizas et al. (1999) for the copepod genusMicroarthridion along the south-eastern and Gulfcoasts of the USA. In this case, morphological simi-larities as a result of convergent evolution withinsimilar habitat constraints masked genetic differ-ences among these copepods. Consequently, it isimportant to combine morphometric and geneticanalyses when comparing populations to obtain amore correct and complete view about the basis oftheir differentiation.
In the present study, a morphological and mtDNAsurvey of adult P. guttatum populations sampled in23 mangrove sites along a geographical gradient ispresented. Carapace morphology and genetic varia-tion were examined among these natural populationsof P. guttatum along the East African coast, aiming toreveal the levels of population diversity and differen-tiation along a latitudinal cline. The convergence ofthe morphological and genetic results obtained withrespect to the species population structure was alsoanalysed. Phylogeographical analyses and statistical
GENETIC AND MORPHOLOGICAL DIFFERENTIATION OF P. GUTTATUM 29
© 2010 The Linnean Society of London, Biological Journal of the Linnean Society, 2010, 99, 28–46
comparisons among populations were also made toassess possible patterns in population differentiation.
MATERIAL AND METHODSSAMPLING COLLECTION
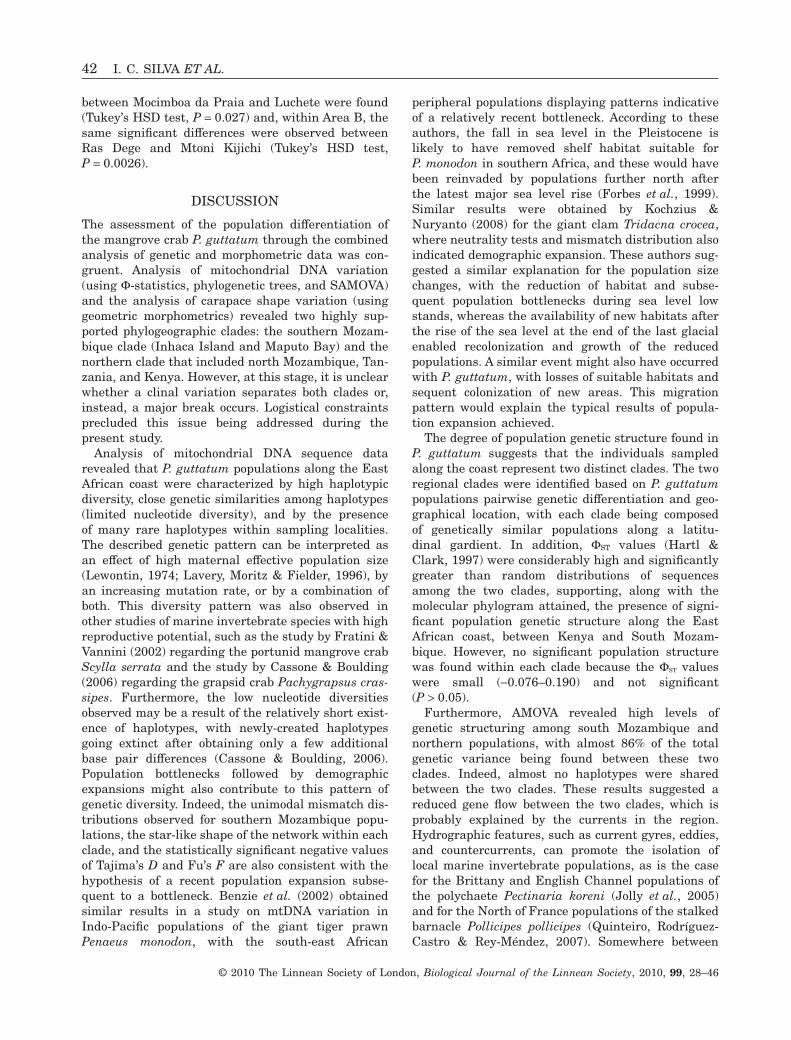
Sampling was conducted on the East African coast,between Mozambique and Kenya, along a greater than3000 km geographical gradient, between July 2005and September 2006. A nested sampling design wasadopted along the geographical region under analysis,including six study areas (areas A, B, C, D, F, and H;Fig. 1), each one with different sampling sites (three tofive replicates), and single sampling points (Fig. 1E,G). Study areas were several hundreds of kilometresapart, whereas sites within each area were fromkilometres to tens of kilometres apart. The scale wasthus nominally defined as 100s km and 10s km. A totalof 22 sites were sampled for the genetic analysis and23 for the morphometric analysis. Fifty males and50 females of P. guttatum were collected at each siteby hand during spring low tides, in the margins ofmangrove creeks. Whole specimens were shipped inabsolute ethanol to the laboratory. Distances amongpopulations were measured by following coastlines andusing the software package ARCVIEW, version 3.2(Environmental Systems Research Institute).
GENETIC ANALYSIS
DNA was isolated directly from pereiopods for asubset of samples. Tissues were incubated at 38 °Covernight in 500 mL of extraction buffer (100 mMTris-HCl, 10 mM EDTA, 100 mM NaCl, 0.1% SDS)and 3 mL of 20 mg mL-1 proteinase K. Total genomicDNA extractions were performed using sequentialphenol–chloroform extraction steps, as described byHillis et al. (1996). The DNA obtained was resus-pended in low TE buffer (10 mM, pH 8.0, Tris-HCl,0.1 mM, pH 8.0, EDTA).
A 651-bp fragment of the mtDNA cytochrome coxidase subunit I (COI) gene was amplified by poly-merase chain reaction (PCR) using the primers devel-oped by Folmer et al. (1994) (LCO1490 5′-GGT CAACAA ATC ATA AAG ATA TTG G-3′, HCO2198 5′-TAAACT TCA GGG TGA CCA AAA AAT CA-3′). Each25-mL PCR reaction included: 0.5 mM of each primer,3.0 mM MgCl2, 0.2 mM dNTPs, 2.5 mL 10 ¥ reactionbuffer, 0.25 mL of dimethyl sulphoxide, 0.2 U of TaqDNA polymerase (Fermentas) and 1 mL of DNA. ThePCR thermal cycling conditions consisted of 35 cycles,with the profile: 94 °C denaturation for 60 s; 50 °Cannealing for 60 s, and 72 °C extension for 2 min. Thecycles were preceded by a 2-min denaturation step;then were finalized with an additional extensionstep of 2 min. All PCR products were checked for the
presence of correctly sized products on 1% agarosegels. Previous to sequencing, the PCR products werepurified using the Exo-Sap DNA clean-up protocol.Samples were sequenced in the forward direc-tion using an ABI PRISM 3700 DNA analyser atMacrogen (http://www.macrogen.com). Uca pugila-tor (AF466700) and Eriocheir japonica sinensis(AY27430223) sequences were obtained from molecu-lar database (http://ncbi.nlm.nih.gov/) and used as theoutgroup. Sequences were aligned and edited usingthe software BIOEDIT, version 7.0.5.3 (Hall, 1999).
Population genetic statistics was estimated usingthe software DNASP, version 4.50 (Rozas et al., 2003).The level of polymorphism for each population wasestimated as haplotype diversity (h) and nucleo-tide diversity (p). Nucleotide sequence evolutionmodels were evaluated using the likelihood-ratiotests implemented by MODELTEST (HYPHY; Posada& Crandall, 1998) (available at: http://phylemon.bioinfo.cipf.es). Akaike based model selection and hier-archical model testing were used to select the evolu-tionary model that best fitted the data set (Posada &Crandall, 1998). The inferred evolutionary model(GTR+I+G) was used to estimate pairwise geneticdistances among haplotypes. Phylogenetic trees wereconstructed using Neighbour-joining (NJ) genetic dis-tances and maximum parsimony (MP) methods, imple-mented in PAUP* (Swofford, 1998). MP analysis wasperformed using a heuristic search with a tree-bisection-reconnection branch-swapping algorithmand random stepwise sequence adding with ten repli-cates. For both NJ and MP analysis, the stability of thenodes was tested by 1000 bootstrap replicates. Median-joining networks (Bandelt, Forster & Röhl, 1995) wereconstructed using the software NETWORK, version4.5.0.1 (Shareware Phylogenetic Network Soft-ware Web site; http://www.fluxus-engineering.com/sharenet.htm). The resulting network is a combinationof minimum spanning trees, with median vectors(consensus sequences) added by a parsimony criterion.
An analysis of molecular variance (AMOVA) wasperformed using ARLEQUIN, version 3.11 (Excoffier,Laval & Schneider, 2005) to assess patterns of geneticdifferentiation among populations. This analysis pro-duces estimates of variance components similar toF-statistics, reflecting the correlation of haplotypesat different levels of hierarchical subdivision. Toassess genetic distances among populations, pairwiseFST values were calculated using ARLEQUIN, version3.11 (Excoffier et al., 2005) and associated probabilityvalues were calculated using 10 000 permutations.Population genetic structure was also exploredthrough the spatial analysis of molecular variance(SAMOVA) approach (Dupanloup, Schneider &Excoffier, 2002), which defines groups of populationsthat are geographically homogeneous and maximally
30 I. C. SILVA ET AL.
© 2010 The Linnean Society of London, Biological Journal of the Linnean Society, 2010, 99, 28–46

Figure 1. Sampling locations for Perisesarma guttatum in the East African coast. Area A: Mikindani (Mi), Gazi (G),Shirazi (Sh); Area B: Makoba (Mak), Kunduchi (K), Mtoni Kijichi (MK); Ras Dege (RD); Area C: Mikindani Bay (MiB),Mnazi Bay (MB); Ruvuma Estuary (RE); Area D: Mocimboa da Praia (MP), Ulo (U), Luchete (Lu); Point E: Ibo (I); AreaF: Olondo (O), Pemba (P), Mecúfi (Me); Point G: Nacala Velha (NV); Area H: Inkomati (Ink), Costa do Sol (CS), Sangala(Sa), Saco (S), Ponta Rasa (PR).
GENETIC AND MORPHOLOGICAL DIFFERENTIATION OF P. GUTTATUM 31
© 2010 The Linnean Society of London, Biological Journal of the Linnean Society, 2010, 99, 28–46

differentiated from each other. This analysis wasperformed with the software SAMOVA, version 1.0(Dupanloup et al., 2002).
To assess whether genetic differentiation could beexplained by geographical distance (isolation by dis-tance), values of FST/(1 - FST) were plotted againstgeographical distances for each pair of populations.The significance of correlation between genetic andgeographical matrices was tested by the MantelZ-test (Mantel, 1967), with 10 000 iterations, usingMANTEL, version 1.18 (Cavalcanti, 2005). Tajima’sD was calculated to assess evidence for populationexpansion, as well as Fu’s test of neutrality (FS).Significant negative values of Tajima’s D and Fu’s FS
are considered to comprise evidence of expandingpopulations. Mismatch distributions were constructedin ARLEQUIN, version 3.11. The shapes of the mis-match distributions were used to deduce whethera population has undergone population expansion(Rogers & Harpending, 1992). Populations that havebeen historically stable are predicted to have multi-modal mismatch distributions, whereas those thathave undergone a recent expansion are predicted tobe unimodal (Slatkin & Hudson, 1991).
MORPHOMETRIC ANALYSIS
Perisesarma guttatum body shape was quantified us-ing landmark-based geometric morphometric methods(Rohlf & Marcus, 1993). A Nikon D70 digital camerawith a 55-mm micro lens was used to take imagesof all specimens with consistent capture methods.Twelve homologous points were digitized on thecarapace using the software TPSDIG, version 2.10(Rohlf, 2006) (Fig. 2). These landmarks were chosen
for their capacity to capture overall body shape. Be-cause crustaceans have allometric growth, TPSREGR,version 1.34 (Rohlf, 2007a) was used to evaluate therole of allometry in shape variation. When detected,allometry was removed by the regression of eachshape variable (the relative warps) against a measureof body size and estimating residual shape variation.To obtain shape variables, nonshape variation in thelandmark coordinates was removed via generalizedprocrustes analysis (Rohlf & Slice, 1990). This analysisremoved nonshape variation by scaling all specimensto unit size, translating them to a common location,and rotating them so that their corresponding land-marks line up as closely as possible (Kassam et al.,2003). From the aligned specimens, shape variableswere generated via relative warp analysis (Bookstein,1991). These new sets of data were then treated as aset of shape variables for statistical comparisons ofshape variation within and among groups. The aboveprocedures were implemented in TPSRELW, version1.45 (Rohlf, 2007b).
To determine patterns of morphometric differentia-tion among areas, a multivariate analysis of variance(MANOVA) was performed on the relative warpsscores. After assessing the degree of variation amongareas, differentiation among populations and withinareas was also determined, undergoing pairwise com-parisons with the post-hoc Tukey’s honestly signi-ficant difference (HSD) test. A canonical varianceanalysis was also performed on the relative warpscores to provide an ordination of all the specimensin a morphological space (Kassam et al., 2003).Classification was used to determine whether or notcanonical functions were effective in discriminatingamong groups. Shape differences were describedusing thin-plate spline deformation grids, generatedin TPSRELW (Rohlf, 2007b). These procedures wereexecuted in STATISTICA, version 6.0 (StatSoft Inc.).
RESULTS
Because of insufficient sampling size, probablyrelated to preservation problems, genetic analysiswas not carried out for the Inkomati population. Asa result, the Costa do Sol population was includedin Area H, thus forming an area constituted by theInhaca Island and Maputo Bay populations. Thissame grouping pattern was maintained in themorphometric analysis, but also including Inkomatispecimens in Area H (Fig. 1).
GENETIC ANALYSIS
The alignment of the 651-bp sequences was straight-forward, with no indels or stop codons detected uponputative translation into aminoacids. A total of 73
1
11
6 5
4
32
10
9
8 7
12
Figure 2. Perisesarma guttatum. Position of the 12 land-marks on the carapace.
32 I. C. SILVA ET AL.
© 2010 The Linnean Society of London, Biological Journal of the Linnean Society, 2010, 99, 28–46

distinct COI haplotypes were identified for the 292specimens assayed, and 58 positions were variable,of which 30 were parsimony informative. The averagenumber of transitions and transversions were 3.74and 1, respectively, and the average transition/transversion ration was 1.99. Fifty-four haplotypes(73.97%) were unique, accounting for 18.49% of theoverall specimens. Haplotype 1 was almost exclusiveof Area H (Fig. 1H) and accounted for 80.3% of thetotal specimens sampled in this area. Indeed, allhaplotypes identified in the southernmost area(Fig. 1H) were restricted to this area, with the excep-tion of haplotype 1 that was shared with NacalaVelha, a transition site (Fig. 1). Considering all indi-viduals, the most common haplotype was haplotype13, which represented 82 of the 292 specimens analy-sed and was restricted to the Mikindani to NacalaVelha areas (Fig. 1A, B, C, D, E, F, G). The distribu-tion of haplotypes per population is summarized inTable 1.
The levels of within-population genetic diversityvaried considerably among populations, with haplo-type diversity (h) in the range 0.292–1.000 andnucleotide diversity (p) in the range 0.0005–0.0079.Nevertheless, two clades of populations can be definedaccording to the levels of within-population geneticdiversity: a southern clade, comprising Ponta Rasa,Saco, Sangala (Inhaca Island, Mozambique), andCosta do Sol (Maputo Bay, Mozambique), with lowerdiversity levels (h = 0.292–0.562; p = 0.0005–0.0010);and a northern clade, from Nacala Velha (Mozam-bique) to Mikindani (Kenya), with higher diversitylevels (h = 0.643–1.000; p = 0.0027–0.0079).
Concerning among-populations genetic structure,the phylogenetic clustering of COI haplotypes usingboth NJ and MP methods revealed identical treetopologies and levels of bootstrap support for all sup-ported nodes (Fig. 3). Two well-supported clades werefound, matching the two clades identified in the popu-lation genetic diversity analysis (southern clade andnorthern clade), and no significant genetic structurewas found within each clade. Nacala Velha, the south-ernmost population in the northern clade, presentedonly one haplotype in common with the southernclade (haplotype 1). In another population from thenorthern clade, Ulo, a haplotype belonging to thesouthern evolutionary lineage was also observed.
The network reconstruction also revealed the exist-ence of these two well-supported clades (Fig. 4). Clade1 contains exclusively individuals from the southernpopulations, with the exception of one specimen fromNacala Velha (the southernmost population from thenorth clade) and one specimen from Ulo, whereasclade 2 contains exclusively individuals from thenorthern populations. Regarding the levels of geneticdifferentiation among populations the same pattern
was found. Pairwise FST values were high (0.834–0.955) and significant (P < 0.05) among populationsfrom different clades (southern and northern), andlow (-0.075–0.190) and nonsignificant (P > 0.05)among populations from the same clade (Table 2). Thesame pattern was found for the average values ofgenetic distance among populations (Table 2): higherfor between clade comparisons (2.32%–2.75%) andlower for within clade comparisons (0.05%–0.72%).Additionally, with respect to the values of geneticdistance among populations within clades, the popu-lations within the northern clade were more differen-tiated among each other (0.28%–0.72%), comparedto the level of genetic differentiation found among thepopulations of the southern clade (0.05%–0.08%).
In view of the two distinct phylogeographic cladesconsistently supported (the southern, from PontaRasa to Costa do Sol, and the northern, from NacalaVelha to Mikindani) a hierarchical analysis of thegenetic variation (AMOVA) was made considering thisstructure. In accordance, the apportioning of totalvariance results indicated that the large majorityof the genetic variance was found between clades(85.99%), almost none among populations withinclades (0.17%), and a few within populations(13.84%). Moreover, the FST and the FCT values werehigh (0.862 and 0.860, respectively) and significant(P < 0.05), indicating high genetic differentiationamong populations (for the total populations) andbetween clades, respectively, whereas the FSC valuewas reduced (0.012) and nonsignificant (P > 0.05),indicating low genetic differentiation among popula-tions within clades. The SAMOVA algorithm was usedto investigate the hypothesis of finding populationgroups using not only the genetic information, butalso its combination with the geographic locationof those populations. A search for two significantlydifferentiated population clusters revealed one groupconsisting of the southern Mozambique populations(Ponta Rasa, Saco, Sangala, Costa do Sol), and asecond group consisting of the remaining sampledpopulations. This analysis was performed severaltimes by increasing the user-defined number ofgroups. The cluster formed by the southern Mozam-bique populations did not collapse with the increasein the number of groups and the northern cluster wasbroken progressively. Populations were not, however,grouped according to the pre-defined sampling areas.Indeed, the results of AMOVAs, considering this popu-lation structure and with an increase numbers ofgroups, presented low (and nonsignificant) valuesof FCT.
The full COI data set indicated a positive andsignificant trend between genetic divergence andgeographic distance (multiple regression analysis:R2 = 0.401; P < 0.001) because values of FST among all
GENETIC AND MORPHOLOGICAL DIFFERENTIATION OF P. GUTTATUM 33
© 2010 The Linnean Society of London, Biological Journal of the Linnean Society, 2010, 99, 28–46

Pg H44 Pg H57
Pg H21 Pg H62
Pg H13 Pg H54 Pg H19 Pg H31 Pg H40 Pg H51 Pg H39 Pg H43 Pg H41 Pg H69 Pg H72 Pg H68 Pg H52 Pg H56 Pg H23 Pg H65 Pg H61 Pg H71
Pg H22 Pg H25
Pg H42 Pg H47 Pg H37 Pg H73
Pg H16 Pg H63 Pg H18 Pg H29 Pg H55 Pg H64 Pg H67
Pg H35 Pg H46
Pg H48 Pg H24 Pg H70
Pg H49 Pg H28
Pg H20 Pg H58 Pg H32 Pg H34 Pg H15 Pg H66
Pg H14 Pg H38 Pg H26 Pg H27 Pg H33
Pg H36 Pg H50 Pg H60
Pg H17 Pg H30 Pg H53
Pg H59 Pg H6 Pg H45 Pg H11 Pg H10 Pg H8 Pg H12 Pg H7 Pg H9
Pg H1 Pg H5 Pg H3 Pg H2 Pg H4
Uca pugilator Eriocheir japonica sinensis
6664
Northern Group
(Nacala Velha to Mikindani)
Southern Group
(Ponta Rasa to Costa Sol)
Ulo specimen
Nacala Velha specimen
0.02
6575
9372
9787
100
100
Figure 3. Phylogenetic relationships among cytochrome c oxidase subunit I haplotypes of the 22 populations ofPerisesarma guttatum using Neighbour-joining (NJ) and maximum parsimony (MP) methods. Bootstrap values (NJ/MP)are, respectively, given above and under lines.
34 I. C. SILVA ET AL.
© 2010 The Linnean Society of London, Biological Journal of the Linnean Society, 2010, 99, 28–46

Tab
le1.
Nu
mbe
rof
hap
loty
pes
per
popu
lati
onfo
rP
eris
esar
ma
gutt
atu
mfo
ra
frag
men
tof
the
cyto
chro
me
cox
idas
esu
bun
it1
gen
em
itoc
hon
dria
lD
NA
Loc
alit
ies
PR
SS
aC
SN
VM
eP
OI
Lu
UM
PR
EM
BM
iBR
DM
KK
Mak
Sh
GM
iN
°sp
ecim
ens
Hap
loty
pedi
vers
ity
0.37
10.
562
0.33
10.
292
0.77
80.
873
0.87
40.
801
0.86
0.64
30.
867
1.00
0.90
50.
891.
000.
933
0.91
71.
000.
795
0.66
70.
833
0.8
0.77
2
Nu
cleo
tide
dive
rsit
y0.
001
0.00
10.
001
0.00
10.
008
0.00
40.
004
0.00
50.
004
0.00
30.
007
0.00
60.
005
0.00
40.
005
0.00
40.
005
0.00
60.
004
0.00
30.
005
0.00
30.
004
Nu
mbe
rof
hap
loty
pes
44
52
66
1212
910
104
67
127
75
76
59
73
Nu
mbe
rof
spec
imen
s15
1715
1910
1120
2217
816
1021
107
109
513
1210
1529
2
H1
1214
1016
153
H2
11
H3
11
H4
12
3H
51
1H
62
2H
71
1H
81
1H
91
1H
101
1H
111
1H
121
1H
135
37
106
16
53
16
23
65
67
82H
141
11
11
22
110
H15
11
21
11
7H
161
33
11
22
11
15H
171
23
11
11
12
31
12
11
22H
181
1H
191
1H
201
12
11
17
H21
11
H22
11
H23
11
H24
11
2H
251
11
11
16
H26
11
H27
11
H28
11
H29
11
H30
12
11
4H
311
1H
321
1H
331
1H
341
11
11
5H
351
12
11
11
8
GENETIC AND MORPHOLOGICAL DIFFERENTIATION OF P. GUTTATUM 35
© 2010 The Linnean Society of London, Biological Journal of the Linnean Society, 2010, 99, 28–46

Tab
le1.
Con
tin
ued
Loc
alit
ies
PR
SS
aC
SN
VM
eP
OI
Lu
UM
PR
EM
BM
iBR
DM
KK
Mak
Sh
GM
iN
°sp
ecim
ens
H36
11
H37
11
H38
22
H39
11
H40
11
H41
11
H42
11
H43
11
H44
11
H45
11
H46
11
H47
11
H48
11
2H
491
12
H50
11
2H
511
1H
521
1H
531
1H
541
1H
551
1H
561
1H
571
1H
581
1H
591
1H
601
11
3H
611
1H
621
1H
631
1H
641
1H
651
1H
661
1H
671
1H
681
1H
691
1H
70H
711
1
H72
11
H73
11
Hap
loty
pedi
vers
ity
0.37
10.
562
0.33
10.
292
0.77
80.
873
0.87
40.
801
0.86
0.64
30.
867
1.00
0.90
50.
891.
000.
933
0.91
71.
000.
795
0.66
70.
833
0.8
0.77
2
Nu
cleo
tide
dive
rsit
y0.
001
0.00
10.
001
0.00
10.
008
0.00
40.
004
0.00
50.
004
0.00
30.
007
0.00
60.
005
0.00
40.
005
0.00
40.
005
0.00
60.
004
0.00
30.
005
0.00
30.
004
Nu
mbe
rof
hap
loty
pes
44
52
66
1212
910
104
67
127
75
76
59
73
Nu
mbe
rof
spec
imen
s15
1715
1910
1120
2217
816
1021
107
109
513
1210
1529
2
For
the
com
plet
en
ames
and
loca
tion
sof
the
sam
plin
gsi
tes,
see
Fig
.1.
36 I. C. SILVA ET AL.
© 2010 The Linnean Society of London, Biological Journal of the Linnean Society, 2010, 99, 28–46

population pairs increased with increasing geogra-phical separation (Mantel test significant: Z = 0.917;P = 0.001) (Fig. 5). When the Mantel test was per-formed among the northern populations (from NacalaVelha to Mikindani), no significant relationship be-tween FST and geographical separation was observed(Z = -0.0085; P = 0.129).
Populations from Inhaca Island (Ponta Rasa, Sacoand Sangala) and from Ulo had negative values forTajima’s D that deviated significantly from zero(Table 3). None of the other populations had a signifi-cant value of Tajima’s D and Mecufi and Luchetepopulations had positive and not statistically signifi-cant values. Large significant negative values of FS
were observed for several populations: the InhacaIsland populations, Costa do Sol, Pemba, Olondo, Ibo,Luchete, Mnazi Bay, Mikindani Bay, and Mikindani(Table 3). Only Nacala Velha had a positive value.The results of the Fu’s tests were consistent with datafrom Tajima’s D-tests.
Six separate assemblages of mismatch distributionswere constructed: southern Mozambique (Area H),Area F, Area D, Area C, Area B, and Kenya (Area A)(Fig. 6). Mismatch distributions of southern Mozam-bique showed a smooth and unimodal curve, suggest-ing that a sudden population expansion had occurred.The remaining assemblages generated uneven distri-butions, which is consistent with a lack of populationexpansion.
MORPHOMETRIC ANALYSIS
Shape analysis showed carapace differences amongpopulations and among groups. Analyses performedon males revealed that the first relative warp (RW1)explained 46.71%, the second (RW2) 17.5%, and thethird (RW3) 8.03%, explaining 72.24% of the variancein total. The first axis revealed shape variation in therostrum and on the distance between landmarks 3 and6, corresponding to a rounding of the region defined bylandmarks 3, 4, 5, and 6. RW2 explained shape varia-tion in the lateral-posterior zone of the carapace, andRW3 accounted differences as a result of variationin the carapace width. The same variation patternwas observed in females, with the first three axesexplaining 41.64%, 16.36%, and 13.33%, respectively.
MANOVA revealed significant differences among thesampling areas (males: Wilks’ l = 0.367, F = 10.171;P < 0.0001; females: Wilks’ l = 0.295, F = 12.091;P < 0.0001), being well discriminated. Figure 7 showsthe distribution of individuals along the first twocanonical axes and, at the top and along the plots,splines relative to the non-uniform component (theoverall set of relative warps) are visualized. It can beseen that the medium shape from Area H was moreconcave, and the distance between the lateral spinesand the rostrum is smaller. These differences wereclearer in the males.
Considering the sampling areas, for males, correctclassification was 31.3% for Area A, 53% for Area B,60.8% for Area C, 41.2% for Area D, 41.3% for AreaF and, finally, 71% for Area H. The overall rate ofindividuals correctly classified into areas was 49.8%,which is better than random assignment (tau statis-tics = 47.4%). When analysing each population sepa-rately, 40.2% of specimens were correctly classifiedinto groups. Nevertheless, individuals that were notcorrectly classified were grouped in the contiguouspopulations and not in a different area. A similarpattern of correct classification was observed infemales (Area A, 30.8%; Area B, 48.5%; Area C, 54.1%;Area D, 52.6%; Area F, 33.6%; Area H, 78.1%). In thiscase, correct classification accounted for 49.6% whenconsidering the overall analysis, which is slightlybetter than chance (tau statistics = 48.8%).
The comparisons made among areas, obtained withthe post-hoc Tukey’s HSD test, showed that Area Hwas significantly different from the other areas, whenthe shape variables considered comprised the firstthree relative warps. The comparisons made betweenthe Areas A, B, C, D, and F resulted in the absence ofsignificant differences between the Areas that werecloser together. Thus, the shape variation explainedby the RW1 presented significant differences betweenAreas D–F and Area A, and RW2 presented signifi-cant differences between Area D and Areas A–B.
Clade 2
Clade 1
Figure 4. Network of phylogenetic relationships amongall haplotypes. The area of the circle is proportional tohaplotype frequency, whereas line length is proportionalto the number of mutational steps.
GENETIC AND MORPHOLOGICAL DIFFERENTIATION OF P. GUTTATUM 37
© 2010 The Linnean Society of London, Biological Journal of the Linnean Society, 2010, 99, 28–46

Tab
le2.
FS
Tan
dge
net
icdi
stan
ceam
ong
popu
lati
ons
PR
Sa
SC
SN
VM
EP
OI
MP
UL
UM
IBR
EM
BR
DM
KK
MA
KG
SH
MI
PR
0.08
%0.
07%
0.05
%2.
35%
2.68
%2.
62%
2.57
%2.
75%
2.65
%2.
54%
2.48
%2.
62%
2.53
%2.
49%
2.65
%2.
53%
2.70
%2.
68%
2.67
%2.
56%
2.69
%
Sa
0.01
8*0.
08%
0.08
%2.
33%
2.64
%2.
59%
2.54
%2.
71%
2.62
%2.
51%
2.44
%2.
58%
2.51
%2.
45%
2.63
%2.
51%
2.68
%2.
65%
2.63
%2.
53%
2.66
%
S0.
001*
0.01
4*0.
06%
2.32
%2.
62%
2.58
%2.
53%
2.70
%2.
60%
2.50
%2.
43%
2.57
%2.
49%
2.44
%2.
62%
2.40
%2.
66%
2.64
%2.
62%
2.52
%2.
65%
CS
-0.0
24*
0.03
7*0.
018*
2.34
%2.
65%
2.60
%2.
57%
2.73
%2.
63%
2.53
%2.
45%
2.60
%2.
53%
2.48
%2.
64%
2.52
%2.
69%
2.68
%2.
66%
2.55
%2.
67%
NV
0.84
00.
834
0.85
30.
864
0.61
%0.
59%
0.60
%0.
62%
0.54
%0.
67%
0.66
%0.
60%
0.58
%0.
63%
0.60
%0.
62%
0.71
%0.
59%
0.55
%0.
61%
0.59
%
ME
0.92
00.
914
0.92
50.
932
-0.0
17*
0.44
%0.
43%
0.42
%0.
38%
0.53
%0.
48%
0.43
%0.
43%
0.50
%0.
42%
0.49
%0.
48%
0.42
%0.
39%
0.46
%0.
40%
P0.
898
0.88
90.
902
0.90
7-0
.025
*0.
018*
0.42
%0.
44%
0.35
%0.
52%
0.51
%0.
42%
0.41
%0.
48%
0.43
%0.
45%
0.55
%0.
42%
0.38
%0.
43%
0.41
%
O0.
885
0.88
30.
890
0.89
7-0
.034
*0.
006*
-0.0
20*
0.46
%0.
36%
0.55
%0.
50%
0.44
%0.
42%
0.47
%0.
44%
0.46
%0.
54%
0.43
%0.
39%
0.45
%0.
42%
I0.
911
0.90
10.
915
0.92
10.
014*
-0.0
22*
0.03
1*0.
044*
0.35
%0.
51%
0.52
%0.
46%
0.43
%0.
51%
0.41
%0.
51%
0.50
%0.
41%
0.35
%0.
49%
0.39
%
MP
0.94
70.
938
0.95
20.
955
-0.0
39*
0.03
5*-0
.031
*-0
.001
*-0
.001
*0.
45%
0.47
%0.
39%
0.37
%0.
45%
0.35
%0.
40%
0.51
%0.
33%
0.29
%0.
39%
0.32
%
U0.
856
0.84
70.
864
0.87
1-0
.059
*-0
.024
*-0
.013
*-0
.013
*-0
.021
*-0
.046
*0.
60%
0.55
%0.
53%
0.60
%0.
52%
0.57
%0.
63%
0.52
%0.
46%
0.57
%0.
50%
LU
0.89
10.
881
0.89
80.
904
-0.0
37*
0.00
0*0.
022*
-0.0
12*
0.08
30.
101*
0.01
1*0.
51%
0.49
%0.
53%
0.51
%0.
51%
0.56
%0.
52%
0.49
%0.
50%
0.51
%
MIB
0.89
00.
882
0.89
40.
898
-0.0
21*
-0.0
25*
-0.0
18*
-0.0
25*
0.03
3*0.
007*
-0.0
03*
-0.0
08*
0.44
%0.
49%
0.45
%0.
45%
0.55
%0.
44%
0.42
%0.
43%
0.44
%
RE
0.91
70.
904
0.92
00.
925
-0.0
51*
0.01
0*-0
.058
*-0
.043
*0.
050*
0.02
6*-0
.019
*-0
.032
*-0
.043
*0.
47%
0.44
%0.
44%
0.56
%0.
43%
0.39
%0.
42%
0.43
%
MB
0.91
40.
902
0.92
20.
927
-0.0
52*
0.05
5*0.
009*
-0.0
35*
0.11
50.
092*
0.00
8*-0
.042
*0.
007*
-0.0
53*
0.50
%0.
48%
0.60
%0.
49%
0.45
%0.
49%
0.49
%
RD
0.91
90.
909
0.92
10.
929
-0.0
27*
-0.0
31*
0.00
4*-0
.009
*-0
.044
*-0
.015
*-0
.046
*0.
015*
0.01
3*0.
010*
0.03
4*0.
50%
0.53
%0.
43%
0.38
%0.
48%
0.37
%
MK
0.91
20.
899
0.91
80.
921
-0.0
55*
0.02
6*-0
.042
*-0
.042
*0.
085*
0.02
3*-0
.006
*-0
.056
*-0
.041
*-0
.075
*-0
.055
*0.
036*
0.61
%0.
47%
0.44
%0.
46%
0.46
%
K0.
930
0.91
90.
937
0.94
30.
010*
-0.0
42*
0.13
3*0.
085*
0.04
0*0.
190*
0.02
0*-0
.007
*0.
072*
0.10
4*0.
087*
0.00
2*0.
103*
0.54
%0.
52%
0.60
%0.
50%
MA
K0.
918
0.90
70.
925
0.92
7-0
.029
*-0
.006
*-0
.016
*-0
.016
*-0
.013
*-0
.064
*-0
.036
*0.
054*
0.00
7*0.
014*
0.04
1*-0
.048
*0.
024*
0.08
8*0.
35%
0.46
%0.
35%
G0.
936
0.92
80.
942
0.94
6-0
.014
*0.
044*
-0.0
14*
0.00
4*-0
.018
*-0
.071
*-0
.041
*0.
099*
0.03
6*0.
02*
0.08
4*-0
.053
*0.
060*
0.16
1*-0
.057
*0.
42%
0.33
%
SH
0.90
70.
898
0.91
20.
920
-0.0
16*
0.05
2*-0
.016
*-0
.009
*0.
114
0.04
8*0.
030*
-0.0
17*
-0.0
23*
-0.0
56*
-0.0
09*
0.06
8*-0
.073
*0.
150*
0.05
7*0.
083*
0.47
%
MI
0.92
10.
913
0.92
80.
930
0.01
5*0.
027*
0.04
0*0.
033*
-0.0
05*
-0.0
23*
-0.0
14*
0.10
40.
067*
0.08
2*0.
118*
-0.0
62*
0.09
9*0.
102*
-0.0
37*
-0.0
44*
0.12
7
Bel
owdi
agon
al:
pair
wis
eF
ST
valu
esam
ong
popu
lati
ons;
abov
edi
agon
al:
the
aver
age
(%)
pair
wis
edi
ffer
ence
sam
ong
popu
lati
ons
(hap
loty
pefr
equ
enci
esan
dG
TR
+I+G
gen
etic
dist
ance
).*N
osi
gnifi
can
tpa
irw
ise
FS
Tva
lues
(P>
0.05
).
38 I. C. SILVA ET AL.
© 2010 The Linnean Society of London, Biological Journal of the Linnean Society, 2010, 99, 28–46

MANOVA also revealed significant differencesbetween the groups north and south (males: Wilks’l = 0.606, F = 9.001; P < 0.0001; females: Wilks’l = 0.898, F = 4.965; P < 0.0001). According to the dis-
criminant analysis, 68.6% of the males and 63.3% ofthe females were correctly classified as belonging tothe southern group, and 98.9% of both sexes werecorrectly classified as specimens of the northern group.
-5
0
5
10
15
20
25
0 1 2 3 4 5 6 7 8 9
Geographic distance (ln(km))
FS
T/(
1-F
ST)
-5
0
5
10
15
20
25
0 1 2 3 4 5 6 7 8 9
Geographic distance (ln(km))
FS
T/(
1-F
ST)
Figure 5. Isolation by distance in Perisesarma guttatum samples. The divergence estimates are plotted versusgeographic distance for each pair of populations.
Table 3. Parameters for the mismatch distribution for the Perisesarma guttatum mitochondrial DNA populations
Parameters Goodness-of-fit tests Tajima’s D test Fu’s test
q0 q1 t SSD PSSD Ragged. PRagged. D P FS P
PR 0 99999.0 0.479 0.0402 0.75 0.181 0.57 -1685 0.017* -2.369 0.003*S 0 3.6 2.980 0.2272 0.15 0.212 0.22 -1.706 0.025* -2.526 0.001*Sa 0 99999.0 0.811 0.0171 0.28 0.161 0.35 -1.518 0.043* -2.677 0.002*CS 0 0.433 3.000 0.0077 0.50 0.255 0.59 -1.120 0.183 -1.152 0.04*NV 0 5.596 4.096 0.0726 0.29 0.163 0.29 -1.273 0.085 0.461 0.57Me 0.004 10.332 3.705 0.0131 0.66 0.037 0.94 0.573 0.724 -0.768 0.294P 0 8.105 4.090 0.0305 0.22 0.087 0.27 -0.646 0.302 -5.674 0.004*O 0 6.663 4.658 0.0295 0.29 0.054 0.48 -0.661 0.259 -4.831 0.012*I 0.002 8.967 3.332 0.0022 0.93 0.016 1.00 -0.403 0.365 -2.796 0.042*Lu 0 99999.0 3.951 0.0203 0.32 0.069 0.32 0.165 0.594 -5.021 0.000*U 0 99999.0 0.496 0.2738 0.01 0.041 1.00 -1.592 0.039* -2.403 0.118MP 0.004 2.231 4.814 0.0491 0.46 0.133 0.71 -0.335 0.419 -0.073 0.443RE 0.009 8.54 4.016 0.0155 0.62 0.500 0.79 -0.009 0.515 -0.963 0.26MB 1.619 99999.0 2.453 0.0257 0.45 0.077 0.74 -0.354 0.372 -4.010 0.001*MiB 0.007 11.543 3.967 0.0094 0.44 0.031 0.75 -0.417 0.380 -5.021 0.009*RD 0.016 101.25 3.051 0.0088 0.65 0.053 0.62 -0.726 0.273 -2.092 0.077MK 0 37.148 4.227 0.0629 0.13 0.161 0.19 -0.047 0.482 -2.300 0.061K 0 61.875 5.102 0.1003 0.15 0.240 0.48 -0.855 0.269 -1.805 0.052Mak 0 4.519 5.215 0.0304 0.47 0.069 0.73 -1.089 0.137 -1.522 0.142Sh 0 16.592 4.389 0.0277 0.19 0.088 0.37 -0.035 0.514 -1.405 0.176G 0 2.642 5.074 0.0492 0.44 0.169 0.43 -1.161 0.144 0.528 0.312Mi 0.563 5.133 2.531 0.0111 0.63 0.042 0.74 -0.977 0.177 -3.901 0.002*
Tajima’s D and Fu’s FS test values and their statistical significance are also presented. q0 and q1, pre-expansion andpost-expansion populations size; t, time in number of generations elapsed since the sudden expansion episode; SSD, sumof squared deviations; Ragged, raggedness index; PSSD and PRagged, probability that expected mismatch distributions(1000 bootstrap replicates) have significantly larger than observed mismatch distributions.*Statistically significant (P < 0.05).
GENETIC AND MORPHOLOGICAL DIFFERENTIATION OF P. GUTTATUM 39
© 2010 The Linnean Society of London, Biological Journal of the Linnean Society, 2010, 99, 28–46

In the analysis of differentiation among popula-tions, Maputo Bay populations (Costa do Sol andInkomati) and the Inhaca Island populations (Saco,Ponta Rasa, and Sangala), the southern group, wasrevealed to be very different from the remainder forboth males and females. These differences in carapaceshapes were assessed through a post-hoc Tukey’sHSD test and were statistically significant. Ingeneral, the areas sampled along the coast showedsignificant differences among them, whereas the loca-
tions sampled within each area did not present sig-nificant differences among each other. As an example,the area defined by Maputo Bay and Inhaca Islandpopulations is statistically different from the areadefined by Pemba, Olondo, and Mecufi. However,Sangala, Ponta Rasa, Saco, Costa do Sol, and Inko-mati did not show differences among them, andPemba, Olondo and Mecufi also did not show differ-ences among them. However two exceptions wereregistered: within Area D, significant differences
Number of differences between haplotypes
0
0.1
0.2
0.3
0.4
0.5
0 1 2 3 4 5 6 7 8
0
0.1
0.2
0.3
0.4
0.5
0 1 2 3 4 5 6 7 8
0
0.1
0.2
0.3
0.4
0.5
0 1 2 3 4 5 6 7 80
0.1
0.2
0.3
0.4
0.5
0 1 2 3 4 5 6 7 8
0
0.1
0.2
0.3
0.4
0.5
0 1 2 3 4 5 6 7 8
0
0.1
0.2
0.3
0.4
0.5
0 1 2 3 4 5 6 7 8
0
0.1
0.2
0.3
0.4
0.5
0 1 2 3 4 5 6 7 8
0
0.1
0.2
0.3
0.4
0.5
0 1 2 3 4 5 6 7 8
0
0.1
0.2
0.3
0.4
0.5
0 1 2 3 4 5 6 7 80
0.1
0.2
0.3
0.4
0.5
0 1 2 3 4 5 6 7 8
0
0.1
0.2
0.3
0.4
0.5
0 1 2 3 4 5 6 7 8
0
0.1
0.2
0.3
0.4
0.5
0 1 2 3 4 5 6 7 8
0
0.1
0.2
0.3
0.4
0.5
0 1 2 3 4 5 6 7 8
0
0.1
0.2
0.3
0.4
0.5
0 1 2 3 4 5 6 7 8
0
0.1
0.2
0.3
0.4
0.5
0 1 2 3 4 5 6 7 80
0.1
0.2
0.3
0.4
0.5
0 1 2 3 4 5 6 7 8
0
0.1
0.2
0.3
0.4
0.5
0 1 2 3 4 5 6 7 8
0
0.1
0.2
0.3
0.4
0.5
0 1 2 3 4 5 6 7 8
Inhaca Island and Costa do Sol
Mecúfi, Pemba and Olondo
Mocimboa da Praia, Ulo and Luchete
Ruvuma Estuary, Mnazi Bay and Mikindani Bay
Ras Dege, Mtoni and Kunduchi
Gazi, Shirazi and Mikindani
Fre
qu
ency
Figure 6. Frequency distributions of the number of pairwise nucleotide differences (mismatch distributions) betweenPerisesarma guttatum mitochondrial haplotypes.
40 I. C. SILVA ET AL.
© 2010 The Linnean Society of London, Biological Journal of the Linnean Society, 2010, 99, 28–46
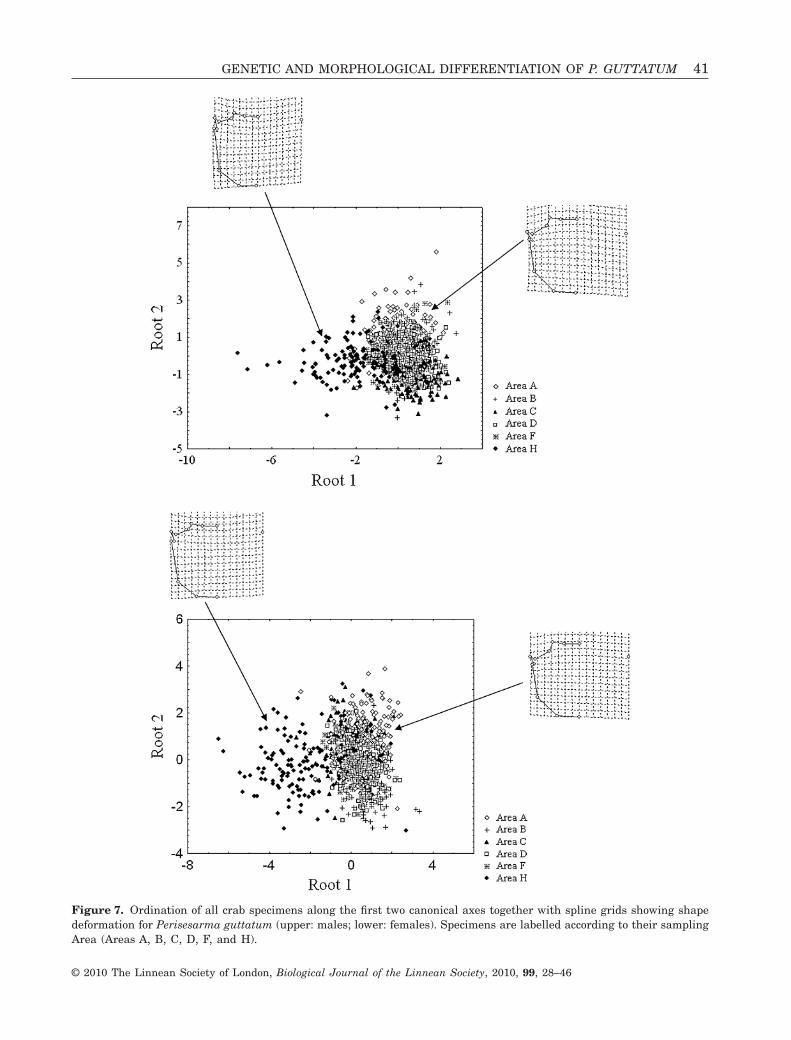
Figure 7. Ordination of all crab specimens along the first two canonical axes together with spline grids showing shapedeformation for Perisesarma guttatum (upper: males; lower: females). Specimens are labelled according to their samplingArea (Areas A, B, C, D, F, and H).
GENETIC AND MORPHOLOGICAL DIFFERENTIATION OF P. GUTTATUM 41
© 2010 The Linnean Society of London, Biological Journal of the Linnean Society, 2010, 99, 28–46
between Mocimboa da Praia and Luchete were found(Tukey’s HSD test, P = 0.027) and, within Area B, thesame significant differences were observed betweenRas Dege and Mtoni Kijichi (Tukey’s HSD test,P = 0.0026).
DISCUSSION
The assessment of the population differentiation ofthe mangrove crab P. guttatum through the combinedanalysis of genetic and morphometric data was con-gruent. Analysis of mitochondrial DNA variation(using F-statistics, phylogenetic trees, and SAMOVA)and the analysis of carapace shape variation (usinggeometric morphometrics) revealed two highly sup-ported phylogeographic clades: the southern Mozam-bique clade (Inhaca Island and Maputo Bay) and thenorthern clade that included north Mozambique, Tan-zania, and Kenya. However, at this stage, it is unclearwhether a clinal variation separates both clades or,instead, a major break occurs. Logistical constraintsprecluded this issue being addressed during thepresent study.
Analysis of mitochondrial DNA sequence datarevealed that P. guttatum populations along the EastAfrican coast were characterized by high haplotypicdiversity, close genetic similarities among haplotypes(limited nucleotide diversity), and by the presenceof many rare haplotypes within sampling localities.The described genetic pattern can be interpreted asan effect of high maternal effective population size(Lewontin, 1974; Lavery, Moritz & Fielder, 1996), byan increasing mutation rate, or by a combination ofboth. This diversity pattern was also observed inother studies of marine invertebrate species with highreproductive potential, such as the study by Fratini &Vannini (2002) regarding the portunid mangrove crabScylla serrata and the study by Cassone & Boulding(2006) regarding the grapsid crab Pachygrapsus cras-sipes. Furthermore, the low nucleotide diversitiesobserved may be a result of the relatively short exist-ence of haplotypes, with newly-created haplotypesgoing extinct after obtaining only a few additionalbase pair differences (Cassone & Boulding, 2006).Population bottlenecks followed by demographicexpansions might also contribute to this pattern ofgenetic diversity. Indeed, the unimodal mismatch dis-tributions observed for southern Mozambique popu-lations, the star-like shape of the network within eachclade, and the statistically significant negative valuesof Tajima’s D and Fu’s F are also consistent with thehypothesis of a recent population expansion subse-quent to a bottleneck. Benzie et al. (2002) obtainedsimilar results in a study on mtDNA variation inIndo-Pacific populations of the giant tiger prawnPenaeus monodon, with the south-east African
peripheral populations displaying patterns indicativeof a relatively recent bottleneck. According to theseauthors, the fall in sea level in the Pleistocene islikely to have removed shelf habitat suitable forP. monodon in southern Africa, and these would havebeen reinvaded by populations further north afterthe latest major sea level rise (Forbes et al., 1999).Similar results were obtained by Kochzius &Nuryanto (2008) for the giant clam Tridacna crocea,where neutrality tests and mismatch distribution alsoindicated demographic expansion. These authors sug-gested a similar explanation for the population sizechanges, with the reduction of habitat and subse-quent population bottlenecks during sea level lowstands, whereas the availability of new habitats afterthe rise of the sea level at the end of the last glacialenabled recolonization and growth of the reducedpopulations. A similar event might also have occurredwith P. guttatum, with losses of suitable habitats andsequent colonization of new areas. This migrationpattern would explain the typical results of popula-tion expansion achieved.
The degree of population genetic structure found inP. guttatum suggests that the individuals sampledalong the coast represent two distinct clades. The tworegional clades were identified based on P. guttatumpopulations pairwise genetic differentiation and geo-graphical location, with each clade being composedof genetically similar populations along a latitu-dinal gardient. In addition, FST values (Hartl &Clark, 1997) were considerably high and significantlygreater than random distributions of sequencesamong the two clades, supporting, along with themolecular phylogram attained, the presence of signi-ficant population genetic structure along the EastAfrican coast, between Kenya and South Mozam-bique. However, no significant population structurewas found within each clade because the FST valueswere small (-0.076–0.190) and not significant(P > 0.05).
Furthermore, AMOVA revealed high levels ofgenetic structuring among south Mozambique andnorthern populations, with almost 86% of the totalgenetic variance being found between these twoclades. Indeed, almost no haplotypes were sharedbetween the two clades. These results suggested areduced gene flow between the two clades, which isprobably explained by the currents in the region.Hydrographic features, such as current gyres, eddies,and countercurrents, can promote the isolation oflocal marine invertebrate populations, as is the casefor the Brittany and English Channel populations ofthe polychaete Pectinaria koreni (Jolly et al., 2005)and for the North of France populations of the stalkedbarnacle Pollicipes pollicipes (Quinteiro, Rodríguez-Castro & Rey-Méndez, 2007). Somewhere between
42 I. C. SILVA ET AL.
© 2010 The Linnean Society of London, Biological Journal of the Linnean Society, 2010, 99, 28–46

Maputo and Durban, the warm southward AgulhasCurrent (Lutjeharms, 2006) might be responsible forthe dispersion of the larvae originated in InhacaIsland and Maputo Bay southwards. Thus, it shouldbe expected that populations from further southwould be similar to those sampled at Inhaca Islandand Costa do Sol. However, because the north coastof South Africa is the southern geographic limit ofP. guttatum, it was not possible to capture sufficientspecimens to achieve a statistically valid samplingnumber for this southernmost region. Nevertheless,other studies (Gibbons, Barange & Hutchings, 1995;Gibbons & Thibault-Botha, 2002) have shown, foreuphausiid and siphonophore species, a tight agree-ment between the circulation components of theAgulhas current system and species biogeography.Furthermore, the hydrography of Maputo Bay andadjacent neritic waters has demonstrated a complexdynamics, which included countercurrents and eddiesderived from the Mozambique Current (Lutjeharms &da Silva, 1988). These eddies and northward inshorecountercurrents may contribute to the retention oflarvae in areas adjacent to Maputo Bay and restrictoffshore dispersal, as suggested by Paula et al. (2001)for a set of brachyuran megalopae. Accordingly, thisretention of larvae could prevent gene flow, andthereby explain the observed differences betweennorthern and southern clades. Moreover, observationsmade by Sætre & da Silva (1984) in the MozambiqueChannel showed a flow southward along the Mozam-bique coastline, and also an anti-cyclonic circulationin the northern clade of the channel. Although thecirculation in this channel as a whole is not yet fullyunderstood (Lutjeharms, 2006), the anti-cyclonic cir-culation pattern should constitute the major part ofthe flow through the Mozambique Channel, allowingan almost random dispersion of the larval planktonicphases and contributing to the homogenization ofpopulations along the coast. Accordingly, the apparentlimited gene flow between the two geographic cladesand the similarities observed among populationswithin clades supported the hypothesis of bothhomogenization and isolation roles of the hydro-graphic dynamics along the eastern African coast.
The southernmost population in the northernclade,Nacala Velha, had one haplotype in common with thesouthern clade, and Ulo (another population fromthe northern clade) also had a haplotype belongingto the southern evolutionary lineage. One possibleexplanation for these results would be the migrationof individuals between the two clades, which could beachieved by rafting of adults or egg masses (Johan-nesson, 1988) or, most likely in this species, by dis-persive larvae (Crisp, 1978). However, consideringthat these two specimens did not show any atypicalshape pattern for their population, but rather possess
the typical carapace shape of the northern clade,hybridization events could also explain these results.In any case, the direction of these migratory and/orhybridization events appears to be, preferentially,from the southern clade to the northern clade becauseno haplotypes from the northern evolutionary lineagewere observed in the southern populations. Finally,the genetic versus morphological pattern observedmight also indicate that the morphological differen-tiation found can be a plastic response to habitat-specific selective pressures and not a direct cause ofgenetic differences. Nevertheless, a larger numberof specimens with the same genetic profile as thesetwo specimens from Nacala Velha and Ulo should beanalysed.
The main morphometric differences observed con-cerned the rostrum shape and the distance betweenthe rostrum and the first lateral spine and, despitea clear differentiation in mtDNA COI sequencesbetween northern and southern clades, differencesin morphological characters were not so obvious. Nev-ertheless, statistically significant differences amongareas were found, especially between area H (south-ern clade) and the remaining areas (northern clade),in line with the pattern of differentiation betweennorth and south. Furthermore, not only the southernpopulations of Inhaca Island and Maputo Bay (Costado Sol and Inkomati) were found to be similar to eachother, but also differences among populations withinthe northern clade did not show a clear patternof differentiation according to geographic distance,with populations that were several hundreds of kilo-metres apart not showing statistically significantmorphometric shape variation. Thus, corroboratingthe pattern of within geographic clade homogeneity,the lack of shape differentiation among populationsmay indicate that similar ecological pressures areacting, leading to the development of similar mor-phological characters. These ecological pressurescan have diverse origins, such as foraging, defence,habitat availability, mating, and food acquisition(Smith, 2004). However, two exceptions between twopopulations in areas B and D were seen. These localshape variations can be explained by shape plasticity,as already demonstrated in previous studies per-formed with crab species (Rosenberg, 1997; Rufino,Abelló & Yule, 2004; Silva & Paula, 2008). This phe-notypic plasticity can be the result of specific ecologi-cal conditions, as suggested by Monteiro, Bordin &Reis (2000). Indeed, the same environmental factorsthat justify the lack of shape differentiation amongpopulations, may also contribute to local shape varia-tion, if acting in different directions.
In the present study, two population clades werethus define (southern clade and northern clade), withall pairwise genetic distances in the range 2.32–
GENETIC AND MORPHOLOGICAL DIFFERENTIATION OF P. GUTTATUM 43
© 2010 The Linnean Society of London, Biological Journal of the Linnean Society, 2010, 99, 28–46

2.75%. In the study by Hebert et al. (2003) regardingbiological identifications through DNA barcodes,divergence values between species were ordinarilygreater than 3%, with the exception of some conge-neric species pairs that were genetically distinct butshowed low divergence (0.6–2.0%), suggesting theirrecent origin. Considering these COI-based identifi-cation system estimations and the statistically signifi-cant but not obvious morphological differences, wesuggest the presence of a species complex for theseP. guttatum populations, with the existence of twocryptic species. Recent investigations suggest thatmarine biodiversity may be much higher than earlierestimates, and an important hidden source of diver-sity in marine systems comprises the phenomenonof cryptic species complexes (Mathews, 2006). Manycryptic species have been detected in the marineenvironment, such as in the species Xiphopenaeuskroyeri and Xiphopenaeus riveti (Gusmão et al., 2006)and in the genus Alpheus (Mathews, 2006). Insummary, it appears that, despite the potential forhigh gene flow in marine species that have larvalstages, genetic panmixia cannot be assumed. Indeed,the currents that may allow gene flow between popu-lations can also act as barriers to it, even when thedistribution appears to be continuous. This was par-ticularly evident along the geographic gradient understudy, where the significant spatial genetic structureobserved between the southern and the northernpopulations of P. guttatum, combined with morpho-logical differences, suggests that these populationsmay be considered as cryptic species.
ACKNOWLEDGEMENTS
I. C. Silva acknowledges a PhD grant by Fundaçãopara a Ciência e a Tecnologia (FCT), reference SFRH/BD/14325/2003 and N. Mesquita acknowledges apost-doc grant by FCT, reference SFRH/BPD/14557/2003. This study is part of the research projectTRANSMAP (INCO-CT2004-510862) funded by theEuropean Commission, Sixth Framework. Theauthors extend their gratitude to the following peoplewho assisted in procuring crab samples used for thisstudy: D. Abreu, A. Alfiado, F. Amade, C. Hassane, C.Litulo, A. Macia, J. Mahenge, P. Muianga, E. Nhaca,and G. Penha-Lopes. The authors also thank P.Cardoso for map elaboration.
REFERENCES
Avise JC. 2004. Molecular markers, natural history andevolution. New York, NY: Chapman and Hall.
Bandelt H-J, Forster P, Röhl A. 1995. Median-joiningnetworks for inferring intraspecific phylogenies. MolecularBiology and Evolution 16: 37–48.
Benzie JAH, Ballment E, Forbes AT, Demetriades NT,Sugama K, Moria H, Moria S. 2002. Mitochondrial DNAvariation in Indo-Pacific populations of the giant tigerprawn, Penaeus monodon. Molecular Ecology 11: 2553–2569.
Bookstein FL. 1991. Morphometric tools for landmark data:geometry and biology. New York, NY: Cambridge UniversityPress.
Brian JV, Fernandes T, Ladle RJ, Todd PA. 2006.Patterns of morphological and genetic variability in UKpopulations of the shore crab, Carcinus maenas Linnaeus,1758 (Crustacea: Decapoda: Brachyura). Journal of Experi-mental Marine Biology and Ecology 329: 47–54.
Cassone BJ, Boulding EG. 2006. Genetic structure andphylogeography of the lined shore crab, Pachygrapsus cras-sipes, along the northeastern and western Pacific coasts.Marine Biology 149: 213–226.
Cavalcanti MJ. 2005. Mantel for Windows – Test for asso-ciation between two symmetric distance matrices with per-mutation iterations, Version 1.18. Rio de Janeiro, Brazil.
Crisp DJ. 1978. Genetic consequences of different reproduc-tive strategies in marine invertebrates. In: Battaglia B,Beardmore JA, eds. Marine organisms: genetic, ecology andevolution. New York, NY: Plenum Press.
Dawson MN. 2001. Phylogeography in coastal marineanimals: a solution from California? Journal of Biogeogra-phy 28: 723–736.
Dupanloup I, Schneider S, Excoffier L. 2002. A simulatedannealing approach to define the genetic structure of popu-lations. Molecular Ecology 11: 2571–2581.
Excoffier L, Laval G, Schneider S. 2005. Arlequin version3.0: an integrated software package for population geneticsdata analysis. Evolutionary Bioinformatics Online 1: 47–50.
Flores AAV, Saraiva J, Paula J. 2002. Sexual maturity,reproductive cycles, and juvenile recruitment of Peris-esarma guttatum (Brachyura, Sesarmidae) at Ponta Rasamangrove swamp, Inhaca Island, Mozambique. Journal ofCrustacean Biology 22: 143–156.
Folmer O, Black M, Hoeh W, Lutz R, Vrijenhoek R. 1994.DNA primers for amplification of mitochondrial cytochromeC oxidase subunit I from metazoan invertebrates. MolecularMarine Biology and Biotechnology 3: 294–299.
Forbes AT, Demetriades NT, Benzie JAH, Ballment E.1999. Allozyme frequencies indicate little geographic varia-tion amongst stocks of the giant tiger prawn, Penaeusmonodon, in the south-east Indian Ocean. South AfricanJournal of Marine Biology 21: 271–277.
Fratini S, Vannini M. 2002. Genetic differentiation in themud crab Scylla serrata (Decapoda: Portunidae) within theIndian Ocean. Journal of Experimental Marine Biology andEcology 272: 103–116.
Gibbons MJ, Barange M, Hutchings L. 1995. Zoogeogra-phy and diversity of euphausiids around southern Africa.Marine Biology 123: 257–268.
Gibbons MJ, Thibault-Botha D. 2002. The match betweenocean circulation and zoogeography of epipelagic sipho-nophores around southern Africa. Journal of the MarineBiological Association of the United Kingdom 82: 801–810.
44 I. C. SILVA ET AL.
© 2010 The Linnean Society of London, Biological Journal of the Linnean Society, 2010, 99, 28–46

Gillikin DP, Schubart CD. 2004. Ecology and systematicsof mangrove crabs of the genus Perisesarma (Crustacea:Brachyura: Sesarmidae) from East Africa. ZoologicalJournal of the Linnean Society 141: 435–445.
Gopurenko D, Hughes JM. 2002. Regional patterns ofgenetic structure among Australian populations of the mudcrab, Scylla serrata (Crustacea: Decapoda): evidence frommitochondrial DNA. Marine and Freshwater Research 53:849–857.
Gusmão J, Lazoski C, Monteiro FA, Solé-Cava AM. 2006.Cryptic species and population structuring of the Atlanticand Pacific seabob shrimp species, Xiphopenaeus kroyeriand Xiphopenaeus riveti. Marine Biology 149: 491–502.
Hall TA. 1999. BioEdit: a user-friendly biological sequencealignment editor and analysis program for Windows95/98/NT. Nucleic Acids Symposium Series 41: 95–98.
Hartl DL, Clark AG. 1997. Principles of populationgenetics, 3rd edn. Sunderland, MA: Sinauer Associates IncPublishers.
Hebert PDN, Cywinska A, Ball SL, deWaard JR. 2003.Biological identifications through DNA barcodes. Proceed-ings of the Royal Society of London Series B, BiologicalSciences 270: 313–321.
Hillis DM, Mable BK, Larson A, Davis SK, Zimmer EA.1996. Nucleic acids IV: sequencing and cloning. In: HillisDM, Moritz C, Mable BK, eds. Molecular systematics, 2ndedn. Sunderland, MA: Sinauer Associates Inc. Publishers.
Johannesson K. 1988. The Paradox of Rockall – why is abrooding gastropod (Littorina saxatilis) more widespreadthan one having a planktonic larval dispersal stage(Littorina litorea)? Marine Biology 99: 507–513.
Jolly MT, Jollivet D, Gentil F, Thiébaut E, Viard F. 2005.Shape genetic break between Atlantic and English Channelpopulations of the polychaete Pectinaria koreni, along theNorth coast of France. Heredity 94: 23–32.
Jordaens K, van Riel P, Backeljau T. 2003. Molecularand morphological discrimination between the pulmonateland snails Zonitoides nitidus and Z. excavatus. MolluscanStudies 69: 295–300.
Kassam DD, Adams DC, Hori M, Yamaoka K. 2003.Morphometric analysis on ecomorphologically equivalentcichlid species from Lakes Malawi and Tanganyika. Journalof Zoology 260: 153–157.
Kochzius M, Nuryanto A. 2008. Strong genetic populationstructure in the boring giant clam, Tridacna crocea, acrossthe Indo-Malay Archipelago: implications related to evolu-tionary processes and connectivity. Molecular Ecology 17:3775–3787.
Lago RP. 1993. Larval development of Sesarma guttatum A.Milne Edwards (Decapoda: Brachyura: Grapsidae) reared inthe laboratory, with comments on larval generic and famil-ial characters. Journal of Crustacean Biology 13: 745–762.
Lavery S, Moritz C, Fielder DR. 1996. Indo-Pacific popu-lation structure and evolutionary history of the coconut crabBirgus latro. Molecular Ecology 5: 557–570.
Lee SY. 1998. Ecological role of grapsid crabs in mangroveecosystems: a review. Marine and Freshwater Research 49:335–343.
Lewontin RC. 1974. The genetic basis of evolutionary change.New York, NY: Columbia University Press.
Lutjeharms JRE. 2006. The agulhas current. Berlin:Springer-Verlag Press.
Lutjeharms JRE, da Silva JA. 1988. The Delagoa bighteddy. Deep-Sea Research 35: 619–634.
Mantel N. 1967. The detection of disease clustering and ageneralized regression approach. Cancer Research 27: 209–220.
Mathews LM. 2006. Cryptic biodiversity and phylogeograhicpatterns in a snapping shrimp complex. Molecular Ecology15: 4049–4063.
Miner BG, Sultan SE, Morgan SG, Padilla DK, RelyeaRA. 2005. Ecological consequences of phenotypic plasticity.Trends in Ecology and Evolution 20: 685–692.
Monteiro LR, Bordin B, Reis SF. 2000. Shape distances,shape spaces and the comparison of morphometric methods.Trends in Ecology and Evolution 15: 217–220.
Palumbi SR. 1994. Genetic divergence, reproductive isola-tion, and marine speciation. Annual Review of Ecology andSystematics 25: 547–572.
Paula J, Dray T, Queiroga H. 2001. Interaction of offshoreand inshore processes controlling settlement of brachyuranmegalopae in Saco mangrove creek, Inhaca Island (SouthMozambique). Marine Ecology Progress Series 215: 251–260.
Pinheiro A, Teixeira CM, Rego AL, Marques JF, CabralHN. 2005. Genetic and morphological variation of Solealascaris (Risso, 1810) along the Portuguese coast. FisheriesResearch 73: 67–78.
Posada D, Crandall KA. 1998. MODELTEST: testing themodel of DNA substitution. Bioinformatics 14: 817–818.
Quinteiro J, Rodríguez-Castro J, Rey-Méndez M.2007. Population genetic structure of the stalked barnaclePollicipes pollicipes (Gmelin, 1789) in the northern Atlantic:influence of coastal currents and mesoscale hydrographicstructures. Marine Biology 153: 47–60.
Reuschel S, Schubart CD. 2006. Phylogeny and geogra-phic differentiation of Atlanto-Mediterranean species of thegenus Xantho (Crustacea: Brachyura: Xanthidae) based ongenetic and morphometric analyses. Marine Biology 148:853–866.
Rogers AR, Harpending HC. 1992. Population growthmakes waves in the distribution of pairwise genetic differ-ences. Molecular Biology and Evolution 9: 552–569.
Rohlf FJ. 2006. Tpsdig, Version 2.10. Stony Brook, NY:Department of Ecology and Evolution, State University ofNew York at Stony Brook.
Rohlf FJ. 2007a. Tpsregr, Version 1.34. Stony Brook, NY:Department of Ecology & Evolution, State University ofNew York.
Rohlf FJ. 2007b. Tpsrelw, Version 1.45. Stony Brook, NY:Department of Ecology & Evolution, State University ofNew York.
Rohlf FJ, Marcus LF. 1993. A revolution in morphometrics.Trends in Ecology and Evolution 8: 129–132.
Rohlf FJ, Slice DE. 1990. Extensions of the Procrustesmethod for the optimal superimposition of landmarks.Systematic Zoology 39: 40–59.
GENETIC AND MORPHOLOGICAL DIFFERENTIATION OF P. GUTTATUM 45
© 2010 The Linnean Society of London, Biological Journal of the Linnean Society, 2010, 99, 28–46

Rosenberg MS. 1997. Evolution of shape differences betweenthe major and minor chelipeds of Uca pugnax (Decapoda:Ocypodidae). Journal of Crustacean Biology 17: 52–59.
Rozas J, Sánchez-DelBarrio J, Messeguer X, RozasR. 2003. DnaSP, DNA polymorphism analyses by thecoalescent and other methods. Bioinformatics 19: 2496–2497.
Rufino MM, Abelló P, Yule AB. 2004. Male and femalecarapace shape differences in Liocarcinus depurator (Deca-poda, Brachyura): an application of geometric morphometricanalysis to crustaceans. Italian Journal of Zoology 71:79–83.
Sætre R, da Silva AJ. 1984. The circulation of the Mozam-bique Channel. Deep-Sea Research 31: 485–508.
Schizas NV, Street GT, Coull BC, Chandler GT, QuattroJM. 1999. Molecular population structure of the marinebenthic copepod Microarthridion littorale along the south-eastern and Gulf coasts of the USA. Marine Biology 135:399–405.
Schubart CD, Cannicci S, Vannini M, Fratini S.2006. Molecular phylogeny of grapsoid crabs (Decapoda,Brachyura) and allies based on two mitochondrial genes anda proposal for refraining from current superfamily classifi-cation. Journal of Zoological Systematics and EvolutionaryResearch 44: 193–199.
Silva IC, Paula J. 2008. Is there a better chela to usefor geometric morphometric differentiation in brachyurancrabs? A case study using Pachygrapsus marmoratus andCarcinus maenas. Journal of the Marine Biological Associa-tion of the United Kingdom 88: 841–853.
Slatkin M, Hudson RP. 1991. Pairwise comparisons ofmitochondrial DNA sequences in stable and exponentiallygrowing populations. Genetics 129: 555–562.
Smith LD. 2004. Biogeographic differences in claw size andperformance in an introduced crab predator Carcinusmaenas. Marine Ecology Progress Series 276: 209–222.
Sousa R, Freire R, Rufino M, Méndez J, Gaspar M,Antunes C, Guilhermino L. 2007. Genetic and shellmorphological variability of the invasive bivalve Corbiculafluminea (Müller, 1774) in two Portuguese estuaries. Estua-rine, Coastal and Shelf Science 74: 166–174.
Spivak ED, Schubart CD. 2003. Species status in question;a morphometric and molecular comparison of Cyrtograpsusaffinis and C. altimanus (Decapoda, Brachyura, Varunidae).Journal of Crustacean Biology 23: 212–222.
Swofford DL. 1998. PAUP*. Phylogenetic analysis usingparsimony (*and other methods), Version 4. Sunderland,MA: Sinauer Associates.
Vannini M, Valmori P. 1981. Researchers on the coastof Somalia. The shore and the dune of Sar Uanle. 30.Grapsidae (Decapoda Brachyura). Monitore Zoologico Ital-iano 6: 57–101.
Vasconcellos AV, Vianna P, Paiva PC, Schama R,Solé-Cava A. 2008. Genetic and morphometric differencesbetween yellowtail snapper (Ocyurus chrysurus, Lutjan-idae) populations of the tropical West Atlantic. Geneticsand Molecular Biology 31 (Suppl. 1): 308–326.
Waters JM, King TM, O’Loughlin PM, Spencer HG. 2005.Phylogeographical disjunction in abundant high/dispersallittoral gastropods. Molecular Ecology 14: 2789–2802.
46 I. C. SILVA ET AL.
© 2010 The Linnean Society of London, Biological Journal of the Linnean Society, 2010, 99, 28–46