Embed Size (px)
Citation preview
PONTÍFICIA UNIVERSIDADE CATÓLICA DE SÃO PAULO
Faculdade de Economia, Administração, Contabilidade e Atuariais
UM ESTUDO DO POSSIVEL IMPACTO DOS INDICADORES DE GOVERNANÇA-HDR EM RELAÇAO AO INDICE DE
DESENVOLVIMENTO HUMANO-HDI E AO PRODUCTO INTERNO BRUTO PER CAPITA-GNIPC
Aluna: Bianca Zapparoli Barbara
Prof. Arnoldo José de Hoyos Guevara
1° Semestre 2012
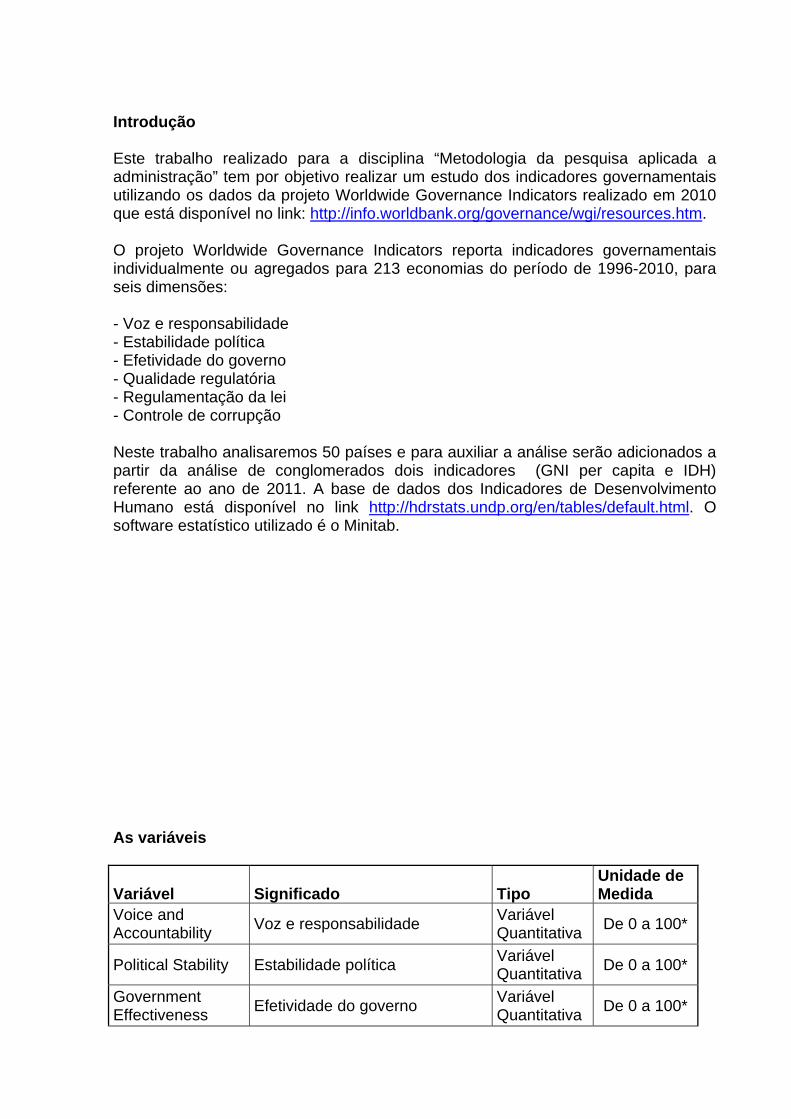
Introdução Este trabalho realizado para a disciplina “Metodologia da pesquisa aplicada a administração” tem por objetivo realizar um estudo dos indicadores governamentais utilizando os dados da projeto Worldwide Governance Indicators realizado em 2010 que está disponível no link: http://info.worldbank.org/governance/wgi/resources.htm. O projeto Worldwide Governance Indicators reporta indicadores governamentais individualmente ou agregados para 213 economias do período de 1996-2010, para seis dimensões: - Voz e responsabilidade - Estabilidade política - Efetividade do governo - Qualidade regulatória - Regulamentação da lei - Controle de corrupção Neste trabalho analisaremos 50 países e para auxiliar a análise serão adicionados a partir da análise de conglomerados dois indicadores (GNI per capita e IDH) referente ao ano de 2011. A base de dados dos Indicadores de Desenvolvimento Humano está disponível no link http://hdrstats.undp.org/en/tables/default.html. O software estatístico utilizado é o Minitab. As variáveis
Variável Significado Tipo Unidade de Medida
Voice and Accountability
Voz e responsabilidade Variável Quantitativa
De 0 a 100*
Political Stability Estabilidade política Variável Quantitativa
De 0 a 100*
Government Effectiveness
Efetividade do governo Variável Quantitativa
De 0 a 100*
Regulatory Quality Qualidade regulatória Variável Quantitativa
De 0 a 100*
Rule of Law Regulamentação da lei Variável Quantitativa
De 0 a 100*
Control of Corruption
Controle de corrupção Variável Quantitativa
De 0 a 100*
Índice de Desenvolvimento Humano (IDH)
Um índice composto que mede desempenho médio em três dimensões básicas do desenvolvimento humano - uma vida longa e saudável, conhecimento e um padrão de vida decente.
Variável Quantitativa
Índice
GNI per capita
Renda agregada de uma economia gerada pela sua produção e sua propriedade de fatores de produção, menos os rendimentos pagos pela utilização dos fatores de produção pertencentes ao resto do mundo, convertido em dólares internacionais, usando a paridade do poder de compra (PPP) taxas, dividido pela população no meio do ano.
Variável Quantitativa
Índice
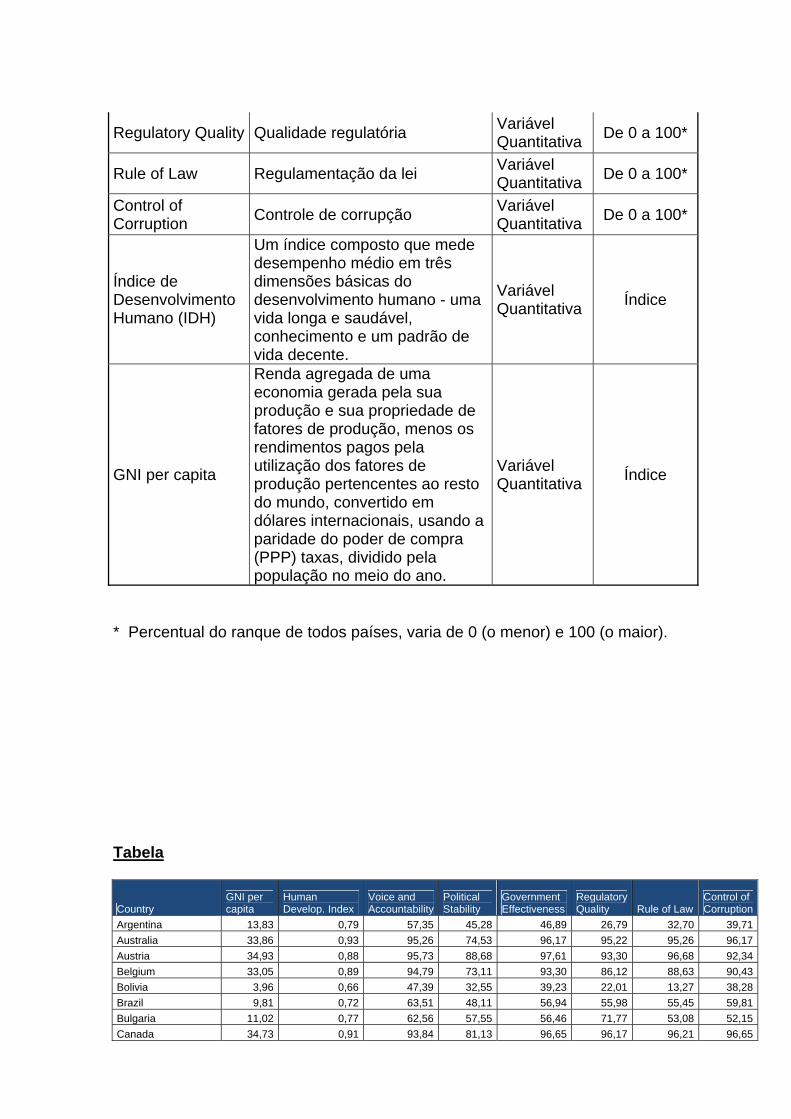
* Percentual do ranque de todos países, varia de 0 (o menor) e 100 (o maior). Tabela
Country GNI per capita
Human Develop. Index
Voice and Accountability
Political Stability
Government Effectiveness
Regulatory Quality Rule of Law
Control of Corruption
Argentina 13,83 0,79 57,35 45,28 46,89 26,79 32,70 39,71
Australia 33,86 0,93 95,26 74,53 96,17 95,22 95,26 96,17
Austria 34,93 0,88 95,73 88,68 97,61 93,30 96,68 92,34
Belgium 33,05 0,89 94,79 73,11 93,30 86,12 88,63 90,43
Bolivia 3,96 0,66 47,39 32,55 39,23 22,01 13,27 38,28
Brazil 9,81 0,72 63,51 48,11 56,94 55,98 55,45 59,81
Bulgaria 11,02 0,77 62,56 57,55 56,46 71,77 53,08 52,15
Canada 34,73 0,91 93,84 81,13 96,65 96,17 96,21 96,65
Chile 12,74 0,80 81,99 67,45 83,73 91,39 87,68 90,91
China 6,86 0,68 5,21 24,06 59,81 44,98 44,55 32,54
Colombia 8,04 0,71 40,76 8,96 60,77 60,29 45,02 43,06
Costa Rica 10,21 0,74 80,57 68,40 64,59 68,90 64,93 72,73
Cuba 5,25 0,77 6,16 55,19 45,93 5,26 34,12 71,77
Denmark 33,71 0,89 98,58 84,43 99,04 100,00 98,58 100,00
Dominican Republic 7,80 0,69 51,18 46,23 31,58 46,41 24,64 22,01
Egypt 5,32 0,64 13,27 17,92 40,19 46,89 51,66 34,45
Finland 31,61 0,88 97,16 94,34 99,52 99,04 100,00 98,09
France 30,11 0,88 89,10 70,75 89,47 87,08 90,52 89,00
Germany 33,92 0,90 92,89 74,06 91,87 93,78 92,42 93,30
Greece 24,52 0,86 73,46 40,09 68,42 73,68 66,82 55,50
Haiti 1,05 0,45 28,91 16,98 2,87 15,31 5,21 6,70
Hong Kong 42,85 0,89 66,35 77,83 94,74 99,52 91,00 94,74
Iceland 28,98 0,90 94,31 85,38 92,82 78,47 92,89 94,26
India 3,25 0,54 59,24 10,85 55,02 39,23 54,50 35,89
Ireland 29,07 0,91 92,42 83,02 87,56 94,74 94,31 92,82
Israel 25,46 0,89 67,77 9,43 86,60 84,69 76,30 72,25
Italy 26,33 0,87 75,83 62,26 67,94 77,03 62,56 57,42
Jamaica 6,43 0,73 60,19 32,08 62,68 59,81 37,44 44,98
Japan 31,86 0,90 82,46 76,89 88,52 80,86 88,15 91,87
Lebanon 12,92 0,74 35,55 8,49 43,06 53,59 30,33 21,53
Malaysia 13,19 0,76 31,28 51,89 82,30 71,29 65,40 61,24
Mexico 12,78 0,77 52,13 22,64 61,72 58,85 33,65 44,50
Netherlands 35,98 0,91 96,21 79,72 94,26 98,09 97,16 97,61
Nicaragua 2,38 0,59 33,18 26,42 15,79 40,19 24,17 23,44
Panama 11,69 0,77 62,09 46,70 60,29 64,11 51,18 45,45
Paraguay 4,57 0,66 44,55 19,34 17,70 41,15 19,43 24,88
Peru 7,93 0,72 49,76 20,28 47,37 66,51 32,23 50,24
Poland 16,80 0,81 81,04 83,49 72,73 79,43 69,19 70,33
Portugal 20,93 0,81 84,83 69,81 81,82 75,60 83,41 81,34
Russia 13,84 0,75 20,85 18,40 41,63 38,28 26,07 12,92
Saudi Arabia 22,12 0,77 3,79 35,85 52,63 55,02 60,19 62,20
South Africa 9,26 0,62 65,40 44,34 65,07 62,68 57,82 60,77
Spain 26,36 0,88 85,78 39,15 79,43 84,21 86,73 80,86
Sweden 34,62 0,90 99,05 88,21 98,56 96,65 99,53 99,04
Turkey 11,84 0,70 43,13 16,04 66,03 61,24 58,29 57,89United Arab Emirates 59,82 0,85 24,17 75,94 76,08 62,20 63,03 80,38
United Kingdom 32,98 0,86 91,94 58,02 92,34 97,13 94,79 89,95
United States 42,25 0,91 87,20 56,60 89,95 90,43 91,47 85,65
Uruguay 12,66 0,78 86,26 77,36 70,81 63,64 71,09 86,12
Venezuela 10,68 0,73 22,27 10,38 14,83 4,31 1,42 7,18
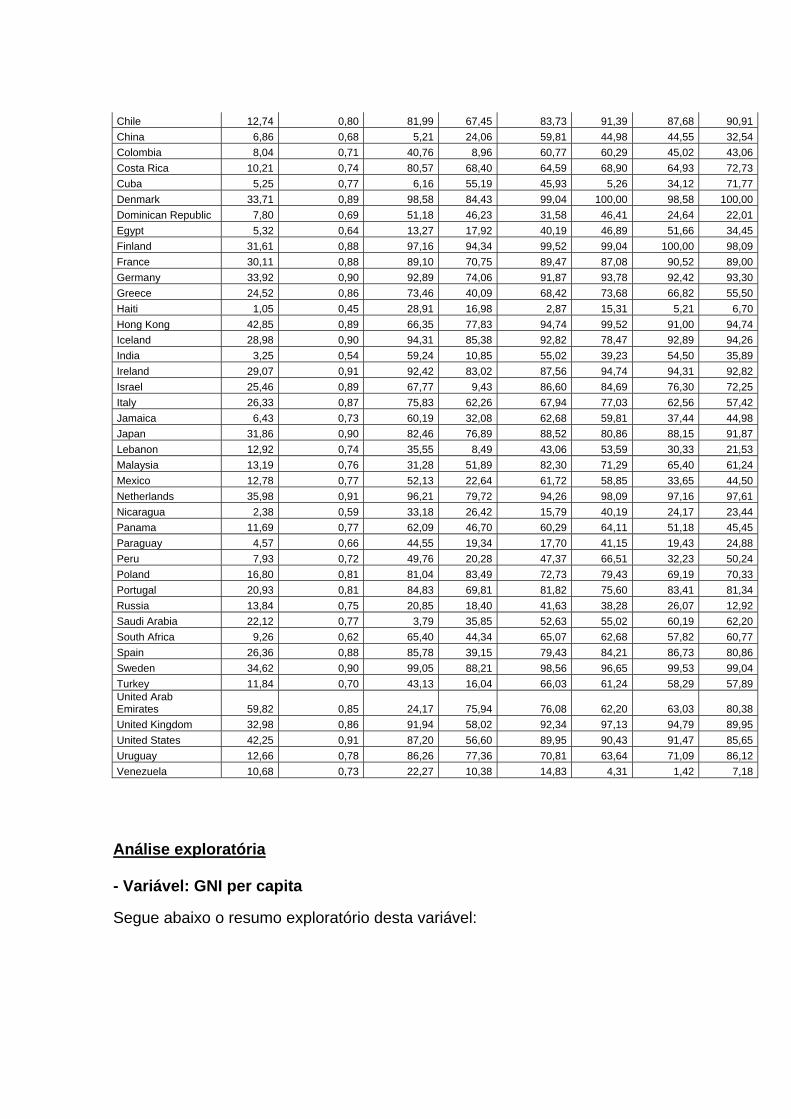
Análise exploratória - Variável: GNI per capita
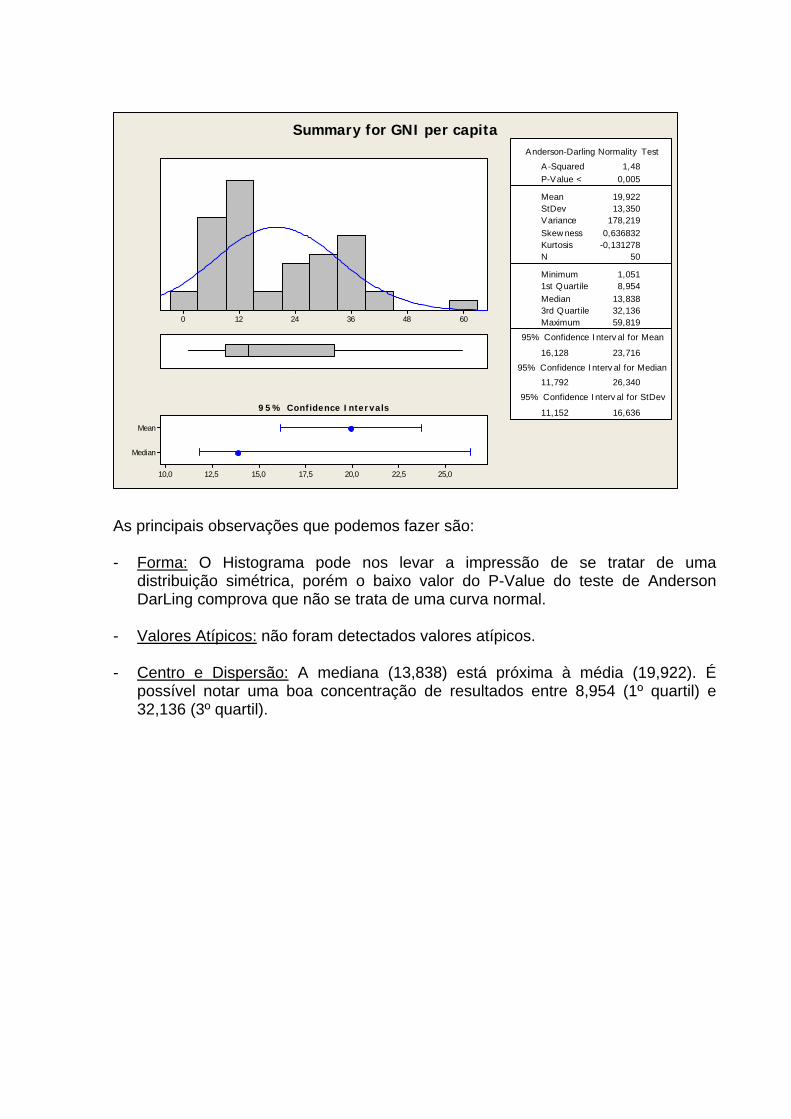
Segue abaixo o resumo exploratório desta variável:
60483624120
Median
Mean
25,022,520,017,515,012,510,0
1st Q uartile 8,954Median 13,8383rd Q uartile 32,136Maximum 59,819
16,128 23,716
11,792 26,340
11,152 16,636
A -Squared 1,48P-V alue < 0,005
Mean 19,922StDev 13,350V ariance 178,219Skewness 0,636832Kurtosis -0,131278N 50
Minimum 1,051
A nderson-Darling Normality Test
95% C onfidence Interv al for Mean
95% C onfidence Interv al for Median
95% C onfidence Interv al for StDev9 5% Confidence Intervals
Summary for GNI per capita
As principais observações que podemos fazer são:
- Forma: O Histograma pode nos levar a impressão de se tratar de uma distribuição simétrica, porém o baixo valor do P-Value do teste de Anderson DarLing comprova que não se trata de uma curva normal.
- Valores Atípicos: não foram detectados valores atípicos.
- Centro e Dispersão: A mediana (13,838) está próxima à média (19,922). É possível notar uma boa concentração de resultados entre 8,954 (1º quartil) e 32,136 (3º quartil).
Venezu
ela
Urugu
ay
United
Stat
es
Un ited K
ingdom
United
Arab
Emira
tes
Turk
ey
Swed
enSp
ain
South
Afri
ca
Saudi
Arab
iaRu
ssia
Portu
gal
Polan
dP eru
Parag
uay
Pana
ma
Nicaragu
a
Netherl
ands
Mexico
Malays
ia
Leba
nonJap an
Jamaic
aIta
lyIsr
ael
Irelan
dIn
d ia
Icela
nd
Hong Ko
ngHaiti
Greece
German
y
F rance
Finlan
dEg
ypt
Domini
can Re
publi
c
DenmarkCuba
Co sta Ri
ca
Co lombia
China
Chile
Canad
a
Bulga
riaBraz
il
Bolivia
Belgium
Austria
Austra
lia
Argen
tina
60
50
40
30
20
10
0
Country
Mea
n of
GNI
per
cap
ita
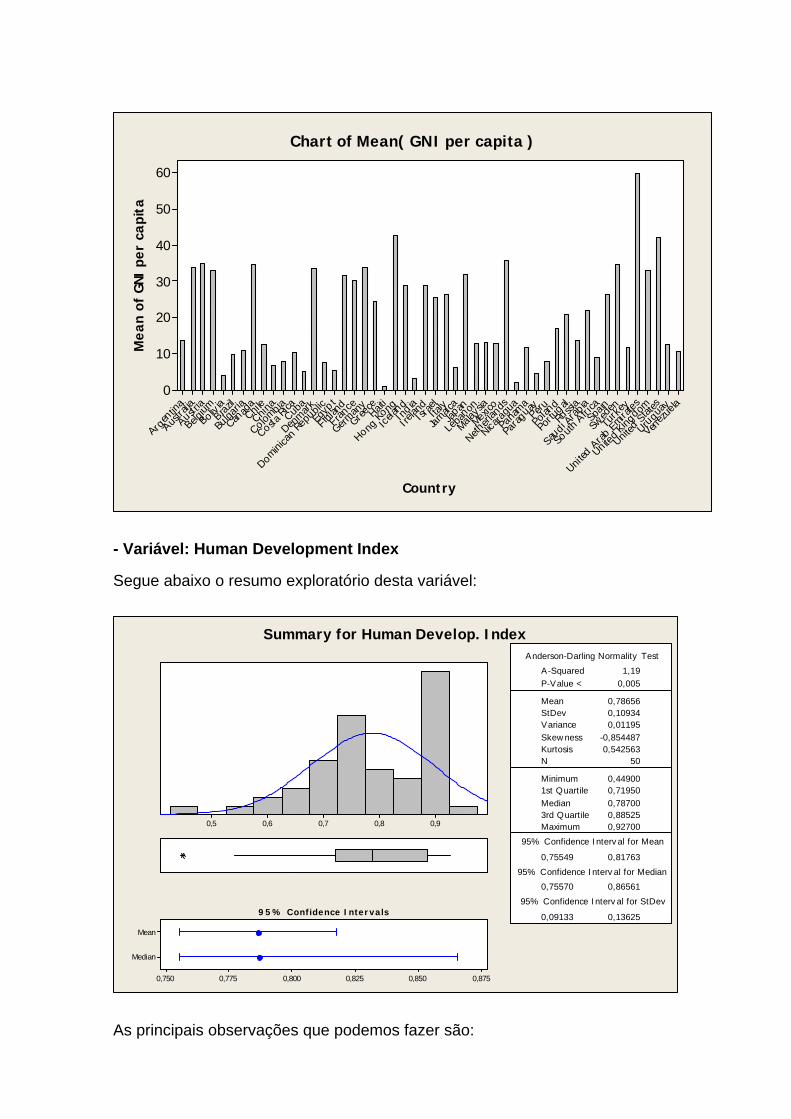
Chart of Mean( GNI per capita )
- Variável: Human Development Index
Segue abaixo o resumo exploratório desta variável:
0,90,80,70,60,5
Median
Mean
0,8750,8500,8250,8000,7750,750
1st Q uartile 0,71950Median 0,787003rd Q uartile 0,88525Maximum 0,92700
0,75549 0,81763
0,75570 0,86561
0,09133 0,13625
A -Squared 1,19P-V alue < 0,005
Mean 0,78656StDev 0,10934V ariance 0,01195Skewness -0,854487Kurtosis 0,542563N 50
Minimum 0,44900
A nderson-Darling Normality Test
95% C onfidence Interv al for Mean
95% C onfidence Interv al for Median
95% C onfidence Interv al for StDev9 5% Confidence Intervals
Summary for Human Develop. Index
As principais observações que podemos fazer são:
- Forma: O Histograma pode nos levar a impressão de se tratar de uma
distribuição simétrica, porém o baixo valor do P-Value do teste de Anderson DarLing comprova que não se trata de uma curva normal.
- Valores Atípicos: apresentou um valor atípico.
- Centro e Dispersão: A mediana (0,787) está praticamente igual à média (0,786). É possível notar uma boa concentração de resultados entre 0,719 (1º quartil) e 0,885 (3º quartil).
Venezu
ela
Urugu
ay
United
Stat
es
United
King
dom
Unite
d Arab
Emira
tes
Turk
ey
Sweden
Spain
Sou th
Africa
S aud i A
rabia
Russi
a
Portu
gal
Polan
dP eru
Parag
uay
Pana
ma
Nicaragu
a
Netherl
ands
Mexico
Malay sia
Leba
non
Japa
n
Jamaic
aIta
lyIsr
ael
Irelan
dIn
dia
Icela
nd
Hong Kon
gHait
i
Greece
Germ
any
Fran
ce
Finlan
dEgy
pt
Domini
can Re
pub lic
DenmarkCuba
Co sta Ri
ca
Colombia
China
Ch ile
Canad
a
Bulgar
iaBr
azil
Boliv
ia
Belgi
um
Austria
Austra
lia
Argen
tina
0,9
0,8
0,7
0,6
0,5
0,4
0,3
0,2
0,1
0,0
Country
Mea
n of
Hum
an D
evel
op. I
ndex
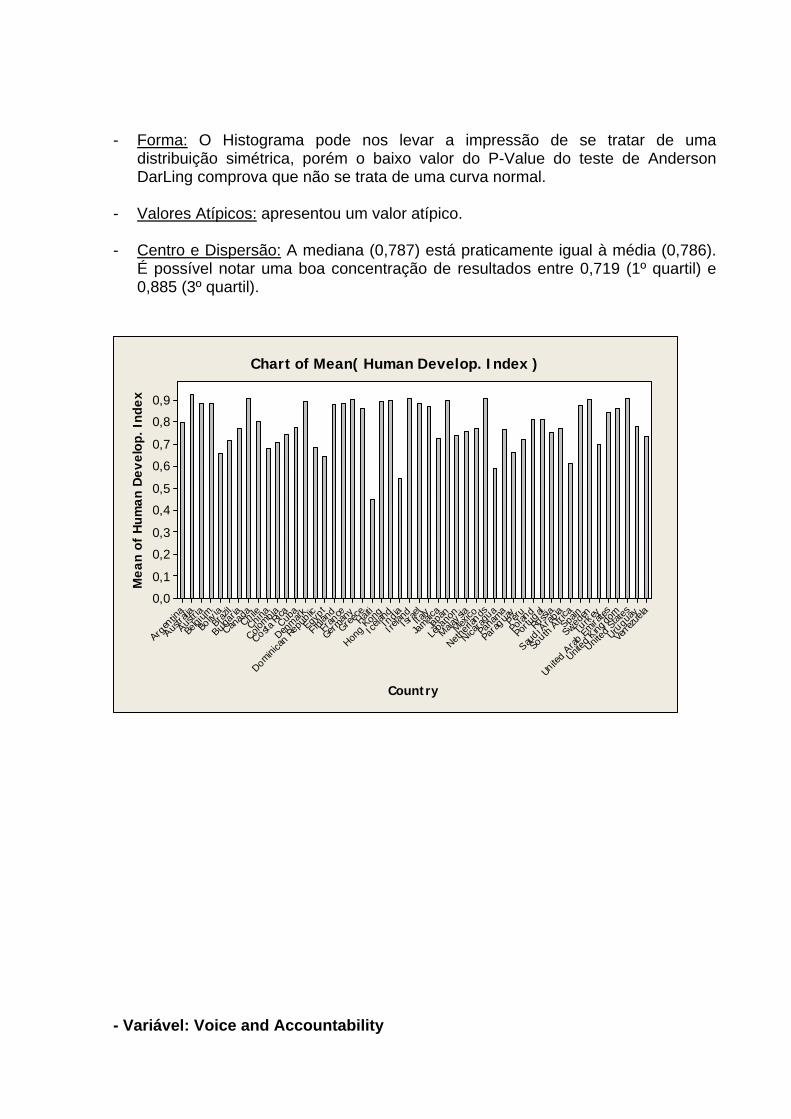
Chart of Mean( Human Develop. Index )
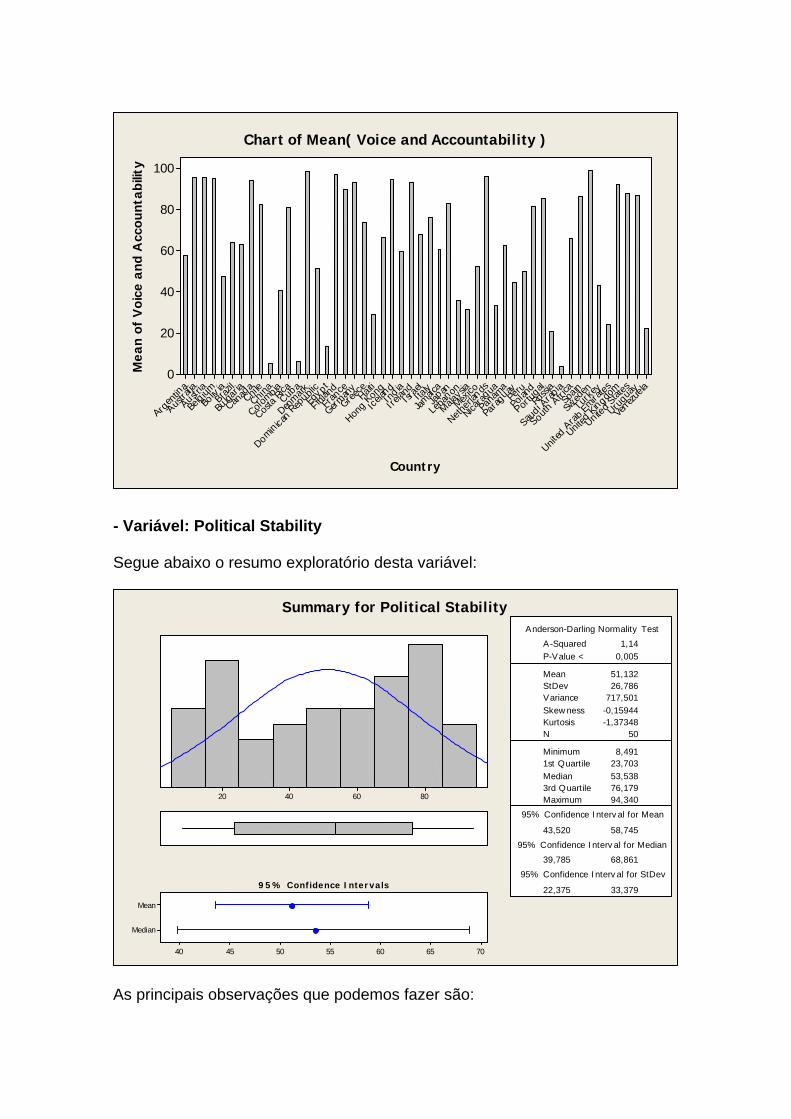
- Variável: Voice and Accountability
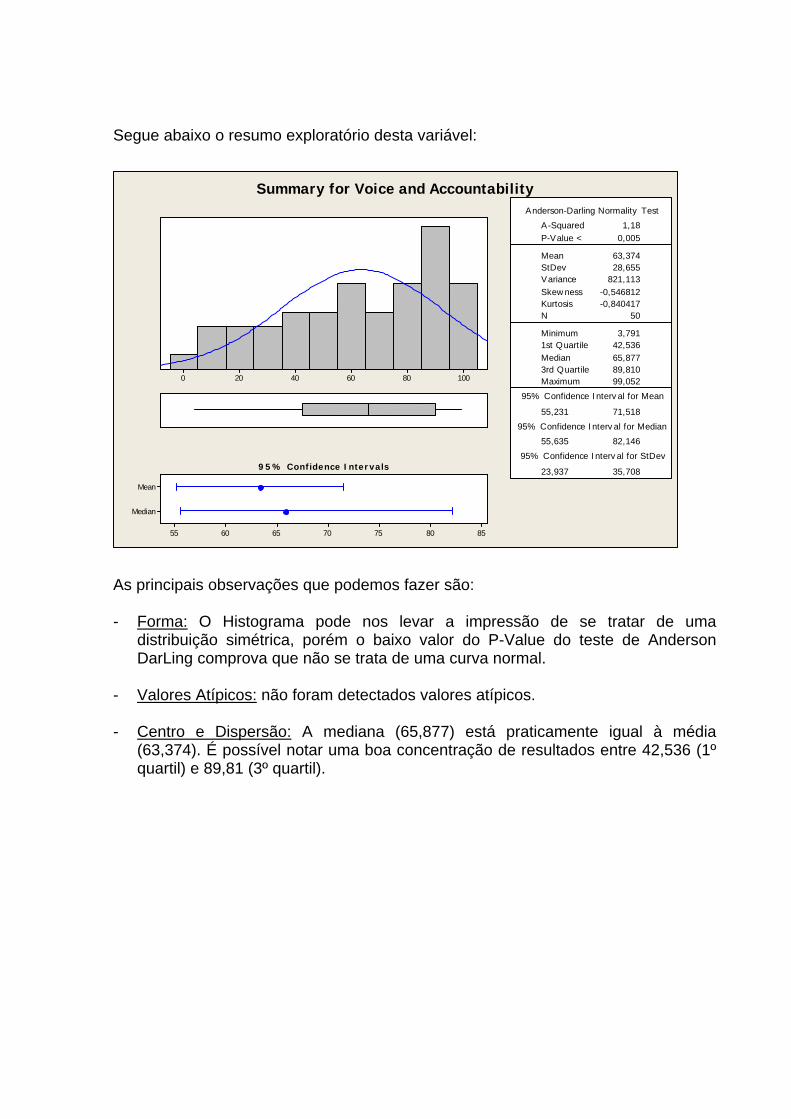
Segue abaixo o resumo exploratório desta variável:
100806040200
Median
Mean
85807570656055
1st Q uartile 42,536Median 65,8773rd Q uartile 89,810Maximum 99,052
55,231 71,518
55,635 82,146
23,937 35,708
A -Squared 1,18P-V alue < 0,005
Mean 63,374StDev 28,655V ariance 821,113Skewness -0,546812Kurtosis -0,840417N 50
Minimum 3,791
A nderson-Darling Normality Test
95% C onfidence Interv al for Mean
95% C onfidence Interv al for Median
95% C onfidence Interv al for StDev9 5% Confidence Intervals
Summary for Voice and Accountability
As principais observações que podemos fazer são:
- Forma: O Histograma pode nos levar a impressão de se tratar de uma distribuição simétrica, porém o baixo valor do P-Value do teste de Anderson DarLing comprova que não se trata de uma curva normal.
- Valores Atípicos: não foram detectados valores atípicos.
- Centro e Dispersão: A mediana (65,877) está praticamente igual à média (63,374). É possível notar uma boa concentração de resultados entre 42,536 (1º quartil) e 89,81 (3º quartil).
Venezu
ela
Urugu
ay
Un ited S
tates
United
Kingd
om
United
Arab
Emira
tes
Turke
y
Swed
enSp
ain
South
Africa
Saud
i Arab
iaRu
ssia
Portug
al
Polan
dPe
ru
Parag
uay
Pana
ma
Nicara
gua
Netherl
ands
Mexico
Malays
ia
Leba
nonJap an
Jamaic
aIta
lyIsr
ael
Irelan
dIn
d ia
Icela
nd
Hong Kon
gHait
i
Greece
German
y
Fran
ce
Finlan
dEg
y pt
Domin ica
n Rep
ublic
DenmarkCuba
Costa
Rica
Colombia
China
Chile
Canad
a
Bulga
riaBr
azil
Boliv
ia
Belg ium
Austria
Austra
lia
Argen
tina
100
80
60
40
20
0
Country
Mea
n of
Voi
ce a
nd A
ccou
ntab
ility
Chart of Mean( Voice and Accountability )
- Variável: Political Stability Segue abaixo o resumo exploratório desta variável:
80604020
Median
Mean
70656055504540
1st Q uartile 23,703Median 53,5383rd Q uartile 76,179Maximum 94,340
43,520 58,745
39,785 68,861
22,375 33,379
A -Squared 1,14P-V alue < 0,005
Mean 51,132StDev 26,786V ariance 717,501Skewness -0,15944Kurtosis -1,37348N 50
Minimum 8,491
A nderson-Darling Normality Test
95% C onfidence Interv al for Mean
95% C onfidence Interv al for Median
95% C onfidence Interv al for StDev9 5% Confidence Intervals
Summary for Political Stability
As principais observações que podemos fazer são:
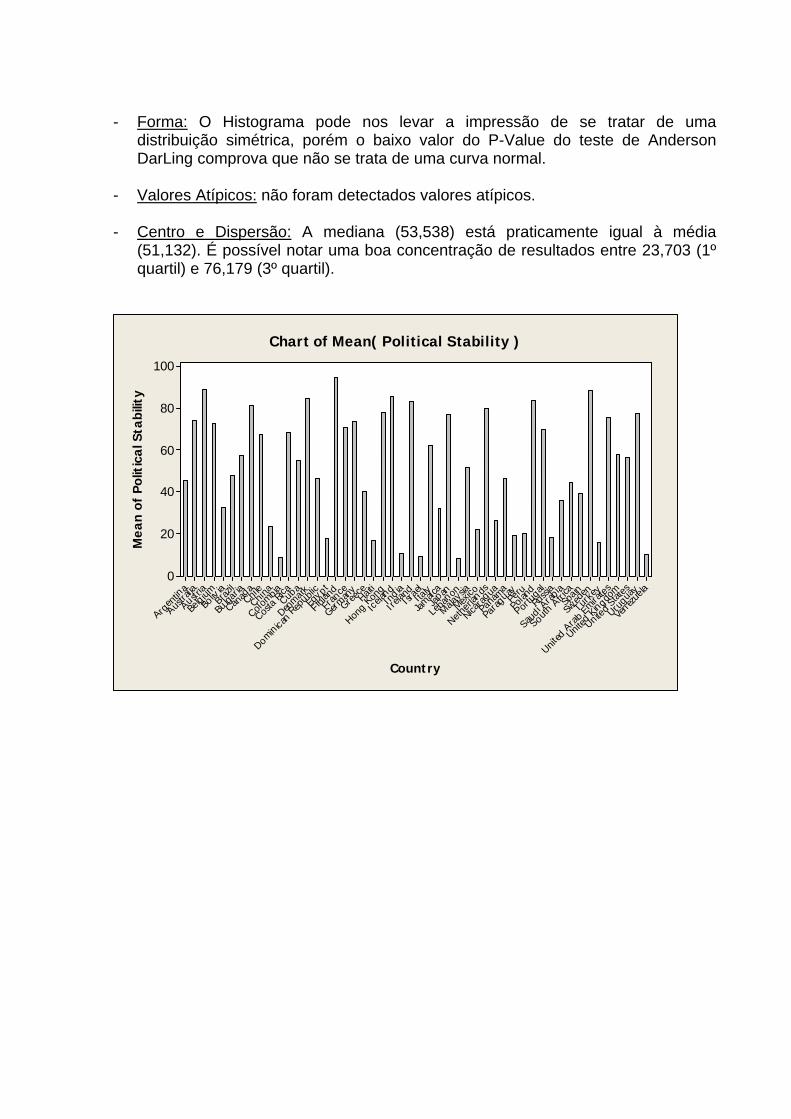
- Forma: O Histograma pode nos levar a impressão de se tratar de uma distribuição simétrica, porém o baixo valor do P-Value do teste de Anderson DarLing comprova que não se trata de uma curva normal.
- Valores Atípicos: não foram detectados valores atípicos.
- Centro e Dispersão: A mediana (53,538) está praticamente igual à média (51,132). É possível notar uma boa concentração de resultados entre 23,703 (1º quartil) e 76,179 (3º quartil).
Venezu
ela
Urugu
ay
Un ited S
tates
United
Kingd
om
United
Arab
Emira
tes
Turke
y
Swed
enSp
ain
South
Africa
Saud
i Arab
iaRu
ssia
Portug
al
Polan
dPe
ru
Parag
uay
Pana
ma
Nicara
gua
Netherl
ands
Mexico
Malays
ia
Leba
nonJap an
Jamaic
aIta
lyIsr
ael
Irelan
dIn
d ia
Icela
nd
Hong Kon
gHait
i
Greece
German
y
Fran
ce
Finlan
dEg
y pt
Domin ica
n Rep
ublic
DenmarkCuba
Costa
Rica
Colombia
China
Chile
Canad
a
Bulga
riaBr
azil
Boliv
ia
Belg ium
Austria
Austra
lia
Argen
tina
100
80
60
40
20
0
Country
Mea
n of
Pol
itic
al S
tabi
lity
Chart of Mean( Political Stability )
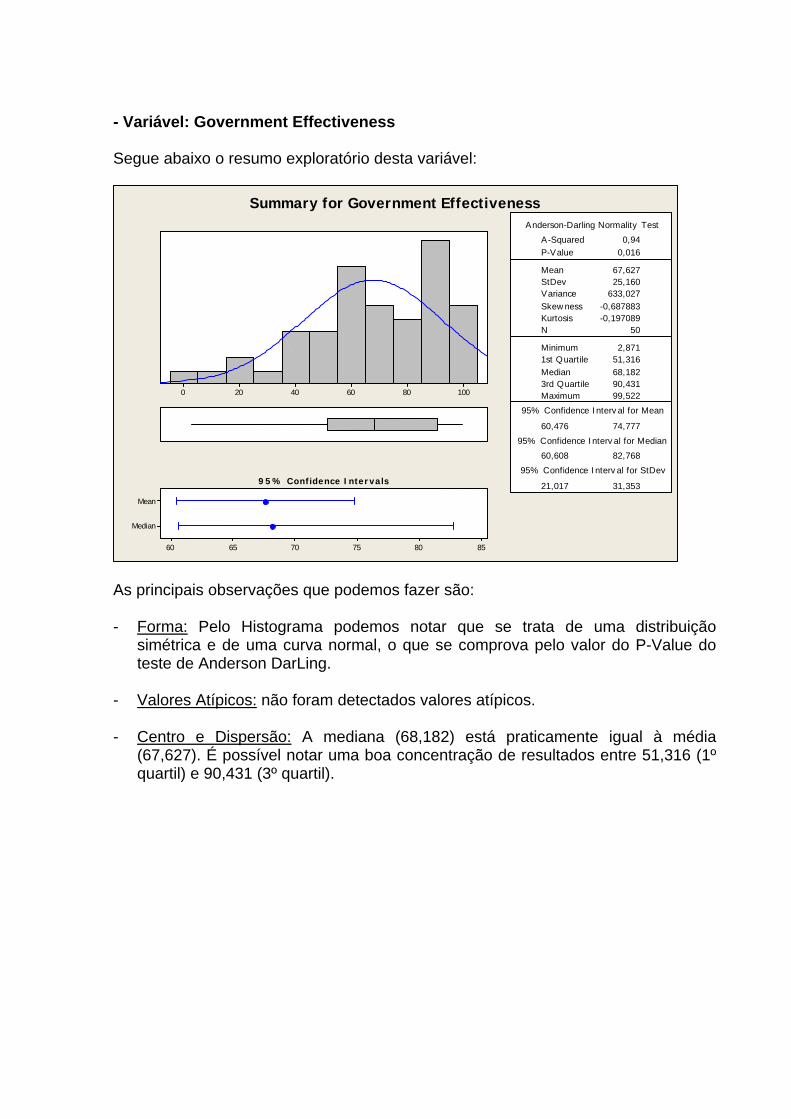
- Variável: Government Effectiveness Segue abaixo o resumo exploratório desta variável:
100806040200
Median
Mean
858075706560
1st Q uartile 51,316Median 68,1823rd Q uartile 90,431Maximum 99,522
60,476 74,777
60,608 82,768
21,017 31,353
A -Squared 0,94P-V alue 0,016
Mean 67,627StDev 25,160V ariance 633,027Skewness -0,687883Kurtosis -0,197089N 50
Minimum 2,871
A nderson-Darling Normality Test
95% C onfidence Interv al for Mean
95% C onfidence Interv al for Median
95% C onfidence Interv al for StDev9 5% Confidence Intervals
Summary for Government Effectiveness
As principais observações que podemos fazer são:
- Forma: Pelo Histograma podemos notar que se trata de uma distribuição simétrica e de uma curva normal, o que se comprova pelo valor do P-Value do teste de Anderson DarLing.
- Valores Atípicos: não foram detectados valores atípicos.
- Centro e Dispersão: A mediana (68,182) está praticamente igual à média (67,627). É possível notar uma boa concentração de resultados entre 51,316 (1º quartil) e 90,431 (3º quartil).
Venezu
ela
Urugu
ay
Un ited S
tates
United
Kingd
om
United
Arab
Emira
tes
Turke
y
Swed
enSp
ain
South
Africa
Saud
i Arab
iaRu
ssia
Portug
al
Polan
dPe
ru
Parag
uay
Pana
ma
Nicara
gua
Netherl
ands
Mexico
Malays
ia
Leba
nonJap an
Jamaic
aIta
lyIsr
ael
Irelan
dIn
d ia
Icela
nd
Hong Kon
gHait
i
Greece
German
y
Fran
ce
Finlan
dEg
y pt
Domin ica
n Rep
ublic
DenmarkCuba
Costa
Rica
Colombia
China
Chile
Canad
a
Bulga
riaBr
azil
Boliv
ia
Belg ium
Austria
Austra
lia
Argen
tina
100
80
60
40
20
0
Country
Mea
n of
Gov
ernm
ent
Effe
ctiv
enes
sChart of Mean( Government Effectiveness )
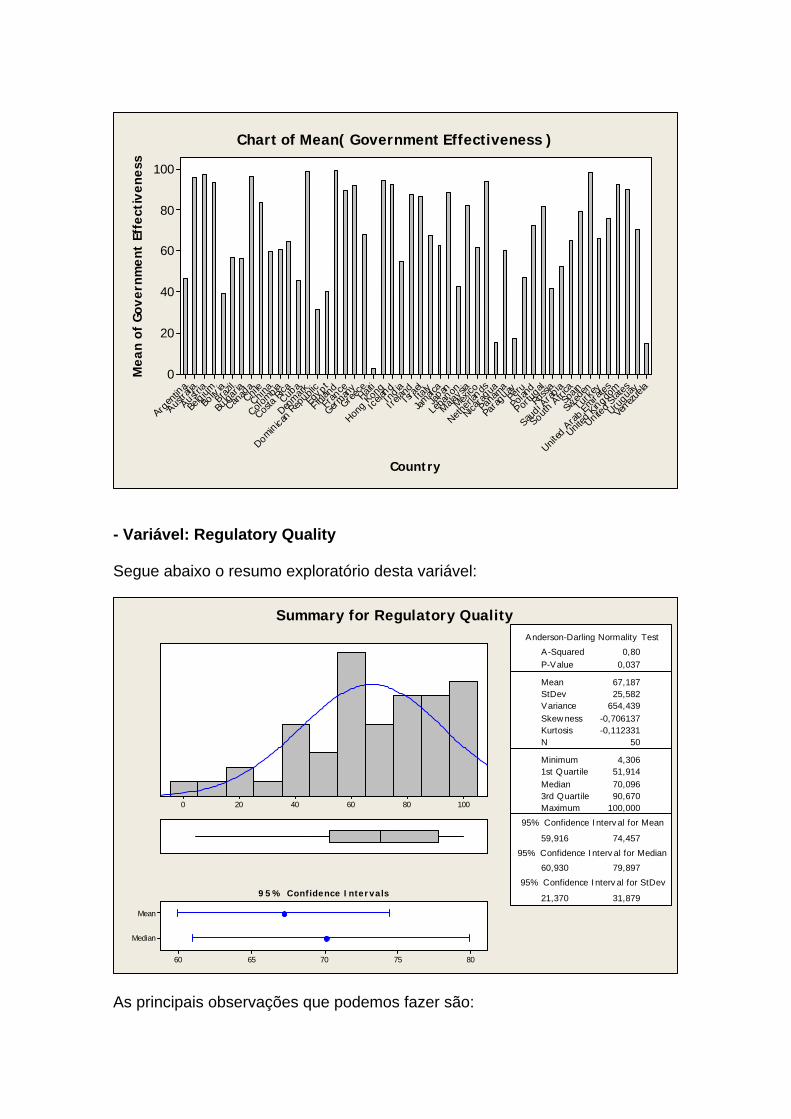
- Variável: Regulatory Quality Segue abaixo o resumo exploratório desta variável:
100806040200
Median
Mean
8075706560
1st Q uartile 51,914Median 70,0963rd Q uartile 90,670Maximum 100,000
59,916 74,457
60,930 79,897
21,370 31,879
A -Squared 0,80P-V alue 0,037
Mean 67,187StDev 25,582V ariance 654,439Skewness -0,706137Kurtosis -0,112331N 50
Minimum 4,306
A nderson-Darling Normality Test
95% C onfidence Interv al for Mean
95% C onfidence Interv al for Median
95% C onfidence Interv al for StDev9 5% Confidence Intervals
Summary for Regulatory Quality
As principais observações que podemos fazer são:
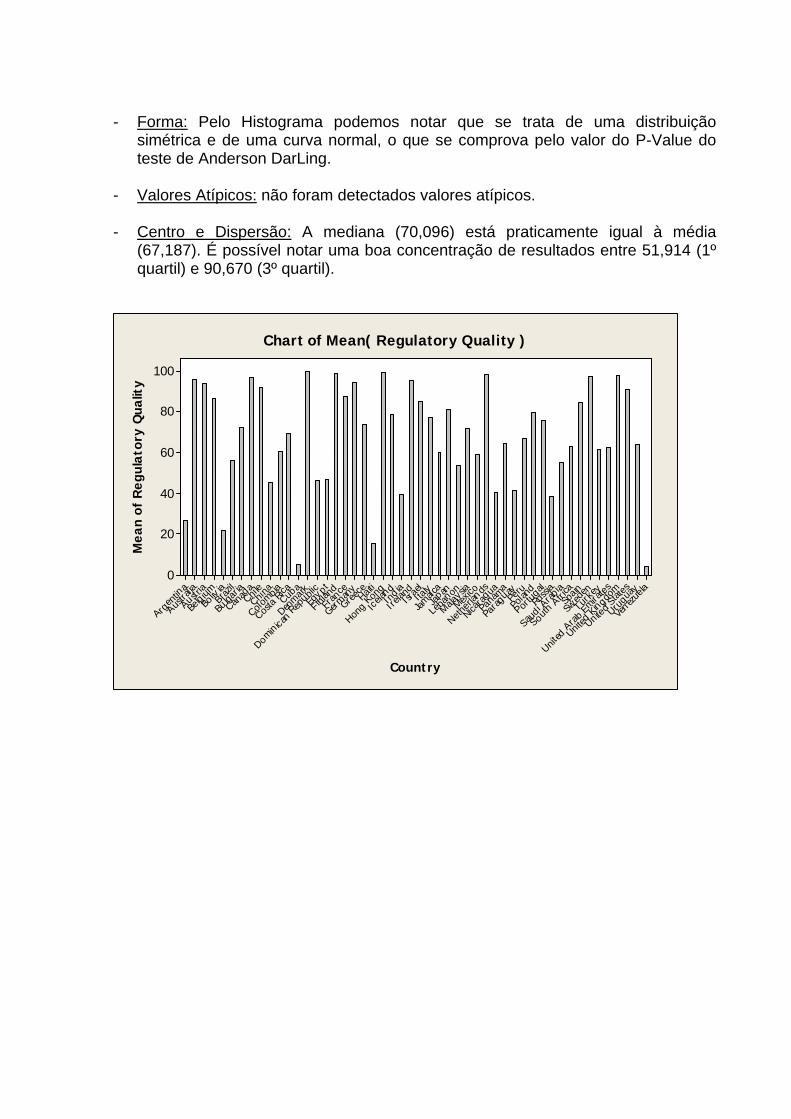
- Forma: Pelo Histograma podemos notar que se trata de uma distribuição simétrica e de uma curva normal, o que se comprova pelo valor do P-Value do teste de Anderson DarLing.
- Valores Atípicos: não foram detectados valores atípicos.
- Centro e Dispersão: A mediana (70,096) está praticamente igual à média (67,187). É possível notar uma boa concentração de resultados entre 51,914 (1º quartil) e 90,670 (3º quartil).
Venezu
ela
Urugu
ay
Un ited S
tates
United
Kingd
om
United
Arab
Emira
tes
Turke
y
Swed
enSp
ain
South
Africa
Saud
i Arab
iaRu
ssia
Portug
al
Polan
dPe
ru
Parag
uay
Pana
ma
Nicara
gua
Netherl
ands
Mexico
Malays
ia
Leba
nonJap an
Jamaic
aIta
lyIsr
ael
Irelan
dIn
d ia
Icela
nd
Hong Kon
gHait
i
Greece
German
y
Fran
ce
Finlan
dEg
y pt
Domin ica
n Rep
ublic
DenmarkCuba
Costa
Rica
Colombia
China
Chile
Canad
a
Bulga
riaBr
azil
Boliv
ia
Belg ium
Austria
Austra
lia
Argen
tina
100
80
60
40
20
0
Country
Mea
n of
Reg
ulat
ory
Qua
lity
Chart of Mean( Regulatory Quality )
- Variável: Rule of Law
Segue abaixo o resumo exploratório desta variável:
100806040200
Median
Mean
85807570656055
1st Q uartile 36,611Median 63,9813rd Q uartile 91,114Maximum 100,000
54,900 71,148
54,036 84,501
23,879 35,622
A -Squared 1,13P-V alue 0,005
Mean 63,024StDev 28,586V ariance 817,156Skewness -0,390746Kurtosis -0,984852N 50
Minimum 1,422
A nderson-Darling Normality Test
95% C onfidence Interv al for Mean
95% C onfidence Interv al for Median
95% C onfidence Interv al for StDev9 5% Confidence Intervals
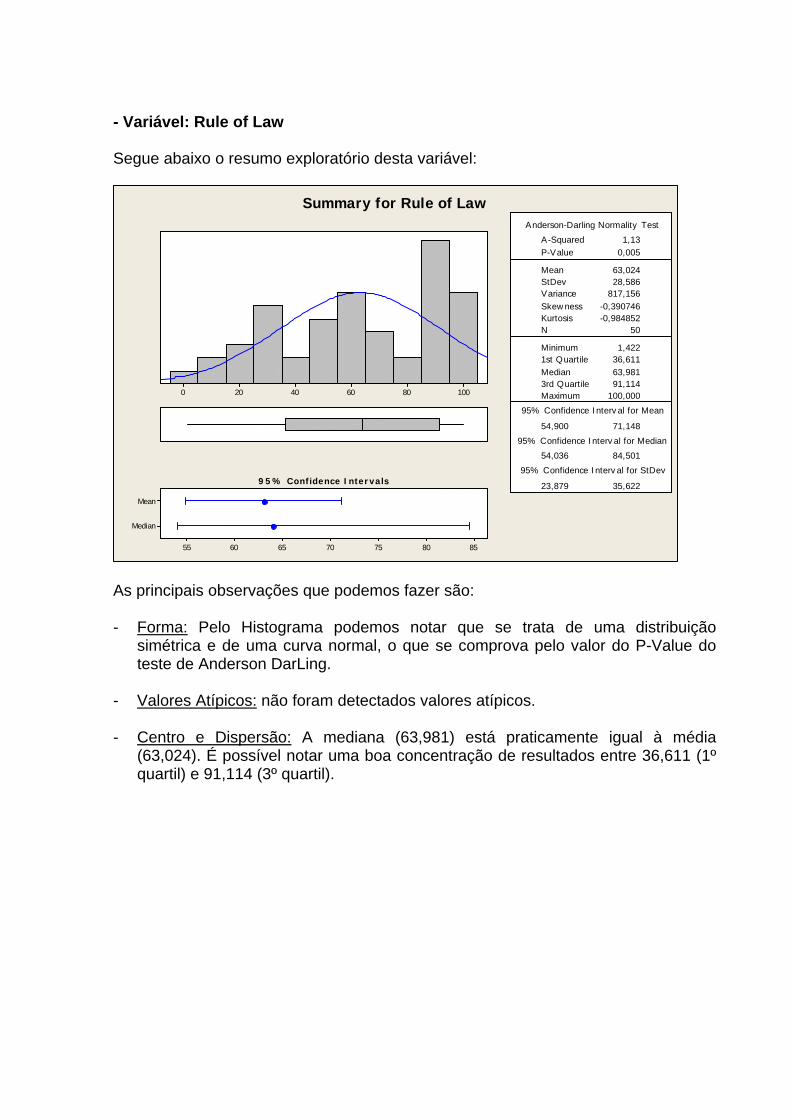
Summary for Rule of Law
As principais observações que podemos fazer são:
- Forma: Pelo Histograma podemos notar que se trata de uma distribuição
simétrica e de uma curva normal, o que se comprova pelo valor do P-Value do teste de Anderson DarLing.
- Valores Atípicos: não foram detectados valores atípicos.
- Centro e Dispersão: A mediana (63,981) está praticamente igual à média (63,024). É possível notar uma boa concentração de resultados entre 36,611 (1º quartil) e 91,114 (3º quartil).
Venezu
ela
Urugu
ay
Un ited S
tates
United
Kingd
om
United
Arab
Emira
tes
Turke
y
Swed
enSp
ain
South
Africa
Saud
i Arab
iaRu
ssia
Portug
al
Polan
dPe
ru
Parag
uay
Pana
ma
Nicara
gua
Netherl
ands
Mexico
Malays
ia
Leba
nonJap an
Jamaic
aIta
lyIsr
ael
Irelan
dIn
d ia
Icela
nd
Hong Kon
gHait
i
Greece
German
y
Fran
ce
Finlan
dEg
y pt
Domin ica
n Rep
ublic
DenmarkCuba
Costa
Rica
Colombia
China
Chile
Canad
a
Bulga
riaBr
azil
Boliv
ia
Belg ium
Austria
Austra
lia
Argen
tina
100
80
60
40
20
0
Country
Mea
n of
Rul
e of
Law
Chart of Mean( Rule of Law )
- Variável: Control of Corruption Segue abaixo o resumo exploratório desta variável:
10080604020
Median
Mean
85807570656055
1st Q uartile 42,225Median 66,2683rd Q uartile 91,148Maximum 100,000
56,087 72,047
54,403 82,753
23,457 34,992
A -Squared 1,22P-V alue < 0,005
Mean 64,067StDev 28,081V ariance 788,521Skewness -0,42417Kurtosis -1,02812N 50
Minimum 6,699
A nderson-Darling Normality Test
95% C onfidence Interv al for Mean
95% C onfidence Interv al for Median
95% C onfidence Interv al for StDev9 5% Confidence Intervals
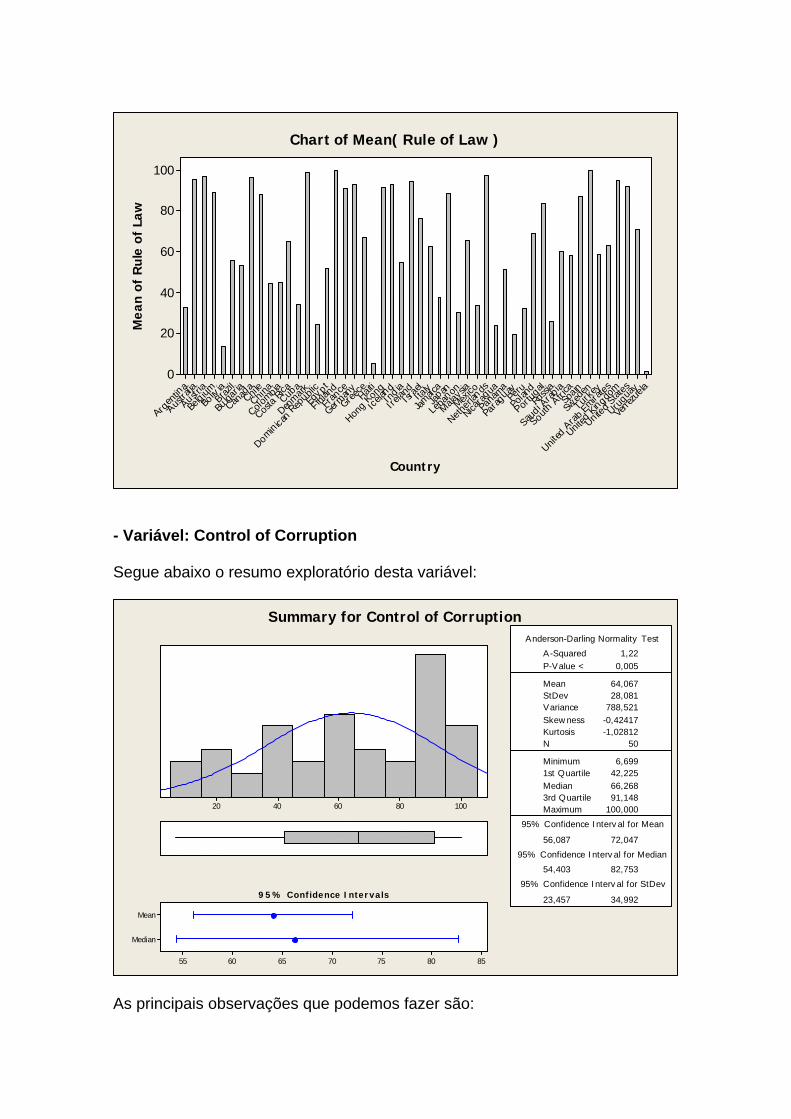
Summary for Control of Corruption
As principais observações que podemos fazer são:
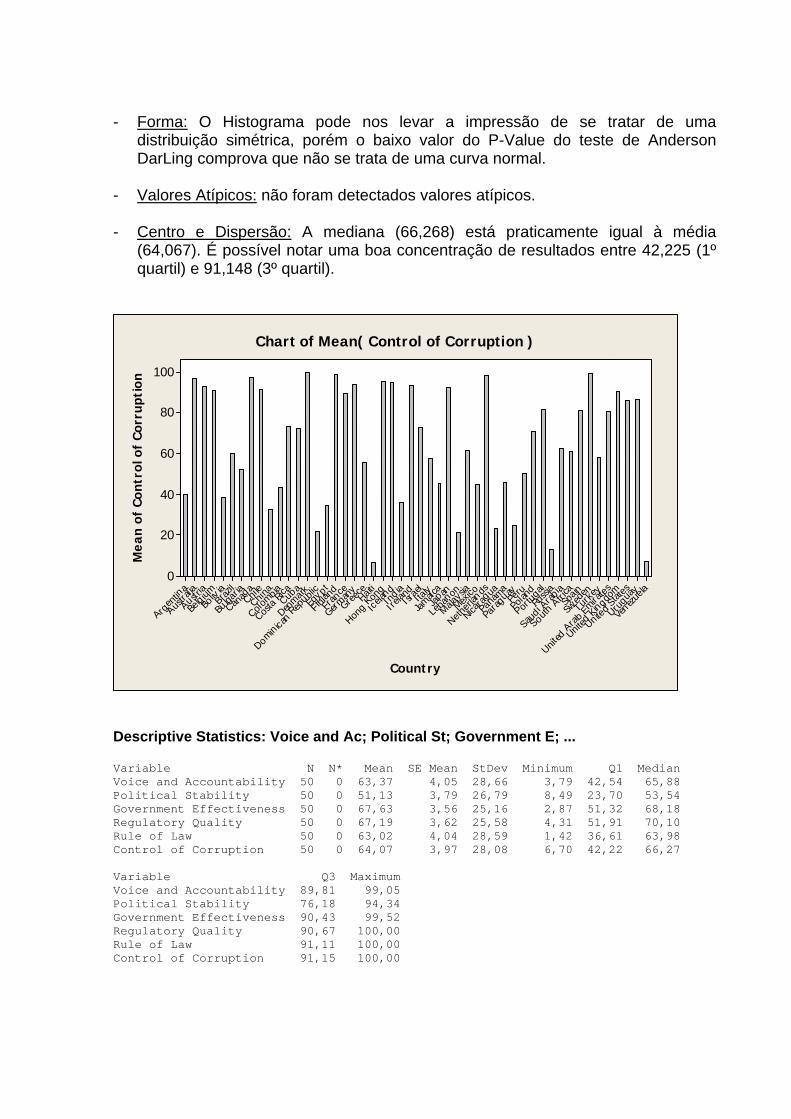
- Forma: O Histograma pode nos levar a impressão de se tratar de uma distribuição simétrica, porém o baixo valor do P-Value do teste de Anderson DarLing comprova que não se trata de uma curva normal.
- Valores Atípicos: não foram detectados valores atípicos.
- Centro e Dispersão: A mediana (66,268) está praticamente igual à média (64,067). É possível notar uma boa concentração de resultados entre 42,225 (1º quartil) e 91,148 (3º quartil).
Venezu
ela
Urugu
ay
Un ited S
tates
United
Kingd
om
United
Arab
Emira
tes
Turke
y
Swed
enSp
ain
South
Africa
Saud
i Arab
iaRu
ssia
Portug
al
Polan
dPe
ru
Parag
uay
Pana
ma
Nicara
gua
Netherl
ands
Mexico
Malays
ia
Leba
nonJap an
Jamaic
aIta
lyIsr
ael
Irelan
dIn
d ia
Icela
nd
Hong Kon
gHait
i
Greece
German
y
Fran
ce
Finlan
dEg
y pt
Domin ica
n Rep
ublic
DenmarkCuba
Costa
Rica
Colombia
China
Chile
Canad
a
Bulga
riaBr
azil
Boliv
ia
Belg ium
Austria
Austra
lia
Argen
tina
100
80
60
40
20
0
Country
Mea
n of
Con
trol
of
Corr
upti
on
Chart of Mean( Control of Corruption )
Descriptive Statistics: Voice and Ac; Political St; Government E; ... Variable N N* Mean SE Mean StDev Minimum Q1 Median Voice and Accountability 50 0 63,37 4,05 28,66 3,79 42,54 65,88 Political Stability 50 0 51,13 3,79 26,79 8,49 23,70 53,54 Government Effectiveness 50 0 67,63 3,56 25,16 2,87 51,32 68,18 Regulatory Quality 50 0 67,19 3,62 25,58 4,31 51,91 70,10 Rule of Law 50 0 63,02 4,04 28,59 1,42 36,61 63,98 Control of Corruption 50 0 64,07 3,97 28,08 6,70 42,22 66,27 Variable Q3 Maximum Voice and Accountability 89,81 99,05 Political Stability 76,18 94,34 Government Effectiveness 90,43 99,52 Regulatory Quality 90,67 100,00 Rule of Law 91,11 100,00 Control of Corruption 91,15 100,00

O radar mostra que a estabilidade política apresentam uma media muita abaixo das demais, deste modo, ao menos metade dos países selecionados precisam garantir uma política mais consistente e duradoura. São eles: países sub-desenvolvidos em sua maioria da América Latina, países em desenvolvimento, países com conflitos religiosos (Israel), países socialistas e países europeus que estão em crise econômica como a Espanha e Grécia. É possível verificar também que a efetividade do governo e a qualidade do regulatório apresentam maiores médias, o que nos permite concluir que como ambas tratam-se de distribuições simétricas, a maoria dos países possuem rigor e medidas eficazes para regular o governo. One-way ANOVA: Voice and Ac; Political St; Government E; Regulatory Q; ... Source DF SS MS F P Factor 5 9032 1806 2,45 0,034 Error 294 217156 739 Total 299 226188 S = 27,18 R-Sq = 3,99% R-Sq(adj) = 2,36% Level N Mean StDev Voice and Accountability 50 63,37 28,66 Political Stability 50 51,13 26,79 Government Effectiveness 50 67,63 25,16 Regulatory Quality 50 67,19 25,58 Rule of Law 50 63,02 28,59 Control of Corruption 50 64,07 28,08 Individual 95% CIs For Mean Based on Pooled StDev Level ------+---------+---------+---------+--- Voice and Accountability (--------*---------)
010203040506070
Voice andAccountability
Political Stability
GovernmentEffectiveness
RegulatoryQuality
Rule of Law
Control ofCorruption
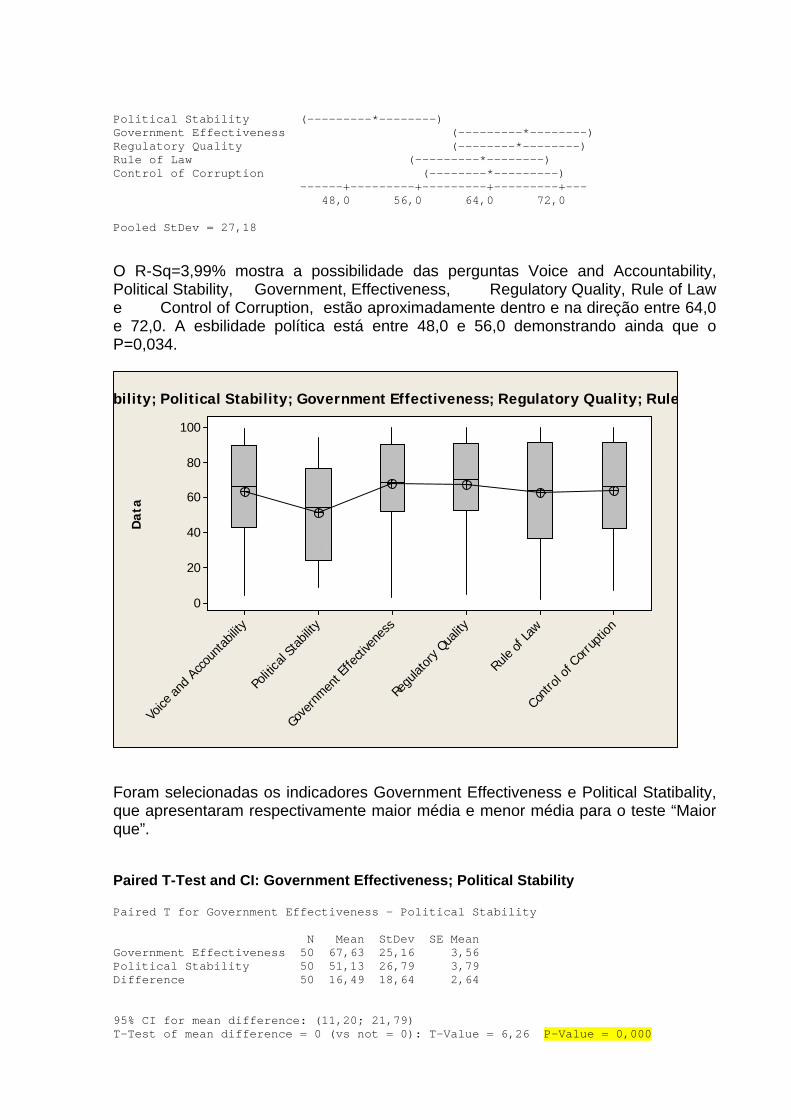
Political Stability (---------*--------) Government Effectiveness (---------*--------) Regulatory Quality (--------*--------) Rule of Law (---------*--------) Control of Corruption (--------*---------) ------+---------+---------+---------+--- 48,0 56,0 64,0 72,0 Pooled StDev = 27,18
O R-Sq=3,99% mostra a possibilidade das perguntas Voice and Accountability, Political Stability, Government, Effectiveness, Regulatory Quality, Rule of Law e Control of Corruption, estão aproximadamente dentro e na direção entre 64,0 e 72,0. A esbilidade política está entre 48,0 e 56,0 demonstrando ainda que o P=0,034.
Contr
ol of
Corru
ption
Rule
of La
w
Regu
latory Q
uality
Gove
rnmen
t Effe
ctive
ness
Poli ti
cal S
tabilit
y
Voice
and A
ccoun
tabilit
y
100
80
60
40
20
0
Dat
a
ability; Political Stability; Government Effectiveness; Regulatory Quality; Rule
Foram selecionadas os indicadores Government Effectiveness e Political Statibality, que apresentaram respectivamente maior média e menor média para o teste “Maior que”. Paired T-Test and CI: Government Effectiveness; Political Stability Paired T for Government Effectiveness - Political Stability N Mean StDev SE Mean Government Effectiveness 50 67,63 25,16 3,56 Political Stability 50 51,13 26,79 3,79 Difference 50 16,49 18,64 2,64 95% CI for mean difference: (11,20; 21,79) T-Test of mean difference = 0 (vs not = 0): T-Value = 6,26 P-Value = 0,000
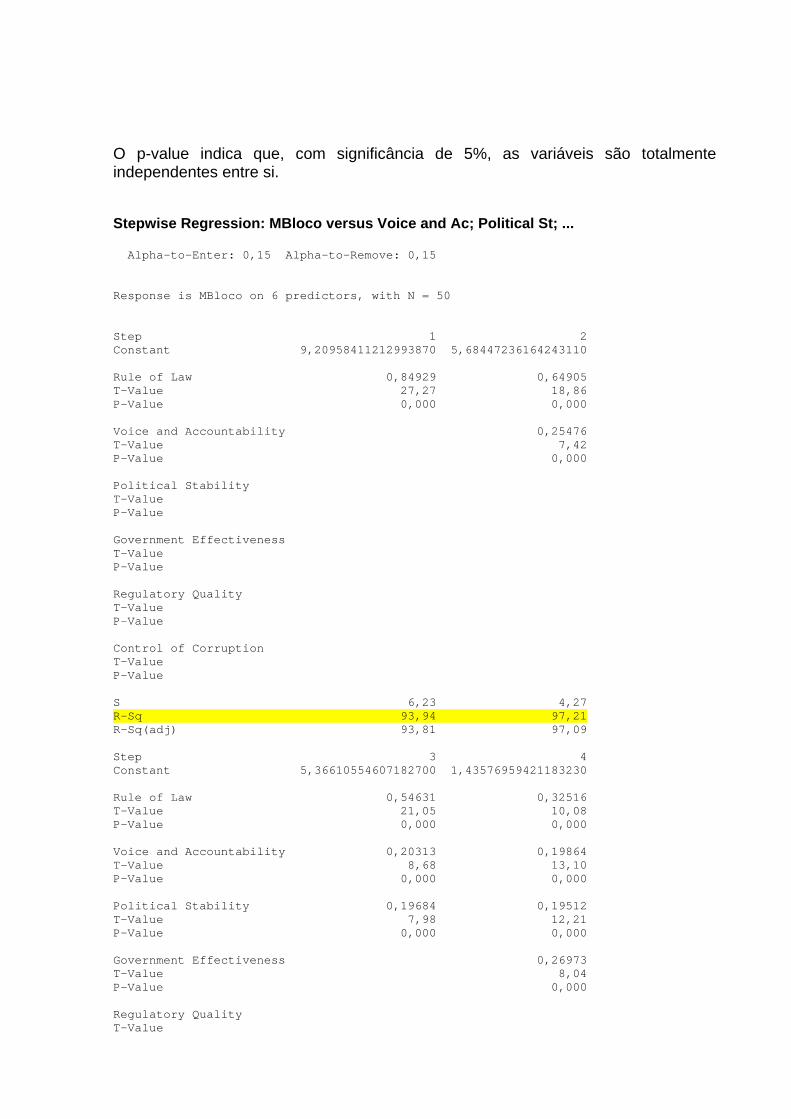
O p-value indica que, com significância de 5%, as variáveis são totalmente independentes entre si. Stepwise Regression: MBloco versus Voice and Ac; Political St; ... Alpha-to-Enter: 0,15 Alpha-to-Remove: 0,15 Response is MBloco on 6 predictors, with N = 50 Step 1 2 Constant 9,20958411212993870 5,68447236164243110 Rule of Law 0,84929 0,64905 T-Value 27,27 18,86 P-Value 0,000 0,000 Voice and Accountability 0,25476 T-Value 7,42 P-Value 0,000 Political Stability T-Value P-Value Government Effectiveness T-Value P-Value Regulatory Quality T-Value P-Value Control of Corruption T-Value P-Value S 6,23 4,27 R-Sq 93,94 97,21 R-Sq(adj) 93,81 97,09 Step 3 4 Constant 5,36610554607182700 1,43576959421183230 Rule of Law 0,54631 0,32516 T-Value 21,05 10,08 P-Value 0,000 0,000 Voice and Accountability 0,20313 0,19864 T-Value 8,68 13,10 P-Value 0,000 0,000 Political Stability 0,19684 0,19512 T-Value 7,98 12,21 P-Value 0,000 0,000 Government Effectiveness 0,26973 T-Value 8,04 P-Value 0,000 Regulatory Quality T-Value
P-Value Control of Corruption T-Value P-Value S 2,80 1,81 R-Sq 98,83 99,52 R-Sq(adj) 98,75 99,48 Step 5 6 Constant 0,21757051328617316 0,00000000000001368 Rule of Law 0,25605 0,16667 T-Value 10,16 * P-Value 0,000 * Voice and Accountability 0,16816 0,16667 T-Value 14,34 * P-Value 0,000 * Political Stability 0,21385 0,16667 T-Value 18,24 * P-Value 0,000 * Government Effectiveness 0,23274 0,16667 T-Value 9,48 * P-Value 0,000 * Regulatory Quality 0,13469 0,16667 T-Value 6,68 * P-Value 0,000 * Control of Corruption 0,16667 T-Value * P-Value * S 1,29 0,000000 R-Sq 99,76 100,00 R-Sq(adj) 99,73 100,00
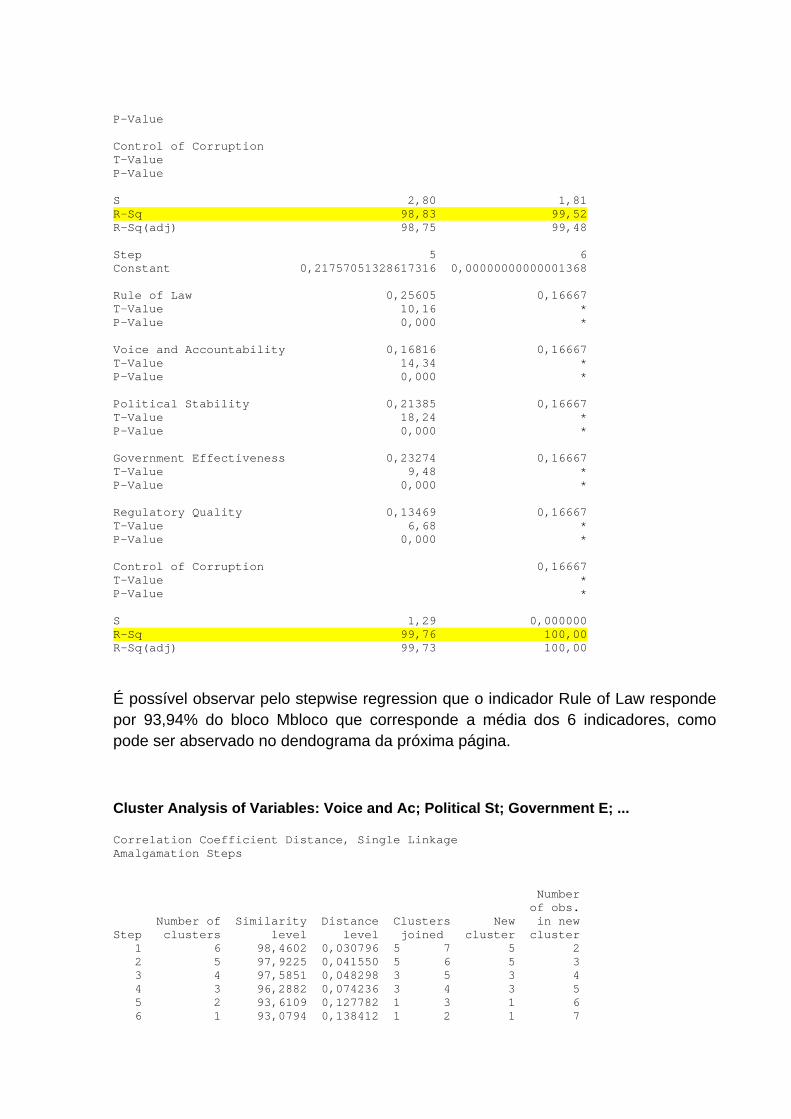
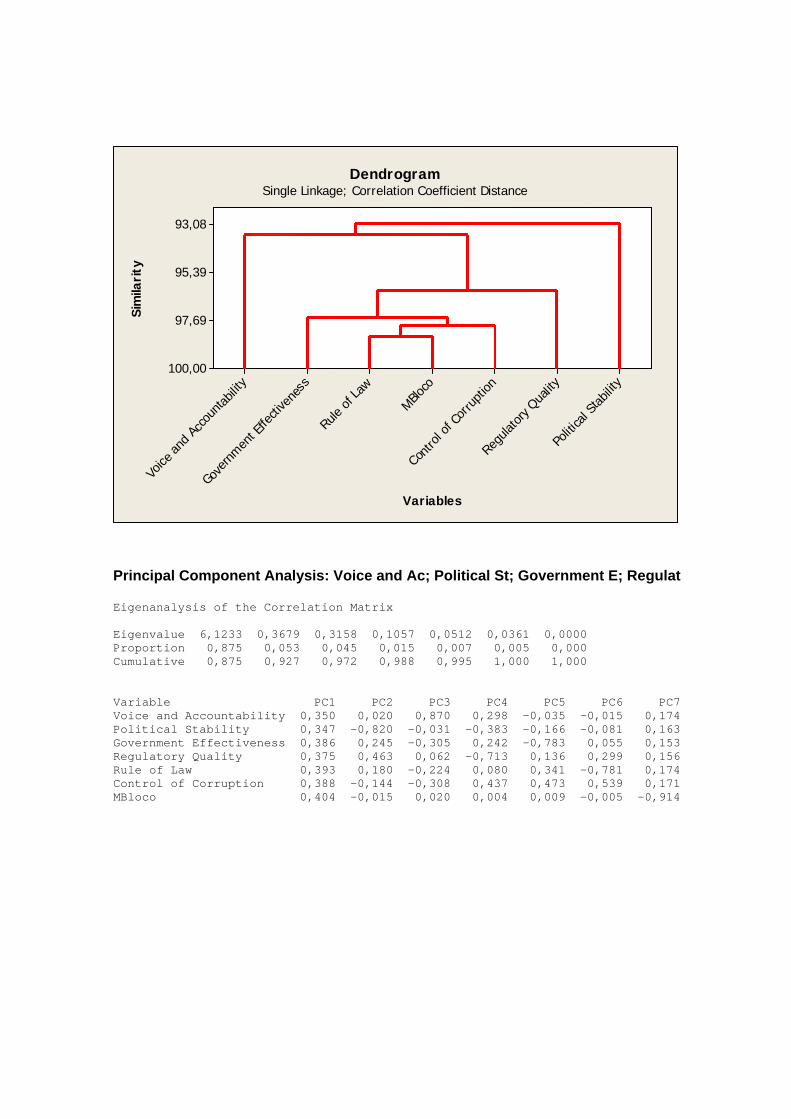
É possível observar pelo stepwise regression que o indicador Rule of Law responde por 93,94% do bloco Mbloco que corresponde a média dos 6 indicadores, como pode ser abservado no dendograma da próxima página.
Cluster Analysis of Variables: Voice and Ac; Political St; Government E; ... Correlation Coefficient Distance, Single Linkage Amalgamation Steps Number of obs. Number of Similarity Distance Clusters New in new Step clusters level level joined cluster cluster 1 6 98,4602 0,030796 5 7 5 2 2 5 97,9225 0,041550 5 6 5 3 3 4 97,5851 0,048298 3 5 3 4 4 3 96,2882 0,074236 3 4 3 5 5 2 93,6109 0,127782 1 3 1 6 6 1 93,0794 0,138412 1 2 1 7
Poli ti
cal S
tabilit
y
Regu
latory
Qua
lity
Contr
ol of
Corru
ption
MBloco
Rule
of La
w
Gove
rnmen
t Effe
ctive
ness
Voice
and A
ccou
ntabil
ity
93,08
95,39
97,69
100,00
Variables
Sim
ilari
ty
DendrogramSingle Linkage; Correlation Coefficient Distance
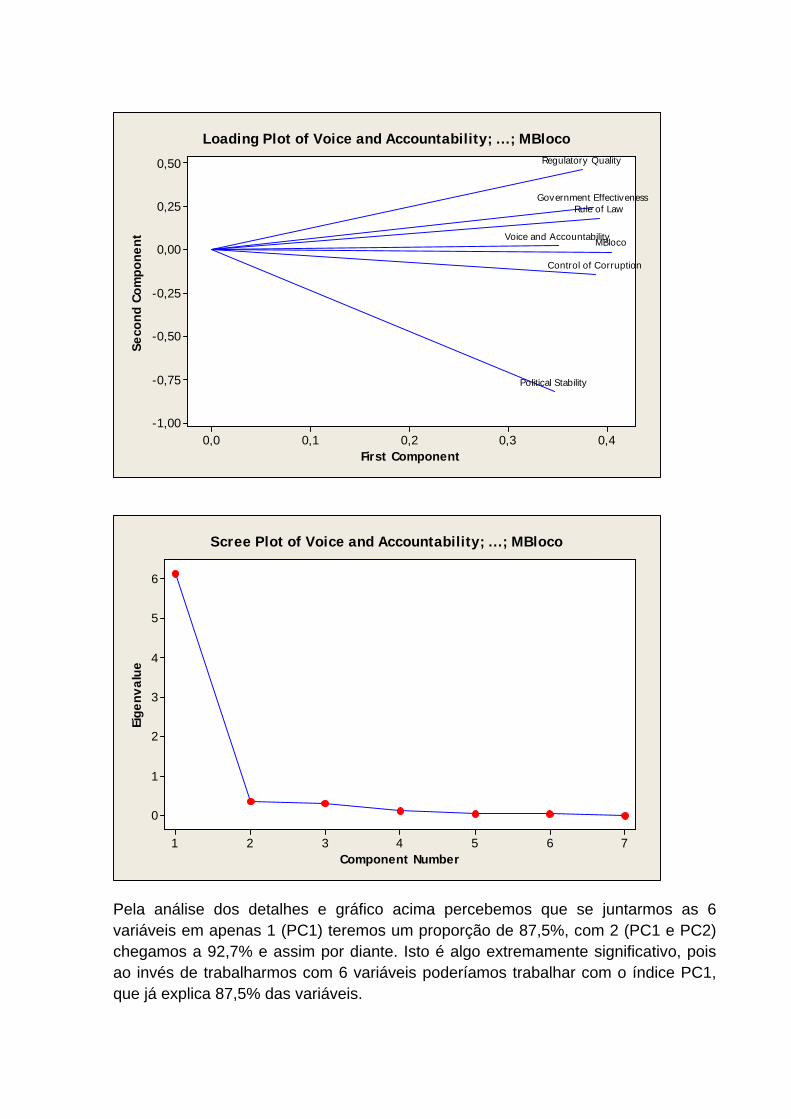
Principal Component Analysis: Voice and Ac; Political St; Government E; Regulat Eigenanalysis of the Correlation Matrix Eigenvalue 6,1233 0,3679 0,3158 0,1057 0,0512 0,0361 0,0000 Proportion 0,875 0,053 0,045 0,015 0,007 0,005 0,000 Cumulative 0,875 0,927 0,972 0,988 0,995 1,000 1,000 Variable PC1 PC2 PC3 PC4 PC5 PC6 PC7 Voice and Accountability 0,350 0,020 0,870 0,298 -0,035 -0,015 0,174 Political Stability 0,347 -0,820 -0,031 -0,383 -0,166 -0,081 0,163 Government Effectiveness 0,386 0,245 -0,305 0,242 -0,783 0,055 0,153 Regulatory Quality 0,375 0,463 0,062 -0,713 0,136 0,299 0,156 Rule of Law 0,393 0,180 -0,224 0,080 0,341 -0,781 0,174 Control of Corruption 0,388 -0,144 -0,308 0,437 0,473 0,539 0,171 MBloco 0,404 -0,015 0,020 0,004 0,009 -0,005 -0,914
0,40,30,20,10,0
0,50
0,25
0,00
-0,25
-0,50
-0,75
-1,00
First Component
Seco
nd C
ompo
nent MBloco
Control of Corruption
Rule of Law
Regulatory Quality
Government Effectiveness
Political Stability
Voice and Accountability
Loading Plot of Voice and Accountability; ...; MBloco
7654321
6
5
4
3
2
1
0
Component Number
Eige
nval
ue
Scree Plot of Voice and Accountability; ...; MBloco
Pela análise dos detalhes e gráfico acima percebemos que se juntarmos as 6 variáveis em apenas 1 (PC1) teremos um proporção de 87,5%, com 2 (PC1 e PC2) chegamos a 92,7% e assim por diante. Isto é algo extremamente significativo, pois ao invés de trabalharmos com 6 variáveis poderíamos trabalhar com o índice PC1, que já explica 87,5% das variáveis.
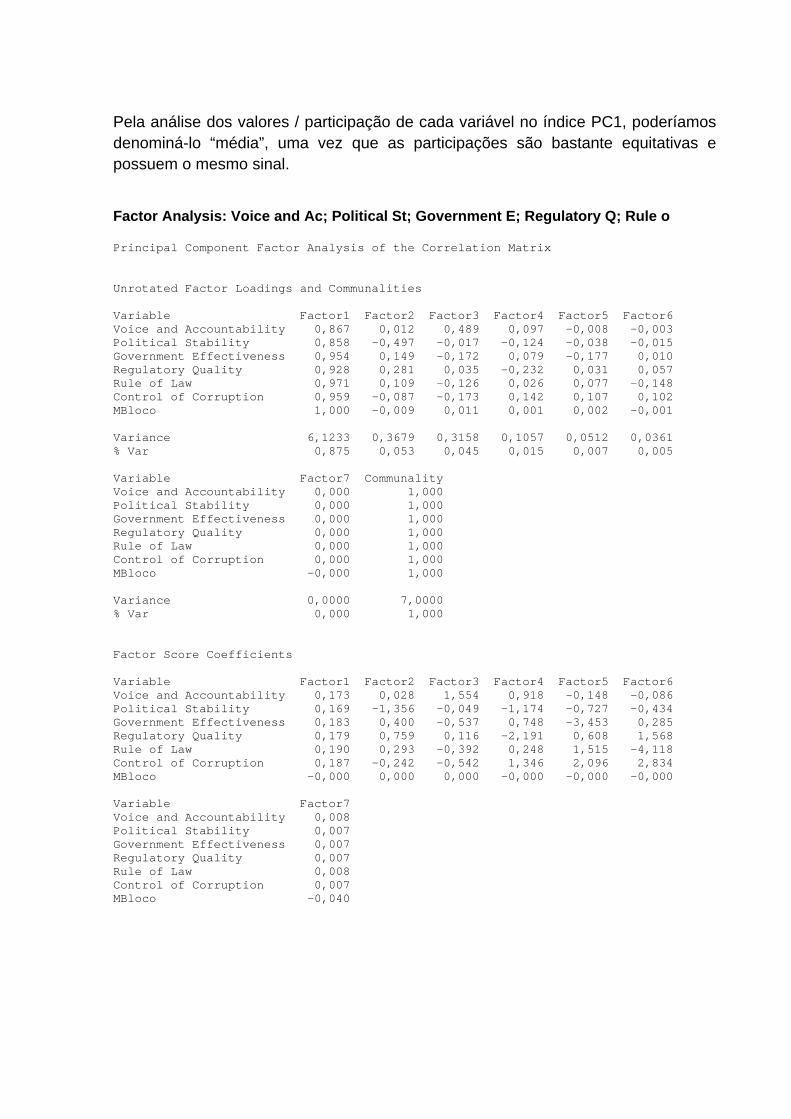
Pela análise dos valores / participação de cada variável no índice PC1, poderíamos denominá-lo “média”, uma vez que as participações são bastante equitativas e possuem o mesmo sinal.
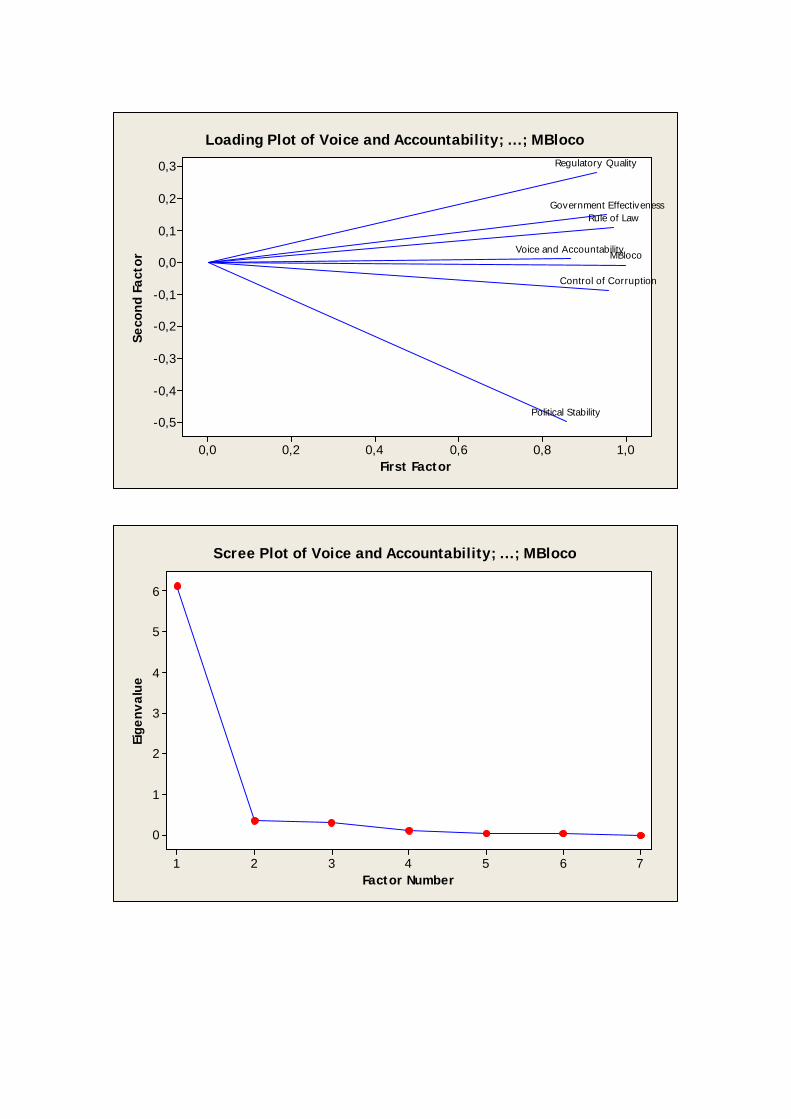
Factor Analysis: Voice and Ac; Political St; Government E; Regulatory Q; Rule o Principal Component Factor Analysis of the Correlation Matrix Unrotated Factor Loadings and Communalities Variable Factor1 Factor2 Factor3 Factor4 Factor5 Factor6 Voice and Accountability 0,867 0,012 0,489 0,097 -0,008 -0,003 Political Stability 0,858 -0,497 -0,017 -0,124 -0,038 -0,015 Government Effectiveness 0,954 0,149 -0,172 0,079 -0,177 0,010 Regulatory Quality 0,928 0,281 0,035 -0,232 0,031 0,057 Rule of Law 0,971 0,109 -0,126 0,026 0,077 -0,148 Control of Corruption 0,959 -0,087 -0,173 0,142 0,107 0,102 MBloco 1,000 -0,009 0,011 0,001 0,002 -0,001 Variance 6,1233 0,3679 0,3158 0,1057 0,0512 0,0361 % Var 0,875 0,053 0,045 0,015 0,007 0,005 Variable Factor7 Communality Voice and Accountability 0,000 1,000 Political Stability 0,000 1,000 Government Effectiveness 0,000 1,000 Regulatory Quality 0,000 1,000 Rule of Law 0,000 1,000 Control of Corruption 0,000 1,000 MBloco -0,000 1,000 Variance 0,0000 7,0000 % Var 0,000 1,000 Factor Score Coefficients Variable Factor1 Factor2 Factor3 Factor4 Factor5 Factor6 Voice and Accountability 0,173 0,028 1,554 0,918 -0,148 -0,086 Political Stability 0,169 -1,356 -0,049 -1,174 -0,727 -0,434 Government Effectiveness 0,183 0,400 -0,537 0,748 -3,453 0,285 Regulatory Quality 0,179 0,759 0,116 -2,191 0,608 1,568 Rule of Law 0,190 0,293 -0,392 0,248 1,515 -4,118 Control of Corruption 0,187 -0,242 -0,542 1,346 2,096 2,834 MBloco -0,000 0,000 0,000 -0,000 -0,000 -0,000 Variable Factor7 Voice and Accountability 0,008 Political Stability 0,007 Government Effectiveness 0,007 Regulatory Quality 0,007 Rule of Law 0,008 Control of Corruption 0,007 MBloco -0,040
1,00,80,60,40,20,0
0,3
0,2
0,1
0,0
-0,1
-0,2
-0,3
-0,4
-0,5
First Factor
Seco
nd F
acto
r MBloco
Control of Corruption
Rule of Law
Regulatory Quality
Government Effectiveness
Political Stability
Voice and Accountability
Loading Plot of Voice and Accountability; ...; MBloco
7654321
6
5
4
3
2
1
0
Factor Number
Eige
nval
ue
Scree Plot of Voice and Accountability; ...; MBloco
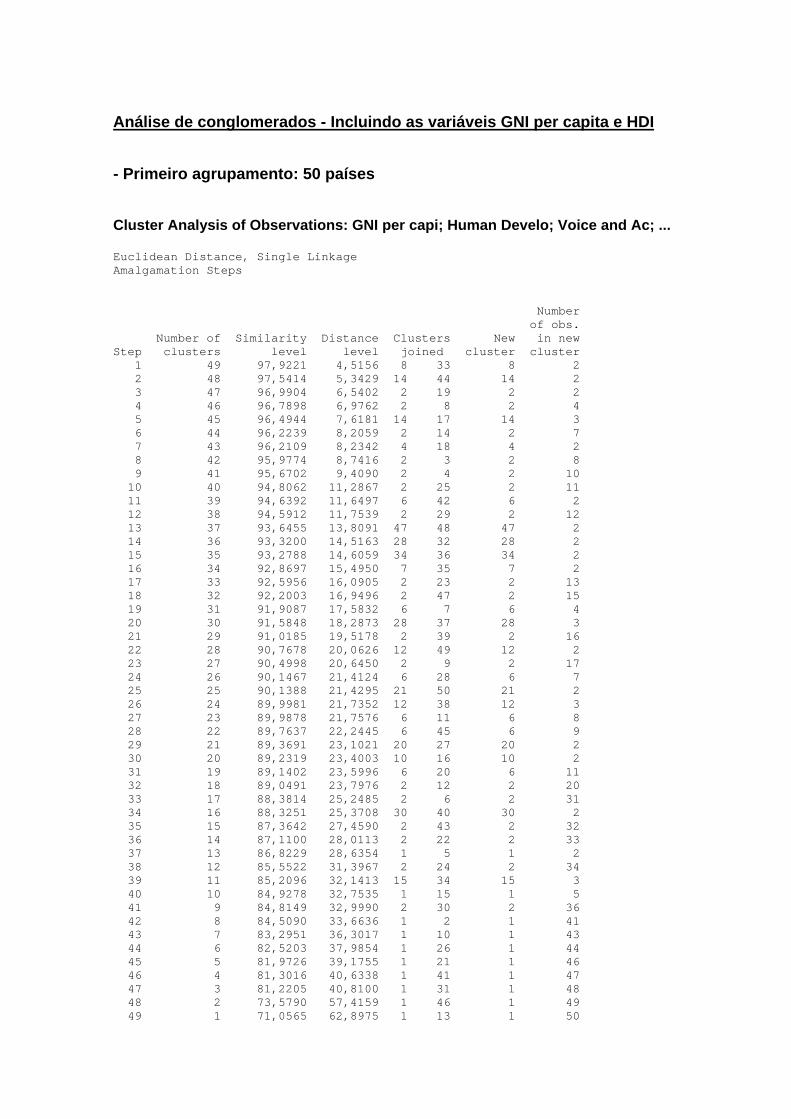
Análise de conglomerados - Incluindo as variáveis GNI per capita e HDI - Primeiro agrupamento: 50 países Cluster Analysis of Observations: GNI per capi; Human Develo; Voice and Ac; ... Euclidean Distance, Single Linkage Amalgamation Steps Number of obs. Number of Similarity Distance Clusters New in new Step clusters level level joined cluster cluster 1 49 97,9221 4,5156 8 33 8 2 2 48 97,5414 5,3429 14 44 14 2 3 47 96,9904 6,5402 2 19 2 2 4 46 96,7898 6,9762 2 8 2 4 5 45 96,4944 7,6181 14 17 14 3 6 44 96,2239 8,2059 2 14 2 7 7 43 96,2109 8,2342 4 18 4 2 8 42 95,9774 8,7416 2 3 2 8 9 41 95,6702 9,4090 2 4 2 10 10 40 94,8062 11,2867 2 25 2 11 11 39 94,6392 11,6497 6 42 6 2 12 38 94,5912 11,7539 2 29 2 12 13 37 93,6455 13,8091 47 48 47 2 14 36 93,3200 14,5163 28 32 28 2 15 35 93,2788 14,6059 34 36 34 2 16 34 92,8697 15,4950 7 35 7 2 17 33 92,5956 16,0905 2 23 2 13 18 32 92,2003 16,9496 2 47 2 15 19 31 91,9087 17,5832 6 7 6 4 20 30 91,5848 18,2873 28 37 28 3 21 29 91,0185 19,5178 2 39 2 16 22 28 90,7678 20,0626 12 49 12 2 23 27 90,4998 20,6450 2 9 2 17 24 26 90,1467 21,4124 6 28 6 7 25 25 90,1388 21,4295 21 50 21 2 26 24 89,9981 21,7352 12 38 12 3 27 23 89,9878 21,7576 6 11 6 8 28 22 89,7637 22,2445 6 45 6 9 29 21 89,3691 23,1021 20 27 20 2 30 20 89,2319 23,4003 10 16 10 2 31 19 89,1402 23,5996 6 20 6 11 32 18 89,0491 23,7976 2 12 2 20 33 17 88,3814 25,2485 2 6 2 31 34 16 88,3251 25,3708 30 40 30 2 35 15 87,3642 27,4590 2 43 2 32 36 14 87,1100 28,0113 2 22 2 33 37 13 86,8229 28,6354 1 5 1 2 38 12 85,5522 31,3967 2 24 2 34 39 11 85,2096 32,1413 15 34 15 3 40 10 84,9278 32,7535 1 15 1 5 41 9 84,8149 32,9990 2 30 2 36 42 8 84,5090 33,6636 1 2 1 41 43 7 83,2951 36,3017 1 10 1 43 44 6 82,5203 37,9854 1 26 1 44 45 5 81,9726 39,1755 1 21 1 46 46 4 81,3016 40,6338 1 41 1 47 47 3 81,2205 40,8100 1 31 1 48 48 2 73,5790 57,4159 1 46 1 49 49 1 71,0565 62,8975 1 13 1 50
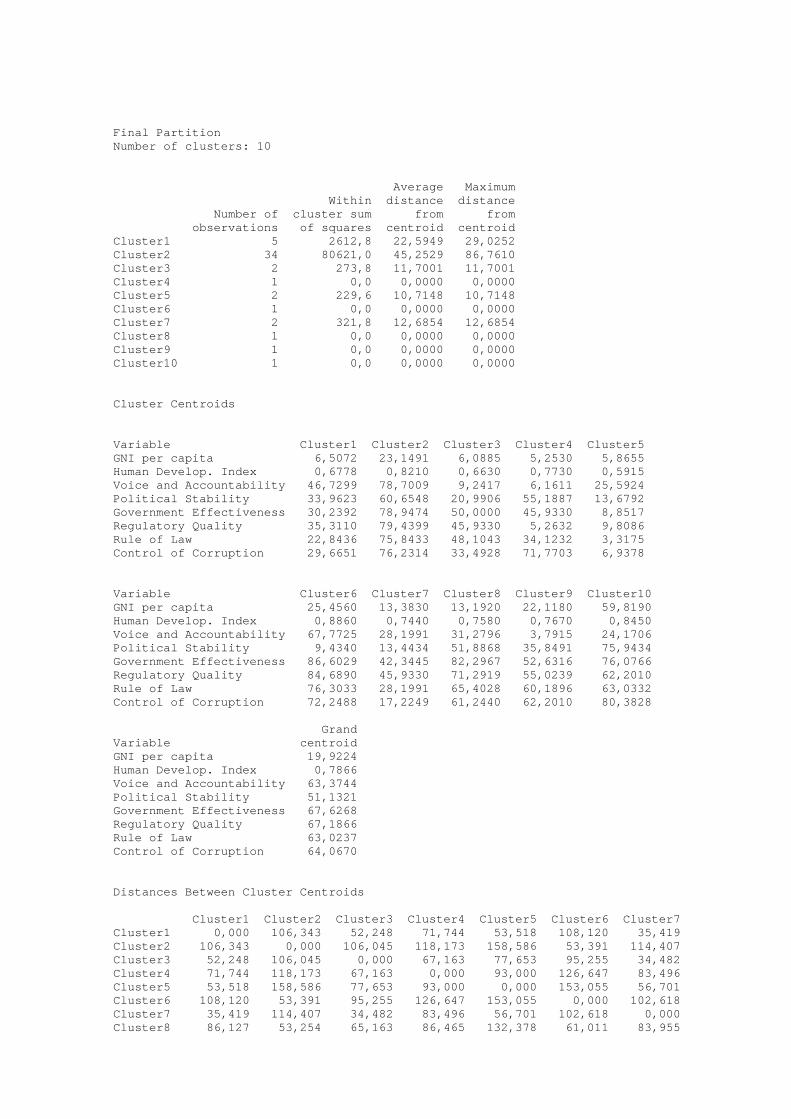
Final Partition Number of clusters: 10 Average Maximum Within distance distance Number of cluster sum from from observations of squares centroid centroid Cluster1 5 2612,8 22,5949 29,0252 Cluster2 34 80621,0 45,2529 86,7610 Cluster3 2 273,8 11,7001 11,7001 Cluster4 1 0,0 0,0000 0,0000 Cluster5 2 229,6 10,7148 10,7148 Cluster6 1 0,0 0,0000 0,0000 Cluster7 2 321,8 12,6854 12,6854 Cluster8 1 0,0 0,0000 0,0000 Cluster9 1 0,0 0,0000 0,0000 Cluster10 1 0,0 0,0000 0,0000 Cluster Centroids Variable Cluster1 Cluster2 Cluster3 Cluster4 Cluster5 GNI per capita 6,5072 23,1491 6,0885 5,2530 5,8655 Human Develop. Index 0,6778 0,8210 0,6630 0,7730 0,5915 Voice and Accountability 46,7299 78,7009 9,2417 6,1611 25,5924 Political Stability 33,9623 60,6548 20,9906 55,1887 13,6792 Government Effectiveness 30,2392 78,9474 50,0000 45,9330 8,8517 Regulatory Quality 35,3110 79,4399 45,9330 5,2632 9,8086 Rule of Law 22,8436 75,8433 48,1043 34,1232 3,3175 Control of Corruption 29,6651 76,2314 33,4928 71,7703 6,9378 Variable Cluster6 Cluster7 Cluster8 Cluster9 Cluster10 GNI per capita 25,4560 13,3830 13,1920 22,1180 59,8190 Human Develop. Index 0,8860 0,7440 0,7580 0,7670 0,8450 Voice and Accountability 67,7725 28,1991 31,2796 3,7915 24,1706 Political Stability 9,4340 13,4434 51,8868 35,8491 75,9434 Government Effectiveness 86,6029 42,3445 82,2967 52,6316 76,0766 Regulatory Quality 84,6890 45,9330 71,2919 55,0239 62,2010 Rule of Law 76,3033 28,1991 65,4028 60,1896 63,0332 Control of Corruption 72,2488 17,2249 61,2440 62,2010 80,3828 Grand Variable centroid GNI per capita 19,9224 Human Develop. Index 0,7866 Voice and Accountability 63,3744 Political Stability 51,1321 Government Effectiveness 67,6268 Regulatory Quality 67,1866 Rule of Law 63,0237 Control of Corruption 64,0670 Distances Between Cluster Centroids Cluster1 Cluster2 Cluster3 Cluster4 Cluster5 Cluster6 Cluster7 Cluster1 0,000 106,343 52,248 71,744 53,518 108,120 35,419 Cluster2 106,343 0,000 106,045 118,173 158,586 53,391 114,407 Cluster3 52,248 106,045 0,000 67,163 77,653 95,255 34,482 Cluster4 71,744 118,173 67,163 0,000 93,000 126,647 83,496 Cluster5 53,518 158,586 77,653 93,000 0,000 153,055 56,701 Cluster6 108,120 53,391 95,255 126,647 153,055 0,000 102,618 Cluster7 35,419 114,407 34,482 83,496 56,701 102,618 0,000 Cluster8 86,127 53,254 65,163 86,465 132,378 61,011 83,955
Cluster9 73,718 89,210 39,588 62,898 107,147 84,836 66,398 Cluster10 110,114 70,984 97,447 93,771 151,704 91,456 112,622 Cluster8 Cluster9 Cluster10 Cluster1 86,127 73,718 110,114 Cluster2 53,254 89,210 70,984 Cluster3 65,163 39,588 97,447 Cluster4 86,465 62,898 93,771 Cluster5 132,378 107,147 151,704 Cluster6 61,011 84,836 91,456 Cluster7 83,955 66,398 112,622 Cluster8 0,000 47,595 57,416 Cluster9 47,595 0,000 66,212 Cluster10 57,416 66,212 0,000
1346314150212616104030242243272045113732283574263849129394847232925184317441433819236341551
71,06
80,70
90,35
100,00
Observations
Sim
ilari
ty
DendrogramSingle Linkage; Euclidean Distance
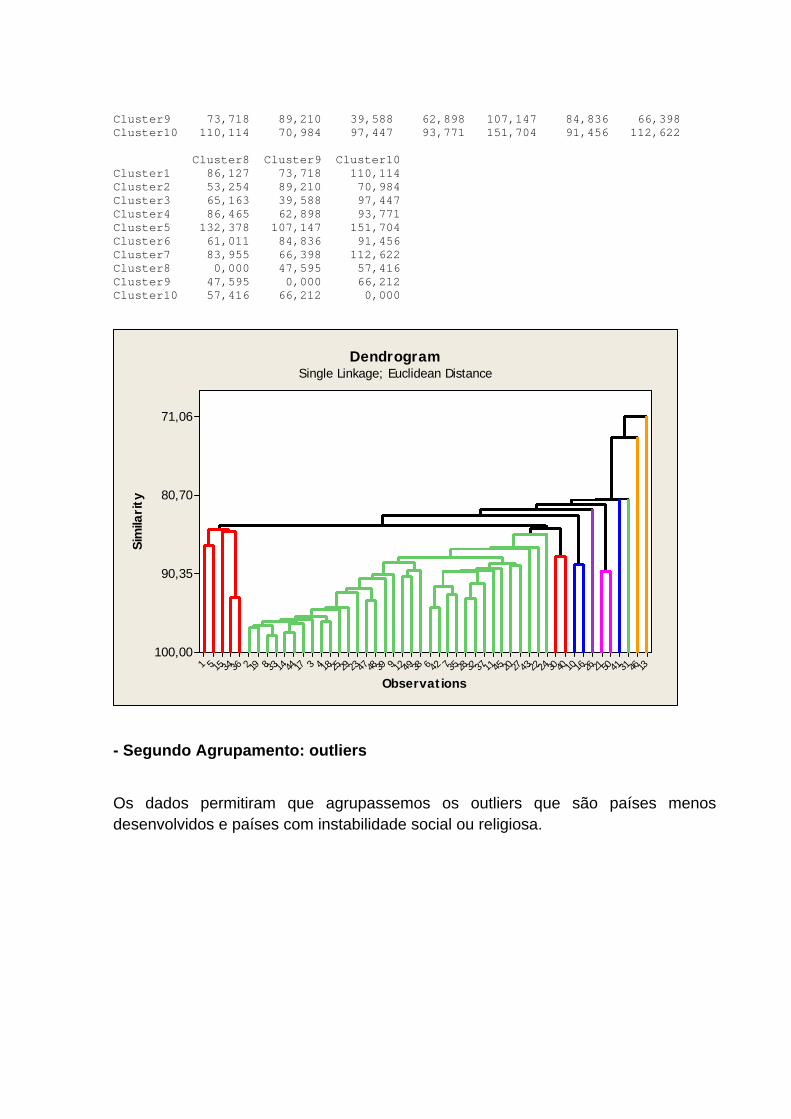
- Segundo Agrupamento: outliers
Os dados permitiram que agrupassemos os outliers que são países menos desenvolvidos e países com instabilidade social ou religiosa.
2510114798631
59,18
72,79
86,39
100,00
Observations
Sim
ilari
tyDendrogram
Single Linkage; Euclidean Distance
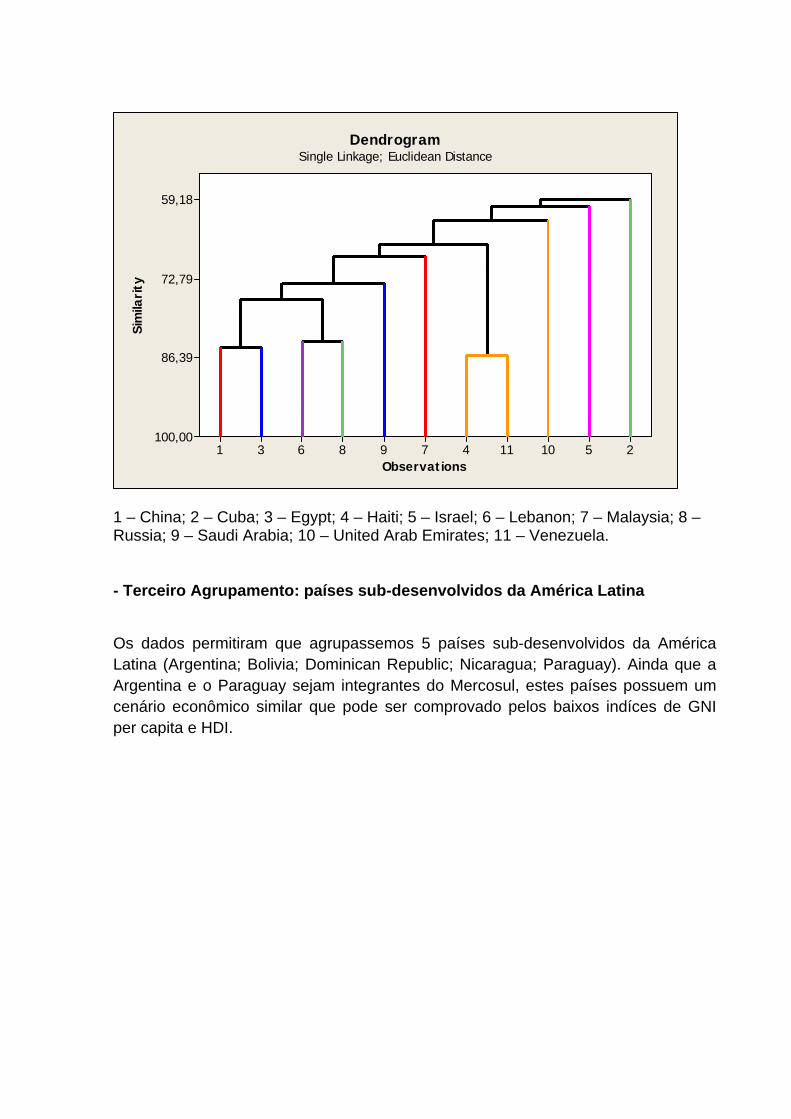
1 – China; 2 – Cuba; 3 – Egypt; 4 – Haiti; 5 – Israel; 6 – Lebanon; 7 – Malaysia; 8 – Russia; 9 – Saudi Arabia; 10 – United Arab Emirates; 11 – Venezuela. - Terceiro Agrupamento: países sub-desenvolvidos da América Latina
Os dados permitiram que agrupassemos 5 países sub-desenvolvidos da América Latina (Argentina; Bolivia; Dominican Republic; Nicaragua; Paraguay). Ainda que a Argentina e o Paraguay sejam integrantes do Mercosul, estes países possuem um cenário econômico similar que pode ser comprovado pelos baixos indíces de GNI per capita e HDI.
54321
35,21
56,81
78,40
100,00
Observations
Sim
ilari
tyDendrogram
Single Linkage; Euclidean Distance
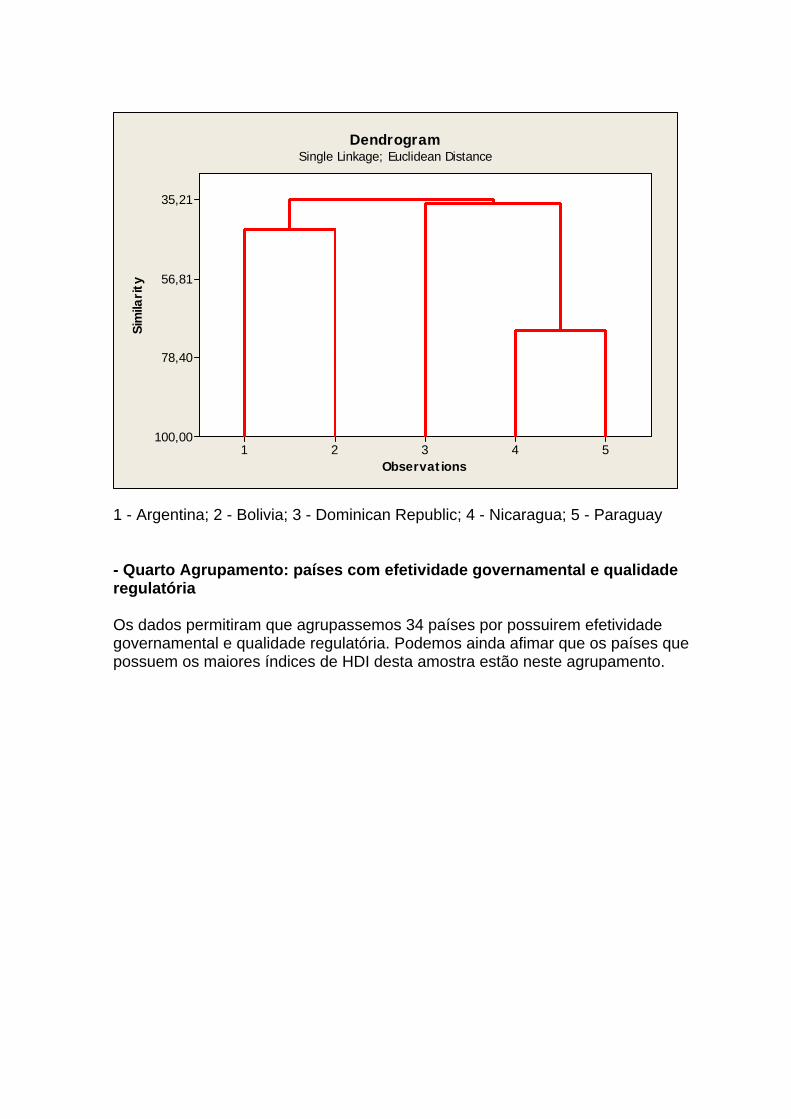
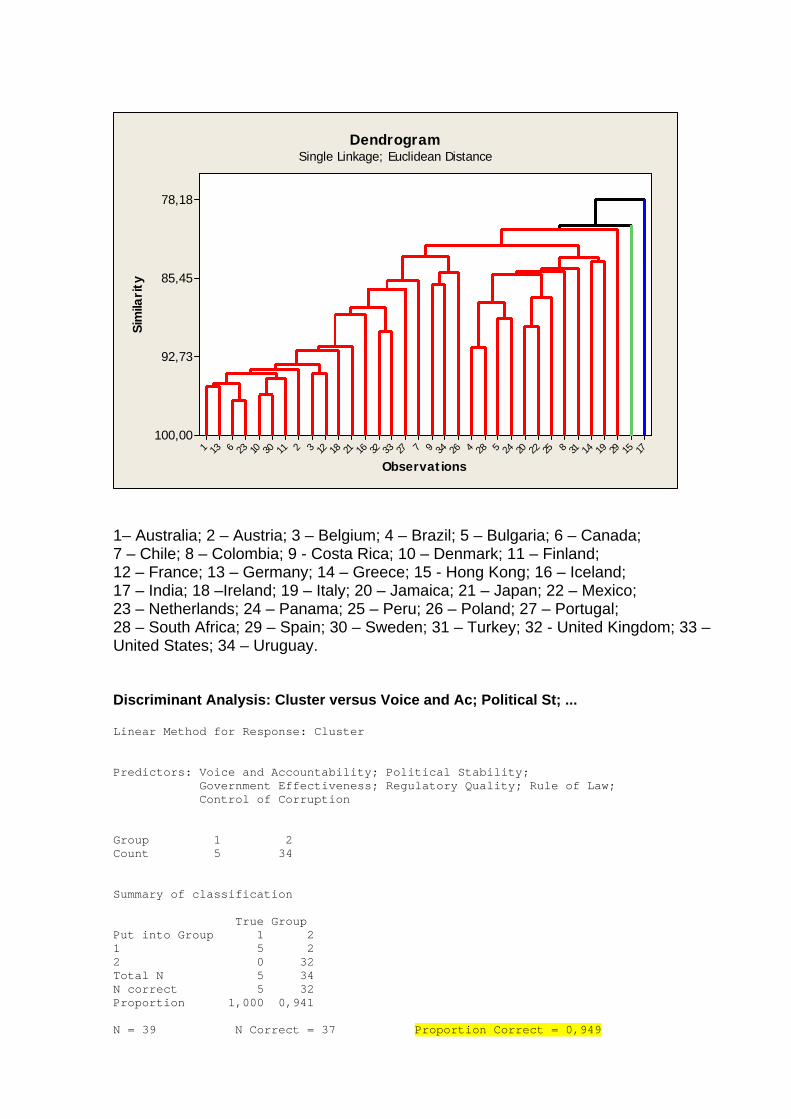
1 - Argentina; 2 - Bolivia; 3 - Dominican Republic; 4 - Nicaragua; 5 - Paraguay - Quarto Agrupamento: países com efetividade governamental e qualidade regulatória Os dados permitiram que agrupassemos 34 países por possuirem efetividade governamental e qualidade regulatória. Podemos ainda afimar que os países que possuem os maiores índices de HDI desta amostra estão neste agrupamento.
17152919143182522202452842634972733321621181232113010236131
78,18
85,45
92,73
100,00
Observations
Sim
ilari
tyDendrogram
Single Linkage; Euclidean Distance
1– Australia; 2 – Austria; 3 – Belgium; 4 – Brazil; 5 – Bulgaria; 6 – Canada; 7 – Chile; 8 – Colombia; 9 - Costa Rica; 10 – Denmark; 11 – Finland; 12 – France; 13 – Germany; 14 – Greece; 15 - Hong Kong; 16 – Iceland; 17 – India; 18 –Ireland; 19 – Italy; 20 – Jamaica; 21 – Japan; 22 – Mexico; 23 – Netherlands; 24 – Panama; 25 – Peru; 26 – Poland; 27 – Portugal; 28 – South Africa; 29 – Spain; 30 – Sweden; 31 – Turkey; 32 - United Kingdom; 33 – United States; 34 – Uruguay. Discriminant Analysis: Cluster versus Voice and Ac; Political St; ... Linear Method for Response: Cluster Predictors: Voice and Accountability; Political Stability; Government Effectiveness; Regulatory Quality; Rule of Law; Control of Corruption Group 1 2 Count 5 34 Summary of classification True Group Put into Group 1 2 1 5 2 2 0 32 Total N 5 34 N correct 5 32 Proportion 1,000 0,941 N = 39 N Correct = 37 Proportion Correct = 0,949
Squared Distance Between Groups 1 2 1 0,0000 15,6631 2 15,6631 0,0000 Linear Discriminant Function for Groups 1 2 Constant -15,192 -32,377 Voice and Accountability 0,690 0,709 Political Stability -0,198 -0,349 Government Effectiveness 0,233 0,584 Regulatory Quality 0,375 0,549 Rule of Law -0,648 -0,690 Control of Corruption -0,022 -0,096 Summary of Misclassified Observations True Pred Squared Observation Group Group Group Distance Probability 6** 2 1 1 4,769 0,572 2 5,351 0,428 39** 2 1 1 10,57 0,662 2 11,92 0,338
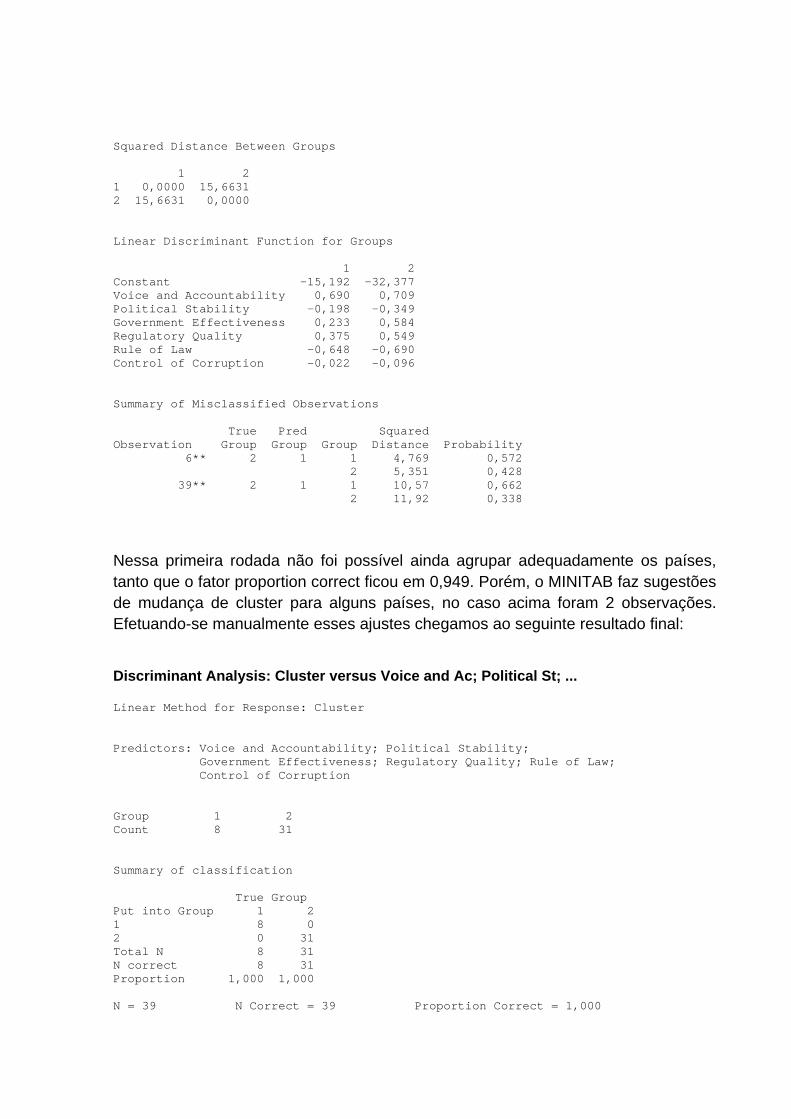
Nessa primeira rodada não foi possível ainda agrupar adequadamente os países, tanto que o fator proportion correct ficou em 0,949. Porém, o MINITAB faz sugestões de mudança de cluster para alguns países, no caso acima foram 2 observações. Efetuando-se manualmente esses ajustes chegamos ao seguinte resultado final:
Discriminant Analysis: Cluster versus Voice and Ac; Political St; ... Linear Method for Response: Cluster Predictors: Voice and Accountability; Political Stability; Government Effectiveness; Regulatory Quality; Rule of Law; Control of Corruption Group 1 2 Count 8 31 Summary of classification True Group Put into Group 1 2 1 8 0 2 0 31 Total N 8 31 N correct 8 31 Proportion 1,000 1,000 N = 39 N Correct = 39 Proportion Correct = 1,000
Squared Distance Between Groups 1 2 1 0,0000 22,8475 2 22,8475 0,0000 Linear Discriminant Function for Groups 1 2 Constant -18,173 -44,013 Voice and Accountability 0,659 0,572 Political Stability -0,242 -0,407 Government Effectiveness 0,476 1,270 Regulatory Quality 0,503 0,919 Rule of Law -0,641 -0,632 Control of Corruption -0,213 -0,791
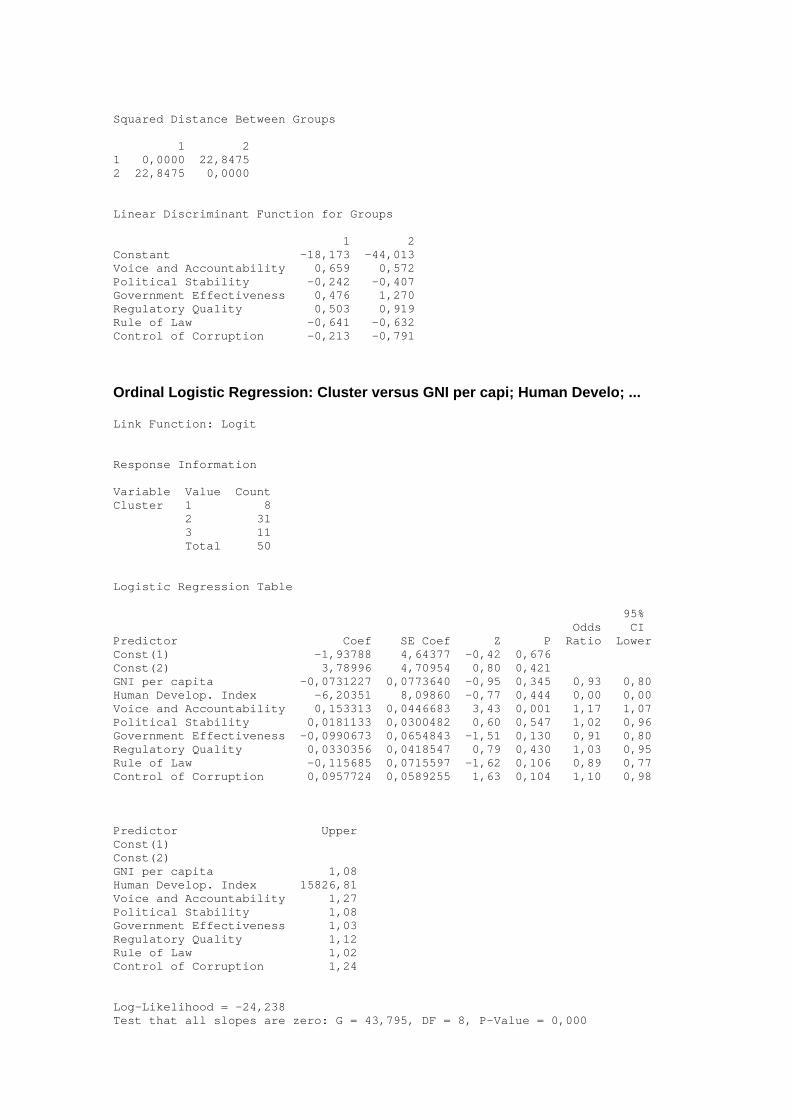
Ordinal Logistic Regression: Cluster versus GNI per capi; Human Develo; ... Link Function: Logit Response Information Variable Value Count Cluster 1 8 2 31 3 11 Total 50 Logistic Regression Table 95% Odds CI Predictor Coef SE Coef Z P Ratio Lower Const(1) -1,93788 4,64377 -0,42 0,676 Const(2) 3,78996 4,70954 0,80 0,421 GNI per capita -0,0731227 0,0773640 -0,95 0,345 0,93 0,80 Human Develop. Index -6,20351 8,09860 -0,77 0,444 0,00 0,00 Voice and Accountability 0,153313 0,0446683 3,43 0,001 1,17 1,07 Political Stability 0,0181133 0,0300482 0,60 0,547 1,02 0,96 Government Effectiveness -0,0990673 0,0654843 -1,51 0,130 0,91 0,80 Regulatory Quality 0,0330356 0,0418547 0,79 0,430 1,03 0,95 Rule of Law -0,115685 0,0715597 -1,62 0,106 0,89 0,77 Control of Corruption 0,0957724 0,0589255 1,63 0,104 1,10 0,98 Predictor Upper Const(1) Const(2) GNI per capita 1,08 Human Develop. Index 15826,81 Voice and Accountability 1,27 Political Stability 1,08 Government Effectiveness 1,03 Regulatory Quality 1,12 Rule of Law 1,02 Control of Corruption 1,24 Log-Likelihood = -24,238 Test that all slopes are zero: G = 43,795, DF = 8, P-Value = 0,000
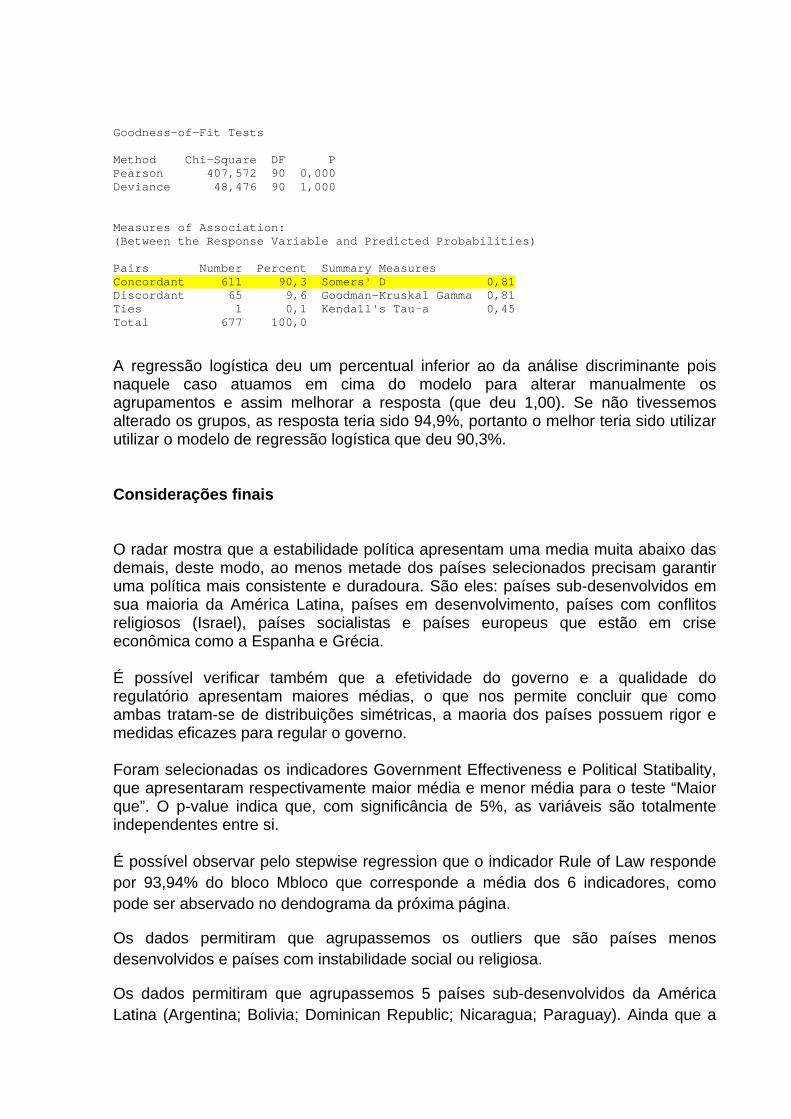
Goodness-of-Fit Tests Method Chi-Square DF P Pearson 407,572 90 0,000 Deviance 48,476 90 1,000 Measures of Association: (Between the Response Variable and Predicted Probabilities) Pairs Number Percent Summary Measures Concordant 611 90,3 Somers' D 0,81 Discordant 65 9,6 Goodman-Kruskal Gamma 0,81 Ties 1 0,1 Kendall's Tau-a 0,45 Total 677 100,0
A regressão logística deu um percentual inferior ao da análise discriminante pois naquele caso atuamos em cima do modelo para alterar manualmente os agrupamentos e assim melhorar a resposta (que deu 1,00). Se não tivessemos alterado os grupos, as resposta teria sido 94,9%, portanto o melhor teria sido utilizar utilizar o modelo de regressão logística que deu 90,3%. Considerações finais O radar mostra que a estabilidade política apresentam uma media muita abaixo das demais, deste modo, ao menos metade dos países selecionados precisam garantir uma política mais consistente e duradoura. São eles: países sub-desenvolvidos em sua maioria da América Latina, países em desenvolvimento, países com conflitos religiosos (Israel), países socialistas e países europeus que estão em crise econômica como a Espanha e Grécia. É possível verificar também que a efetividade do governo e a qualidade do regulatório apresentam maiores médias, o que nos permite concluir que como ambas tratam-se de distribuições simétricas, a maoria dos países possuem rigor e medidas eficazes para regular o governo. Foram selecionadas os indicadores Government Effectiveness e Political Statibality, que apresentaram respectivamente maior média e menor média para o teste “Maior que”. O p-value indica que, com significância de 5%, as variáveis são totalmente independentes entre si. É possível observar pelo stepwise regression que o indicador Rule of Law responde por 93,94% do bloco Mbloco que corresponde a média dos 6 indicadores, como pode ser abservado no dendograma da próxima página.
Os dados permitiram que agrupassemos os outliers que são países menos desenvolvidos e países com instabilidade social ou religiosa.
Os dados permitiram que agrupassemos 5 países sub-desenvolvidos da América Latina (Argentina; Bolivia; Dominican Republic; Nicaragua; Paraguay). Ainda que a
Argentina e o Paraguay sejam integrantes do Mercosul, estes países possuem um cenário econômico similar que pode ser comprovado pelos baixos indíces de GNI per capita e HDI.
Os dados permitiram que agrupassemos 34 países por possuirem efetividade governamental e qualidade regulatória. Podemos ainda afimar que os países que possuem os maiores índices de HDI desta amostra estão neste agrupamento. Bibliografia GREENBERG, B. S.; CHITTURI, P. Minitab manual. The practice of business statistics. New York: Freeman, 2003. Worldwide Governance Indicators – acessado no dia 26/Junho/2012 no link: http://hdrstats.undp.org/en/tables/default.html Indicadores de Desenvolvimento Humano 2011 - acesso no dia 24/Junho/2012 no link: http://hdrstats.undp.org/en/tables/default.html.