Embed Size (px)
Citation preview

UNIVERSIDADE DE SÃO PAULO
ESCOLA DE ENGENHARIA DE SÃO CARLOS
MARIA GABRIELA SERRANO GUZMAN
The Impact of Financial Development, Financial Constraints and
Capital Controls on Stock Returns
O Impacto do Desenvolvimento Financeiro, Restrições
Financeiras e Controles de Capital sobre os Retornos de Ações
São Carlos
2017


MARIA GABRIELA SERRANO GUZMAN
The impact of Financial development, Financial constraints and
Capital controls on Stock returns
O impacto do desenvolvimento financeiro, restrições financeiras e
controles de capital sobre os retornos de ações
Dissertação apresentada ao Departamento de
Engenharia de Produção da Escola de
Engenharia de São Carlos da Universidade de
São Paulo para obtenção do título de Mestre
em Ciências.
Área de Concentração: Economia,
Organizações e Gestão do Conhecimento.
Orientador: Prof. Associado. Aquiles Elie
Guimarães Kalatzis
São Carlos
2017

AUTORIZO A REPRODUÇÃO TOTAL OU PARCIAL DESTE TRABALHO,POR QUALQUER MEIO CONVENCIONAL OU ELETRÔNICO, PARA FINSDE ESTUDO E PESQUISA, DESDE QUE CITADA A FONTE.
Serrano Guzman, Maria Gabriela S487o O desenvolvimento financeiro e as restrições
financeiras afetam os retornos das ações nas economiasdesenvolvidas e emergentes? / Maria Gabriela SerranoGuzman; orientador Aquiles Elie Guimarães Kalatzis.São Carlos, 2017.
Dissertação (Mestrado) - Programa de Pós-Graduação em Engenharia de Produção e Área de Concentração emEconomia, Organizações e Gestão Conhecimento -- Escolade Engenharia de São Carlos da Universidade de SãoPaulo, 2017.
1. Retorno das ações. 2. Desenvolvimento financeiro. 3. Restrições financeiras. I. Título.


“It’s chaos, be kind.”
-Michelle McNamara

ACKNOWLEDMENTS
I would like to thank my parents, my brother, and Javier Jurado for the love and support during
the hard times and for being people I could count on regardless of the situation.
I would also like to thank everyone who at some point made an impact in my life, either directly
or indirectly - It is thanks to these people that I am who I am.
My advisor, Aquiles Elie Guimarães Kalatzis whose patience and eagerness to teach showed
through every class. The support and desire for his students to succeed echoes in every action.
Lastly, I would like to thank Mirian Chimirri, who has become someone very special in my life.
This work would not have been possible without her and my life in Brazil would not have been
the same without her. I thank her not only because of the countless hours that we shared during
our academic work but also for her friendship.
A huge and special THANK YOU to the employees of the Department of Production
Engineering for being so helpful and always being there to answer questions with smile.

ABSTRACT
GUZMAN, Maria Gabriela Serrano. The Impact of Financial Development, Financial
Constraints and Capital Controls on Stock Returns. 2017. Dissertation (Master’s) – Escola
de Engenharia de São Carlos. Universidade de São Paulo, São Carlos, 2017.
The aim of this work is to examine the impact of financial development, financial constraints
and capital control on stocks market returns. The research looks into stock returns of emerging and
developed economies over the period of 2004-2016 by using data, both by firm-level and country level,
from 88 developed and emerging countries. Furthermore, the KZ, WW and SA indexes were used to
classified as being financially constrained and financially unconstrained and the level of capital control
of each group of countries is interacted with financial constraints. We aim to determine the relationship
between the variables used as the measurement (depth, access, efficiency and stability) of financial
development of a country, the financial constraint and capital control and their relationship to the stock
market returns. Previous research focusing on stock market returns have dealt with different influences
affecting the stock returns; however, the literature examining the influence of capital control on stock
return is scarce. Our results suggest that the extended Fama and French three-factor model including
macroeconomic and financial development variables and considering the presence of financial
constraints help in the understanding in their impact on asset pricing for emerging and developed
countries alike.
Keywords: Capital Control, Financial Development, Stock Returns, Emerging and Developing
economies.


RESUMO
GUZMAN, Maria Gabriela.Serrano O impacto do desenvolvimento financeiro, restrições
financeiras e controles de capital sobre os retornos de ações. 2017. Dissertação (Mestrado)
– Escola de Engenharia de São Carlos. Universidade de São Paulo, São Carlos, 2017.
Este trabalho tem por objetivo examinar o impacto do desenvolvimento financeiro, das
restrições financeiras e do controle de capital no retorno das ações. A pesquisa analisa o retorno das
ações dos países emergentes e desenvolvidos durante o período de 2004-2016 através de uma base de
dados de 88 países, emergentes e desenvolvidos, com dados tanto ao nível da firma como ao nível do
país. Além disso, os índices KZ, WW e SA são usados para classificar as empresas como restritas e não
restritas financeiramente, e utiliza-se também as interações do nível de controle de capital com as
restrições financeiras. O objetivo é determinar a relação entre as variáveis de desenvolvimento
financeiro do país (profundidade, acesso, eficiência e estabilidade), as restrições financeiras e o controle
de capital com o retorno de mercado das ações. As pesquisas anteriores acerca do tema retorno lidaram
com diferentes fatores que afetam o retorno de ações; entretanto, estudos envolvendo a influência do
controle de capital no retorno de ações ainda são escassos Nossos resultados sugerem que um modelo
composto coletivamente pelo modelo de três fatores de Fama e French e variáveis macroeconômicas e
de desenvolvimento financeiro, considerando ao mesmo tempo restrições financeiras, ajuda na melhor
compreensão do impacto de ditas variáveis no preço de ativos em países emergentes e desenvolvidos.
Palavras-chave: controles de capital, desenvolvimento financeiro, retornos de ações, Países
emergentes e desenvolvidos.

LIST OF FIGURES
Figure 1 – Stock returns of Emerging and Developed Countries ............................................ 41
Figure 2 – Liquidity of Emerging and Developed Countries ................................................... 42
Figure 3 – Capital Controls of Emerging and Developed Countries ........................................ 57
Figure 4 – Size of Firms of Emerging and Developed Countries ........................................... 57

LIST OF TABLES
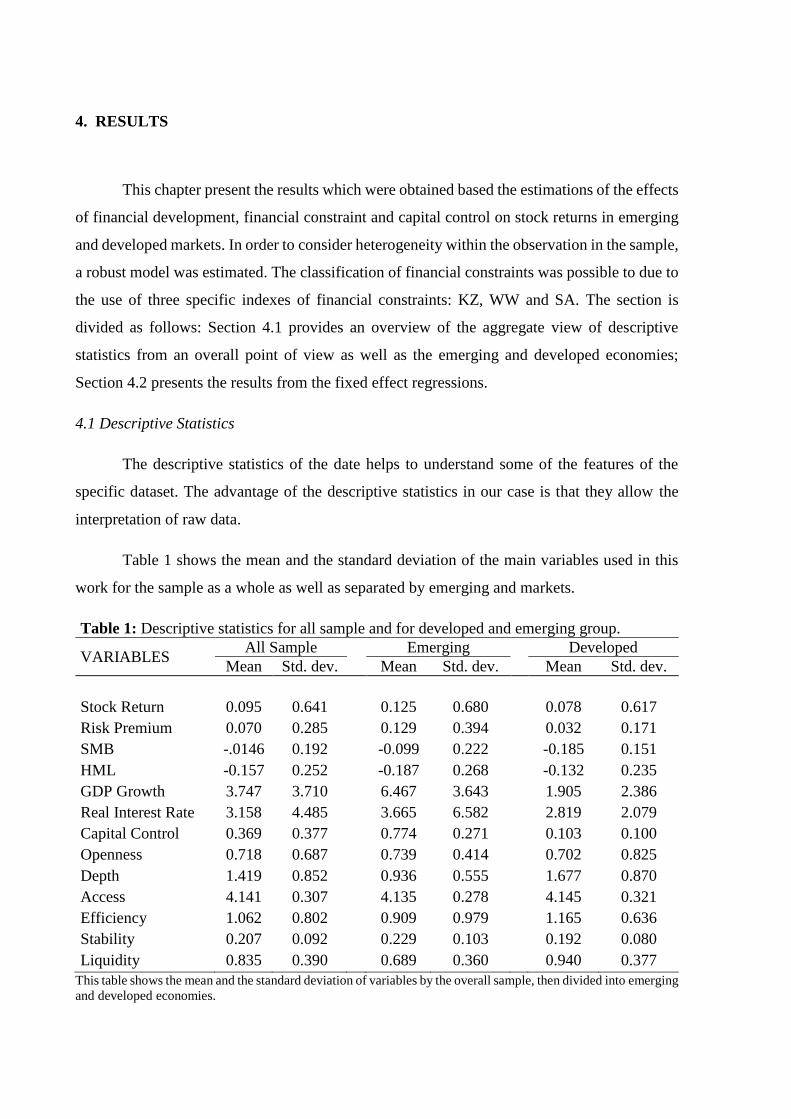
Table 1 – Descriptive Statistics ............................................................................................... 36
Table 2 – Descriptive Statistics based on Financial Constraint Index .................................... 38
Table 3 – Fixed-effect Robust Regression ............................................................................... 43
Table 4 – Fixed-effect Robust Regression considering Financial constraints ....................... 45
Table A– List of all countries ................................................................................................. 55
Table B – List of Variables ................................................................................................... 56
Table C – Variable´s Correlations ........................................................................................ 58
.

TABLE OF CONTENT
1. INTRODUCTION ............................................................................................................ 11
2. LITERATURE REVIEW ................................................................................................. 15
2.1 Asset Pricing ................................................................................................................. 15
2.2 Macroeconomic Activity ............................................................................................... 17
2.3 Financial Development ................................................................................................. 20
2.4 Financial Constraints .................................................................................................... 24
2.5 Capital Control ............................................................................................................... 29
3. DATA AND METHODS OF RESEARCH ..................................................................... 31
3.1 Data ................................................................................................................................. 31
3.2 Empirical model and estimation ................................................................................... 33
4. Results ................................................................................................................................. 36
4.1 Descriptive Statistics ....................................................................................................... 36
4.2 The results of the estimations ......................................................................................... 42
5. Conclusion .......................................................................................................................... 47
References ............................................................................................................................... 51
Appendix ................................................................................................................................. 55


11
1. Introduction
The idea behind the asset pricing theory deals with determining and explaining the prices
of financial assets in a world of uncertainty. The pricing of the financial assets is a crucial part
of the allocation of financial resources, and in an event that mispricing occurs, it could
potentially lead an inefficiency in investment and consumption in the real economy. (Qian,
2017)
When dealing with finance and the asset pricing theory, one of the principal issues is that
of understanding why on average, financial assets earn extremely different returns. The
classical capital asset pricing models, or CAPM introduced by Sharpe (1964) and Lintner
(1965) presents a situation in which the opportunities of investment are constant and, in order
to increase the chances to maximize their expected returns, the investors hold efficient
portfolios. More specifically, this model anticipates that the risk premium will be proportional
to its beta (Perold, 2004).
In an attempt to extend the CAPM model, and to consider other factors which could explain
stock returns, Fama and French introduced the “three-factor model”. This model extended the
CAPM model by adding proxies which could be viewed as more fundamental economic
variables, in particular size and book-to-market ratio. While the influence of the risk on stock
returns is a topic that has been widely studied, we venture into trying to see the influence that
financial development, financial constraint and capital control may exert in stock returns.
There is abundant literature investigating the relationship between financial development
and economic growth (King and Levine, 1993; Bekaert and Harvey, 1995, 1997; Rajan and
Zingales, 1998; Beck, Levine and Loayza, 2000). In the investigatory attempt to analyze the
relationship between financial development and economic growth, multiple other topics were
also studied. These topics varied from investigating causality (Rajan and Zingales, 1998; Abu-
Bader and Abu-Qarn, 2008) to the possibility that the differences between the levels of financial
development between countries were due to legal and accounting systems (Levine, Loayza and
Beck, 2000).
The topic of stock returns has also been extensively studied and a wide variety of asset
pricing models have been proposed in the literature (Sharpe, 1964; Litner 1965; Merton 1973;
Fama and French, 1992, 1993, 1996, 2004; Banz, 1981; Lakonishok, Shleifer and Vishny, 1994;
Kothari, Shanken and Sloan, 1995; Carhart, 1997). The interesting aspect of the theory of
finance is that riskier assets offer predictions of higher expected returns as way to reward the
investors for assuming a higher risk. While these studies care about relationship between risks

and returns for the investors, we consider other aspects such as microeconomic factors which
deal with firm level data, macroeconomic factors, which is concerned with country level data,
financial development factors and information regarding the capital control of each country.
The studies addressing the relationship between financial development and stock returns are
still limited (Dellas and Hess 2005; Abugri 2006).
The concept of financial development could be explained as the ability of the financial
instruments to facilitate economic transactions (Levine 2005). Keeping this in mind, this topic
gains importance, especially for emerging markets, due to the fact that it could help researchers
understand financial constraints in both the credit and capital market.
The idea behind the label “emerging markets” is the fact that these countries emerge
from their status of being less-developed to join the group of developed countries. Historically,
an issue behind the researching of emerging economies is the lack of data for these economies.
However, there have been many advances and renew interest in the topic of emerging
economies since the 1990s. Bekaert and Harvey (2002) work looks at the “big picture” when
dealing with the topic of emerging economies. The authors provide an overview of how the
research of regarding this topic has evolved, fields in which this evolution has taken place and
future steps.
The financial development variables used in this study are complementary of each other.
For example: Let’s say there is a country in which a bank’s loan standards have relaxed, banks
give loans without strict rules, and banks do not have correct risk or loan management. At first
glance, an observer may see a rapid growth within the country, which could be interpreted, as
a sign of deepening and raise in access to finance. Also, it may seem that the financial sector is
efficient due to having no approval process and that allows the banks to lower their cost. The
first impression would be that the financial sector was working well, until the loans turn bad.
Once the loans turn bad, the reality of the situation would sink in. The system would be very
unstable and the possibility of creating a crisis would be an almost certain one.
Another influence that we take into consideration is that of capital control. Capital
control is a topic that is essential when dealing with international macroeconomics. In the same
way that capital control may be responsible for a variety of benefits, it may also leave the market
vulnerable to global shocks. In 2008, the global crisis highlighted that not all decisions
regarding borrowing and lending of capital are rational and that inhibited flows could
potentially result in an exorbitant level of volatility. In this study, we attempt to see the impact
of capital controls in stock returns in both, emerging and developed countries.

13
We investigate the relationship between financial development, financial constraints,
capital control and stock return. We do so by observing how different measurements of financial
development, the most commonly used indexes of financial constraints and high and low levels
of capital control affect the stock returns of firms. Following the train of thought of Dellas and
Hess (2005) and Abugri (2008), we use four measures of financial development (depth, access,
efficiency and stability). Furthermore, we classify the sample by developed and emerging
countries and then apply the three different indexes of financial constraints to each group to
determine the impact of financial constraints on stock returns. Lastly, the effect of capital
control on stock returns is also analyzed.
The main contribution of this paper is that we consider the effects of capital control for
financially constrained firms on stock returns. By classifying the countries as having high or
low capital control, we also contribute to the understanding of the features and differences of
each group on stock market return. This distinction allows us to investigate the relationship
between capital control and financial constraints factors on stock returns for emerging and
developed economies.
Another contribution of this paper is that we consider the effects of financial
development factors and domestic macroeconomic shocks on stock returns. By classifying the
countries as developed and emerging, we also contribute to the understanding the features and
differences of each group on stock market return. These distinctions allow us to investigate the
relationship between macroeconomic and financial development factors, as well their effect on
a firm’s stock returns, and how the effects differ for developed and emerging economies. The
relationship between financial constraints and stock returns and how the interaction between
GDP growth and financial constraints, as well as the interaction between capital control and
financial constraints affect stock returns are also investigated.
The analysis of the relationship between financial constraints and stock returns
contributes to the literature by considering how the presence of financial constraint impacts the
decision to invest in the stock market. In the presence of financial constraint there are frictions
that should be considered for investment decisions on stock market. The impact of the
reductions of credit conditions will be higher for financially constrained firms making it more
difficult to invest which can compromise their expected future cash flow and in turn the stock
returns.
We employ an unbalanced panel data of 88 countries with 14,728 firms segregated into
developed and emerging groups, for the period of 2004 to 2016. We investigate the effect that
financial development has on stock returns as well as how financial constraints and capital

control impact stock returns. Furthermore, we also analyze the interaction between financial
constraint and GDP growth and financial constraint and capital control. In order to be able to
observe these relationships, financial development indicators, including country and firm-level
variables, are used. The sample is also divided into three groups according to three financial
constraint indexes in order to analyze how the effects differ in the stock returns whether the
firm is financially constrained or not. Additionally, the sample is classified as the emerging
countries having high capital control while the developed countries have low capital control.
This classification is made in order to differentiate the role of that capital control may have over
stock returns. Our results suggest the impact of the Fama and French three-factor model
including the macroeconomic and financial development variables while considering the
presence of financial constraint are different based on whether you are looking at emerging or
developed countries. Nevertheless, the different effects represent important aspects that should
be taken into consideration by policy makers.
The paper is organized in 5 sections, including this introduction. Section 2 presents a
brief literature review regarding previous studies in the topic of asset pricing, macroeconomic
activity, financial development, financial constraints and capital control. Section 3 describes
the data and methodology. In section 4, we present our results and lastly, the conclusions are
presented.

15
1. LITERATURE REVIEW
2.1 Asset Pricing
Calomiris, Love and Pería (2012) define stock returns as being a “unique measure of
performance that is comparable across countries, forward-looking, comprehensive in scope and
insensitive to differences in accounting rules”.
The Capital Asset Pricing Model or CAPM, introduced by Sharpe (1964) and Lintner
(1965) builds upon previous work from Harry Markowitz (1952) referencing modern portfolio
theory and diversification. This asset pricing model is used to make predictions in reference on
how risk is measured in addition to investigating the relationship between expected return and
risk. In order to implement the CAPM model, there are four assumptions that must be made: 1)
investors are risk averse; 2) the markets are perfect – there are no transaction cost, information
is costless and readily available and borrowing and lending between investors is possible at a
risk-free rate; 3) all investors have access to the same opportunities; and 4) the estimates used
by the by investors regarding the asset expected returns, standard deviation of returns and the
correlations among asset returns are the same (Perold, 2004).
The CAPM model is usually expressed in the following equation:
𝐸(𝑅) − 𝑅𝑓 = 𝛽 (𝐸(𝑅𝑚) − 𝑅𝑓 (1)
where 𝐸(𝑅) is the expected return of an asset given its beta, 𝑅𝑓 is the risk-free rate, 𝑅𝑚 is the
return of the market portfolio and 𝛽 measures the sensitivity of an assets to the movement in
the stock market. More specifically, on the left side of equation 1, the risk premium of an asset
is shown. The right hand side of the equation shows the risk premium of the market portfolio.
When looking at the theory, the beta of the market portfolio is defined as 1. It is based on this
observation that can be stated that a beta that is greater than 1 suggests that an asset has a higher
risk than that of the overall market, while a beta smaller than 1 suggest that the risk of the asset
is less than that of the overall market. The idea that a higher risk should be compensated by
higher returns is based on classical finance theory. The theory also highlights the statement that
a beta of higher value should result in a higher return in the CAPM model.
Fama and French (1993) extend the CAPM model so that not only takes into
consideration one factor (the market portfolio) in order to attempt to explain stock returns, but
also considers an additional two risk factors to the model. The extension of the CAPM model
by Fama and French is rightfully called the Fama-French three-factor model.
The expression for the Fama–French three-factor model is:
𝑅𝑖 − 𝑅𝑓 = 𝛼 + 𝛽𝑚 (𝑅𝑚𝑖 − 𝑅𝑓) + 𝛽𝑠𝑚𝑏𝑆𝑀𝐵𝑖 + 𝛽ℎ𝑚𝑙𝐻𝑀𝐿𝑖 + 𝜀 (2)
where 𝑅𝑚 remains as the return of the market portfolio; the extension lies in 𝑆𝑀𝐵 (which stands
for “Small Minus Big”) and 𝐻𝑀𝐿 (which stands for “High Minus Low”). The purpose of this
extension is to incorporate Size (measured by market capitalization) and book-to-market ratio
to the ongoing investigation of stock returns. More specifically, 𝑆𝑀𝐵 is considered as the
difference in returns between the smallest largest market capitalization stock, whereas are 𝐻𝑀𝐿
is the difference in return between high and low book-to-market in the corresponding firms.
In taking their cues from historical observations, Fama and French (1993) imply that big
capitalization stock are usually outperformed by small capitalization stock (size premium).
Additionally, stocks with high book-to-market ratio (value stocks) generally outperform low
book-to-market ratio (growth). By including the size and price ratio, Fama- and-French three
model factor assumes that the market risk factor does not captured the risk caused by the size
and the value/growth ratio (book to market ratio).
The effects of value and momentum on emerging stock returns are investigated by
Cakici, Fabozzi and Tan (2013). Their work investigates the size patterns in value and the
momentum in the equity market of 18 emerging countries and the integration process 1 of
emerging economies with that of the U.S equity markets. In order to explain stock returns, the
authors use three specific models: the capital asset pricing model (CAPM) (Linter, 1965;
Sharpe, 1964), the Fama-French three-factor model (Fama and French, 1993), and the Carhart
four-factor model (1997). The results of this work suggest that the value effect in emerging
countries is similar across both, small and big stocks (or stocks with small and large
capitalization); however, this finding does not match what has been shown in developed
markets. When looking into the momentum effect, it is found to be significantly larger for small
stock, which matches the findings in developed markets. Furthermore, evidence indicates that
the relationship of returns with value and momentum for emerging markets seem to be
negatively correlated. This finding is constant with that of developed markets, Finally, when
1 The authors study the integration of emerging markets with that of the U.S equity market by investigating the
local cross-sections of value and momentum of stock return by using and comparing both U.S and local factors
in order to examine it.
17
dealing with the asset pricing test that investigate value and momentum measure, it is shown
that local factors are notably better than U.S factors.
While the CAPM model takes into consideration risk when determining stock returns,
and the Fama-French three-factor model incorporates size and growth, there are still several
factors not included such as those referencing macroeconomic factors.
2.2 Macroeconomic Activity
Amihud and Mendelson (1986) and Jacoby, Fowler and Gottesman (2000), while
looking at investment and stock returns, suggest a link between corporate cost of capital and
liquidity. The investigation in these studies shows how liquidity, marketability or trading costs
are factors that influence the portfolio decisions of investors. Due to the fact that rational
investors need a higher risk premium in order to hold illiquid securities, cross-sectional risk-
adjusted returns are lower for liquid stock. This has been investigated in various empirical
studies run on mature capital markets. Kiyotaki and Moore (1997) study how small temporary
shocks to technology or income distribution in an economy, in which the credit limits are
endogenously determined, might generate large, persistent fluctuations in output and asset
prices. In other words, how credit constraints may amplify the effect of various shocks. It must
be addressed that there is an importance for both, bank and stock market liquidity.
In his work, Rouwenhorst (1999) investigates the differences and similarities between
the return factors of developed and emerging markets, and the relationship between liquidity
and stock return in emerging economies. Through the examination of the cross section of
returns of 1705 firms from 20 emerging markets collected from the Emerging Market Database
(EMBD) of the International Finance Corporation (IFC), the authors state that the return factors
in emerging markets are similar to those in developed markets. The results show that the stock
from emerging markets exhibit momentum2, value stocks surpassed growth stocks and small
stock exceed large stocks. This works shows no evidence that the local market betas are
associated with average returns. Due to the fact that there is little evidence that the correlations
between the local factor portfolio increased, the authors infer that the factors accountable for
the increase of the countries belonging to emerging markets correlations are different to those
that are responsible for the differences between expected return within these markets.
Furthermore, the results of the Bayesian analysis of the return premium of both, developed and
2 Momentum is used by Rouwenhorst (1999) as the relative strength portfolios.

emerging countries, agree with the hypothesis that size, momentum and value strategies are
compensated for in expected returns around the world. In regards to the relationship between
expected returns and the share turnover, the results do not provide evidence proving a
relationship for emerging countries. Nevertheless, there is a positive correlation between
turnover and beta, size, momentum and value in emerging counties which implies that returns
premiums do not only reflect a compensation for illiquidity.
Beck, Levine and Loayza’s (2000) investigate the relationship between the growth
sources - defined as private saving rate, physical capital accumulation, and total factor
productivity growth - and financial intermediary development. In order to control for
endogenous determination of financial intermediary development with growth and the sources
or growth, the authors use two econometric methods: a traditional cross-sectional, instrumental
variable estimator3 and a cross-country, time-series panel of data employing dynamic panel
techniques in order to estimates the relation between financial development and growth, capital
accumulation, saving rate and productivity growth. The results show that a large, positive
impact is applied on the total factor productivity growth by financial intermediaries and it
continues on to affect the overall GDP growth; also, they validate the perspective stating that
higher functioning financial intermediaries improve the allocation of resources, speeds up the
total factor productivity growth with a favorable outcome for long-run economic growth.
Bernanke and Gertler (2000) research the effects of asset price volatility in the
management of monetary policy. The authors focus on monetary policy because while they
agree that monetary policy alone is not sufficient to contain the possibility of damaging effects
of booms and bust in asset prices; however, based on history, they stated that damages from
asset price crashes in the economy have been sustained in cases where monetary policy
remained unresponsive. In order to investigate this relationship, the authors used non-
fundamental movements4 present in asset prices into a dynamic macroeconomic framework.
The results, for large industrial economies such as the United States and Japan, show that
flexible inflation targeting impart a unified, effective framework which leads to a
macroeconomic and financial stability. Furthermore, the suggestion that small economies
should adopt flexible inflation targeting as part of a deal which would come with an
improvement of financial regulation and fiscal reform was also made.
3 Legal origin of each country is used as an instrument to extract the exogenous component of financial
intermediary development in the pure cross-sectional regressions. 4 The suggested sources of “non-fundamental” fluctuations in asset prices are: poor regulatory practice and
imperfect rationality on the part of investors.

19
As mentioned by Dellas and Hess (2002) if the stock market is thin, then there is a
greater possibility that it will demonstrate bigger fluctuations in prices leading to a less
amenable to host international capital; however, if the stock market is sufficiently liquid, it will
allow the stock traders to minimize price volatility by smoothing their trades. The consequence
of a thin market in a particular country is that the co-movement with the rest of the world will
be lower.
Abugri’s (2006) work investigates whether the interaction in key macroeconomic
indicators such as exchange rates, interest rate, industrial production and money supply in four
specific Latin American countries significantly explain market returns. The author concludes
that because the response of the market returns from shock to macroeconomic variables tends
to vary from country to country, they cannot be determined a priori. Furthermore, the results
also pointed to global variables having significant and consistent effects on the market returns
which serve to emphasize the importance of external shocks in Latin American markets.
A report by the International Organization of Security Commissions, (IOSCO, 2007),
emerging markets committee concluded that due to the fact that investors are attracted to higher
levels of liquidity, it plays an important role in the development of a market and economic
growth. Factors that typically lower transactions cost, that facilitate trading and timely
settlement and those that ensure that large trades have only a limited impact on market prices
are the factors that affect market liquidity. One of the threats to small and less developed
markets, due to the process of globalization, is that the domestic market’s liquidity may dry up
because of the transfer of liquidity to major markets in the region. The authors conclude that
regardless of whether the efforts were direct or indirect, several markets have shown that the
initiatives have had a positive effect on liquidity while others suggest that it is still a work in
progress.
Gay (2008) uses the Box-Jenkins ARIMA model in order to investigates the relationship
between stock market index prices and the macroeconomic variables of exchange rate and oil
in the countries of Brazil, Russia, India and China from 1999 to 2006. The results show that the
effect on the international macroeconomic factors of exchange rate and oil price on stock market
index are not significant in any of the emerging countries. Furthermore, based on the results,
the author suggests that the emerging countries that were used in this work show a weak form
of market efficiency.
Geetha, Mohidin, Chandran and Chong (2011) look into the links between stock market,
expected inflation rate, unexpected inflation rate, exchange rate, interest rate and GDP for
Malaysia, China and the United States for the period of 2000 to 2009. Based on the Vector

Error-Correction (VEC) model, the results show that there is no short run relationship between
stock markets and the macroeconomic variables used in the study for Malaysia and the US;
however, the results for the VEC model for China, shows that there is short run relationship
between expected inflation rates with the stock market.
Calomiris, Love and Peria (2012) argue that the effect of stock liquidity may have on
returns is ambiguous. One possibility is that an increase in liquidity could contribute to a steeper
decline in equity prices, due to the fact that investors choose their most liquid risky assets to
sell during a liquidity squeeze. On the other hand, in the case of a crisis, liquidity becomes more
valuable, which implies that relatively illiquid stocks could experience relative price declines.
The observed effects liquidity has on returns are similar. If liquid stock declines during a crisis,
it could be said that the relatively illiquid stocks will show similar or even greater decline in
value.
2.3 Financial Development
While macroeconomic factors aid in the study of stock returns, an additional factor,
which may affect stock returns through its relationship with the stock market is that of financial
development. Financial development is understood as the process in which financial systems
(financial instruments, markets and intermediaries) ameliorate and/or eventually overcome
enforcement and information frictions, in addition to transaction cost, in order to facilitate trade,
mobilize savings and diversify risk.
The relationship between financial development and economic growth has been one of
the most studied topics in finance and it is often explained as growth being promoted by the
financial system. It can either happen through the increase of the volume of saving, in countries
in which this is common practice such as the United States or UK, or through foreign direct
investments in countries like Brazil in which saving is not practiced or by bettering the
efficiency in which the savings are allocated across investment plans (Giovannini, Iacopetta,
and Minetti, 2013).
There are a variety of factors that may help determine the financial development. For
example, Huang (2010) investigates the political, economic, policy and geographic
determinants of the development of financial market and how variables such as institutional,
macroeconomic and geographic factors seem to play a role in the determination of the level of
development.

21
Institutional factors have been considerably studied and its research involves the study of the
effects of legal and regulatory environment on the functioning of financial markets. Generally,
it is possible that institutions may have an intense impact on the supply side of financial
development. Overall, the level of institutional development that exists in a country to a degree
determines the sophistication of the financial system (Huang, 2010).
The policy view emphasizes the importance of various macroeconomic policies,
openness of goods market and financial liberalization in promoting financial development. The
effect of the policies on the financial development could be working through either its demand
side or its supply side.
The factors addressing the correlation between geography and financial development
have been less investigated than those relating to policy and institutions. However, these works
have tackled three specific aspects: the first being concerned with the correlation between
latitude and economic development Sachs (2003); the second aspect deals with the countries
being landlocked (Malik and Temple, 2009); and lastly, the third aspect deals with the link
between resource endowment and economic development (Easterly and Levine, 2003).
In order to comprehend how financial systems are a necessary part of financial
development, it is necessary to understand their main functions. According to Levine (2005),
the primary functions of the financial systems are: (1) the facilitation of trading, hedging,
diversifying, and pooling risk; (2) the allocation of resources; (3) the monitoring of investment
and implementation of corporate governance; (4) the mobilization and pooling of saving and
(5) the facilitation of the exchange of goods and services. Since every one of the financial
functions potentially has an influence on saving and investment decisions, it can be stated that
it also influences economic growth.
Early theoretical studies show that economists have had different views about the
relationship between the financial system and economic growth. While authors like Bagehot
(1873), Schumpeter (1912), Gurley and Shaw (1955), Goldsmith (1969) and McKinnon (1973)
dismissed the idea that the nexus between financial development and economic growth could
be disregarded without limiting the way that economic growth is understood. But authors like
Merton Miller (1998) state that the concept that financial development contributes to economic
growth is too evident for serious discussion. In addition to the theoretical studies, there have
also been countless empirical studies investigating the relationship between financial
development and economic growth (Jayaratne and Strahan, 1995; Harris 1997; Levine and
Zervos, 1998; Rousseau and Wachtel, 2000).

Levine and Zervo (1998) integrate measures of the functioning of stock markets into
King and Levine’s (1993)5 study dealing with financial development and economic growth.
The authors investigate if both, banking and stock markets indicators are “robustly correlated
with current and future rates of economic growth, capital accumulation, productivity growth,
and private savings”. The results show that there is a positively and robustly correlated
relationship between stock market liquidity, banking development and future and current rate
of economic growth, capital accumulation, and productivity growth. In addition, since the two
measures, stock market liquidity and banking development both come up as significant in the
regressions, it is implied that financial services provided by banks are different from those
provided by stock markets. Lastly, the evidence shows a strong and positive relationship
between financial development and economic growth suggesting that financial factors are an
intrinsic part of the growth process.
An econometrically approach, conducted by Rajan and Zingales (1998), presents factors
which assisted in driving the study dealing with causality between financial development and
economic growth. By taking into consideration that, in some macroeconomic models, savings
has an influence on the long-run growth rate of the economy and by using this as a proxy for
the level of financial development. The authors focus on the theoretical mechanisms in which
financial market and institutions help a firm overcome adverse selection and moral hazard
problems and in doing so, the cost of raising money from outsiders would decrease. They argue
that having access to credit gives firms more opportunities for profitable investment. Following
the expectations of growth, the stock market takes advantage of the present value of those
opportunities.
Demirgüç-Kunt and Levine’s (1996) research the link between the stock market and the
economic development. They focus on four issues: (1) constructing further criteria of stock
market development than any earlier studies had provided; (2) investigating the relationship
between financial intermediaries and stock markets by using the new measurement of stock
market development; (3) examining the relationship between long-run economic growth and
stock market development and (4) investigating previous research that show a relationship
between stock market development and financing choices of firms. The authors show that the
financial structures are extremely different depending on the country and that as countries
develop economically so do their financial structures. Based on the results, it can be stated that
5 King, Robert G. and Levine, Ross. “Finance and Growth: Schumpeter Might Be Right.” Quarterly Journal of
Economics, August 1993a, 108 (3) pp 717-38

23
as countries get richer over time or as a poor country increases in wealth, they benefit from:
their financial intermediaries becoming larger, non-banks become more important, bank
allocate as much credit as the central bank, and the stock markets become larger.
Beck, Lundberg and Majnoni (2003) results suggest that the financial intermediaries
have no overall effect in growth volatility. Aghion, Banerjee and Piketty (1999) demonstrates
that when there is a lack of equality in the capital markets and individuals do not have an equal
access to the investment opportunities then there is a cyclical demand and supply of credit,
which shows in a supply of output. Financial development also allows an economy to absorb
investment more efficiently. Arestis, Demetriades and Luintel (2001) proposed that the theory
of volatility might reflect efficiency in stock market; however, empirical results did not support
this theory.
Pagan and Soydemir (2001) point out that economic and political changes, in addition
to financial liberalization in Latin American countries, have cause them to be of significance in
the Latin American share of U.S and world trade. These changes have led to growth in market
capitalization and trading value of their stock. Furthermore, international investors - in an
attempt to take advantage of diversification, decreasing measure of concentration, and
increasing capitalization- have increase the allocation of funds to the countries. Additionally,
Bilson, Brailsford and Hooper (2001) state that given the changes, the expectation of
distinguishing features between these “changing” Latin American countries and developed
stock markets is reasonable.
Hassan, Sanchez and Yu (2011) use diverse multivariate time-series analysis techniques
and unbalanced panel estimations to study direction, timing, and strength of the causal link
between financial and real sectors spread through different geographic areas and diverse income
group as to explore some policy implications. The results of this work are in agreement with
works from King and Levine (1993) and Levine et al. (2000) in that there is a strong linkage
between financial development and economic growth. Additionally, it points out that while it
is necessary to have financial development in developing countries, it is not enough to secure a
constant economic growth.
Dellas and Hess (2005) pool emerging and mature markets and investigate how the
moments of stock returns are affected by the financial development of the country based on
standard measures of financial development such as size, quality of banking systems and stock
market liquidity (which is measured as the ratio of total shares traded as a percentage of GDP).
The authors investigate how the distribution of asset returns may depend on how well the
financial system carries out specific functions. This can be done directly (through the
monitoring of managers and exertion of corporate control, and the provision of liquidity) or
indirectly (through macroeconomic volatility, and production structure and trade patterns).
The indirect relationships that are highlighted explain how financial development
affects stock returns are: first, through its effects on the macroeconomic growth and volatility
and secondly, through its effect on the structure of production and pattern of international trade;
however, the main focus of the study is on the macroeconomic volatility (Dellas and Hess,
2005).
Furthermore, Dellas and Hess (2005) establish that the banking development, and the
variance and covariance of the country stock returns are closely related regardless of the
currency in which the rate of stock returns are measured. Additionally, their results state that
the “deeper” and more efficient banking systems may have been associated to significantly
lower stock return volatility and that banking size is less important that “quality”.
In summary, Dellas and Hess (2005) state that several markets have shown interests in
starting initiatives in order to increase the level of liquidity in their market and by doing so
increasing the financial development. Also, while there have been theories showing a negative
relationship between financial development and growth volatility, there have also been theories
that show that there is no overall effect of growth volatility (Bacchetta and Caminal, 2000;
Beck, Lundberg and Majnoni, 2001).
Wurgler (2000), while analyzing data for 65 countries through a period of 33 years,
demonstrated that better functioning financial markets, measured by the size of the domestic
stock and credit markets relative to GDP, are associated with better allocation of capital. The
author states that it is not the higher investment rates that make up the advantage of financially
developed countries but that they allocate their resources to more profitable investment projects.
When it comes to firms choosing to fund an investment, the possibility of financial
constraints must be taken into consideration. Financial constrains are characterized as friction
that prevent the funding of all desired project by the firms which may be due to bad credit
conditions, inability to obtain a loan, or inability to issue new stocks. However, regardless of
the reason, it is something that must be looked at when dealing with stock returns.
2.4 – Financial Constraints
Recent studies in corporate finance tackle the factors that affect the investment decisions
that are made by managers and whether or not they really contribute to the optimization of the
company’s profit. Under the assumption of a competitive market with perfect information,

25
Modigliani and Miller (1958) theorize that the financial structure will not affect their decisions
and decisions will be made based only on the investment opportunities. Based on that
assumption, the way in which the company is financed is not an influential factor to its value,
and the value depends solely on the cash flow generated by the company and its risk.
Information asymmetry, which can cause a kind of market failure, deals with the study
of the decision-making in a transaction when one side has more or better information than the
other, between investor and managers was introduced to corporate finance by the work of Ross
(1977). The author argued that in order for better projects to be financed then a transfer of
information must take place
Jensen and Meckling (1973) give importance to the topic involving the impact of
structure of property on the value of the company by criticizing the way they see firms as black
boxes, with their respective inputs and outputs, looking to achieve equilibrium and the
maximization of profit but not considering that the individuals present in this process can aim
for different goals. Another problem that may arise between the shareholders and creditors is
that of agency problems. Jensen and Meckling (1976) believe that shareholders will be
encouraged to invest in riskier projects due to the fact that if the problem fails the biggest bulk
of the damage will fall upon the credits. However, if it is successful, the majority of the profit
will go to the shareholders.
Having considered the presence of asymmetrical information and cost of transactions in
the credits and capital markets, and that capital compromises the efficiency of these markets
leading to a financial restriction problem, there have been abundant work addressed to looking
into how the financial constraints influenced the behavior of corporate investments.
In 1988, Fazzari, Hubbard and Pertersen attempted to control information asymmetry
by assuming that, companies in which the information asymmetry is present, would have to pay
a premium to rise external financing. When analyzing the data, the authors divided the
companies. According to the authors, firms that use internal resources in order to invest, when
the access to external capital is limited and the cost are higher than that of their own, is what
generates a dependency on the firm’s own retained earnings. The authors use traditional
investment models such as accelerator, Tobin q and neoclassical and examine different groups
of companies with varied financial characteristics. The authors included the proxy of cash flow
(which represents internal capital) of the firms and used the cash flow and the q of Tobin as
explicatory variables. It was concluded that the firms that would most likely have the highest
difference between the cost of internal and external capital would necessarily be those that show
the highest sensibility to the cash flow investment.

Fazzari and Petersen (1993) introduced new ways to test for financial constraints
stressing the role of working capital as both a use and a source of funds. Due to a variety of
reasons, changes made to the level of fixed investments is very costly for firms, therefore they
will look into maintaining a stable fixed-investment path keeping other things equal. The
authors also emphasized the difference between the irreversibility of the fixed capital and
working capital which is reversible stock that can be used as a source of funds to soften the
constraints in the short run.
The study by Devereux and Schiantarelli (1990) present econometric corroboration
concerning the influence of the financial factors such as cash flow, debt and stock measures of
liquidity on the decisions that British companies make regarding investments and look to see if
the impact of the financial factors differs across the various types of firms. The authors looked
at 720 companies, and integrated variables of size, age and a dummy variable representing
whether the company was functioning in a growing or declining sector, to the model used by
Fazzari et al. from 1988. The results show that the impact of cash flow on investment appears
to differ in magnitude depending on the firms. The authors concluded that the role played by
cash flow was more significant in larger firms than smaller ones. Also, when looking at size,
the impact of cash flow appears to be higher for companies in growing sectors. Lastly, when
looking at the firms according to age, the cash flow tends to be of more importance for newer
firms.
Kaplan and Zingales (1997) and Cleary (1999) have both criticized Fazziri et al. (1988)
research. Kaplan and Zingales (1997) investigate the validity of using investment cash-flow
sensitivities to get measure of financing constraints by looking at the firms that were identified
in Fazzari’s et al. work. The issue is not in the sensitivity of an investment to cash flow but that
the value of the coefficients grows monotonically when dealing with financial constraints. The
model used by Kaplan and Zingales (1997) reworked Fazzari’s et al model and did not include
a criterion for the classification of financial restriction a priori as their intent was to develop a
measure for financial constraints. The results show that in fact, the investment decisions for the
firms with the smallest financial constraints are the most sensitive to the cash flow availability.
Carpenter and Guariglia’s (2008) research analyzes the correlation between cash flow
and investment. In order to evaluate the part that cash flow plays in investment, the authors
introduce a new proxy, alongside Q, for the “expectations reflecting the firms’ insiders’
evaluation opportunities”. The authors use data over the period of 1983 to 2000 for 693 British
firms and classified them by size based on the number of employees. When the variable Tobin’s
q was considered but the proxy was not, the results show that cash flow was significant in large

27
companies and small companies; nevertheless, the effect was bigger for small companies. When
the regressions were run with both the firm’s contracted capital expenditure and the Q, the
explanatory power of cash flow decreased for large firms but it remained the same for small
firms. The results propose that, although cash flow could encompass information regarding
investment opportunities not contained in Q, the significance that comes from the cash flow in
an investment equation come from the part it plays in capturing the effect of credit frictions.
While there has been extensive literature attempting deal with the financial constraints
and investments, there results have not been definitive. As presented in the literature, there is
no singular way to combine the theory regarding financial constraints in investment decisions.
However, when looking at decision making regarding investment, it is believed that the
sentiments of the investors directly affect stock prices which could potentially and indirectly
affect real activity.
Lamont, Polk and Saá-Requejo’s (2001) work looks to see if the impact of financial
constraints on the value of a firm is something that can be observed in stock returns. While the
term financial constraints make the issues such as bankruptcy risks, economic or financial
distress come to mind, the authors use the term financial constraints to describe “the frictions
that prevent the firm from funding all desired investment”. The authors take into consideration
of the regression coefficients of Kaplan and Zingales (1997) work in order to build an index
which is made up a linear combination of 5 accounting ratios, and it is therefore called the KZ
index.
Due to the fact that the KZ index is an in-depth study of firms, it is found attractive by
researchers attempting to investigate financial constraints. Lamont et al. (2001) are able to reach
three conclusions through their study of whether there is a financial constraint factor in stock
returns. The first conclusion that is reached based on the evidence is that financial constraints
do affect the value of a firm and degree of the financial constraints varies over time. The second
conclusion is that constrained firms earn lower returns than unconstrained firms. Thirdly, the
returns for financially constrained firms are not significantly more cyclical than average. It is
important to note that there are contradicting views on how the financial constrains should affect
valuation and if they should bind more during expansion or downturns. In contrast to Lamont
et al. (2001), Perez-Quiros and Timmerman (2000) state that the large firms’ returns are less
sensitive to credit tightening than small firms’ stock returns.
Whited and Wu (2006) constructed an index of the external finance constraints of firms
via the GMM (Generalized Method of Moments) estimation of an investment Euler equation.
The authors attempt to answer the question of whether the effects of financial constraints are

priced in asset markets. The results of this work suggest that the firms classified as constrained
with basis on this index are small, they underinvest, do not have bong ratings and have low
analyst coverage. Additionally, through time-series test, it is determined that stock returns on
constrained firms positively covary with other constrained firm’s stock return. The cross-
sectional regression of the returns of firms on the index of financial constraints constructed by
Whited and Wu (2006), in addition to a variety of other firm characteristics stipulate that firms
that are more constrained earn higher returns. Furthermore, when financial constraints are
considered, the usually expected result of smaller firms earning higher returns disappear.
Hadlock and Pierce, in their work from 2010, suggest an additional financial constraint
index. The authors, by reading the statements that were made by manager in SEC filing for a
sample of randomly selected firms, for a period of 1995 to 2004, categorize firms by their
financially constrained status6. Due to concerns regarding endogeneity, the authors investigate
the role of firm and size resulting in evidence stating that factors are nonlinear in financial
constraints. Hadlock and Pierce (2010), using the relation between size and age, suggest a new
index called SA index. They state that the new index has an intuitive appeal and the factors are
more exogenous than most of the alternatives.
Campello and Chen (2010), through the use of firm and overall-level data, investigate
the implication that real and financial influences have on the imperfections of capital market.
The authors do so by looking into the sensitivity of the effects of macroeconomic movements
in both financially constrained and unconstrained firms and it is done by the construction of
financial constraint return factors7. The research shows that the constraint factors are, both
statistically and economically, significant. More specifically, the returns of constrained firms’
increase in relation to the returns of unconstrained firms’ in a period of expansion and credit
easing. The results suggest the systematic risk of financially constrained firms is higher and that
the constraint risk is priced in financial markets. The financial constraint factor, calculated by
the authors, shows a correlation with the macroeconomic movements which are predicted by
existing theories: the stock returns for firms which are financially constraints underperform
those for unconstrained firms when there are downturns and tight credit condition and
outperform when constraints are relaxed.
6 The information used by the authors includes statements regarding the strength of a firm’s liquidity;
furthermore, the ability of the firm to raise external funds as needed. 7 The financial constraint return factors are the differences of returns between financially constrained and
unconstrained firms.

29
2.5 – Capital Control
In the study of stock markets, stock market returns, emerging and developing economies
and financial development, it is important to include the topic of capital control. A capital
control is defined by Christopher Neely (1999), as a policy meant to create a limit or to reassign
capital account transactions. As per Schindler (2009), the significance of the cross-border
financial assets holding has skyrocketed from under 50% of the world GDP in 1970 to over
300% in 2006.
While the factors of capital control can be seen to have a variety of benefits such as,
allowing its government and citizens to lend abroad (this lending would allow domestic
investment to veer from domestic saving, which in turn could promote economic efficiency and
growth), and allowing for diversification of international portfolio. However, the capital flows
are also blamed for being responsible for the spreading of economic disturbances or as a way
in which investors elicit a stop, which may cause an economy to crash (Fernández, Klein,
Rebucci, Schindler and Uribe, 2015).
Blundell-Wignall and Roulet (2013) state that there are several negative effects from
capital control based on the economic theory. Some of the effects are: a reduction of supply of
capital; a raise in the cost of financing; domestic firms that do not have access to international
capital markets will see an increase in financial constraints; increase of corruption or risk; the
reduction of property rights so that the approvals for long-term investors are excluded; and it
leads to costly effects of avoidance and enforcement. The authors also make note of the fact
that there is considerable microeconomic evidence that shows that if emerging countries lift
capital controls, they experience the positive effects that are outlines in the economic theory.
Ghosh and Qureshi (2016) investigate the history of capital controls and why capital
controls on capital inflows have had a bad name. There are several reason referenced which
may have given capital inflows a bad name. The first factor that is mention is that of completely
linked to the capital outflow controls which have been historically linked to autocratic regimes,
failed macroeconomic policies and financial crisis. The second reason is that as countries aimed
at higher trade integration, capital control became viewed as incompatible as capital account
restriction became seen as being linked to current account restriction. The authors concluded
that, while capital inflows are not a perfect instrument which manage financial and
macroeconomic-stability risk, there is really no reason to think that they are worst or of higher
cost than any other policy measure.
Until 1995, the capital control index, created by collecting information from the Annual
Report on Exchange Arrangements and Exchange Restrictions (AREAER) which is published
by the International Monetary Fund, was summarized by using a binary variable where 1
represents a restricted capital account and 0 represents an unrestricted capital account. After
1995, AREAER has used a more structure approached, which served to provide more detailed
information. Schindler’s (2009) work creates a new panel data set, which contains measure of
du jure restriction on transactions across-borders. While the du jure measures are under the
policy maker’s direct control, de facto measures of financial globalization are available to the
public for a large number of countries and years. Schindler’s (2009) new index is able to provide
a more significant comparison of the levels of restrictions across regions.
Due to this new detailed information, researchers have started to integrate the
distinction in the inflow/outflow of capital control, how capital controls affect an economy
(Prati, Schindler and Valenzuela, 2008) and investigate the link between de jure and de facto
measures on the restrictiveness of capital account (Dell’Ariccia, 2008). Furthermore, Henry
(2007) used the du jure measures in order to date reform events. Schindler’s (2009) concludes
his work by stating that the data proposed by his work could help in better understanding the
process of financial globalization.

31
3. DATA AND METHODS OF RESEARCH
In this research, we will be following an applied nature in order to investigate if financial
development, financial constraints, and capital control have an effect on stock returns. The topic
is approached in a quantitative and exploratory manner. The purpose of this chapter is to
introduce and provide a brief description of the database that was used in order to make this
work possible, the methodology, and econometric models that are used in order to analyze the
relationship between financial development and stock returns (Gil, 1994).
This chapter is divided into 2 sections. In section 3.1, the databased used in this work is
described, which involves discussing the origin of the data, and the separation of the variables
used. The principal variables used in the estimation models are also described in this section.
In section 3.2, the econometric models used in order to investigate how stock returns are
affected by financial development variables and three financial constraints index.
3.1 Data
This paper consists of firm-level and country-level data in order to implement the
proposed empirical model. All data used is in U.S dollars due to the fact that the various
economies are studied and it is useful to look at this information from the perspective of an
international investor rather than a local one. The firm-level data covers 14,728 listed
companies (divided into 5,442 firms located in emerging countries and 9,286 firms in developed
countries) in 88 countries from the period of 2004 to 2016. All the information dealing with
firm-level data was collected from the ORBIS database, which contains information of over
200 million companies worldwide. A complete description of all variables and a list of all
countries, divided by emerging and developed, are in Table A and B (see Appendix)
The variables associated with the measure of financial development are from the
database Global Financial Development Database (World Bank) of Čihák, Demirgüç-Kunt,
Feyen, and Levine (2013), updated in June 2017. We employ country-level variables to analyze
the association between stock market returns and macroeconomic conditions.
As one of the focus of this study is to understand the effects of financial development
in stock returns, we employ four measures of the financial system following the study of Čihák
et al. (2012). The first measurement of financial development is that of Depth, which is a proxy,
used to approximate the size of the stock markets. This variable is defined as the sum of stock
market capitalization to GDP (which is the most common choice when approximating the size
of stock markets) and the outstanding volume of debt securities (private and public) to GDP
(which is the most common choice for bond markets).
The second variable used in measuring financial development is Access which is used
as to describe the degree to which the public can access financial market. The access financial
development variable addresses the characteristics of a functioning financial systems
overcoming market friction. This will provide financial services to diverse firms and household,
and will not focus on the large firms and wealthy individuals. This measurement is comprised
of market concentration, which reasons that a higher degree of concentration indicates greater
difficulties for access for newer or smaller issuers. This proxy is defined as the percentage of
market capitalization outside of the top 10 largest companies.
The third measure of financial development that is used is Efficiency, which takes into
consideration the intermediating resources and the facilitation of financial transactions. In
financial markets, the emphasis is placed on the measuring of transactions rather than on the
direct measurement of the cost of the transactions. The suggested measurement for efficiency
is stock market turnover ratio, which is defined as the total value of shares traded during the
period divided by the average market capitalization for the period.
Lastly, the fourth measure used to represent stability for financial markets is market
volatility. Due to the fact that the financial stability plays an important role in the broader topic
of macroeconomic stability, this issue is often independently researched. This variable is
defined as the average of the 360-day volatility of the national stock market index.
The independent variables in our analysis come from multiple sources. The data for
openness, GDP growth rate, and real interest rate were collected from the World Bank’s World
Development Indicators. The variables used in the creation of the indexes of financial
constraints have been deflated. The index used in order to measure capital control was gathered
from the work written by Fernandez, Klein, Rebucci, and Schinlder and Uribe (2015).
The capital control variable that was used in this work is an overall capital control
variable. First, the capital control inflow is calculated based on the average of the inflow of 10
asset categorizations. Then, the capital control outflow is calculated the same way. Once the
capital inflows and outflows are calculated, the average of the inflow and the outflow will give
the overall capital control of a country.
In an attempt to explain a firm's stock return, first we employ a panel data model
considering: 1) the Fama and French three-factor model, 2) macroeconomic variables and 3)
financial development variables. The Fama and French three-factor model is constructed taking
into consideration data for each country. Second, while still using the variables mentioned

33
above, we divided the emerging and developed countries group by capital control, the emerging
countries having high capital control and developed countries having low capital control, as
well as considering the three financial constraint indexes and the interaction of financial
constraints with capital control and financial constraints with GDP growth. Panel data,
otherwise known as longitudinal data, is characterized by collecting the information for the
same firms over a period of time. There are several advantages that come from working with
panel data. Due to the number of observations, the models that are used over the sample allow
for a higher degree of freedom over the estimation of the parameters at the moment that they
are analyzed. As a consequence of a higher degree of freedom, the inferences are more efficient.
Another advantage is that the use of longitudinal data allows for a better consideration of the
dynamic nature in many economic models.
It is important to note that observations in panel allows the control of other characteristic
that may influence the results which were not controlled for with t
3.2. Empirical model and estimation
To estimate the impact of the Fama-French three-factor model, macroeconomic
variables and financial development on stock return, we use the fixed effect model for
considering the heteroscedasticity-robust estimator. The equation (1) represents a general
model which will be expressed in different versions as data is classified in different groups.
1 2 3 _ it i t t t itR Fama French Macro_variables FD_variables (3)
where Rit is the stock return; i is the firm; t is the year; αi is the firm-specific effect;
Fama_Frencht are the variables used dealing with the three factor model which are: Risk
Premim, SMB, and HML. Macro_variablest are the variables used dealing with the
macroeconomic variables such as the GDP growth, real interest rate, openness, capital control
and liquidity; FD_variablesit indicates the different financial development variables; and εit is
the error term.
The data will be first classified into emerging and developed countries. By generating
these two groups, we are able to compare the effects that the three set of variables may have on
stock returns depending on the group. We also separate the sample considering the three
financial constraints to investigate the impact of three set of variables, on stock returns for
emerging and develop countries with the presence of financial constraints on firms.

In order to examine the presence of financial constraint, we use three different indexes:
the KZ, WW and SA index. These financial constraints indexes are constructed in a way that
the higher the value of the index, the higher the financial constraint of the firm. The value of
each index is calculated for each firm. In order to do so, the sample was divided into tertiles
based on the values of the index and then the firms classified in ascending order. The first of
the tertiles was classified as being financially unconstrained, and the firms that belong to the
last of the tertiles were classified as being financially constrained.
Over the years, there have been multiple ways and indexes that financial constraints
have been measured; however, for the purpose of this paper, we will be looking at the KZ, WW
and SA index. While the KZ index does not use size, the WW and SA mostly rely on size. It is
for this reason that the sign for both WW and SA are expected to match.
The KZ index, which was proposed by Lamont et al (2001), follows the following
equation:
ittittit
it
itt
itK
Cash
K
Div
TotCap
DQ
K
CFKZ
111
1.314839.36783.13920,28261.0019
(4)
where i is the firm; t is the year; 𝐾𝑖 is the fixed assets; 𝐶𝐹𝑖𝑡 is the cash flow variable; Q𝑖𝑡 is
the Tobin’s Q; D𝑖𝑡 is the debt variable; TotCap𝑖𝑡 is the total capital defined as the sum of debt
plus stockholders’ equity; Div𝑖𝑡 is the dividends and Cash𝑖𝑡 is the cash, defined as cash plus
short-term investments.
Whited and Wu (2006) suggested another index, which is aptly name the WW index.
This index is shown through the following equation:
ititit
it
it
it
it SGISGSizeTA
LTDDDIV
TA
CFWW 035.0102.0044.0021.0062.0091.0
(5)
where i is the firm; t is the year; 𝐶𝐹𝑖 is the cash flow variable; 𝑇𝐴𝑖𝑡 is the total assets; 𝐷𝐷𝐼𝑉𝑖𝑡
is a dividend payer dummy; 𝐿𝑇𝐷𝑖𝑡 is the long-term debt; 𝑆𝑖𝑧𝑒𝑖𝑡 is the logarithm of the firm’s
total assets; 𝐼𝑆𝐺𝑖𝑡 is the industry’s sales growth and 𝑆𝐺𝑖𝑡 is the firm’s sales growth.
Hadlock and Pierce (2010) create an index, which uses two of the most relative
exogenous variables, firm size and age, otherwise known as the SA-index. Due to the fact that
this index can be calculated for each individual firm, this financial constraint index is said to be

35
firm-specific. Furthermore, this index is capable of coping with time varying changes, meaning
that a firm can alter from a degree of financial constraints during a particular period (Clearly,
1999), while being continuous and facilitating the usage of this index.
2 0.737 0.043 0.040 it it ititSA S S A (6)
where i is the firm; t is the year; S is the firm’s size and A is the firm’s age. The size of the firm
is calculated as the logarithm of book assets. Also, age is defined by the number of years in
activity (Silva and Carreira, 2010).
4. RESULTS
This chapter present the results which were obtained based the estimations of the effects
of financial development, financial constraint and capital control on stock returns in emerging
and developed markets. In order to consider heterogeneity within the observation in the sample,
a robust model was estimated. The classification of financial constraints was possible to due to
the use of three specific indexes of financial constraints: KZ, WW and SA. The section is
divided as follows: Section 4.1 provides an overview of the aggregate view of descriptive
statistics from an overall point of view as well as the emerging and developed economies;
Section 4.2 presents the results from the fixed effect regressions.
4.1 Descriptive Statistics
The descriptive statistics of the date helps to understand some of the features of the
specific dataset. The advantage of the descriptive statistics in our case is that they allow the
interpretation of raw data.
Table 1 shows the mean and the standard deviation of the main variables used in this
work for the sample as a whole as well as separated by emerging and markets.
Table 1: Descriptive statistics for all sample and for developed and emerging group.
VARIABLES All Sample Emerging Developed
Mean Std. dev. Mean Std. dev. Mean Std. dev.
Stock Return 0.095 0.641 0.125 0.680 0.078 0.617
Risk Premium 0.070 0.285 0.129 0.394 0.032 0.171
SMB -.0146 0.192 -0.099 0.222 -0.185 0.151
HML -0.157 0.252 -0.187 0.268 -0.132 0.235
GDP Growth 3.747 3.710 6.467 3.643 1.905 2.386
Real Interest Rate 3.158 4.485 3.665 6.582 2.819 2.079
Capital Control 0.369 0.377 0.774 0.271 0.103 0.100
Openness 0.718 0.687 0.739 0.414 0.702 0.825
Depth 1.419 0.852 0.936 0.555 1.677 0.870
Access 4.141 0.307 4.135 0.278 4.145 0.321
Efficiency 1.062 0.802 0.909 0.979 1.165 0.636
Stability 0.207 0.092 0.229 0.103 0.192 0.080
Liquidity 0.835 0.390 0.689 0.360 0.940 0.377
This table shows the mean and the standard deviation of variables by the overall sample, then divided into emerging
and developed economies.
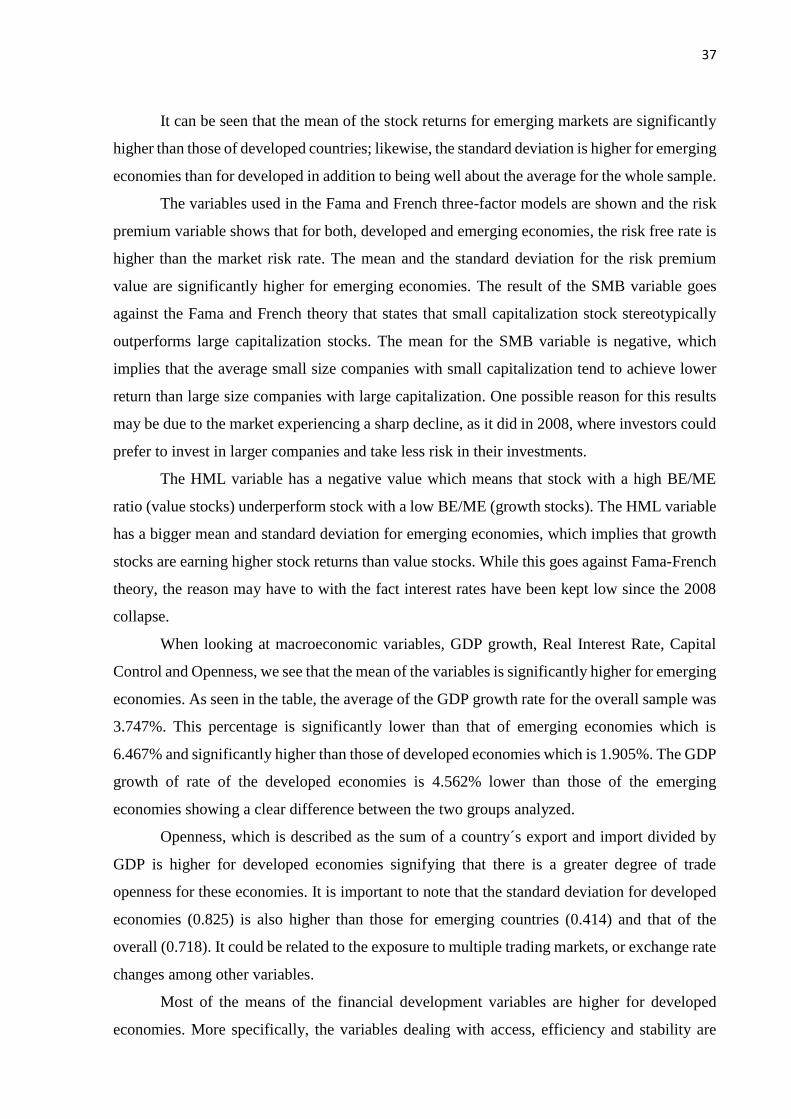
37
It can be seen that the mean of the stock returns for emerging markets are significantly
higher than those of developed countries; likewise, the standard deviation is higher for emerging
economies than for developed in addition to being well about the average for the whole sample.
The variables used in the Fama and French three-factor models are shown and the risk
premium variable shows that for both, developed and emerging economies, the risk free rate is
higher than the market risk rate. The mean and the standard deviation for the risk premium
value are significantly higher for emerging economies. The result of the SMB variable goes
against the Fama and French theory that states that small capitalization stock stereotypically
outperforms large capitalization stocks. The mean for the SMB variable is negative, which
implies that the average small size companies with small capitalization tend to achieve lower
return than large size companies with large capitalization. One possible reason for this results
may be due to the market experiencing a sharp decline, as it did in 2008, where investors could
prefer to invest in larger companies and take less risk in their investments.
The HML variable has a negative value which means that stock with a high BE/ME
ratio (value stocks) underperform stock with a low BE/ME (growth stocks). The HML variable
has a bigger mean and standard deviation for emerging economies, which implies that growth
stocks are earning higher stock returns than value stocks. While this goes against Fama-French
theory, the reason may have to with the fact interest rates have been kept low since the 2008
collapse.
When looking at macroeconomic variables, GDP growth, Real Interest Rate, Capital
Control and Openness, we see that the mean of the variables is significantly higher for emerging
economies. As seen in the table, the average of the GDP growth rate for the overall sample was
3.747%. This percentage is significantly lower than that of emerging economies which is
6.467% and significantly higher than those of developed economies which is 1.905%. The GDP
growth of rate of the developed economies is 4.562% lower than those of the emerging
economies showing a clear difference between the two groups analyzed.
Openness, which is described as the sum of a country´s export and import divided by
GDP is higher for developed economies signifying that there is a greater degree of trade
openness for these economies. It is important to note that the standard deviation for developed
economies (0.825) is also higher than those for emerging countries (0.414) and that of the
overall (0.718). It could be related to the exposure to multiple trading markets, or exchange rate
changes among other variables.
Most of the means of the financial development variables are higher for developed
economies. More specifically, the variables dealing with access, efficiency and stability are
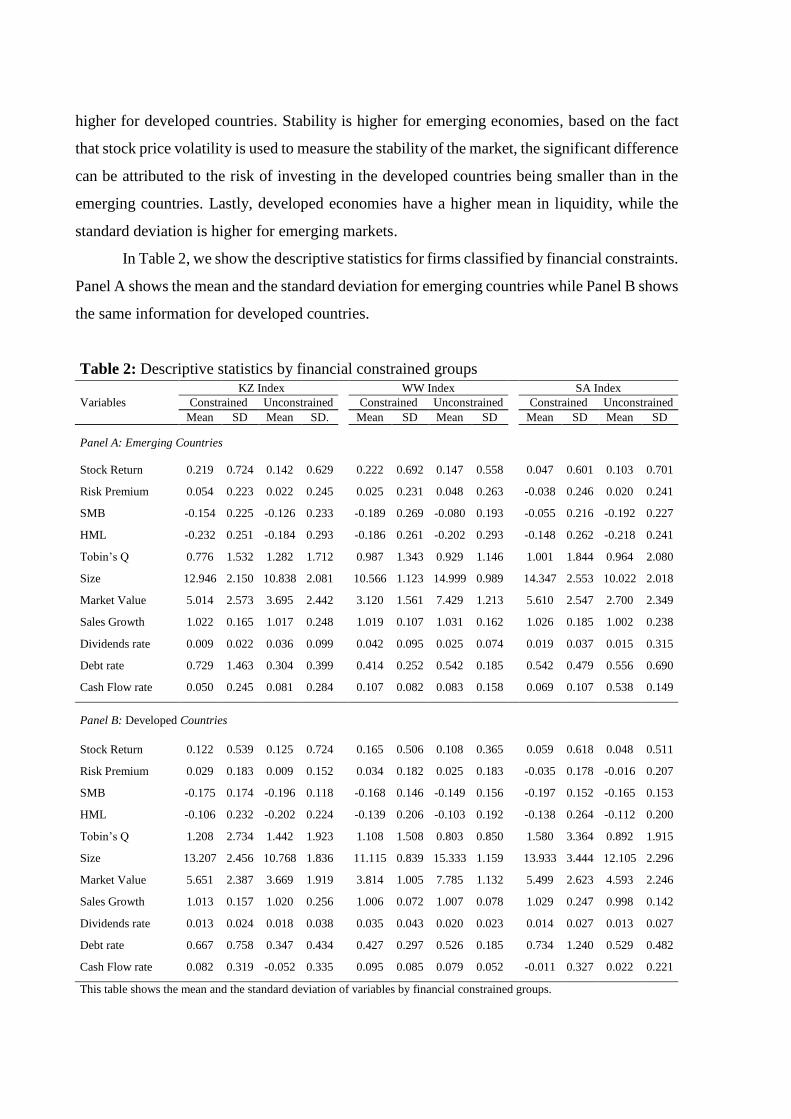
higher for developed countries. Stability is higher for emerging economies, based on the fact
that stock price volatility is used to measure the stability of the market, the significant difference
can be attributed to the risk of investing in the developed countries being smaller than in the
emerging countries. Lastly, developed economies have a higher mean in liquidity, while the
standard deviation is higher for emerging markets.
In Table 2, we show the descriptive statistics for firms classified by financial constraints.
Panel A shows the mean and the standard deviation for emerging countries while Panel B shows
the same information for developed countries.
Table 2: Descriptive statistics by financial constrained groups
KZ Index WW Index SA Index
Variables Constrained Unconstrained Constrained Unconstrained Constrained Unconstrained
Mean SD Mean SD. Mean SD Mean SD Mean SD Mean SD
Panel A: Emerging Countries
Stock Return 0.219 0.724 0.142 0.629 0.222 0.692 0.147 0.558 0.047 0.601 0.103 0.701
Risk Premium 0.054 0.223 0.022 0.245 0.025 0.231 0.048 0.263 -0.038 0.246 0.020 0.241
SMB -0.154 0.225 -0.126 0.233 -0.189 0.269 -0.080 0.193 -0.055 0.216 -0.192 0.227
HML -0.232 0.251 -0.184 0.293 -0.186 0.261 -0.202 0.293 -0.148 0.262 -0.218 0.241
Tobin’s Q 0.776 1.532 1.282 1.712 0.987 1.343 0.929 1.146 1.001 1.844 0.964 2.080
Size 12.946 2.150 10.838 2.081 10.566 1.123 14.999 0.989 14.347 2.553 10.022 2.018
Market Value 5.014 2.573 3.695 2.442 3.120 1.561 7.429 1.213 5.610 2.547 2.700 2.349
Sales Growth 1.022 0.165 1.017 0.248 1.019 0.107 1.031 0.162 1.026 0.185 1.002 0.238
Dividends rate 0.009 0.022 0.036 0.099 0.042 0.095 0.025 0.074 0.019 0.037 0.015 0.315
Debt rate 0.729 1.463 0.304 0.399 0.414 0.252 0.542 0.185 0.542 0.479 0.556 0.690
Cash Flow rate 0.050 0.245 0.081 0.284 0.107 0.082 0.083 0.158 0.069 0.107 0.538 0.149
Panel B: Developed Countries
Stock Return 0.122 0.539 0.125 0.724 0.165 0.506 0.108 0.365 0.059 0.618 0.048 0.511
Risk Premium 0.029 0.183 0.009 0.152 0.034 0.182 0.025 0.183 -0.035 0.178 -0.016 0.207
SMB -0.175 0.174 -0.196 0.118 -0.168 0.146 -0.149 0.156 -0.197 0.152 -0.165 0.153
HML -0.106 0.232 -0.202 0.224 -0.139 0.206 -0.103 0.192 -0.138 0.264 -0.112 0.200
Tobin’s Q 1.208 2.734 1.442 1.923 1.108 1.508 0.803 0.850 1.580 3.364 0.892 1.915
Size 13.207 2.456 10.768 1.836 11.115 0.839 15.333 1.159 13.933 3.444 12.105 2.296
Market Value 5.651 2.387 3.669 1.919 3.814 1.005 7.785 1.132 5.499 2.623 4.593 2.246
Sales Growth 1.013 0.157 1.020 0.256 1.006 0.072 1.007 0.078 1.029 0.247 0.998 0.142
Dividends rate 0.013 0.024 0.018 0.038 0.035 0.043 0.020 0.023 0.014 0.027 0.013 0.027
Debt rate 0.667 0.758 0.347 0.434 0.427 0.297 0.526 0.185 0.734 1.240 0.529 0.482
Cash Flow rate 0.082 0.319 -0.052 0.335 0.095 0.085 0.079 0.052 -0.011 0.327 0.022 0.221
This table shows the mean and the standard deviation of variables by financial constrained groups.
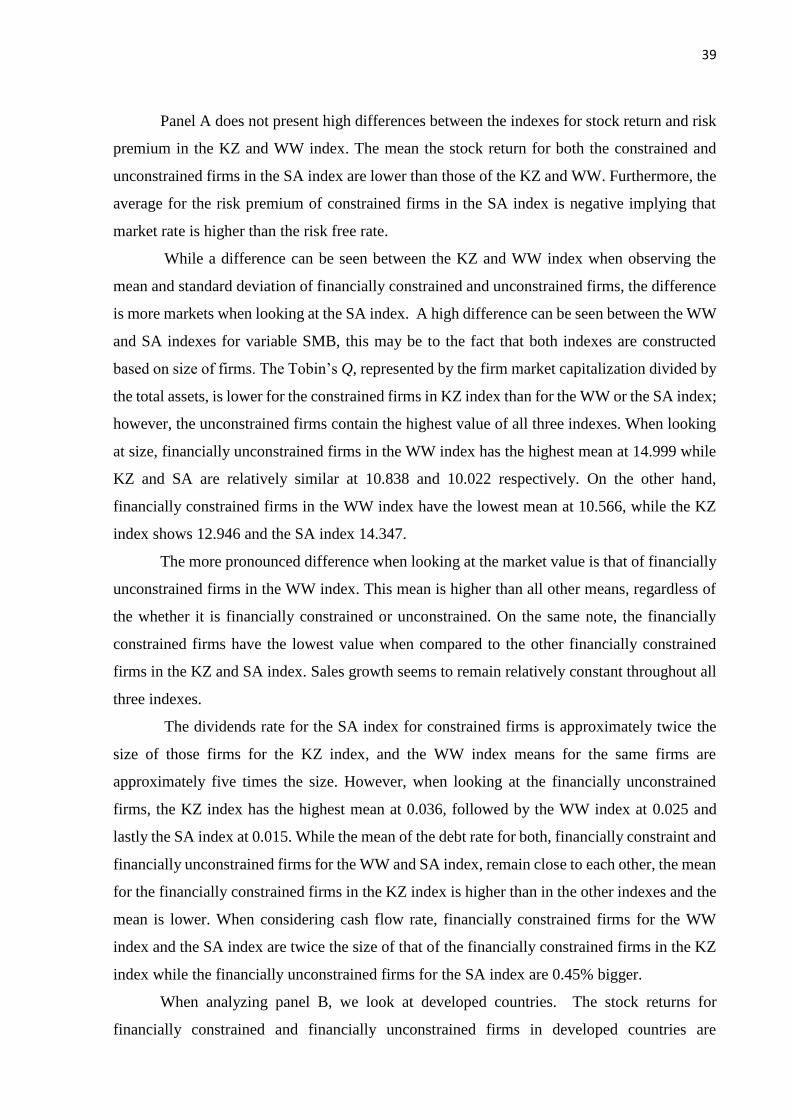
39
Panel A does not present high differences between the indexes for stock return and risk
premium in the KZ and WW index. The mean the stock return for both the constrained and
unconstrained firms in the SA index are lower than those of the KZ and WW. Furthermore, the
average for the risk premium of constrained firms in the SA index is negative implying that
market rate is higher than the risk free rate.
While a difference can be seen between the KZ and WW index when observing the
mean and standard deviation of financially constrained and unconstrained firms, the difference
is more markets when looking at the SA index. A high difference can be seen between the WW
and SA indexes for variable SMB, this may be to the fact that both indexes are constructed
based on size of firms. The Tobin’s Q, represented by the firm market capitalization divided by
the total assets, is lower for the constrained firms in KZ index than for the WW or the SA index;
however, the unconstrained firms contain the highest value of all three indexes. When looking
at size, financially unconstrained firms in the WW index has the highest mean at 14.999 while
KZ and SA are relatively similar at 10.838 and 10.022 respectively. On the other hand,
financially constrained firms in the WW index have the lowest mean at 10.566, while the KZ
index shows 12.946 and the SA index 14.347.
The more pronounced difference when looking at the market value is that of financially
unconstrained firms in the WW index. This mean is higher than all other means, regardless of
the whether it is financially constrained or unconstrained. On the same note, the financially
constrained firms have the lowest value when compared to the other financially constrained
firms in the KZ and SA index. Sales growth seems to remain relatively constant throughout all
three indexes.
The dividends rate for the SA index for constrained firms is approximately twice the
size of those firms for the KZ index, and the WW index means for the same firms are
approximately five times the size. However, when looking at the financially unconstrained
firms, the KZ index has the highest mean at 0.036, followed by the WW index at 0.025 and
lastly the SA index at 0.015. While the mean of the debt rate for both, financially constraint and
financially unconstrained firms for the WW and SA index, remain close to each other, the mean
for the financially constrained firms in the KZ index is higher than in the other indexes and the
mean is lower. When considering cash flow rate, financially constrained firms for the WW
index and the SA index are twice the size of that of the financially constrained firms in the KZ
index while the financially unconstrained firms for the SA index are 0.45% bigger.
When analyzing panel B, we look at developed countries. The stock returns for
financially constrained and financially unconstrained firms in developed countries are

significantly higher for the KZ and the WW index than those in the SA index. While the risk
premium for the SA index is negative for both constrained and unconstrained firms, the mean
for KZ and WW index are positive. The negative sign when looking at the mean implies that
that market rate is higher than the risk free rate. The SMB values are negative for all indexes
implying big capitalization firms outperform small capitalization firms. The lowest mean for
the financially constrained firms is represented in the SA index while the highest is for those
classified under the WW index. The KZ index is approximately three times the size of those
under the SA index. For unconstrained firms, the mean for the WW index is -0.080, while in
the KZ index this group is approximately 0.04 higher and the SA index is about twice the size.
The HML mean is also negative which implies that the growth stocks outperform the value
stocks. While the values remain relatively similar for the financially constrained firms, the
financially unconstrained firms in the KZ index are approximately twice the size of those in the
WW and SA index.
The Tobin’s q for constrained firms are higher for the SA index than for the KZ and
WW index; however, unconstrained firms under the KZ index have a higher mean than those
under the WW and SA index. The size of the WW index for constrained firms is 11.115 which
is slightly less than the 13.207 of the KZ index and the 13.933 of the SA index; however, the
WW index for financially constrained firms have the higher mean with 15.333 while the SA
index has a mean of 12.102 and the KZ has a 10.768 mean.
The market values for financially constrained firms for both the KZ index and the SA
index is approximately the same while it is slightly less for the WW index. Financially
constrained firms for the WW index has the higher mean at 7.785, while the KZ and the SA
index are significantly lower at 3.669 and 4.593 respectively. Furthermore, the differences
between sales growth in all three indexes for financially constrained and financially
unconstrained firms are very small.
The dividends rate for the WW index for constrained firms is approximately twice the
size of those firms for the KZ index and the SA index. However, when looking at the financially
unconstrained firms, the WW index has the highest mean at 0.020, followed by the KZ index
at 0.018 and lastly the SA index at 0.013. While the mean of the debt rate for both, financially
constraint and financially constrained firms for the KZ and SA index, remain close to each
other, the mean for the financially constrained firms in the WW index is lower. The mean for
financially unconstrained firms for the KZ index is lower than both WW and SA indexes at
0.347. When considering cash flow rate, financially constrained firms for the KZ index and the
WW index are approximately 8 times the size of those of the SA index. However, the

41
unconstrained firms of the KZ index are significantly lower at -0.052 than both the WW index
at 0.079 and the SA index at 0.022.
An illustration of the stock return for both emerging and developed countries for the
years 2004 to 2016 is shown below.
Figure 1 - Stock Returns for Emerging and Developed Countries
Source: Own autorship based on the information from the Global Financial Development Database by Cihák,
Demirgüç-Kunt ,Feyenand Levine.
The idea that emerging markets have higher returns than those of the developed
countries is confirmed in figure 1. The sharp decline due to the 2008 financial crises is there for
both countries and we see that the recovery of emerging countries was higher and slightly faster
than those for developed countries. This may due to the fact that due to the instability of the
market of the developed countries, they were looking to new markets in which to invest their
capital. Furthermore, since the emerging markets seem to have higher level of capital control,
they may have been insulated for longer period of time before the crisis. During the period of
2013 through 2016, the relationship between the stock returns of emerging markets and those
of the developed market seem to be negative. While the stock returns for developed markets
rose, the ones for emerging markets decline and vice versa.

Figure 2 shows the progression of the level of liquidity for emerging and developed
countries. Unfortunately, since there was missing information in our database for private credit
sectors to GDP, which is a proxy for liquidity, our parameter starts at 2008.
Figure 2 Liquidity for Emerging and Developed
Source: Own autorship based on the information from the Global Financial Development Database by Cihák,
Demirgüç-Kunt ,Feyen and Levine
When looking at liquidity, we see that the while there has been a slight decline in
developed countries (less than 0.1), while the emerging countries have increase significantly
(from 0.65 to 0.085).
4.2 The results of the estimations
Table 3 present the estimations of the fixed effect model for four models for emerging
and four developed countries. In order to analyze the effects of the Fama and French (1993)
three- factor model, the macroeconomic and financial development variables on stock returns,
we estimate four models by adding a set of group variables in each model. Our analysis will be
focused on model (4), which contain all variables and is based on the criteria Bayesian
information criterion (BIC) and Akaike information criterion (AIC).

43
In analyzing the emerging countries first, we note that the risk premium and the SMB
(Small Minus Big), which represents the difference between the average returns of small and
big firms, are positive and significant in order to explain the stock returns. On the other hand,
the HML (High Minus Low) variable, which represents the difference between the average of
the returns of high book-to-market ratio and low book-to-market ratio, is negative and
significant. This indicates that low growth portfolios have higher market capitalization than
those of high growth portfolios for emerging countries.
Table 3: Fixed-Effect Robust Regression.
Emerging Developed
Variables (1) (2) (3) (4) (5) (6) (7) (8)
Risk Premium 0.163*** -0.053* 0.880*** 0.802*** 0.378*** 0.289*** 1.009*** 0.757***
(0.023) (0.027) (0.035) (0.040) (0.013) (0.017) (0.030) (0.054)
SMB 0.738*** 0.327*** 0.167*** 0.504*** 0.441*** 0.320*** 0.065* 0.277***
(0.033) (0.030) (0.030) (0.036) (0.027) (0.028) (0.035) (0.040)
HML 0.530*** 0.645*** 0.122*** -0.349*** 0.707*** 0.780*** 0.673*** -1.052***
(0.024) (0.023) (0.023) (0.024) (0.023) (0.022) (0.025) (0.029)
GDP Growtht-1 0.107*** -0.097*** 0.052*** -0.024***
(0.002) (0.003) (0.001) (0.002)
Real Interest Ratet-1 0.005*** -0.023*** 0.021*** 0.062***
(0.002) (0.002) (0.002) (0.003)
Capital Controlt-1 0.234*** -1.190*** 0.732*** -1.609***
(0.069) (0.092) (0.069) (0.116)
Openness 2.143*** 0.604*** 0.916*** 0.529***
(0.067) (0.124) (0.038) (0.047)
Depth 2.786*** -1.768*** 0.411*** -0.277***
(0.051) (0.061) (0.021) (0.036)
Access 0.352*** -0.866*** 0.842*** 1.684***
(0.121) (0.124) (0.043) (0.065)
Efficiency 0.050*** -0.238*** 0.165*** 0.300***
(0.013) (0.017) (0.016) (0.021)
Stability 6.791*** 6.511*** 3.512*** 3.233***
(0.126) (0.136) (0.065) (0.108)
Liquidity 2.508*** 3.339*** 0.013 -2.584***
(0.167) (0.175) (0.065) (0.113)
AIC 72477 68151 42797 40735 91151 83725 62787 59758
BIC 72502 68211 42863 40833 91178 83788 62858 59861
R-squared 0.071 0.178 0.377 0.424 0.077 0.144 0.234 0.257
Number of Firms 6,206 6,206 5,442 5,442 11,046 11,038 9,525 9,286
Observations 35,553 35,553 26,557 26,557 57,185 55,581 41,880 41,012
The dependent variable is stock return. The table represents the fixed-effect robust regression considering financial constraints.
Robust standard errors are in parentheses. The symbols *, ** and *** represent the significance of estimators for 10%, 5% and
1% respectively
The effects of macroeconomic variables, such as GDP growth and real interest rate,
capital control on stock return are found to be negative and significant. For the openness
variable, the effect is positive and significant, although greater trade openness makes domestic

firms - and hence domestic stock returns - more susceptible to world economic conditions
(Dellas and Hess, 2005).
When dealing with financial development variables, the results show a negative impact
the depth, access and efficiency on stock returns. Since depth measures the size of the stock
market, we must note that if there is an increase in the size of the stock market, there will be
decrease in the stock returns of the firms. This also happens for access and efficiency variables
and could represent a higher level of competition of the capital market. The variables dealing
with stability and liquidity have a positive impact on stock return. As stability here represents
stock price volatility, the results agree with the theory in that the higher the risk, the higher the
stock returns. As emerging countries are more in need of liquidity, an increase of this variable
could provide a positive impact on stock return.
By analyzing developed countries, we observe that the results are similar to those of the
emerging countries variables of the Fama and French three factor model. The more pronounced
difference between emerging and developed countries is seen in relation to the HML variable,
which for the developed countries the parameter is more than twice the value of that of emerging
countries. When considering the macroeconomic variables, the main difference is observed for
the real interest rate, with a positive impact on stock returns.
For financial development variables, depth and liquidity have a negative impact on stock
returns. For depth, which represents size of the market, a higher market could imply more
competition and reduce the stock returns. The negative impact on stock returns of the liquidity
variable in developed countries could be due to the channeling of private credit to the betterment
endeavors instead of financial markets. The variables of access, efficiency and stability have a
positive impact on stock returns. Similar as emerging countries, more risk implies more stock
returns. The positive impact on stock returns of access and efficiency could be due to lower
concentration and reduces the difficulties in the entry to newer and smaller issuers.
In order to better understand the presence of financial constraints and the role of capital
control on the stock returns we use the following three financial constraints indexes: KZ, WW
and SA. In addition, to capture the effect of capital control for constrained firms we include the
interactions of high and low capital control with financially constrained firms. With this purpose
we classify the sample of emerging and developed countries as having by capital control and
interact them with the indexes of financial constraints. We also check the role of economic
activity and financial constraints on asset prices. Table 4 presents the estimates of six models
considering these interactions for emerging and developed countries.

45
Table 4. Fixed-Effect Robust Regression considering financial constraints and capital control. Emerging (High Control) Developed (Low Control)
Variables (1) (2) (3) (4) (5) (6)
Risk Premium -0.244*** -0.354*** 1.261*** 0.345*** 0.552*** 1.154***
(0.0691) (0.0874) (0.0392) (0.0573) (0.0722) (0.0366)
SMB -0.0527 -0.127*** -0.200*** 0.484*** 0.271*** 0.0365
(0.0320) (0.0413) (0.0362) (0.0646) (0.0695) (0.0403)
HML -0.233*** -0.0893** -0.332*** -0.970*** -0.600*** -0.796***
(0.0297) (0.0361) (0.0343) (0.0415) (0.0558) (0.0278)
Real Interest Ratet-1
0.0217*** 0.0329*** 0.00144 -0.0185*** -0.00737 0.0382***
(0.00184) (0.00253) (0.00196) (0.00353) (0.00512) (0.00304)
Opennesst-1
2.858*** 2.594*** 2.855*** 0.696*** 0.634*** 0.581***
(0.202) (0.248) (0.139) (0.0571) (0.0796) (0.0509)
Depth -0.772*** -1.082*** -2.019*** -0.232*** -0.243*** -0.250***
(0.0777) (0.0979) (0.0797) (0.0310) (0.0345) (0.0228)
Access 1.684*** 0.835*** -0.483*** -0.218** -0.646*** 0.843***
(0.241) (0.307) (0.160) (0.0987) (0.106) (0.0473)
Efficiency 0.0100 0.0724** -0.219*** 0.687*** 0.675*** 0.146***
(0.0261) (0.0323) (0.0161) (0.0474) (0.0508) (0.0178)
Stability 5.380*** 5.524*** 6.581*** 2.121*** 1.636*** 3.503***
(0.175) (0.224) (0.140) (0.126) (0.144) (0.0701)
Liquidity 1.128*** 0.981** 3.947*** -0.654*** -0.568*** -0.775***
(0.331) (0.424) (0.190) (0.121) (0.143) (0.0782)
KZCONST
-0.340*** 0.307***
(0.0777) (0.0620)
Control* KZCONST 0.220*** -0.405***
(0.0752) (0.0648)
GDP growth* KZCONST 0.0156** 0.0243***
(0.00694) (0.00263)
WWCONST
-0.410*** 0.238***
(0.149) (0.0686)
Control*WWCONST -0.0651 -0.419***
(0.144) (0.0720)
GDP growth* WWCONST 0.0377*** 0.0119***
(0.00886) (0.00314)
SACONST
-0.459*** 0.0704
(0.0880) (0.0553)
Control* SACONST 0.543*** -0.180***
(0.0790) (0.0680)
GDP growth* SACONST 0.00223 0.0133***
(0.00743) (0.00369)
R-squared 0.397 0.435 0.426 0.216 0.193 0.247
Number of Firms 4,902 3,477 4,072 6,305 4,131 7,574
Observations 20,427 12,050 17,568 23,867 14,311 33,761 The dependent variable is stock return. The table represents the fixed-effect robust regression considering financial constraints. Robust standard errors are in parentheses. The symbols *, ** and *** represent the significance of estimators for 10%, 5% and 1% respectively. The interaction of Control* KZCONST indicate financial constraints with high capital control when countries are emerging and low capital control when countries are developed.

First, we analyze the results of emerging countries, which, according Table 4, indicate
that financial constraints have a negative and significant impact on stock returns for all three
indexes of financial constraints. The interaction of the financial constraints with capital control
suggests that more capital control associated with financial constraints increase stock returns.
High capital control of the emerging countries could imply a reduction of the ease to withdraw
the money by the external investors. The benefits here for emerging countries may come from
a possible reduction of the economic instability given that these countries are not fully stable
and are more sensitive to economic disturbances and more subjected to international capital
flows.
On the other hand, more economic activity has a positive impact on stock return even
when the firms are considered financially constrained, for all three indexes of financial
constraints. This mean that as the real activity increases in the presence of financial constraints
the stock returns will also increases. An explanation regarding this issue is that financially
constrained firms in emerging countries are more susceptible to macroeconomics fluctuations,
to external credit conditions and are more sensitive on monetary policy. However, it is
reasonable to expect that higher economic growth may reduce the factors of financial
constraints, and in turn increasing the possibility of firm value growth, which will be reflected
on their stock returns.
For developed countries, Table 4 shows that the financial constraints variable by itself
has a positive on stock returns for the all three indexes. A possible explanation for this is that
the investors could demand higher returns to maintain their stocks, which will have a positive
correlation with financial constraints. On the other hand, when we interact financial constraints
with capital control we observe a negative impact on stock returns. As developed countries have
low capital control, they smooth out the difficulties that restrict the transactions in their country.
In developed countries, which are supposedly more stable and less susceptible to economic
fluctuations, this dynamic could result lower stock returns for financially constrained firms.
The same result is found for all financial constraints indexes.
To check if the economic growth associated with financial constraints factors are
connected to stock returns, we interact GDP growth and financial constraints. As result of this
interaction we find that an increase in economic activity positively impacts stock returns. This
means that higher economic growth may alleviate financial constraints by positive expectations
about future better conditions of the economy, future credit conditions, higher expectations
regarding future projects and in turn future profit.

47
5. Conclusions
In this paper, our goal is to investigate the effect that financial development, financial
constraint and capital control have on stock returns in emerging and developing countries. In
order to do so, we employ the Fama and French (1993) three-factor model with the
macroeconomic variable and financial development variables. Additionally, we interact
financial constraints with capital control and with economic activity in order to capture both of
these effect on stock returns. We consider three financial constraint index suggested in the
literature (KZ, WW and SA indexes). To consider te effects of the possible capital liberalization
on stock returns, we also classified emerging and developed countries as having high or low
capital control. The criterion used to classify the capital control of countries help to better
understand the role of the financial globalization process on asset pricing in different
economies. Based on the observations, the statement that emerging countries have high capital
control while developed countries have low capital control can be made.
An additional idea behind the use of capital control as a classifying factor in this research
is that it enables us to investigate the joint impact of capital control and financially constrained
firms on stock returns. Additionally, due to the renewed interest in capital controls, the literature
has grown; however, it is usually focused on one country. We attempt to observe the differences
between the emerging countries, which have high capital control, and the developed countries,
which have low capital control. Furthermore, we aim to capture the effect of economic activity
interacting with financially constrained firms, as well as with capital control on stock returns.
For this purpose, we estimate a robust fixed effect model using panel data with 14,728 firms
from 88 countries (emerging and developed) from the period ranging from 2004-2016.
First, by analyzing the chosen model using the AIC and BIC criteria selection models
for emerging and developed countries, we find that in emerging countries the variables dealing
with risk premium and SMB, as expected based on the Fama and French theory (1992), have a
positive impact on stock returns. However, the results for the HML variable, goes against the
Fama and French theory (1992) in that it has a negative impact on stock returns. This indicates
that low growth portfolios have higher market capitalization than those of high growth
portfolios. It is important to mention that the chosen model include macroeconomic and
financial development variables in addition to the Fama and French three-factor model.
We also find a relevant and statistically significant effect of macroeconomic variables
in stock returns. The capital control variable has a negative effect on stock returns, which may

involve the fact that, as there is an increase of capital control, the inflow and outflows between
countries are more difficult which would impact stock returns negatively. Our results agree with
Chari and Henry (2004), which state that there is an inverse relationship between capital
controls and expected returns.
When dealing with financial development variables, we see that depth, access and
efficiency have a negative impact for emerging economies. These results can go back to the
fact that if there is a decrease in depth, access or efficiency, the market will be riskier and
therefore the stock returns will increase (Fama and French, 1992). Furthermore, liquidity shows
a positive and significant relationship with stock returns which agree with the findings from
Jun, Marathe and Shawky (2003).
When looking at developed countries, the results for the Fama and French three-factor
model are similar to those of the emerging economies in the sense that there is positive
relationship between risk premium, SMB and stock returns, but a negative one for HML. The
main difference between the emerging and developing economies when dealing with
macroeconomic variables is in the real interest rate with a positive impact on stock returns. An
increase of the real interest rate for developed countries indicates an increase in stock returns,
probably due to greater economic stability of these countries. In this sense, a higher interest rate
may encourage the search for higher risk assets with higher returns to these countries.
Considering financial development variables, we find similar results for depth, stability
variables, although the parameter of the stability is half of the value for emerging economies
due to more stable economies. Different to the emerging countries, access and efficiency have
a positive impact on stock returns which could indicate a lower level of concentration,
decreasing barriers of new entries and smaller issuers. Here, the liquidity variable showed a
negative impact on stock returns which could be attributed to the effect of the private credit
channel by improving new ventures.
In order to investigate the presence of financial constraints and the role of the capital
control on stock returns, we use three financial constrain indexes and interact it with capital
control. It also takes into consideration the interaction between financial constraints and GDP
growth. The interactions are included in this model in order to see the impact of this variables
together on stock returns.
When looking at emerging countries, financial constraints are shown to have negative
and significant effect on stock returns. The interaction between financial constraints and high
level of capital control presents a positive and significant effect on stock market return. This
may be due to the fact that the capital controls are high for emerging countries may deter the
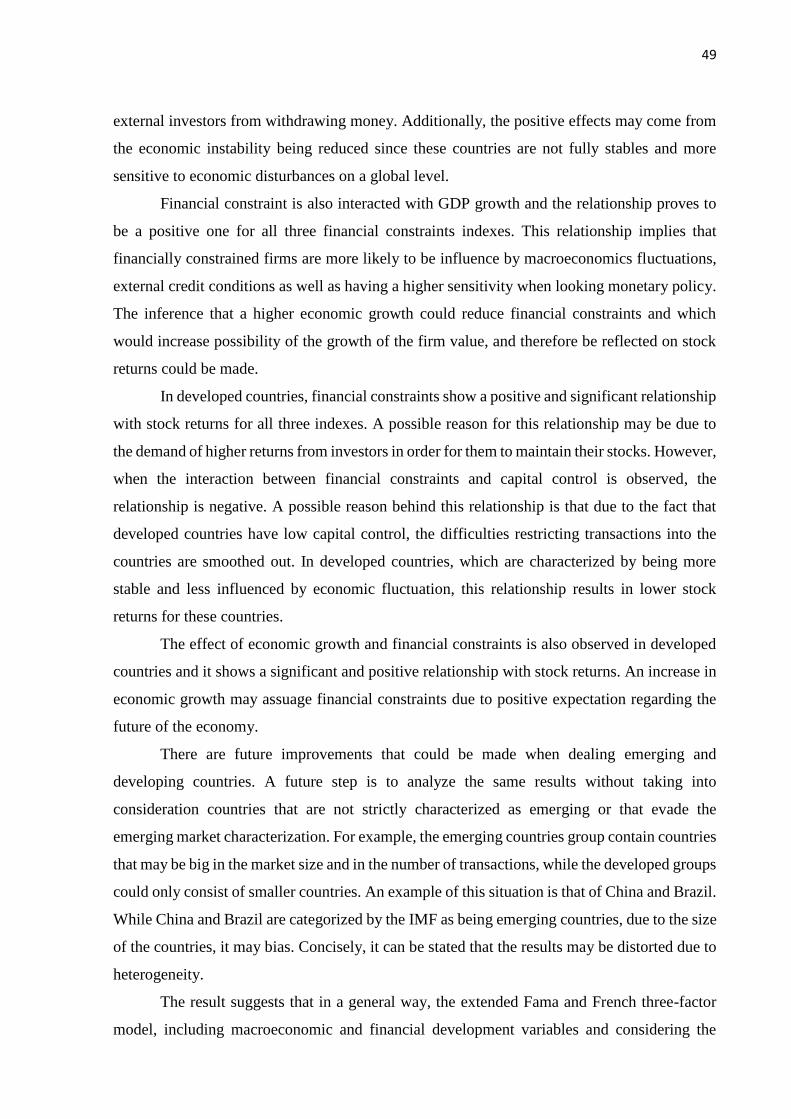
49
external investors from withdrawing money. Additionally, the positive effects may come from
the economic instability being reduced since these countries are not fully stables and more
sensitive to economic disturbances on a global level.
Financial constraint is also interacted with GDP growth and the relationship proves to
be a positive one for all three financial constraints indexes. This relationship implies that
financially constrained firms are more likely to be influence by macroeconomics fluctuations,
external credit conditions as well as having a higher sensitivity when looking monetary policy.
The inference that a higher economic growth could reduce financial constraints and which
would increase possibility of the growth of the firm value, and therefore be reflected on stock
returns could be made.
In developed countries, financial constraints show a positive and significant relationship
with stock returns for all three indexes. A possible reason for this relationship may be due to
the demand of higher returns from investors in order for them to maintain their stocks. However,
when the interaction between financial constraints and capital control is observed, the
relationship is negative. A possible reason behind this relationship is that due to the fact that
developed countries have low capital control, the difficulties restricting transactions into the
countries are smoothed out. In developed countries, which are characterized by being more
stable and less influenced by economic fluctuation, this relationship results in lower stock
returns for these countries.
The effect of economic growth and financial constraints is also observed in developed
countries and it shows a significant and positive relationship with stock returns. An increase in
economic growth may assuage financial constraints due to positive expectation regarding the
future of the economy.
There are future improvements that could be made when dealing emerging and
developing countries. A future step is to analyze the same results without taking into
consideration countries that are not strictly characterized as emerging or that evade the
emerging market characterization. For example, the emerging countries group contain countries
that may be big in the market size and in the number of transactions, while the developed groups
could only consist of smaller countries. An example of this situation is that of China and Brazil.
While China and Brazil are categorized by the IMF as being emerging countries, due to the size
of the countries, it may bias. Concisely, it can be stated that the results may be distorted due to
heterogeneity.
The result suggests that in a general way, the extended Fama and French three-factor
model, including macroeconomic and financial development variables and considering the

presence of financial constraints is important to better understand their impacts on asset pricing
for emerging and developed countries alike.
Furthermore, by interacting financial constraints with GDP growth and financial
constraints with capital control, the results point out different effects based on whether they
belong to emerging or developed countries. These different results based on the emerging and
developed countries are an important aspect that should be considered by policy makers.

51
References ABU-BADER, S., & Abu-Qarn, A. Financial development and economic growth: Empirical
evidence from six MENA countries. Review of Development Economics, Vol. 12
No. 4, p. 803-817, 2008.
ABUGRI, B. Empirical relationship between macroeconomic volatility and stock returns:
Evidence from Latin American markets. International Review of Financial
Analysis. 2006.
AGHION, P., Banerjee, A., & Piketty, T. Dualism and macroeconomic volatility. Quarterly
Journal of Economics, Vol. 114 No. 4, p. 1359-1397, 1999.
ARESTIS, P., Demetriades, P., & Luintel, K. Financial Development and Economic Growth:
The Role of Stock Markets. Journal of Money, Credit and Banking, Vol. 33 No.1,
p.16-41, 2001.
BACCHETTA, P., & Caminal, R. Do capital market imperfections exacerbate output
fluctuations? European Economic Review, 2000.
BANZ, R. The relationship between return and market value of common stocks. Journal of
Financial Economics. 1981.
BEKAERT, G., & Harvey, C. Research in emerging markets finance: Looking to the future.
Emerging Markets Review, 2002.
BERNANKE, B., & Gertler, M. Monetary Policy and Asset Price Volatility. Federal Reserve
Bank of Kansas City - Economic Review, 1999.
BILSON, C., Brailsford, T., & Hooper, V. Selecting macroeconomic variables as explanatory
factors of emerging stock market returns. Pacific-Basin Finance Journal,Vol. 9,
p.401-426, 2001.
BLUNDELL-WIGNALL, A., & Roulet, C. Capital controls on inflows, the global financial
crisis and economic growth: Evidence for emerging economies. OECD Journal:
Financial MARKET TRENDS VOL. 22, 2013.
CAKICI, N., Fabozzi, F., & Tan, S. Size, value, and momentum in emerging market stock
returns. Emerging Markets Review. 2013.
CALOMIRIS, C., Love, I., & Martínez Pería, M. Stock returns' sensitivities to crisis shocks:
Evidence from developed and emerging markets. Journal of International Money
and Finance. 2012.
CAMPELLO, M., & CHEN, L. Are Financial Constraints Priced? Evidence from Firm
Fundamentals and Stock Returns. Journal of Money, Credit and Banking, Vol. 42
No. 6, p. 1185-1198, 2010.
CARHART, M. On Persistence in Mutual Fund Performance. The Journal of Finance. 1997.

CHARI, A & Henry, P.B. Risk Sharing and Asset Prices: Evidence from a Natural
Experiment. The Journal of Finance, Vol. 59, p. 1295-1324, 2004.
CLEARY, S. The Relationship between Firm Investment and Financial Status; The Journal
of Finance, Vol. 2, p. 673-692, 1999.
DEMIRGÜÇ-KUNT, A., & Levine, R. Stock Markets, Corporate Finance, and Economic
Growth: An Overview. The World Bank Economic Review, Vol. 10 No. 2, p. 223-
239, 1996.
FAMA, E., & French, K. The Cross-Section of Expected Stock Returns. The Journal of
Finance , Vol. 47 No. 2, p. 427-465, 1992.
FAMA, E., & French, K. Common Risk Factors in the Returns on Stock and Bonds. Journal
of Financial Economics , Vol. 33, p. 3-56, 1993.
FAMA, E., & French, K. Multifactor Explanations of Asset Pricing Anomalies. Journal of
Finance , Vol. 51 No. 1, p. 55-84, 1996.
FAMA, E., & French, K. The Capital Asset Pricing Model: Theory and Evidence. Journal of
Economic Perspectives , Vol. 18 No. 3, p. 25-46, 2004.
GAY, R. Effect of Macroeconomic Variables on Stock Market Returns for Four Emerging
Economies: Brazil, Russia, India and China. International Business & Economics
Research Journal, Vol. 7 No. 3, 2008.
GEETHA, C., Mohidin, R., Chandran, V., & Chong, V. The relationship between inflation
and stock market: evidence from malaysia, united states and china. International
Journal of Economics and Management Sciences, Vol. 1 No. 2, 1-16, 2011.
GHOSH, A., & Qureshi, M. What's In a Name? That Which We Call Capital Controls What's
In a Name? That Which We Call Capital Controls. IMF Working Paper. 2016.
GIOVANNINI, A., Iacopetta, M., & Minetti, R. Financial Markets, Banks, and Growth :
Disentangling the links. Revue de l'OFCE, Vol. 131 No. 5, p. 105, 2013.
GOLDSMITH, R.W., Financial Structure and Development. Yale University Press, New
Haven, CT. 1969.
HADLOCK, C., & Pierce, J. New evidence on measuring financial constraints: Moving
beyond the KZ index. Review of Financial Studies. 2010.
HENRY, P. Capital Account Liberalization: Theory, Evidence, and Speculation. Journal of
Economic Literature, XLV, p. 887-935, 2007.
HUANG, Y. Determinants of Financial Development. PALGRAVE MACMILLAN. 2010.
JENSEN, M., & Meckling, W. Theory of the firm: Managerial behavior, agency costs and
ownership structure. Journal of Financial Economics. 1976.
53
JUN, S-G., Marathe,A., Shawky, H. Liquidity and stock returns in emerging equity markets.
Emerging Markets Review. Vol. 4, p 1-24. 2003.
KOTHARI, S., Shanken, J., & Sloan, R. Another Look at the Cross-Section of Expected
Stock Returns. The Journal of Finance, Vol. 50 No. 1, p. 185-224, 1995.
LAKONISHOK, J., Shleifer, A., & Vishney, R. Constraint Investment, Extrapolation, and
Risk. The Journal of Finance, Vol. 49 No. 5, p. 1541-1578, 1994.
LAMONT, O., Polk, C., & Saá-Requejo, J. Financial Constraints and Stock Returns. NBER
Working Paper, Cambridge, MA. 2001.
LEVINE, R., Loayza, N., & Beck, T. Financial intermediation and growth: Causality and
causes. Journal of Monetary Economics, Vol. 46, p. 31-77. 2000.
LINTNER, J. The Valuation of Risk Assets and the Selection of Risky Investment in Stock
Portfolios and Capital Budgets. The Review of Economics and Statistics, Vol. 47
No. 1, p.13-37. 1965.
MALIK, A., & Temple, J. The geography of output volatility. Journal of Development
Economics. 2009.
MARKOWITZ, H. Portfolio Selection. The Journal of Finance , Vol. 7 No. 1, p. 77-91,
1952.
MILLER, M.H. Financial markets and economic growth. Journal of Applied Corporate
Finance Vol. 11, p. 8-14, 1998.
MODIGLIANI, F., & Miller, M. The Cost of Capital, Corporation Finance and the Theory of
Investment. The American Economic Review. Vol. 48 No. 3, p. 261-297, 1958.
NEELY, Christopher. An introduction to capital controls. Review. Vol. 81 No. 6, p. 13-30,
1999.
PAGÁN, J., & Soydemir, G. Response asymmetries in the Latin American equity markets.
International Review of Financial Analysis. 2001.
PEREZ-QUIROS, G., & Timmermann, A. Firm size and cyclical variations in stock returns.
Journal of Finance. 2000.
PEROLD, A. The Capital Asset Pricing Model. Journal of Economic Perspectives. 2004.
PRATI, A., Schindler, M., & Valenzuela, P. Who benefits from capital account liberalization?
Evidence from firm-level credit ratings data. Journal of International Money and
Finance. 2012.
QIAN, J. An Introduction to Asset Pricing Theory. Shanghai, p1-106, 2017.
ROSS, S. The Determination of Financial Structure: The Incentive-Signalling Approach. The
Bell Journal of Economics, Vol. 8 No.1, p 23-40, 1977.

ROUSSEAU, P., & Wachtel, P. Equity markets and growth: Cross-country evidence on
timing and outcomes, 1980–1995. Journal of Banking & Finance. 2000.
ROUWENHORST, K. Local return factors and turnover in emerging stock markets. Journal
of Finance. 1999.
SACHS, J. Institutions Matter, but not for everything. Finance and Development . 2003.
SCHINDLER, M. Measuring Financial Integration: A New Data Set. IMF Staff Papers.
2009.
SHARPE, W. Capital asset prices: a theory of market equilibrium under conditions of risk.
The Journal of Finance. 1964.
SCHUMPETER, J.A, The Theory of Economic development, 1912 (translated by Redvers
Opie) Harvard University Press, Cambridge, MA. 1934
WHITED, T., & Wu, G. Financial Constraints Risk. The Review of Financial Studies, Vol.
19 No. 2, p. 531-559, 2006.
WURGLER, J. Financial Markets And The Allocation Of Capital. SSRN Electronic
Journal. 1999.

55
APPENDIX
Source: International Monetary Fund
http://www.imf.org/external/pubs/ft/weo/2017/01/weodata/groups.htm#wa
Table A- List of all countries
List of Countries
Developed Emerging
Australia Argentina Poland
Austria Bahrain Qatar
Bangladesh Bosnia and Herzegovina Romania
Belgium Botswana Russian Federation
Canada Brazil Saudi Arabia
Cyprus Bulgaria Serbia
Czech Republic Chile South Africa
Denmark China Sri Lanka
Estonia Colombia Thailand
Finland Costa Rica Tunisia
France Croatia Turkey
Germany Ecuador United Arab Emirates
Greece Egypt, Arab Rep. Venezuela, RB
Hong Kong SAR, China Ghana Vietnam
Iceland Hungary
Ireland India
Israel Indonesia
Italy Jamaica
Japan Jordan
Korea, Rep. Kazakhstan
Latvia Kenya
Lithuania Kuwait
Luxembourg Lebanon
Malta Macedonia, FYR
Netherlands Malaysia
New Zealand Mauritius
Norway Mexico
Portugal Mongolia
Singapore Montenegro
Slovak Republic Morocco
Slovenia Namibia
Spain Nigeria
Sweden Oman
Switzerland Pakistan
Ukraine Panama
United Kingdom Peru
United States Philippines

Table B - List of Variables
Variables Description
Firm-Level variables
Stock Return (Closing Pricet – Closing Pricet-1/ Closing Price t-1)
SD of Stock Return Standard deviation of stock returns
Risk Premium Market risk rate minus Risk free rate
SMB Average return on the three small portfolios minus the average
return on the three big portfolios (Small minus big)
HML Average return on the two value portfolios minus the average
return on the two growth portfolios (High minus low)
Tobin's q Total Market Value of firm / Total Asset Value
Size Log (Total Assets)
Market Value Market capitalization of the country
Sales Growth Industry’s sales growth
Dividend Rate Total amount of expected dividend payments from investment
expected to be received during that period.
Debt Rate Ratio of total long-term and short-term debt to total assets
Cash flow rate Firms cash flow divided by total assets
Country-Level Variables
Company Market Value
Market capitalization of firms (# of shares outstanding times
the price per share)
GDP growth (GDPt - GDPt-1/ GDPt-1)
Real Interest rate Real Interest Rate
Capital Control Overall Capital Control
Openness Imports + Exports / GDP
Liquidity Private Credit by Deposit Money Banks by GDP
Financial Development
Variables
Depth
(Stock market capitalization + Outstanding domestic private
debt securities) / GDP
Access
Market Capitalization Excluding Top 10 Companies / Total
Market Capitalization
Efficiency Stock Market Turnover Ratio
Stability Stock Price Volatility

57
Figure 3 Capital Control for Emerging and Developed
Source: Own authorship based on the information from the Global Financial Development Database by
Fernandez, Klein, Rebucci, Schindler and Uribe (2015)
Figure 4 Size of Firm of Emerging and Developed
Source: Own authorship based on the information from the Global Financial Development Database by
Cihák, Demirgüç-Kunt, Feyen and Levine


58
Table C – Variable´s correlations
Stock
Return
Risk
Premium SMB HML
GDP
growth
Real
Interest
rate
Capital
Control Openness Depth Access Efficiency Stability Liquidity
Stock Return 1 Risk Premium 0,1334 1
SMB -0,1105 0,0208 1
HML -0,2092 -0,2164 0,0875 1 GDP growth -0,1071 0,016 0,141 -0,0845
Real Interest rate 0,0022 -0,0887 -0,1175 0,0351 -0,0422 1 Capital Control 0,0835 0,1958 0,151 -0,0869 0,7061 0,0614 1 Openness -0,0012 0,0298 -0,2164 0,0436 0,1619 -0,0278 -0,0024 1
Depth -0,0597 -0,0213 -0,0577 -0,0823 -0,2723 -0,0874 -0,4494 0,5142 1
Access 0,0851 0,2425 0,3344 -0,1187 0,2099 -0,2125 0,3134 -0,0347 0,0269 1
Efficiency 0,1751 0,2868 0,3004 -0,3211 0,1525 -0,0623 0,2293 -0,1927 -0,1774 0,4664 1
Stability 0,2642 -0,2805 -0,1308 -0,0924 -0,0339 0,0893 0,0913 -0,072 -0,2069 0,1244 0,2697 1
Liquidity 0,0022 -0,0527 0,0799 -0,3225 -0,1878 -0,202 -0,2799 -0,0173 0,3439 0,1123 0,3567 -0,171 1
This table displays the correlations between the Fama and French three factors (Risk premium, SMB, HML), the macroeconomic variables (GDP
growth, Real interest rate, Capital control, Openness and liquidity) and the financial development variables (depth, access, efficiency, stability).