Embed Size (px)
Citation preview

UNIVERSIDADE ESTADUAL DE CAMPINAS
FACULDADE DE ENGENHARIA DE ALIMENTOS
DEPARTAMENTO DE ALIMENTOS E NUTRIÇÃO
Curso de Pós-Graduação em Alimentos e Nutrição
Área de Nutrição Experimental e Aplicada à Tecnologia de Alimentos
Luciano Bruno de Carvalho Silva
Mestre em Alimentos e Nutrição
ISOLADO PROTÉICO DO SORO DE LEITE COMO PERSPECTIVA NO
CUIDADO NUTRICIONAL DE INDIVÍDUOS COM ESCLEROSE LAT ERAL
AMIOTRÓFICA
CAMPINAS
2008

ii
FICHA CATALOGRÁFICA ELABORADA PELA
BIBLIOTECA DA FEA – UNICAMP
Título em inglês: Milk whey protein isolate as a perspective on nutritional care for amyotrophic
lateral sclerosis patients Área de concentração: Nutrição Experimental Aplicada à Tecnologia de Alimentos Palavras-chave em inglês (Keywords): Amyotrophic lateral sclerosis, Malnutrition,
Supplementation, Dysphagia, Milk Whey proteins, Food intake
Titulação: Doutor em Alimentos e Nutrição Banca examinadora: Jaime Amaya-Farfan
Adriane Elizabete Antunes Anamarli Nucci Ariovaldo Armando da Silva Érika Maria Marcondes Tassi Granja Lucia Figueiredo Mourão Data da defesa: 15/01/08 Programa de Pós Graduação: Programa em Alimentos e Nutrição
Silva, Luciano Bruno de Carvalho Si38i Isolado protéico do soro de leite como perspectiva no cuidado
nutricional de indivíduos com esclerose lateral amiotrófica / Luciano Bruno de Carvalho Silva. -- Campinas, SP: [s.n.], 2008.
Orientador: Jaime Amaya-farfán Tese (doutorado) – Universidade Estadual de Campinas.Faculdade
de Engenharia de Alimentos 1. Esclerose amiotrófica lateral. 2. Desnutrição. 3.
Suplementação. 4. Disfagia. 5. Proteínas do soro de leite. 6. Ingestão alimentar. I. Amaya-Farfán, Jaime. II. Universidade Estadual de Campinas.Faculdade de Engenharia de Alimentos. III. Título.
(cars/fea)

iii
Luciano Bruno de Carvalho Silva
Mestre em Alimentos e Nutrição
ISOLADO PROTÉICO DO SORO DE LEITE COMO PERSPECTIVA NO
CUIDADO NUTRICIONAL DE INDIVÍDUOS COM ESCLEROSE LAT ERAL
AMIOTRÓFICA
UNICAMP
2008
Tese apresentada como exigência para obtenção do
Título de Doutor em Alimentos e Nutrição - Área de
Nutrição Experimental e Aplicada à Tecnologia de
Alimentos à Faculdade de Engenharia de Alimentos
da Universidade Estadual de Campinas
Orientador
Professor Doutor Jaime Amaya-Farfán

iv
BANCA EXAMINADORA
Prof. Dr. Jaime Amaya-Farfán
Faculdade de Engenharia de Alimentos - Universidade Estadual de Campinas
Profa. Dra. Adriane Elizabete Antunes Centro de Pesquisa e Desenvolvimento de Laticínios - Instituto de Tecnologia de
Alimentos
Profa. Dra. Anamarli Nucci Faculdade de Ciências Médicas - Universidade Estadual de Campinas
Prof. Dr. Ariovaldo Armando da Silva Faculdade de Ciências Médicas - Universidade Estadual de Campinas
Profa. Dra. Érika Maria Marcondes Tassi Granja Instituto de Biologia - Universidade Estadual de Campinas
Profa. Dra. Lucia Figueiredo Mourão Faculdade de Ciências Médicas - Universidade Estadual de Campinas

v
“ Ah! Se o mundo inteiro Me pudesse ouvir Tenho muito prá contar Dizer que aprendi... E na vida a gente Tem que entender Que um nasce prá sofrer Enquanto o outro rir.. Mas quem sofre Sempre tem que procurar Pelo menos vir achar Razão para viver... Ver na vida algum motivo Prá sonhar Ter um sonho todo azul Azul da cor do mar... Mas quem sofre Sempre tem que procurar Pelo menos vir achar Razão para viver... Ver na vida algum motivo Prá sonhar Ter um sonho todo azul Azul da cor do mar...” Tim Maia (Cantada por um paciente) “ Esperança! ” Palavra formada na prancha de comunicação alternativa, juntando as letras do alfabeto disponíveis por meio de varredura (somente com indicação pelos olhos), por um paciente com comprometimento apendicular.

vi
A vocês, pacientes que colaboraram para que novas perspectivas se abrissem, e a
todos os pacientes com esclerose lateral amiotrófica, que todos os dias, incansavelmente lutam pela vida,
A Adriana, minha princesa, meu amor, minha vida, pela confiança, apoio,
companheirismo, paciência sempre,
Dedico.

vii
AGRADECIMENTOS
Ao Prof. Dr. Jaime Amaya-Farfán pela orientação, apoio, confiança, oportunidade e
respeito. Serei eternamente grato. Ao professor, toda minha admiração e respeito!
Ao Conselho Nacional de Desenvolvimento Científico e Tecnológico – CNPq pela
concessão da bolsa nos primeiros meses de curso.
Ao Programa de Pós-Graduação em Alimentos e Nutrição da Faculdade de Engenharia de
Alimentos da UNICAMP.
À Universidade Federal de Alfenas – UNIFAL-MG pela liberação para cursar o doutorado.
À Profa. Dra. Anamarli Nucci, pela oportunidade, pela solicitude e ensinamentos,
indispensáveis.
À Profa. Dra. Lucia Figueiredo Mourão e ao Prof. Dr. Ariovaldo Armando Silva, pela
amizade, profissionalismo e ética.
À Profa. Dra. Adriane Elizabete Antunes, por toda ajuda, amizade e pela oportunidade em
trabalharmos juntos.
Aos membros da Banca Examinadora pelas contribuições e sugestões a esta tese.
Ao Instituto de Tecnologia de Alimentos – ITAL, na pessoa da Pesquisadora Fernanda
Vissotto, sempre solícita e dedicada.
A todos dos Ambulatórios de Neurologia e Otorrinolaringologia do Hospital das Clínicas
da Unicamp, em especial a fonoaudióloga Aline Wolf.
Aos meus grandes parceiros Núbia, Sara e Marcondes. Sem vocês com certeza este trabalho
não teria acontecido!
Aos funcionários da Coordenadoria de Pós-Graduação, em especial ao Cosme, pelos
esclarecimentos e ajuda.

viii
Aos amigos Ari de Paula e Isabel Botelho pela amizade e ensinamentos.
Ao meu saudoso pai, cuja presença, muitas vezes foi sentida ao meu lado.
À minha maravilhosa mãe Maria Aparecida, por me preparar para a vida, e aos meus
irmãos Priscilla, Silas, Bruno e André que tanto amo.
À minha avó Geralda e minha tia Carmelita, pelos ensinamentos, apoio e orações. Amo
muito vocês!!!
À minha “nova” família, Denise, Paulo Sergio, Marcos, Dona Wilma e Carlos, pelos
momentos de descontração.
Aos meus amigos da UNIFAL-MG, nas pessoas de Cristiane, Daniela, Eliane, Eveline,
Flavia, Luciana, Márcia, Marcos, Neide, Simone, Tânia e Valéria. Muito obrigado por
tudo!
A minha grande amiga Olga Lucia pela amizade e apoio.
À Michelle Anderson pelos meses de ajuda, principalmente nas análises de ingestão
alimentar.
Às alunas Elaine e Fernanda pelo apoio durante a formatação da Tese.
A todos, que de alguma forma contribuíram, direta ou indiretamente, para que este trabalho
se efetivasse.
Meus mais sinceros agradecimentos!!!
"Não há lugar para a sabedoria onde não haja paciência." (Santo Agostinho)

ix
RESUMO
SILVA, Luciano Bruno de Carvalho. Isolado protéico do soro de leite como perspectiva
no cuidado nutricional de indivíduos com Esclerose Lateral Amiotrófica. Campinas,
2007. 170 f. Tese (Doutorado) – Curso de Pós-Graduação em Alimentos e Nutrição,
Universidade Estadual de Campinas. Campinas, 2008.
A Esclerose Lateral Amiotrófica (ELA) é uma doença progressiva neurodegenerativa que
envolve, neurônios motores do córtex cerebral, cérebro e medula espinhal. Em
aproximadamente 50% dos pacientes, a doença afeta inicialmente os braços. Em 25%, a
doença afeta as pernas e, em 25%, o início da doença é bulbar. Ocorre desnutrição em 16%-
50% dos pacientes com ELA, principalmente pela disfunção da deglutição. Para 50% dos
casos, a ELA é comumente fatal dentro de 3-4 anos a partir da ocorrência de pneumonia.
Muitas complicações nutricionais que acontecem com o paciente com ELA, geralmente se
devem à viscosidade da dieta. Os líquidos de baixa viscosidade dificultam a deglutição de
pacientes que apresentam controle laríngeo reduzido. O objetivo do presente trabalho foi
diagnosticar o estado nutricional, bem como avaliar o efeito da suplementação com isolado
protéico do soro de leite aglomerado com polissacarídeo no estado nutricional e condições
gerais de pacientes com ELA. A investigação da ingestão alimentar se deu por meio da
avaliação do consumo alimentar, qualitativo e quantitativo, de pacientes com ELA.
Aplicou-se o questionário de freqüência de consumo alimentar e o recordatório de 24 horas.
Todos os pacientes apresentaram inadequação para energia, fibras, cálcio e vitamina E.
Considerando-se a predominância topográfica do comprometimento muscular na doença,
foram observadas diferenças significativas entre pacientes predominantemente bulbares e
de predomínio apendicular. Nos pacientes com maior envolvimento apendicular (GA)
houve maior ingestão energética (p=0,02), de gordura saturada (p=0,03), monoinsaturada
(p=0,04) e polinsaturada (p=0,001), além de colesterol (p=0,001) e fibras (p=0,001). Nos
pacientes com predominância bulbar (GB) houve dificuldade no manejo da consistência da
dieta. A partir daí, foram elaborados suplementos a base de proteínas do soro de leite e
polissacarídeo. O aglomerado contendo 70% de isolado protéico do soro de leite e 30% de
amido modificado (70%WPI:30%AM) na concentração de 28g em 250mL em todos os
sistemas avaliados, suco de laranja e leite integral, exibiu viscosidade entre 2122,66 e

x
5110,60 centipoises, além de maior nota, nos testes sensoriais, 6,97 (± 0,15), quando
comparado aos outros produtos, não diferindo (p=0,681) do espessante comercial, que
obteve nota 6,91 (± 0,38). Baseando-se nestes resultados, sugeriu-se a utilização do
aglomerado 70%WPI:30%AM para terapia nutricional de pacientes com ELA. Previamente
à administração do suplemento, em função dos poucos dados sobre as técnicas de avaliação
nutricional em ELA, foram correlacionados os indicadores mais comuns na avaliação
nutricional, funcional e respiratória dos pacientes. No GA, observou-se correlação entre:
Pressão inspiratória máxima (Pimax) e expiratória máxima (Pemax) (r=-0,76); Pemax e
oximetria de pulso (r=0,58); Pimax e porcentagem de perda de peso (%PP) (r=0,59); e entre
Pimax, escore total e subescala respiratória (ALSFRS) com %PP (r=0,59). No GB, houve
correlação entre Pemáx e IMC (r=0,97). Em ambos GA e GB, observaram-se correlação
entre índice de massa corporal (IMC) e as variáveis: massa (kg), gordura (%),
circunferência braquial e punho (cm), pregas cutâneas tricipital, subescapular e supra-ilíaca
(mm), circunferência muscular do braço (cm), área muscular e gordurosa do braço (mm2).
Definidas as técnicas de avaliação, 16 pacientes foram divididos em dois grupos:
suplementado (70%WPI:30%AM) e controle (maltodextrina) e submetidos a avaliação
nutricional, respiratória e funcional durante 4 meses. No grupo suplementado verificou-se
melhora do estado nutricional geral, aumento do peso e Índice de Massa Corporal-IMC,
circunferência e área muscular do braço (CMB e AMB), albumina, linfócitos e leucócitos,
diminuindo os marcadores do catabolismo muscular, creatina quinase, aspartato-amino-
transferase e alanina-amino-transferase. No grupo controle, observou-se diminuição do
peso, IMC, CMB e AMB e aumento da área gordurosa do braço, sem alterações
significativas nos parâmetros bioquímicos. O presente estudo mostrou que o suplemento
70%WPI:30%AM melhorou o estado nutricional e condições gerais pacientes com ELA,
podendo ser utilizado na prática clínica.
Termos de Indexação: esclerose lateral amiotrófica, desnutrição, suplementação, disfagia,
proteínas do soro de leite, ingestão alimentar.

xi
ABSTRACT
SILVA, Luciano Bruno de Carvalho. Milk whey protein isolate as a perspective on
nutritional care for amyotrophic lateral sclerosis patients. Campinas, 2007. 170 f. Tese
(Doutorado) – Curso de Pós-Graduação em Alimentos e Nutrição, Universidade
Estadual de Campinas. Campinas, 2008.
Amyotrophic lateral sclerosis (ALS) is a progressive neurodegenerative disorder that
involves, motor neurons in the cerebral cortex, brainstem, and spinal cord. In approximately
50% of the patients, the disease first affects the arms, in 25% the legs and in 25% the onset
is bulbar. Malnutrition occurs in 16%-50% of patients with ALS, mainly for swallowing
difficulty. For 50% of the cases, ALS is frequently fatal inside of 3-4 years from the
pneumonia occurrence. Many of the nutritional complications that occur with ALS
sufferers are due to the low viscosity of the diet. Fluid liquids are difficult to swallow by
patients with reduced deglutition control. The objective of the present work was to
diagnosis the nutricional state as well as evaluating the effect of the supplementation with
milk whey protein isolate agglomerated with modified starch in the nutricional state and
general conditions of patients with ALS. The investigation of the alimentary intake was
evaluate quantitatively and qualitatively food intake in patients with ALS. We employed
the frequency questionnaire and the 24h-diet history. All patients presented inadequate
energy, fibers, calcium and vitamin E intake. Taking into account predominantly affected
muscle groups, we found significant differences between patients with bulbar or
appendicular onset. Patients with appendicular ALS had higher intake of energy (p=0.02),
saturated fat (p=0.03), monounsaturated fat (p=0.04), polyunsaturated fat (p=0.001), as well
as cholesterol (p=0.001) and fibers (p=0.001). In the patients with predominance to bulbar
(GB) had difficulty in the handling of the consistency of the diet. From there, supplements
had been elaborated from protein base of whey milk and modified starch. The agglomerate
contend 70% whey protein isolate and 30% modified starch (70%WPI:30%MS), in all the
systems evaluated, at a concentration of 112g/L showed a viscosity between 2,122 and
5,110cP. In the sensory tests, the 70%WPI:30%MS in orange juice obtained the highest
score, 6.97 (± 0.15), in relation to the other agglomerates, not differing (p=0.681) from the
commercial thickener, 6.91 (p=0.380). Based on these results, the agglomerate

xii
70%WPI:30%MS was suggested for use in the nutritional therapy of patients with ALS.
Previously the administration of the supplement, in function of the few data on the
techniques of nutricional evaluation in ALS, had been correlated the pointers most common
in the nutricional, functional and respiratory evaluation of the patients. Among the GA type
significant correlation was observed between maximal inspiratory (MIP) and expiratory
(MEP) pressure (r=-0.76), MEP and pulse oxymetry (r=0.58), MIP and percent weight loss
(%WL; r=0.59), and between MIP, total and subscale respiratory scores (ALSFRS-R) with
%WL. With regard to the GB, correlation was found between MEP and BMI (r=0.97). In
both GA and GB correlations were noticed between the BMI and the variables mass (kg),
fat (%), arm and fist circumference (cm), and tricipital, subscapular and supra-iliac
skinfolds (mm), as well as the arm muscle circumference (cm) and fatty arm muscular area
(mm2). After defined the evaluation techniques, 16 patients were randomized to two
groups, treatment (70%WPI:30%MS) and placebo (maltodextrin). They underwent
prospective nutritional, respiratory and functional assessment for 4 months. Patients in the
treatment group presented weight gain, increased BMI, increased arm muscle area and
circumference, higher albumin, white blood cell and total lymphocyte counts, and reduced
markers of skeletal muscle turnover (creatine-kinase, aspartate transferase and alanine
transferase). In the placebo group, biochemical measures did not change, but weight and
BMI declined. Our results indicate that the agglomerate 70%WPI:30%MS may be useful in
the nutritional therapy of patients with ALS.
Indexing terms: amyotrophic lateral sclerosis, malnutrition, supplementation, dysphagia,
milk whey proteins, food intake.

xiii
LISTA DE FIGURAS DO ARTIGO II
Figura 1 Analysis of preference of the foods containing added agglomerates isolate
(WPI), concentrate (WPC) and hydrolysate (WPH) milk whey protein
and calcium caseinate (CasCa) at the concentration of 18 at 28 g in 250
mL at 25°C………………………..……………….....................................
99

xiv
LISTA DE FIGURAS DO ARTIGO IV
Figura 1 Proteic-caloric malnutrition score (PCMS) throughout 4 months in patients
with ALS. Control Group (CON) and Treatment Group (SPL)................................
136

xv
LISTA DE TABELAS DA REVISÃO BIBLIOGRÁFICA
Tabela 1 Classificação do estado nutricional segundo os parâmetros propostos por
Blackburn; Harvey (1982) e Blackburn; Thornton (1979)...........................
18
Tabela 2 Classificação da viscosidade, em valores de centipoise (cP), de acordo
com a ADA (2002) para o cuidado nutricional de indivíduos com disfagia
26
Tabela 3 Porcentagem de proteínas no leite bovino em base úmida........................... 32

xvi
LISTA DE TABELAS DO ARTIGO I
Tabela 1 Valores de referência diária de nutrientes.................................................... 60
Tabela 2 Alimentos mais referidos de consumo diário, semanal e mensal pelos
pacientes com ELA......................................................................................
63
Tabela 3 Avaliação da adequação de energia e nutrientes, segundo os valores de
referência e de acordo com o nº de pacientes...............................................
64
Tabela 4 Comparação do consumo energético e de nutrientes entre indivíduos com
ELA com manifestação inicial bulbar e apendicular....................................
65
xvii
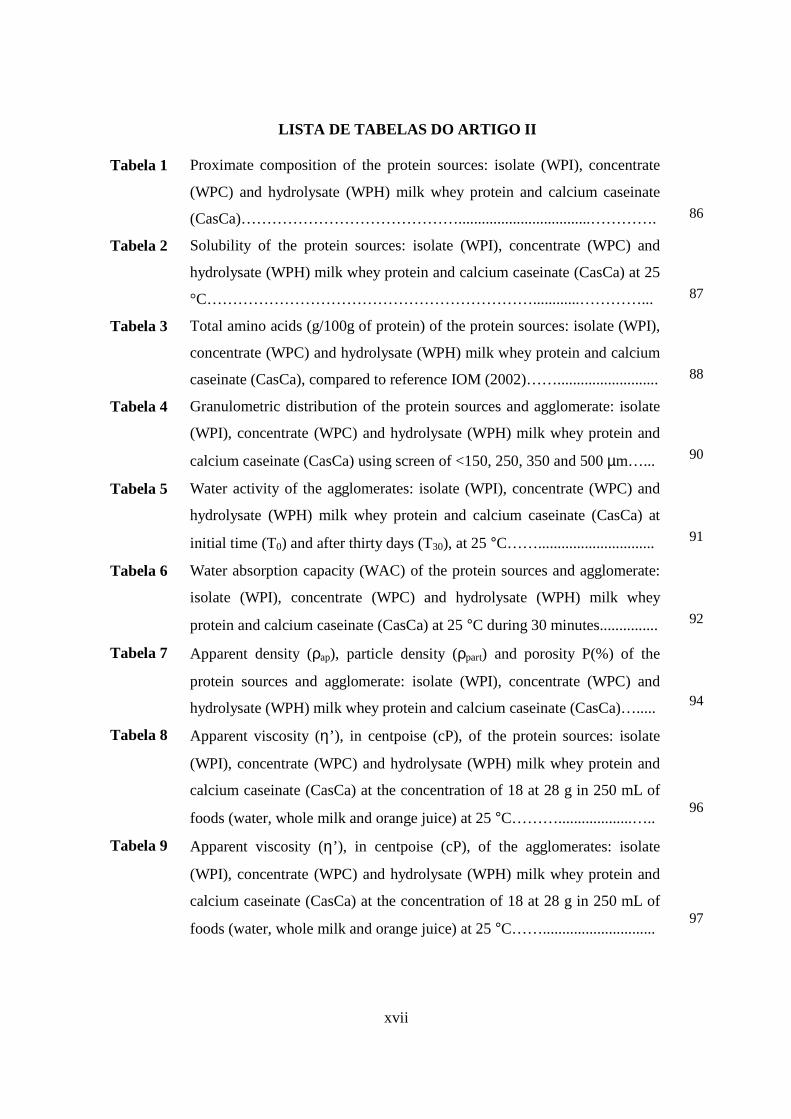
LISTA DE TABELAS DO ARTIGO II
Tabela 1 Proximate composition of the protein sources: isolate (WPI), concentrate
(WPC) and hydrolysate (WPH) milk whey protein and calcium caseinate
(CasCa)……………………………………..................................………….
86
Tabela 2 Solubility of the protein sources: isolate (WPI), concentrate (WPC) and
hydrolysate (WPH) milk whey protein and calcium caseinate (CasCa) at 25
°C………………………………………………………............…………...
87
Tabela 3 Total amino acids (g/100g of protein) of the protein sources: isolate (WPI),
concentrate (WPC) and hydrolysate (WPH) milk whey protein and calcium
caseinate (CasCa), compared to reference IOM (2002)……..........................
88
Tabela 4 Granulometric distribution of the protein sources and agglomerate: isolate
(WPI), concentrate (WPC) and hydrolysate (WPH) milk whey protein and
calcium caseinate (CasCa) using screen of <150, 250, 350 and 500 µm…...
90
Tabela 5 Water activity of the agglomerates: isolate (WPI), concentrate (WPC) and
hydrolysate (WPH) milk whey protein and calcium caseinate (CasCa) at
initial time (T0) and after thirty days (T30), at 25 °C……..............................
91
Tabela 6 Water absorption capacity (WAC) of the protein sources and agglomerate:
isolate (WPI), concentrate (WPC) and hydrolysate (WPH) milk whey
protein and calcium caseinate (CasCa) at 25 °C during 30 minutes...............
92
Tabela 7 Apparent density (ρap), particle density (ρpart) and porosity P(%) of the
protein sources and agglomerate: isolate (WPI), concentrate (WPC) and
hydrolysate (WPH) milk whey protein and calcium caseinate (CasCa)….....
94
Tabela 8 Apparent viscosity (η’), in centpoise (cP), of the protein sources: isolate
(WPI), concentrate (WPC) and hydrolysate (WPH) milk whey protein and
calcium caseinate (CasCa) at the concentration of 18 at 28 g in 250 mL of
foods (water, whole milk and orange juice) at 25 °C………...................…..
96
Tabela 9 Apparent viscosity (η’), in centpoise (cP), of the agglomerates: isolate
(WPI), concentrate (WPC) and hydrolysate (WPH) milk whey protein and
calcium caseinate (CasCa) at the concentration of 18 at 28 g in 250 mL of
foods (water, whole milk and orange juice) at 25 °C…….............................
97

xviii
LISTA DE TABELAS DO ARTIGO III
Tabela 1 Demographic data (n=20)…………………………………………........… 115
Tabela 2 Correlations of nutritional functional and respiratory indicators of bulbar
and apendicular groups………………………………................………….
116
Tabela 3 Anthropometric profile of patients with ALS according to the
predominance symptoms…………………………………………….....….
116
Tabela 4 Spearman correlation coefficients of BMI and other nutritional markers
according to the predominance symptoms of the disease….…...................
117

xix
LISTA DE TABELAS DO ARTIGO IV
Tabela 1 Values of food intake throughout 4 months in patients with ALS…............. 133
Tabela 2 Influence of the nutritional supplementation with aggomerate milk whey
protein on body weight (kg), body mass index (IMC-kg/m2), fat mass (%) e
fat free mass (%)……………………………………………..............……...
134
Tabela 3 Influence of the nutritional supplementation with agglomerate of
70%WPI:30%MS on body composition: tricipital skinfolds (TSF), bicipital
skinfolds (BSF), supra-iliac skinfolds (SISF), subscapular skinfolds (SESF)
and sum of four skinfolds (mm)………...........………...................................
135
Tabela 4 Influence of nutritional supplementation with agglomerate of
70%WPI:30%MS on body composition: midarm circumference (MAC),
wrist circumference (WC), midarm muscle circumference (MAMC), airm
muscle area (AMA) and airm fat area (AFA) (cm2)……………...................
135
Tabela 5 Influence of nutritional supplementation with aggomerate of milk whey
protein on biochemical parameters…………………………………........…
137
Tabela 6 ALSFRS-R: Level of significance enters the first and second time of
control and supplemented groups...................................................................
138

xx
LISTA DE ABREVIATURAS
%G - Porcentagem de gordura
%MM - Porcentagem de massa magra
%P - Percent porosity
%PP - Porcentagem de perda de peso
%WL - Percent weight loss
ADA - American Dietetic Association
AI - Ingestão adequada
ALS - Amyotrophic lateral sclerosis
ALSFRS-R - Amyotrophic lateral sclerosis functional rating scale revised
AM - Amido modificado
AMA - Airm muscle area
AMB - Área muscular do braço
BMI - Body mass index
BSF - Biciptal skinfolds
CasCa - Calcium caseinate
CB - Circunferência braquial
CMB - Circunferência muscular do braço
CON - Grupo controle
Cp - Centpoises
CP - Circunferência do punho
CRP - C-reative protein
DH - Degree of hydrolysis
EAR - Necessidade média estimada

xxi
ELA - Esclerose lateral amiotrófica
FFM - Fat free mass
FVC - Forced vital capacity
GA - Appendicular group
GB - Bulbar group
IMC - Índice de massa corporal
MAC - Midarm circumference
MAMC - Midarm muscle circumference
MEP - Maximal expiratory pressure
MIP - Maximal inspiratory pressure
PCMS - Protein-calorie malnutrition score
PEmax - Pressão expiratória máxima
pI - Isoeletric point
PImax - Pressão inspiratória máxima
PS - Protein solubility
QFA - Questionário de freqüência alimentar
RDA - Recommended dietary allowances
SDS - Sodium dodecyl sulphate
SESF - Subscapular skinfolds
SF - Skinfolds
SISF - Supra-iliac skinfolds
SPL - Grupo suplementado
TMB - Taxa metabólica basal
TNBS - Trinitro-benzene sulphonic acid

xxii
TSF - Triciptal skinfolds
VET - Valor energético total
WAC - Water absortion capacity
WC - Wrist circumference
WPC - Whey protein concentrate
WPH - Whey protein hidrolysate
WPI - Whey protein isolate

xxiii
SUMÁRIO
INTRODUÇÃO GERAL....................................................................................... 1
REVISÃO BIBLIOGRÁFICA.............................................................................. 10
REFERÊNCIAS.................................................................................................... 36
ARTIGO I.............................................................................................................. 52
ARTIGO II............................................................................................................. 76
ARTIGO III........................................................................................................... 107
ARTIGO IV........................................................................................................... 124
CONCLUSÕES GERAIS...................................................................................... 145
APÊNDICES.......................................................................................................... 149

xxiv
ÍNDICE GERAL
1 INTRODUÇÃO GERAL......................................................................................... 1
2 REVISÃO BIBLIOGRÁFICA................................................................................. 10
2.1 Esclerose Lateral Amiotrófica (ELA)............................................................... 11
2.2 Ingestão alimentar em ELA.............................................................................. 13
2.3 Antropometria e composição corporal.............................................................. 15
2.4 Parâmetros bioquímicos.................................................................................... 21
2.5 Disfagia............................................................................................................. 23
2.6 Textura dos alimentos....................................................................................... 25
2.7 Complicações respiratórias............................................................................... 28
2.8 Avaliação funcional.......................................................................................... 29
2.9 Suporte nutricional............................................................................................ 30
2.9.1 Suplementação oral com proteínas do soro de leite...................................... 32
2.9.2 Vias alternativas de nutrição......................................................................... 34
2.10 Considerações finais........................................................................................... 35
3 REFERÊNCIAS....................................................................................................... 36
4 ARTIGO I: Avaliação da ingestão alimentar de indivíduos com Esclerose Lateral
Amiotrófica.....................................................................................................................
52
Resumo........................................................................................................................... 55
Abstract........................................................................................................................... 55
Resumen......................................................................................................................... 56
Introdução...................................................................................................................... 57
Métodos.......................................................................................................................... 58
Avaliação da ingestão alimentar................................................................................ 58
xxv
Avaliação da função da deglutição segundo a ALSFRS-R........................................
Análise Estatística..........................................................................................................
62
62
Resultados...................................................................................................................... 62
Discussão........................................................................................................................ 65
Conclusões...................................................................................................................... 70
Agradecimentos.............................................................................................................. 71
Referências Bibliográficas............................................................................................. 71
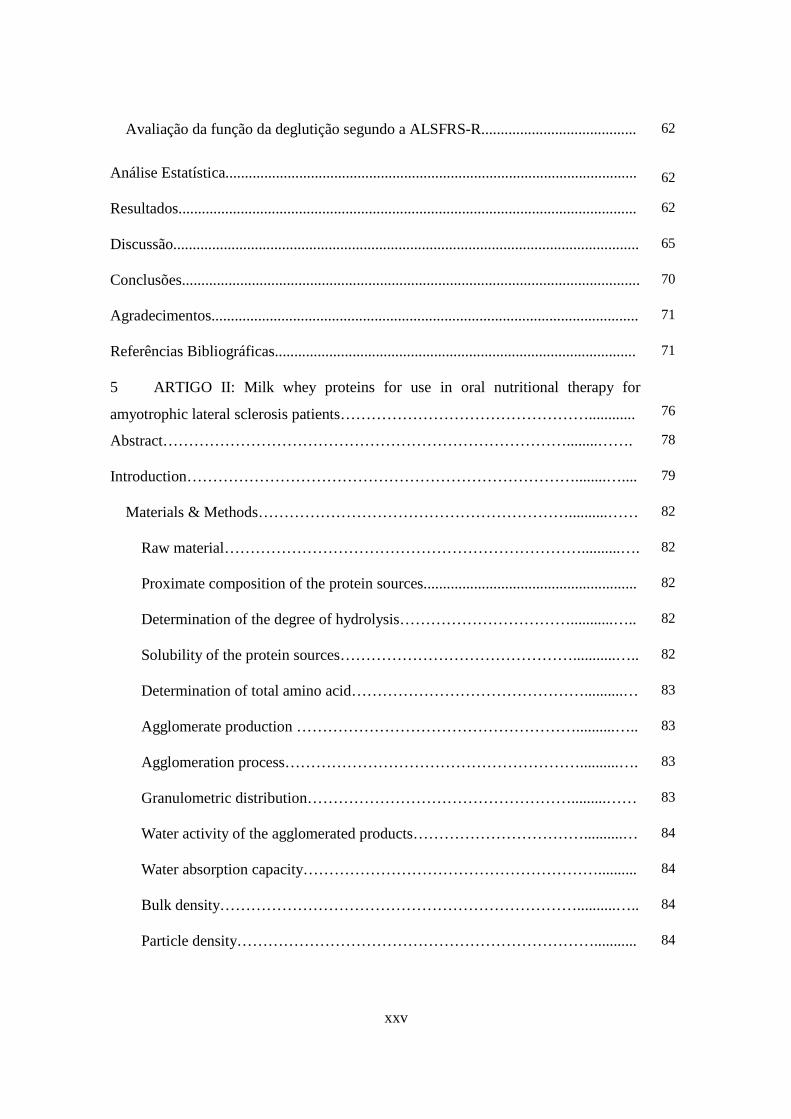
5 ARTIGO II: Milk whey proteins for use in oral nutritional therapy for
amyotrophic lateral sclerosis patients…………………………………………............
76
Abstract……………………………………………………………………........……. 78
Introduction…………………………………………………………………........….... 79
Materials & Methods……………………………………………………..........…… 82
Raw material……………………………………………………………..........…. 82
Proximate composition of the protein sources....................................................... 82
Determination of the degree of hydrolysis……………………………...........….. 82
Solubility of the protein sources………………………………………...........….. 82
Determination of total amino acid………………………………………..........… 83
Agglomerate production ………………………………………………..........….. 83
Agglomeration process…………………………………………………..........…. 83
Granulometric distribution…………………………………………….........…… 83
Water activity of the agglomerated products……………………………..........… 84
Water absorption capacity………………………………………………….......... 84
Bulk density……………………………………………………………..........….. 84
Particle density……………………………………………………………........... 84
xxvi
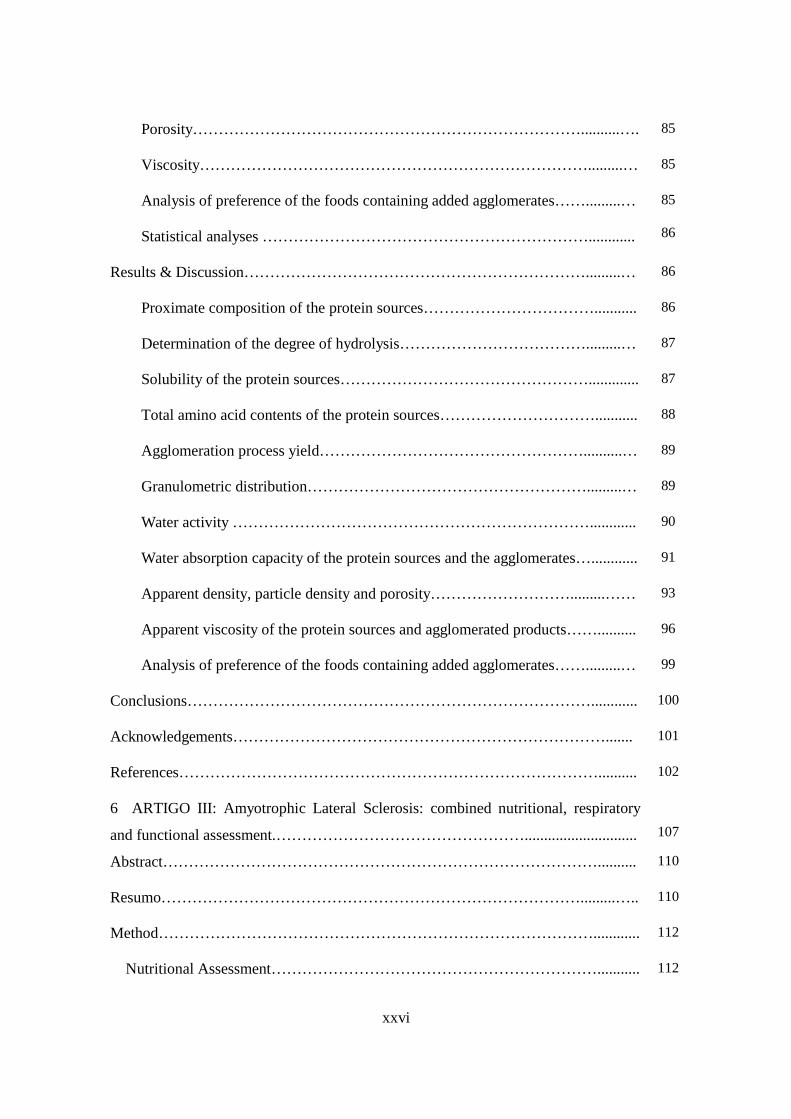
Porosity…………………………………………………………………..........…. 85
Viscosity………………………………………………………………….........… 85
Analysis of preference of the foods containing added agglomerates…….........…
Statistical analyses ………………………………………………………............
85
86
Results & Discussion………………………………………………………….........… 86
Proximate composition of the protein sources……………………………........... 86
Determination of the degree of hydrolysis……………………………….........… 87
Solubility of the protein sources…………………………………………............. 87
Total amino acid contents of the protein sources…………………………........... 88
Agglomeration process yield……………………………………………..........… 89
Granulometric distribution……………………………………………….........… 89
Water activity ……………………………………………………………............ 90
Water absorption capacity of the protein sources and the agglomerates…............ 91
Apparent density, particle density and porosity……………………….........…… 93
Apparent viscosity of the protein sources and agglomerated products…….......... 96
Analysis of preference of the foods containing added agglomerates…….........… 99
Conclusions……………………………………………………………………............ 100
Acknowledgements………………………………………………………………....... 101
References……………………………………………………………………….......... 102
6 ARTIGO III: Amyotrophic Lateral Sclerosis: combined nutritional, respiratory
and functional assessment.………………………………………….............................
107
Abstract………………………………………………………………………….......... 110
Resumo……………………………………………………………………….........….. 110
Method…………………………………………………………………………............ 112
Nutritional Assessment………………………………………………………........... 112

xxvii
Amyotrophic Lateral Sclerosis Functional Rating Scale, revised………….........…. 113
Respiratory Assessment……………………………………………………..........… 114
Statistical Analysis……………………………………………………………......... 114
Results……………………………………………………………………........……… 115
Discussion……………………………………………………………………….......... 117
Conclusions……………………………………………………………………........… 120
Acknowledgement……………………………………………………………….......... 121
References……………………………………………………………………….......... 121
7 ARTIGO IV: Oral supplementation with milk whey proteins improve nutritional
status of patients with amyotrophic lateral sclerosis………………….........................
124
Abstract………………………………………………………………………........….. 127
Methods………………………………………………………………………….......... 128
Inclusion criteria………………………………………………………………........ 129
Exclusion criteria……………………………………………………………........... 129
Nutritional intervention phase…………………………………………….........…... 129
Nutritional supplementation……………………………………….........………….. 129
Dietary evaluation..................................................................................................... 130
Nutritional evaluation................................................................................................ 131
Biochemistry evaluation............................................................................................ 132
Amyotrophic Lateral Sclerosis Functional Rating Scale Revised…………........…. 132
Statistical Analysis………………………………………..………………........….. 132
Results…………………………………………………………………………........… 133
Food intake……………………………………………………………………......... 133
Anthropometry…………………………………………………………….........….. 134
Biochemistry……………………………………………………………….........…. 136
xxviii
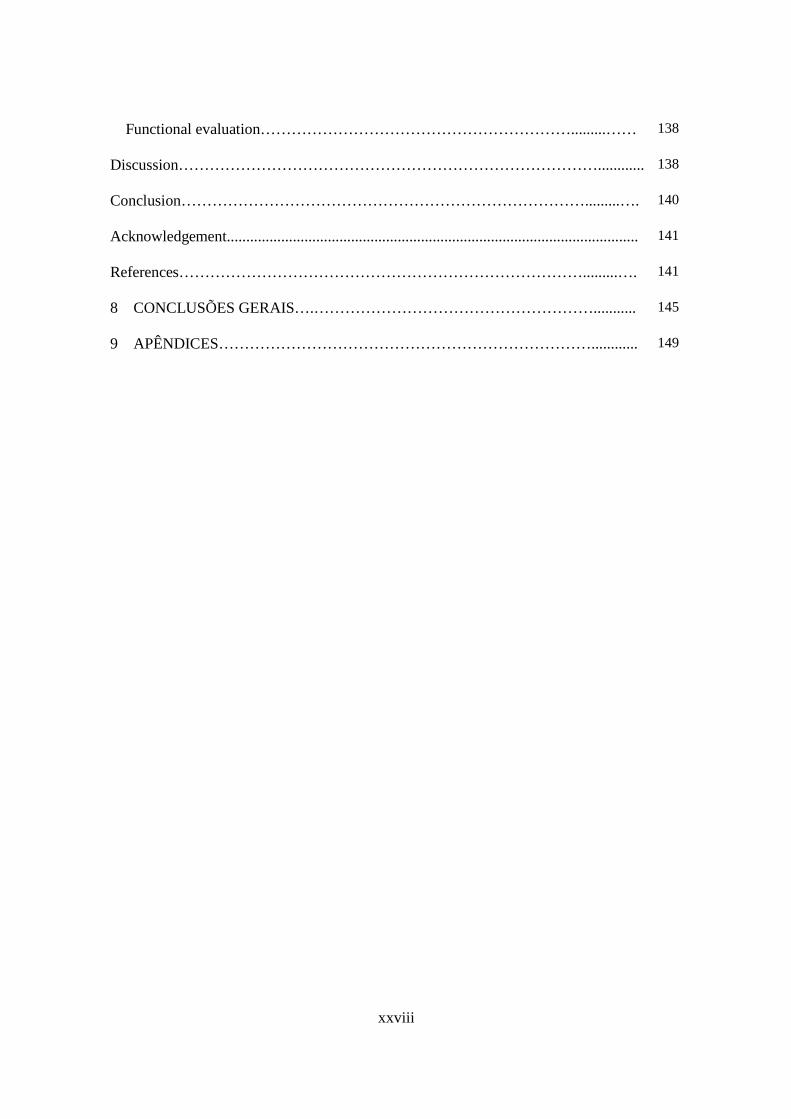
Functional evaluation…………………………………………………….........…… 138
Discussion………………………………………………………………………............ 138
Conclusion…………………………………………………………………….........…. 140
Acknowledgement.......................................................................................................... 141
References…………………………………………………………………….........…. 141
8 CONCLUSÕES GERAIS….………………………………………………........... 145
9 APÊNDICES………………………………………………………………............ 149

1
_________________________________________________Introdução Geral
1

2
1 INTRODUÇÃO GERAL
A esclerose lateral amiotrófica (ELA), conhecida nos Estados Unidos como Doença de
Lou Gehrig, e na França como doença de Charcot, caracteriza-se por paralisia progressiva
secundária ao comprometimento dos neurônios motores, neurônio motor superior e
neurônio motor inferior. Os sintomas e sinais mais comuns são atrofia e fraqueza muscular,
fasciculações, cãimbras, hipertonia e hiperreflexia. Nos estágios mais avançados, observa-
se diminuição da força muscular respiratória, perda progressiva de peso corporal e
alterações na ingestão alimentar (NELSON et al., 2000).
Vários fatores são inerentes à ingestão alimentar na ELA. Dentre eles: inapetência,
disfagia, fraqueza, dispnéia e depressão (STANICH et al., 2004; NELSON et al., 2000;
KASARSKIS et al., 1996; WELNETZ, 1990; SLOWIE et al., 1983).
Kasarskis et al. (1996) e Slowie et al. (1983) verificaram 70% dos indivíduos com
ingestão energética abaixo da recomendação diária adequada (RDA) e 84% dos pacientes
com ingestão acima para proteínas. Stanich et al. (2004) verificaram valores acima da RDA
para lipídios na maioria dos pacientes com ELA selecionados em seu estudo.
SILVA et al. (2007a e 2007b) analisaram o perfil nutricional dos pacientes
atendidos nos Ambulatórios de Disfagia e de Neuromuscular do Hospital das Clínicas da
Unicamp – HC/UNICAMP. Foram feitas avaliações interdisciplinares, nas quais os homens
apresentaram baixa ingestão calórica, de aproximadamente 1600 kcal. Entre as mulheres,
também foi observada baixa ingestão calórica, em torno de 1700 kcal/dia.
Pacientes com ELA geralmente apresentam rápida perda de peso associada à redução da
ingestão alimentar, aumento do tempo de alimentação, fadiga, desidratação e depressão
(WRIGHT et al., 2005). A associação destes fatores pode resultar em aumento do gasto
energético e conseqüentemente hipercatabolismo.

3
Diferentes estudos confirmam a correlação entre a redução do Índice de Massa Corporal
(IMC) e a diminuição da sobrevivência em indivíduos com ELA (KASARSKIS et al.,
1996; DESPORT et al., 2003; HEFFERNAN et al., 2004). Mazzini et al. (1995)
demonstraram 53% dos indivíduos com IMC abaixo de 20 kg/m2 e 55% com porcentagem
de perda de peso (%PP) maior que 15%. Desport et al. (1999) relataram a prevalência de
desnutrição em 16,3% dos indivíduos. Desport et al. (2001) mostraram declínio do IMC
com o curso natural da doença. Slowie et al. (1983) observaram correlação entre a
diminuição da ingestão alimentar e diminuição da dobra cutânea tricipital (DCT).
Em pacientes com ELA, a progressão do grau de disfagia é um dos fatores que
dificultam a manutenção da alimentação por via oral, aumentando as complicações
respiratórias, com início de ventilação invasiva, dificuldade de locomoção do paciente para
o atendimento ambulatorial e os quadros depressivos (MAZZINI et al., 1995).
Muitas complicações nutricionais que acontecem com o paciente com ELA,
geralmente se devem à baixa viscosidade da dieta. Os líquidos de baixa viscosidade
dificultam a deglutição de pacientes que apresentam controle laríngeo reduzido. Isso ocorre
porque estes líquidos são deglutidos rapidamente e não exercem sua forma dentro da
cavidade oral. Desse modo, parte do alimento líquido pode penetrar nas vias aéreas ainda
abertas, resultando em broncoaspiração e pneumonia aspirativa, agravando o estado
nutricional do paciente, e com a progressão, podem provocar desidratação. O espessamento
correto de alimentos pode minimizar tais intercorrências (SOUZA et al., 2003).
Neste contexto, visando a otimização do cuidado nutricional do paciente com disfagia, o
guia americano “National Dysphagia Diet (ADA): Standardization for Optimal Care”
estabeleceu padrões e limites de variação de viscosidades. Tais padrões e limites não
representam, necessariamente, as variações esperadas, mas servem como base para
discussões e análise da prescrição dietética. Estes valores são classificados em centipoise
4
(cP) em “ralo” (1-50 cP - água), “néctar” (51-350 cP – suco de manga), “mel” (351-1750
cP ) e “pudim” (> 1750 cP) (ADA, 2002).
Ingredientes como as proteínas do soro de leite, quando modificadas química e/ou
fisicamente e associadas a outros colóides podem alterar a viscosidade de sistemas. No
entanto, isoladamente, estas fontes não são capazes de atingir a viscosidade padronizada
pela ADA (2002) em fluidos, mas aglomeradas a fontes de carboidratos, como o amido
modificado, poderão promover aumento da viscosidade de sistemas alimentares para
valores próximos àqueles da ADA.
Além dos efeitos funcionais tecnológicos, as proteínas do soro apresentam atividade
imunomoduladora em indivíduos portadores do vírus HIV+ (MORENO, 2002; BOUNOUS
et al., 1993), atividade anticâncer (DIAS, 2004; McINTOSH; LE LEU, 2001; HAKKAK et
al., 1999; CHMIEL, 1998), atividade antiúlcera (MATSUMOTO, 2001) e proteção do
sistema cardiovascular (DA COSTA, 2004), dentre outras.
Tendo em vista a importância do conhecimento em relação aos hábitos alimentares
desta população para o aconselhamento dietético mais eficaz, bem como para elaboração de
orientações específicas, o presente trabalho teve como objetivo avaliar o consumo alimentar
(qualitativo e quantitativo) de indivíduos com diagnóstico de esclerose lateral amiotrófica.
Esta investigação deu origem ao primeiro artigo da Tese “Avaliação da ingestão alimentar
de indivíduos com Esclerose Lateral Amiotrófica”. A partir dos resultados obtidos do
estudo de ingestão alimentar, com verificação de dificuldade de manejo nutricional, o
presente trabalho teve como proposta adicional desenvolver um suplemento protéico, a base
de proteínas do soro de leite e amido modificado com capacidade espessante para terapia
nutricional de pacientes com ELA, dando origem ao segundo artigo desta Tese “Milk whey
proteins for use in oral nutritional therapy for amyotrophic lateral sclerosis patients”.

5
Para avaliação do efeito do produto desenvolvido em pacientes com ELA,
primeiramente foram verificadas as principais medidas para avaliação nutricional de
indivíduos com ELA, e então foram realizadas correlações entre os fatores nutricionais,
funcionais e parâmetros respiratórios dos indivíduos, o que deu origem ao terceiro artigo da
Tese “Amyotrophic Lateral Sclerosis: combined nutritional, respiratory and functional
assessment”.
Uma vez verificados e definidos os parâmetros utilizados na avaliação da evolução
nutricional, funcional e respiratória, prosseguiu-se a suplementação nutricional e avaliação
do efeito da suplementação nutricional com o aglomerado contendo 70% de isolado
protéico do soro de leite e 30% de amido modificado, no estado nutricional de indivíduos
com ELA, dando origem ao quarto artigo da Tese “Oral supplementation with milk whey
proteins improve nutritional status of patients with amyotrophic lateral sclerosis”.
A apresentação geral da Tese foi desenvolvida conforme a Norma da Comissão de Pós-
Graduação/FEA/UNICAMP para Teses em formato alternativo (ATO INTERNO
CPG/FEA Nº 004/2003). Conforme descrito, serão apresentados quatro Artigos Originais,
precedidos de Resumo e Introdução Geral, Revisão Bibliográfica sobre o tema em questão
e seguidos das Conclusões Gerais.
REFERÊNCIAS
ADA. 2002. National Dysphagia Diet: Standardization for Optimal Care. National
Dysphagia Diet Task Force. Chicago, IL: The American Dietetics Association. 47 p.
BOUNOUS, G.; BARUCHEL, S.; FALUTZ, J.; GOLD, P. Whey protein as a food
supplement in HIV-seropositive individuals. Clinical and Investigative Medicine,
Ottawa, v. 16, p. 204-209, 1993.

6
CHMIEL, K. F. Anti-tumor effects of dietary whey protein and its value for head and neck
cancer patients. In: International Dairy Federation: Proceedings of the 3rd International
Whey Conference1997; Chicago. Brussels, Belgium: International Dairy Federation; 1998.
p. 310-314.
DA COSTA, E. L. Efeito do processamento térmico e enzimático na obtenção de
hidrolisados do isolado protéico do soro de leite com atividade anti-hipertensiva.
Campinas: 2004. Tese (Doutor em Alimentos e Nutrição) – Faculdade de Engenharia de
Alimentos, Universidade Estadual de Campinas.
DESPORT, J. C.; PREUX, P. M.; BOUTELOUP-DEMANGE, C.; CLAVELOU, P.;
BEAUFRÈRE, B.; BONNET, C.; COURATIER, P. P. Validation of bioelectrical
impedance analysis in patients with amyotrophic lateral sclerosis. American Journal of
Clinical Nutrition , Houston, v.77, p. 1179-1185, 2003.
DESPORT, J. C.; PREUX, P. M.; MAGY, L.; BOIRIE, Y.; VALLAT, J. M.;
BEAUFRÈRE, B.; COURATIER, P. Factor correllted with hypermetabolism in patients
with amyotrophic lateral sclerosis. American of Journal Clinical Nutrition , New York,
v. 74, p. 328-334, 2001.
DESPORT, J. C.; PREUX, P. M.; TRUONG, T. C.; VALLAT, J. M.; SAUTEREAU, D.;
COURATIER, P. Nutritional status is a prognostics factor for survival in ALS patients.
Neurology, Minneapolis, v. 53, p. 1059-1063, 1999.
DIAS, N. F. G. P. Propriedades imunoestimulatórias e antitumoral de concentrados
protéicos do soro de leite bovino, de caseína e de um isolado protéico de soja.

7
Campinas: 2004. Tese (Doutor em Alimentos e Nutrição) – Faculdade de Engenharia de
Alimentos, Universidade Estadual de Campinas.
HAKKAK, R.; KOROURIAN, S.; RONIS, M.; IRBY, D.; KECHCLANA, S.;
ROWLAND. Dietary prevention of mammary cancer in multiparous female rats whey
protein, but nor soy protein isolate. Proceedings of the American Association for
Cancer Research, Chicago, v. 40, 2010, 1999.
HEFFERNAN, C.; JENKINSON, C.; HOLMES, T.; FEDER, G.; KUPFER, R.; LEIGH,
R.; MCGOWAN, P. N.; RIO, A.; SIDHU, P. S. Nutritional management in MND/ALS
patients: an evidence based review. Amyotrophic Lateral Sclerosis and Other Motor
Neuron Disorders, London, v. 5, p. 72-83, 2004.
KASARSKIS, E.; BERRYMAN, S.; VANDERLEEST, J. G.; SCHNEIDER, A. R.;
MCCLAIN, C. J. Nutritional status of patients with amyotrophic lateral sclerosis: relation
to the proximity of death. American Journal of Clinical Nutrition , New York, v. 63, p.
130-137, 1996.
MAZZINI, L.; CORRÁ, T.; ZACCALA, M.; MORA, G.; DEL PIANO, M.; GALANTE,
M. Percutaneous endoscopic gastrostomy and enteral nutrition in amyotrophic lateral
sclerosis. Journal of Neurology, New York, v. 242, p. 695-698, 1995.
MATSUMOTO, H.; SHIMOKAWA, Y.; USHIDA, Y.; TOIDA, T.; HAYASAWA, H.
New biological function of bovine alpha-lactalbumin: protective effect against ethanol and
stress-induced gastric mucosal injury in rats. Bioscience, Biotechnology and
Biochemistry, Tokyo, v. 65, p. 1104-1111, 2001.
8
McINTOSH, G. H.; LE LEU, R. K. The influence of dietary proteins on colon cancer risk.
Nutrition Research, Tarrytown, v. 21, p. 1053-1066, 2001.
MORENO, Y. M. F. Influência das proteínas de soro de leite bovino do estado
nutricional, composição corporal e sistema imune em coorte de crianças com
síndrome da imunodeficiência adquirida (AIDS). Campinas, SP, 2002. 145p.
Dissertação (Mestrado em Alimentos e Nutrição) Universidade de Campinas, 2002.
NELSON, L. M.; MATKIN, C.; LONGSTRETH, W. T, MCGUIRE, V. Population – based
case – control study of amyotrophic lateral sclerosis in Western Washington State. II. Diet.
American Journal of Epidemiology, Baltimore, v. 151, p. 164-173, 2000.
SILVA, L. B. C.; MOURÃO, L.; LIMA, N. M. F. V.; ALMEIDA, S. R. M.; FRANCA, M.
J.; NUCCI, A.; AMAYA-FARFAN, J. Amyotrophic lateral sclerosis: nutritional status
and functional conditions. Annual Dysphagia Research Society Meeting, Vancouver,
Canada, March 8-10, 2007a.
_____Amyotrophic Lateral Sclerosis (ALS): Nutritional pr ofile and swallowing ability
in patients with dysphagia. Annual Dysphagia Research Society Meeting, Vancouver,
Canada, March 8-10, 2007b.
SLOWIE, L. A.; PAIGE, M. S.; ANTEL, J. P. Nutritional considerations in the
management of patients with ALS amyotrophic lateral sclerosis. Journal of the American
Dietetic Association, Chicago, v. 83, p. 44-47, 1983.
SOUZA, B. B. A.; MARTINS, C.; CAMPOS, D. J.; BALSINI, I. D.; MEYER, L. R.
Nutrição e Disfagia: Guia para profissionais. Curitiba, PR, Brasil: Nutroclínica. 2003.

9
STANICH, P.; PEREIRA, A. M. L.; CHIAPPETA, A. L. M. L.; NUNES, M.; OLIVEIRA,
A. S. B.; GABBAI, A. A. Suplementação nutricional em pacientes com doença do neurônio
motor/esclerose lateral amiotrófica. Revista Brasileira de Nutrição Clínica, São Paulo, v.
19, p. 70-78, 2004.
WELNETZ, K. Maintaining adequate nutrition and hydration in the dysphagic ALS patient.
Journal of Continuing Education in Nursing, Thorofare, v. 21, p. 62-71, 1990.
WRIGHT, L.; COTTER, D.; HICKSON, M.; FROST, G. Comparison of energy and
protein intakes of older people consuming a texture modified diet with a normal hospital
diet. Journal of Human Nutrition and Dietetics, Oxford, v. 18, p. 213-219, 2005.

10
____________________________________________Revisão Bibliográfica
2

11
Esclerose Lateral Amiotrófica: Considerações nutricionais para avaliação e
acompanhamento da evolução clínica do paciente
2 REVISÃO BIBLIOGRÁFICA
2.1 Esclerose Lateral Amiotrófica
A esclerose lateral amiotrófica (ELA), caracteriza-se por paralisia progressiva
secundária ao comprometimento dos neurônios motores, neurônio motor superior e
neurônio motor inferior. Os sintomas e sinais mais comuns são atrofia e fraqueza muscular,
fasciculações, cãimbras, hipertonia e hiperreflexia (GIL et al., 2007; NELSON et al.,
2000).
“ Amiotrófico vem do grego: A significa não ou negativo; mio se refere ao músculo;
trófico nutrição. Amiotrófico significa sem nutrição muscular. Quando um músculo não é
nutrido, ele atrofia ou sofre emaciação. Lateral identifica as áreas da medula espinhal onde
se localizam partes das células nervosas que nutrem os músculos. A medida em que essa
área sofre degeneração, ocorre cicatrização ou endurecimento – esclerose – na região”
(BRADLEY, 2007).
A ELA é conhecida como doença de Charcot, em homenagem ao seu maior
estudioso, Jean-Martin Charcot que a descreveu pela primeira vez em 1869. Nos Estados
Unidos, a ELA é conhecida como Doença de Lou Gehrig, em homenagem ao famoso
jogador de beisebol falecido 1941 em decorrência da doença.
A ELA pode apresentar manifestações iniciais apendicular ou bulbar. Quando as
manifestações iniciais são apendiculares, a musculatura dos membros é acometida e os
sintomas começam em um ou vários membros ou em todos ao mesmo tempo. As

12
manifestações bulbares instalam-se após meses ou anos com a progressão da doença,
começando pela musculatura inervada por meio dos nervos bulbares, afetando a fala, a voz
e a deglutição. Na maioria dos casos, observa-se combinação das duas formas (BACH,
2004).
A incidência da ELA é de 0,4 a 2,4/100.000 indivíduos/ano (MITSUMOTO;
NORRIS, 1994). Na Europa, a incidência é de aproximadamente 1,8 a 2,2 casos/ 100.000
pessoas. No Brasil, a incidência é de 1,5 casos/100.000 pessoas, em média 2.500
pacientes/ano (DIETRICH-NETO et al., 2000).
A doença afeta, preferencialmente, indivíduos do sexo masculino em relação ao
sexo feminino, na proporção de 1,8:1. No Brasil, a idade média de início é 52 anos, sendo
48,5 anos para os homens e 53,1 anos para as mulheres. Mundialmente, a idade de início
ocorre entre 59 e 65 anos. Cerca de 4 a 6% dos casos ocorrem em pessoas com menos de 40
anos (DIETRICH-NETO et al., 2000).
A ELA apresenta um curso progressivo, com óbito ocorrendo, em média, 2 a 5 anos
após o início da doença (NORRIS; SHEPHERD; DENYS, 1993; LI; ALBERMAN;
SWASH, 1990). Alguns casos, cerca de 8 a 22% sobrevivem por aproximadamente 10
anos. O prognóstico tende a piorar em indivíduos com início bulbar, com idade avançada e
com predomínio de atrofia (WALLING, 1999; EISEN et al., 1993; MACKAY, 1963). A
maior causa de óbito é a insuficiência respiratória (com ou sem pneumonia), devido a
associação com disfagia e broncoaspiração (OLIVEIRA; GABBAI, 2001).
De acordo com o El Escorial, revisado em 1998, as formas de apresentação são
definidas pelos critérios: ELA esporádica, forma clássica, que ocorre isoladamente; ELA
familiar, presente em uma ou mais gerações e associada a diferentes padrões de herança e
mutações definidas, como a mutação no gene da enzima superóxido dismutase cobre/zinco
(SOD-1), no cromossomo 21 e deficiência de hexosaminidase A/B; Síndromes ELA plus,

13
caracterizada por manifestações clínicas de outras doenças neurológicas, como:
extrapiramidal (distonia, parkinsonismo), cerebelar (incoordenação motora), cortical
(demência), autonômico (hipotensão postural), sensitivo (hipoestesia, parestesia, ataxia
sensitiva) e ocular (paralisia dos movimentos oculares) (ROWLAND; SHENEIDER,
2001); ELA com anormalidades laboratoriais de significado incerto, com anormalidades
laboratoriais definidas, com significado indeterminado sobre a patogênese da ELA;
Síndromes que mimetizam a ELA, que ocorrem como conseqüência de outros processos
patogênicos que não os da ELA (síndrome pós-poliomielite e neuropatias motoras
multifocais com ou sem bloqueio de condução) (El Escorial revisado, 1998).
Nos estágios mais avançados da doença, observa-se diminuição da força muscular
respiratória, perda progressiva de peso corporal, e alterações na ingestão alimentar
(NELSON et al., 2000).
Vários fatores são inerentes à ingestão alimentar na ELA. Dentre eles: inapetência,
disfagia, fraqueza, dispnéia e depressão (STANICH et al., 2004; NELSON et al., 2000;
KASARSKIS et al., 1996; WELNETZ, 1990; SLOWIE et al., 1983). A associação desses
fatores pode resultar em comprometimento do estado nutricional e desnutrição.
2.2 Ingestão alimentar em ELA
Poucos estudos sobre ingestão alimentar em pacientes com ELA estão disponíveis
na literatura. Dentre eles destacam-se estudos de Kasarskis et al. (1996) que verificaram
70% dos indivíduos com ingestão energética abaixo da RDA e ingestão de proteínas acima
da RDA para 84% dos pacientes. Slowie et al. (1983) encontraram, assim como Kasarskis
et al. (1996), 70% de inadequação para energia utilizando o recordatório de 24 horas em

14
pacientes com ELA. Stanich et al. (2004), verificaram valores acima da RDA para lipídios
na maioria dos pacientes com ELA selecionados em seu estudo.
Silva et al. (2007a e 2007b) analisaram o perfil nutricional dos pacientes atendidos
nos Ambulatórios de Disfagia e de Neuromuscular do Hospital das Clínicas da Unicamp –
HC/UNICAMP. Foram feitas avaliações interdisciplinares, verificando-se nos homens,
baixa ingestão calórica, de aproximadamente 1600 kcal. Entre as mulheres, também foi
observada baixa ingestão calórica, em torno de 1700 kcal/dia.
Assim como na maioria das doenças neuromusculares, na ELA também podem ser
observadas alterações, que aumentam o catabolismo muscular, refletindo diretamente sobre
a síntese protéica e na excreção de minerais. Em estágios iniciais da doença, conforme
estudo realizado com 94 pacientes com ELA, não foram observados déficits de vitaminas
como E e C, mas com a evolução da doença, foram verificadas manifestações clínicas e
bioquímicas de carência (LUDOLPH, 2006).
Para se estimar a ingestão alimentar, alguns países da Europa e Canadá usam como
principais práticas o recordatório de 24 horas, registro alimentar de 3 dias e de 7 dias. Para
estimativa dos requerimentos de energia, os profissionais usaram as equações de Schofield
(1985) e Harris e Benedict (1919). Para estimar a adequação de macronutrientes os
pesquisadores usaram os padrões das Recommended Dietary Allowances (NCR, 1989),
Departament of Health (1991) e do Institute of Medicine (IOM, 2002; IOM, 2001; IOM
2000; IOM 1997).
No Brasil os poucos estudos realizados com estes indivíduos relatam a utilização
das RDAs para micronutrientes e para proteínas, as recomendações da Sociedade Brasileira
de Alimentação e Nutrição (SILVA et al., 2007a; STANICH et al., 2004). Para estimativa
dos requerimentos de energia, a equação mais usada foi a de Harris e Benedict (1919)
modificada por Long; Schaffel; Geiger (1979).

15
De acordo com Harris e Benedict:
Homens: TMB* = 66 + (13,7 x massa em kg) + (5 x altura em cm) – (6,8 x idade em anos)
Mulheres: TMB* = 655 + (9,6 x massa em kg) + (1,7 x altura em cm) – (4,7 x idade em anos)
*TMB = taxa metabólica basal
Modificado por Long; Schaffel; Geiger (1979):
VET* = TMB x fator de atividade x fator de injúria
*VET = valor energético total
Como fator de atividade, considera-se 1,2 para pacientes que não deambulavam e
1,3 para pacientes que deambulavam. Como fator de injúria, 1,1 para doenças crônicas
(LONG; SCHAFFEL; GEIGER, 1979). Considerando o gasto energético de 10 a 20%
acima para indivíduos com ELA (PIQUET, 2006), alguns profissionais também trabalham
com 35 kcal/kg de peso atual.
Em relação a ingestão hídrica, a estimativa de acordo com Thomas (2001), deve ser
de 30-35mL/kg considerando a idade.
2.3 Antropometria e composição corporal
Pode-se avaliar o estado nutricional através de métodos objetivos, tais como:
antropometria, composição corporal, parâmetros bioquímicos e consumo alimentar; ou
subjetivos, como o exame físico e a avaliação global subjetiva. A antropometria envolve a
obtenção de medidas do tamanho corporal, suas proporções e a relação com padrões que
reflitam o desenvolvimento dos indivíduos adultos. As medidas mais utilizadas são peso,
estatura, circunferências e dobras cutâneas (STANICH et al., 2004; KASARSKIS et al.,
1996; SLOWIE et al., 1983).

16
Peso (P)
Para pacientes que não deambulavam, na ausência de uma balança metabólica, o
peso é aferido com cadeira de rodas. Previamente à pesagem do paciente, as cadeiras são
pesadas e o valor descontado no momento da calibração da balança. Os pacientes que
deambulam, o peso corpóreo é aferido em pé em balanças tipo plataforma ou digital
(STANICH et al., 2004). O peso também pode ser aferido em balanças tipo cadeira,
disponíveis no mercado.
Altura (A)
A altura, para indivíduos que não deambulam, é aferida com o indivíduo sentado o
mais próximo possível da extremidade da cadeira, com o joelho esquerdo flexionado em
ângulo de 90º. O comprimento entre a superfície plantar e o joelho é medido com auxílio de
fita métrica. A altura é estimada segundo as equações propostas por Chumlea; Roche;
Steinbaugh (1985), onde:
Altura homens = [64,19-(0,04 x idade em anos)] + (2,02 x altura do joelho em cm)
Altura mulheres = [84,88-(0,24 x idade em anos ) + (1,83 x altura do joelho em cm)
Índice da massa corporal (IMC)
Usualmente, utiliza-se a relação entre massa corporal e altura como indicador de
Índice de Massa Corporal (IMC = massa croporal kg/altura m²).
Esse índice classifica-se em:
- IMC < 16 kg/m2: desnutrição grave
- 16 - 16,9 kg/m2: desnutrição moderada
- 17,0- 18,49 kg/m2: desnutrição leve
- 18,5 - 24,9 kg/m2: eutrófico

17
- 25,0 - 29,9 kg/m2: Sobrepeso
- 30,0 - 34,9 kg/m2: Obesidade grau I
- 35,0 - 39,9 kg/m2: Obesidade grau II
> 40 kg/m2: Obesidade grau III (Organización Mundial de La Salud, 1985)
Kasarskis et al. (1996) confirmam a correlação entre a redução do IMC e
diminuição da expectativa de vida. Em trabalhos realizados por Mazzini et al. (1995), 53%
dos pacientes com ELA apresentaram IMC <20Kg/m2 e 55% apresentaram perda de peso >
15% do peso usual.
Circunferência do braço (CB)
A circunferência do braço é aferida no braço não dominante estendido ao longo do
corpo, medida no ponto médio entre o processo acrômio e o olécrano, com fita métrica
plástica, flexível e inelástica (LOHMAN; ROCHE; MARTORELL, 1991). Desport; Maillot
(2002) utilizam a CB para cálculo da circunferência muscular do braço (CMB) e
acompanhamento do estado nutricional dos pacientes com ELA.
Dobras cutâneas
Dobra cutânea triciptal (DCT) = determinada paralelamente ao eixo longitudinal do braço,
na face posterior, sendo seu ponto exato de reparo a distância média entre a borda súpero-
lateral do acrômio e o olécrono.
Dobra cutânea bicipital (DCB) = determinada no sentido do eixo longitudinal no braço, na
sua face anterior, no ponto meso-umeral do bíceps.

18
Dobra cutânea subescapular (DCSE) = obtida obliquamente ao eixo longitudinal seguindo
a orientação dos arcos costais, sendo localizada a 2 cm do ângulo inferior da escápula.
Dobra cutânea suprailíaca (DCSI) = aferida afastando-se levemente o braço direito do
paciente para trás procurando não influenciar na obtenção da medida. Esta dobra é
individualizada no sentido oblíquo a 2 cm acima da crista ilíaca ântero-superior na altura da
linha axilar anterior.
Para avaliação da CB e dobras cutâneas, utiliza-se como padrão de referência o
trabalho de Frisancho (1981).
Classificação do estado nutricional
Segundo a Tabela de Distribuição em Percentis, calcula-se a percentagem de
adequação dos parâmetros supracitados, considerando-se o percentil 50 (P50) como padrão.
% adequação = valor parâmetro estudado/valor P50 x 100
Para a classificação do estado nutricional, utiliza-se os valores da Tabela 1.
Tabela 1. Classificação do estado nutricional segundo os parâmetros propostos por Blackburn;
Harvey (1982) e Blackburn; Thornton (1979).
Parâmetros Obesidade Sobrepeso Eutrofia DPC1 leve
DPC moderada
DPC grave
CB2
DCT3
≥ 120%
≥120%
120-110%
120-110%
110-90%
110-90%
90-80%
90-80%
80-70%
80-70%
≤ 70%
≤ 70%
1DPC: Desnutrição protéico-calórica; 2CB: Circunferência braquial; 3DCT: Dobra cutânea triciptal.
Para a determinação do estado nutricional os parâmetros antropométricos são
analisados em conjunto. Os valores obtidos segundo percentagem de adequação são

19
classificados pelo Escore de Desnutrição Protéico Calórico (DPC). O Escore de DPC
representa a soma de todos os parâmetros de avaliação nutricional em percentagem de
adequação dividido pelo número de parâmetros avaliados (BLACKBURN; HARVEY,
1982).
Escore DPC= % adq PI + % adq DCT + % adq CB + % adq CMB + % adq AMB
Números de parâmetros
% adq PI = % de adequação a partir do peso ideal
% adq DCT = % de adequação da dobra cutânea triciptal
% adq CB = % de adequação da circunferência braquial
% adq CMB = % de adequação da circunferência muscular do braço
% adq AMB = % de adequação da área muscular do braço
O valor obtido pelo escore de DPC permite classificar os pacientes em:
Eutrofia: > 100%
DPC leve: < 100% e > 80%
DPC moderada: < 80% e > 60%
DPC grave: < 60%
Porcentagem de perda de peso (%PP)
A porcentagem de alteração de peso usual ou porcentagem de perda de peso (%PP)
é determinada utilizando o peso usual e atual do paciente, conforme a seguinte equação:
A % PP é altamente reflexiva da extensão da doença. Pacientes com valores de % PP
acima de 10% são classificados como desnutridos e acima de 10% desnutrição grave
(MAHAN; ESCOTT-STUMP, 2005).
% PP = Peso Usual – Peso Atual Peso Usual
x 100

20
Bioimpedância elétrica
A análise de bioimpedância elétrica (BIA) é uma técnica não-invasiva que pode ser
usada para estimar a composição corporal. O método usa a corrente de baixa amperagem
(freqüência única ou múltipla) que passa entre dois eletrodos colocados na pele sob a
hipótese de que a resistência da corrente (impedância) varia de maneira inversamente
proporcional ao líquido presente nos tecidos e ao teor de eletrólitos. A BIA apresenta boa
correlação com a composição corporal feita com a diluição de isótopo, em condições
controladas (O'BRIEN; YOUNG; SAWKA, 2002).
Em ELA, em função das limitações e das dificuldades na avaliação nutricional, a
BIA tem sido uma boa ferramenta no diagnóstico nutricional. Trata-se de uma técnica fácil,
não invasiva onde obtem-se a massa livre de gordura e a massa de gordura, além da
estimativa do grau de hidratação. Em 2003, foi validada a equação para a BIA em pacientes
com ELA através de estudos transversais e longitudinais, sendo esta otimizada a 50 kHz
(DESPORT et al., 2003).
Radioabsorciometria de feixes duplos (DEXA)
A radioabsorciometria de feixes duplos (DEXA) é um método invasivo que vêm se
tornando uma medida popular na avaliação da composição corporal, em países
desenvolvidos (MADSEN; JENSEN; SORENSEN, 1997; TOTHILL et al., 1996; SNEAD;
BIRGE; KOHRT, 1993). Esse método permite a avaliação estrutural da composição
corporal, dividindo a massa corporal em três componentes básicos: tecido macio livre de
minerais e gordura, conteúdo mineral ósseo e gordura (LASKEY, 1996).
Alguns estudos mostram a utilização desta técnica em pacientes com ELA (TADAN
et al., 1998; NAU et al., 1995; KANDA et al., 1994), no entanto Desport et al. (2003)
ressalta que o equipamento é de alto custo, e que o fato do paciente permanecer na posição

21
horizontal com os braços estendidos ao longo do corpo por mais de 10 minutos pode ser um
problema para indivíduos com ELA.
2.4 Parâmetros bioquímicos
A escolha dos parâmetros laboratoriais está baseada naqueles exames que
demonstram as alterações bioquímicas mais rápidas e que permitam acompanhar a
evolução do estado nutricional do paciente.
Índice de Creatinina/Altura: relação entre a excreção de creatinina em 24 horas de um
paciente e a excreção esperada de creatinina em 24 horas de um adulto sadio normal.
Determina o grau de depleção da proteína somática do paciente. Índices de creatinina/altura
entre 60% e 80% refletem depleção moderada da proteína somática, e valores inferiores a
60% depleção grave (ESCOTT-STUMP, 2007).
Creatinina Plasmática Total: volume plasmático x creatinina plasmática total. Cada
miligrama de creatinina plasmática total corresponde a 0,88 ou 0,98 kg de músculo
esquelético (ESCOTT-STUMP, 2007).
Balanço Nitrogenado: relação entre a ingestão de nitrogênio em 24 horas e a excreção de
nitrogênio em 24 horas. O balanço nitrogenado é considerado positivo entre 4 e 6 g.
Valores inferiores – balanço nitrogenado negativo – podem predizer hipercatabolismo
(ESCOTT-STUMP, 2007).

22
Proteínas Totais: responsáveis pela pressão oncótica. Em indivíduos eutróficos, existe
equilíbrio entre albumina (4,0-5,8g%) e globulina (1,0-3,0g%). A relação entre essas deve
ser entre A/G=1,5-2,5 (ESCOTT-STUMP, 2007).
Albumina e Transferrina: Evidenciam estado de proteína visceral. A albumina (meia-vida
de 16 a 18 dias) pode ser correlacionada com mudanças na circunferência muscular do
braço. A transferrina (meia vida de 6 a 8 dias) é um bom indicador de síntese hepática
protéica (BLACKBURN; THORNTON, 1979).
Pré-Albumina: Observa-se diminuição dos níveis séricos desta proteína em infecções e
traumatismos. Meia-vida de 2 dias e valores normais 22,4mg% ± 7mg% (ESCOTT-
STUMP, 2007).
Proteína Ligadora de Retinol: Proteína específica para o transporte de vitamina A
alcoólica. Além de ser bom indicador de prova renal, em ELA, pode ser utilizada devido a
meia vida de 10 horas, refletindo alterações agudas de desnutrição protéica (ESCOTT-
STUMP, 2007).
Hemograma: Pedido rotineiro na prática clínica. Geralmente são avaliadados: Hemácias,
Hemoglobina, Hematócrito, Ferro Sérico, Capacidade Total de Transporte de Ferro (CTF) e
Ferritina.
Contagem Total de Linfócitos: Contagem total de leucócitos e o percentual de linfócitos. A
depressão na imunidade celular está relacionada ao aumento da morbidade e mortalidade
por doença infecciosa (BLACKBURN; THORNTON, 1979).

23
Em estudo realizado por Rio e Cawadias (2007), foram discutidas as principais
técnicas adotadas por nutricionistas de alguns centros de tratamento de ELA na Europa e do
Canadá, para avaliação nutricional de indivíduos com ELA. Os pesquisadores encontraram
somente 22% dos nutricionistas com experiência maior que 4 anos com ELA. Dentre os
métodos para avaliação nutricional mais utilizados estavam o peso, usado por 100% dos
profissionais, %PP (96%), IMC (83%) e circunferência braquial (9%). A impedância
bioelétrica, validada por Desport et al. em 2003, assim como a DEXA, não foram relatadas
pelos profissionais dos centros investigados por Rio e Cawadias.
Verificando as medidas adotadas pela literatura pertinente, assim como em outras
doenças, em ELA pode-se notar a utilização de parâmetros como o peso, %PP e IMC, além
das dobras cutâneas, BIA, DEXA e calorimetria indireta. Dos parâmetros bioquímicos,
foram relatados albumina e creatinina (RIO; CAWADIAS 2007; DESPORT et al., 2003;
DESPORT et al., 2001; SILANI; KASARKIS, YANAGISAWA, 1998).
2.5 Disfagia
Com a evolução clínica da ELA, são comuns manifestações como disartria
(alteração da fala), dispnéia (alteração respiratória), disfonia (alteração da voz) e disfagia
(alteração da deglutição). Essas manifestações ocorrem em função da progressiva disfunção
da musculatura respiratória, ocasionada pela degeneração dos neurônios motores do trato
corticobulbar (CHIAPPETTA; ODA, 2004).
Em 17 a 30% dos pacientes com ELA, os músculos bulbares, principalmente os
grupos musculares do véu do palato e língua são os primeiros afetados, resultando em
24
disfagia progressiva, e conseqüentemente dificuldade na ingestão de alimentos e líquidos
(CALIA; ANNES, 2003; MITSUMOTO; NORRIS, 1994; GUBBAY et al., 1985).
A fraqueza orolaringofaríngea afeta a sobrevida de indivíduos com ELA,
principalmente, pelo risco contínuo de pneumonia aspirativa e sepsis e, pela ingestão
alimentar inadequada podendo resultar em desnutrição (KARSARKIS et al., 1996).
A desnutrição decorrente de disfagia, ou de outros fatores associados como atrofia
muscular e da fraqueza diafragmática aumenta o risco relativo ao óbito em quase oito vezes
em pacientes com ELA (MITSUMOTO et al., 2003; DESPORT et al., 1999).
O envolvimento da musculatura da língua e orbicular dos lábios, com a evolução da
ELA, desencadeia diminuição da onda pressórica, da peristalse faríngea, da elevação e
anteriorização da laringe, ocasionando engasgos, mesmo com saliva (WATTS;
VANRYCKEGHEM, 2001; STRAND et al., 1996).
Na ELA, a disfagia para líquidos é mais comum que para sólidos. O escape precoce,
ou seja, quando o alimento chega a valécula antes do início da deglutição faríngea, é mais
freqüente com líquidos ralos e a maior causa de aspiração traqueal. Resíduos faríngeos são
mais comumente observados no decorrer da doença. As consistências pastosa e sólida
podem causar penetração laríngea e aspiração traqueal após a deglutição. As alterações da
deglutição ocorrem devido à influência do trânsito oral, redução da movimentação da base
de língua, redução da elevação e anteriorização da laringe e da contração faríngea
(CHIAPPETTA; ODA, 2004; LOGEMAN, 1998; CAMPBEL; ENDERBY, 1984; apud
CHIAPPETTA, 2005).
Para minimizar intercorrências respiratórias e nutricionais no tratamento da disfagia,
a avaliação interdisciplinar é extremamente importante, sendo a modificação da textura dos
alimentos uma alternativa para a manutenção da via oral.
25
2.6 Textura dos alimentos
A textura é a soma das sensações cinestésicas, derivadas da degustação de um
alimento. Isso engloba todas as sensações percebidas na cavidade oral. Ou seja, textura é a
relação do alimento frente à aplicação de forças (CAMPOS, 1989). Esta, por sua vez, está
relacionada às propriedades físicas percebidas pelos olhos antes de consumir o alimento,
pelo sentido do tato no manuseio, pelos receptores da boca durante o consumo e pela
audição durante a mastigação. Existem, pelo menos, sete características de textura
importantes (WRIGHT et al., 2005; TYMCHUCK, 1999), conforme citadas a seguir:
Firmeza ou dureza: é a força requerida para a compressão de um alimento pastoso
(pudim ou banana entre a língua e o palato).
Elasticidade: é o grau em que o alimento retorna à forma original depois de ser
comprimido (marshmallow).
Fraturabilidade: é a força que causa a quebra de um alimento sólido pela ação de
duas forças opostas (morder uma cenoura).
Mastigabilidade/Dureza: á a força necessária para deformar alimentos sólidos
(mastigação de uma salsicha um pouco antes de iniciar a sua quebra).
Adesividade: é a atração entre a superfície do alimento e outra (a força necessária
para remover a pasta de amendoim aderida ao palato).
Coesão: é o grau em que o alimento se deforma quando é comprimido. (quando uma
papa de bolacha é comprimida entre a língua e o palato).
Viscosidade: é a taxa de fluxo por unidade de força (taxa na qual um iogurte é
drenado pela sucção através de um canudo).
A viscosidade do alimento é uma das variáveis mais importantes da deglutição. Os
líquidos ralos dificultam a deglutição de pacientes que apresentam controle laríngeo

26
reduzido. Isso ocorre porque os líquidos ralos são deglutidos rapidamente e não mantêm
sua forma dentro da cavidade oral. Desse modo, parte do alimento líquido pode escorrer
prematuramente para a faringe e, assim, penetrar nas vias aéreas ainda abertas. Ou seja,
antes que a deglutição tenha efetivamente ocorrido. Para evitar esse efeito, deve ser
determinada a viscosidade ideal para a deglutição ocorrer de maneira segura (SOUZA et
al., 2003).
É importante entender a definição de viscosidade porque esta influencia muitos
aspectos da avaliação e manejo da disfagia. A viscosidade pode ser definida como
resistência do líquido ao fluxo e é medida em centpoises (ctps ou cP). A água é um
exemplo de líquido ralo, cuja viscosidade é de, aproximadamente, 1 cP à temperatura de 25
ºC (MILLS, 1999).
Existem diferentes tipos de viscosidade, que podem ser facilmente alcançadas
utilizando espessantes comerciais. Estes tipos podem ser classificados em valores de
centipoise (cP) (Tabela 2) em ralo (1-50 cP), néctar (51-350 cP), mel (351-1750 cP) e
pudim (> 1750 cP) (ADA, 2002).
Tabela 2. Classificação da viscosidade, em valores de centipoise (cP), de acordo com a ADA
(2002) para o cuidado nutricional de indivíduos com disfagia.
Classificação Viscosidade (cP)
Ralo 1-50
Néctar 51-350
Mel 351-1750
Pudim > 1750
Fonte: ADA, 2002
No Quadro 1 está apresentado um exemplo de uma dieta modificada com restrição a
“líquido ralo” (1-50 cP) e sólido para indivíduos com ELA e comprometimento da
deglutição.

27
Quadro 1. Dieta modificada com restrição a “líquido ralo” (1-50 cP) e “sólidos” para indivíduos
com ELA e comprometimento da deglutição. Características: Alimentos macios, úmidos e todos
liquidificados. Os alimentos líquidos são todos espessados. O exemplo de cardápio contém
aproximadamente 2.000 quilocalorias.
Refeição Alimento Ingredientes (Porções) Viscosidade
(cP)
Café da manhã: Mingau de farinha Láctea
Banana amassada
Leite: 100 mL
Farinha Láctea: 25 g
1 unidade – 90 g
910
2.900
Lanche: Suco mamão espessado Água: 30 mL
Mamão: 170 g
870
Almoço:
Sopa de legumes com carne
(liquidificada)
Suco de laranja espessado
Água (600 mL), carne (75 g),
abobrinha (30 g), chuchu (30 g),
beterraba (50 g), cenoura (30 g),
batata (30 g), arroz cru (50 g)
Suco de laranja: 200 mL
Espessante: 10 g
3.520
320
Lanche: Vitamina de frutas (mamão,
banana e maçã)
Leite fluido resfriado (10º)
(200 mL), mamão (100 g), banana
(90 g), maçã (50 g)
1.090
Jantar: Canja de galinha
Mousse de maracujá
Água (600 ml), frango (75 g), arroz
cru (50 g), mandioquinha (120 g),
cenoura (30 g)
100 g
4.680
3.790
Ceia: Mingau de milho
Leite: 100 mL
Farelo de Milho: 25 g
840
* Adaptado de Peres et al. (2006).

28
2.7 Complicações respiratórias
A função muscular respiratória passa a ser afetada com o enfraquecimento dos
músculos respiratórios, o que leva à hipoventilação, hipercapnia, dispnéia, infecções
pulmonares e insuficiência respiratória (OLIVEIRA; GABBAI, 2001; HAYASHI, 2000;
KAPLAN; HOLLANDER, 1994; SCHIFFMAN; BELSH, 1993).
A insuficiência respiratória pode desenvolver-se tanto como conseqüência natural
da evolução da doença ou pode ser aguda, pela precipitação de infecção pulmonar ou
pneumonia aspirativa (KAPLAN; HOLLANDER, 1994).
A avaliação precoce da função pulmonar e das pressões respiratórias máximas deve
ser realizada assim que o diagnóstico de ELA for confirmado, uma vez que o
comprometimento respiratório é o fator limitante para sobrevida do indivíduo com ELA. A
avaliação respiratória tem como objetivo estabelecer a presença ou a ausência do
comprometimento respiratório, sua gravidade, proporcionar dados para comparações
futuras e planejamento terapêutico (SHIFFMAN; BELSH, 1993).
A avaliação clínica da capacidade vital (CV) permite a obtenção de dados tanto da
função muscular quanto pulmonar e acompanhar a gravidade do comprometimento
respiratório. O declínio progressivo da capacidade vital ao longo da doença deve-se à
fraqueza muscular respiratória e à complacência pulmonar reduzidas, em parte devido à
micro atelectasias ou a restrição do movimento da caixa torácica (TIDWELL, 1993;
HOWARD; WILES; LOH, 1989). A CV em torno de 50% do previsto está associada a
sintomas respiratórios, mas valores abaixo de 20 a 30% do previsto podem ser preditivos de
falência respiratória e óbito (HARDIMAN, 2000; MILLER et al., 1999).
Black e Hyatt (1969), descreveram casos de pacientes com ELA com sintomas de
dispnéia, com CV, fluxo expiratório máximo e ventilação voluntária máxima próximos do

29
normal, mas com significante decréscimo na pressão inspiratória máxima (PImáx) e pressão
expiratória máxima (PEmáx) que estavam reduzidas em média 34% e 47% do previsto. Com
base em seus dados, propuseram a relação entre o grau de dispnéia e o grau de fraqueza
muscular respiratória obtido pela mensuração da PImáx, e PEmáx, especialmente quando
outros resultados como teste de função pulmonar, encontram-se normais.
Shiffman e Belsh (1993) estudaram 36 pacientes com diagnóstico de ELA com o
objetivo de determinar o grau de prejuízo muscular respiratório e a subseqüente taxa de
declínio da função respiratória desses pacientes. Constataram que, embora 81% não
relatassem sintomas respiratórios, 86% apresentaram evidência de alguma fraqueza
muscular respiratória determinada pela redução na CV, na PImáx e PEmáx.
2.8 Avaliação funcional
O instrumento de medida Amyotrophic Lateral Sclerosis Functional Rating Scale
(ALSFRS) foi elaborado para avaliar a função das atividades de vida diária na ELA e
detectar melhora ou declínio da função após um período de estudo (JACKSON;
ROSENFELD, 2002). A ALSFRS é derivada do instrumento Amyotrophic Lateral
Sclerosis Severity Scale e da Unified Parkinson Rating Scale (COURATIER; TORNY;
LACOSTE, 2006). Trata-se de uma escala validada e de uso internacional que avalia a
função física, comprometimentos bulbares, apendiculares e respiratórios na ELA
(COURATIER; TORNY; LACOSTE, 2006; DE GROOT et al., 2006; JACKSON;
ROSENFELD, 2002; CEDARBAUM et al., 1999). É um instrumento utilizado em estudos
longitudinais bem como na prática clínica, pois se correlaciona com outras medidas de
progressão da ELA (força muscular e capacidade vital forçada) e níveis de incapacidade da
ELA (ALS CNFT Treatment Study, 1996). Os componentes da escala se agrupam em
30
quatro domínios: função bulbar, função motora fina, função motora grossa e função
respiratória.
Cedarbaum et al. (1999), assinalou que na ALSFRS os componentes da escala não
estavam equitativamente divididos, pois havia três itens para as funções motora grossa, fina
e bulbar e apenas um item para a função respiratória. Desta forma, a escala foi revisada em
1999 e passou a conter 12 itens (ALSFRS-R): fala, deglutição, salivação, escrita,
alimentação (uma subdivisão foi realizada para pacientes com ou sem gastrostomia),
vestir/higiene, transferência na cama/ajuste lençóis, andar, subir escadas, dispnéia,
ortopnéia e insuficiência respiratória. Cada item é pontuado em 5 níveis: 0 para incapaz e 4
para normal; então variando de 0 a 40, sendo que o escore menor representa pior estado
clínico.
A adição dos itens ortopnéia e insuficiência respiratória resultou em uma escala
mais sensível às mudanças e com melhor capacidade de predizer a sobrevivência que a
original ALSFRS (CEDARBAUM et al., 1999). A ALSFRS-R é uma escala simples, de
fácil e rápida aplicação (até 10 minutos), podendo ser administrada pelo médico,
enfermeiro, fisioterapeuta ou profissional de saúde treinado e familiarizado com o
instrumento (JACKSON; ROSENFELD, 2002).
2.9 Suporte nutricional
O suporte nutricional pode retardar a perda de peso e a atrofia muscular. Pesquisas
têm demonstrado que a perda de peso corporal associada às alterações bulbares (disfagia e
respiração) requer suporte nutricional precoce e específico (KASARSKIS et al., 1996;
SLOWIE et al., 1983).

31
A constante atrofia muscular, característica das doenças progressivas pode mascarar
o aumento da demanda metabólica. Uma vez que as energias estão canalizadas para a
manutenção da ventilação pulmonar, justifica-se o aumento do gasto energético basal dos
pacientes com ELA (STANICH et al., 2004; KASARSKIS et al., 1996; NAU et al., 1995;
SHIMIZU; HAYASHI; TANABE, 1991).
Em um estudo com pacientes com ELA, sob programa de suplementação nutricional
oral, verificou-se diminuição progressiva do índice de massa corporal (IMC) nos pacientes
com paralisia bulbar progressiva e preservação dessas variáveis nos pacientes com ELA. A
relação massa magra/massa gorda manteve-se durante o estudo para ambos os grupos. A
classificação do estado nutricional não se modificou para 70% dos pacientes. Os resultados
demonstraram que a suplementação preveniu a piora do estado nutricional, mas não foi
capaz de corrigir as médias globais de adequação (STANICH et al., 2004).
É comum na prática clínica a utilização de suplementos de vitaminas,
principalmente de vitamina E. Sugere-se que a suplementação desta vitamina, cuja
quantidade ainda não definida, possa melhorar o perfil nutricional de indivíduos com ELA
(BORASIO; VOLTZ, 1997). A suplementação oral com creatina monoidratada na
concentração de 3g/dia não demonstrou melhora do estado nutricional em ELA. No
entanto, a suplementação energética e protéica é utilizada por grande parte dos
profissionais, e mostrou ser eficiente no estado nutricional de indivíduos com ELA (RIO;
CAWADIAS, 2007; HEFFERNAN et al., 2004).

32
2.9.1 Suplementação oral com proteínas do soro de leite
O leite é constituído por água (87,3%), lactose (4,6%), gordura (3,9%), proteínas
(3,2%), substâncias minerais (0,65%) e ácidos orgânicos (0,2%). Dentre as proteínas, as
caseínas representam 80% e as proteínas do soro de leite, 20%.
O soro do leite (Tabela 3) é composto pelas frações α-lactoalbumina (α-La), β-
lactoglobulina (β-Lg), lactoferrina, lactoperoxidase, imunoglobulinas e
glicomacropeptídeos (KINSELLA; WHITEHEAD, 1989).
Tabela 3. Porcentagem de proteínas no leite bovino em base úmida.
Composição %
Caseínas 80
Proteínas do soro 20
α-lactoalbumina 50-55
β-lactoglobulina 20-25
Albumina do soro bovino 5-10
Imunoglobulinas 10-15
Lactoferrina 1-2
Lactoperoxidase 0,5
Glicomacropeptídeo 10-15
Fonte: USDA National Nutrient Database for Standard Reference, Release 16 (2003).
A qualidade das proteínas do soro de leite vem sendo observada desde 1978 por
Bounous e Kongshavn (1988), a partir de pesquisas realizadas para analisar os efeitos de
diferentes proteínas alimentares no sistema imune de animais, quando se verificou que o
33
isolado protéico do soro de leite contém altas quantidades dos aminoácidos cistina e
glutamilcisteína que são precursores da glutationa (GSH), e que a mistura dessas proteínas
desempenha papel importante na manutenção dos níveis celulares de GSH, necessários
para garantir uma resposta imune eficiente. As proteínas do soro apresentaram ações
fisiológicas específicas, estando associadas a vários efeitos biológicos observados em
estudos com animais e humanos, que variam desde atividade anticâncer, melhora na função
digestiva, melhora do desempenho físico, além de modulação do sistema imune
(PACHECO et al., 2006; TASSI; AMAYA-FARFÁN; AZEVEDO, 1998; McINTOSH;
ROGESTER, 1998; BRINK, 1996).
Em estudo com crianças infectadas pelo vírus da imunodeficiência adquirida (HIV-
I) e suplementadas com proteínas do soro de leite por 6 meses, foi observado, aumento da
GSH nos linfócitos (BARUCHEL et al., 1998). Em outro estudo, realizado no HC-
UNICAMP, a suplementação nutricional em crianças HIV+, com concentrado protéico do
soro de leite (WPC) rico em cisteína, aumentou os níveis de GSH nos eritrócitos, sugerindo
melhora na relação entre os linfócitos T CD4+/CD8+ (MORENO, 2002). Em adultos
infectados pelo HIV-I com suplementação alimentar semelhante, apresentou aumento dos
níveis de GSH plasmática e de células mononucleadas (MICKE et al., 2001; BOUNOUS et
al., 1993).
Bounous e Molson (2003) demonstraram que o WPC e o hidrolisado do soro do
leite (WPH) são boas fontes de cisteína, aminoácido limitante para síntese intracelular de
GSH durante a resposta imune. A glutationa (GSH- γ-glutamilcisteinilglicina) é o tiol livre
mais abundante nas células humanas; desempenha função importante como antioxidante de
lipídios, proteínas e alguns materiais genéticos (LU, 1999; ANDERSON, 1998; SEN,
1997), participando em diversos processos biológicos como remoção de hidroperóxidos,

34
proteção contra efeitos de radiações ionizantes, manutenção das ligações sulfidrila das
proteínas e modulação da atividade de enzimas pela mudança nas ligações dissulfeto
(AKERBOON; SIES, 1981), e ainda é um modo de armazenamento de cisteína; participa
do metabolismo de prostaglandinas, linfócitos bem como na funcionalidade do sistema
imunológico e proliferação celular (BRODY, 1994).
Tendo em vista as propriedades funcionais fisiológicas e tecnológicas das proteínas
do soro de leite, associado a todas as peculiaridades e complicações clínicas dos pacientes
com ELA, principalmente àqueles com comprometimento bulbar, sugere-se a utilização
destas fontes protéicas como coadjuvante no tratamento da disfagia, no estado nutricional e
consequentemente na evolução da ELA.
2.9.2 Vias alternativas de alimentação em ELA
Diferentes autores relatam a necessidade de via alternativa de nutrição a partir dos
seguintes critérios: capacidade vital em torno de 50% do predito, presença de disfagia
moderada a grave e diminuição de 10% do peso corpóreo nos últimos três meses.
(STANICH et al., 2004; MITSUMOTO et al., 2003; ALBERT et al., 2001; SILANI;
KASARSKIS; YANAGISAWA, 1998; LISBETH et al., 1994).
A gastrostomia endoscópica percutânea (GEP) representa uma opção no tratamento
sintomático do paciente com ELA (MILLER et al., 1999).
Ao comparar a utilização de nutrição enteral via sonda nasogástrica e gastrostomia
endoscópia percutânea (GEP) em pacientes com ELA, observa-se diferença significativa no
índice de massa corporal (IMC) dos pacientes com GEP em relação aos com sonda
nasogástrica, além da melhor aceitação social e, consequentemente, da qualidade de vida

35
dos pacientes estudados, justificando a utilização desta técnica quando a ingestão via oral
não for segura (MAZZINI et al., 1995).
2.10 Considerações finais
Esta Revisão Bibliográfica foi realizada para fundamentar a hipótese da Tese e
reúne informações científicas que catalogam as principais práticas para avaliação, com
enfoque nutricional, em indivíduos com ELA. A literatura pertinente e disponível para
consulta é limitada. Trabalhos sobre a ingestão alimentar, técnicas específicas de avaliação
do estado nutricional bem como do uso de suplementos são escassos.

36
________________________________________________________Referências
3

37
3. REFERÊNCIAS
ADA. 2002. National Dysphagia Diet: Standardization for Optimal Care. National
Dysphagia Diet Task Force. Chicago, IL: The American Dietetics Association. 47 p.
AKERBOON, T. P. M.; SIES, H. Assay of glutathione , glutathione disulfide, and
glutathione mixed disulfides in biological samples. Methods in Enzymology, New York,
v. 77, p. 373-382, 1981.
ALBERT, S. M.; MURPHY, P. L.; DEL BENE, M.; ROWLAND, L. P.; MITSUMOTO,
H. Incidence and predictors of GEP placement in ALS/MND. Journal of Neurological
Sciences, v.191, p. 115-119, 2001.
ALS CNTF Treatment Study (ACTS) Study Group. A double-blind placebo-controlled
clinical trial of subcutaneous recombinant human ciliary neurotrophic factor (rHCNTF) in
amyotrophic lateral sclerosis. Neurology, Minneapolis, v. 46, p. 1224-1249, 1996.
ANDERSON, M. E. Glutathione: an overview of biosynthesis and modulation. Chemical
and Biological Interactions, v.111, p.1-14, 1998.
BACH, J. R. Guia de exame e tratamento das doenças neuromusculares. São Paulo:
Santos editora Ltda, 2004. 166 p.
BARUCHEL, S.; BOUNOUS, G.; OLIVIER, R.; VIAU, G.; WAINBERG, M. A.
Nutriceutical Modulation of Glutathione with a Humanized Native milk Serum Protein
Isolate, ImmunocalTM: Application in AIDS and cancer. p. 447-461. In: MONTAGNIER,
L.; OLIVIER, R.; PASQUIER, C. Oxidative Stress in Cancer, AIDS, and
Neurodegenerative Disease, New York: Marcel Dekker, 1998. 558 p.

38
BLACK, L. F.; HYATT, R. E. Maximal respiratory pressures: normal values and
relationship to age and sex. American Review of Respiratory Disease, New York, v.
99, p. 696–702, 1969.
BLACKBURN, G. L.; HAVEY, K. B. Nutritional assessment as a routine in clinical
medicine. Postgraduate Medicine, New York, v. 71, p. 46-63, 1982.
BLACKBURN, G. L.; THORRNTON, P. A. Nutrition assessment of the hospitalized
patient. Medicine Clinical Nutrition of American , v. 63, p. 1103-1115, 1979.
BORASIO, G. D.; VOLTZ, R. Palliative care in amyotrophic lateral sclerosis. Journal of
Neurology, New York, v. 244, p.S11-S7, 1997. Supl. 4.
BOUNOUS, G.; BARUCHEL, S.; FALUTZ, J.; GOLD, P. Whey protein as a food
supplement in HIV-seropositive individuals. Clinical and Investigative Medicine,
Ottawa, v. 16, p. 204-209, 1993.
BOUNOUS, G.; KONGSHAVN, P. A. L.; GOLD, P. The Immunoenhancing Property of
Dietary Whey Protein Concentrate. Clinical and Investigate Medicine, Ottawa, v. 11,
n. 4, p. 271-278, 1988.
BOUNOUS, G.; MOLSON, J.H. The antioxidant system. Anticancer Research, Ulrich,
v. 23, p. 1411-1415, 2003.
BRADLEY, W. Esclerose Lateral Amiotrófica. Disponível em
<http://www.tudosobreela.com.br/relacoes/entrevistas02.shtml?sessao=entrevistas> [2007
Jun 30].
39
BRINK, W. The life extension protein: that fights disease and extends lifespan. Life
Extention Report, Life Extention Foundation, Scottsdale, v.1, p. 21-28, 1996.
BRODY, T. Inorganic nutrients. In BRODY, T. Ed. Nutritional Biochemistry, San
Diego: Academic Press, 1994, p.485-642.
CALIA, L. C.; ANNES, M. Afecções neurológicas periféricas. In: LEVY, J. A.;
OLIVEIRA, A. S. B. Ed. Reabilitação em doenças neurológicas – guia terapêutico
prático. São Paulo: Atheneu, 2003. p. 31-64.
CAMPBELL, M. J.; ENDERBY, P. Management of motor neurone disease. Journal of
the Neurological Sciences. Amsterdam, v. 64, p. 65–71, 1984.
CAMPOS, S. D. S. Textura de alimentos. In CAMPOS, S. D. S (Ed). Reologia e textura
dos alimentos. Campinas: ITAL, 1989. p.15..
CEDARBAUM, J. M.; STAMBLER, N.; MALTA, E.; FULLER, C.; HILT, D.
THURMOND, B. The ALSFRS-R: a revised ALS functional rating scale that incorporates
assessments of respiratory function. BDNF ALS Study Group (Phase III). Journal of the
Neurological Science, Detroit, v. 169, p. 13-21, 1999.
CHIAPPETTA, A. L. M. L. Disfagia Orofaríngea em Pacientes com Doença do
Neurônio Motor/Esclerose Lateral Amiotrófica. São Paulo, 2005. 124. Tese (Doutor em
Ciências) – Escola Paulista de Medicina, Universidade Federal de São Paulo.
CHIAPPETTA, A. L. M. L.; ODA, A. L. Doenças neuromusculares. In: FERREIRA, L. P.;
BENEFILOPES, D. M.; LIMONGI, S. C. Ed. Tratado de fonoaudiologia. São Paulo:
Roca, 2004. 330-342 p.

40
CHUMLEA, M. A. C.; ROCHE, A. F.; STEINBAUGH, M. L. Estimating stature from
knee height for persons 60 to 90 years of age. Journal of American Geriatrics Society,
New York, v. 33, p. 116-120, 1985.
COURATIER, P.; TORNY, F.; LACOSTE, M. Échelles fonctionnelles de la sclérose
latérale amyotrophique. Revue Neurologique, Paris, v. 162, n. 4, p. 502-507, 2006.
DE GROOT, I. J. M.; POST, M. W. M.; VAN HEUVELN, T.; VAN DEN BERG, L. H.;
LINDEMAN, E. Measurement of decline of functioning in persons with amyotrophic
lateral sclerosis: responsiveness and possible applications of the Functional Independence
Measure, Barthel Index, Rehabilitation Activities Profile and Frenchay Activities Index.
Amyotrophic Lateral Sclerosis and other Neuron Disorders, London, v. 7, p. 167-172,
2006.
DEPARTMENT OF HEALTH. Report on health and social subjects. Dietary reference
values for food energy and nutrients for the UK. London: HMSO, n. 41, 1991.
DESPORT, J. C.; PREUX, P. M.; BOUTELOUP-DEMANGE, C.; CLAVELOU, P.;
BEAUFRÈRE, B.; BONNET, C.; COURATIER, P. P. Validation of bioelectrical
impedance analysis in patients with amyotrophic lateral sclerosis. American Journal of
Clinical Nutrition , Houston, v.77, p. 1179-1185, 2003.
DESPORT, J. C.; PREUX, P. M.; MAGY, L.; BOIRIE, Y.; VALLAT, J. M.;
BEAUFRÈRE, B.; COURATIER, P. Factor correllted with hypermetabolism in patients
with amyotrophic lateral sclerosis. American of Journal Clinical Nutrition , New York,
v. 74, p. 328-334, 2001.

41
DESPORT, J. C.; PREUX, P. M.; TRUONG, T. C.; VALLAT, J. M.; SAUTEREAU, D.;
COURATIER, P. Nutritional status is a prognostics factor for survival in ALS patients.
Neurology, Minneapolis, v. 53, p. 1059-1063, 1999.
DESPORT, J. C.; MAILLOT, F. Nutrition et Sclérose Latérale Amyotrophique (SLA).
Nutrition Clinique et Métabolisme, Paris, v.16, p. 91-96, 2002.
DIETRICH-NETO, F.; CALLEGARO, D.; DIAS-TOSTA, E.; SILVA, H. A.; FERRAZ,
M. E.; LIMA, J. M. B.; OLIVEIRA, A. S. B.. Amyotrophic Lateral Sclerosis in Brazil:
1998 National Survey. Arquivos de Neuropsiquiatria, São Paulo, v. 58, n. 3, p.607-515,
2000.
EISEN, A.; SCHULZER, M.; MAcNEIL, M.; PANT, B.; MARK, E. Duration of
amyotrophic lateral sclerosis is age dependent. Muscle and Nerve, New York, v. 16, p.
27-32, 1993.
EL ESCORIAL REVISITED: Revisited criteria for the diagnosis of ALS.-World
Federation of Neurology research group on motor diseases. A consensus conference held at
Airlie House Worrenton Virginia on april 2-4, 1998. Disponível em
<http://www.wfnals.org/articles/elescorial1998.htm.>[2007 Maio 03].
ESCOTT-STUMP, S. Nutrição: Relacionada ao diagnóstico e tratamento. 5a ed.
Barueri: Ed. Monole, 2007. 746-758.
FRISANCHO, A. R. New norms of upper limb fat and muscle areas for assessment of
nutritional status. American of Journal Clinical Nutrition , New York, v. 34, p. 540-545,
1981.

42
GIL, J.; PREUX, P. M.; ALIOUM, A.; KETZOIAN, C.; DESPORT, J. C.; DRUET-
CABANAC, M.; COURATIER, P. Disease progression and survival in ALS: First multi-
state model approach. Amyotrophic Lateral Sclerosis and other Motor Neuron
Disorders, London, v. 8, n. 4, p. 224-229, 2007.
GUBBAY, S. S.; KAHANA, E.; ZILBER, N.; COOPER, G.; PINTOV, S.; LEIBOWITZ,
Y. Amyotrophic lateral sclerosis. A study of its presentation and prognosis. Journal of
Neurology, New York, v.232, p.295-300, 1985.
HARDIMAN, O. Symptomic treatment of respiratory and nutritional failure in amyotrophic
lateral sclerosis. Journal of Neurology, New York, v. 247, p. 243-251, 2000.
HARRIS, J. A.; BENEDICT, F. G. A biometric study of basal metabolism in man.
Washington, DC: Carnegie Istitute of Washington, 1919.
HAYASHI, M. C. B. Estudo da ação aguda da aminofilina endovenosa nos músculos
respiratórios de pacientes com esclerose lateral amiotrófica. São Paulo: 2000. Tese
(Doutor em Ciências) – Escola Paulista de Medicina, Universidade Federal de São Paulo.
HEFFERNAN, C.; JENKINSON, C.; HOLMES, T.; FEDER, G.; KUPFER, R.; LEIGH,
R.; MCGOWAN, P. N.; RIO, A.; SIDHU, P. S. Nutritional management in MND/ALS
patients: an evidence based review. Amyotrophic Lateral Sclerosis and Other Motor
Neuron Disorders, London, v. 5, p.72-83, 2004.
HOWARD, S.; WILES, C. M.; LOH, L. Respiratory complications and their management
in motor neuron disease. Brain , Oxford, v. 112, p. 1155-1170, 1989.

43
INSTITUTE OF MEDICINE. Energy. In: Dietary Reference Intakes for energy,
carbohydrate, fiber, fatty acids, cholesterol, protein, and amino acids. Washington, D.C.:
The National Academy Press, 2002. Disponível em: <http://www.nap.edu> [2007 Abril
14].
INSTITUTE OF MEDICINE. In: Dietary Reference Intakes for calcium, phosphorous,
magnesium, vitamin D, and fluoride. Washington, D.C.: The National Academy Press,
1997. Disponível em: <http://www.nap.edu> [2007 Abril 14].
INSTITUTE OF MEDICINE. In: Dietary Reference Intakes for vitamin C, vitamin E,
selenium, and carotenoids. Washington, D.C.: The National Academy Press, 2000.
Disponível em: <http://www.nap.edu> [2007 Abril 14].
INSTITUTE OF MEDICINE. In: Dietary Reference Intakes for vitamin A, vitamin K,
arsenic, boron, chromium, copper, iodine, iron, manganese, molybdenum, nickel, silicon,
vanadium, and zinc (2001). Washington, D.C.: The National Academy Press, 2001.
Disponível em: <http://www.nap.edu> [2007 Abril 14].
JACKSON, C. E.; ROSENFELD, J. Quantitative assessment and outcome measures in
neuromuscular disease. In: Katirji B, Kaminski HJ, Preston DC, Ruff RL, Shapiro BE.
Neuromuscular Disorders in Clinical Practice. Ohio: Butterworth Heinemann: 2002.
p.309-338.
KANDA, F.; FUJII, Y.; TAKAHASHI, L.; FUJITA, T. Dual-energy X-ray absorptiometry
in neuromuscular diseases. Muscle and Nerve, New York, v. 17, p. 413-415, 1994.
KAPLAN, L. M.; HOLLANDER, D. Respiratory Dysfunction in Amyotrophic Lateral
Sclerosis. Clinics in Chest Medicine, Philadelphia, v. 15, n. 4, p. 675-681, 1994.

44
KASARSKIS, E.; BERRYMAN, S.; VANDERLEEST, J. G.; SCHNEIDER, A. R.;
MCCLAIN, C. J. Nutritional status of patients with amyotrophic lateral sclerosis: relation
to the proximity of death. American Journal of Clinical Nutrition , New York, v. 63,
p.130-137, 1996.
KINSELLA, J. E.; WHITEREAD, D. M. Proteins in Whey: Chemical, physical and
functional properties. In: Advances in Food Nutritional Research, London: Academic
Press, 1989, v.33, p.343-439.
LASKEY, M. A. Dual-energy x-ray absorptiometry and body composition. Nutrition ,
New York, v. 12, n. 1, p. 45-52, 1996.
LI, T. M.; ALBERMAN, E.; SWASH, M. Clinical features and associations of 560 cases of
motor neuron disease. Journal of Neurology and Neurosurgery and Psychiatry,
London, v. 53, p. 1043-1045, 1990.
LISBETH, M. H.; MATHUS, V.; LOUWERSE, L. S.; MERKUS, M. P.; TYTGAT, G. N.
J.; VIANNEY, J. M. B. Percutaneous endoscopic gastrostomy in patients with
amyotrophic lateral slerosis ans impaired pulmonary function. Gastrointestinal
Endoscopy, Denver, v. 40, p. 463-469, 1994.
LOGEMANN, J. A. Evaluation and Treatment of Swallowing Disorders. 2nd edition.
Austin texas: Pro-ed, 1998. 406 p.
LOHMAN, T. G.; ROCHE, A. F.; MARTORELL, R. Anthropometric standardization
reference manual. Abrindged edition, 1991.

45
LONG, C. L.; SCHAFFEL, N.; GEIGER, J. W. Metabolic response to injury and illness:
Estimation of energy and protein needs from indirect calorimetry and nitrogen balance.
Journal of Parenteral and Enteral Nutrition, Silver Spring, v. 3, p. 452-456, 1979.
LU, S. Regulation of hepatic glutathione synthesis: current concepts and controversies.
FASEB Journal, Bethesda, v.13, p.1169-1183. 1999.
LUDOLPH, A. C. 135th ENMC International Workshop: Nutrition in amyotrophic lateral
sclerosis 18-20 of March 2005, Naarden, The Netherlands. Neuromuscular Disorders,
Oxford, p. 1-9, 2006.
MAcKAY, R. P. Course and prognosis in amyotrophic lateral sclerosis. Archives of
Neurology, Chicago, v. 8, p. 17-27, 1963.
MADSEN, O. R.; JENSEN, J. E. B.; SORENSEN, O. H. Validation of a dual energy x-ray
absortiometer: measurement of bone mass and soft tissue composition. European Journal
Applied Physiology, Heidelberg, v. 75, p. 554-558, 1997.
MAHAN, K.; ESCOTT-STUMP, S. Krause: alimentos, nutrição e dietoterapia. 11a ed.
São Paulo: Ed. Roca, 2005. 407 p.
MAZZINI, L.; CORRÁ, T.; ZACCALA, M.; MORA, G.; DEL PIANO, M.; GALANTE,
M. Percutaneous endoscopic gastrostomy and enteral nutrition in amyotrophic lateral
sclerosis. Journal of Neurology, New York, v. 242, p. 695-698, 1995.
McINTOSH, G. H.; ROGESTER, G. O. Whey proteins as functional food ingredient?
International Dairy Journal , Barking, v.8, p.425-434, 1998.

46
MICKE, P.; BEEH, K. M.; SCHALLK, J. K.; BUHL, R. Oral Supplementation with Whey
Proteins Increases Plasma Glutathione levels of HIV- infected Patients. European Journal
of Clinical Investigation, Oxford, v. 31, n. 2, p. 171-178, 2001.
MILLER, R. G.; ROSENBERG, J. A.; GELINAS, D. F.; MITSUMOTO, H.; NEWMAN,
D.; SUFIT, R. Practice parameter: The care of the patient with amyotrophic lateral sclerosis
(an evidence-based review). Neurology, Minneapolis, v. 52, p. 1311- 1323, 1999.
MILLS, R. H. Rheology overview: control of liquid viscosities in dysphagia management.
Nutritional in Clinical Practice , Silver Spring, v. 14, p. S52-6, 1999.
MITSUMOTO, H.; DAVIDSON, M.; MOORE, D.; GAD, N.; BRANDS, M.; RINGEL, S.;
ROSENFELD, J.; SHEFNER, J. M.; STRONG, M. J.; SUFIT, R.; ANDERSON, F. A.
ALS CARE Study Group Percutaneous endoscopic gastrostomy (GEP) in patients with
ALS and bulbar dysfunction. ALS and other motor disorders, Sweden, v. 4, p. 177-185,
2003.
MITSUMOTO, H.; NORRIS, F. H. Amyotrophic Lateral A Comprehensive Guide to
management, New York: Demos Publications, 1994. 342 p.
MORENO, Y. M. F. Influência das proteínas de soro de leite bovino do estado
nutricional, composição corporal e sistema imune em coorte de crianças com
síndrome da imunodeficiência adquirida (AIDS). Campinas, SP, 2002. 45p. Dissertação
(Mestrado em Alimentos e Nutrição) Universidade de Campinas, 2002.
NATIONAL RESEARCH COUNCIL (US). Recommended dietary allowances.
Washington: National Academic Press; 1989.

47
NAU, K. L. Individuals with amyotrofic lateral sclerosis are in caloric balance despite
losses in mass. Journal of the Neurological Sciences, Amsterdam, v. 192, p.S47-S49,
1995.
NAU, K. L.; BROMBERG, M. B.; FORSSHEW, D. A.; KATCH, V. L. Individuals with
amyotrophic lateral sclerosis are in caloric balance despite losses in mass. Journal of the
Neurological Sciences, Amsterdam, v. 129, p. 47-49, 1995.
NELSON, L. M.; MATKIN, C.; LONGSTRETH, W. T, MCGUIRE, V. Population – based
case – control study of amyotrophic lateral sclerosis in Western Washington State. II. Diet.
American Journal of Epidemiology, Baltimore, v. 151, p. 164-173, 2000.
NORRIS, F.; SHEPHERD, R.; DENYS, E. U. K. Onset natural history and outcome in
idiopathic adult motor neuron disease. Journal of the Neurological Sciences, Amsterdam,
v. 118, p. 48-55. 1993.
O'BRIEN, C.; YOUNG, A.J.; SAWKA, M. N. Bioelectrical impedance to estimate changes
in hydration status. International Journal of Sports and Medicine, Stuttgart, v. 23, p.
361-366, 2002.
OLIVEIRA, A. S. B.; GABBAI, A. A. Doenças neuromusculares. In: PRADO, F. C.;
RAMOS, J. A.; VALLE, J. R.; ED-BORGES, D. R.; ROTHSCHILD, H. A. Atualização
Terapêutica. 20a ed. São Paulo: Artes Médicas, 2001. 816-826 p.
ORGANIZACION MUNDIAL DE LA SALUD. Necesidades de energia y proteínas.
Informe de uma reunion consultiva conjunta FAO/OMS/UNU de expertos. Genebra,
1985.

48
PACHECO, M. T. B.; BIGHETTI, E.; ANTÔNIO, M.; CARVALHO, J. E.; ROSANELI,
C. F.; SGARBIERI, V. C. Efeito de um hidrolisado de proteínas de soro de leite e de seus
peptídios na proteção de lesões ulcerativas da mucosa gástrica de ratos. Revista de
Nutrição, Campinas, v.19, n.1, p. 47-55, 2006.
PERES, S. P. B.; MANZANO, F. M.; MARQUES, I. L.; SILVA, L. B. C.; MOURA, R. M.
X. Manual de Técnicas e Receitas para Espessamento de Alimentos: utilização de
diferentes amidos espessantes. Bauru: HRAC-USP, 2006. 10-68 p.
PIQUET, M. A. Nutritional Approach for patients with amyotrophic lateral sclerosis.
Revue Neurologique, Paris, v. 2, p. S177-4S187, 2006.
RIO, A.; CAWADIAS, E. Nutritional advice and treatment by dietitians to patients with
amyotrophic latera sclerosis/motor neurone disease: a survey of current practice in England,
Wales, Northern Ireland and Canada. Journal of Human Nutrition and Dietetics,
Oxford, v. 20, p. 1-13, 2007.
ROWLAND, L. P.; SHENEIDER, N. A. Amyotrophic lateral sclerosis. New England
Journal of Medicine, Waltham, v. 344, n. 22, p. 1688-1700, 2001.
SCHIFFMAN, P. L.; BELSH, J. M. Pulmonary function at the diagnosis of amyotrophic
lateral sclerosis. Chest, Chicago, v. 103, p. 508-513, 1993.
SCHOFIELD, W. N. Predicting basal metabolic rate, new standards and a review of
previous work. Human Nutrition Clinical Nutrition , London, v. 39, p. 5-41, 1985.
SEN, C. K. Nutritional Biochemistry of Cellular Glutathione. The Journal Nutritional
Biochemistry, Stoneham, v. 8, p. 660-672, 1997.

49
SHIMIZU, T.; HAYASHI, H.; TANABE, H. Energy metabolism of ALS patients Ander
mechanical ventilation and tube feeding. Clinical neurology and neurosurgery, Assen, v.
31, p. 255-259, 1991.
SILANI. V.; KASARKIS, E. J.; YANAGISAWA, N. Nutritional management in
amyotrophic lateral sclerosis: a worldwide perspective. Journal of Neurology, New York,
v. 243, p.S13-S19, 1998. Supl. 2.
SILVA, L. B. C.; MOURÃO, L.; LIMA, N. M. F. V.; ALMEIDA, S. R. M.; FRANCA, M.
J.; NUCCI, A.; AMAYA-FARFAN, J. Amyotrophic lateral sclerosis: nutritional status
and functional conditions. Annual Dysphagia Research Society Meeting, Vancouver,
Canada, March 8-10, 2007a.
_____Amyotrophic Lateral Sclerosis (ALS): Nutritional pr ofile and swallowing ability
in patients with dysphagia. Annual Dysphagia Research Society Meeting, Vancouver,
Canada, March 8-10, 2007b.
SLOWIE, L. A.; PAIGE, M. S.; ANTEL, J. P. Nutritional considerations in the
management of patients with ALS amyotrophic lateral sclerosis. Journal of the American
Dietetic Association, Chicago, v. 83, p. 44-47, 1983.
SNEAD, D. B.; BIRGE, S. J.; KOHRT, M. Age-related differences in body composition by
hydrodensitometry and dual-energy-x-ray absorptiometry. Journal of Applied
Physiology, Bethesda, v. 74, n. 2, p. 770-775, 1993.
SOUZA, B. B. A.; MARTINS, C.; CAMPOS, D. J.; BALSINI, I. D.; MEYER, L. R.
Nutrição e Disfagia: Guia para profissionais. Curitiba, PR, Brasil: Nutroclínica. 2003.

50
STANICH, P.; PEREIRA, A. M. L.; CHIAPPETA, A. L. M. L.; NUNES, M.; OLIVEIRA,
A. S. B.; GABBAI, A. A. Suplementação nutricional em pacientes com doença do neurônio
motor/esclerose lateral amiotrófica. Revista Brasileira de Nutrição Clínica, São Paulo, v.
19, p.70-78, 2004.
STRAND, E. A.; MILLER, R. M.; YORKSTON, K. M.; HILLEL, A. D. Management of
oral-pharyngeal dysphagia symptoms in amyotrophic lateral sclerosis. Dysphagia, New
York, v. 11, p. 129-139, 1996.
TADAN, R.; KRUSINSKI, P. B.; HISER, J. R. The validity and sensitivity of dual
energy X-ray absorptiometry in estimulating lean body mass in amyotrophic lateral
sclerosis. In: Proceedings of the 9th International Symposium on ALS/MND, Munich, 16-
18 November 1998. Munich: ALS Association, 1998. 48 p.
TASSI, E. M. M.; AMAYA-FARFÁN, J.; AZEVEDO, R. A. Hydrolyzed α-lactalbumin as
a sourse of protein to the exercising rat. Nutrition Research. Tarrytown, v. 18, p. 875-881,
1998.
THOMAS, B. Manual of Dietetic Practice. 3 rd edition. Oxford: Blackwell Science Ltd,
2001.
TIDWELL, J. Pulmonary Management of the amyotrophic lateral patient. The Journal of
neuroscience Nursing, Chicago, v. 25, n. 6, p. 337-342, 1993.
TOTHILL, P.; HAN, T. S.; AVENELL, A.; MCNEILL, G.; REID, D. M. Comparisons
between fat measurements by dual-energy x-ray absorptiometry, underwater weighing and

51
magnetic resonance imaging in healthy women. European Journal of Clinical Nutrition ,
London, v. 50, p. 747-752, 1996.
TYMCHUCK, D. Textural property considerations of food for dysphagia. Nutrition in
Clinical Practice, Silver Spring, 14, p.S57-S59, 1999.
U. S. DEPARTAMENT OF AGRICULTURE. 2003. Composition of Foods. Raw,
Processed, Prepared USDA National Nutrient Database for Standard Reference. Release
16. Nutrient Data Laboratory homepage. Disponível em
<http://www.nal.usda.gov/fnic/foodcomp/Data/SR18/SR18_doc.pdf>.
WALLING, A. D. Amyotrophic lateral Scerosis: Lou Gehrig’s Disease. American Family
Physician, Kansas City, v. 59, n. 6, p. 1489-1496, 1999.
WATTS, C. R.; VANRYCKEGHEM, M. Layngeal dysfunction in Amyotropic Lateral
Sclerosis: a review and case report. BMC Ear, Nose and Throat disorders 2001.
WELNETZ, K. Maintaining adequate nutrition and hydration in the dysphagic ALS patient.
Journal of Continuing Education in Nursing, Thorofare, v. 21, p. 62-71, 1990.
WRIGHT, L.; COTTER, D.; HICKSON, M.; FROST, G. Comparison of energy and
protein intakes of older people consuming a texture modified diet with a normal hospital
diet. Journal of Human Nutrition and Dietetics, Oxford, v. 18, p. 213-219, 2005.

52
________________________________________________________________Artigo I
“Avaliação da ingestão alimentar de indivíduos com Esclerose Lateral
Amiotrófica”
4

53
AVALIAÇÃO DA INGESTÃO ALIMENTAR DE INDIVÍDUOS COM
ESCLEROSE LATERAL AMIOTRÓFICA
Luciano Bruno de Carvalho Silva
Lucia Figueiredo Mourão
Ariovaldo Armando Silva
Núbia Maria Freire Vieira Lima
Marcondes Franca Junior
Anamarli Nucci
Jaime Amaya-Farfán
Artigo a ser submetido à Revista Brasileira de Nutrição Clínica
54
Avaliação da ingestão alimentar de indivíduos com Esclerose Lateral Amiotrófica
Evaluation of the food intake of individuals with Amyotrophic Lateral Sclerosis
Evaluación de la ingestión alimentaria de pacientes con Esclerosis Lateral
Amiotrófica
Luciano Bruno de Carvalho Silva1, Lucia Figueiredo Mourão2, Ariovaldo Armando
Silva3, Núbia Maria Freire Vieira Lima4, Marcondes Franca Junior5, Anamarli Nucci6,
Jaime Amaya-Farfán7
________________________
1Nutricionista, mestre e doutorando em Alimentos e Nutrição do Departamento de
Alimentos e Nutrição (DEPAN) - Faculdade de Engenharia de Alimentos (FEA) -
Universidade Estadual de Campinas (UNICAMP), professor assistente do Departamento de
Nutrição - Universidade Federal de Alfenas (UNIFAL-MG). 2Fonoaudióloga, professora do curso de Fonoaudiologia da Faculdade de Ciências Médicas
(FCM/UNICAMP). 3Otorrinolaringologista e Foniatra, professor da FCM-UNICAMP Ambulatório de
Otorrionolaringologia do Hospital das Clínicas, HC/UNICAMP. 4Fisioterapeuta - Departamento de Neurologia, FCM/UNICAMP, 5Neurologista - Departamento de Neurologia, FCM/UNICAMP, 6Livre-Docente - Departamento de Neurologia, FCM/UNICAMP, responsável pelo setor de
Doenças Neuromusculares do HC/UNICAMP; 7Livre-Docente FEA/UNICAMP, responsável pelo Núcleo de Estudos e Pesquisas em
Alimentação (NEPA/UNICAMP).
Endereço para correspondência:
Luciano Bruno de Carvalho Silva
Rua Monteiro Lobato 80, Cidade Universitária Zeferino Vaz, Barão Geraldo
CEP 13083-862, Campinas SP – Brasil.
Fax 55 19 35214060. E-mail: [email protected].

55
Resumo
A esclerose lateral amiotrófica (ELA) caracteriza-se por paralisia progressiva, secundária
ao comprometimento de neurônios motores inferiores e superiores. Com a evolução da
doença observa-se disfunção motora generalizada e insuficiência respiratória, perda
progressiva de peso corporal e alterações na ingestão alimentar. O trabalho teve como
objetivo avaliar o consumo alimentar, qualitativo e quantitativo, de pacientes com ELA,
acompanhados no setor de Doenças Neuromusculares do HC-UNICAMP. Aplicou-se
questionário de freqüência de consumo alimentar e o recordatório de 24 horas, em 23
pacientes. Os alimentos mais consumidos diariamente foram óleo (100%), arroz (96%),
leite (96%), feijão (91%) e pão francês (74%). Todos os pacientes apresentaram
inadequação para energia, fibras, cálcio e vitamina E. Considerando-se a predominância
topográfica do comprometimento muscular na doença, foram observadas diferenças
significativas entre pacientes predominantemente bulbares e de predomínio apendicular.
Nos pacientes com maior envolvimento apendicular houve maior ingestão energética
(p=0,02), de gordura saturada (p=0,03), monoinsaturada (p=0,04) e polinsaturada
(p=0,001), além de colesterol (p=0,001) e fibras (p=0,001). Os resultados obtidos
permitiram conhecer os hábitos alimentares desta população e estimar a ingestão alimentar.
Os dados podem ser aplicados no atendimento nutricional, e orientações específicas
poderão proporcionar uma alimentação mais adequada.
Unitermos: Esclerose lateral amiotrófica, estado nutricional, consumo alimentar, avaliação
nutricional
Abstract
Amyotrophic lateral sclerosis (ALS) is a neurodegenerative disorder of motor neurons,
characterized by progressive motor handicap, late respiratory failure, severe weigth loss
and deficient nutritional intake. The objective of this study was to evaluate quantitatively
and qualitatively food intake in patients with ALS regularly followed at the neuromuscular
outpatient clinic of HC-UNICAMP. We employed the frequency questionnaire and the
24h-diet history in 23 patients. Oil (100%), rice (96%), milk (96%), beans (91%) and bread
(74%) were the most frequent items of the daily diet in these individuals. All patients
presented inadequate energy, fibers, calcium and vitamin E intake. Taking into account
predominantly affected muscle groups, we found significant differences between patients

56
with bulbar or appendicular onset. Patients with appendicular ALS had higher intake of
energy (p=0.02), saturated fat (p=0.03), monounsaturated fat (p=0.04), polyunsaturated fat
(p=0.001), as well as cholesterol (p=0.001) and fibers (p=0.001). In this study, we were
able to characterize nutritional habits in these patients and estimate their food intake. These
findings might be useful in the nutritional management of patients with ALS by indicating
more adequate advice for this population.
Key words: Amyotrophic lateral sclerosis, nutritional status, alimentary consumption,
nutritional assessment.
Resumen
La esclerosis lateral amiotrófica (ELA) se caracteriza por la paralización progresiva,
secundaria al comprometimiento de las neuronas motoras, neurona motora inferior y
superior. En los estadios más avanzados de la enfermedad, se registra disminución de la
fuerza muscular respiratoria, pérdida progresiva del peso y alteraciones en la ingestión de
alimentos. El presente trabajo tuvo como objetivo evaluar el consumo alimentar actual,
cualitativo y cuantitativo de pacientes con ELA observados en ambulatorio de
enfermedades neuromusculares HC-UNICAMP. Fueron aplicados: un cuestionario de
frecuencia de consumo alimentar y el recordatorio de 24 horas, en 23 pacientes. Los
alimentos más consumidos diariamente fueron aceite (100%), arroz (96%), leche líquida
(96%), fríjol (91%) y pan francés (74%). Todos los pacientes evaluados presentaron
inadecuación en energía, fibras, calcio y vitamina E. Tomándose como base la
predominancia topográfica de lo comprometimiento muscular de la enfermedad, fue posible
observar diferencias significativas entre pacientes predominantemente bulbares y
apendiculares. Se observó en los apendiculares ingestión energética mayor (p=0,02), grasas
saturadas (p=0,03), monoinsaturadas (p=0,04) y poliinsaturadas (p=0,001), además de
colesterol (p=0,001) y fibras (p=0,001). Los resultados obtenidos permitieron conocer los
hábitos alimentarios de esta población y estimar la ingestión alimentar. Los dados poden ser
aplicados en la atención nutricional y orientaciones específicas podrían proporcionar una
alimentación más adecuada.
Unitérminos: Esclerosis lateral amiotrófica, estado nutricional, consumo alimentar,
evaluación nutricional

57
Introdução
A esclerose lateral amiotrófica (ELA) caracteriza-se por paralisia progressiva,
secundária ao comprometimento dos neurônios motores, dos neurônios motores superiores
e dos neurônios motores inferiores1-3.
A progressão característica da ELA leva ao comprometimento motor generalizado.
Nos estágios mais avançados da doença, observa-se diminuição da força muscular
respiratória, disfagia, perda progressiva de peso corporal e alterações na ingestão
alimentar4.
Vários fatores influenciam a ingestão alimentar na ELA, dentre eles: inapetência,
disfagia, fraqueza, dispnéia e depressão4-8.
Poucos estudos sobre ingestão alimentar na ELA são encontrados na literatura. Dentre
eles destacam-se os de Kasarskis et al.7, que verificaram 70% dos indivíduos com ingestão
abaixo da Recommended Dietary Allowances (RDA) e ingestão de proteínas acima da RDA
para 84% dos pacientes. Slowie et al.5 também encontraram 70% de inadequação para
energia, utilizando o recordatório de 24 horas. Stanich et al.8 verificaram valores acima da
RDA para lipídios na maioria dos seus pacientes com ELA
Silva et al.9,10 analisaram o perfil nutricional dos pacientes atendidos nos
Ambulatórios de Disfagia e de Neuromuscular do HC-UNICAMP em avaliações
interdisciplinares, verificando que os homens tiveram baixa ingestão calórica, de
aproximadamente 1600 Kcal/dia e as mulheres em torno de 1700 Kcal/dia.
Na ELA, assim como na maioria das doenças neuromusculares, pode ocorrer aumento
do catabolismo muscular, refletindo diretamente sobre a síntese protéica e na excreção de
minerais. Em estágios iniciais da ELA, conforme estudo realizado com 94 pacientes, não
foram observados déficits de vitaminas como E e C, mas com a evolução da doença,
manifestações clínicas e bioquímicas de carência foram verificadas11.

58
Com a evolução da ELA, hábitos e preferências alimentares podem necessitar de
modificações. A disfagia pode resultar em ingestão e absorção inadequada de alimentos,
levando a desnutrição e a várias deficiências nutricionais12.
O trabalho teve como objetivo avaliar o consumo alimentar, qualitativo e quantitativo,
de indivíduos com diagnóstico de ELA.
Métodos
Avaliação da ingestão alimentar
O presente estudo transversal, descritivo e comparativo foi aprovado pelo Comitê de
Ética e Pesquisa da FCM-UNICAMP (n° 428/2006) e todos os pacientes assinaram o termo
de consentimento livre e esclarecido.
Dos pacientes acompanhados no Ambulatório de Doenças Neuromusculares do HC-
UNICAMP, 23 concordaram em participar e foram selecionados de acordo com os critérios
de inclusão: diagnóstico definido de ELA, pelo critério El Escorial13, de ambos os sexos
independente do tempo de doença e exclusão clínico-laboratorial de outras patologias
neurológicas. Foram excluídos também aqueles com via alternativa de nutrição e ventilação
mecânica invasiva.
Foi aplicado o recordatório de 24 horas14, em diferentes dias, 6 vezes em cada
indivíduo, possibilitando conhecer os aspectos quantitativos e qualitativos da dieta do
paciente. Para tanto, foi questionada a alimentação habitual, incluindo quantidade, marca
comercial e preparação de cada alimento. Por meio desse método, avaliou-se a ingestão
energética (Valor Energético Total — VET); a porcentagem de carboidratos, proteínas e
lipídios, em relação ao VET ingerido; a porcentagem de gorduras saturadas, polinsaturadas

59
e monoinsaturadas, em relação ao VET consumido; fibras, cálcio, ferro, retinol e ácido
ascórbico, sendo que os cálculos foram efetuados pelo software DIET PRO 4.015 .
O conteúdo de fibras, colesterol, gorduras saturadas, polinsaturadas e
monoinsaturadas dos alimentos foi acrescentado ao DIET PRO 4.0, tendo como base a
Tabela de Composição de Alimentos de Philippi16, Tabela Brasileira de Composição de
Alimentos (TACO)17 e Tabela da United States Departament of Agriculture (USDA)18.
Para estimar a adequação de carboidratos e lipídios utilizou-se as RDAs19, e para
proteínas as recomendações da Sociedade Brasileira de Alimentação e Nutrição20. Para os
micronutrientes, seguiu-se como referência o padrão do Institute of Medicine21,22,23,24,
sendo que para cálcio seguiu-se a Ingestão Adequada (AI). Para ferro, retinol, ácido
ascórbico, vitamina E, zinco e selênio usou-se a Necessidade Média Estimada (EAR) como
parâmetros de comparação. Os pontos de corte utilizados como referência diária de
nutrientes estão apresentados na Tabela 1.
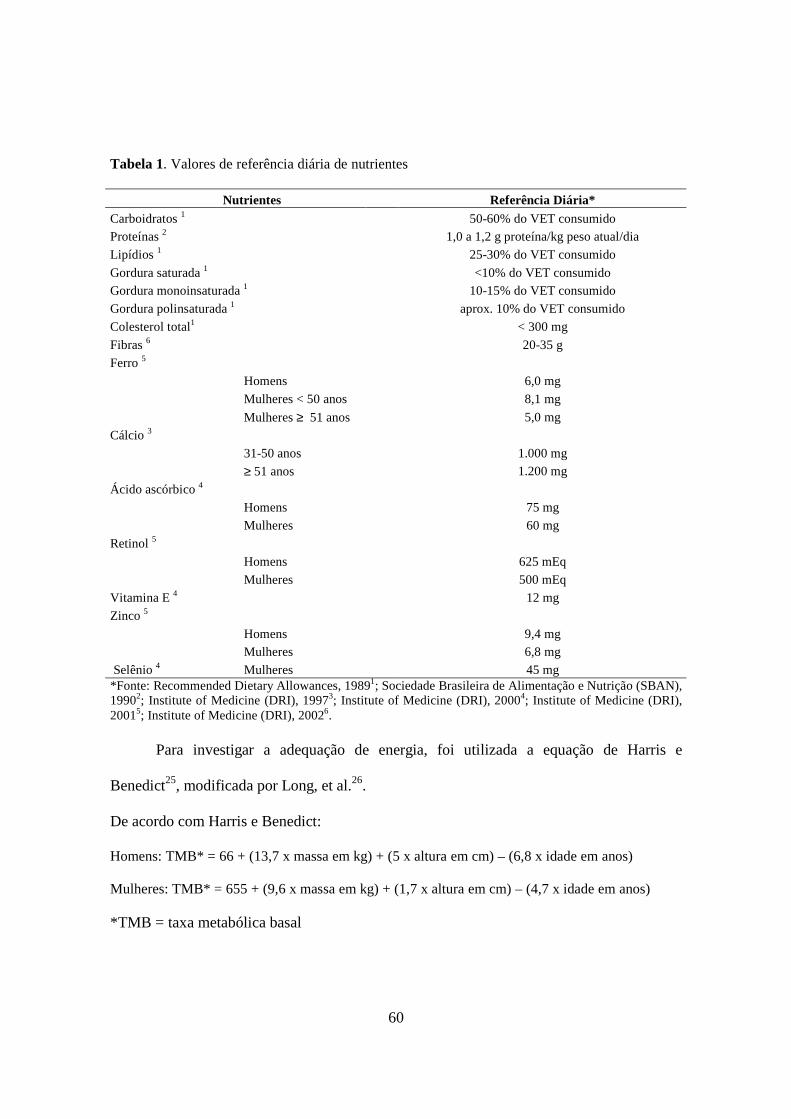
60
Tabela 1. Valores de referência diária de nutrientes
Nutrientes Referência Diária* Carboidratos 1 50-60% do VET consumido Proteínas 2 1,0 a 1,2 g proteína/kg peso atual/dia
Lipídios 1 25-30% do VET consumido
Gordura saturada 1 <10% do VET consumido Gordura monoinsaturada 1 10-15% do VET consumido
Gordura polinsaturada 1 aprox. 10% do VET consumido
Colesterol total1 < 300 mg
Fibras 6 20-35 g
Ferro 5 Homens 6,0 mg
Mulheres < 50 anos 8,1 mg
Mulheres ≥ 51 anos 5,0 mg
Cálcio 3 31-50 anos 1.000 mg ≥ 51 anos 1.200 mg
Ácido ascórbico 4 Homens 75 mg
Mulheres 60 mg
Retinol 5 Homens 625 mEq
Mulheres 500 mEq
Vitamina E 4 12 mg
Zinco 5 Homens 9,4 mg Mulheres 6,8 mg
Selênio 4 Mulheres 45 mg *Fonte: Recommended Dietary Allowances, 19891; Sociedade Brasileira de Alimentação e Nutrição (SBAN), 19902; Institute of Medicine (DRI), 19973; Institute of Medicine (DRI), 20004; Institute of Medicine (DRI), 20015; Institute of Medicine (DRI), 20026.
Para investigar a adequação de energia, foi utilizada a equação de Harris e
Benedict25, modificada por Long, et al.26.
De acordo com Harris e Benedict:
Homens: TMB* = 66 + (13,7 x massa em kg) + (5 x altura em cm) – (6,8 x idade em anos)
Mulheres: TMB* = 655 + (9,6 x massa em kg) + (1,7 x altura em cm) – (4,7 x idade em anos)
*TMB = taxa metabólica basal

61
Modificado por Long et al.26:
VET* = TMB x fator de atividade x fator de injúria
*VET = valor calórico total
Como fator de atividade, considerou-se 1,2 em pacientes incapacitados para andar e
1,3 em pacientes que deambulavam. Como fator de injúria, considerou-se 1,1 para doenças
crônicas26. Para indivíduos com ELA, alguns autores27 consideram o gasto energético de 10
a 20% acima daquele do indivíduo saudável; outros consideram 35 kcal/kg de peso atual.
No entanto, utilizou-se a equação de Harris e Benedict, modificada por Long et al. 26 por ser
mais específica.
Para avaliar o consumo qualitativo, utilizou-se o Questionário de Freqüência de
Consumo Alimentar (QFA)28. O questionário foi testado previamente no público-sujeito, e
possuía 72 alimentos que foram separados em 8 grupos29: cereais, hortaliças do grupo III
(percentual de carboidratos > 10%) e leguminosas; frutas e suco de frutas; hortaliças do
grupo I e II (percentual de carboidratos < 5% e < 10%, respectivamente); leite e derivados;
gorduras e óleos; carnes, frango, peixes, ovos, vísceras e embutidos; adoçantes e produtos
dietéticos; açúcar, produtos que contém açúcar e produtos de pastelaria (salgados fritos e
assados). A freqüência de consumo foi avaliada da seguinte forma: diária (quando o
alimento era consumido todos os dias, pelo menos uma vez), semanal (quando era
consumido toda semana, pelo menos uma vez), mensal (quando era consumido de 1 a 3
vezes por mês), nunca ou raramente (quando o alimento não era usado ou seu uso era
esporádico, com freqüência menor que uma vez ao mês).
Os dados sobre freqüência alimentar foram processados no programa Epi-Info,
versão 6.0430.
62
Avaliação da função da deglutição segundo a “Revised Amyotrophic Lateral Sclerosis
Functional Rating Scale (ALSFRS-R)”
A ALSFRS é uma escala validada e de uso internacional que avalia a função física,
atividades de vida diária e comprometimento bulbar, apendicular e respiratório na ELA.
Esta escala foi revisada em 1999 e contém 12 itens (ALSFRS-R), sendo utilizado nesta
pesquisa somente o item deglutição, o qual foi pontuada em 5 níveis: 0 para
impossibilidade de alimentação oral e 4 para deglutição normal; o escore menor representa
pior função de deglutição31 .
Análise estatística
Para comparar variáveis numéricas entre dois grupos independentes utilizou-se o
teste de Mann Whitney, adotando-se o nível de significância inferior a 0,05. Os dados
foram analisados no programa SPSS for Windows 15.032.
Resultados
Dos 23 pacientes avaliados, 19 (83%) eram do sexo masculino e 4 (17%) do
feminino, com mediana de idade de 45 anos, extremos de 32 e 68 anos.
Em relação à renda familiar, 97% possuíam renda mensal de até 5 salários mínimos,
sendo que destes, 83% apresentavam renda per capita de até 2 salários.
Com relação ao fracionamento das refeições, verificou-se que 14 (61%) dos
entrevistados faziam de cinco a seis refeições por dia. Das 9 pessoas que faziam menos de
cinco refeições diárias, 7 (30%) consumiam quatro e 2 (9%) consumiam três refeições. Não
foi observada diferença significativa quanto ao número de refeições dos pacientes com

63
maior e menor renda per capita (p=0,563). Quanto à escolaridade, 91% possuíam, no
máximo, 4 anos de estudo.
Os alimentos mais citados como consumidos diariamente e semanalmente pelos
pacientes com ELA estão apresentados na Tabela 2.
Tabela 2. Alimentos mais referidos de consumo diário, semanal e mensal pelos pacientes com ELA.
Alimentos mais consumidos diariamante
% Alimentos mais consumidos semanalmente
% Alimentos mais consumidos mensalmente
%
Óleo de soja 100 Batata inglesa 99 Peixe 87 Arroz 96 Macarrão 99 Carne suína 87 Açúcar 96 Cenoura 97 Manteiga 83 Leite 96 Banana 83 Chocolate 64 Feijão 91 Ovos 83 Embutidos 57 Suco de frutas 78 Mamão 83 Café 78 Frango 74 Pão francês 74 Carne de bovina 65 Suplemento hipercalórico 65 Refrigerante 61 Margarina 30 Abóbora 60 Queijo 35
A adequação da ingestão de energia e nutrientes, em relação aos seus respectivos
valores de referência, está apresentada na Tabela 3.

64
Tabela 3. Avaliação da adequação de energia e nutrientes, segundo os valores de referência e de acordo com o nº de pacientes.
Nutrientes Referência Diária* Adequado Abaixo Acima Energia (homens) (kcal) 2284,51a 5 (26%) 8 (42%) 6 (32%) Energia (mulheres) (kcal) 2029,47b 1 (25%) - 3 (75%) Carboidratos 50-60% do VET consumido 1 11 (48%) 8 (35%) 4 (17%) Proteínas 1,0 a 1,2 g proteína/Kg peso atual/dia 2 18 (78%) 5 (22%) - Lipídios 25-30% do VET consumido 1 13 (56%) 2 (9%) 8 (35%) Gordura saturada <10% do VET consumido 1 11 (48%) - 12 (52%) Gordura monoinsaturada 10-15% do VET consumido 1 2 (9%) - 21 (91%) Gordura polinsaturada aprox. 10% do VET consumido 1 21 (91%) - 2 (9%) Colesterol < 300 mg 1 23 (100%) - - Fibras 20-35 g 6 - 23 (100%) - Ferro Homens 6,0 mg 5 19 (100%) - - Mulheres < 51 anos 8,1 mg 5 2 (50%) - - Mulheres ≥ 51 anos 5,0 mg 5 2 (50%) - - Cálcio 31-50 anos 1.000 mg 3 - 4 (13%) - ≥ 51 anos 1.200 mg 3 - 19 (87%) - Ácido ascórbico Homens 75 mg 4 11 (58%) 4 (21%) 4 (21%) Mulheres 60 mg 4 2 (50%) - 2 (50%) Retinol Homens 625 mg 5 9 (47%) 10 (53%) - Mulheres 500 mg 5 3 (75%) 1 (25%) - Vitamina E 12 mg4 - 23 (100%) - Zinco Homens 9,4 mg 5 6 (32%) 13 (68%) - Mulheres 6,8 mg 5 2 (50%) 2 (50%) - Selênio 45 mg 4 17 (74%) 5 (26%) -
a Valor mediano do VET para homens; b valor mediano do VET para mulheres (Harris e Benedict, 1919 e Long; Schaffel; Geiger 1979). *Fonte: Recommended Dietary Allowances, 19891; Sociedade Brasileira de Alimentação e Nutrição (SBAN), 19902; Institute of Medicine (DRI), 19973; Institute of Medicine (DRI), 20004; Institute of Medicine (DRI), 20015; Institute of Medicine (DRI), 20026.
Tomando-se como base a topografia da deficiência motora na ELA, observou-se
diferenças significativas entre pacientes com predominância bulbar e aqueles de
predominância apendicular. Nos pacientes com maior manifestação apendicular, havia
maior ingestão energética (p=0,02), de gordura saturada (p=0,03), monoinsaturada (p=0,04)
e polinsaturada (p=0,001), além de colesterol (p=0,001) e fibras (p=0,001), quando
comparados com os de predominância bulbar, conforme dados apresentados na Tabela 4.

65
Tabela 4. Comparação do consumo energético e de nutrientes entre indivíduos com ELA com
manifestação inicial bulbar e apendicular.
Bulbar Apendicular Nutrientes Média ± DP Mediana (min-max) Média ± DP Mediana (min-max)
p*
Energia (kcal) 2008,7 ± 307,8 2030 (1564,9-2522,4) 2495,8 ± 457,8 2471,1 (1792,67-2431,2) 0,02
Carboidratos (g) 289 ± 76,2 267,1 (196,4-396,9) 321,29 ± 62,5 322,3 (208,4-397,1) 0,38
Proteínas (g) 63,8 ± 18,9 66,8 (39,5-92,1) 80,4 ± 31,4 76,9 (40,2-140) 0,43
Lipídios (g) 80,3 ± 14,1 81,6 (60,2-106,6) 96,5 ± 39,3 81,8 (52,4-173,2) 0,92
Gordura saturada (g) 12,7 ± 1,7 13,1 (9,5-15) 13,8 ± 9,5 19 (9,1-28,9) 0,03
Gordura monoinsaturada (g) 10,3 ± 1,4 10,2 (8,1-11,9) 11,2 ± 1,0 11,3 (9,3-12,85) 0,04
Gordura polinsaturada (g) 12,1 ± 2,2 11,9 (9,4-15,7) 21,25 ± 9,3 17,1 (10,2-41,8) 0,00
Colesterol (mg) 154,7 ± 44,6 142,9 (94,8-231,7) 217,6 ± 37,5 221 (156-279,2) 0,01
Fibras (g) 11,1 ± 1,9 12,5 (9,1-14-6) 14,6 ± 1,6 14,8 (11,9-17,1) 0,01
Ferro (mg) 7,7 ± 1,8 7,4 (5,5-11,7) 8,37 ± 1,7 7,9 (6,1-12,2) 0,63
Cálcio (mg) 453,7 ± 236,4 449,8 (115,9-996,4) 511,6 ± 192,5 591,9 (162,4-698) 0,72
Ácido ascórbico (mg) 97,1 ± 54,6 81,9 (27,3-210,1) 118,3 ± 59,2 111,1 (23,2-258,1) 0,65
Retinol (mEq) 626,7 ± 151,1 581,9 (443,4-922,1) 563,4 ± 220,3 593,8 (227,6-950,6) 0,19
Vitamina E (mg) 3,8 ± 1,8 4,4 (1,2-6,5) 5,5 ± 1,4 5,1 (2,9-7,3) 0,18
Zinco (mg) 8,7 ± 3,5 9,9 (2,8-13,1) 9,9 ± 3,7 12,1 (4-13,7) 0,86
Selênio (µg) 53,5 ± 15,3 57,1 (22,1-75,5) 58,7 ± 24,1 62,6 (10,1-85,4) 0,81
* Teste de Mann Whitney considerando o nível de significância inferior a 0,05.
Os escores referentes ao item de deglutição, avaliado segundo a escala ALSFRS-R,
foram diferentes levando em consideração a predominância da doença, bulbar ou
apendicular. No grupo bulbar, os escores foram inferiores (p=0,046) quando comparados ao
grupo apendicular. Os escores variaram de 3 a 4 e de 1 a 3 para os pacientes com
predominância apendicular e bulbar, respectivamente.
Discussão
Avaliando a freqüência de consumo de cereais, feijão e hortaliças do grupo III,
observou-se que os alimentos mais ingeridos diariamente foram arroz (96%), feijão (91%) e
pão francês (74%), sendo o macarrão (99%) e batata inglesa (99%) os mais consumidos

66
semanalmente (Tabela 2). A batata-baroa e inhame foram os menos consumidos, sendo que
64% e 61%, respectivamente, relataram consumi-los raramente.
Verificou-se baixo consumo diário de frutas. Entretanto, o suco de laranja natural
foi consumido por 78% dos pacientes, diariamente. A maioria (64%) adicionava o
suplemento hipercalórico de marca comercial ao suco de laranja, resultando em uma
preparação mais espessa, o que facilitava o processo de deglutição. O principal motivo
relatado para o baixo consumo de frutas foi o preço. As frutas mais consumidas
semanalmente foram a banana (83%) e o mamão (83%) (Tabela 2), principalmente em
função da consistência que facilitava seu consumo “in natura” ou como espessante de
outras preparações. O mamão, em 24% dos casos, era usado como espessante de água
inclusive, para facilitar o processo de deglutição comprometido pela disfagia.
Analisando o consumo de hortaliças do grupo I e II, notou-se que as mais
consumidas semanalmente foram cenoura (97%) e abóbora (60%) (Tabela 2), na maioria
das vezes (92%) cozidas, também por facilitarem a obtenção de preparações com
consistências diversas. A hortaliça mais citada como raramente consumidas foi o pepino
(61%), que segundo relatos, era de maior dificuldade de deglutição.
Folhosos eram consumidos esporadicamente. Em 22% dos pacientes estes
alimentos foram retirados da alimentação, corroborando com Yorkston et al. 200433, que
mostraram a exclusão de alimentos de maior dificuldade de deglutição de acordo com a
classificação da disfagia. Mesmo naqueles que não apresentavam queixas de disfagia, foi
observado baixo consumo de folhosos.
O consumo diário de leite foi relatado por 96% dos pacientes (Tabela 2). No
entanto, 82% dos indivíduos relataram consumir 1 copo americano (200 mL) de leite/dia. O
queijo foi consumido semanalmente por 35% dos pacientes, sendo o preço o fator limitante.
67
Quanto ao consumo de gorduras e óleos, 100% dos avaliados utilizavam
diariamente o óleo vegetal (Tabela 2), prevalecendo o óleo de soja (96%). A margarina
vegetal foi diariamente utilizada por 30% dos pacientes. A manteiga foi citada como de uso
mensal e consumida por 83% dos pacientes. O azeite de oliva foi citado como raramente
consumido.
Do grupo das carnes e ovos, os mais consumidos semanalmente foram os ovos
(83%), seguidos do frango (74%) e da carne bovina (65%) (Tabela 2). Grande parte dos
pacientes ou cuidadores (92%), pela limitação motora da doença, relatou maior facilidade
na utilização de frango e ovos como fontes de proteína. Oitenta e sete por cento dos
pacientes consumiam o peixe e a carne suína em freqüência mensal. As vísceras foram
citadas como raramente consumidas por 93% dos indivíduos.
De acordo com o relato dos pacientes, o consumo de carnes, frutas e embutidos são
os mais raros devido a limitações financeiras.
O refrigerante foi citado como de consumo semanal por 61% dos pacientes.
Verificou-se que 74% dos indivíduos relataram que sua ingestão estava ligada ao “prazer”
que esta bebida lhes proporcionava. Digno de nota é que, muitas vezes, a ingestão de
líquidos não era segura, devido a disfagia a líquidos, principalmente em função da baixa
viscosidade desses produtos (aproximadamente 10 centpoise-cP). No entanto, Bülow et
al.34 demonstraram que as bebidas carbonatadas podem melhorar o trânsito oral e faríngeo,
pela elevação laríngea, diminuindo a incidência de aspiração pulmonar. Como medida de
segurança, todos os alimentos ou formulações com viscosidade inferior a 50cP devem ser
excluídos ou modificados, no que diz respeito à viscosidade, quando constatado que o
paciente apresenta alterações na deglutição, principalmente a líquidos ralos12.
Tendo-se como referência o valor mediano do VET para os homens, foi observada
maior freqüência de inadequação alimentar (42%) com valores abaixo da RDA, enquanto

68
que as mulheres (75%) apresentaram valores acima. Nau35 em seu estudo, utilizando
também o recordatório de 24 horas, verificou que 87% dos pacientes tinham consumo
alimentar adequado, segundo a RDA de 1989, com ingestão alimentar em torno de 2100
kcal. Em contraste, Slowie5 avaliando a ingestão alimentar de 20 pacientes de ELA
ambulatoriais, encontrou ingestão energética em torno de 2000 kcal para homens (83% da
RDA), e ingestão média de 1200 kcal, para mulheres (67% da RDA).
No que se refere à ingestão de macronutrientes foi observada maior freqüência de
adequação para proteínas (78%), lipídios (56%) e carboidratos (48%) (Tabela 3). É
importante ressaltar que mesmo com 78% de adequação, a ingestão de proteínas está bem
próxima ao limite inferior. Além disso, a proveniência de fontes vegetais, principalmente,
pode limitar sua biodisponibilidade.
Em relação à ingestão de energia, Kasarskis et al.7 estudaram 16 pacientes com
ELA, verificando que 6% dos indivíduos excederam a RDA, enquanto que 70% estavam
abaixo da RDA, diferentemente do presente estudo. Em relação à ingestão de proteínas, os
mesmos autores encontraram valores acima da RDA para 84% dos pacientes. Stanich et al.8
verificaram valores acima da RDA para lipídios na maioria dos pacientes com ELA.
Quando a ingestão de macronutrientes foi avaliada conforme a predominância da
doença, se apendicular ou bulbar, foi possível notar diferenças significativas na ingestão
energética (Tabela 4), de fibras e frações lipídicas. É comum em pacientes com
predominância bulbar da ELA, alterações na deglutição, o que pode limitar a ingestão
energética4. Já a ingestão de fibra foi baixa nas duas formas de manifestação da doença
(Tabela 4), no entanto, naqueles com deficiência bulbar houve relativamente menor
ingestão. O fato pode ser explicado pelas limitações quanto à ingestão de fontes alimentares
de fibra, que geralmente são de mais difícil deglutição nesses pacientes. A baixa ingestão
de alimentos fonte de fibra foi relatada por 64% desses pacientes e, pode estar relacionada

69
com o alto índice de constipação intestinal (64%) encontrado, observações também
relatadas em outro estudo36.
A maioria dos pacientes apresentou adequação de ingestão (Tabela 3) para vitamina
C, sendo o consumo de suco de laranja importante fonte da vitamina para os pacientes.
O estudo mostrou que todos os pacientes exibiram inadequação de ingesta para
vitamina E pela baixa ingestão de fontes alimentares da mesma. É comum na prática clínica
a utilização de suplementos de vitaminas, principalmente de vitamina E. Rio et al37
sugeriram que a suplementação com esta vitamina, em quantidade ainda não definida, possa
melhorar o perfil nutricional de indivíduos com ELA. A ingestão de vitamina E deve ser
encorajada e indicada, preferencialmente, através de fontes alimentares (azeite de oliva e
óleo de girassol).
Apesar do leite ser citado como de consumo diário, pôde-se observar que a
quantidade ingerida/dia foi em torno de 200 mL. Estes dados, associados à baixa ingestão
de seus derivados e a baixa ingestão de alimentos fonte de cálcio, podem estar relacionados
com a inadequação de ingesta desse nutriente, encontrada em 100 % dos pacientes.
Kasarskis e Neville38 sugeriram que indivíduos com ELA não são necessariamente
hipercatabólicos, mas com a progressão da doença, a demanda energética pode ser
aumentada. Dois conjuntos de fatores são de grande importância no que diz respeito à
ingestão alimentar de indivíduos com ELA, as disfunções apendiculares, limitando a
manipulação e preparo dos próprios alimentos; e, as disfunções bulbares, expressas
principalmente por disfagia, levando a modificação no padrão alimentar dos pacientes39.
Neste sentido alguns estudos5,7 sugeriram a existência de correlação entre a ingestão
calórica inadequada, e a perda de peso corporal em indivíduos com disfagia média a grave.
Estas alterações podem levar a desnutrição e desidratação.

70
Nutricionistas de experiência européia no tratamento da ELA, em situações de baixa
ingestão energética, geralmente utilizam suplementos hipercalóricos e protéicos como
forma de garantir a ingestão de macro e micronutrientes37. Os resultados apresentados no
estudo mostram que 62% dos pacientes relataram consumo diário de suplementos
hipercalóricos, no entanto, utilizados de forma inespecífica, seguindo as indicações do
rótulo. Também foi observado, com a utilização dos itens de deglutição da escala ALSFRS-
R, que 22% dos pacientes apresentavam disfagia, com dificuldade de obtenção da
consistência indicada pelo fonoaudiólogo. A nosso ver, o acompanhamento nutricional
individualizado é necessário para a adequação e orientação específica.
É importante ressaltar que dados de ingestão alimentar são utilizados para nortear os
cuidados nutricionais e gerais do paciente com ELA. A ingestão calórica inferior a 80% da
RDA pode resultar em perda de peso. Em situações nas quais a ingestão calórica é
insuficiente, a gastrostomia percutânea endoscópica tem sido uma alternativa de nutrição e,
geralmente indicada quando a porcentagem de perda de peso acima de 10%, há disfagia
média ou grave e a medida da capacidade vital forçada é menor que 50%33.
Estudos de diagnóstico alimentar na ELA, a exemplo do apresentado, permitem
conhecer os hábitos alimentares de determinada população e estimar a ingestão de
nutrientes, sendo úteis ao aconselhamento dietético mais eficaz, às orientações específicas e
seguras, contribuindo para o melhoramento da qualidade de vida dos pacientes. Para que as
orientações sejam implementadas são necessários trabalhos educativos com pacientes e/ou
cuidadores.
Conclusões
Na população do estudo, os alimentos mais consumidos diariamente foram óleo,
arroz, feijão, pão francês e leite. Constatou-se inadequação alimentar para energia, fibras,

71
cálcio e vitamina E. Observou-se diferença significativa entre pacientes com ELA de
predomínio bulbar e apendicular, sendo que em pacientes com maior manifestação
apendicular, houve maior ingestão energética (p=0,02), de gordura saturada (p=0,03),
monoinsaturada (p=0,04) e polinsaturada (p=0,001), além de colesterol (p=0,001) e fibras
(p=0,001), quando comparados com os de predominância bulbar. O maior
comprometimento na deglutição verificada nos pacientes com predominância bulbar pode
ter influenciado na ingestão qualitativa e quantitativa. Além das peculiaridades da doença
repercutir em alimentação, a renda per capita dos pacientes parece ter influenciado no
baixo consumo qualitativo de alimentos.
Com base nos resultados obtidos, estes pacientes devem ser orientados com relação
ao consumo de alimentos e preparações com maior conteúdo de proteínas de alto valor
biológico, fibras, cálcio e vitamina E.
Agradecimentos
Os autores agradecem ao CNPq – Conselho Nacional de Desenvolvimento
Científico e Tecnológico pela concessão de bolsa de doutorado (LBCS).
Referências bibliográficas
1. Tadan R, Bradley WG. Amyotrophic lateral sclerosis: Part 1. Clinical features,
pathology, and ethical issues in management. Ann Neurol 1985;18:271-80.
2. Tadan R, Bradley WG. Amyotrophic lateral sclerosis: Part 2. Etio-pathogenesis. Ann
Neurol 1985;18:419-31.
3. Rosen AD, Bradley WG. Amyotrophic lateral sclerosis. Clinical features and prognosis.
Arch Neurol 1978;35:638-42.

72
4. Nelson LM, Matkin C, Longstreth W T, Mcguire V. Population – based case – control
study of amyotrophic lateral sclerosis in Western Washington State. II. Diet. Am J
Epidemiol 2000;151:164-173.
5. Slowie LA, Paige MS, Antel JP. Nutritional considerations in the management of
patients with ALS. J Am Diet Assoc 1983; 83:44-7.
6. Welnetz K. Maintaining adequate nutrition and hydration in the dysphagic ALS patient. J
Contin Educ Nurs 1990;21:62-7.
7. Kasarskis E, Berryman S, Vanderleest JG, Schneider AR, McClain CJ. Nutritional status
of patients with amyotrophic lateral sclerosis: relation to the proximity of death. Am J
Clin Nutr 1996;63:130-7.
8. Stanich P, Pereira AML, Chiappeta ALML, Nunes M, Oliveira ASB, Gabbai AA.
Suplementação nutricional em pacientes com doença do neurônio motor/esclerose
lateral amiotrófica. Rev Bras de Nutri Clin 2004;19:70-8.
9. Silva LBC, Mourão L, Wolf A, Sordi M, França MJr, Nucci A, Amaya-Farfan J.
Amyotrophic Lateral Sclerosis (ALS): Nutritional profile and swallowing ability in
patients with dysphagia. Annual Dysphagia Research Society Meeting, Vancouver,
Canada, March 8-10, 2007 Vancouver, Canada. a
10. Silva LBC, Mourão L, Lima NMFV, Almeida SRM, França MJr, Nucci A, Amaya-
Farfan J. Amyotrophic lateral sclerosis: nutritional status and functional conditions.
Annual Dysphagia Research Society Meeting, Vancouver, Canada, March 8-10, 2007.
Vancouver, Canada. b
11. Ludolph AC. 135th ENMC International Workshop: Nutrition in amyotrophic lateral
sclerosis 18-20 of March 2005, Naarden, The Netherlands. Neuromuscular Disorders
2006:1-9.
12. Souza BBA, Martins C, Campos DJ, Balsini ID, Meyer LR. Nutrição e Disfagia: Guia
para profissionais. Curitiba, PR, Brasil: Nutroclínica, 2003.

73
13. El Escorial revisited: Revisited criteria for the diagnosis of ALS.-World Federation of
Neurology research group on motor diseases. A consensus conference held at Airlie
House, Worrenton, 1998; Virginia on April 2-4.
14. Fisberg RM, Martini LA, Slater B. Métodos de Inquéritos Alimentares. In: Fisberg RM,
Slater B, Marchioni DML, Martini LA, editores. Inquéritos Alimentares: Métodos e
bases científicos. São Paulo: Manole, 2005. p 2-7.
15. Diet Pro, versão 4.0: Sistema de suporte à avaliação nutricional e prescrição de dietas.
Monteiro JBR, Esteves EA. Agromídia Software, 2001. CD-ROM
16. Philippi ST. Tabela de composição de alimentos: suporte para decisão nutricional.
Brasília, 2001. p.133.
17. Tabela Brasileira de Composição de Alimentos/NEPA-UNICAMP-Versão II-2ºed-
Campinas: NEPA-UNICAMP, 2006. p.113.
18. U. S. DEPARTAMENT OF AGRICULTURE. 2003. Composition of Foods. Raw,
Processed, Prepared USDA National Nutrient Database for Standard Reference.
Release 16. Nutrient Data Laboratory homepage. Disponível em
<http://www.nal.usda.gov/fnic/foodcomp/Data/SR18/SR18_doc.pdf>.
19. National Research Council (US). Recommended dietary allowances. Washington:
National Academic Press; 1989.
20. Vannucchi H, Menezes EW, Campana AO, Lajolo FM. Aplicações das recomendações
adaptadas à população brasileira. Ribeirão Preto, editora Legis Suma, 1990.
21. Institute of Medicine. In: Dietary Reference Intakes for calcium, phosphorous,
magnesium, vitamin D, and fluoride. Washington, D.C.: The National Academy Press,
1997. Disponível em: <http://www.nap.edu>.
22. Institute of Medicine. In: Dietary Reference Intakes for vitamin C, vitamin E, selenium,
and carotenoids. Washington, D.C.: The National Academy Press, 2000. Disponível
em: <http://www.nap.edu>.

74
23. Institute of Medicine. In: Dietary Reference Intakes for vitamin A, vitamin K, arsenic,
boron, chromium, copper, iodine, iron, manganese, molybdenum, nickel, silicon,
vanadium, and zinc (2001). Washington, D.C.: The National Academy Press, 2001.
Disponível em: <http://www.nap.edu>.
24. Institute of Medicine. Energy. In: Dietary Reference Intakes for energy, carbohydrate,
fiber, fatty acids, cholesterol, protein, and amino acids. Washington, D.C.: The National
Academy Press, 2002. Disponível em: <http://www.nap.edu>.
25. Harris JA, Benedict FG. A biometric study of basal metabolism in man. Washington,
DC: Carnegie Istitute of Washington, 1919.
26. Long CL, Schaffel N, Geiger JW. Metabolic response to injury and illness: Estimation
of energy and protein needs from indirect calorimetry and nitrogen balance. JPEN
1979; 3:452-456.
27. Piquet MA. Nutritional Approach for patients with amyotrophic lateral sclerosis. Rev
Neulol 2006; 2 (suppl4):S177-4S187.
28. Cintra IP, Heyde MED, Schmitz BAS, Franceschini SCC, Sigulem DM. Métodos de
inquéritos dietéticos. Cad Nutrição 1997;13:11-23.
29. Brasil. Ministério da Saúde. Guia alimentar para a população brasileira: Promovendo a
alimentação saudável. Brasília, 2006. p.189.
30. Dean AG, Dean JA, Coulombier D, Brendel KA, Smith DC, Burton AH, et al. Epi Info,
Version 6.04: A word-processing, database, and statistics program for public health on
IBM-compatible microcomputers. Atlanta: Centers for Disease Control and Prevention,
1997.
31. Cedarbaum JM, Stambler N, Malta E, Fuller C, Hilt D, Thurmond B. The ALSFRS-R: a
revised ALS functional rating scale that incorporates assessments of respiratory
function. BDNF ALS Study Group (Phase III). Journal Neurol Sci 1999;169:13-21.
32. Norussis M J. Statistical Package for Social Science (SPSS) for Windows Advanced
Statistics Release 15.0. Chicago: SPSS;2006.

75
33. Yorkston KM, Miller RM, Strand EA. Management of speech and swallowing in
degenerative diseases. Texas:Pro-Ed., 2006. p.265.
34. Bülow M, Olsson RO. Ekberg.Videoradiographic Analysis of How Carbonated Thin
Liquids and Thickened Liquids Affect the Physiology of Swallowing in Subjects with
Aspiration on Thin Liquids. Acta Radiol 2003;44:366–372.
35. NAU KL. Individuals with amyotrofic lateral sclerosis are in caloric balance despite
losses in mass. J Neurol Science 1995;192 (suppl):S47-S49.
36. Borasio GD, Voltz R. Palliative care in amyotrophic lateral sclerosis. J Neurol
1997;244 (suppl4):S11-S7.
37. Rio A, Cawadias E. Nutritional advice and treatment by dietitians to patients with
amyotrophic latera sclerosis/motor neurone disease: a survey of current practice in
England, Wales, Northern Ireland and Canada. J Hum Nutr Diet 2007;20:1-13.
38. Karsarkis EJ, Neville HE. Management of ALS. Neurology 1996;47(Suppl):S118-
S120.
39. Silani V, Karsarkis EJ. Yanagisawa N. Nutritional management in amyotrophic lateral
sclerosis: a worldwide perspective. J Neurology 1998;243(2 Suppl):S13-S19.

76
_______________________________________________________________Artigo II
“Milk whey proteins for use in oral nutritional therapy for amyotrophic lateral sclerosis patients”
5

77
MILK WHEY PROTEINS FOR USE IN ORAL NUTRITIONAL THER APY
FOR AMYOTROPHIC LATERAL SCLEROSIS PATIENTS
Luciano Bruno de Carvalho Silva
Fernanda Zaratini Vissotto
Jaime Amaya-Farfán
Artigo a ser submetido à revista International Dairy Journal

78
Milk whey proteins for use in oral nutritional ther apy for amyotrophic lateral sclerosis patients
Luciano Bruno de Carvalho Silva*, Fernanda Zaratini Vissotto, Jaime Amaya-Farfán
State University of Campinas, Faculty of Food Engineering, Campinas, SP, Brazil
* To whom correspondence should be sent: Monteiro Lobato Street 80 – CEP 13083-862. Universidade Estadual de Campinas, SP, Brazil. Tel: 55-19-35214059, Fax: 55-19-35214060. E-mail: [email protected].
Abstract
Agglomerates based on milk whey proteins and modified starch were developed for
amyotrophic lateral sclerosis (ALS) patients, aimed at adjusting the viscosity of different
food systems. Modified starch (MS), calcium caseinate (CaCas), whey protein isolate
(WPI), concentrate (WPC) and hydrolysate (WPH) were used. After characterisation, the
sources were agglomerated with the carbohydrate and an increase in the porosity of about
73% and also in the viscosity of the agglomerates were observed. In all the systems
evaluated, the WPI agglomerate at a concentration of 112g/L showed a viscosity between
2,122 and 5,110cP, and the agglomerates of WPC and WPH between 1,115-2,880cP and
6651-2,600cP, respectively. CaCas exhibited high values in water and milk of 3,200cP and
6,651cP, respectively, and low values of 640cP in orange juice. In the sensory tests, the
70% WPI:30%MS agglomerate in orange juice obtained the highest score, 6.97 (± 0.15), in
relation to the other agglomerates, not differing (p=0.681) from the commercial thickener,
6.91 (p=0.380). Based on these results, the agglomerate 70%WPI:30%MS was suggested
for use in the nutritional therapy of patients with ALS.
Keywords: amyotrophic lateral sclerosis, dysphagia, viscosity, supplementation, milk
whey proteins, malnutrition.
79
1. Introduction
The term “amyotrophic” comes from the Greek, where a signifies “without” or
“non”; myo refers to “muscle”; and trophic to “nutrition”. Thus amyotrophic signifies
“without muscle nutrition”. When a muscle is not nourished, it atrophies or suffers
emaciation. Lateral identifies the areas of the spinal marrow where parts of the nerve cells
that nourish the muscles are located. As this area undergoes degeneration, scarring,
hardening or sclerosis will occur in the region.
Also known as Lou Gehrig’s disease, amyotrophic lateral sclerosis (ALS) is
characterised by progressive paralysis, secondary to the compromise of the motor neurons,
upper motor neuron and lower motor neuron. In the more advanced stages of the disease,
decreases in respiratory muscle strength, progressive losses of body weight and muscle
mass and dysphagia or difficulty in swallowing are observed (Nelson et al., 2000).
According to the United States National Health Institute, ALS is diagnosed in
approximately 5,000 people per year. In Brazil, according to the data of the Brazilian ALS
Association, “abrELA”, the incidence of the disease is 1.5 cases/million inhabitants, or
2,500 patients per year (Bradley, 2007).
In approximately 50% of the patients, the disease first affects the arms, in 25% the
legs and in 25% the onset is bulbar. The bulbar dysfunction is defined as the paralysis or
weakness of the muscles controlling swallowing and speaking, as also the movements of
the jawbone, lips and tongue, signifying that the voice and swallowing will be affected first,
possibly leading to dysphagia. However, independent of the type of initial manifestation,
with the progression of the disease, the individual will present difficulty in swallowing.
The progressive muscle atrophy may mask the increase in metabolic demand, since
metabolic energy is channelled to maintain pulmonary ventilation, thus justifying the

80
increase in basal energy expended by ALS patients (Shimizu, et al., 1991; Nau et al., 1995;
Stanich et al., 2004; Silva et al., 2007a).
In a study carried out with patients suffering from ALS, a mean calorie ingestion of
2,100 kcal was observed, varying from 1,150 to 3,300 kcal, values below the recommended
daily values (FAO/WHO, 1985 for neurologically compromised individuals). Silva et al.
(2007b), analysing the body mass index (BMI) and caloric ingestion by patients with ALS,
found a BMI below 18 g/m2 (malnutrition) and caloric ingestion between 1350 and 2050
kcal in 46% of the patients (Almeida et al., 2007). Low protein ingestion was observed as
compared to the other macronutrients (ADA, 1996; Nardurkar et al., 2004).
In patients with ALS, progression of the degree of dysphagia makes it difficult to
maintain oral feeding, increases respiratory complications with the start of invasive
ventilation, makes locomotion difficult for the patient to attend outpatients departments and
stimulates depression (Mazzini et al., 1995). Nevertheless the use of alternative means of
nutrition can result in metabolic alterations and a decrease in the quality of life of these
individuals.
Many of the nutritional complications that occur with ALS sufferers are due to the
low viscosity of the diet. Fluid liquids are difficult to swallow by patients with reduced
deglutition control. This happens because such liquids can be swallowed very quickly and
do not maintain any defined shape in the oral cavity. Thus part of the liquid food may
penetrate the airways, which are still open, resulting in broncho-aspiration and aspiration
pneumonia, worsening the nutritional state of the patient and with the progression of the
disease, leading to dehydration. Proper thickening of the foods can minimise such inter-
occurrences (Souza et al., 2003).
In this context and aiming to optimise the nutritional care of ALS sufferers, the
American guide “National Dysphagia Diet: Standardization for Optimal Care” established

81
standards and limits for the variation in viscosity, with the objective of making the diet
adequate for patients with compromised swallowing capacity. Such standards and limits do
not necessarily represent the expected variation, but serve as a basis for discussion and for
an analysis of the prescribed diet. These values are classified in centipoisess (cP) as “thin”
(1-50 cP – water), “nectar” (51-350 cP – mango juice), “honey” (351-1750 cP) and
“pudding” (> 1750 cP) (ADA, 2002).
Different brands of modified starches have been indicated for use in the diets of
individuals with difficulty in swallowing, such as Thick & Easy (Hormel
HealthLabs/Fresenius), Resourse Thicken Up (Novartis) and Nutilis (Nutrícia/Support).
All of these products are exclusively carbohydrate.
Ingredients such as milk whey proteins, when chemically or physically modified,
can alter the viscosity of food systems. However, on their own, they are unable to reach the
viscosity standardised by the ADA (2002) for fluids, but agglomerated with carbohydrate
sources such as modified starch, they could increase the viscosity of food systems to values
close to those cited by the ADA.
Based on the high malnutrition indices and difficulty in nutritional handling of ALS
patients, the main objective of this study was to develop and sensory test a protein
supplement based on milk whey proteins and modified starch, with adequate thickening
capacity, for nutritional therapy in ALS patients.
82
2. Materials & Methods
2.1. Raw material
Whey protein isolate (WPI), concentrate (WPC) and hydrolysate (WPH) from Glanbia
Foods Inc. (Monroe, Wisconsin, USA) were used, donated by the Integral Medicine
Teaching and Research Institute, São Paulo, Brazil; calcium caseinate (CaCas) and
modified starch (Thick & Easy – Hormel Health Labs).
2.2. Proximate composition of the protein sources
The moisture, total solids, ash and protein contents were determined according to
AOAC (1990). Total lipids were determined according to Bligh & Dyer (1959), and total
carbohydrates were estimated by difference, subtracting the sum of the values obtained in
the other determinations from 100%.
2.3. Determination of the degree of hydrolysis
The degree of hydrolysis (DH) was determined based on the Adler-Niessen (1979)
method, which consists of the spectrophotometric measurement of the chromophore formed
in the reaction between trinitrobenzene sulphonic acid (TNBS) and amino groups, under
alkaline conditions. After 1 hour of incubation, the reaction was interrupted by lowering the
pH with 0.1M HCl. The sample was dispersed in sodium dodecyl sulphate (SDS) and the
reaction occurred in 0.2125 M phosphate buffer, pH 8.2 L-leucine (0 to 2.0 mM) was used
as the standard and the readings made at 340 nm.
2.4. Solubility of the protein sources
The protein solubility (% PS) was determined according to the method of Morr et
al., (1985). The effects of pH (2.5 to 7.5) were studied for all the protein sources: WPI,
WPC, CaCas and WPH.

83
2.5. Determination of total amino acids
The total amino acids were determined by reversed phase liquid chromatography
(Hagen et al, 1989) after a 24 h acid hydrolysis step, in 20% HCl plus phenol, followed by
derivatization with phenylisothiocyanate.
2.6. Agglomerate production
Formulations
Different concentrations of modified starch, calcium caseinate and milk whey
protein isolate, concentrate and hydrolysate were used.
Preliminary physicochemical tests were carried out using modified starch as the
standard. Concentrations varying from 10 to 50% protein plus modified starch were tested
and evaluated for their viscosity profile. The formulation showing a viscosity closest to that
of the commercial thickener was submitted to the process of agglomeration. The
formulation selected for this study was 70% protein:30% modified starch.
2.7. Agglomeration process
Agglomeration of the formulations was carried out using a pilot plant scale model
RCR instantiser (capacity of 5 kg) from ICF Industrie S.p.a. (Maranello-MO, Italy).
The following parameters were used for agglomeration: round 1.5 µm mesh grill,
with 50% opening and a rotary dryer at 95 ºC with a vapour pressure of 2 bar. After
agglomeration and cooling, the products were packed into 500 g packages and stored at a
temperature of approximately 10 ºC.
2.8. Granulometric distribution
The particle size distribution of the protein sources and agglomerated products was
determined using the vibratory Granutest equipment vibrating for 5 minutes with the 150,

84
250, 350 and 500 µm sieves. The amounts retained on each sieve were weighed and
expressed as percentages.
2.9. Water activity of the agglomerated products
This was determined according to AOAC (1990) at zero time (for samples at room
temperature). A portable pawkit, model 950 NE from Decagon® was used for the
measurements. The equipment was calibrated using saturated solutions of magnesium and
lithium chlorides (water activities of 0.1-0.4) and potassium sulphate (water activity of
0.975). The measurements were made in duplicate at room temperature (25.5 ºC).
2.10. Water absorption capacity
The water absorption capacity of the protein sources and agglomerated products was
measured in triplicate using the method proposed by Baumann (1996) and by Torgensen &
Toledo (1977). This technique consists of using a horizontal capillary connected to a
Buchner funnel by flexible tubing. 100 g-samples were placed on a Whatman nº 1 filter
paper, and the water absorbed at equilibrium expressed as the mLs of water absorbed/g of
protein.
2.11. Bulk density
This was determined in triplicate, based on the definition: the mass of particles
occupying a defined volume. The analysis consists of standardising the product
distribution, based on the volume it occupies (Peleg, 1983), placing 3 g of sample in a 25
mL graduated cylinder with the help of a funnel, thus standardising the distribution and
minimising the effects of agglomerate compacting.
2.12. Particle density
This was determined in triplicate using the pycnometer recommended by Pomeranz
& Meloan (1994), with toluene as the inert liquid (p=0.866 g.cm-3).

85
2.13. Porosity
The porosity (%P) of the protein sources and agglomerated products was
determined according to Peleg (1983).
2.14. Viscosity
The apparent viscosities (η) were determined in a Brookfield DV – III rheometer
with a shear rate of 30 rpm (similar to that obtained in the processes of chewing and
swallowing a food), using 30 s reading time and spindles 16, 18 and 31, the results being
expressed in centipoises (cP). Protein concentrations of 18 and 28 g were used for women
and men respectively, representing 30% of the individual’s needs. The protein sources or
agglomerates were added to the following food systems: water, whole UHT milk and
commercial orange juice (pH 4.0 and 1.5% total solids). The viscosity was determined in
triplicate at 25 ºC.
2.15. Analysis of preference of the foods containing added agglomerates
Two samples were used: control (juice/milk + commercial thickener) and
experimental (juice/milk + agglomerated products), 18 g and 28 g for women and men,
respectively. The samples were served to the panellist (patients) individually in a monadic
way and balanced order, using 50 mL disposable plastic cups coded with 3 digit algorithms.
The participation of the 30 patients in the test was voluntary after agreeing to take part and
freely signing a consent form. A 9-cm structured hedonic scale was used (Meilgaard et al.,
1999). The protocol was approved by the Ethics Committee (n° 428/2006) of the State
University of Campinas School of Medicine.

86
2.16. Statistical analyses
All the results were analyzed by multivariate analysis of variance and the differences
amongst the means by Tukey’s test. The software used was “Statistica-Basic Statistics and
Tables” and “SPSS for windows 15.1”.
3. Results & Discussion
3.1. Proximate composition of the protein sources
With the exception of WPC, all the materials used presented a protein concentration
above 80% (Table 1). There was no significant difference in protein content between WPI
and WPH. The sample with the lowest protein concentration was WPC. With respect to the
lipid content, WPC showed the highest values and there was no significant difference
(p=0.835) between WPI and WPH or between CaCas and WPH. For the ash content, there
was a significant difference between WPI and WPC (p=0.7110); WPI and CaCas
(p=0.673); and between WPC and CaCas (p=0.742). With respect to moisture content, there
was no significant difference (p=0.0613) between the samples CaCas and WPH, but WPI
and WPC were statistically different from the other samples. WPC showed the highest
carbohydrate content and WPI the lowest. WPI is obtained by removing the carbohydrates,
lipids and salts from WPC. For this reason, the WPI showed a higher protein concentration
and lower carbohydrate and ash contents.
Table 1. Proximate composition of the protein sources: isolate (WPI), concentrate (WPC) and
hydrolysate (WPH) milk whey protein and calcium caseinate (CasCa).
Sources Protein (%) 1.2.3 Fat (%) 1.2.3 Ash (%) 1.2.3 Water (%) 1.2.3 Carboidrate (%) 2.4
WPI 92.94 ± 0.01 a 0.57 ± 0.02 b 1.58 ± 0.69 ab 4.69 ± 0.03 c 0.22
WPC 77.30 ± 0.43 c 0.70 ± 0.03 a 2.15 ± 0.33 a 6.36 ± 0.01 a 13.49
CasCa 89.31 ± 0.11 b 0.45 ± 0.02 c 1.74 ± 0.31 a 5.25 ± 0.02 b 3.25
WPH 92.38 ± 0.06 a 0.51 ± 0.03 bc 1.39 ± 0.88 b 5.16 ± 0.08 b 0.56 1 Values correspond to means (± SD) of three determinations.2 Values expressed in dry basis. 3 Values not sharing similar letter in the same column are different (p < 0.05) in Tukey test. 4 Calculated by difference = 100 – (protein + total fat + ash + water).

87
3.2. Determination of the degree of hydrolysis
The DH found was 10.11 mM.g-1, classified as a protein source of medium degree
of hydrolysis (7 to 15 mM.g-1).
3.3. Solubility of the protein sources
Milk whey protein concentrates and isolates show good solubility throughout a wide
range of pH values, temperatures, protein concentrations, water activities and ionic
strengths (Huffman, 1996). Thus this property was shown to be stable in the various pH
ranges applied. With CaCas a decrease in solubility was found at pH values close to the
isoelectric point (pH 4.6) as shown in Table 2.
Table 2. Solubility of the protein sources: isolate (WPI), concentrate (WPC) and hydrolysate
(WPH) milk whey protein and calcium caseinate (CasCa) at 25 °C.
pH WPI 1.2 WPC 1.2 CasCa 1.2 WPH 1.2
2.5 71.01 ± 1.12 Da 71.56 ± 1.45 Ca 86.47 ± 0.94 Aa 71.41 ± 1.03 Ab
3.5 82.68 ± 0.45 Aa 80.93 ± 0.53 Aa 73.06 ± 0.31 Cb 58.29 ± 0.31 Bc
4.5 77.94 ± 0.34 Ca 77.54 ± 0.11 Ba 1.82 ± 0.21 Fb 58.11 ± 0.14 Bb
5.5 80.63 ± 0.12 Ba 80.71 ± 0.28 Aa 38.51 ± 0.47 Eb 35.03 ± 0.29 Db
6.5 80.56 ± 0.65 Ba 81.18 ± 0.56 Aa 56.45 ± 0.71 Db 45.39 ± 0.61 Cc
7.5 80.27 ± 0.16 Ba 79.88 ± 0.72 Aa 80.84 ± 0.03 Ba 71.06 ± 0.85 Ab
1 Values correspond to means (± SD) of three determinations. 2 Values sharing similar capital letter in the same column and minuscule letter in the same line are not different (p > 0.05) in Tukey test.
In foods, protein solubility is affected by the pH, ionic strength, temperature, solvent
polarity, isolation method, processing conditions, interactions with other components and
mechanical treatments (Vojdani, 1996). These factors affect the solubility of the proteins,
mainly causing alterations in the hydrophilic and hydrophobic interactions of the surface
groups of the protein with the solvent (Damodaram, 1996).

88
According to Morr & Ha (1993), whey proteins remain soluble around their
isoelectric point (pI), that is, in the pH range between 4 and 5, or, according to Giese
(1994), between 4 and 6. In the pH range between 4 and 6 no decrease in the values for
solubility was found for the sources WPC and WPI.
3.4. Total amino acid contents of the protein sources
The protein sources used present amino acid compositions that attend all the
recommendations for essential amino acids based on the Institute of Medicine standard
(IOM, 2002) for all stages of life (Table 3).
Table 3. Total amino acids (g per 100 g of protein) of the protein sources: isolate (WPI),
concentrate (WPC) and hydrolysate (WPH) milk whey protein and calcium caseinate (CasCa),
compared to reference IOM (2002).
Amino acids
(g/100g of protein)
IOM2-2002
Pre-school1
IOM2-2002
Adults1
WPI
WPC
CasCa
WPH
Threonine
Methionine + Cistine
Valine
Leucine
Isoleucine
Phenylalanine + Tyrosine
Lysine
Histidine
Trytophan
2.7
2.5
3.2
5.5
2.5
4.7
5.1
1.8
0.8
2.4
2.3
2.9
5.2
2.3
4.1
4.7
1.7
6.0
6.06
5.05
5.20
14.24
5.57
8.69
10.06
1.76
*
5.76
2.84
4.38
8.92
4.43
5.47
6.35
1.47
*
4.31
4.68
5.36
9.24
4.24
9.57
6.74
3.06
*
6.56
4.59
4.94
10.66
6.24
6.34
8.87
1.37
*
1Values based on EAR (estimated average requirement): EAR amino acids/EAR protein; Children (1 to 3 years) EAR protein = 0.88 g/kg/day; adults (> 18 years). EAR protein = 0.66 g/kg/day. 2 IOM: Institute of Medicine. * Amino acid not determinated.
According to De Kruif & Holt (2003), caseins have a high (35-45%) apolar amino
acid content (Val, Leu, Ile, Phe, Tyr, Pro) and a low sulphur amino acid content, which
limits their biological value. Nevertheless, as can be seen in Table 3, the essential amino

89
acid content of all the samples studied was in agreement with the IOM (2002) reference
standard.
Due to the profile presented by the milk whey proteins, they can be recommended
for the formulation of various special products such as infant formulas (Hambraceus, 1982),
and for muscle metabolism performance, due to the high content of branched chain
essential amino acids such as leucine and isoleucine (Steele & Harper, 1990). These
peculiarities are extremely important for ALS patients, due to their hypermetabolism and
progressive loss of lean mass with the clinical evolution of the disease.
3.5. Agglomeration process yield
The agglomeration process yield was 94.36, 94.53, 93.86 and 92.32% for WPI,
WPC, CaCas and WPH, respectively.
3.6. Granulometric distribution
Before the agglomeration process, the milk whey and casein protein sources
presented more than 90% of their particles retained on sieves with mesh below 150µm, a
size characteristic of spray dried products (Table 4).
The agglomerates WPI, WPC and WPH mostly presented particles smaller than 250
µm, although with an expressive increase in the diameter of the particles above 500 µm,
generally of 40%. The majority of the CaCas particles were larger than 500 µm. WPH
showed the smallest particles, justified by the smaller granulometry found in the
granulometric distribution of the protein sources presented in Table 4.

90
Table 4. Granulometric distribution of the protein sources and agglomerate: isolate (WPI),
concentrate (WPC) and hydrolysate (WPH) milk whey protein and calcium caseinate (CasCa) using
screen of <150, 250, 350 and 500 µm.
<150 µm 1.2 250 µm 1.2 350 µm 1.2 500 µm 1.2 Components Source Agglomerate Source Agglomerate Source Agglomerate Source Agglomerate
WPI 99.65 ± 0.3 a 42.57 ± 1.1 b 0.35 ± 0.9b 4.02 ± 1.4 a … 14.80 ± 1.2 a … 38.48 ± 0.7 b
WPC 98.48 ± 0.4 a 43.50 ± 0.7 b 1.52 ± 0.8 a 3.13 ± 0.4 a … 13.74 ± 1.8 a … 39.63 ± 0.4 b
CasCa 99.88 ± 0.5 a 42.45 ± 0.8 b 0.12 ± 0.9 b 4.07 ± 0.5 a … 9.86 ± 1.3 b … 43.62 ± 0.5 a
WPH 99.37 ± 0.6 a 46.84 ± 0.9 a 0.25 ± 0.9 b 3.86 ± 0.2 a … 9.82 ± 0.9 b … 39.48 ± 0.3 b
1 Values correspond to means (± SD) of three determinations. 2 Values not sharing similar letter in the same column are different (p < 0.05) in Tukey test.
3.7. Water activity
The water activity is defined as the ratio between the water vapour pressure in
equilibrium with a food and the vapour saturation pressure at the same temperature
(Fontana, 1998). It is a measurement used in the quality control of foods, including
powdered foods. In order to retard alterations in this type of product due to undesirable
changes such as the exponential growth of microorganisms, enzymatic reactions or
enzymatic browning, the value for aw should be below 0.6.
Table 5 shows the values for water activity of the agglomerated products. The
lowest values for aw were found in the WPH agglomerate and the values for aw increased
for all the agglomerates during the 30 days of storage.

91
Table 5. Water activity of the agglomerates: isolate (WPI), concentrate (WPC) and hydrolysate
(WPH) milk whey protein and calcium caseinate (CasCa) at initial time (T0) and final time, after
thirty days (T30), at 25°C.
aw (To) 1.2 aw (T30)
1.2 Agglomerates
Temp. 25º
WPI 0.24 ± 0.03 Ab 0.30 ± 0.01 Aa
WPC 0.25 ± 0.94 Ab 0.31 ± 0.10 Aa
CasCa 0.25 ± 0.03 Ab 0.31 ± 0.01 Aa
WPH 0.18 ± 0.06 Bb 0.23 ± 0.08 Ba
1 Values correspond to means (± SD) of three determinations. 2 Values sharing similar capital letter in the same column and minuscule letter in the same line are not different (p > 0.05) in Tukey test.
For all the agglomerates the values found for aw at the beginning of the study (T0)
for all the formulations developed, were within the values reported in the literature for
powdered (dehydrated) foods, which, by their very nature, present low aw values, generally
below 0.30 (Vitali & Quast, 1996). However at the end of this study (T30), the aw had
increased to approximately 0.30, suggesting that the packaging used did not present an
adequate barrier to water vapour, and that a packaging material showing greater protection
should therefore be used to store the agglomerated products.
3.8. Water absorption capacity of the protein sources and the agglomerates
The water absorption capacity of the protein sources varied from 1.82 to 6.11 mL
water absorbed/g protein. Table 6 presents the WAC values of the protein sources.

92
Table 6. Water absorption capacity (WAC) of the protein sources and agglomerate: isolate (WPI),
concentrate (WPC) and hydrolysate (WPH) milk whey protein and calcium caseinate (CasCa) at 25
°C during 30 minutes.
WAC (mL absorbed water /g protein) 1,2 Components
Source Agglomerates
WPI 1,82 ± 0,18 Db 4,02 ± 0,14 Da
WPC 3,77 ± 0,28 Bb 6,30 ± 0,23 Ba
CasCa 6,11 ± 0,10 Ab 8,17 ± 0,13 Aa
WPH 2,63 ± 0,09 Cb 5,15 ± 0,17 Ca
1 Values correspond to means (± SD) of three determinations. 2 Values sharing similar capital letter in the same column and minuscule letter in the same line are not different (p > 0.05) in Tukey test.
Of all the sources, CaCas showed the highest WAC values. No statistical differences
were observed between the WAC values of WPH and WPI (p=0.0712) or WPC (p=0.0604).
Nevertheless the samples WPI and WPC were statistically different (p=0.0021), WPI
showing the higher values.
These findings are in agreement with the literature, where the difference between
the WAC of protein sources has been attributed to protein denaturation. Protein sources
containing more denatured protein and showing decreased solubility, exhibited higher
WAC values (Arrese et al., 1991; Remondetto et al., 2001). This was clearly shown in the
case of the CaCas samples, which presented the lowest values for solubility (independent of
the isoelectric point) and highest values for WAC. Similar behaviour was shown by the
WPC samples which, when compared to WPI, showed higher WAC and lower solubility at
pH values of about 6.5, considering 5% probability.
The WAC values were shown to increase for all the products after the
agglomeration process, as can be seen in Table 6.

93
The agglomerate WPH did not differ statistically from the agglomerates WPI
(p=0.0860) and WPC (p=0.0968) with respect to WAC. However, the agglomerates WPI
and WPC were statistically different (p=0.0490). The CaCas based agglomerate showed the
highest values for WAC of all the products evaluated.
In part, the greater WAC observed for CaCas could be due to its granulometry, as
compared to the other agglomerates. Increases in granule size improve WAC. To the
contrary, products with very small granulometry (<125 µm) show reduced WAC, favouring
the formation of clusters on the surface or deposition of residues. Agglomeration results in
products with a porous structure that absorb liquids quicker, dissolving in an instantaneous
way (Aguilera et al., 1995; Masters, 1972).
The physical-chemical alterations occurring during agglomeration can alter the
WAC. One of the peculiarities of the agglomeration process is to moisten the fine particles
of the powder with vapour, such that the particles enter into contact or collide with each
other, forming porous agglomerates subsequently dried in hot air (Agilera et al., 1995).
Alterations in the protein conformation resulting from this process can affect the
thermodynamics of water binding by altering the availability of polar sites or hydration
sites. The transition of the compact globular conformation of the protein molecule to a
random conformation results in an increase in the available surface area and the exposition
of the peptides and lateral amino acid chains, previously hidden, which, in this way, could
increase the interaction with water (Kinsella, 1984).
3.9. Apparent density, particle density and porosity
The protein sources WPI and WPC were not statistically different from each other
(p=0.9315). The CaCas and WPH were significantly different (p=0.0324) from each other
and from the other protein sources (Table 7).

94
Table 7. Apparent density (ρap), particle density (ρpart) and porosity P(%) of the protein sources and
agglomerate: isolate (WPI), concentrate (WPC) and hydrolysate (WPH) milk whey protein and
calcium caseinate (CasCa).
ρap g.cm-3 1.2.3 ρpart g.cm-3 1.2.4 P (%) 1.2.5 Components Source Agglomerate Source Agglomerate Source Agglomerate
WPI 0.394 ± 0.042 Ba 0.344 ± 0.005 Bb 1.088 ± 0.006 Bb 1.334 ± 0.020 Ba 64.12 Bb 74.13 Ba
WPC 0.391 ± 0.018 Ba 0.341 ± 0.003 Bb 1.087 ± 0.003 Bb 1.332 ± 0.073 Ba 64.02 Bb 74.16 Ba
CasCa 0.366 ± 0.009 Ca 0.319 ± 0.036 Cb 1.085 ± 0.005 Bb 1.329 ± 0.037 Ba 66.27 Ab 75.27 Aa
WPH 0.413 ± 0.004 Aa 0.363 ± 0.012 Ab 1.093 ± 0.006 Ab 1.342 ± 0.001 Aa 62.21 Cb 74.89 Ca
1 Values correspond to means (± SD) of three determinations. 2 Similar letter in the same column are not different (p > 0.05) in Tukey test. 3 Similar letter in the same line referent to ρap are not different (p > 0.05) in Tukey test. 4 Similar letter in the same line referent to ρpart are not different (p > 0.05) in Tukey test. 5 Similar letter in the same line referent to %P are not different (p > 0.05) in Tukey test.
The apparent density depends on the intensity of the attractive forces between the
particles, the particle size and the number of points of contact. Powdered foods have
apparent densities between 0.3 and 0.8 g.cm-3. According to Peleg (1983), the ρap of
powdered milk whey is 0.52 g.cm-3, whilst for WPI with protein contents of 85%, this value
was 0.38 g.cm-3 (Barbosa-Cánovas & Juliano, 2005).
It can be seen that after agglomeration a significant difference was observed
between the protein sources (raw material) and the agglomerates, the differences found
between the samples of CaCas and WPH remaining (p=0.033).
The particle density (ρpart) reflects the existence of internal pores in the powder
granules, and is defined as the mean weight of the particles per unit volume, excluding the
volume occupied by interstitial air (Maia & Golgher, 1983). It is known as the
measurement of true density, and is important in situations where one must obtain the
relationship between the weight of the particles and the forces between them (Peleg, 1983;
Salazar, 1979).

95
As in the case of the values obtained in the analyses for ρap for the protein sources
and agglomerated products, the WPH showed higher values for ρpart for both the protein
sources and the agglomerates (Table 7).
According to Peleg (1983), the particle density of the majority of powdered foods is
between 1.4 and 1.5 g.cm-3, depending on the moisture content. However, for milk whey
products, the value for ρpart shown by Barbosa-Cánovas & Juliano (2005) was 1.0 g.cm-3,
corroborating with the present study. The results of the present study corroborate with the
papers cited, the variation being from 1.08 to 1.14 g.cm-3.
Porosity is a function of particle size, size distribution and form. The use of porosity
allows for and facilitates the treatment and comparisons between powdered foods that could
have different particle densities (Peleg, 1983).
As in the case of apparent density, the results for %P of the protein sources and
agglomerates showed significant differences between the %P of WPH and of CaCas
(p=0.092) and those of the other sources used. Amongst the agglomerates, the greatest %P
was found for the CaCas samples (Table 7).
The values found in the present study agree with those found by Peleg (1983), who
showed that powdered foods with ρpart of about 1.4 g.cm-3 showed internal, external or both
porosities between 40 and 80%.
The %P can be a parameter showing the efficiency of the agglomeration process.
The interstitial space shown, in an irregular array, by large particles, favours wettability
(ability of the powder to bind water on the surface), whereas small, symmetrical particles
show reduced interstices that hamper water penetration (Maia & Golgher, 1993; Masters,
1972; Salazar, 1979).

96
3.10. Apparent viscosity of the protein sources and agglomerated products
The viscosity of a food is one of the most important variables in swallowing. Thin
liquids make swallowing difficult for patients with reduced oral control, since they are
swallowed quickly and fail to maintain any form inside the oral cavity. Part of the liquid
food may slip prematurely to the pharynx and thus penetrate the still open airways, that is,
before swallowing actually occurs. To avoid this effect, the ideal viscosity for swallowing
to occur safely should be determined (Souza et al., 2003).
Considering the protein sources of different food systems as a base, and using
protein concentrations of 18 and 28 g, it can be seen that the sources WPI, WPC and WPH
showed similar behaviour in water and in milk. CaCas showed higher values in whole milk
and lower values in orange juice (Table 8).
Table 8. Apparent viscosity (η’), in centpoise (cP), of the protein sources: isolate (WPI),
concentrate (WPC) and hydrolysate (WPH) milk whey protein and calcium caseinate (CasCa) at the
concentration of 18 at 28 g in 250 mL of foods (water, whole milk and orange juice) at 25 °C.
η’ (cP) 1.2
Protein source Water Whole milk Orange juice
WPI 90.91± 0.18 Db 90.46 ± 0.37 Db 103.06 ± 0.67 Ba
WPC 5.38 ± 0.28 Fb 6.01 ± 0.53 Fb 11.30 ± 0.35 Fa
CasCa 114.4 ± 1.04 Cb 192.33 ± 0.34 Ba 20.29 ± 0.41 Dc [ ] 18 g of protein
WPH 5.30 ± 0.87 Fb 5.45 ± 0.65 Fb 10.90 ± 0.07 Fa
WPI 140.70 ± 0.61 Bb 140.46 ± 0.79 Cb 160.7 ± 0.52 Aa
WPC 10.11 ± 0.20 Ea 10.35 ± 0.45 Eb 18.60 ± 0.12 Ea
CasCa 181.5 ± 1.32 Ab 302.36 ± 0.47 Aa 32.15 ± 2.15 Cc [ ] 28 g of protein
WPH 10.14 ± 0.02 Ea 10.15 ± 0.03 Eb 18.25 ± 0.98 Ea
1 Values correspond to means (± SD) of three determinations. 2 Values sharing similar capital letter in the same column and minuscule letter in the same line are not different (p > 0.05) in Tukey test.
Considering the food system in water as the base, no differences of viscosity were
observed between WPC and WPH (p=0.961), the same being observed in milk (p=0.955)

97
and juice (p=0.738) at a concentration of 18 g of protein. Similar behaviour was observed at
a final concentration of 28 g of protein. As in water, the values found for CaCas in milk
were greater than the others. In orange juice, WPI showed the highest values and CaCas the
lowest (Table 8).
According to the standards established by ADA (2002), both for the use of 18 g
(recommended for female adult) and 28 g (recommended for a male adult), the protein
sources WPC and WPH were classified as thin liquids (1-50 centipoise – cP) in all the food
systems. CaCas was classified as nectar (51-350 cP) in water and milk, and in orange juice
this same source was classified as a thin liquid (1-50 cP – water). The low values for the
viscosity found with CaCas in the orange juice are related to the system pH of about 4.5,
close to the isoelectric point of the casein, which favours precipitation of these sources.
WPI was classified as a nectar in all the food systems.
After the agglomeration process, which was the main proposal of the present study,
it can be seen that the apparent viscosity increased for all the agglomerates (Table 9).
Table 9. Apparent viscosity (η’), in centpoise (cP), of the agglomerates: isolate (WPI), concentrate
(WPC) and hydrolysate (WPH) milk whey protein and calcium caseinate (CasCa) at the
concentration of 18 at 28 g in 250 mL of foods (water, whole milk and orange juice) at 25 °C.
η’ (cP) 1.2 Agglomerates
Water Whole milk Orange juice
WPI 1361.33 ± 1.10 Dc 2701.38 ± 1.50 Db 3283.31 ± 2.30 Ba
WPC 864.33 ± 1.15 Gb 850.57 ± 0.50 Fc 2850.00 ± 1.02 Da
CasCa 2051.67 ± 2.89 Cb 4273.33 ± 2.39 Ba 410.33 ± 0.58 Hc [ ] 18 g of protein
WPH 862.66 ± 1.53 Gb 854.00 ± 0.21 Fc 1851.00 ± 1.00 Fa
WPI 2122.66 ± 2.31 Bc 4001.32 ± 1.14 Cb 5110.66 ± 1.15 Aa
WPC 1115.00 ± 0.34 Eb 1018.18 ± 0.32 Eb 2980.73 ± 0.62 Ca
CasCa 3200.60 ± 0.58 Ab 6651.66 ± 1.53 Aa 640.16 ± 0.29 Gc [ ] 28 g of protein
WPH 988.00 ± 0.32 Fc 1017.00± 0.48 Eb 2600.00 ± 0.01 Ea
1 Values correspond to means (± SD) of three determinations. 2 Values sharing similar capital letter in the same column and minuscule letter in the same line are not different (p > 0.05) in Tukey test.

98
In relation to the behaviour of the agglomerates in the different systems, it can be
seen that those of WPI showed the highest values of viscosity in the orange juice. Those
from CaCas showed the highest values in milk and lowest in the orange juice.
Comparing the various agglomerates in a single system, with a final concentration
of 18 g protein in water, the highest values were found for CaCas and the lowest for WPI
and WPH. Similar behaviour was shown with a final concentration of 28 g of protein. In
milk the highest values were again found for CaCas at the two protein concentrations,
followed by WPI. The agglomerates WPC and WPH presented no significant differences at
the protein concentrations of 18 g (p=0.52) and 28 g (p=0.22). In orange juice the WPI
agglomerates showed the highest values at both concentrations and the CaCas agglomerates
the lowest values.
At the concentration of 18 g protein, the WPI agglomerates showed values varying
from 1361.33 to 3283.31 cP. In water these agglomerates were classified as honey (351-
1750 cP), and in milk and orange juice presented the consistency of pudding (>1750 cP),
showing significant differences in all the systems. Lower values were found for the WPC
and WPH agglomerates, being classified as honey in water and milk and pudding in orange
juice. The CaCas agglomerates showed the highest values in the water and milk systems
(pudding), but in orange juice the viscosity was only 410.33 cP (honey).
When used at the concentration of 28 g (Table 9), the WPI agglomerates were
classified as pudding in all the systems. In water and milk, WPC showed the same
behaviour, being classified as honey, but in orange juice the viscosity was 2980.73 cP
(pudding). The CaCas agglomerates showed higher values than the other agglomerates in
water and milk and lower values than the others in the orange juice. WPH agglomerates

99
0
1
2
3
4
5
6
7
8
9
WPI WPC CasCa WPH Espes
Aglomerados
No
tas
Suco de Laranja
Leite
showed a viscosity of 1005.00 cP in water and 1017 cP in milk, being classified as honey.
In orange juice the viscosity of these agglomerates was classified as pudding.
3.11. Analysis of preference of the foods containing added agglomerates
The figure 1 shows the results of the preference tests carried out with ALS patients.
Figure 1. Analysis of preference of the foods containing added agglomerates isolate (WPI), concentrate (WPC) and hydrolysate (WPH) milk whey protein, calcium caseinate (CasCa) and modified starch (MS) at the concentration of 18 at 28 g in 250 mL at 25°C. * Similar capital letter in the same column that represent the same agglomarate are not different (p > 0.05) in Tukey test. Similar minuscule letter in the same column that represent the same food are not different (p > 0.05) in Tukey test.
It can be seen that the means for preference of the milk and orange juice systems
with added WPI agglomerate differed statistically (p=0.007), being between 5.61 and 6.97
(between “liked slightly” and “liked moderately”). No significant difference (p=0.804) was
observed between the use of this agglomerate and the commercial thickener.
The means found for the agglomerates based on WPC, CaCas and WPH in orange
juice were 3.61 (±1.26), 1.37 (±0.59) and 1.23 (±0.42). In milk the means were 3.25
(±1.26), 1.63 (±0.77) and 1.37 (±0.49). For the WPC agglomerates the scores given on the
hedonic scale were between “disliked moderately” and “disliked slightly” and for the
CaCas and WPH agglomerates between “disliked intensely” and “disliked a lot”.
Aa
Ba
Ab Ab
Bc Ac
Bc Ac
Aa
Ba
Agglomerates
Orange Juice Milk
Scores
MS
100
It is important to point out that in the systems with added 70% WPI:30%MS and
with added commercial thickener, means above the cut-off point of 5 (Stone & Sidel, 1993)
were obtained, indicating preference for these products.
4. Conclusions
With respect to the proximate composition of the protein sources, the protein
concentration of the WPI was higher than those of the other sources. Of all the protein
sources, WPI and WPC exhibited the highest values for solubility, independent of pH. The
CaCas showed higher solubility at the extreme pH values, but solubility at the isoelectric
point was close to 0. WPH showed intermediate solubility with the minimum values at pH
values between 3.5 and 6.5. All the sources satisfied the recommendations in terms of
essential amino acids according to the IOM of 2002.
The formulations elaborated showed good yields, varying from 92.53 to 94.53%,
and an increase in granule size of the products was observed after agglomeration, with
more than 38% of the particles presenting diameters greater than 500 µm. Despite the low
initial water activity values, the agglomerates showed increased values after 30 days of
storage, suggesting that the packaging used did not offer an adequate barrier to water
vapour. The greatest values for water absorption capacity were noted for the protein sources
and agglomerated products containing CaCas, and an expressive increase in this property
was observed for the milk whey protein based agglomerates (WPI, WPC and WPH) after
the agglomeration process.
There was no significant difference (p<0.05) in apparent density between the
protein sources WPI and WPC, and the values for CaCas were lower than those of WPH.
The values for apparent density of the protein sources decreased after agglomeration with
modified starch. The mean density of the protein source particles was about 1.09 g.cm-3,
increasing to 1.3 g.cm-3 after agglomeration, close to the expected value for powdered
101
foods. Considering the values for the apparent and particle densities, the values for porosity
were obtained, showing an increase after agglomeration and resulting in highly porous
products, as desired for this type of product.
Of the protein sources, the WPI and CaCas samples at concentrations of 18 and 28
g, presented higher values for viscosity. The former showed similar behaviour in all the
systems, but in orange juice the CaCas showed low values for viscosity because of the
system pH value (close to the isoelectric point of the caseins). After the agglomeration
process, the products were able to modify the system viscosity, approaching that of the
ADA standard (2002). The WPI agglomerate stood out because of the values obtained and
its versatility in all the systems evaluated. In the sensory preference tests, the WPI
agglomerate obtained the highest scores from the patients, not differing from those obtained
with the commercial thickener. The WPC, CaCas and WPH samples received below
average scores for acceptance.
Considering the set of physical-chemical and nutritional properties of the 70%
WPI:30%MS agglomerate as a whole, for use as a food thickener for feeding patients
suffering from ALS, it was concluded that it would be an advantageous substitute for the
current commercial thickeners in managing of the disease. The cost factor should add to the
benefits of a nutritional therapy.
5. Acknowledgements
The authors are grateful to the Integral Medicine Teaching and Research Institute,
São Paulo, Brazil, for donating the protein sources; to CNPq, the Brazilian National
Research Council, for conceding a doctorate scholarship (LBCS); and to the Institute of
Food Technology (ITAL), Campinas, Brazil, for the use of the agglomerator.

102
6. References
ADA. (1996). National Dysphagia Diet: The manual of clinical dietetics. (5rd ed). Chicago,
IL: The American Dietetics Association.
ADA. (2002) National Dysphagia Diet: Standardization for Optimal Care. National
Dysphagia Diet Task Force. Chicago, IL: The American Dietetics Association.
Adler-Nissen, J. (1979). Determination of the degree of hydrolysis of food protein
hydrolysates by trinitrobenzenesulfonic acid. Journal of Agriculture and Food Chemistry,
27, 1256-1262.
Aguilera, J. M., Valle, J. M., & Karel, M. (1995). Caking phenomena in amorphous food
powders. Trends in Food Science & Technology, 6, 149-155.
Almeida, S. R. M., Nucci, A., & Silva, L. B. C. (2007). Avaliação da função respiratória e
nutricional na ELA. Estudo Piloto. VI Congresso Paulista de Neurologia, São Paulo, June
22-23, 2007. São Paulo, Brasil.
A.O.A.C. (1990). Association of Official Analytical Chemists. Official Methods of
Analysis. Washington, DC: W. Horwtz (Eds.).
Arrese, E. L., Sorgentini, D. A., Wagner, J. R., & Añon, M. C. (1991). Eletrophoretic,
solubility, and functional properties of commercial soy protein isolates. Journal of
Agricultural And Food Chemistry, 39, 1029-1032.
Barbosa-Cánovas, G.V., & Juliano, P. (2005). Physical and Chemical Properties of Food
Powders. In C. Onwulata (Eds.), Encapsulated and Powdered Foods, (pp.39-71). New
York, NY: Taylor & Francis.
Baumann, H. (1966). Appatur nach Baumann zur Besting der flússig-keitsaunahme von
pulvrigen substanzen. Fette. 68, 741 (Seifen, Anstrim).
Bligh, E. G., & Dyer, W. J. (1959). A rapid method of total lipid extraction and
purification. Canadian Journal of Biochemistry and Physiology, 37, 911-917.

103
Bradley, W. (2007). Esclerose Lateral Amiotrófica. Retrieved July 30, 2007, from
www.tudosobreela.com.br/relacoes/entrevistas02.shtml?sessao=entrevistas.
Damodaran, S. (1989). Interrelationship of molecular and functional properties of food
proteins. In J.E. Linsella (Eds.), Food proteins (pp.21-51). Champaign, IL: American Oil
Chemists Society.
De Kruif, C.G., & Holt, C. (2003). Casein micelle structure, functions and interactions. In
P.F. Fox & P.L.H. CaSweeney (Eds.), Advanced dairy chemistry, Vol. 1: Proteins (3rd ed)
(pp.233-276). New York, NY: Kluwer Academic/Plenum Publishers.
FAO/WHO. (1985). Food and Agriculture Organization of the United Nation / World
Health Organization. FAO/WHO Expert Consultation on Energy and Protein
Requirements, Roma, Italy, Techinal. Reports, Series 724, 1981. Geneva, Italy.
Fontana, A. J. (1998). Water activiy: why is it important for food safety. Proceedings of the
First NSF International Conference of Food Safety, Albuquerque, NM, November, 1998.
Albuquerque, NM. México.
Giese, J. (1994). Proteins as ingredients: types, functions, applications. Food Technology,
48, 50-60.
Hagen, S. R., Frost, B., & Augustin, J. (1989). Pre-column phenylisothiocyanate
derivatization and liquid chromatography of amino acids in food. J. AOAC, 72, 912–916.
Hambraeus, L. (1982). Nutritional aspects of milk proteins. In P. F. Fox (Ed.), Development
of Dairy Chemistry, (pp.289-313). London: Applies Science.
Huffman, L. M. (1996). Processing whey protein for use as a food ingredient. Food
Technology, 50, 49-52.
IOM (Institute of Medicine). (2002). National Academy of Sciences on Dietary Reference
Intakes (DRI’s). Dietary Reference Intakes for Energy, Carbohydrates, Fiber, Fat, Protein
and Amino Acids (Macronutrients). Washington: National Academy Press.

104
Kinsella, J. E. (1994). Milk proteins: physicochemical and functional properties. Critical
Reviews in Food Science and Nutrition, 21, 197-287.
Maia, A. B. R., & Golgher, M. (1983). Parâmetros para a avaliação da qualidade de
reconstituição do leite em pó desidratado em secador de aspersão (“spray dryer”). Boletim
SBCTA, 17, 235-254.
Masters, K. (1972). Spray Drying. Chemical and Process Engineering Series. London:
Leonard Hill Books.
Mazzini, L., Corra, T., Zaccata, M., Mora, G., Del Piano, M., & Galante, M. (1995).
Percutaneous endoscopic gastrostomy and enteral nutrition in amyotrophic lateral sclerosis.
Journal of Neurology, 242, 695-698.
Meilgaard, M., Civille, G. V., & Carr, B.T. (1999). Sensory evaluation techniques. (3rd ed).
New York, NY: CRC Press.
Morr, C. V., German, B., Kinsella, J. E., Regenstein, J. P., Buren, V., Kilara, A., Lewis, B.
A., & Mangino, M.E. (1985). Collaborative study to develop a standardized food protein
solubility procedure. Journal of Food Science. 50, 1715-1718.
Morr, C. V., & Ha, E. Y. W. (1993). Whey protein concentrates and isolates: processing
and functional properties. Critical Reviews in Food Science and Nutrition, 33, 431-476.
Nardurkar, S., Locke, G. R., Fett, S., Zinsmeister, A.R., Cameron, A. J.; & Talley, N. J.
(2004). Relationship between body mass index, diet, exercise and gastro-esophageal reflux
symptoms in a community. Aliment Pharmacology Ther, 20, 497-505.
Nau, K. L. (1995). Individuals with amyotrophic lateral sclerosis are in caloric balance
despite losses in mass. Journal Neurology of Science, 192, 47-9.
Nelson, L. M., Matkin, C., Longstreth, W. T, & Mcguire V. (2000). Population – based
case – control study of amyotrophic lateral sclerosis in Western Washington State. II. Diet.
American Journal of Epidemiology, 151, 164-173.
105
Peleg, M. (1983). Physical characteristics of food powders. In M. Peleg, & E. B. Bagley
(Eds), Physical properties of foods. (pp.293-321). Westport, CT: AVI Publishing Co. Inc.
Pomeranz, Y., & Meloan, C. E. (1994). Food Analysis: Theory and practice (3rd ed).
Westport, CT: AVI Publishing Co. Inc.
Remondetto, G., Añon, M. C., & González, R. J. (2001). Hydratation properties of soybean
protein isolates. Brasilian Archives of Biology and Technology, 44, 2001.
Salazar, J. (1979). Aspectos gerais sobre a produção de leite em pó instantâneo. Revista do
ILCT, 15-25.
Shimizu, T., Hayashi H., & Tanabe, H. (1991) Energy metabolism of ALS patients under
mechanical ventilation and tube feeding. Clinical of Neurology, 31, 255-259.
Silva, L. B. C., Mourão, L., Wolf, A., Sordi, M., Franca, M. J., Nucci, A., & Amaya-Farfan,
J. (2007). Amyotrophic Lateral Sclerosis (ALS): Nutritional profile and swallowing ability
in patients with dysphagia. Annual Dysphagia Research Society Meeting, Vancouver,
Canada, March 8-10, 2007. Vancouver, Canada a.
Silva, L. B. C., Mourão, L., Lima, N. M. F. V., Almeida, S. R. M., Franca, M. J., Nucci, A.,
& Amaya-Farfan, J. (2007) Amyotrophic lateral sclerosis: nutritional status and functional
conditions. Annual Dysphagia Research Society Meeting, Vancouver, Canada, March 8-10,
2007. Vancouver, Canada b.
Souza, B. B. A., Martins, C., Campos, D. J., Balsini, I. D., & Meyer, L. R. (2003). Nutrição
e Disfagia: Guia para profissionais. Curitiba, PR, Brasil: Nutroclínica.
Stanich, P., Pereira A. M. L., Chiappeta, A. L. M. L., Nunes, M., Oliveira, A. S. B., &
Gabbai, A. A. (2004). Suplementação nutricional em pacientes com doença do neurônio
motor/esclerose lateral amiotrófica. Revista Brasileira de Nutrição Clínica, 19, 70-78.
Steele, R. D., & Harper, A. E. (1990). Protein. In M. L. Brown (Ed.), Present knowledge in
nutrition, (6rd ed) (pp.67-79). Washington, DC: Nutritional Foundation.

106
Stone, H., & Sidel, J. L. (1993). Sensory Evaluation Practices, New York, NY: Academic
Press.
Torgensen, H., & Toledo, R. T. (1977). Physical properties of protein preparations relates
to their functional characteristics in comminuted meat systems. Journal of Food Science,
42, 1615-1618.
Vitali, A. A, & Quast, D. G. (1996) Vida de prateleira de alimentos. In S.C.S.R. Moura,
S.P.M. M Germen (Eds), Reações de transformações e vida de prateleira de alimentos
processados – Manual técnico n°6 (pp.3-10). Campinas, SP: ITAL.
Vojdani, F. (1996). Solubility. In G. M. Hall (Ed.), Methods of testing protein functionality
(pp.11-60). London: Blackie Academic & Professional.

107
______________________________________________________________Artigo III
“Amyotrophic Lateral Sclerosis: combined nutritional, respiratory and
functional assessment”
6

108
AMYOTROPHIC LATERAL SCLEROSIS: COMBINED NUTRITIONAL ,
RESPIRATORY AND FUNCTIONAL ASSESSMENT
Luciano Bruno de Carvalho Silva
Lucia Figueiredo Mourão
Ariovaldo Armando Silva
Núbia Maria Freire Vieira Lima
Sara Regina Almeida
Marcondes C. Franca Junior
Anamarli Nucci
Jaime Amaya-Farfán
Artigo a ser submetido à revista Arquivos de Neuropsiquiatria

109
Amyotrophic Lateral Sclerosis: combined nutritional, respiratory and functional
assessment
LUCIANO BRUNO DE CARVALHO SILVA1, LUCIA FIGUEIREDO MOURÃO2,
ARIOVALDO ARMANDO SILVA3, NÚBIA MARIA FREIRE VIEIRA LIMA4. SARA
REGINA ALMEIDA4, MARCONDES C. FRANCA JUNIOR5, ANAMARLI NUCCI6, JAIME
AMAYA-FARFÁN7
________________________
1Doctoral candidate, Food and Nutrition Department, School of Food Engineering (FEA)
and NEPA (Center for Food Security Studies) of the State University of Campinas
(UNICAMP), Campinas, SP, Brazil; 2Prof. Doctor PhD Speech Pathologist Medical School
(FCM/UNICAMP); 3Prof. Doctor FCM-UNICAMP Otorrionolaringology
FCM/UNICAMP; 4Physiotherapeutics Dept. of Neurology FCM/UNICAMP; 5Neurologist
Ambulatory Neuromuscular Diseases HC/UNICAMP; 6Associate Prof. FCM/UNICAMP.
Ambulatory Neuromuscular Diseases HC/UNICAMP; 7Full Prof. FEA/UNICAMP,
NEPA/UNICAMP.
_________________________________________________________________________
* To whom correspondence should be sent: Monteiro Lobato Street, 80 – CEP 13083 – 862
Universidade Estadual de Campinas, SP, Brazil. Tel: 55-19-35214059, Fax: 55-19-35214060. E-
mail: [email protected].

110
ABSTRACT– Objective: to establish correlations between nutritional, functional and
respiratory indices of patients with Amyotrophic Lateral Sclerosis (ALS). Method: twenty
patients (13 appendicular –GA and 7 bulbar –GB) were included in the multidisciplinary
study at the Ambulatory Neurological Clinic of the State University of Campinas Hospital.
Results: among the GA type significant correlation was observed between maximal
inspiratory (MIP) and expiratory (MEP) pressure (r=-0.76), MEP and pulse oxymetry
(r=0.58), MIP and percent weight loss (%WL; r=0.59), and between MIP, total and
subscale respiratory scores (ALSFRS-R) with %WL. With regard to the GB, correlation
was found between MEP and BMI (r=0.97). In both GA and GB correlations were noticed
between the BMI and the variables mass (kg), fat (%), arm and wrist circumference (cm),
and tricipital, subscapular and supra-iliac skinfolds (mm), as well as the arm muscle
circumference (cm) and fatty arm muscular area (mm2). Conclusion: it is suggested that the
application of simple anthropometric measurements could be useful in routine monitoring
of patients with ALS.
KEYWORDS: amyotrophic lateral sclerosis, nutritional support in ALS, respiratory tests.
Esclerose Lateral Amiotrófica: correlações dos indicadores da avaliação nutricional,
funcional e respiratória
RESUMO – Objetivo: Correlacionar os indicadores utilizados na avaliação nutricional,
funcional e respiratória de indivíduos com Esclerose Lateral Amiotrófica (ELA). Método:
Vinte pacientes (13 apendiculares – GA e 7 bulbares – GB) foram incluídos no estudo
usando parâmetros nutricionais, respiratórios e escala funcional (ALSFRS-R). Resultados:
Entre os pacientes do GA, as correlações observadas foram: Pressão inspiratória máxima

111
(PImax) e expiratória máxima (PEmax) (r=-0,76); PEmax e oximetria de pulso (r=0,58); PImax e
porcentagem de perda de peso (%PP) (r=0,59); e entre PImax, escore ALSFRS-R com %PP.
No GB, houve correlação entre MEP e índice de massa corporal (IMC) (r=0,97). Em ambos
GA e GB, observaram-se correlação entre IMC e as variáveis: massa, gordura (%),
circunferência braquial e punho, pregas cutâneas tricipital, subescapular e supra-ilíaca,
circunferência muscular do braço (cm), área muscular gordurosa do braço (mm2).
Conclusão: Sugere-se a aplicação deste conjunto de medidas no acompanhamento da
evolução clínica de indivíduos com ELA.
PALAVRAS-CHAVE: Esclerose lateral amiotrófica, suporte nutricional em ALS, testes
respiratórios, escala ALSFRS-R.
_________________________________________________________________________
Amyotrophic lateral sclerosis (ALS) is a neurodegenerative condition characterized
by progressive weakness and amyotrophy due to degeneration of motor neurons derived
from damage to either corticobulbar pathway or brainstem motor nuclei is one of the most
important clinical problems encountered in ALS. ALS patients generally exhibit
progressive disability that requires a multidisciplinary therapeutic approach. Dysphagia and
body weight loss are typical findings in these patients, and may herald the onset of the
disease 1.2.
Bulbar dysfunction resulting from damage either to corticobulbar pathway or
brainstem motor nuclei is one of the most important clinical problems encountered in ALS.
It is related to respiratory and swallowing complications, which are major causes of
morbidity and mortality in ALS. Decline in respiratory function occurs as disease
progresses, and there are multiple causes of respiratory compromise, such as diaphragmatic
fatigue and weakness. atelectasis and broncoaspiration3,4.

112
Malnutrition as a consequence of bulbar muscle weakness may further worsen
respiratory function and shorten survival. Abnormalities of the control and strength of the
laryngeal and pharyngeal muscles may cause upper airway obstruction increasing resistance
to airflow4. Although ALS patients with bulbar involvement suffer from more severe
swallowing problems, predominantly the “non-bulbar” ALS patients may also have
dysphagia3.
There are few data devoted to the combined assessment of nutritional and
respiratory status of ALS patients. In this setting, we studied the nutritional, respiratory and
functional profile of a cohort of ALS patients. We looked for correlations between these
variables in order to identify determinant factors in the severity of the disease.
METHOD
This is a cross-sectional descriptive study in a cohort of 20 ALS patients regularly
followed at the Neuromuscular outpatient Clinic of Campinas State University Hospital
(UNICAMP). The study was approved by the ethics committee of the School of Medical
Sciences - UNICAMP and all patients accepted a written consent.
Patients meeting the El-Escorial criteria for defined ALS, either with bulbar or
appendicular predominantly, regularly assisted in the Clinic and without intervening
neurological illnesses were included in the study. They were included regardless of gender
or duration of disease. Patients with nasogastric tube or gastrostomy, or on assisted
mechanical ventilation were excluded.
Nutritional Assessment. We employed the following measures to assess body
composition: Body weight (kg): measured in a platform scale (Toledo do Brasil). Ideal body
weight for each individual was defined according to tables of the Metropolitan Life
Insurance Company6. Height (m): measured in meters and estimated according to Chumlea
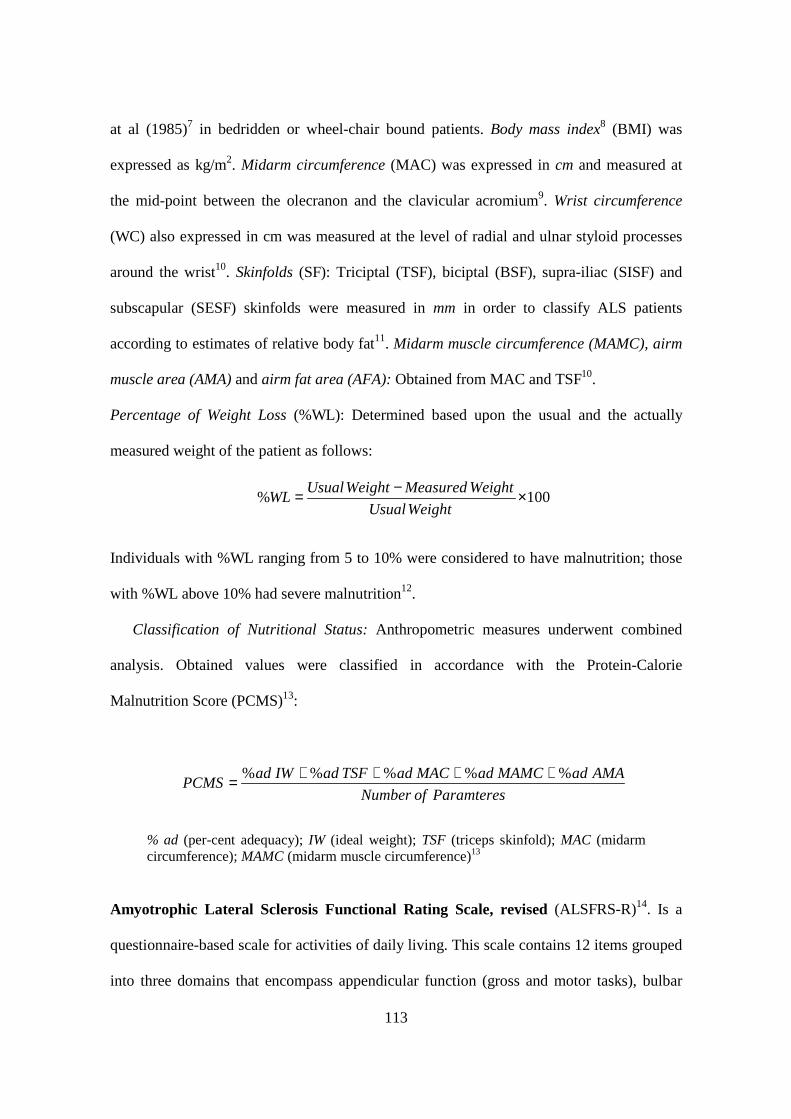
113
ParamteresofNumber
AMAadMAMCadMACadTSFadIWadPCMS
%%%%% ++++=
100% ×−=WeightUsual
WeightMeasuredWeightUsualWL
at al (1985)7 in bedridden or wheel-chair bound patients. Body mass index8 (BMI) was
expressed as kg/m2. Midarm circumference (MAC) was expressed in cm and measured at
the mid-point between the olecranon and the clavicular acromium9. Wrist circumference
(WC) also expressed in cm was measured at the level of radial and ulnar styloid processes
around the wrist10. Skinfolds (SF): Triciptal (TSF), biciptal (BSF), supra-iliac (SISF) and
subscapular (SESF) skinfolds were measured in mm in order to classify ALS patients
according to estimates of relative body fat11. Midarm muscle circumference (MAMC), airm
muscle area (AMA) and airm fat area (AFA): Obtained from MAC and TSF10.
Percentage of Weight Loss (%WL): Determined based upon the usual and the actually
measured weight of the patient as follows:
Individuals with %WL ranging from 5 to 10% were considered to have malnutrition; those
with %WL above 10% had severe malnutrition12.
Classification of Nutritional Status: Anthropometric measures underwent combined
analysis. Obtained values were classified in accordance with the Protein-Calorie
Malnutrition Score (PCMS)13:
% ad (per-cent adequacy); IW (ideal weight); TSF (triceps skinfold); MAC (midarm circumference); MAMC (midarm muscle circumference)13
Amyotrophic Lateral Sclerosis Functional Rating Scale, revised (ALSFRS-R)14. Is a
questionnaire-based scale for activities of daily living. This scale contains 12 items grouped
into three domains that encompass appendicular function (gross and motor tasks), bulbar

114
and respiratory function. Each item has a 5-point scale (0 for unable. 4 for normal) and
scores ranging from 0 to 48. Low scores denote a serious disease status.
Respiratory Assessment. The strength of inspiratory and expiratory muscles was assessed
through maximum inspiratory and expiratory pressures (MIP and MEP, respectively),
obtained from residual volume and total lung capacity. A Marshall Town® device (Black
and Hyatt)15 was used to perform the measurements. While seated and using a nasal clamp,
patients were instructed to breath as deep as possible in order to determine MIP e MEP.
These procedures were consecutively repeated 3 times each. Thirty seconds apart, and the
highest values were recorded for analysis. Individuals underwent spirometry in a seated
position to quantify dynamic respiratory function. Forced vital capacity (FVC) expressed
either as an absolute value or as percentage of the predicted value for age and sex, was
recorded for all patients. Pulse oxymetry was accomplished with a Morvia 1001 device.
The patients were evaluated by an interdisciplinary group. The nutritional
assessment was done by a nutritionist and the ALSFRS-R and respiratory assessment by
physiotherapeutics.
Statistical Analysis. Pearson and Spearman correlation coefficients were employed to
analyze normally and non-normally distributed variables, respectively. Significance level
was set at 0.05. Spearman coefficients were considered as follows: 0 to 0.19 – weak
correlations; 0.2 to 0.39 – mild correlations; 0.4 to 0.59 – moderate correlations; 0.6 to 0.79
– important correlations; 0.8 to 1 – almost perfect correlations16. SPSS for Windows
version 15.0 was employed in the statistical analysis17.
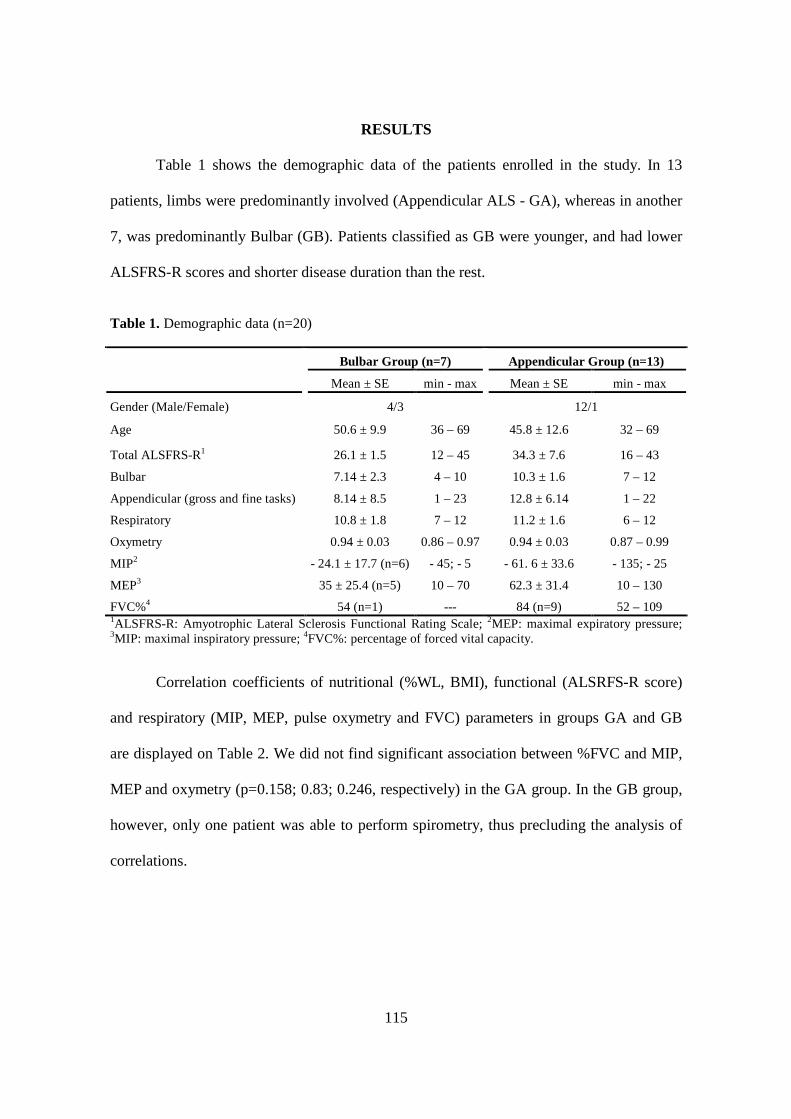
115
RESULTS
Table 1 shows the demographic data of the patients enrolled in the study. In 13
patients, limbs were predominantly involved (Appendicular ALS - GA), whereas in another
7, was predominantly Bulbar (GB). Patients classified as GB were younger, and had lower
ALSFRS-R scores and shorter disease duration than the rest.
Table 1. Demographic data (n=20)
Bulbar Group (n=7) Appendicular Group (n=13) Mean ± SE min - max Mean ± SE min - max
Gender (Male/Female) 4/3 12/1
Age 50.6 ± 9.9 36 – 69 45.8 ± 12.6 32 – 69
Total ALSFRS-R1 26.1 ± 1.5 12 – 45 34.3 ± 7.6 16 – 43
Bulbar 7.14 ± 2.3 4 – 10 10.3 ± 1.6 7 – 12
Appendicular (gross and fine tasks) 8.14 ± 8.5 1 – 23 12.8 ± 6.14 1 – 22
Respiratory 10.8 ± 1.8 7 – 12 11.2 ± 1.6 6 – 12
Oxymetry 0.94 ± 0.03 0.86 – 0.97 0.94 ± 0.03 0.87 – 0.99
MIP2 - 24.1 ± 17.7 (n=6) - 45; - 5 - 61. 6 ± 33.6 - 135; - 25
MEP3 35 ± 25.4 (n=5) 10 – 70 62.3 ± 31.4 10 – 130
FVC%4 54 (n=1) --- 84 (n=9) 52 – 109 1ALSFRS-R: Amyotrophic Lateral Sclerosis Functional Rating Scale; 2MEP: maximal expiratory pressure; 3MIP: maximal inspiratory pressure; 4FVC%: percentage of forced vital capacity.
Correlation coefficients of nutritional (%WL, BMI), functional (ALSRFS-R score)
and respiratory (MIP, MEP, pulse oxymetry and FVC) parameters in groups GA and GB
are displayed on Table 2. We did not find significant association between %FVC and MIP,
MEP and oxymetry (p=0.158; 0.83; 0.246, respectively) in the GA group. In the GB group,
however, only one patient was able to perform spirometry, thus precluding the analysis of
correlations.

116
Table 2. Correlations of nutritional. functional and respiratory indicators of bulbar and appendicular groups.
Bulbar Group (n=7) Appendicular Group (n=13) Correlations r p-value r p-value
Time onset ALS x bulbar score ALSFRS-R1 0.9 0.005* -0.04 0.88 Time onset ALS x total ALSFRS-R -0.82 0.023* -0.37 0.206 Time onset ALS x Oximetry -0.26 0.563 -0.75 0.003* Time onset ALS x WL2 0.73 0.063 0.32 0.296 Respiratory score ALSFRS-R x %WL -0.33 0.436 -0.59 0.042* Total ALSFRS-R x %WL -0.39 0.379 -0.59 0.042* MIP3 x Respiratory score ALSFRS-R 0.18 0.72 -0.65 0.016* MIP x MEP4 -0.66 0.219 -0.76 0.002* MEP x Oximetry 0.63 0.253 0.58 0.034* MEP x BMI5 0.97 0.005* 0.49 0.09
* = p < 0.05. 1ALSFRS-R: Amyotrophic Lateral Sclerosis Functional Rating Scale-revised; 2%WL: % of weight loss;3MEP: maximal expiratory pressure; 4MIP: maximal inspiratory pressure; 5BMI: body mass index.
Anthropometric data are shown in table 3.
Table 3. Anthropometric profile of patients with ALS according to the predominance symptoms.
Bulbar Group (n=7) Appendicular Group(n=13) Indicadores Mean SE* Mean SE*
p*
Height (m) 1.684 0.007 1.71 0.004 0.156
Mass (kg) 63.99 1.38 68.51 1.12 0.356
Body mass index (kg/m2) 21.97 0.35 23.26 0.36 0.097
Weight loss (%) 17.68 1.19 13.61 0.97 0.708
Fat mass (%) 25.66 0.60 23.72 0.40 0.188
Lean mass (%) 83.95 0.50 83.72 0.51 0.350
Initial arm circumference (cm) 25.94 0.41 26.12 0.36 0.273
Arm circumference (cm) 25.74 0.39 27.46 0.36 0.061
Initial wrist circumference (cm) 15.49 0.12 17.13 0.06 0.131
Wrist circumference (cm) 15.36 0.11 17.68 0.08 0.536
Tricipital skin fold (mm) 14.70 0.47 10.73 0.33 0.971
Bicipital skin fold (mm) 9.30 0.44 6.45 0.19 0.405
Supra-iliac skin fold (mm) 16.30 0.66 16.09 0.73 0.599
Subescapular skin fold (mm) 11.10 0.36 13.32 0.32 0.117
Sum of all skinfolds (mm) 51.40 1.46 46.59 1.37 0.935
Muscle circumference of the arm (cm) 22.22 1.77 24.13 0.28 0.438
Muscle area of the arm (cm) 41.36 2.97 59.75 1.65 0.340
Fat area of the arm (cm) 57.68 1.64 57.92 1.49 0.087 SE* = Standard error p* = Spearman test (α= 5%).
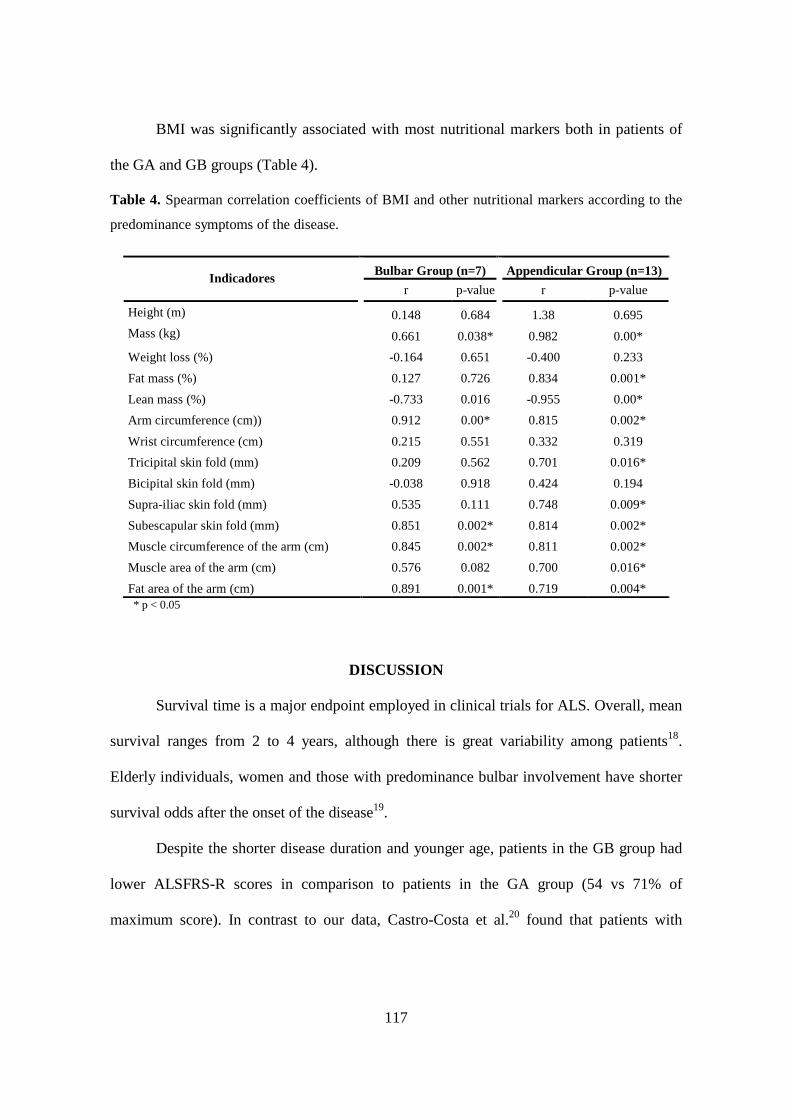
117
BMI was significantly associated with most nutritional markers both in patients of
the GA and GB groups (Table 4).
Table 4. Spearman correlation coefficients of BMI and other nutritional markers according to the
predominance symptoms of the disease.
Bulbar Group (n=7) Appendicular Group (n=13) Indicadores
r p-value r p-value
Height (m) 0.148 0.684 1.38 0.695
Mass (kg) 0.661 0.038* 0.982 0.00*
Weight loss (%) -0.164 0.651 -0.400 0.233
Fat mass (%) 0.127 0.726 0.834 0.001*
Lean mass (%) -0.733 0.016 -0.955 0.00*
Arm circumference (cm)) 0.912 0.00* 0.815 0.002*
Wrist circumference (cm) 0.215 0.551 0.332 0.319
Tricipital skin fold (mm) 0.209 0.562 0.701 0.016*
Bicipital skin fold (mm) -0.038 0.918 0.424 0.194
Supra-iliac skin fold (mm) 0.535 0.111 0.748 0.009*
Subescapular skin fold (mm) 0.851 0.002* 0.814 0.002*
Muscle circumference of the arm (cm) 0.845 0.002* 0.811 0.002*
Muscle area of the arm (cm) 0.576 0.082 0.700 0.016*
Fat area of the arm (cm) 0.891 0.001* 0.719 0.004* * p < 0.05
DISCUSSION
Survival time is a major endpoint employed in clinical trials for ALS. Overall, mean
survival ranges from 2 to 4 years, although there is great variability among patients18.
Elderly individuals, women and those with predominance bulbar involvement have shorter
survival odds after the onset of the disease19.
Despite the shorter disease duration and younger age, patients in the GB group had
lower ALSFRS-R scores in comparison to patients in the GA group (54 vs 71% of
maximum score). In contrast to our data, Castro-Costa et al.20 found that patients with

118
bulbar predominantly were older than patients with initial limb involvement (60.5 vs 36.2
y, respectively).
Although FVC has been considered the most reliable tool to monitor respiratory
function in patients with ALS, it is not as useful to estimate strength of respiratory
muscles21. FVC is not a sufficiently sensitive test to detect early respiratory involvement in
ALS, and there is only a weak correlation between FVC and parameters such as MIP and
MEP22. In the GA group, there was a significant correlation between MIP and MEP
(p=0.002), as well as MEP and pulse oxymetry (p=0.034). Similar findings were not
identified in the GB group, since results of respiratory function were less reliable in that
group due to the severe weakness of oro-pharyngeal muscles.
Although respiratory complaints are frequent in ALS, studies on the relationship of
dyspnea and objective measurements of respiratory function in the disease are scanty. Melo
et al. (1999)23 reported that severity of dyspnea was related to respiratory muscle weakness
expressed as abnormal MIP and MEP. Similarly, Dugan et al. (2000)24 found reduced
values of MIP and MEP in dyspneic ALS patients. Our data are in accordance with those
findings since MIP and respiratory scores of ALSFRS-R, which is a reliable marker for
dyspnea in ALS, were significantly correlated (p=0.016). These findings suggest that
clinical evaluation and MIP may be useful to monitor the loss of respiratory quality in ALS.
Cedarbaum et al. (1999)14 found that FVC and respiratory scores of ALSFRS-R
were related in ALS (r=0.53 e p=0.0001) but this was not replicated in our patients. These
authors emphasized that the items dyspnea and orthopnea of ALSFRS-R may be altered in
patients with normal FVC. Four patients in the GB group showed respiratory scores below
maximum. However, mean FVC was 84% for patients in the GB group. Therefore, dyspnea
in some patients with preserved respiratory reserve may be more closely related to factors
such as fatigue and bad conditioning.

119
Malnutrition in ALS is closely associated to dysphagia and thus an early finding in
patients with progressive bulbar palsy occurrance25. Due to oro-pharyngeal muscle
weakness, measurements such as MIP and MEP are less reliable in those patients. Despite
this, MEP and BMI were strongly correlated in patients of the GB group (p=0.005).
Both dysphagia and neurogenic muscle atrophy may contribute to the percent
weight loss in ALS26, MIP, ALSFRS-R total score and respiratory sub-score correlated
independently with %WL (p<0.05) in patients of the GA, but not GB group. This may be
explained by the more severe muscular atrophy identified in the GA group (FFM%=79.6
and 84.9, respectively).
There were not significant differences between the GA and GB groups regarding
nutritional profiles. Our data on body mass. BMI, fat%, TSF, MAMC, AMA and AFA, also
were similar to those found by Stanich et al (2004)27, in a cohort of patients with ALS from
São Paulo (Brazil), suggesting they accurately characterize the disease.
In this series, patients would be classified as eutrophic according to BMI; however,
if we take into account the PCMS score, patients would be classified as moderately
malnourished (mean PCMS scores of 76.66 and 79.76 in groups GB and GA, respectively).
Overall, PCMS is more appropriate than BMI to characterize nutritional status of patients
because it includes separately muscle and adipose mass rather than total body mass. We
found high %WL values, indicating significant differences between the usual weight and
the actually measured weight of the patient at clinical evaluation. Percent WL is a
parameter readily determined and useful to assess nutritional status in ALS. BMI should not
be the unique marker to assess nutritional status because of the lack of sensitivity to low
weight losses, adipose accumulation, lean mass reduction and dehydration, all of which
may make it difficult to interpret the results29,30.

120
MAC and WC are frequently used in population studies31. In our patients, they were
tightly related to BMI. Among patients of the GA group, MAC and WC were parameters
smaller at the side initially affected by the disease process (mean difference=1.34 and 0.55,
p=0.003 and 0.037, respectively). Such an asymmetry may be clinically relevant since it
may either overestimate or underestimate the actual nutritional needs of the patients
(measurements are usually performed on one side). PCMS also helped to accurately
perform nutritional classification of patients with ALS, since parameters employed to
calculate this score were correlated with BMI.
There was significant correlation between respiratory parameters, namely MIP and
MEP, and ALSFRS-R in both groups, GA and GB. As shown in Table 2, BMI and %WL
were also related to the respiratory parameters. In addition, we found significant
correlations between BMI and other measures of nutritional status, thus suggesting that this
may be a useful clinical tool in the management of patients with ALS.
CONCLUSIONS
Nutritional, functional and respiratory profiles were similar in patients with ALS of
either bulbar or appendicular predominantly. There was significant correlation between
MIP and MEP; MEP and pulse oxymetry; MIP and percent weight loss; and between MIP,
total and subscale respiratory scores (ALSFRS-R) with %WL. With regard to the GB,
correlation was found between MEP and BMI. In both GA and GB correlations were
noticed between the BMI and the variables mass (kg), fat (%), arm and wrist circumference
(cm), and tricipital, subscapular and supra-iliac skinfolds (mm), as well as the arm muscle
circumference (cm) and fatty arm muscular area (mm2). Although preliminary, our data
support the use of these simple determinations in the management of patients with ALS.

121
ACKNOWLEDGEMENT / FINANCIAL SUPPORT
This study was supported by CNPq – Conselho Nacional de Desenvolvimento Científico,
Brazil (PhD Grant to LBCS).
REFERENCES
1. Nelson LM, Matkin C, Longstreth WT, Mcguire V. Population – based case –
control study of amyotrophic lateral sclerosis in Western Washington State. II. Diet.
Am J Epidemiol 2000; 151:164-173.
2. Kasarskis E, Berryman S, Vanderleest JG, Schneider AR, McClain CJ. Nutritional
status of patients with amyotrophic lateral sclerosis: relation to the proximity of
death. Am J Clin Nutr 1996; 63:130-137.
3. Fattori B, Grosso M, Bongioanni P, et al. Assessment of Swallowing by
Oropharyngoesophageal Scintilography in Patients with Amyotrophic Lateral
Sclerosis. Dysphagia 2006; 280-286.
4. Hadjikoutis S, Wiles CM. Respiratory complications related to bulbar dysfunction
in motor neuron disease. Acta Neurol Scand 2001; 103:207–213.
5. El Escorial revisited: Revisited criteria for the diagnosis of ALS.-World Federation
of Neurology research group on motor diseases. A consensus conference held at
Airlie House. Worrenton. 1998; 2-4.
6. Grant JP, Custer PB, Thurlon J. Current techniques of nutrition assessment. In
Handbook of total parenteral nutrition. Philadelphia. Saunders. 1980.
7. Chumlea MAC, Roche AF, Steinbaugh ML. Estimating stature from knee height for
persons 60 to 90 years of age. J Am Geriatric Soc 1985; 33:116-120.
8. Rio A, Cawadias E. Nutritional advice and treatment by dietitians to patients with
amyotrophic lateral sclerosis/motor neurone disease: a survey of current practice in
England. Wales. Northern Ireland and Canada. J Hum Nutr Diet 2007; 20:1-13.
9. Lohman TG, Roche AF, Martorell R. Anthropometric standardization reference
manual. Ed. Abridged. 1991.
10. Filho JF. A prática da avaliação física. Rio de Janeiro: Ed. Shape. 1999:17-38.

122
11. Frisancho AR. New norms of upper limb fat and muscle areas for assessment of
nutritional status. Am J Clin Nutr 1981; 34: 540-545.
12. Mahan K, Stump SE. Krause: alimentos. nutrição e dietoterapia. 11ª (ed). São
Paulo: Ed. Roca. 2005.
13. Blackburn GL, Harvey KB. Nutritional assessment as a routine in clinical medicine.
Postgrad Med 1982; 71: 46-63.
14. Cedarbaum JM, Stambler N, Malta E, et al. The ALSFRS-R: a revised ALS
functional rating scale that incorporates assessments of respiratory function. Journal
Neurol Sci 1999;169:13-21.
15. Black LF, Hyatt RE. Maximal respiratory pressures: normal values and relationship
to age and sex. Am Rev Respir Dis 1969; 99:696–702.
16. Landis JR, Koch GG. The measurement of observer agreement for categorical data.
Biometrics 1977; 33: 159-174.
17. Norussis MJ. Statistical Package for Social Science (SPSS) for Windows Advanced
Statistics Release 15.0. Chicago: SPSS; 2006.
18. Magnus T, Beck M, Giess R, Puls I, Naumann N, Toyka KV. Disease progression
in amyotrophic lateral sclerosis: Predictors of survival. Muscle Nerve 2002;
25(5):709-714.
19. Czaplinski A, Yen AA, Appel SH. Amyotrophic lateral sclerosis: early predictors of
prolonged survival 2006; 253:1428-1436.
20. Castro-Costa CM, Oriá RB, Machado-Filho JA, et al. Amyotrophic Lateral
Sclerosis: Clinical analysis of 78 cases from Fortaleza (Northeastern Brazil) Arq
Neuropsiquiatr 1999; 57(3-B): 761-774.
21. Kleopas AK, Sherman M, Neal B, Romano GJ, Heiman-Patterson. Bipap improves
survival and rate of pulmonary function decline in patients with ALS. J Neurol Sci
1999; 164: 82-88.
22. Jackson CE, Rosenfeld J, Moore DH, et al. A preliminary evaluation of a
prospective study of pulmonary function studies and symptoms of hypoventilation
in ALS/ MND patients. J Neurol Sci 2001; 191:75-78.
23. Melo J, Homma A, Iturriaga E, et al. Pulmonary evaluation and prevalence of non-
invasive ventilation in patients with amyotrophic lateral sclerosis: a multicenter
survey and proposal of a pulmonary protocol. J Neurol Sci 1999; 169: 114-117.
123
24. Dougan CF, Connell CO, Thornton E, Young CA. Development of a patient-
specific dyspnoea questionnaire in motor neurone disease (MND): the dyspnoea
rating scale (MRDS). J Neurol Sci 2000; 180: 86-93.
25. Desport JC, Preux PM, Truong CT, Courat L, Vallat JM, Couratier P. Nutritional
assessment and survival in ALS patients. Amyotroph Lateral Scler Other Motor
Neuron disord 2000; 1(2): 91-96.
26. Rowland LP, Mitsumoto H, De-Vivo DC. Doenças do Neurônio Motor Hereditárias
e Adquiridas. In: Merrit – Tratado de Neurologia. 11ª ed. 2007. Rio de
Janeiro:Guanabara Koogan. p.798-805.
27. Stanich P, Pereira AML, Chiappeta ALML, Nunes M, Oliveira ASB, Gabbai AA.
Suplementação nutricional em pacientes com doença do neurônio motor/esclerose
lateral amiotrófica. Rev Bras de Nutri Clin 2004; 19: 70-78.
28. Santos DM, Sichieri R. Índice de massa corporal e indicadores antropométricos de
adiposidade em adultos. Rev Saúde Pública 2005; 22: 163-168.
29. Frisancho RA, Flegel PN. Relative merits of old and new indices of body mass with
reference to skinfold thichness. Am J Clin Nutr 1982; 36: 697-679.
30. Gallagher D, Visser M, Sepúlveda D, Pierson RN, Harris T, Heymsfield SB. How
useful is body mass index for comparison or body fatness across age. sex. and
ethnic groups? Am J Epidemiol 1996; 146: 228-239.
31. James WPT, Mascie-Taylor GNC, Norgan NG, Bistrian BR, Shetty PS, Ferro-Luzzi
A. The value of arm circumference measurements in assessing chronic energy
deficiency in Third World adults. Eu J Clin Nutr 1994; 48: 883-894.

124
______________________________________________________________Artigo IV
“Oral supplementation with milk whey proteins improve nutritional
status of patients with amyotrophic lateral sclerosis”
7

125
ORAL SUPPLEMENTATION WITH MILK WHEY PROTEINS IMPROV E
NUTRITIONAL STATUS OF PATIENTS WITH AMYOTROPHIC LAT ERAL
SCLEROSIS
Luciano Bruno de Carvalho Silva
Lucia Figueiredo Mourão
Ariovaldo Armando Silva
Núbia Maria Freire Vieira Lima
Sara Regina Almeida
Marcondes C. Franca Junior
Anamarli Nucci
Jaime Amaya-Farfán
Artigo a ser submetido à revista Nutritional Neuroscience

126
Oral supplementation with milk whey proteins improve nutritional status of patients
with amyotrophic lateral sclerosis
LUCIANO BRUNO DE CARVALHO SILVA 1, LUCIA FIGUEIREDO
MOURÃO 2, ARIOVALDO ARMANDO SILVA 3, NÚBIA MARIA FREIRE VIEIRA
LIMA 4, SARA REGINA ALMEIDA 4, MARCONDES C. FRANCA JUNIOR 5,
ANAMARLI NUCCI 6 & JAIME AMAYA-FARFÁN 7
________________________
1Doctoral candidate, Food and Nutrition Department, School of Food Engineering (FEA)
and NEPA (Center for Food Security Studies) of the State University of Campinas
(UNICAMP), Campinas, SP, Brazil; 2Prof. Doctor PhD Speech Pathologist Medical School
(FCM/UNICAMP); 3Prof. Doctor FCM-UNICAMP Otorrionolaringology
FCM/UNICAMP; 4Physiotherapeutics Dept. of Neurology FCM/UNICAMP; 5Neurologist
Ambulatory Neuromuscular Diseases HC/UNICAMP; 6Associate Prof. FCM/UNICAMP.
Ambulatory Neuromuscular Diseases HC/UNICAMP; 7Full Prof. FEA/UNICAMP,
NEPA/UNICAMP.
_________________________________________________________________________ * To whom correspondence should be sent: Monteiro Lobato Street 80 – CEP 13083 – 862
Universidade Estadual de Campinas, SP, Brazil. Tel: 55-19-35214059, Fax: 55-19-35214060. E-
mail: [email protected].
127
ABSTRACT – Amyotrophic lateral sclerosis (ALS) is a neurodegenerative disease
characterized by death of upper and lower motor neurons. Nutritional and respiratory
failure occurs in most patients with ALS. We evaluated the efficacy of oral
supplementation with milk whey proteins and modified starch (70%WPI:30%MS), on
nutritional and functional parameters of patients with ALS. Sixteen patients were
randomized to two groups, treatment (70%WPI:30%MS) and placebo (maltodextrin). They
underwent prospective nutritional, respiratory and functional assessment for 4 months.
Patients in the treatment group presented weight gain, increased BMI, increased arm
muscle area and circumference, higher albumin, white blood cell and total lymphocyte
counts, and reduced markers of skeletal muscle turnover (creatine-kinase, AST and ALT).
In the placebo group, biochemical measures did not change, but weight and BMI declined.
Our results indicate that the agglomerate 70%WPI:30%MS may be useful in the nutritional
therapy of patients with ALS.
KEY WORDS: Amyotrophic lateral sclerosis, nutrition status, anthropometry,
respiratory function, palliative care.
_________________________________________________________________________
Amyotrophic lateral sclerosis (ALS) is a progressive neurodegenerative disorder of
motor neurons in the cerebral cortex, brainstem, and spinal cord [Desport 2001]. ALS
patients show multiple clinical features, since the disease affects bulbar and/or spinal
systems according to the site of motor neuron involvement. As the disease progresses, both
upper and lower motor neurons may be affected, and various symptoms may overlap
[Strand et al., 1996].

128
During the course of ALS, there is often a decline in nutritional status that is not
properly managed in clinical practice, even though it is a significant and independent
prognostic survival factor [Desport et al., 1999].
Nutritional status should be routinely monitored to identify poor food intake and
malnutrition [Slowie et al., 1983]. Patients may experience rapid weight loss associated
with reduced nutritional intake, prolonged meal times, fatigue, dehydration and depression.
Un-fortified texture-modified diets for dysphagic patients may hasten weight loss due to
their low protein and energy content [Wrigth et al., 2005]. When these nutrition-depleting
co-factors are present the insidious onset malnutrition is inevitable.
Ingredients such as milk whey proteins, when chemically or physically modified,
can alter the viscosity of food systems. However, on their own, they are unable to reach the
viscosity standardised by the ADA [2002] for fluids, but agglomerated with carbohydrate
sources such as modified starch, they could increase the viscosity of food systems to values
close to those cited by the ADA.
Based on the high malnutrition index and difficulty in nutritional handling, the main
objective of this study was evaluate the effect of supplementation with agglomerate 70%
milk whey protein isolate and 30% modified starch (70%WPI:30%MS), on
anthropometrics, body composition, biochemists and respiratory parameters in ALS
patients.
METHODS
Study design
We performed a prospective randomized double-blind placebo-controlled clinical
trial to evaluate oral supplementation of milk whey protein in patients with ALS. We
recruited 16 patients with clinically definite ALS from the Neuromuscular outpatient clinic

129
of Campinas State University (UNICAMP). Patients were randomized to receive either
milk whey protein or placebo for 16 weeeks, and submitted to bimonthly evaluation. The
study was conducted between July 2006 and July 2007. The study was approved by the
ethics committee of the School of Medical Sciences - UNICAMP and all patients accepted
a written consent.
Inclusion criteria: ALS patients meeting El Escorial criteria (1998) for defined disease,
either with bulbar or appendicular onset, regularly assisted in the Clinic and without
intervening neurological illnesses were included in the study.
Exclusion criteria: patients with nasogastric tube or gastrostomy, and patients on assisted
mechanical ventilation.
Nutritional intervention phase: Patients were randomized to receive either maltodextrin
(control group) or oral supplementation with whey protein (treatment group). This is a
nutritional supplement developed at UNICAMP containing 70% of milk serum protein and
30% modified starch (70% WPI:30% MS). Patients received malodextrin or whey protein
for 16 weeks. Nutritional assessment, including anthropometric and biochemical measures,
was performed at the onset, two months and four months after supplementation. We
performed respiratory and functional assessment at the onset and four months after
supplementation.
Nutritional supplementation:
Individual daily needs of protein are 1.2 g/kg of body weight. Mean body weight
was 55 and 69 kg for female and male patients, respectively. We offered 30 and 45 g of
whey protein to men and women, thus representing approximately 30% of daily proteic
needs.
Nutritional supplementation was administered twice a day (morning and afternoon)
for 16 consecutive weeks. Patients did not receive supplement at the same time of Riluzole.

130
They were instructed to keep the product on a refrigerator and to solubilize it before
administration; on an individual basis, assays to adequate viscosity were performed with
orange juice (pH=4.0 and 1.5% of solid components).
Study measures
Dietary evaluation
We applied the 24h record method [Fisberg et al. 2005] in 6 different days for every
patient. We inquired about the usual diet of the patient, including amount, commercial
brand and the cooking procedure. We estimated energy requirement (ER); proportion of
carbohydrates, proteins and lipids; proportion of saturated, polyunsaturated and
monounsaturated fat relative to ER; and the intake of fibers, calcium, iron, retinol and
ascorbic acid. Estimates were accomplished by the software DIET PRO 4.0 [2001]. The
amount of fibers, cholesterol, saturated, polyunsaturated and monounsaturated fat was
analyzed by DIET PRO 4.0 in accordance with the table of food composition [Philippi et
al. 2001], Brazilian table of food composition [2006] and the table of the United States
Department of Agriculture (USDA 2003 – Release 16).
We evaluated macronutrient and protein nutritional adequacy in accordance with the
Recommended Dietary Allowances (RDA) [1989] and the recommendations of the
Brazilian society of food and nutrition [Vannucchi et al. 1990], respectively. We used the
guidelines of the Institute of Medicine [IOM 1997, 2000, 2001, 2002] to analyze intake of
micronutrients. Harris and Benedict equation modified by Long et al. [1979] was
employed to analyze caloric intake.

131
100% ×−=WeightUsual
WeightMeasuredWeightUsualWL
Nutritional evaluation
Body weight (kg): Measured in a platform scale (Toledo do Brasil). Ideal body weight for
each individual was defined according to Grant et al. 1980.
Height (m): Measured in meters. Height was estimated according to Chumlea et al (1985)
in bedridden or wheel-chair bound patients:
Height men= [64.19-(0.04 x age(y))] + (2.02 x distance to the knee(cm))
Height women =[84.88-(0.24 x age(y) )+ (1.83 x distance to the knee(cm))]
Body mass index (BMI): the ratio of weigth per squared height, expressed as kg/m2.
Midarm circumference (MAC): expressed in cm, was measured at the mid-point between
olecranon and clavicular acromium [Lohman et al. 1991].
Wrist circumference (WC): expressed in cm, was measured at the level of radial and ulnar
styloid processes around the wrist [Filho, 1981].
Skinfolds (SF): Tricipital (TSF), bicipital (BSF), supra-iliac (SISF) and subscapular (SESF)
skinfolds were measured in mm in order to classify ALS patients according to estimates of
relative body fat [Frisancho 1981].
Midarm muscle circumference (MAMC), arm muscle area (AMA) and airm fat area (AFA):
Obtained from MAC and TSF according to Frisancho [1981].
Percentage of weigth loss (%WL): Determined based upon the usual and the actually
measured weight of the patient as follows:
%WL is related to the severity of the disease. Individuals with %WL ranging from 5 to
10% were considered to have malnutrition; the ones with %WL above 10% had severe
malnutrition [Mahan & Escott-Stump 2005].
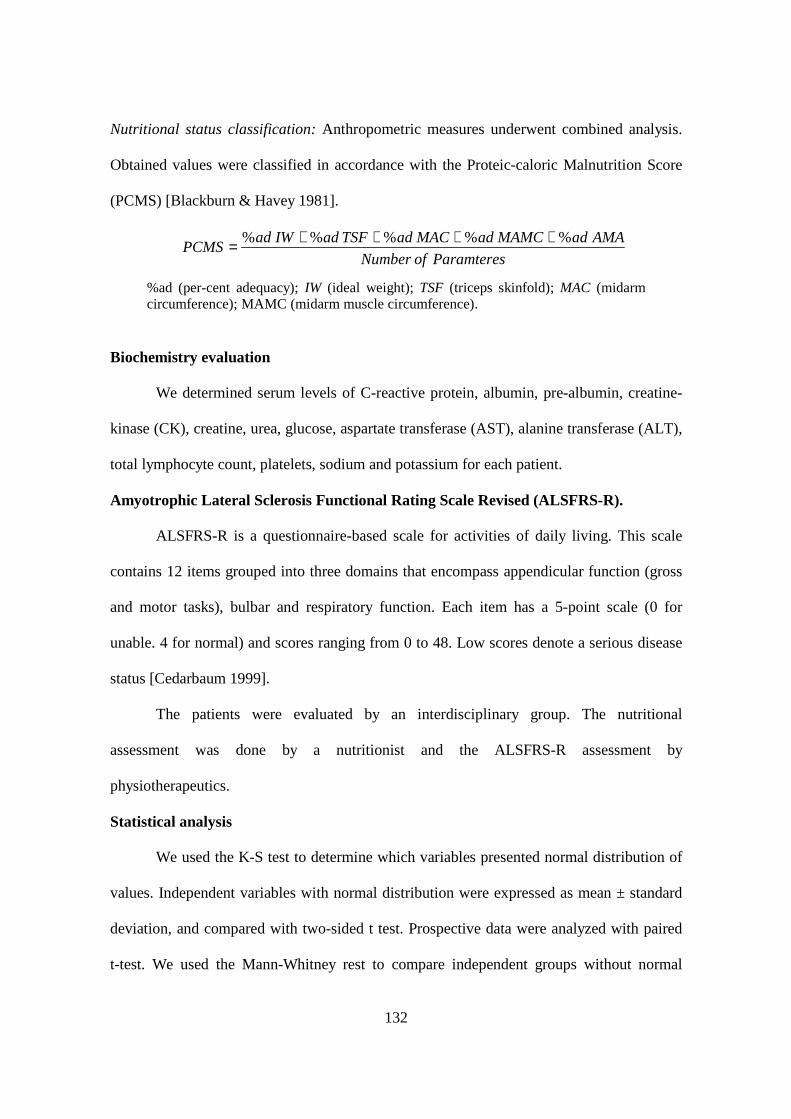
132
ParamteresofNumber
AMAadMAMCadMACadTSFadIWadPCMS
%%%%% ++++=
Nutritional status classification: Anthropometric measures underwent combined analysis.
Obtained values were classified in accordance with the Proteic-caloric Malnutrition Score
(PCMS) [Blackburn & Havey 1981].
%ad (per-cent adequacy); IW (ideal weight); TSF (triceps skinfold); MAC (midarm circumference); MAMC (midarm muscle circumference).
Biochemistry evaluation
We determined serum levels of C-reactive protein, albumin, pre-albumin, creatine-
kinase (CK), creatine, urea, glucose, aspartate transferase (AST), alanine transferase (ALT),
total lymphocyte count, platelets, sodium and potassium for each patient.
Amyotrophic Lateral Sclerosis Functional Rating Scale Revised (ALSFRS-R).
ALSFRS-R is a questionnaire-based scale for activities of daily living. This scale
contains 12 items grouped into three domains that encompass appendicular function (gross
and motor tasks), bulbar and respiratory function. Each item has a 5-point scale (0 for
unable. 4 for normal) and scores ranging from 0 to 48. Low scores denote a serious disease
status [Cedarbaum 1999].
The patients were evaluated by an interdisciplinary group. The nutritional
assessment was done by a nutritionist and the ALSFRS-R assessment by
physiotherapeutics.
Statistical analysis
We used the K-S test to determine which variables presented normal distribution of
values. Independent variables with normal distribution were expressed as mean ± standard
deviation, and compared with two-sided t test. Prospective data were analyzed with paired
t-test. We used the Mann-Whitney rest to compare independent groups without normal

133
distribution. The α value was set at 5%. SPSS for windows version 15.0 was employed in
the statistical analysis.
RESULTS
Food intake
We found increased food intake in both placebo and supplemented groups after nutritional
intervention. In both groups, patients followed nutritional advice as shown by the relevant
improvement in macro and micronutrient intake.
At the time of enrollment, patients in the placebo group had 77% of nutritional
adequacy, but after 4 months this rose to 90.27% (p=0.032). Carbohydrate intake (70.8% vs
82%, p=0.022) significantly increased in 4 months, as well as lipids (93% vs 101.4%,
p=0.038). Protein and fiber intake also improved in this period (82.04% vs 93.53%,
p=0.043, and 50.44% vs 63.6%, p=0.034, respectively). Ingestion of calcium (p=0.002),
ascorbic acid (p=0.035), vitamin E (p=0.012) and retinol (p=0.041) increased (Table 1).
Table I. Values of food intake throughout 4 months in patients with ALS. CONTROL GROUP* †‡ TREATMENT GROUP* †§
Months Months Nutrients
0 2 4 0 2 4 Energy (kcal) 1774,41 ± 35,98b 1998,05 ± 28,71a 2062,3 ± 30,73 a 1885,32 ± 31,44 b 2332,92 ± 36,43 a 2301,66 ± 35,22 a
Carbohydrate (g) 242,7 ± 10,12 b 281,3 ± 8,93 a 289,01 ± 7,62 a 261,4 ± 8,34 b 327,79 ± 5,13 a 321,89 ± 4,82 a
Lipid (g) 59,01 ± 2,37 b 64,37 ± 2,01 a 63,76 ± 1,89 a 63,11 ± 2,65 b 71,45 ± 2,18 a 70,38 ± 2,41 a
Protein (g) 70,28 ± 2,17 b 80,13 ± 1,04 a 80,28 ± 1,41 a 71,32 ± 3,51 b 95,03 ± 3,18 a 96,52 ± 3,02 a
Fiber (g) 12,61 ± 0,44 b 14,62 ± 0,64 a 15,9 ± 0,49 a 12,49 ± 0,31 b 18,11 ± 0,12 a 18,62 ± 0,17 a
Iron (mg) 6,39 ± 0,17 7,01 ± 0,13 7,71 ± 0,18 8,3 ± 0,11 8,21 ± 0,41 8,36 ± 0,13
Calcium (mg) 459,8 ± 20,14 b 818,15 ± 21,13 a 953,68 ± 23,64 a 441,6 ± 19,25 b 903,12 ± 22,4 a 911,62 ± 14,81a
Ascorbic acid (mg) 90,01 ± 4,98 b 96,44 ± 4,61 a 97,06 ± 5,46 a 100,32 ± 4,12 b 102,63 ± 3,92 b 118,35 ± 4,55 a
Retinol (mEq) 520,12 ± 16,52 b 606,17 ± 14,59 a 626,70 ± 15,11a 510,14 ± 17,12 512,63 ± 14,41 563,35 ± 16,84
Vitamin E (mg) 3,94 ± 0,19 b 5,18 ± 0,14 a 6,84 ± 0,17 a 4,43 ± 0,18 b 7,34 ± 0,11a 7,37 ± 0,11a
Zinc (mg) 8,12 ± 0,41 8,91 ± 0,33 8,72 ± 0,35 8,9 ± 0,9 8,7 ± 0,31 9,94 ± 0,28
Selenium (µg) 50,10 ± 2,1 53,64 ± 1,38 53,55 ± 1,53 50,33 ± 1,34 58,82 ± 1,71 58,72 ± 1,86 * Values correspond to means ± standard error of three determinations. † Minimum and maximum value. ‡ Values not sharing similar letter in the same line referent to control group are different (p < 0.05) in Tukey test. § Values not sharing similar letter in the same line referent to treatmanet group are different (p < 0.05) in Tukey test.
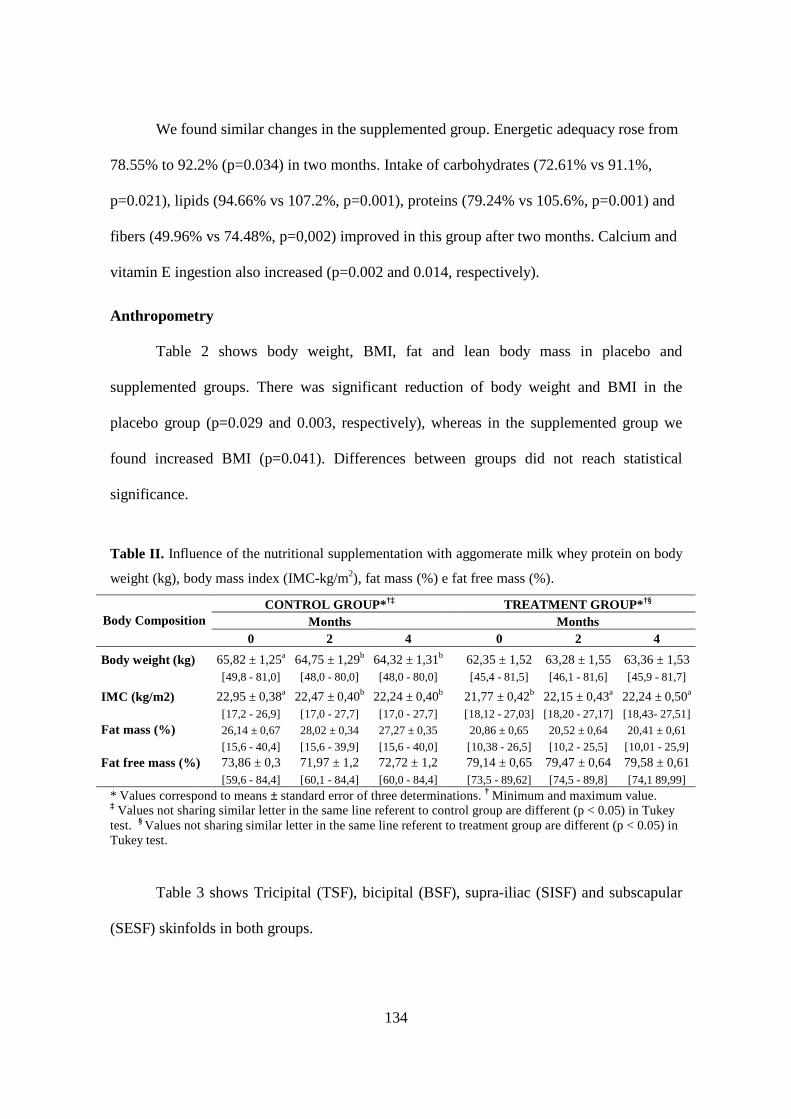
134
We found similar changes in the supplemented group. Energetic adequacy rose from
78.55% to 92.2% (p=0.034) in two months. Intake of carbohydrates (72.61% vs 91.1%,
p=0.021), lipids (94.66% vs 107.2%, p=0.001), proteins (79.24% vs 105.6%, p=0.001) and
fibers (49.96% vs 74.48%, p=0,002) improved in this group after two months. Calcium and
vitamin E ingestion also increased (p=0.002 and 0.014, respectively).
Anthropometry
Table 2 shows body weight, BMI, fat and lean body mass in placebo and
supplemented groups. There was significant reduction of body weight and BMI in the
placebo group (p=0.029 and 0.003, respectively), whereas in the supplemented group we
found increased BMI (p=0.041). Differences between groups did not reach statistical
significance.
Table II. Influence of the nutritional supplementation with aggomerate milk whey protein on body
weight (kg), body mass index (IMC-kg/m2), fat mass (%) e fat free mass (%).
CONTROL GROUP* †‡ TREATMENT GROUP* †§ Months Months Body Composition
0 2 4 0 2 4
Body weight (kg) 65,82 ± 1,25a 64,75 ± 1,29b 64,32 ± 1,31b 62,35 ± 1,52 63,28 ± 1,55 63,36 ± 1,53 [49,8 - 81,0] [48,0 - 80,0] [48,0 - 80,0] [45,4 - 81,5] [46,1 - 81,6] [45,9 - 81,7]
IMC (kg/m2) 22,95 ± 0,38a 22,47 ± 0,40b 22,24 ± 0,40b 21,77 ± 0,42b 22,15 ± 0,43a 22,24 ± 0,50a [17,2 - 26,9] [17,0 - 27,7] [17,0 - 27,7] [18,12 - 27,03] [18,20 - 27,17] [18,43- 27,51] Fat mass (%) 26,14 ± 0,67 28,02 ± 0,34 27,27 ± 0,35 20,86 ± 0,65 20,52 ± 0,64 20,41 ± 0,61 [15,6 - 40,4] [15,6 - 39,9] [15,6 - 40,0] [10,38 - 26,5] [10,2 - 25,5] [10,01 - 25,9]
Fat free mass (%) 73,86 ± 0,3 71,97 ± 1,2 72,72 ± 1,2 79,14 ± 0,65 79,47 ± 0,64 79,58 ± 0,61 [59,6 - 84,4] [60,1 - 84,4] [60,0 - 84,4] [73,5 - 89,62] [74,5 - 89,8] [74,1 89,99]
* Values correspond to means ± standard error of three determinations. † Minimum and maximum value. ‡ Values not sharing similar letter in the same line referent to control group are different (p < 0.05) in Tukey test. § Values not sharing similar letter in the same line referent to treatment group are different (p < 0.05) in Tukey test.
Table 3 shows Tricipital (TSF), bicipital (BSF), supra-iliac (SISF) and subscapular
(SESF) skinfolds in both groups.
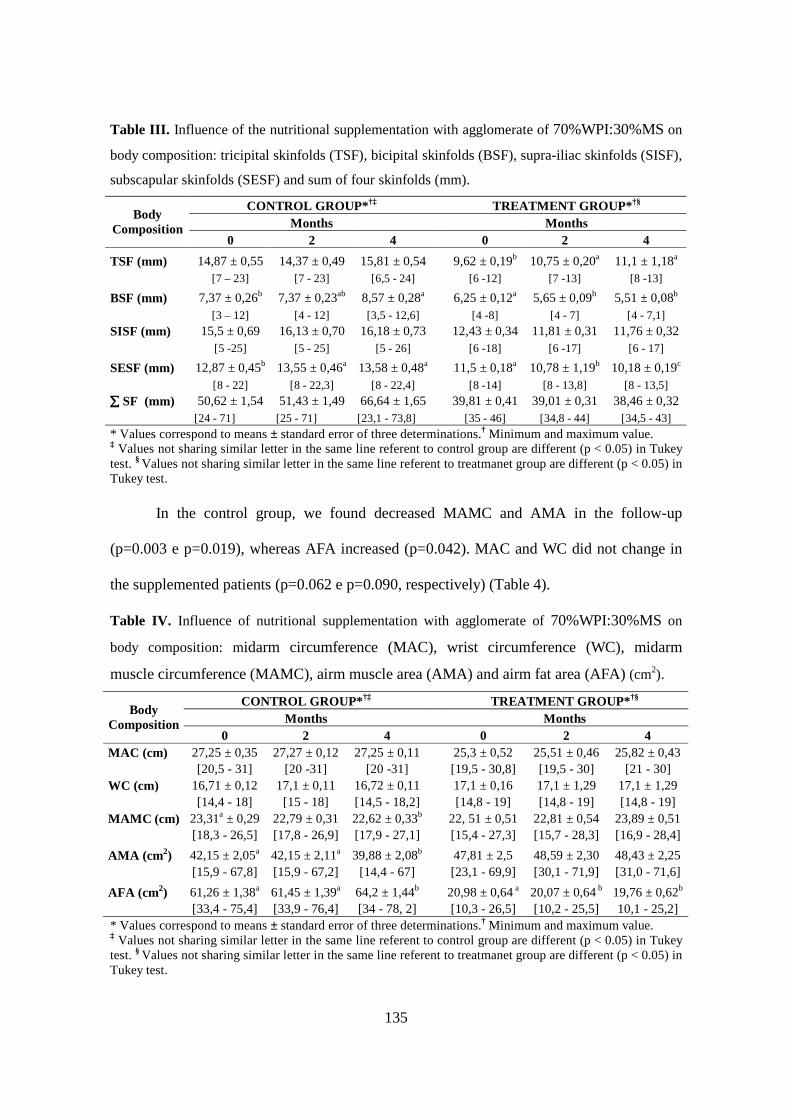
135
Table III. Influence of the nutritional supplementation with agglomerate of 70%WPI:30%MS on
body composition: tricipital skinfolds (TSF), bicipital skinfolds (BSF), supra-iliac skinfolds (SISF),
subscapular skinfolds (SESF) and sum of four skinfolds (mm).
CONTROL GROUP* †‡ TREATMENT GROUP* †§ Months Months
Body Composition
0 2 4 0 2 4
TSF (mm) 14,87 ± 0,55 14,37 ± 0,49 15,81 ± 0,54 9,62 ± 0,19b 10,75 ± 0,20a 11,1 ± 1,18a [7 – 23] [7 - 23] [6,5 - 24] [6 -12] [7 -13] [8 -13]
BSF (mm) 7,37 ± 0,26b 7,37 ± 0,23ab 8,57 ± 0,28a 6,25 ± 0,12a 5,65 ± 0,09b 5,51 ± 0,08b [3 – 12] [4 - 12] [3,5 - 12,6] [4 -8] [4 - 7] [4 - 7,1]
SISF (mm) 15,5 ± 0,69 16,13 ± 0,70 16,18 ± 0,73 12,43 ± 0,34 11,81 ± 0,31 11,76 ± 0,32 [5 -25] [5 - 25] [5 - 26] [6 -18] [6 -17] [6 - 17]
SESF (mm) 12,87 ± 0,45b 13,55 ± 0,46a 13,58 ± 0,48a 11,5 ± 0,18a 10,78 ± 1,19b 10,18 ± 0,19c [8 - 22] [8 - 22,3] [8 - 22,4] [8 -14] [8 - 13,8] [8 - 13,5]
∑∑∑∑ SF (mm) 50,62 ± 1,54 51,43 ± 1,49 66,64 ± 1,65 39,81 ± 0,41 39,01 ± 0,31 38,46 ± 0,32 [24 - 71] [25 - 71] [23,1 - 73,8] [35 - 46] [34,8 - 44] [34,5 - 43] * Values correspond to means ± standard error of three determinations.† Minimum and maximum value. ‡ Values not sharing similar letter in the same line referent to control group are different (p < 0.05) in Tukey test. § Values not sharing similar letter in the same line referent to treatmanet group are different (p < 0.05) in Tukey test.
In the control group, we found decreased MAMC and AMA in the follow-up
(p=0.003 e p=0.019), whereas AFA increased (p=0.042). MAC and WC did not change in
the supplemented patients (p=0.062 e p=0.090, respectively) (Table 4).
Table IV. Influence of nutritional supplementation with agglomerate of 70%WPI:30%MS on
body composition: midarm circumference (MAC), wrist circumference (WC), midarm
muscle circumference (MAMC), airm muscle area (AMA) and airm fat area (AFA) (cm2).
CONTROL GROUP* †‡ TREATMENT GROUP* †§ Months Months
Body Composition
0 2 4 0 2 4 MAC (cm) 27,25 ± 0,35 27,27 ± 0,12 27,25 ± 0,11 25,3 ± 0,52 25,51 ± 0,46 25,82 ± 0,43
[20,5 - 31] [20 -31] [20 -31] [19,5 - 30,8] [19,5 - 30] [21 - 30] WC (cm) 16,71 ± 0,12 17,1 ± 0,11 16,72 ± 0,11 17,1 ± 0,16 17,1 ± 1,29 17,1 ± 1,29 [14,4 - 18] [15 - 18] [14,5 - 18,2] [14,8 - 19] [14,8 - 19] [14,8 - 19] MAMC (cm) 23,31a ± 0,29 22,79 ± 0,31 22,62 ± 0,33b 22, 51 ± 0,51 22,81 ± 0,54 23,89 ± 0,51 [18,3 - 26,5] [17,8 - 26,9] [17,9 - 27,1] [15,4 - 27,3] [15,7 - 28,3] [16,9 - 28,4]
AMA (cm 2) 42,15 ± 2,05a 42,15 ± 2,11a 39,88 ± 2,08b 47,81 ± 2,5 48,59 ± 2,30 48,43 ± 2,25 [15,9 - 67,8] [15,9 - 67,2] [14,4 - 67] [23,1 - 69,9] [30,1 - 71,9] [31,0 - 71,6]
AFA (cm2) 61,26 ± 1,38a 61,45 ± 1,39a 64,2 ± 1,44b 20,98 ± 0,64 a 20,07 ± 0,64 b 19,76 ± 0,62b [33,4 - 75,4] [33,9 - 76,4] [34 - 78, 2] [10,3 - 26,5] [10,2 - 25,5] 10,1 - 25,2] * Values correspond to means ± standard error of three determinations.† Minimum and maximum value. ‡ Values not sharing similar letter in the same line referent to control group are different (p < 0.05) in Tukey test. § Values not sharing similar letter in the same line referent to treatmanet group are different (p < 0.05) in Tukey test.
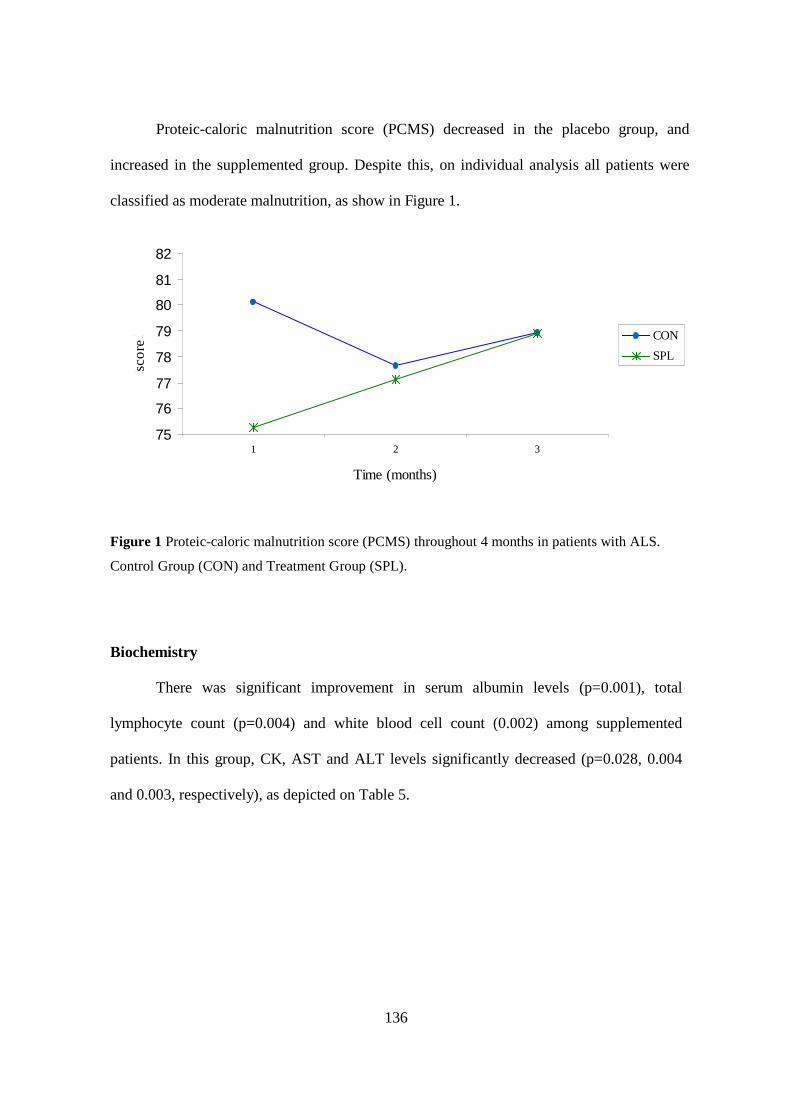
136
Proteic-caloric malnutrition score (PCMS) decreased in the placebo group, and
increased in the supplemented group. Despite this, on individual analysis all patients were
classified as moderate malnutrition, as show in Figure 1.
Figure 1 Proteic-caloric malnutrition score (PCMS) throughout 4 months in patients with ALS.
Control Group (CON) and Treatment Group (SPL).
Biochemistry
There was significant improvement in serum albumin levels (p=0.001), total
lymphocyte count (p=0.004) and white blood cell count (0.002) among supplemented
patients. In this group, CK, AST and ALT levels significantly decreased (p=0.028, 0.004
and 0.003, respectively), as depicted on Table 5.
75
76
77
78
79
80
81
82
1 2 3
Time (months)
Esc
ore
ME
P
CON
SPL

137
Table V. Influence of nutritional supplementation with aggomerate of milk whey protein on
biochemical parameters.
CONTROL GROUP* †‡ TREATMENT GROUP* †§ Months Months Biochemical parameters
0 2 4 0 2 4 C-reative protein (mg/dL) 0,21 ± 0,02 0,21 ± 0,03 0,18 ± 0,02 0,10 ± 001b 0,13 ± 0,01 a 0,12 ± 0,03
[0,04 - 0,7] [0,05 - 0,74] [0,05 - 0,5] [0,02 - 0,23] [0,02 - 0,28] [0,02 - 0,27]
Albumin (g/dL) 4,51 ± 0,03 4,47 ± 0,04 4,48 ± 0,05 4,30 ± 0,05c 4,51 ± 0,03b 4,76 ± 0,01a [4,15 - 4,9] [4,0 - 5,1] [3,9 - 5,3] [3,6 - 4,8] [4,2 - 4,9] [4,4 - 4,9]
Pre-albumin (mg/dL) 28,28 ± 0,74 29 ± 0,85 29,25 ± 0,97 26,32 ± 0,57 30,6 ± 0,54 30,64 ± 0,66 [19,5 - 39,1] [17,2 - 34,3] [19,5 - 36,7] [17,7 - 32,3] [35,4 - 23,6] [24,5 - 39,2]
CK (U/L) 338,75 ± 31,13 310 ± 27,32 335,5 ± 29,39 449,62 ± 30,30a 375 ± 31,57ab 307 ± 12,24b [100 - 774] [87 - 645] [84 - 626] [117 - 795] [87 - 888] [143 - 403]
Urea (mg/dL) 29,5 ± 0,85 29,25 ± 0,97 29,5 ± 1,16 27,49 ± 1,01a 26,12 ± 0,86b 26,75 ± 0,84 [22 - 43] [20 - 45] [17 - 40] [19,9 - 46] [22 - 43] [19 - 42]
Creatine (mg/dL) 0,56 ± 0,02 0,63 ± 0,03 0,57 ± 0,03 0,74 ± 0,02 0,63 ± 0,03 0,61 ± 0,03 [0,39 - 1,02] [0,4 - 1,06] [0,35 - 1,13] [0,35 - 1,02] [0,25 - 1,0] [0,25 - 1,1]
Glucose (mg/dL) 85 ± 1,67 86 ± 1,48 89 ± 1,45 81,62 ± 0,74 80 ± 0,68 80 ± 0,76 [55 - 99] [72 - 103] [76 - 111] [74 - 90] [73 - 88] [69 - 87]
AST (U/L) 27,12 ± 1,09 25,62 ± 0,79 25,25 ± 0,9 28,62 ± 1,2a 27,125 ± 1,1b 26,25 ± 1,35c [13 - 41] [14 - 34] [14 - 37] [19 - 45] [15 - 40] [16 - 42]
ALT (U/L) 28,12 ± 1,29 26,62 ± 1,43 27,125 ± 1,58 32,87 ± 1,95a 31,5 ± 1,85b 27,25 ± 1,76c [10 - 41] [10 - 41] [9 - 47] [8 - 55] [8 - 53] [8 - 47]
Lymphocytes (cels x 103/mm3) 2,36 ± 0,08 2,36 ± 0,11 2,45 ± 0,11 2,04 ± 0,8 2,28 ± 0,05b 2,55 ± 0,06a [1,61 - 3,46] [1,44 - 4,13] [1,64 - 4,02] [0,9 - 3,1] [1,29 - 2,67] [1,58 - 3,12]
Leukocytes (cels x 103/mm3) 7,67 ± 0,25 7,80 ± 0,22 7,64 ± 0,22 6,75 ± 0,18c 7,37 ± 0,19b 8,77 ± 0,24a [4,13 - 9,72] [5,06 - 10,8] [4,47 - 9,87] [4,07 - 9,3] [4,37 - 9,8] [5,8 - 12,55]
Platelets (cels x 103/mm3) 243,75 ± 9,84 237,87 ± 8,34 238,75 ± 8,04 233,62 ± 4,56 235,37 ± 4,9 237,62 ± 4,8 [132 - 376] [131 - 359] [121 - 335] [186 - 291] [192 - 297] [181 - 275]
Potassium (mEq/L) 4,35 ± 0,02 4,32 ± 0,02 4,37 ± 0,03 4,1 ± 0,02 4,07 ± 0,02 4,1 ± 0,02 [4,1 - 4,6] [3,9 - 4,5] [4,0 - 4,7] [3,8 - 4,3] [3,8 - 4,4] [3,8 - 4,3]
Sodium (mEq/L) 139,87 ± 0,36 140,12 ± 0,40 140,25 ± 0,28 139,87 ± 0,19 140,75 ± 0,2 141,62 ± 0,41 [137 - 146] [136 - 145] [137 - 144] [136 - 142] [138 - 143] [138 - 149]
* Values correspond to means ± standard error of three determinations. † Minimum and maximum value. ‡ Values not sharing similar letter in the same line referent to control group are different (p < 0.05) in Tukey test. § Values not sharing similar letter in the same line referent to treatmanet group are different (p < 0.05) in Tukey test.
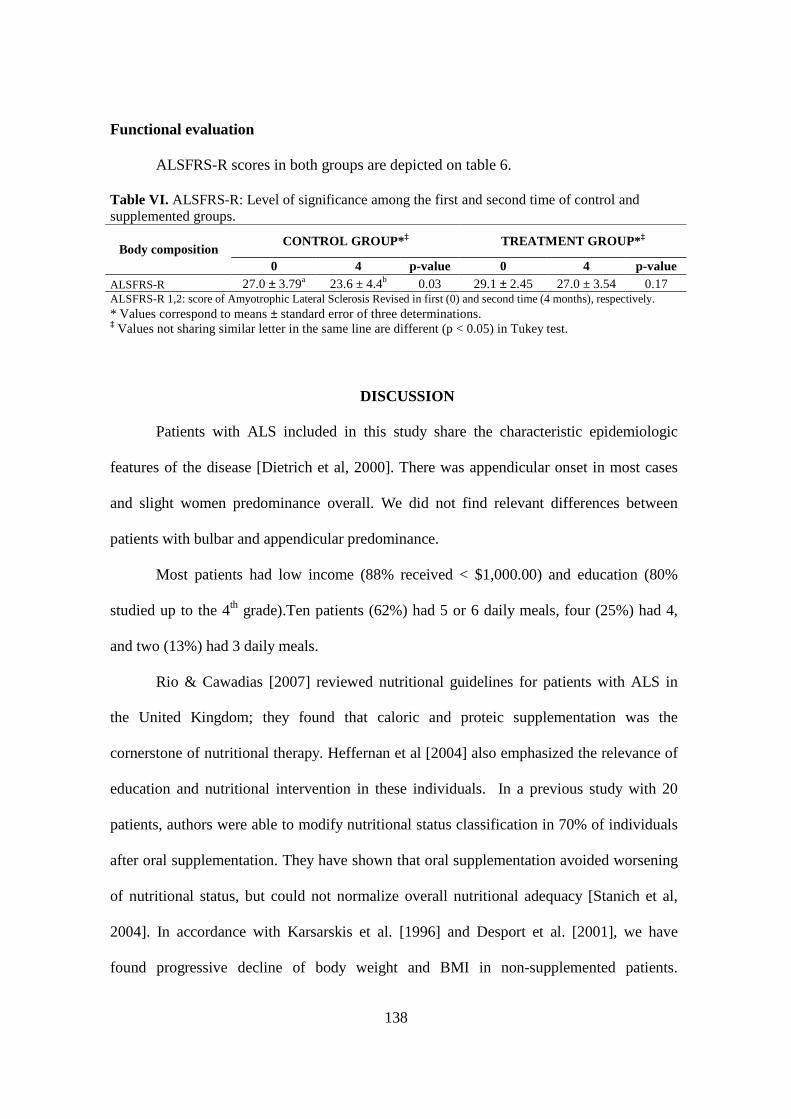
138
Functional evaluation
ALSFRS-R scores in both groups are depicted on table 6.
Table VI. ALSFRS-R: Level of significance among the first and second time of control and supplemented groups.
CONTROL GROUP* ‡ TREATMENT GROUP* ‡ Body composition
0 4 p-value 0 4 p-value ALSFRS-R 27.0 ± 3.79a 23.6 ± 4.4b 0.03 29.1 ± 2.45 27.0 ± 3.54 0.17 ALSFRS-R 1,2: score of Amyotrophic Lateral Sclerosis Revised in first (0) and second time (4 months), respectively. * Values correspond to means ± standard error of three determinations. ‡ Values not sharing similar letter in the same line are different (p < 0.05) in Tukey test.
DISCUSSION
Patients with ALS included in this study share the characteristic epidemiologic
features of the disease [Dietrich et al, 2000]. There was appendicular onset in most cases
and slight women predominance overall. We did not find relevant differences between
patients with bulbar and appendicular predominance.
Most patients had low income (88% received < $1,000.00) and education (80%
studied up to the 4th grade).Ten patients (62%) had 5 or 6 daily meals, four (25%) had 4,
and two (13%) had 3 daily meals.
Rio & Cawadias [2007] reviewed nutritional guidelines for patients with ALS in
the United Kingdom; they found that caloric and proteic supplementation was the
cornerstone of nutritional therapy. Heffernan et al [2004] also emphasized the relevance of
education and nutritional intervention in these individuals. In a previous study with 20
patients, authors were able to modify nutritional status classification in 70% of individuals
after oral supplementation. They have shown that oral supplementation avoided worsening
of nutritional status, but could not normalize overall nutritional adequacy [Stanich et al,
2004]. In accordance with Karsarskis et al. [1996] and Desport et al. [2001], we have
found progressive decline of body weight and BMI in non-supplemented patients.

139
However, BMI improved in patients that received oral supplementation. In this group, fatty
and lean body mass did not decline in the follow-up, leading to higher PCMS.
Skinfolds are a useful clinical method to evaluate body composition, namely the
proportion of fat mass [Waitzberg & Ferrari, 1995]. We found in the placebo group that
BSF and SESF increased in the follow-up, thus suggesting higher proportions of body fat
mass. Increased TSF in supplemented patients may have been caused by higher food intake
during the study. Slowie [1983] identified a relationship between reduced food intake and
smalller TSF. Modifications in TSF may have contributed to improved PCMS scores in this
group.
MAMC and AMA are markers of striated muscle proteic mass [Waitzberg & Ferrari,
1995]. MAC and WC did not change in the follow-up in neither group (Table 4). MAMC
and AMA declined in the placebo group, whereas AFA increased; this may indicate fatty
change in the skeletal muscle due to chronic denervation. MAMC and AMA remained
stable in the supplemented group, but AFA declined, suggesting preserved lean body mass
and reduced fat body mass. Similar findings were reported by Stanich et al. [2004] among
patients with ALS receiving hypercaloric supplementation. Karsarsis et al. [1996] identified
progressive AMA decline over disease course.
Patients in both groups were classified as eutrophic according to BMI. However, PCMS
take into account body composition measures and is therefore a more reliable tool to
evaluate nutritional status. In the placebo group, PCMS were 80.13, 77.67 and 79.93 at the
onset, after 2 months and after 4 months of follow-up, respectively. PCMS progressively
increased among supplemented patients (75.26, 77.13 and 78.89). Despite the different
courses, patients in both groups were classified as moderate malnutrition (70-80%).
Biochemistry analyses showed normal values for albumin, pre-albumin and C-reative
protein (CRP) in pateints with ALS. Kasarskis et al. [1996] previously found that pre-

140
albumin and retinol-binding protein serum levels did not change over disease course. These
results are much similar to the ones observed in our supplemented group. Desport et al
[2001] also found nomal values for CRP, white blood cell and total lymphocyte counts in
ALS. We found increased serum albumin, white blood cell and total lymphocyte counts in
supplemented patients; this may be related to immunomodulatory properties of milk
proteins [Mercier et al. 2004, Sgarbieri 2004]. Muscle turnover, expressed by CK, AST and
ALT levels, also decreased in this group.
ALSFRS-R is a reliable tool useful to predict survival in ALS [Gordon et al. 2007],
survival after mechanical non-invasive ventilation, and to estimate overall functioning of
patients with ALS [Lo-Coco 2007]. ALSFRS-R scores did not change among supplemented
patients (p=0.173), but significantly declined in the placebo group (p=0.003).
CONCLUSIONS
During the study follow-up, intake of carbohydrates, lipids, proteins, fibers, calcium
and vitamin E significantly increased in both placebo and supplemented groups.
BMI, MAMC and AMA declined over time in the placebo group, which received
maltodextrin. In the supplemented group, serum albumin, white blood cell and total
lymphocyte counts increased. Lean body mass seem to be preserved in this group, and
skeletal muscle turnover markers (CK, AST and ALT) declined. The ALSFRS-R scores did
not change in the supplemented group, while patients in the placebo group presented
progressive decline.
Our results indicate that 70%WPI:30%MS improved nutritional status of patients
with ALS, and may be useful in the clinical management of the disease.

141
ACKNOWLEDGEMENT
Authors acknowledge CNPq – Conselho Nacional de Desenvolvimento Científico e
Tecnológico for financial support (PhD fellowship for LBCS).
REFERENCES
ADA. 2002. National Dysphagia Diet: Standardization for Optimal Care. National
Dysphagia Diet Task Force. Chicago, IL: The American Dietetics Association. p 47.
Black LF, Hyatt RE. 1969. Maximal respiratory pressures: normal values and
relationship to age and sex. Am Rev Respir Dis 99:696–702.
Blackburn GL, Havey KB. 1982. Nutritional assessment as a routine in clinical
medicine. Postgrad Med 71:46-63.
Bounous G, Baruchel S, Falutz J, Gold P. 1993. Whey protein as a food supplement in
HIV-seropositive individuals. Clin Invest Med 16:204-9.
Bounous G, Batist G, Gold P. 1989. Immunoenhacing property of dietary whey protein
in mice: role of glutathione. Clin Invest Med 12:154-61.
Bounous G, Gold P. 1991. The biological activity of undenatured dietary whey
proteins: role of glutathione. Clin Invest Med 14:296-309.
Bounous G. 1998. Immuno-enhacing properties of undenatured milk serum protein
isolate in HIV patients. Proc Int Dairy Fed, Brussels, Belgium. P.293-305.
Cedarbaum JM. Stambler N. Malta E. Fuller C. Hilt D. Thurmond B. 1999. The
ALSFRS-R: a revised ALS functional rating scale that incorporates assessments of
respiratory function. Journal Neurol Sci 169:13-21.
Chmiel JF. 1998. Anti-tumor effects of dietary whey protein and its value for head and
neck câncer patients. In International Dairy Federation: Proceedings of the 3rd
International Whey Conference; 1997. Chicago. Brussels, Belgium: International
Dairy Federation. p.310-4.
Chumlea WC, Roche AF, Steinbaugh ML. 1985. Estimating stature from knee height
for persons 60 to 90 years of age. J Am Geriatric Soc 33:116-120.
DeHoog S. 2005. Avaliação do Estado Nutricional. In: Mahan K, Stump SE. editors.
Krause: alimentos, nutrição e dietoterapia. 11th ed São Paulo:Roca. p 372-391
142
Desport JC, Preux PM, Magy L, Boirie Y, Vallat JM, Beaufrère B, Couratier P. 2001.
Factor correlated with hypermetabolism in patients with amyotrophic lateral
sclerosis. Am J Clin Nutr 74:328-34.
Desport JC, Preux PM, Truong TC, Vallat JM, Sautereau D. Couratier P. 1999.
Nutritional status is a prognostics factor for survival in ALS patients. Neurology
53:1059-63.
Diet Pro versão 4.0. 2001. Sistema de suporte à avaliação nutricional e prescrição de
dietas. Monteiro JBR, Esteves EA. Agromídia Software. CD-ROM.
Dietrich-Neto F, Callegaro D, Dias-Tosta E, Silva HA, Ferraz ME, Lima JMB, Oliveira
ASB. 2000. Amyotrophic Lateral Sclerosis in Brazil: 1998 National Survey. Arq
Neuropsiquiatr 58(3-A):607-515.
El Escorial revisited. 1998. Revisited criteria for the diagnosis of ALS.-World
Federation of Neurology research group on motor diseases. A consensus conference
held at Airlie House, Worrenton, Virginia on april 2-4.
Filho JF. 1981. A prática da avaliação física. Rio de Janeiro: Shape. p17-38.
Fisberg RM, Martini LA, Slater B. 2005. Métodos de Inquéritos Alimentares. In:
Fisberg RM, Slater B, Marchioni DML, Martini LA, editors. Inquéritos
Alimentares: Métodos e bases científicos. São Paulo: Manole. p 2-7.
Frisancho AR. 1981. New norms of upper limb fat and muscle areas for assessment of
nutritional status. Am J Clin Nutr 34:540-5.
Gordon PH, Cheng B, Montes J, Doorish C, Albert SM, Mitsumoto H. 2007. Outcome
measures for early phase clinical trials. Amyotroph Lateral Scler Amyotroph Lateral
Scler Other Motor Neuron Disord 27:1-4.
Grant JP, Custer PB, Thurlon J. 1980. Current techniques of nutrition assessment. In
Handbook of total parenteral nutrition. Philadelphia, Sauders. p.12-23.
Hakkak R, Korounian S, Ronis M, Irby D, Kechclana S, Rowland et al. 1999. Dietary
prevention of mammary cancer in multiparous female rats by whey protein, but no
soy protein isolate. Proc Am Assoc Cancer 40:2010.
Heffernan C, Jenkinson C, Holmes T, Feder G, Kupfer R, Leigh R, McGowan PN, Rio
A, Sidhu PS. 2004. Nutritional management in MND/ALS patients: an evidence
based review. Amyotroph Lateral Scler Other Motor Neuron Disord 5:72-83.
Institute of Medicine (IOM) [Internet]. In: Dietary Reference Intakes for energy,
carbohydrate, fiber, fatty acids, cholesterol, protein, and amino acids. Washington,
143
DC: The National Academy Press; 2002 - [cited 2007 July 14]; Available from:
http://www.nap.edu.
Institute of Medicine [Internet]. In: Dietary Reference Intakes for calcium,
phosphorous, magnesium, vitamin D, and fluoride. Washington, DC: The National
Academy Press; 1997 - [cited 2007 July 14]; Available from: http://www.nap.edu.
Institute of Medicine [Internet]. In: Dietary Reference Intakes for vitamin C, vitamin E,
selenium, and carotenoids. Washington, DC: The National Academy Press; 2000 -
[cited 2007 July 14]; Available from: http://www.nap.edu.
Institute of Medicine [Internet]. In: Dietary Reference Intakes for vitamin A, vitamin K,
arsenic, boron, chromium, copper, iodine, iron, manganese, molybdenum, nickel,
silicon, vanadium, and zinc. Washington, DC: The National Academy Press; 2001 -
[cited 2007 July 14]; Available from: http://www.nap.edu.
Kasarskis E, Berryman S, Vanderleest JG, Schneider AR, McClain CJ.1996. Nutritional
status of patients with amyotrophic lateral sclerosis: relation to the proximity of
death. Am J Clin Nutr 63:130-7.
Lo Coco D, Marchese S, La Bella V, Piccoli T, Lo Coco A. 2007. The amyotrophic
lateral sclerosis functional rating scale predicts survival time in amyotrophic lateral
sclerosis patients on invasive mechanical ventilation. Chest 132 (1):64-9.
Lohman TG, Roche AF, Martorell R. 1991. Anthropometric standardization reference
manual. Ed Abrindged. p.31.
Long CL, Schaffel N, Geiger JW, 1979. Metabolic response to injury and illness:
Estimation of energy and protein needs from indirect calorimetry and nitrogen
balance. JPEN 3:452-456.
Mahan, K.; Escott-Stump, S. 2005. Krause: alimentos, nutrição e dietoterapia. 11a ed.
São Paulo: Ed. Roca. p 407.
McIntosh GH, Le Leu RK. 2001. The influence of dietary proteins on colon cancer risk.
Nutr Res 21:1053-66.
Mercier A, Gauthier SF, Fliss I. 2004. Immunomodulating effects of whey proteins and
their enzymatic digests 14:175-183.
National Academic of Sciences. National Research Council. 1989. Recommended
dietary allowances. 10th ed. Washington: National Academic Press.
Norussis MJ. 2006. Statistical Package for Social Science (SPSS) for Windows
Advanced Statistics Release 15.0. Chicago: SPSS.
144
Philippi ST. 2001. Tabela de composição de alimentos: suporte para decisão
nutricional. Brasília. p.133.
Rio A, Cawadias E. 2007. Nutritional advice and treatment by dietitians to patients with
amyotrophic latera sclerosis/motor neurone disease: a survey of current practice in
England, Wales, Northern Ireland and Canada. J Hum Nutr Diet 20:1-13.
Sgarbieri VC. 2004. Propriedades fisiológicas-funcionais das proteínas do soro de leite.
Rev Nutr 17(4):397-409.
Slowie LA, Paige MS, Antel JP. 1983. Nutritional considerations in the management of
patients with ALS amyotrophic lateral sclerosis. J Am Diet Assoc 83:44-7.
Stanich P, Pereira AML, Chiappeta ALML, Nunes M, Oliveira ASB, Gabbai AA. 2004.
Suplementação nutricional em pacientes com doença do neurônio motor/esclerose
lateral amiotrófica. Rev Bras de Nutri Clin 19:70-8.
Strand EA, Miller RM, Yorkston KM, Hillel AD. 1996. Management of oral-
pharyngeal dysphagia symptoms in amyotrophic lateral sclerosis. Dysphagia
11:129-39.
Tabela Brasileira de Composição de Alimentos. 2006. NEPA-UNICAMP-Versão II-2th
ed. Campinas:NEPA-UNICAMP. p113.
U.S.Departament of Agriculture [Internet]. Composition of Foods. Raw, Processed,
Prepared USDA National Nutrient Database for Standard Reference. Release 16.
Nutrient Data Laboratory homepage; 2003 - [cited 2007 July 14]; Available
from:http://www.nal.usda.gov/fnic/foodcomp/Data/SR18/SR18doc.pdf.
Vannucchi H, Menezes EW, Campana AO, Lajolo FM. 1990. Aplicações das
recomendações adaptadas à população brasileira. Ribeirão Preto: Legis Suma.
Waitzberg DL, Ferrini MT. 1995. Avaliação nutricional. In: Waitzberg DL, editor.
Nutrição enteral e parenteral na prática clínica. 2th ed. São Paulo: Atheneu. p127-
152.
Wright L, Cotter D, Hickson M, Frost. 2005. Comparison of energy and protein intakes
of older people consuming a texture modified diet with normal hospital diets. J
Human Nutr Diet 18:213-219.

145
__________________________________________________Conclusões Gerais
8

146
8 CONCLUSÕES GERAIS
Quanto aos resultados a respeito do diagnóstico nutricional, levando em
consideração a ingestão alimentar e a aplicação dos parâmetros de avaliação do estado
nutricional, bem como o efeito da suplementação com aglomerados a base de isolado
protéico do soro de leite para pacientes com esclerose lateral amiotrófica, pôde-se chegar
as seguintes conclusões:
• Na população do estudo, os alimentos mais consumidos diariamente
foram óleo, arroz, feijão, pão francês e leite. Constatou-se inadequação
alimentar para energia, fibras, cálcio e vitamina E. Observou-se
diferença significativa entre pacientes com ELA de predomínio bulbar e
apendicular, sendo que em pacientes com predominancia apendicular,
houve maior ingestão energética, de gordura saturada, monoinsaturada,
além de colesterol e fibras, quando comparados com os de
predominância bulbar. O maior comprometimento na deglutição
verificada nos pacientes com predominância bulbar pode ter
influenciado na ingestão qualitativa e quantitativa. Além das
peculiaridades da doença repercutir na alimentação, a renda per capita
dos pacientes parece ter influenciado no baixo consumo qualitativo de
alimentos;
• Com relação à aglomeração de diferentes fontes protéicas com amido
modificado, o aglomerado contendo 70% de isolado protéico do soro de
leite e 30% de amido modificado (70%WPI:30%AM), apresentou boas
características físico-químicas como perfil aminoacídico, rendimento,
densidade e porosidade, além de elevados valores de viscosidade

147
quando em solução e, dentre os aglomerados estudados, as maiores
notas nos testes sensoriais realizados com pacientes com ELA.
Baseando-se nestes resultados, sugere-se a utilização do aglomerado
70%WPI:30%AM para terapia nutricional de pacientes com ELA;
• Na verificação da adequação e sensibilidade dos instrumentos de
medidas em pacientes com ELA, pôde-se notar que entre os indicadores
do estado nutricional e da função respiratória, foram demonstradas
correlações significantes entre IMC, %PP, escala ALSFRS-R, Pimax e
Pemax. Dentre os indicadores nutricionais, pôde-se notar correlação do
IMC com as variáveis: massa, G%, CB, CP, PCT, PCSE, PCSI, CMB,
AMB e AGB. Com isso, pode ser viabilizada a utilização deste conjunto
de medidas no acompanhamento da evolução clínica de indivíduos com
ELA;
• Quanto a suplementação com o produto elaborado, o 70%WPI:30%AM,
no grupo suplementado verificou-se melhora do estado nutricional geral,
aumento do peso e Índice de Massa Corporal (IMC), circunferência e
área muscular do braço (CMB e AMB), albumina, linfócitos e
leucócitos, diminuindo os marcadores do catabolismo muscular, creatina
quinase, aspartato-amino-transferase e alanina-amino-transferase. No
grupo controle, observou-se diminuição do peso, IMC, CMB e AMB e
aumento da área gordurosa do braço, sem alterações significativas nos
parâmetros bioquímicos;

148
• Com base no exposto, o suplemento 70%WPI:30%AM melhorou o
estado nutricional de indivíduos com ELA, podendo ser utilizado na
prática clínica.

149
_____________________________________________________________Apêndices
9
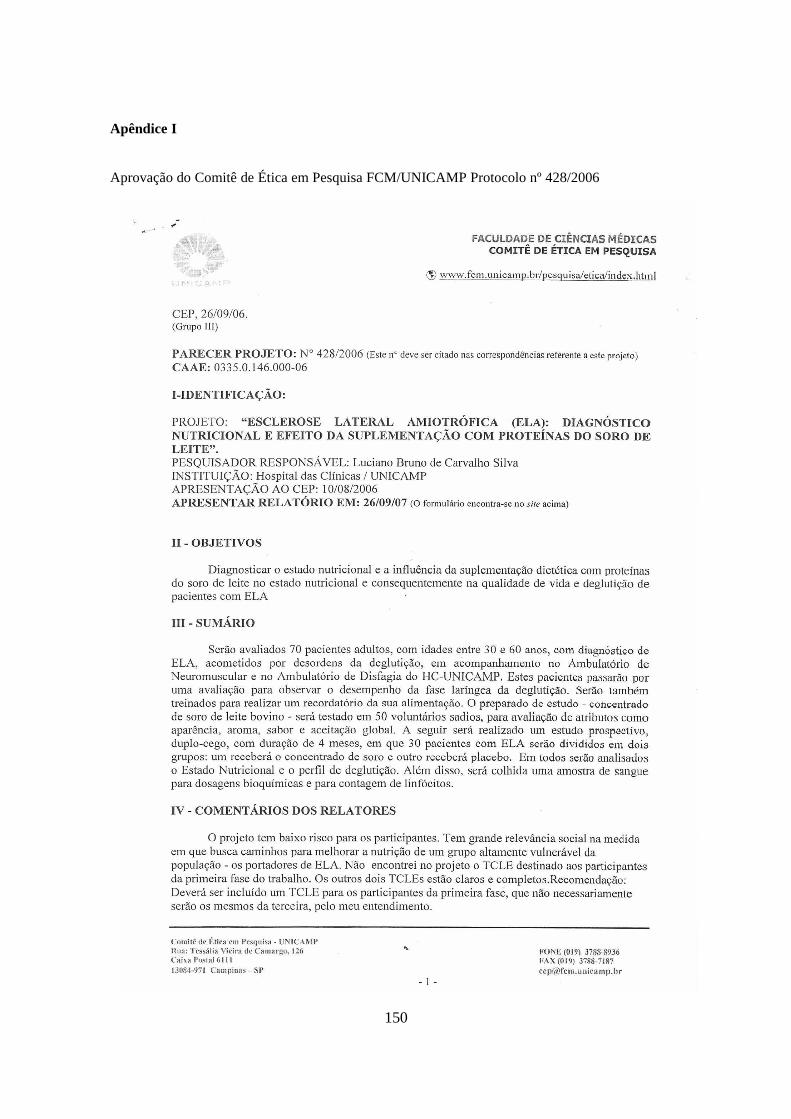
150
Apêndice I
Aprovação do Comitê de Ética em Pesquisa FCM/UNICAMP Protocolo nº 428/2006

151

152
Apêndice II
Termo de Consentimento Livre e Esclarecido
(HC - Grupo CLS e PLA) Declaro por livre e espontânea vontade, que permito a participação de, _______________________________, com idade de ________ anos de HC n ________ com C.I.R.G. de n ____________________, residente á Rua_________________________________________, na pesquisa intitulada “ Esclerose Lateral Amiotrófica: Perfil Nutricional e efeito da suplementação com proteínas do soro de leite” , projeto de tese de doutorado do aluno Luciano Bruno de Carvalho Silva, promovido pela Faculdade de Engenharia de Alimentos e Faculdade de Ciências Médicas da UNICAMP. Sob orientação do Prof. Dr. Jaime Amaya Farfán. Que tem por objetivo, oferecer suplemento alimentar visando melhorar o estado nutricional e estimular o sistema imune. Desconfortos e riscos potenciais: o procedimento que você fará não apresenta risco de qualquer natureza ou desconforto. A proteína do soro de leite já é um ingrediente largamente utilizado pela indústria de alimentos. Neste estudo você receberá a quantidade de suplemento dentro da faixa utilizada pela grande maioria das pesquisas em humanos e dos valores de referência para suplementos protéicos. Sendo assim, comprometo-me a utilizar o suplemento alimentar que for oferecido, bem como, seguir às orientações recebidas quanto ao seu uso. Afirmo ainda que fui informado a respeito dos procedimentos que serão realizados durante o estudo.
a) entrevista com profissional das áreas de nutrição, fonoaudiologia e medicina; b) exames de sangue; c) exames antropométricos (peso, altura, pregas cutâneas, bioimpedância elétrica); d) ingestão do suplemento alimentar que for proposto; e) fornecimento de informações referentes à ingestão alimentar.
Tendo a garantia de receber resposta a qualquer pergunta e esclarecimento e qualquer
dúvida acerca dos assuntos relacionados com a pesquisa e suplementação alimentar Estou ciente que não receberei remuneração em troca da participação, que os dados serão mantidos em sigilo e que posso desistir no momento em que desejar. E que as desistência não acarretará em alteração nos cuidados médicos e orientações que venho recebendo. De acordo, Participante: ___________________________________________________________ Luciano Bruno de Carvalho Silva (19 91943748): ______________________________ Prof. Dr. Jaime Amaya Farfan (19 3521159):_________________________________
Campinas, ____ de _____________ de 2006.
Secretaria do Comitê de Ética em Pesquisa do Hospital de Clínicas–UNICAMP: 19-35218936

153
Apêndice III
Termo de Consentimento Livre e Esclarecido
(Análise Sensorial) Declaro por livre e espontânea vontade, que permito a participação de, ______________________________________________, com idade de ________ anos, com C.I.R.G. de n ____________________, residente á Rua_________________________________________, na pesquisa intitulada: “ Esclerose Lateral Amiotrófica: Perfil Nutricional e efeito da suplementação com proteínas do soro de leite” , projeto de tese de doutorado do aluno Luciano Bruno de Carvalho Silva, promovido pela Faculdade de Engenharia de Alimentos e Faculdade de Ciências Médicas da UNICAMP. Sob orientação do Prof. Dr. Jaime Amaya Farfan. Que tem por objetivo, oferecer suplemento alimentar visando melhorar o estado nutricional e estimular o sistema imune. Nesta etapa será realizada a análise sensorial para indicação prévia do sistema alimentar a ser utilizado na terapia nutricional. Desconfortos e riscos potenciais: o procedimento que você fará não apresenta risco de qualquer natureza ou desconforto. A proteína do soro de leite já é um ingrediente largamente utilizado pela indústria de alimentos. Neste estudo você receberá a quantidade de suplemento dentro da faixa utilizada pela grande maioria das pesquisas em humanos e dos valores de referência para suplementos protéicos. Sendo assim, comprometo-me fazer uma análise da aparência, aroma, sabor, aceitação global. Afirmo ainda que fui informado a respeito dos procedimentos que serão realizados durante o estudo.
Análise de pequenas quantidades de amostra de suco de laranja e leite adicionado do suplemento protéico; dizer o quanto gostou ou desgostou, utilizando uma ficha que lhe será fornecida no momento do teste.
Tendo a garantia de receber resposta a qualquer pergunta e esclarecimento e qualquer dúvida acerca dos assuntos relacionados com a pesquisa e suplementação alimentar. Estou ciente que não receberei remuneração em troca da participação, que os dados serão mantidos em sigilo e que posso desistir no momento em que desejar. E que a desistência não acarretará em alteração nos cuidados médicos e orientações que venho recebendo. De acordo, Participante: ___________________________________________________________ Luciano Bruno de Carvalho Silva (19 91943748): ______________________________ Prof. Dr. Jaime Amaya Farfan (19 35214059):_________________________________
Campinas, ____ de _____________ de 2006. Secretaria do Comitê de Ética em Pesquisa do Hospital de Clínicas–UNICAMP: 19-35218936

154
Apêndice IV 1. IDENTIFICAÇÃO E CONTROLE Id Nome Sexo ( ) M ( ) F Data da entrev. ___/____/___ Data nasc. ___/___/___ Idade Endereço nº
Complemento Bairro CEP Tel. (res) Tel. (cel) Tel. (com) Email: Termo de consentimento ( ) Sim ( ) Não 2. INDICADORES DE SAÚDE Diagnóstico: Pressão arterial x mmHg Toma algum tipo de medicação contínua? ( ) SIM ( ) NÃO Qual? Faz uso de algum tipo de suplemento nutricional? (especialmente para perda de peso ou ganho de massa muscular) ( ) SIM ( ) NÃO Qual? Quantidade Frequência Possui algum tipo de doença cardiovascular? ( ) SIM ( ) NÃO Qual? Possui resistência à insulina e/ou diabetes? ( ) SIM ( ) NÃO Tem ou teve algum tipo de neoplasia? ( ) SIM ( ) NÃO Qual? Quando? Possui algum tipo de desconforto gastrointestinal ao ingerir leite e/ou derivados? ( ) SIM Qual? ( ) NÃO Possui intolerância à lactose? ( ) SIM ( ) NÃO Possui alergia à alguma proteína do leite? (caseína, lactoglobulina e/ou lactoalbumina) ( ) SIM Qual? ( ) NÃO Emagreceu nos últimos 3 meses? ( ) SIM ( ) NÃO %PP: Infecção ( ) SIM ( ) NÃO ( ) NS Qual? Quando? 3. OUTRAS OBSERVAÇÕES
4. MEDIDAS ANTROPOMÉTRICAS Peso P1 = kg P2 = kg P3 = kg Altura A1 = cm A2 = cm A3 = cm Circunferência de braço CB1 = cm CB2 = cm CB3 = cm Circunferência de quadril CQ1 = cm CQ2 = cm CQ3 = cm Circunferência de abdome CA1 = cm CA2 = cm CA3 = cm Prega Triciptal PT1 = mm PT2 = mm PT3 = mm Prega Biciptal PB1 = mm PB2 = mm PB3 = mm Prega Subescapular PSE1 = mm PSE2 = mm PSE3 = mm Prega Suprailíaca PSI1 = mm PSI2 = mm PSI3 = mm
5. IMPEDÂNCIA BIOELÉTRICA (BIA) Reactância 1. mV 2. mV Resistência 1. mV 2. mV

155
Apêndice V
ESCALA HEDÔNICA VERBAL
NOME:__________________________________________DATA:___/___/___
Por favor, avalie as amostras utilizando a escala abaixo para descrever o quanto você gostou ou desgostou do produto. Marque a posição da escala que melhor reflita seu julgamento.
CÓDIGO DA AMOSTRA:___________
CÓDIGO DA AMOSTRA:___________
CÓDIGO DA AMOSTRA:___________
( ) Gostei extremamente ( ) Gostei extremamente ( ) Gostei extremamente ( ) Gostei muito ( ) Gostei muito ( ) Gostei muito ( ) Gostei moderadamente ( ) Gostei moderadamente ( ) Gostei moderadamente ( ) Gostei ligeiramente ( ) Gostei ligeiramente ( ) Gostei ligeiramente ( ) Indiferente ( ) Indiferente ( ) Indiferente ( ) Desgostei ligeiramente ( ) Desgostei ligeiramente ( ) Desgostei ligeiramente ( ) Desgostei moderadamente ( ) Desgostei moderadamente ( ) Desgostei moderadamente ( ) Desgostei muito ( ) Desgostei muito ( ) Desgostei muito ( ) Desgostei extremamente ( ) Desgostei extremamente ( ) Desgostei extremamente
Comentários:_____________________________________________________________________
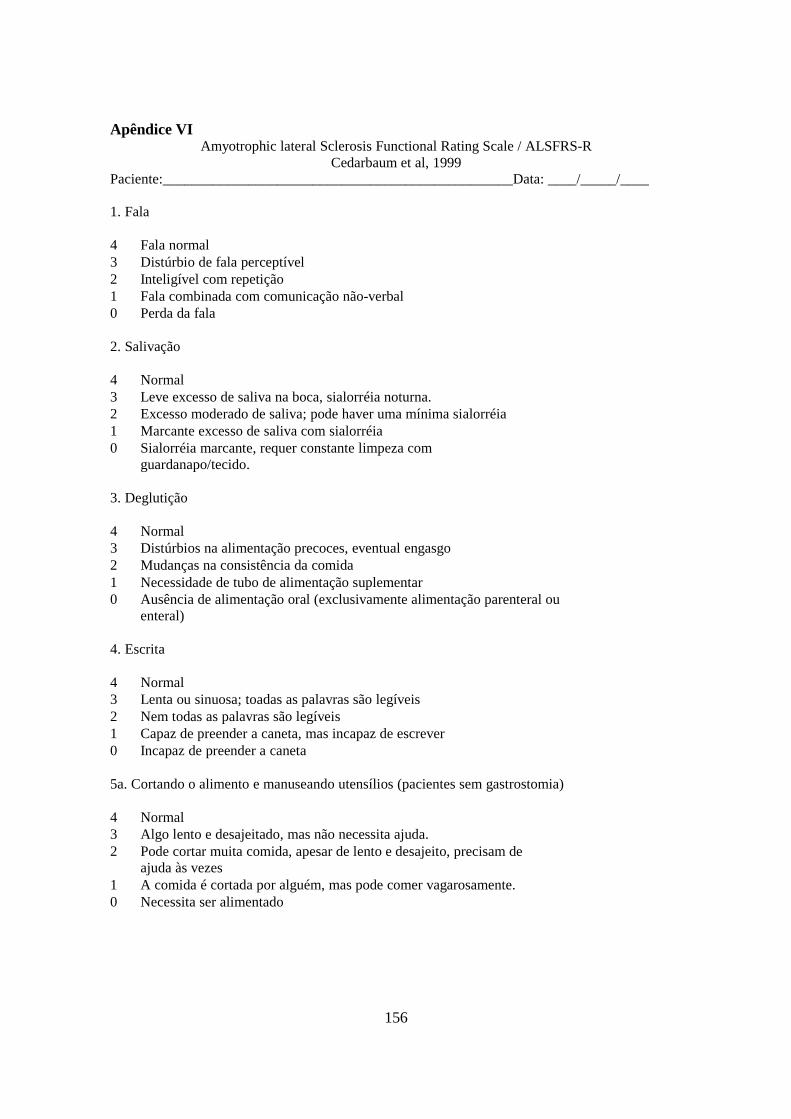
156
Apêndice VI Amyotrophic lateral Sclerosis Functional Rating Scale / ALSFRS-R
Cedarbaum et al, 1999 Paciente:_________________________________________________Data: ____/_____/____
1. Fala 4 Fala normal 3 Distúrbio de fala perceptível 2 Inteligível com repetição 1 Fala combinada com comunicação não-verbal 0 Perda da fala 2. Salivação 4 Normal 3 Leve excesso de saliva na boca, sialorréia noturna. 2 Excesso moderado de saliva; pode haver uma mínima sialorréia 1 Marcante excesso de saliva com sialorréia 0 Sialorréia marcante, requer constante limpeza com
guardanapo/tecido. 3. Deglutição 4 Normal 3 Distúrbios na alimentação precoces, eventual engasgo 2 Mudanças na consistência da comida 1 Necessidade de tubo de alimentação suplementar 0 Ausência de alimentação oral (exclusivamente alimentação parenteral ou
enteral) 4. Escrita 4 Normal 3 Lenta ou sinuosa; toadas as palavras são legíveis 2 Nem todas as palavras são legíveis 1 Capaz de preender a caneta, mas incapaz de escrever 0 Incapaz de preender a caneta 5a. Cortando o alimento e manuseando utensílios (pacientes sem gastrostomia) 4 Normal 3 Algo lento e desajeitado, mas não necessita ajuda. 2 Pode cortar muita comida, apesar de lento e desajeito, precisam de
ajuda às vezes 1 A comida é cortada por alguém, mas pode comer vagarosamente. 0 Necessita ser alimentado

157
5b. Cortando o alimento e manuseando utensílios (escala alternativa para pacientes com
gastrostomia)
4 Normal 3 Desajeitado, mas é capaz de realizar manipulação
independentemente. 2 Necessita alguma ajuda com botões 1 Ajuda mínima do cuidador 0 Incapaz de realizar qualquer tarefa
6. Vestir e higiene
4 Normal 3 Independente e auto-cuidado completo com esforço ou redução da
eficiência 2 Assistência intermitente ou métodos substitutos 1 Necessita assistência no auto-cuidado 0 Total dependência
7. Transferência na cama e ajuste dos lençóis
4 Normal 3 Algo lento e desajeitado, mas não necessita ajuda. 2 Pode ser transferir sozinho ou ajustar o lençol, porém com grande
dificuldade. 1 Consegue iniciar, porém não se transfere ou ajusta o lençol. 0 Necessita ajuda
8. Andar
4 Normal 3 Dificuldade de deambulação precoce 2 Anda com assistência 1 Ausência de movimento ambulatório 0 Sem movimento intencional de membro inferior
9. Subindo escadas
4 Normal 3 Lento 2 Leve instabilidade ou fadiga 1 Necessita assistência 0 Não pode realizar

158
10. Dispnéia
4 Nenhuma 3 Ocorre durante o andar 2 Ocorre em uma ou mais da seqüência: comendo, tomando banho, vestindo-
se (AVD) 1 Ocorre no repouso, dispnéia tanto sentado quanto deitado 0 Dificuldade importante, em uso de suporte ventilatório mecânico
11. Ortopnéia
4 Nenhuma 3 Alguma dificuldade durante o sono a noite devido a incursões curtas,
rotineiramente não se utiliza mais que dois períodos de descanso 2 Necessita descansos extras para dormir (mais de dois) 1 Somente dorme sentado 0 Incapaz de dormir
12. Insuficiência respiratória
4 Nenhuma 3 Uso intermitente do BiPAP 2 Uso contínuo do BiPAP durante a noite 1 Uso contínuo do BiPAP durante a noite e dia 0 Ventilação mecânica invasiva por intubação ou
traqueostomia

159
Apêndice VII Análise Sensorial dos Produtos Aglomerados em Suco de Laranja Comercial – Referente a figura
1 do artigo II - Milk whey proteins for use in oral nutritional therapy for amyotrophic lateral sclerosis patients
Notas dadas pelos pacientes nos testes de aceitação
Amostras
Provadores 493 365 829 147 271 1 7 1 1 6 1 2 6 1 1 5 1 3 9 5 3 6 1 4 8 6 2 7 2 5 8 5 1 7 1 6 8 6 1 7 1 7 8 5 1 8 1 8 6 4 2 8 1 9 9 6 3 8 1 10 6 3 1 7 2 11 6 4 1 8 1 12 7 3 1 8 2 13 8 5 2 8 1 14 7 4 2 7 2 15 8 4 2 6 2 16 7 4 1 7 2 17 7 3 1 8 1 18 6 3 1 8 2 19 7 4 2 7 1 20 7 2 1 8 1 21 7 4 2 7 1 22 6 2 1 8 1 23 7 4 1 7 1 24 6 3 1 7 1 25 6 3 1 6 1 26 6 3 1 6 2 27 6 4 1 7 1 28 6 3 1 6 1 29 7 4 2 6 1 30 7 3 1 6 1 31 7 4 2 6 1 32 7 2 1 8 1 33 7 2 1 6 1 34 7 4 1 6 1 35 7 3 1 6 1
Média 6,97 3,60 1,37 6,91 1,23 Dp 0,86 1,26 0,60 0,89 0,43
Códigos
WPI WPC CasCa WPH Espes Suco 493 365 829 271 147

160
ANOVA
VAR00001
1152,034 4 288,009 402,644 ,000
121,600 170 ,715
1273,634 174
Between Groups
Within Groups
Total
Sum ofSquares df Mean Square F Sig.
Multiple Comparisons
Dependent Variable: VAR00001
3,37143* ,20217 ,000 2,8140 3,9289
5,60000* ,20217 ,000 5,0426 6,1574
-,08571 ,20217 ,993 -,6432 ,4717
5,74286* ,20217 ,000 5,1854 6,3003
-3,37143* ,20217 ,000 -3,9289 -2,8140
2,22857* ,20217 ,000 1,6711 2,7860
-3,45714* ,20217 ,000 -4,0146 -2,8997
2,37143* ,20217 ,000 1,8140 2,9289
-5,60000* ,20217 ,000 -6,1574 -5,0426
-2,22857* ,20217 ,000 -2,7860 -1,6711
-5,68571* ,20217 ,000 -6,2432 -5,1283
,14286 ,20217 ,955 -,4146 ,7003
,08571 ,20217 ,993 -,4717 ,6432
3,45714* ,20217 ,000 2,8997 4,0146
5,68571* ,20217 ,000 5,1283 6,2432
5,82857* ,20217 ,000 5,2711 6,3860
-5,74286* ,20217 ,000 -6,3003 -5,1854
-2,37143* ,20217 ,000 -2,9289 -1,8140
-,14286 ,20217 ,955 -,7003 ,4146
-5,82857* ,20217 ,000 -6,3860 -5,2711
(J) VAR000022,00
3,00
4,00
5,00
1,00
3,00
4,00
5,00
1,00
2,00
4,00
5,00
1,00
2,00
3,00
5,00
1,00
2,00
3,00
4,00
(I) VAR000021,00
2,00
3,00
4,00
5,00
Tukey HSD
MeanDifference
(I-J) Std. Error Sig. Lower Bound Upper Bound
95% Confidence Interval
The mean di fference is significant at the .05 level.*.
VAR00001
35 1,2286
35 1,3714
35 3,6000
35 6,9714
35 7,0571
,955 1,000 ,993
35 1,2286
35 1,3714
35 3,6000
35 6,9714
35 7,0571
,481 1,000 ,672
VAR000025,00
3,00
2,00
1,00
4,00
Sig.
5,00
3,00
2,00
1,00
4,00
Sig.
Tukey HSD a
Duncan a
N 1 2 3
Subset for alpha = .05
Means for g roups in homogeneous subsets are displayed.
Uses Harmonic Mean Sample Size = 35,000.a.

161
Análise Sensorial dos Produtos Aglomerados em Leite – Referente a figura 1 do artigo II - Milk whey proteins for use in oral nutritional therapy for amyotrophic lateral sclerosis patients
Notas dadas pelos pacientes nos testes de aceitação
Amostras
Provadores 739 546 297 177 374 1 6 5 2 5 1 2 5 2 1 5 2 3 5 3 1 5 2 4 6 4 2 5 1 5 6 4 2 5 1 6 6 2 1 5 1 7 6 4 2 6 1 8 6 4 2 6 1 9 6 5 2 6 2 10 8 2 1 6 2 11 5 3 1 5 2 12 6 4 2 6 1 13 7 5 2 5 2 14 6 4 2 6 1 15 5 3 1 5 1 16 6 4 3 6 1 17 5 3 1 5 1 18 6 4 2 4 2 19 3 1 1 4 1 20 6 2 1 5 1 21 3 1 1 6 1 22 5 3 1 5 2 23 5 1 1 6 1 24 4 2 1 5 1 25 5 1 1 6 1 26 6 5 3 5 2 27 6 3 2 5 2 28 5 3 1 5 2 29 7 5 4 5 1 30 6 5 3 5 1 31 5 2 1 5 1 32 6 3 1 5 2 33 6 4 2 6 1 34 6 4 2 5 1 35 6 4 1 6 2
Média 5,60 3,26 1,63 5,29 1,37 Dp 0,98 1,27 0,77 0,57 0,49
Códigos
WPI WPC CasCa WPH Espes Leite 739 546 297 374 177
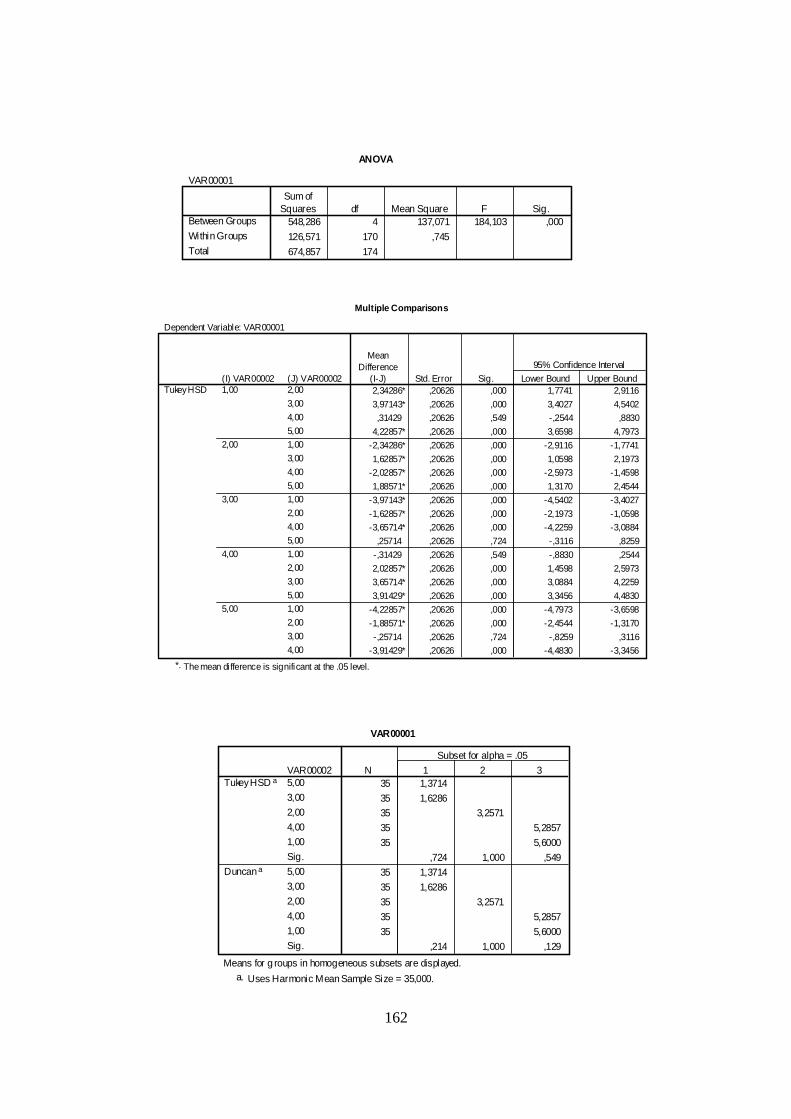
162
ANOVA
VAR00001
548,286 4 137,071 184,103 ,000
126,571 170 ,745
674,857 174
Between Groups
Within Groups
Total
Sum ofSquares df Mean Square F Sig.
Multiple Comparisons
Dependent Variable: VAR00001
2,34286* ,20626 ,000 1,7741 2,9116
3,97143* ,20626 ,000 3,4027 4,5402
,31429 ,20626 ,549 -,2544 ,8830
4,22857* ,20626 ,000 3,6598 4,7973
-2,34286* ,20626 ,000 -2,9116 -1,7741
1,62857* ,20626 ,000 1,0598 2,1973
-2,02857* ,20626 ,000 -2,5973 -1,4598
1,88571* ,20626 ,000 1,3170 2,4544
-3,97143* ,20626 ,000 -4,5402 -3,4027
-1,62857* ,20626 ,000 -2,1973 -1,0598
-3,65714* ,20626 ,000 -4,2259 -3,0884
,25714 ,20626 ,724 -,3116 ,8259
-,31429 ,20626 ,549 -,8830 ,2544
2,02857* ,20626 ,000 1,4598 2,5973
3,65714* ,20626 ,000 3,0884 4,2259
3,91429* ,20626 ,000 3,3456 4,4830
-4,22857* ,20626 ,000 -4,7973 -3,6598
-1,88571* ,20626 ,000 -2,4544 -1,3170
-,25714 ,20626 ,724 -,8259 ,3116
-3,91429* ,20626 ,000 -4,4830 -3,3456
(J) VAR000022,00
3,00
4,00
5,00
1,00
3,00
4,00
5,00
1,00
2,00
4,00
5,00
1,00
2,00
3,00
5,00
1,00
2,00
3,00
4,00
(I) VAR000021,00
2,00
3,00
4,00
5,00
Tukey HSD
MeanDifference
(I-J) Std. Error Sig. Lower Bound Upper Bound
95% Confidence Interval
The mean difference is significant at the .05 level.*.
VAR00001
35 1,3714
35 1,6286
35 3,2571
35 5,2857
35 5,6000
,724 1,000 ,549
35 1,3714
35 1,6286
35 3,2571
35 5,2857
35 5,6000
,214 1,000 ,129
VAR000025,00
3,00
2,00
4,00
1,00
Sig.
5,00
3,00
2,00
4,00
1,00
Sig.
Tukey HSD a
Duncan a
N 1 2 3
Subset for alpha = .05
Means for g roups in homogeneous subsets are displayed.
Uses Harmonic Mean Sample Size = 35,000.a.

163
Análise estatística dos dados referentes a Tabela 1 do Artigo III – Amyotrophic Lateral Sclerosis: combined nutritional, respiratory and functional assessment
Estatística descritiva
Grupo Apendicular
N Minimum Maximum Mean Std. Deviation Idade 13 36,00 69,00 50,6923 9,90273 Tempo_sintomas 13 1,00 9,00 3,9231 2,81252 Escore_bulbar 13 7,00 12,00 10,3077 1,60128 Escore_apendicular 13 1,00 22,00 12,8462 6,14880 Escore_respiratorio 13 6,00 12,00 11,2308 1,69085 Escore_total_escala 13 16,00 43,00 34,3846 7,68699 Pi_max 13 -135,00 -25,00 -61,6923 33,62386 Pe_max 13 10,00 130,00 62,3077 31,46528 Oximetria 13 ,87 ,99 ,9485 ,03051 %MM (massa magra) 12 38,10 92,37 79,6000 14,16775 IMC 12 17,32 29,00 23,7533 4,01553 %PP 12 1,00 29,56 13,2167 10,41573 %Gordura 12 15,60 38,10 24,2750 5,86796 %CVF 9 ,52 1,09 ,8489 ,19114
Grupo Bulbar
N Minimum Maximum Mean Std. Deviation Idade 7 32,00 69,00 45,8571 12,64158 Tempo_sintomas 7 1,00 5,00 2,2857 1,60357 Escore_bulbar 7 4,00 10,00 7,1429 2,34013 Escore_apendicular 7 1,00 23,00 8,1429 8,53285 Escore_respiratorio 7 7,00 12,00 10,8571 1,86445 Escore_total_escala 7 12,00 45,00 26,1429 11,56761 Pi_max 6 -45,00 -5,00 -24,1667 17,72475 Pe_max 5 10,00 70,00 35,0000 25,49510 CVF% 1 0,54 0,54 0,54 0 Oximetria 7 ,86 ,97 ,9400 ,03916 %MM (massa magra) 7 76,57 89,18 84,9500 5,22422 IMC 7 18,18 25,72 20,9943 2,65351 %PP 7 7,40 45,26 16,8100 13,45211 % Gordura 7 19,20 40,00 26,0429 7,06325

164
Análise estatística dos dados referentes a Tabela 2 do Artigo III – Amyotrophic Lateral Sclerosis: combined nutritional, respiratory and functional assessment

165
Análise estatística dos dados referentes a Tabela 3 do Artigo III – Amyotrophic Lateral Sclerosis:
combined nutritional, respiratory and functional assessment
Paired Samples Correlations
N Correlation Sig. Pair 1 Estat1 & Estat2 10 ,484 ,156 Pair 2 Peso1 & Peso2 10 ,327 ,356 Pair 3 IMC1 & IMC2 10 ,553 ,097 Pair 4 PP1 & PP2 10 ,136 ,708 Pair 5 Gpcent & Gpcent2 10 -,453 ,188 Pair 6 Gkg1 & Gkg2 10 ,331 ,351 Pair 7 Fatfree1 & Fatfree2 10 ,331 ,350 Pair 8 Fatfkg & Fatfkg2 10 ,130 ,720 Pair 9 CBI1 & CBI2 10 ,385 ,273 Pair 10 CBn1 & CBn2 10 ,610 ,061 Pair 11 Punhoi1 & Punhoi2 10 ,511 ,131 Pair 12 Punhon1 & Punhon2 10 ,223 ,536 Pair 13 PCT1 & PCT2 10 ,013 ,971 Pair 14 PCB1 & PCB2 10 -,297 ,405 Pair 15 PCSI1 & PCSI2 10 -,190 ,599 Pair 16 PCSE1 & PCSE2 10 ,528 ,117 Pair 17 Soma1 & Soma2 10 ,030 ,935 Pair 18 CMB1 & CMB2 10 ,278 ,438 Pair 19 AMB1 & AMB2 10 ,338 ,340 Pair 20 AGB1 & AGB2 10 ,568 ,087

166
Correlations
1,000 ,127 -,733* ,912** ,215 ,209 -,038 ,535 ,851** ,845** ,576 ,891** ,148 ,661* -,164
. ,726 ,016 ,000 ,551 ,562 ,918 ,111 ,002 ,002 ,082 ,001 ,684 ,038 ,651
10 10 10 10 10 10 10 10 10 10 10 10 10 10 10
,127 1,000 -,709* ,176 -,460 ,763* ,395 ,541 -,155 -,158 -,442 ,115 ,148 -,176 -,236
,726 . ,022 ,626 ,181 ,010 ,258 ,106 ,668 ,663 ,200 ,751 ,684 ,627 ,511
10 10 10 10 10 10 10 10 10 10 10 10 10 10 10
-,733* -,709* 1,000 -,760* ,043 -,634* -,389 -,833** -,478 -,498 -,079 -,733* -,222 -,418 ,333
,016 ,022 . ,011 ,906 ,049 ,267 ,003 ,162 ,143 ,829 ,016 ,538 ,229 ,347
10 10 10 10 10 10 10 10 10 10 10 10 10 10 10
,912** ,176 -,760* 1,000 ,375 ,117 -,019 ,567 ,717* ,881** ,663* ,967** ,420 ,571 -,413
,000 ,626 ,011 . ,285 ,747 ,959 ,087 ,020 ,001 ,037 ,000 ,227 ,084 ,235
10 10 10 10 10 10 10 10 10 10 10 10 10 10 10
,215 -,460 ,043 ,375 1,000 -,611 -,260 ,142 ,132 ,578 ,411 ,399 ,374 ,350 ,141
,551 ,181 ,906 ,285 . ,061 ,467 ,697 ,716 ,080 ,238 ,254 ,287 ,322 ,697
10 10 10 10 10 10 10 10 10 10 10 10 10 10 10
,209 ,763* -,634* ,117 -,611 1,000 ,745* ,407 ,000 -,265 -,375 ,191 -,216 ,025 -,142
,562 ,010 ,049 ,747 ,061 . ,013 ,243 1,000 ,459 ,285 ,598 ,550 ,946 ,696
10 10 10 10 10 10 10 10 10 10 10 10 10 10 10
-,038 ,395 -,389 -,019 -,260 ,745* 1,000 ,315 -,167 -,274 -,370 ,144 -,239 ,075 -,238
,918 ,258 ,267 ,959 ,467 ,013 . ,376 ,644 ,444 ,292 ,691 ,506 ,836 ,507
10 10 10 10 10 10 10 10 10 10 10 10 10 10 10
,535 ,541 -,833** ,567 ,142 ,407 ,315 1,000 ,480 ,427 -,122 ,541 ,173 ,462 -,079
,111 ,106 ,003 ,087 ,697 ,243 ,376 . ,160 ,219 ,738 ,106 ,633 ,179 ,828
10 10 10 10 10 10 10 10 10 10 10 10 10 10 10
,851** -,155 -,478 ,717* ,132 ,000 -,167 ,480 1,000 ,754* ,578 ,690* ,032 ,739* -,068
,002 ,668 ,162 ,020 ,716 1,000 ,644 ,160 . ,012 ,080 ,027 ,931 ,015 ,851
10 10 10 10 10 10 10 10 10 10 10 10 10 10 10
,845** -,158 -,498 ,881** ,578 -,265 -,274 ,427 ,754* 1,000 ,699* ,827** ,340 ,571 -,261
,002 ,663 ,143 ,001 ,080 ,459 ,444 ,219 ,012 . ,024 ,003 ,337 ,084 ,466
10 10 10 10 10 10 10 10 10 10 10 10 10 10 10
,576 -,442 -,079 ,663* ,411 -,375 -,370 -,122 ,578 ,699* 1,000 ,673* ,511 ,406 -,321
,082 ,200 ,829 ,037 ,238 ,285 ,292 ,738 ,080 ,024 . ,033 ,131 ,244 ,365
10 10 10 10 10 10 10 10 10 10 10 10 10 10 10
,891** ,115 -,733* ,967** ,399 ,191 ,144 ,541 ,690* ,827** ,673* 1,000 ,400 ,600 -,370
,001 ,751 ,016 ,000 ,254 ,598 ,691 ,106 ,027 ,003 ,033 . ,252 ,067 ,293
10 10 10 10 10 10 10 10 10 10 10 10 10 10 10
,148 ,148 -,222 ,420 ,374 -,216 -,239 ,173 ,032 ,340 ,511 ,400 1,000 ,235 -,283
,684 ,684 ,538 ,227 ,287 ,550 ,506 ,633 ,931 ,337 ,131 ,252 . ,487 ,428
10 10 10 10 10 10 10 10 10 10 10 10 11 11 10
,661* -,176 -,418 ,571 ,350 ,025 ,075 ,462 ,739* ,571 ,406 ,600 ,235 1,000 ,188
,038 ,627 ,229 ,084 ,322 ,946 ,836 ,179 ,015 ,084 ,244 ,067 ,487 . ,603
10 10 10 10 10 10 10 10 10 10 10 10 11 11 10
-,164 -,236 ,333 -,413 ,141 -,142 -,238 -,079 -,068 -,261 -,321 -,370 -,283 ,188 1,000
,651 ,511 ,347 ,235 ,697 ,696 ,507 ,828 ,851 ,466 ,365 ,293 ,428 ,603 .
10 10 10 10 10 10 10 10 10 10 10 10 10 10 10
Correlation Coefficient
Sig . (2-tailed)
N
Correlation Coefficient
Sig . (2-tailed)
N
Correlation Coefficient
Sig . (2-tailed)
N
Correlation Coefficient
Sig . (2-tailed)
N
Correlation Coefficient
Sig . (2-tailed)
N
Correlation Coefficient
Sig . (2-tailed)
N
Correlation Coefficient
Sig . (2-tailed)
N
Correlation Coefficient
Sig . (2-tailed)
N
Correlation Coefficient
Sig . (2-tailed)
N
Correlation Coefficient
Sig . (2-tailed)
N
Correlation Coefficient
Sig . (2-tailed)
N
Correlation Coefficient
Sig . (2-tailed)
N
Correlation Coefficient
Sig . (2-tailed)
N
Correlation Coefficient
Sig . (2-tailed)
N
Correlation Coefficient
Sig . (2-tailed)
N
IMC
fat
fatfree
CBn
Punhon
PCT
PCB
PCSI
PCSE
CMB
AMB
AGB
Estatura
Massa
PP
Spearman's rhoIMC fat fatfree CBn Punhon PCT PCB PCSI PCSE CMB AMB AGB Estatura Massa PP
Correlation is significant at the 0.05 level (2-tailed).*.
Correlation is significant at the 0.01 level (2-tai led).**.
Análise estatística dos dados referentes a Tabela 4 do Artigo III – Amyotrophic Lateral Sclerosis: combined nutritional, respiratory and functional assessment
Grupo Bulbar

167
Correlations
1,000 ,834** -,955** ,815** ,332 ,701* ,424 ,740** ,814** ,811** ,700* ,791** ,138 ,982** -,400. ,001 ,000 ,002 ,319 ,016 ,194 ,009 ,002 ,002 ,016 ,004 ,685 ,000 ,223
11 11 11 11 11 11 11 11 11 11 11 11 11 11 11
,834** 1,000 -,870** ,695* ,272 ,577 ,700* ,842** ,555 ,660* ,601 ,688* ,109 ,834** -,369
,001 . ,000 ,018 ,419 ,063 ,017 ,001 ,076 ,027 ,050 ,019 ,751 ,001 ,264
11 11 11 11 11 11 11 11 11 11 11 11 11 11 11
-,955** -,870** 1,000 -,870** -,192 -,817** -,530 -,822** -,772** -,788** -,573 -,873** -,332 -,973** ,382
,000 ,000 . ,001 ,572 ,002 ,094 ,002 ,005 ,004 ,066 ,000 ,319 ,000 ,24711 11 11 11 11 11 11 11 11 11 11 11 11 11 11
,815** ,695* -,870** 1,000 ,348 ,921** ,455 ,634* ,914** ,936** ,590 ,993** ,399 ,888** -,449
,002 ,018 ,001 . ,294 ,000 ,160 ,036 ,000 ,000 ,056 ,000 ,224 ,000 ,166
11 11 11 11 11 11 11 11 11 11 11 11 11 11 11
,332 ,272 -,192 ,348 1,000 ,134 ,419 -,031 ,506 ,419 ,659* ,309 -,194 ,271 -,402
,319 ,419 ,572 ,294 . ,695 ,199 ,929 ,112 ,199 ,027 ,356 ,567 ,420 ,220
11 11 11 11 11 11 11 11 11 11 11 11 11 11 11,701* ,577 -,817** ,921** ,134 1,000 ,393 ,543 ,751** ,763** ,274 ,951** ,525 ,808** -,204
,016 ,063 ,002 ,000 ,695 . ,232 ,084 ,008 ,006 ,415 ,000 ,097 ,003 ,547
11 11 11 11 11 11 11 11 11 11 11 11 11 11 11
,424 ,700* -,530 ,455 ,419 ,393 1,000 ,630* ,242 ,393 ,489 ,484 ,332 ,429 -,277
,194 ,017 ,094 ,160 ,199 ,232 . ,038 ,473 ,232 ,127 ,132 ,319 ,188 ,410
11 11 11 11 11 11 11 11 11 11 11 11 11 11 11
,740** ,842** -,822** ,634* -,031 ,543 ,630* 1,000 ,464 ,627* ,534 ,639* ,345 ,763** -,219,009 ,001 ,002 ,036 ,929 ,084 ,038 . ,150 ,039 ,090 ,034 ,299 ,006 ,517
11 11 11 11 11 11 11 11 11 11 11 11 11 11 11
,814** ,555 -,772** ,914** ,506 ,751** ,242 ,464 1,000 ,912** ,694* ,878** ,242 ,837** -,547
,002 ,076 ,005 ,000 ,112 ,008 ,473 ,150 . ,000 ,018 ,000 ,473 ,001 ,082
11 11 11 11 11 11 11 11 11 11 11 11 11 11 11
,811** ,660* -,788** ,936** ,419 ,763** ,393 ,627* ,912** 1,000 ,770** ,893** ,247 ,861** -,478
,002 ,027 ,004 ,000 ,199 ,006 ,232 ,039 ,000 . ,006 ,000 ,464 ,001 ,13711 11 11 11 11 11 11 11 11 11 11 11 11 11 11
,700* ,601 -,573 ,590 ,659* ,274 ,489 ,534 ,694* ,770** 1,000 ,518 -,101 ,636* -,645*
,016 ,050 ,066 ,056 ,027 ,415 ,127 ,090 ,018 ,006 . ,102 ,767 ,035 ,032
11 11 11 11 11 11 11 11 11 11 11 11 11 11 11
,791** ,688* -,873** ,993** ,309 ,951** ,484 ,639* ,878** ,893** ,518 1,000 ,456 ,873** -,400
,004 ,019 ,000 ,000 ,356 ,000 ,132 ,034 ,000 ,000 ,102 . ,158 ,000 ,223
11 11 11 11 11 11 11 11 11 11 11 11 11 11 11,138 ,109 -,332 ,399 -,194 ,525 ,332 ,345 ,242 ,247 -,101 ,456 1,000 ,235 ,147
,685 ,751 ,319 ,224 ,567 ,097 ,319 ,299 ,473 ,464 ,767 ,158 . ,487 ,665
11 11 11 11 11 11 11 11 11 11 11 11 11 11 11
,982** ,834** -,973** ,888** ,271 ,808** ,429 ,763** ,837** ,861** ,636* ,873** ,235 1,000 -,345
,000 ,001 ,000 ,000 ,420 ,003 ,188 ,006 ,001 ,001 ,035 ,000 ,487 . ,298
11 11 11 11 11 11 11 11 11 11 11 11 11 11 11
-,400 -,369 ,382 -,449 -,402 -,204 -,277 -,219 -,547 -,478 -,645* -,400 ,147 -,345 1,000
,223 ,264 ,247 ,166 ,220 ,547 ,410 ,517 ,082 ,137 ,032 ,223 ,665 ,298 .11 11 11 11 11 11 11 11 11 11 11 11 11 11 11
Correlation Coefficient
Sig . (2-tailed)
N
Correlation Coefficient
Sig . (2-tailed)N
Correlation Coefficient
Sig . (2-tailed)
N
Correlation Coefficient
Sig . (2-tailed)
NCorrelation Coefficient
Sig . (2-tailed)
N
Correlation Coefficient
Sig . (2-tailed)
N
Correlation CoefficientSig . (2-tailed)
N
Correlation Coefficient
Sig . (2-tailed)
N
Correlation Coefficient
Sig . (2-tailed)N
Correlation Coefficient
Sig . (2-tailed)
N
Correlation Coefficient
Sig . (2-tailed)
NCorrelation Coefficient
Sig . (2-tailed)
N
Correlation Coefficient
Sig . (2-tailed)
N
Correlation CoefficientSig . (2-tailed)
N
Correlation Coefficient
Sig . (2-tailed)
N
IMC
fat
fatfree
CBn
Punhon
PCT
PCB
PCSI
PCSE
CMB
AMB
AGB
Estatura
Massa
PP
Spearman's rhoIMC fat fatfree CBn Punhon PCT PCB PCSI PCSE CMB AMB AGB Estatura Massa PP
Correlation is significant at the 0.01 level (2-tai led).**.
Correlation is signi ficant at the 0.05 level (2-tailed).*.
Análise estatística dos dados referentes a Tabela 4 do Artigo III – Amyotrophic Lateral Sclerosis: combined nutritional, respiratory and functional assessment
Grupo Apendicular

168
Paired Samples Statistics
,0938 8 ,07029 ,02485
,1125 8 ,11829 ,04182
,0938 8 ,07029 ,02485
,2266 8 ,28147 ,09951,1125 8 ,11829 ,04182
,2266 8 ,28147 ,09951
4,3025 8 ,41272 ,14592
4,5125 8 ,27484 ,09717
4,3025 8 ,41272 ,14592
4,7625 8 ,15980 ,05650
4,5125 8 ,27484 ,097174,7625 8 ,15980 ,05650
26,3250 8 4,59526 1,62467
30,6000 8 4,38797 1,55138
26,3250 8 4,59526 1,62467
30,6375 8 5,33665 1,88679
30,6000 8 4,38797 1,55138
30,6375 8 5,33665 1,88679449,6250 8 242,46587 85,72463
375,0000 8 252,62281 89,31565
449,6250 8 242,46587 85,72463
307,0000 8 97,92125 34,62039
375,0000 8 252,62281 89,31565
307,0000 8 97,92125 34,62039
27,4875 8 8,08445 2,8582929,1250 8 6,87516 2,43074
27,4875 8 8,08445 2,85829
26,7500 8 6,75595 2,38859
29,1250 8 6,87516 2,43074
26,7500 8 6,75595 2,38859
,7375 8 ,23903 ,08451
,6337 8 ,25768 ,09110
,7375 8 ,23903 ,08451,6150 8 ,26699 ,09440
,6337 8 ,25768 ,09110
,6150 8 ,26699 ,09440
81,6250 8 5,99851 2,12079
80,0000 8 5,50325 1,94569
81,6250 8 5,99851 2,12079
80,0000 8 6,09449 2,1547380,0000 8 5,50325 1,94569
80,0000 8 6,09449 2,15473
28,6250 8 9,66492 3,41707
27,1250 8 8,87110 3,13641
28,6250 8 9,66492 3,41707
26,2500 8 10,83315 3,83010
27,1250 8 8,87110 3,1364126,2500 8 10,83315 3,83010
32,8750 8 15,67926 5,54346
31,5000 8 14,81312 5,23723
32,8750 8 15,67926 5,54346
27,2500 8 14,10927 4,98838
31,5000 8 14,81312 5,23723
27,2500 8 14,10927 4,988382,0462 8 ,71370 ,25233
2,2788 8 ,43630 ,15425
2,0462 8 ,71370 ,25233
2,5525 8 ,51325 ,18146
2,2788 8 ,43630 ,15425
2,5525 8 ,51325 ,18146
6,7475 8 1,51454 ,53547
7,3713 8 1,52470 ,539066,7475 8 1,51454 ,53547
8,7738 8 1,93307 ,68344
7,3713 8 1,52470 ,53906
8,7738 8 1,93307 ,68344
233,6250 8 36,48850 12,90063
235,3750 8 39,95332 14,12563
233,6250 8 36,48850 12,90063237,6250 8 38,45568 13,59614
235,3750 8 39,95332 14,12563
237,6250 8 38,45568 13,59614
4,1000 8 ,16903 ,05976
4,0750 8 ,21213 ,07500
4,1000 8 ,16903 ,05976
4,1000 8 ,17728 ,062684,0750 8 ,21213 ,07500
4,1000 8 ,17728 ,06268
139,8750 8 1,55265 ,54894
140,7500 8 1,66905 ,59010
139,8750 8 1,55265 ,54894
141,6250 8 3,29231 1,16401
140,7500 8 1,66905 ,59010141,6250 8 3,29231 1,16401
PCRS1PCRS2
Pair1
PCRS1
PCRS3
Pair2
PCRS2
PCRS3
Pair3
ALBS1
ALBS2
Pair4
ALBS1ALBS3
Pair5
ALBS2
ALBS3
Pair6
PREALBS1
PREALBS2
Pair7
PREALBS1
PREALBS3
Pair8
PREALBS2
PREALBS3
Pair9
CKS1
CKS2
Pair10
CKS1
CKS3
Pair11
CKS2CKS3
Pair12
US1
US2
Pair13
US1
US3
Pair14
US2
US3
Pair15
CRS1
CRS2
Pair16
CRS1
CRS3
Pair17
CRS2
CRS3
Pair18
GLIS1
GLIS2
Pair19
GLIS1
GLIS3
Pair20
GLIS2
GLIS3
Pair21
ASTS1
ASTS2
Pair22
ASTS1ASTS3
Pair23
ASTS2
ASTS3
Pair24
ALTS1
ALTS2
Pair25
ALTS1
ALTS3
Pair26
ALTS2
ALTS3
Pair27
LINFS1
LINFS2
Pair28
LINFS1
LINFS3
Pair29
LINFS2LINFS3
Pair30
LEUCS1
LEUCS2
Pair31
LEUCS1
LEUCS3
Pair32
LEUCS2
LEUCS3
Pair33
PLAQS1PLAQS2
Pair34
PLAQS1
PLAQS3
Pair35
PLAQS2
PLAQS3
Pair36
KS1
KS2
Pair37
KS1
KS3
Pair38
KS2
KS3
Pair39
NAS1
NAS2
Pair40
NAS1NAS3
Pair41
NAS2
NAS3
Pair42
Mean N Std. DeviationStd. Error
Mean
Análise estatística referente a Tabela V do artigo IV - Oral supplementation with milk whey proteins improve nutritional status of patients with amyotrophic lateral sclerosis
Grupo Suplementado

169
Paired Samples Correlations
8 ,631 ,093
8 ,791 ,020
8 ,413 ,309
8 ,927 ,001
8 ,244 ,560
8 ,305 ,463
8 ,175 ,679
8 ,214 ,610
8 ,879 ,004
8 ,660 ,075
8 ,761 ,028
8 ,445 ,269
8 ,864 ,006
8 ,758 ,029
8 ,677 ,065
8 ,912 ,002
8 ,432 ,285
8 ,577 ,134
8 ,701 ,053
8 ,782 ,022
8 ,912 ,002
8 ,884 ,004
8 ,962 ,000
8 ,863 ,006
8 ,897 ,003
8 ,953 ,000
8 ,848 ,008
8 ,625 ,098
8 ,541 ,166
8 ,879 ,004
8 ,943 ,000
8 ,901 ,002
8 ,948 ,000
8 ,923 ,001
8 ,365 ,374
8 ,409 ,314
8 ,478 ,231
8 ,715 ,046
8 ,684 ,061
8 ,593 ,122
8 ,465 ,246
8 ,604 ,112
PCRS1 & PCRS2Pair 1
PCRS1 & PCRS3Pair 2
PCRS2 & PCRS3Pair 3
ALBS1 & ALBS2Pair 4
ALBS1 & ALBS3Pair 5
ALBS2 & ALBS3Pair 6
PREALBS1 & PREALBS2Pair 7
PREALBS1 & PREALBS3Pair 8
PREALBS2 & PREALBS3Pair 9
CKS1 & CKS2Pair 10
CKS1 & CKS3Pair 11
CKS2 & CKS3Pair 12
US1 & US2Pair 13
US1 & US3Pair 14
US2 & US3Pair 15
CRS1 & CRS2Pair 16
CRS1 & CRS3Pair 17
CRS2 & CRS3Pair 18
GLIS1 & GLIS2Pair 19
GLIS1 & GLIS3Pair 20
GLIS2 & GLIS3Pair 21
ASTS1 & ASTS2Pair 22
ASTS1 & ASTS3Pair 23
ASTS2 & ASTS3Pair 24
ALTS1 & ALTS2Pair 25
ALTS1 & ALTS3Pair 26
ALTS2 & ALTS3Pair 27
LINFS1 & LINFS2Pair 28
LINFS1 & LINFS3Pair 29
LINFS2 & LINFS3Pair 30
LEUCS1 & LEUCS2Pair 31
LEUCS1 & LEUCS3Pair 32
LEUCS2 & LEUCS3Pair 33
PLAQS1 & PLAQS2Pair 34
PLAQS1 & PLAQS3Pair 35
PLAQS2 & PLAQS3Pair 36
KS1 & KS2Pair 37
KS1 & KS3Pair 38
KS2 & KS3Pair 39
NAS1 & NAS2Pair 40
NAS1 & NAS3Pair 41
NAS2 & NAS3Pair 42
N Correlation Sig.

170
Paired Samples Test
-,01875 ,09188 ,03248 -,09556 ,05806 -,577 7 ,582
-,13287 ,22996 ,08130 -,32513 ,05938 -1,634 7 ,146
-,11412 ,25631 ,09062 -,32840 ,10015 -1,259 7 ,248
-,21000 ,18883 ,06676 -,36787 -,05213 -3,146 7 ,016
-,46000 ,40455 ,14303 -,79821 -,12179 -3,216 7 ,015
-,25000 ,27255 ,09636 -,47786 -,02214 -2,594 7 ,036
-4,27500 5,77253 2,04090 -9,10096 ,55096 -2,095 7 ,074
-4,31250 6,25150 2,21024 -9,53888 ,91388 -1,951 7 ,092
-,03750 2,56010 ,90513 -2,17780 2,10280 -,041 7 ,968
74,62500 204,43087 72,27723 -96,28349 245,53349 1,032 7 ,336
142,62500 179,54223 63,47776 -7,47606 292,72606 2,247 7 ,059
68,00000 226,68039 80,14362 -121,510 257,50955 ,848 7 ,424
-1,63750 4,07008 1,43899 -5,04017 1,76517 -1,138 7 ,293
,73750 5,30847 1,87683 -3,70049 5,17549 ,393 7 ,706
2,37500 5,47560 1,93592 -2,20271 6,95271 1,227 7 ,260
,10375 ,10555 ,03732 ,01551 ,19199 2,780 7 ,027
,12250 ,27065 ,09569 -,10377 ,34877 1,280 7 ,241
,01875 ,24151 ,08539 -,18316 ,22066 ,220 7 ,832
1,62500 4,47014 1,58043 -2,11213 5,36213 1,028 7 ,338
1,62500 3,99777 1,41342 -1,71722 4,96722 1,150 7 ,288
,00000 2,50713 ,88641 -2,09602 2,09602 ,000 7 1,000
1,50000 4,53557 1,60357 -2,29183 5,29183 ,935 7 ,381
2,37500 3,06769 1,08459 -,18965 4,93965 2,190 7 ,065
,87500 5,48862 1,94052 -3,71360 5,46360 ,451 7 ,666
1,37500 6,96804 2,46357 -4,45043 7,20043 ,558 7 ,594
5,62500 4,80885 1,70018 1,60470 9,64530 3,308 7 ,013
4,25000 8,01338 2,83316 -2,44935 10,94935 1,500 7 ,177
-,23250 ,55726 ,19702 -,69838 ,23338 -1,180 7 ,277
-,50625 ,61356 ,21693 -1,01920 ,00670 -2,334 7 ,052
-,27375 ,24512 ,08666 -,47868 -,06882 -3,159 7 ,016
-,62375 ,51428 ,18183 -1,05370 -,19380 -3,430 7 ,011
-2,02625 ,86951 ,30742 -2,75318 -1,29932 -6,591 7 ,000
-1,40250 ,68600 ,24254 -1,97601 -,82899 -5,783 7 ,001
-1,75000 15,35066 5,42728 -14,58348 11,08348 -,322 7 ,757
-4,00000 42,27123 14,94514 -39,33964 31,33964 -,268 7 ,797
-2,25000 42,63717 15,07452 -37,89557 33,39557 -,149 7 ,886
,02500 ,19821 ,07008 -,14070 ,19070 ,357 7 ,732
,00000 ,13093 ,04629 -,10946 ,10946 ,000 7 1,000
-,02500 ,15811 ,05590 -,15719 ,10719 -,447 7 ,668
-,87500 1,45774 ,51539 -2,09370 ,34370 -1,698 7 ,133
-1,75000 2,91548 1,03078 -4,18740 ,68740 -1,698 7 ,133
-,87500 2,64237 ,93422 -3,08408 1,33408 -,937 7 ,380
PCRS1 - PCRS2Pair 1
PCRS1 - PCRS3Pair 2
PCRS2 - PCRS3Pair 3
ALBS1 - ALBS2Pair 4
ALBS1 - ALBS3Pair 5
ALBS2 - ALBS3Pair 6
PREALBS1 - PREALBS2Pair 7
PREALBS1 - PREALBS3Pair 8
PREALBS2 - PREALBS3Pair 9
CKS1 - CKS2Pair 10
CKS1 - CKS3Pair 11
CKS2 - CKS3Pair 12
US1 - US2Pair 13
US1 - US3Pair 14
US2 - US3Pair 15
CRS1 - CRS2Pair 16
CRS1 - CRS3Pair 17
CRS2 - CRS3Pair 18
GLIS1 - GLIS2Pair 19
GLIS1 - GLIS3Pair 20
GLIS2 - GLIS3Pair 21
ASTS1 - ASTS2Pair 22
ASTS1 - ASTS3Pair 23
ASTS2 - ASTS3Pair 24
ALTS1 - ALTS2Pair 25
ALTS1 - ALTS3Pair 26
ALTS2 - ALTS3Pair 27
LINFS1 - LINFS2Pair 28
LINFS1 - LINFS3Pair 29
LINFS2 - LINFS3Pair 30
LEUCS1 - LEUCS2Pair 31
LEUCS1 - LEUCS3Pair 32
LEUCS2 - LEUCS3Pair 33
PLAQS1 - PLAQS2Pair 34
PLAQS1 - PLAQS3Pair 35
PLAQS2 - PLAQS3Pair 36
KS1 - KS2Pair 37
KS1 - KS3Pair 38
KS2 - KS3Pair 39
NAS1 - NAS2Pair 40
NAS1 - NAS3Pair 41
NAS2 - NAS3Pair 42
Mean Std. DeviationStd. Error
Mean Lower Upper
95% ConfidenceInterval of theDifference
Paired Differences
t df Sig. (2-tailed)