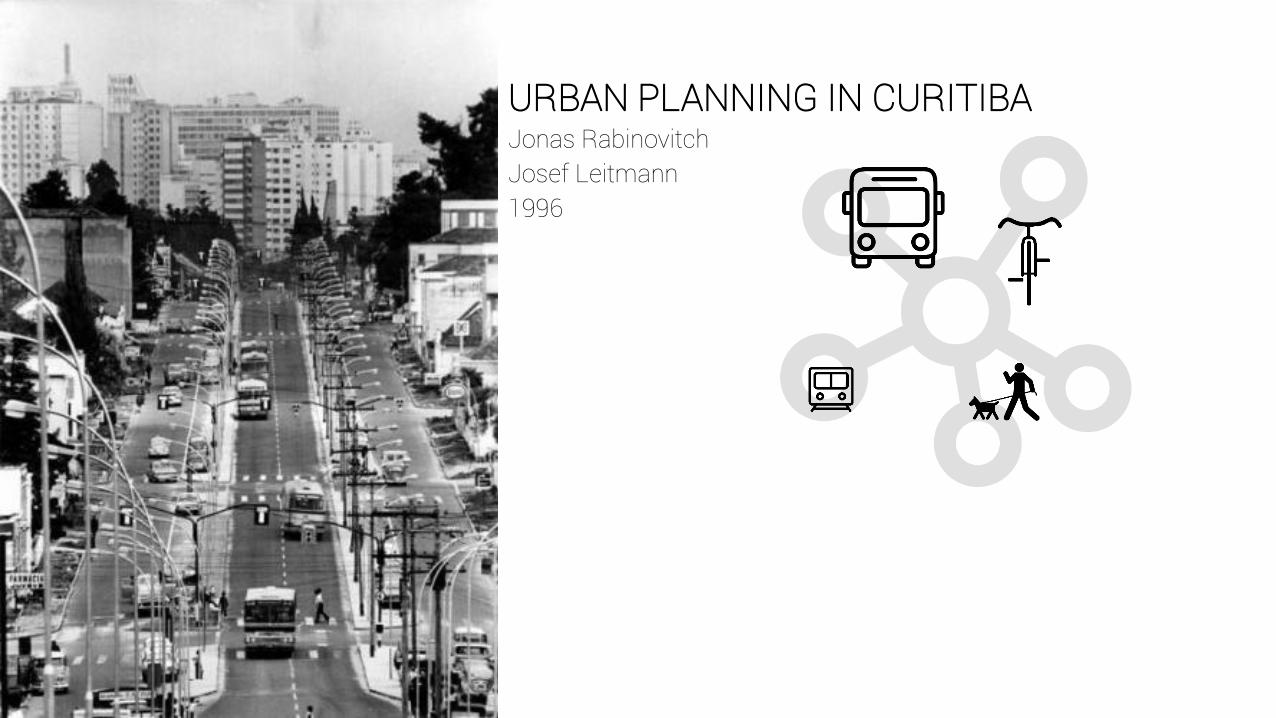
URBAN PLANNING IN CURITIBAJonas Rabinovitch
Josef Leitmann
1996
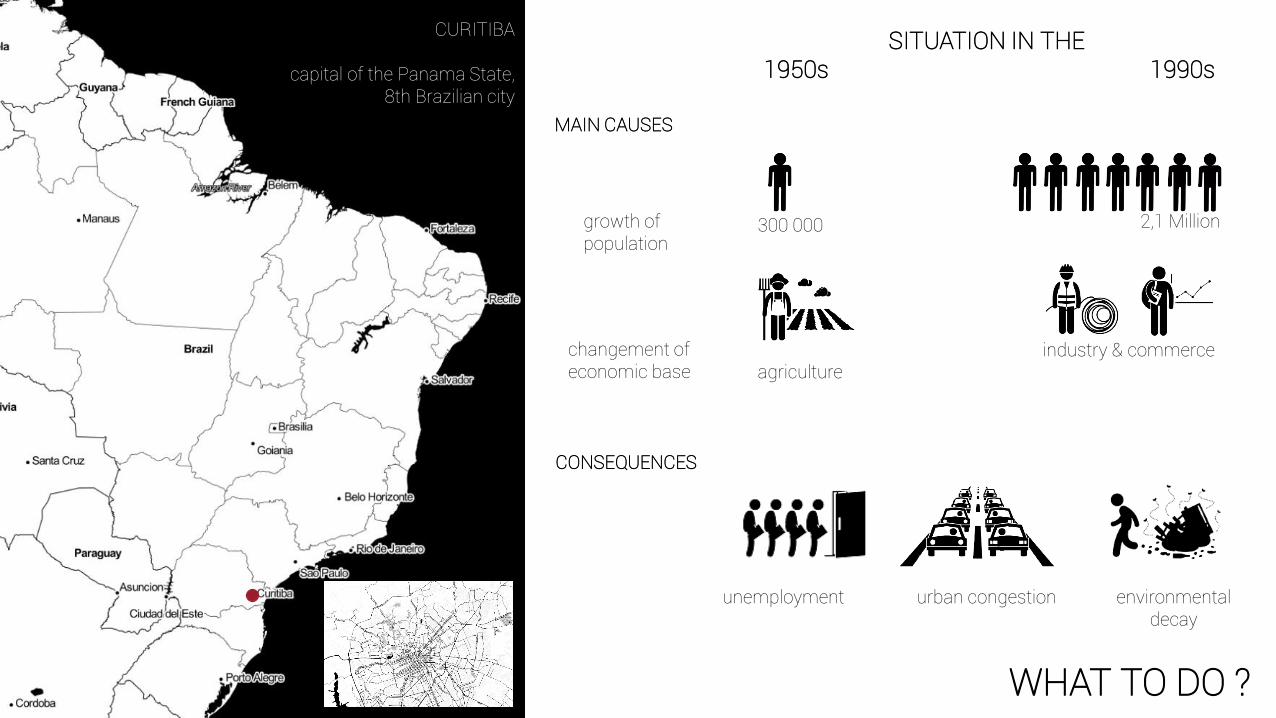
SITUATION IN THE 1950s 1990s
growth of population
changement of economic base
300 000 2,1 Million
agricultureindustry & commerce
MAIN CAUSES
CONSEQUENCES
unemployment urban congestion environmentaldecay
WHAT TO DO ?
CURITIBA
capital of the Panama State, 8th Brazilian city
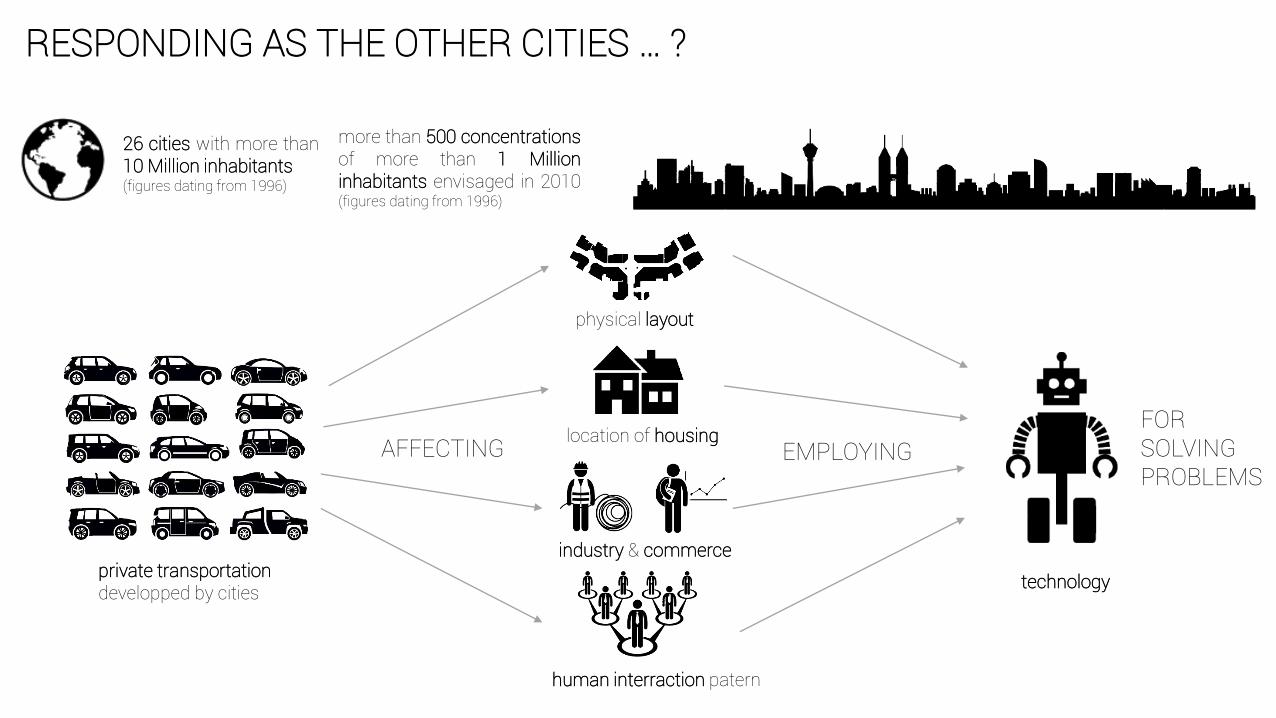
RESPONDING AS THE OTHER CITIES … ?
more than 500 concentrationsof more than 1 Millioninhabitants envisaged in 2010(figures dating from 1996)
26 cities with more than10 Million inhabitants(figures dating from 1996)
private transportation developped by cities
physical layout
location of housing
industry & commerce
human interraction patern
AFFECTING EMPLOYING
technology
FOR SOLVING PROBLEMS
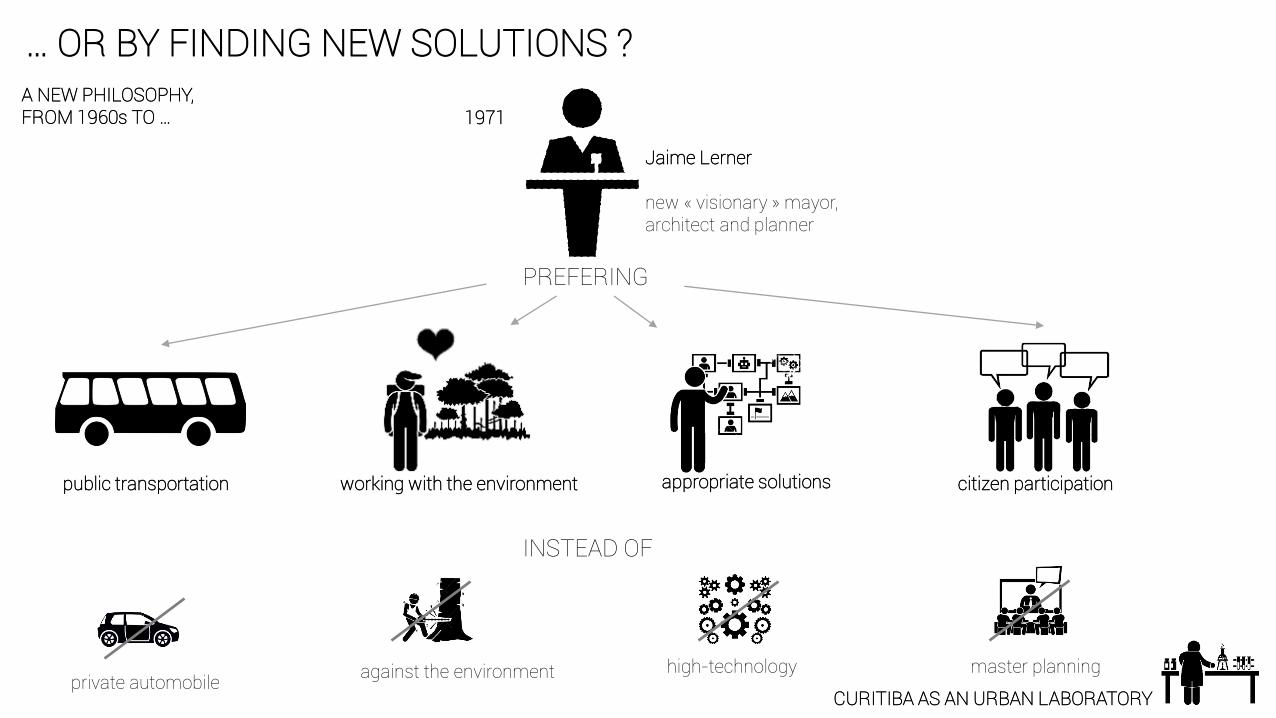
… OR BY FINDING NEW SOLUTIONS ?
CURITIBA AS AN URBAN LABORATORY
Jaime Lerner
new « visionary » mayor,architect and planner
PREFERING
public transportation
private automobile
INSTEAD OF
against the environment
working with the environment appropriate solutions
high-technology
citizen participation
master planning
A NEW PHILOSOPHY, FROM 1960s TO … 1971
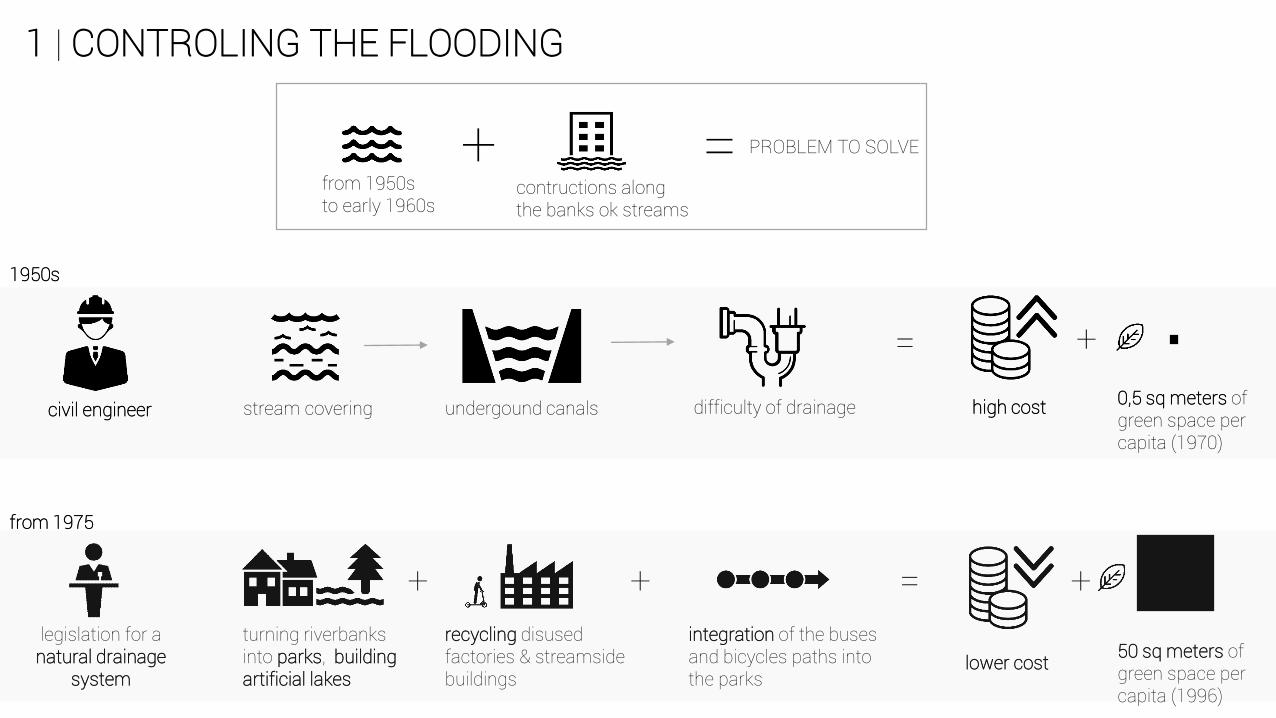
1 | CONTROLING THE FLOODING
contructions alongthe banks ok streams
civil engineer stream covering undergound canals difficulty of drainage high cost
1950s
+ = PROBLEM TO SOLVE
legislation for a natural drainage
system
turning riverbanksinto parks, building artificial lakes
recycling disusedfactories & streamsidebuildings
lower cost
0,5 sq meters of green space per capita (1970)
50 sq meters of green space per capita (1996)
from 1950s to early 1960s
from 1975
integration of the buses and bicycles paths intothe parks
+ + +
+
=
=
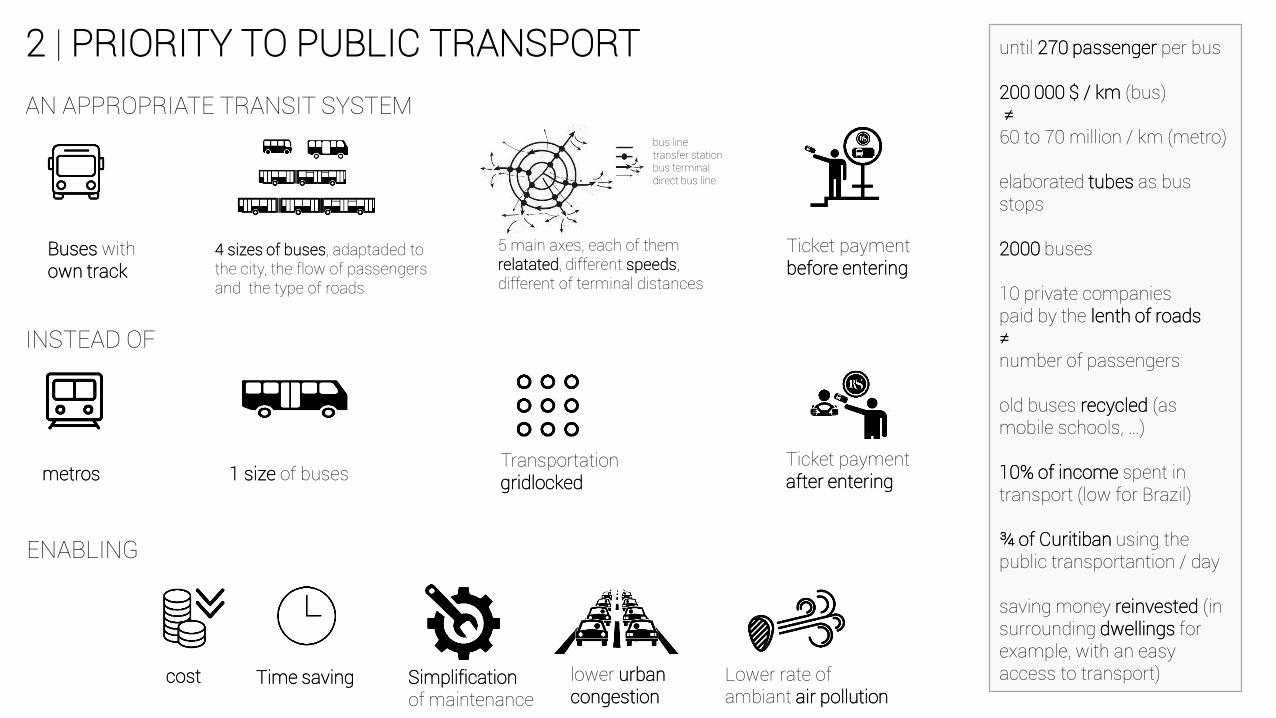
2 | PRIORITY TO PUBLIC TRANSPORT
INSTEAD OF
AN APPROPRIATE TRANSIT SYSTEM
ENABLING
Buses withown track
metros
4 sizes of buses, adaptaded to the city, the flow of passengersand the type of roads
5 main axes, each of themrelatated, different speeds, different of terminal distances
bus linetransfer station bus terminaldirect bus line
Ticket paymentbefore entering
Ticket paymentafter entering1 size of buses
Transportationgridlocked
cost Time saving Simplification of maintenance
lower urbancongestion
Lower rate of ambiant air pollution
until 270 passenger per bus
200 000 $ / km (bus) ≠
60 to 70 million / km (metro)
elaborated tubes as bus stops
2000 buses
10 private companiespaid by the lenth of roads≠ number of passengers
old buses recycled (as mobile schools, …)
10% of income spent in transport (low for Brazil)
¾ of Curitiban using the public transportantion / day
saving money reinvested (in surrounding dwellings for example, with an easyaccess to transport)
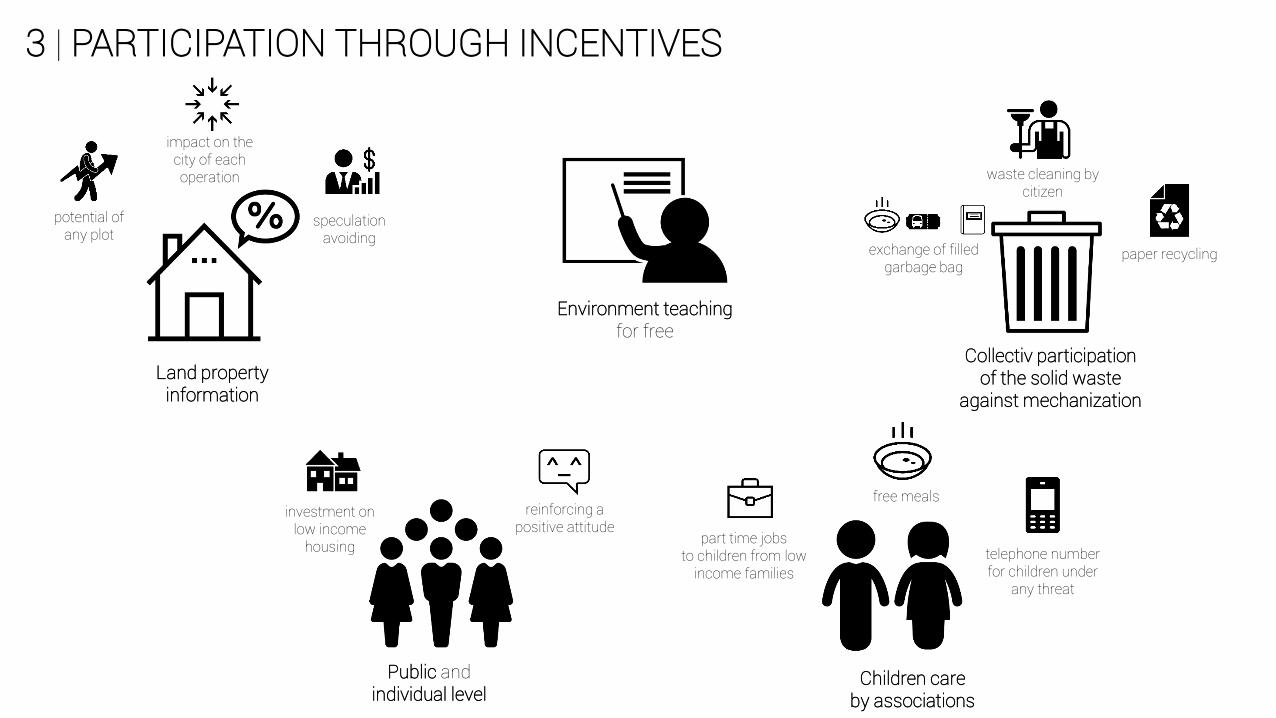
3 | PARTICIPATION THROUGH INCENTIVES
Environment teachingfor free
Children careby associations
Collectiv participation of the solid waste
against mechanization
potential of any plot
Land propertyinformation
impact on the city of eachoperation
speculationavoiding
investment on low income
housing
reinforcing a positive attitude
free meals
telephone numberfor children under
any threat
part time jobsto children from low
income families
exchange of filledgarbage bag
waste cleaning by citizen
paper recycling
Public andindividual level
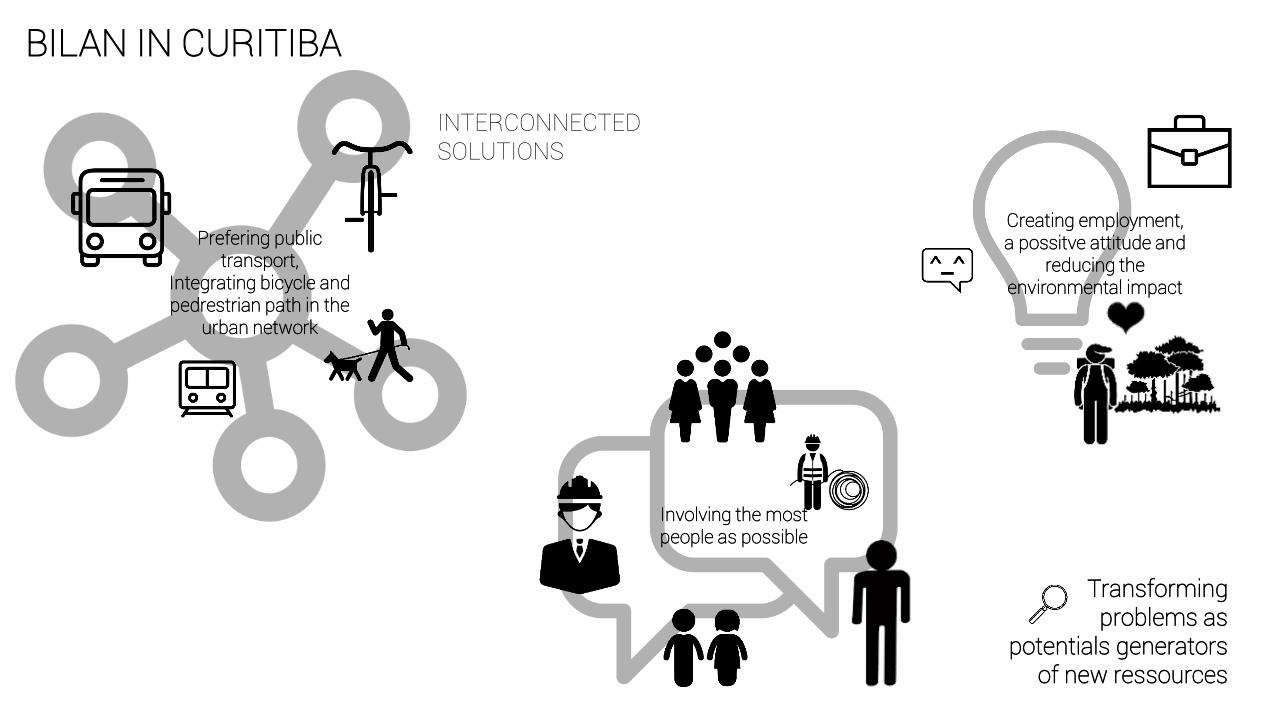
BILAN IN CURITIBA
Prefering public transport,
Integrating bicycle and pedrestrian path in the
urban network
INTERCONNECTED SOLUTIONS
Involving the mostpeople as possible
Transformingproblems as
potentials generatorsof new ressources
Creating employment, a possitve attitude and
reducing the environmental impact
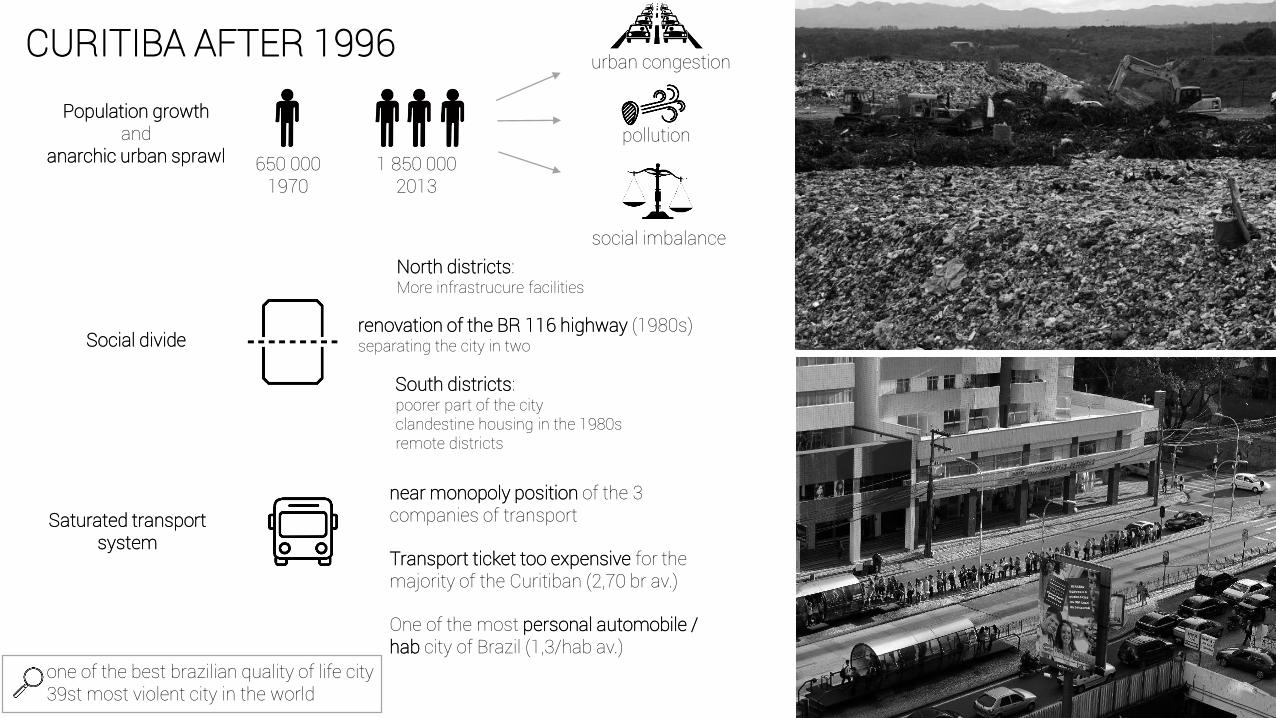
CURITIBA AFTER 1996
Population growthand
anarchic urban sprawl 650 000 1970
1 850 0002013
urban congestion
pollution
social imbalance
Social divide
South districts:poorer part of the city clandestine housing in the 1980sremote districts
North districts:More infrastrucure facilities
renovation of the BR 116 highway (1980s) separating the city in two
Saturated transport system
near monopoly position of the 3 companies of transport
Transport ticket too expensive for the majority of the Curitiban (2,70 br av.)
One of the most personal automobile / hab city of Brazil (1,3/hab av.)
one of the best brazilian quality of life city 39st most violent city in the world
Recommended