Embed Size (px)
Citation preview
ACIT 2015 Amman 1
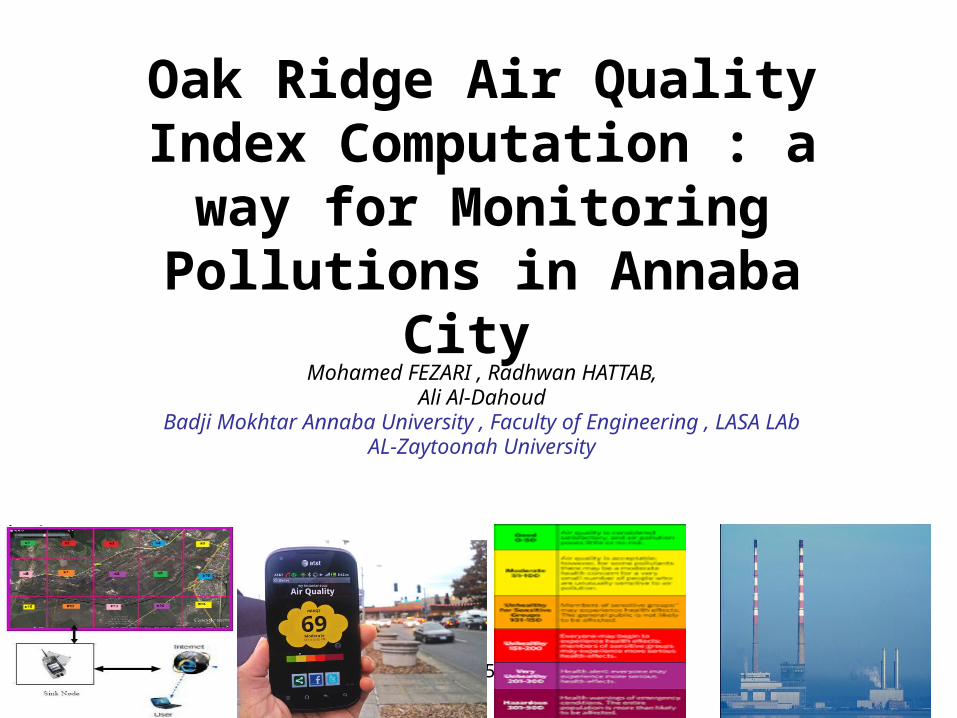
Oak Ridge Air Quality Index Computation : a way for Monitoring Pollutions in
Annaba City Mohamed FEZARI , Radhwan HATTAB,
Ali Al-DahoudBadji Mokhtar Annaba University , Faculty of Engineering , LASA
LAbAL-Zaytoonah University

ACIT 2015 Amman 2
Introduction 1• Wireless sensor networks (WSN) have been involved in different
applications including monitoring many environmental phenomena such as air quality assessment, forest fire monitoring, flood rivers control.
• In this paper, a WSN architecture where nodes are equipped with gas , temperature and dust sensors and DSPIC-30 as microcontroller have been designed for air quality monitoring for some sensible area in Annaba City East of Algeria.
• A AQI algorithm has been selected and implemented on the node in order to reduce wireless communication between nodes and sink gate.
ACIT 2015 Amman 3
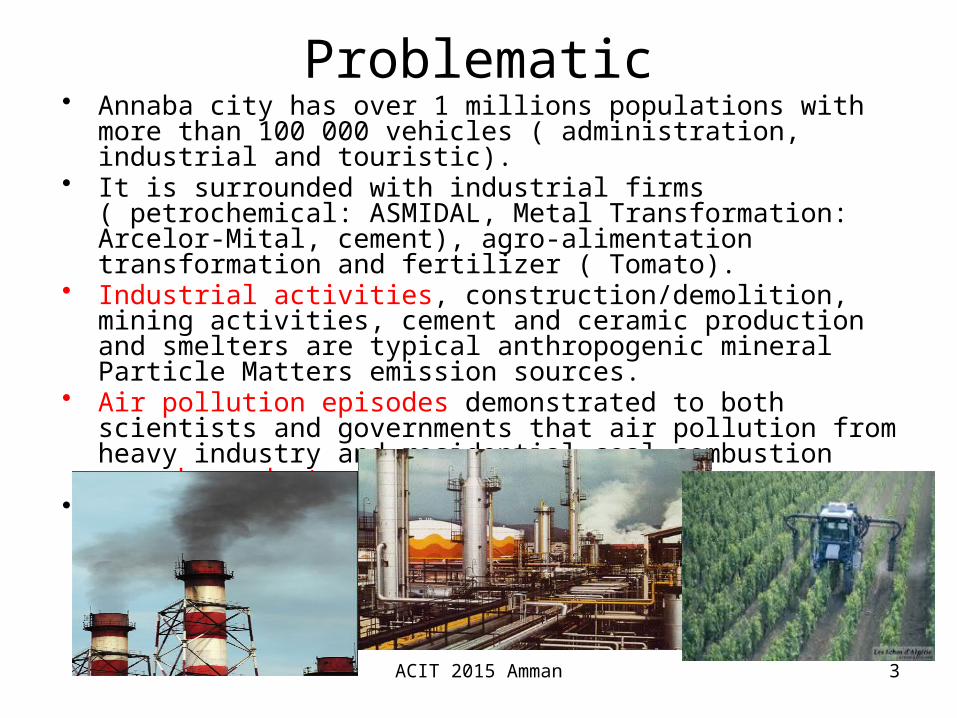
Problematic• Annaba city has over 1 millions populations with more than 100 000
vehicles ( administration, industrial and touristic).• It is surrounded with industrial firms ( petrochemical: ASMIDAL,
Metal Transformation: Arcelor-Mital, cement), agro-alimentation transformation and fertilizer ( Tomato).
• Industrial activities, construction/demolition, mining activities, cement and ceramic production and smelters are typical anthropogenic mineral Particle Matters emission sources.
• Air pollution episodes demonstrated to both scientists and governments that air pollution from heavy industry and residential coal combustion were hazards to public health.
• This leads us to investigate the effect of air pollution on population health.
ACIT 2015 Amman 4
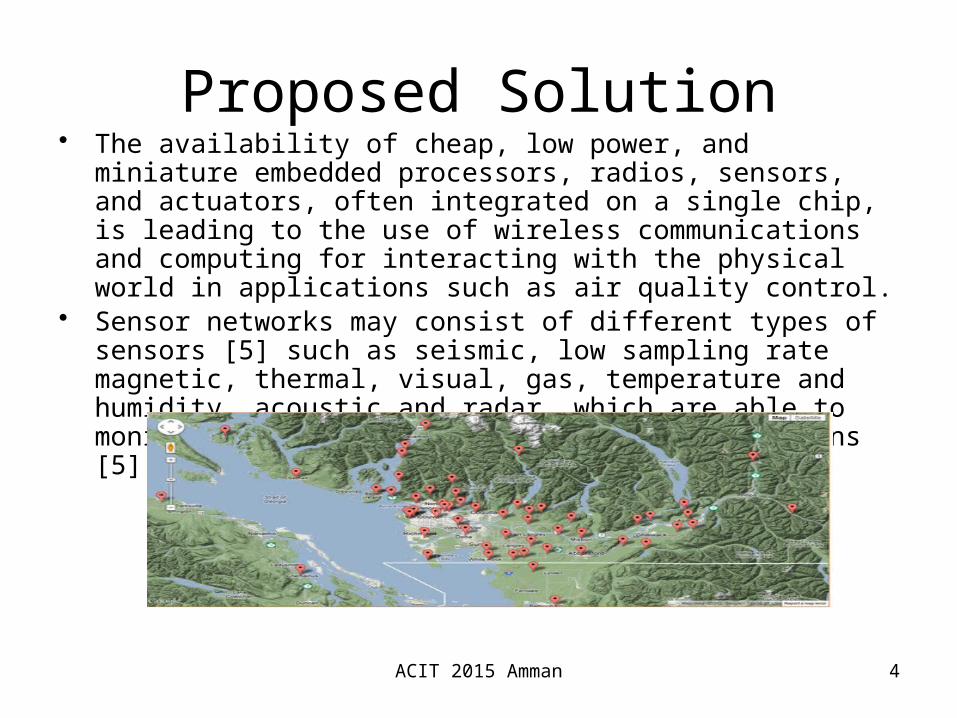
Proposed Solution• The availability of cheap, low power, and miniature embedded
processors, radios, sensors, and actuators, often integrated on a single chip, is leading to the use of wireless communications and computing for interacting with the physical world in applications such as air quality control.
• Sensor networks may consist of different types of sensors [5] such as seismic, low sampling rate magnetic, thermal, visual, gas, temperature and humidity, acoustic and radar, which are able to monitor a wide variety of environment situations [5]
ACIT 2015 Amman 5
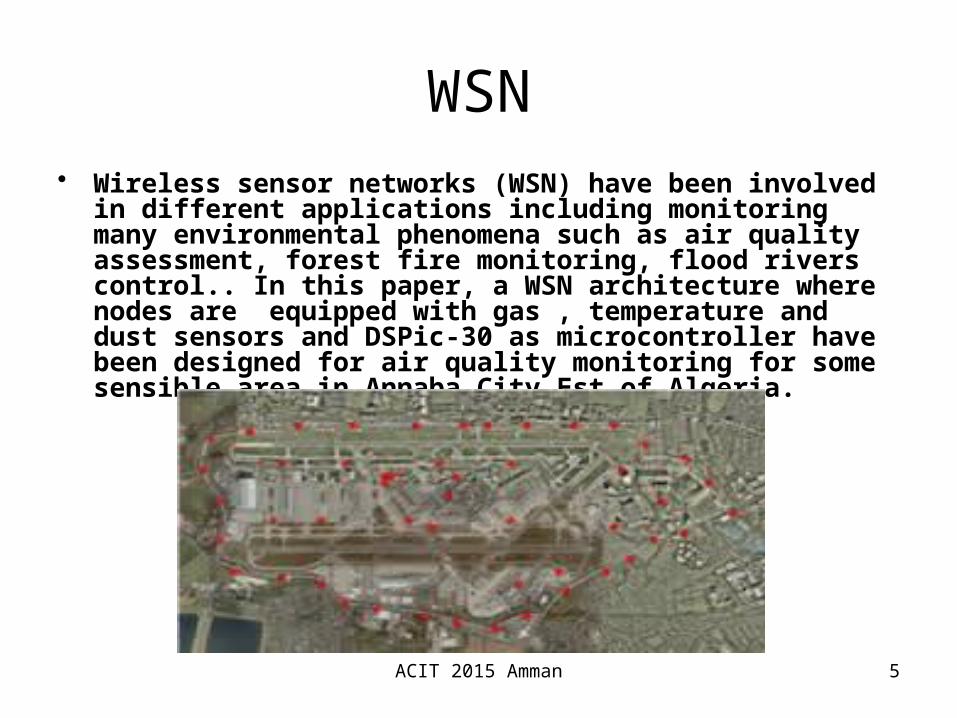
WSN• Wireless sensor networks (WSN) have been involved in
different applications including monitoring many environmental phenomena such as air quality assessment, forest fire monitoring, flood rivers control.. In this paper, a WSN architecture where nodes are equipped with gas , temperature and dust sensors and DSPic-30 as microcontroller have been designed for air quality monitoring for some sensible area in Annaba City Est of Algeria.
ACIT 2015 Amman 6
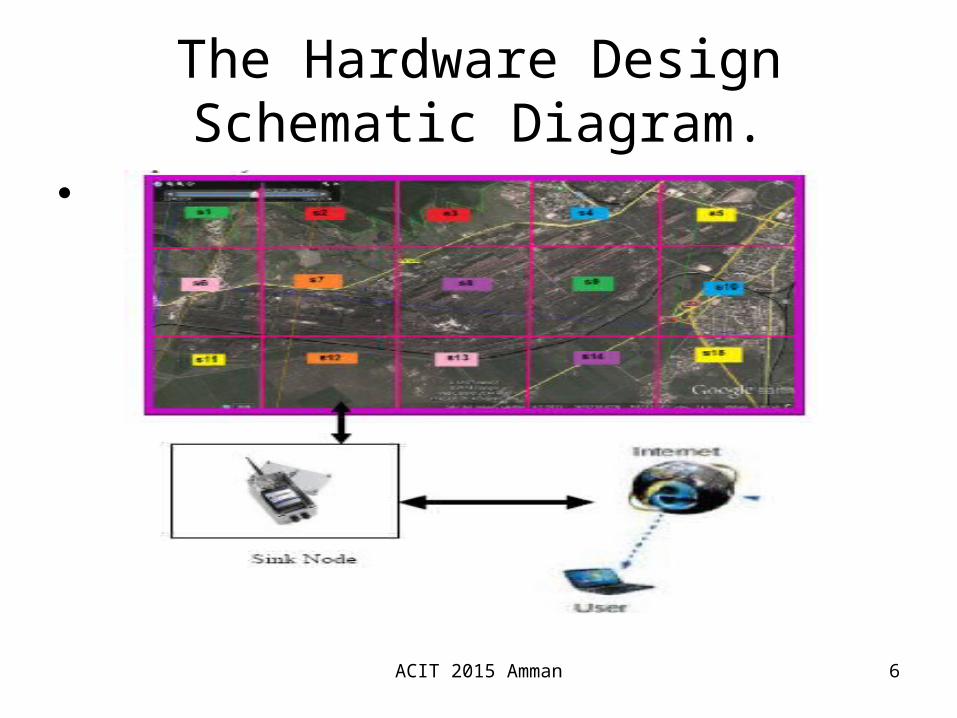
The Hardware Design Schematic Diagram.
•

ACIT 2015 Amman 7
WSN application• Wireless sensor networks (WSN) have been involved in
different applications including monitoring many environmental phenomena such as air quality assessment, forest fire monitoring, flood rivers control.
• In this paper, a WSN architecture where nodes are equipped with gas , temperature and dust sensors and DSPIC-30 Microcontroller have been designed for air quality monitoring for some sensible area in Annaba City Est of Algeria.
• We chosed DSPIC-30 for integrating the « Oak Ridge Air Quality Index » algorithm.
ACIT 2015 Amman 8
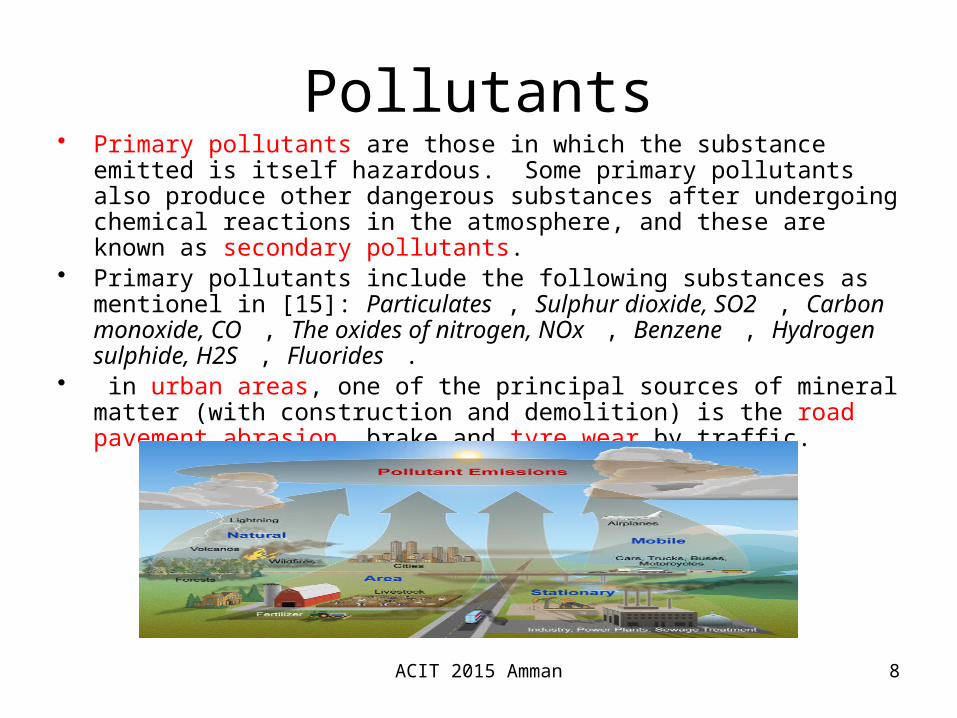
Pollutants• Primary pollutants are those in which the substance emitted is itself
hazardous. Some primary pollutants also produce other dangerous substances after undergoing chemical reactions in the atmosphere, and these are known as secondary pollutants.
• Primary pollutants include the following substances as mentionel in [15]: Particulates , Sulphur dioxide, SO2 , Carbon monoxide, CO , The oxides of nitrogen, NOx , Benzene , Hydrogen sulphide, H2S , Fluorides .
• in urban areas, one of the principal sources of mineral matter (with construction and demolition) is the road pavement abrasion, brake and tyre wear by traffic.
ACIT 2015 Amman 9
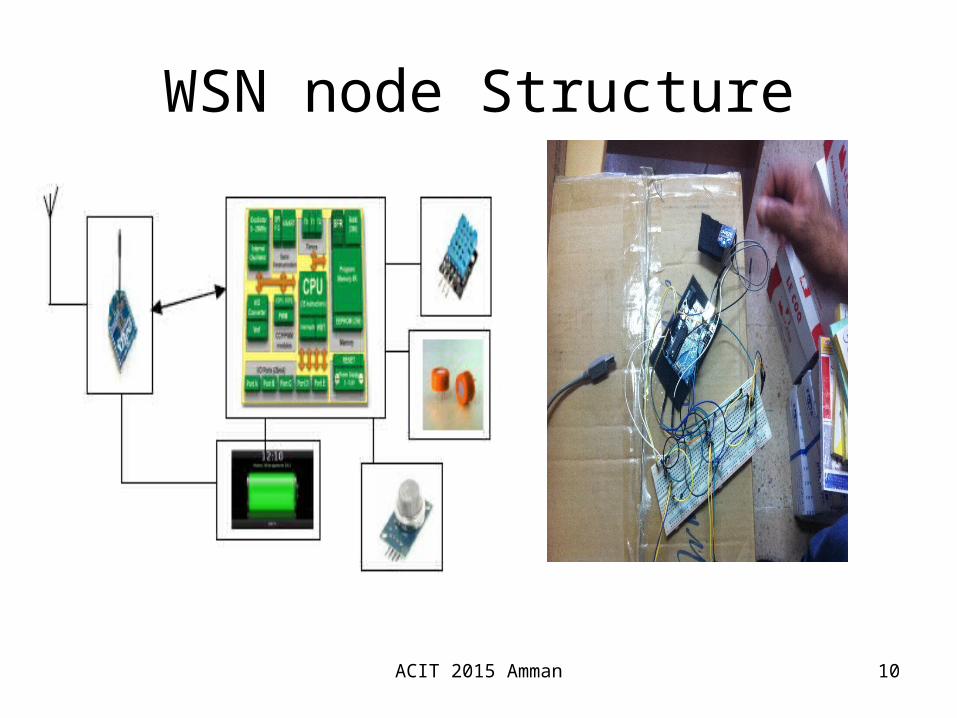
Main Components for the Node• The complete system design is shown in figure
2, Hardware Design Schematic Diagram. The design Included the following major hardware components:
• DSPIC-30 Microcontroller • . MQ-135 GAS Senor [3] • MiCS-2710 NO2 Sensor[18]: • Temperature and Humidity sensor DHT21 • Trasmission module Xbee S2 ,with Zigbee
Protocol
ACIT 2015 Amman 10
WSN node Structure
ACIT 2015 Amman 11
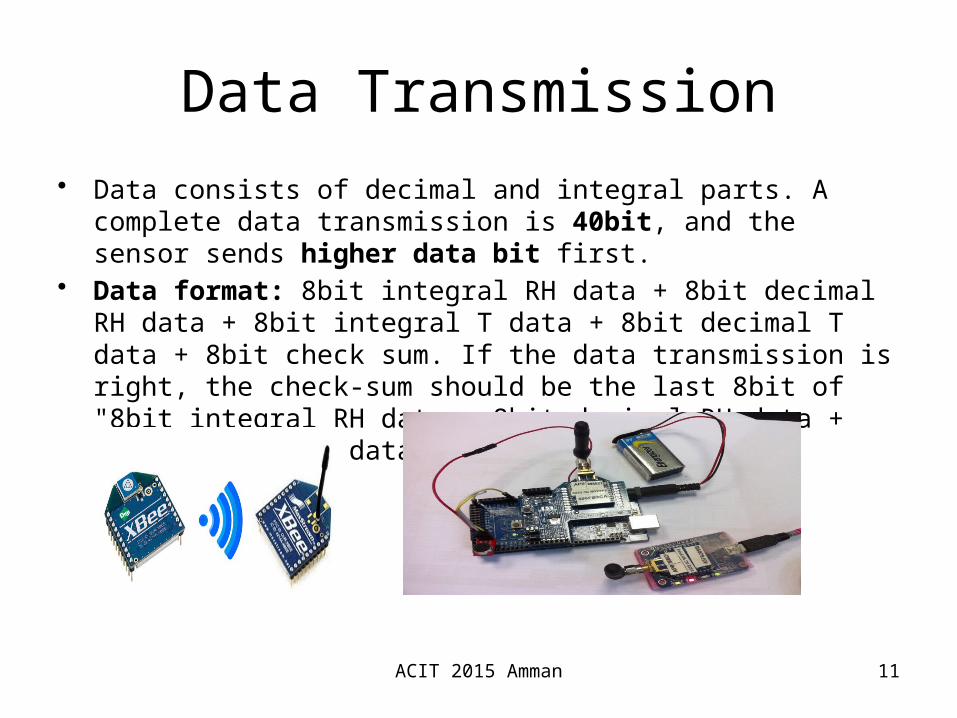
Data Transmission• Data consists of decimal and integral parts. A complete data
transmission is 40bit, and the sensor sends higher data bit first. • Data format: 8bit integral RH data + 8bit decimal RH data + 8bit
integral T data + 8bit decimal T data + 8bit check sum. If the data transmission is right, the check-sum should be the last 8bit of "8bit integral RH data + 8bit decimal RH data + 8bit integral T data + 8bit decimal T data".
ACIT 2015 Amman 12
Used sensors• MQ-2 GAS Senor [3] Breakout Board: MQ-2 is one of the
series of semiconductor Gas Sensors that is used mainly for gas (such as CO) leak detection for houses, workshops, commercial building, Fire, Safety detection system as well as a gas leak alarm.
• The DHT11, DHT21 and DHT22 are relative cheap sensors for measuring temperature and humidity. In reference [6] and [7] there is a description of library for reading both values from these sensors. we contacted the manufacturer to get the details of the differences between the two DHT sensors to build a lib that supports both. The DHT21/22 is quite similar to the DHT11 and has a greater accuracy (one decimal) and range (negative temperatures). The hardware pins and handshake are identical but it uses a different data format.
ACIT 2015 Amman 13
Air Quality Index (AQI) Computation Methods
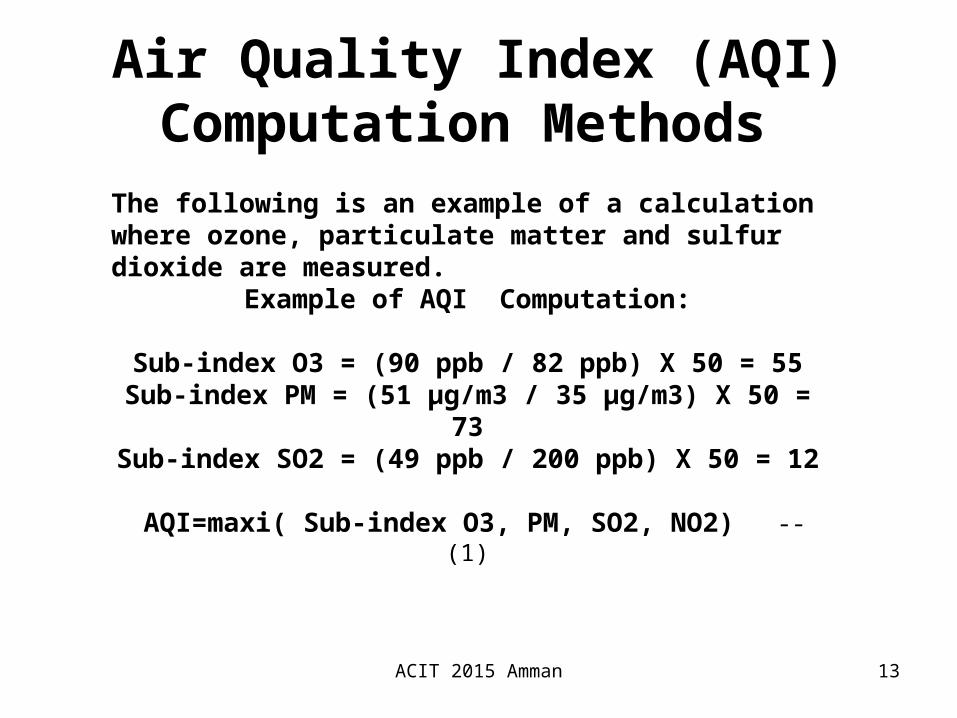
The following is an example of a calculation where ozone, particulate matter and sulfur dioxide are measured.
Example of AQI Computation:
Sub-index O3 = (90 ppb / 82 ppb) X 50 = 55Sub-index PM = (51 µg/m3 / 35 µg/m3) X 50 = 73Sub-index SO2 = (49 ppb / 200 ppb) X 50 = 12
AQI=maxi( Sub-index O3, PM, SO2, NO2) --(1)
ACIT 2015 Amman 14
Air Quality Indices computation in the Literature
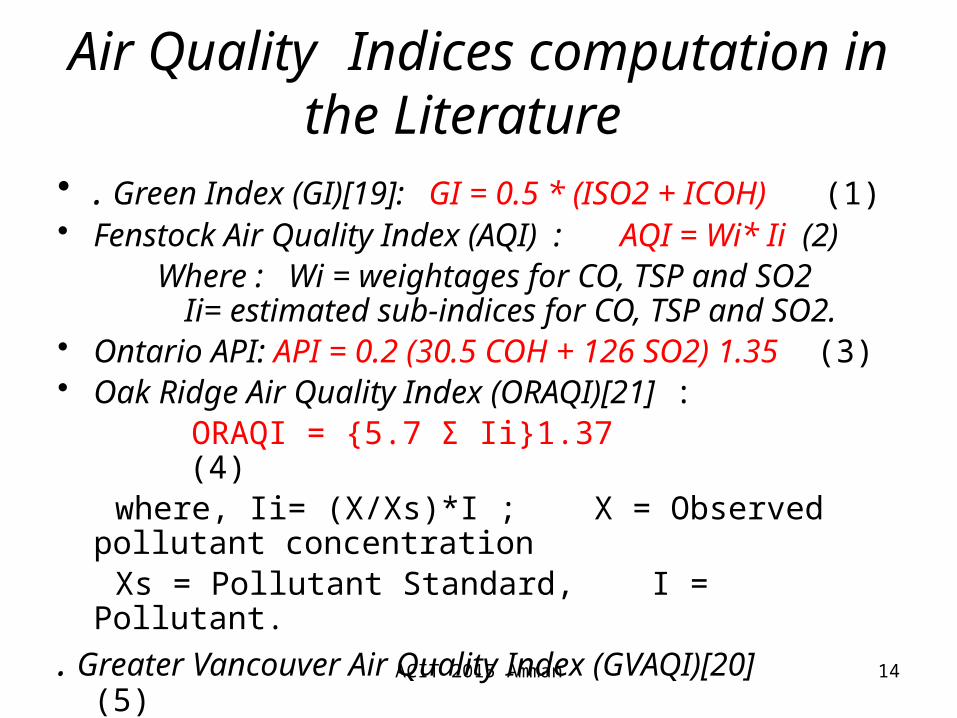
• . Green Index (GI)[19]: GI = 0.5 * (ISO2 + ICOH) (1)• Fenstock Air Quality Index (AQI) : AQI = Wi* Ii (2) Where : Wi = weightages for CO, TSP and SO2
Ii= estimated sub-indices for CO, TSP and SO2.
• Ontario API: API = 0.2 (30.5 COH + 126 SO2) 1.35 (3)• Oak Ridge Air Quality Index (ORAQI)[21] : ORAQI = {5.7 Σ Ii}1.37 (4) where, Ii= (X/Xs)*I ; X = Observed pollutant
concentration Xs = Pollutant Standard, I = Pollutant.. Greater Vancouver Air Quality Index (GVAQI)[20] (5)
ACIT 2015 Amman 15
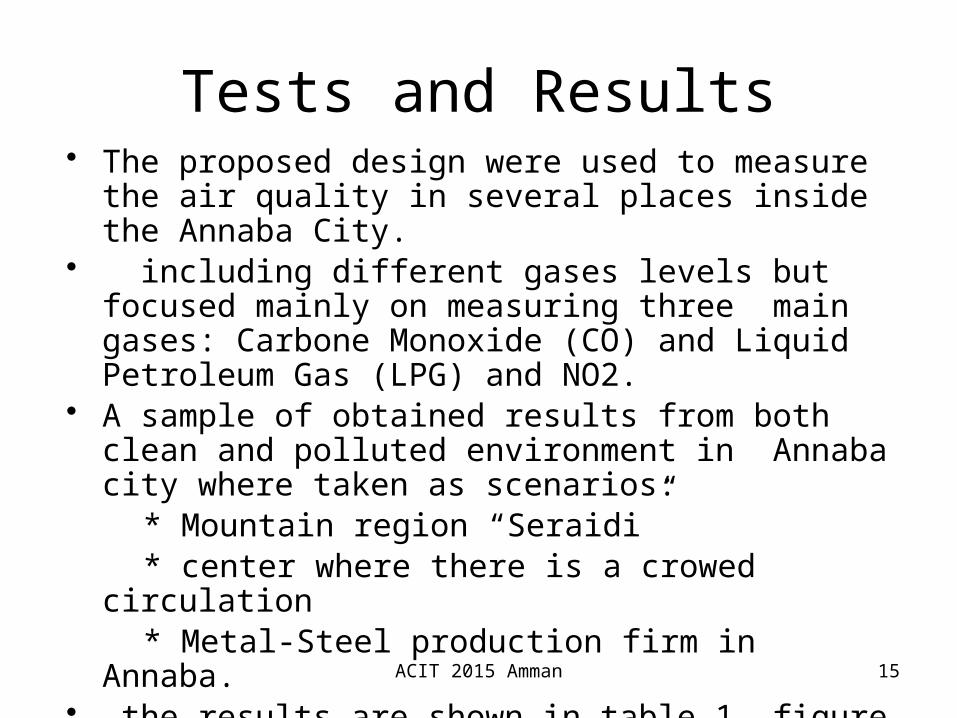
Tests and Results• The proposed design were used to measure the air
quality in several places inside the Annaba City.• including different gases levels but focused mainly on
measuring three main gases: Carbone Monoxide (CO) and Liquid Petroleum Gas (LPG) and NO2.
• A sample of obtained results from both clean and polluted environment in Annaba city where taken as scenarios:
* Mountain region “Seraidi” * center where there is a crowed circulation * Metal-Steel production firm in Annaba.• the results are shown in table 1, figure 3 and figure 4.
ACIT 2015 Amman 16
Situation of air pollution in three different areas in Annaba city
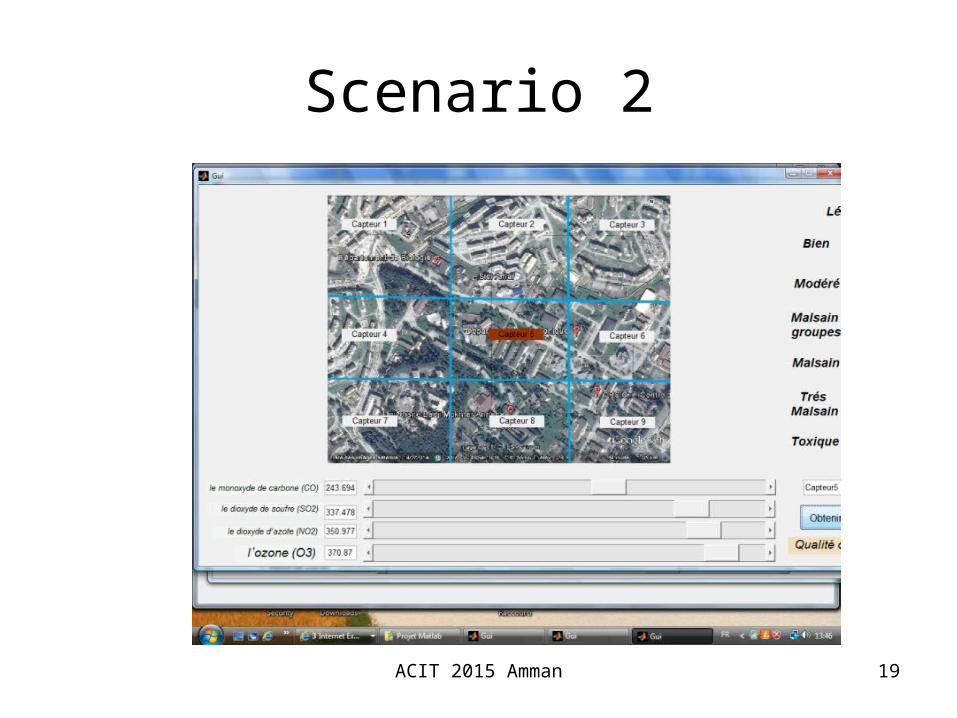
• Simulation results: for simulation of WSN nodes, the area is divided into parts where each part can be controlled by a node, in this case the area is divided into 9 regions, and the transmission circuit is chosen so that it can provide the adjacent nodes with the information with minimum consumption of energy.
ACIT 2015 Amman 17
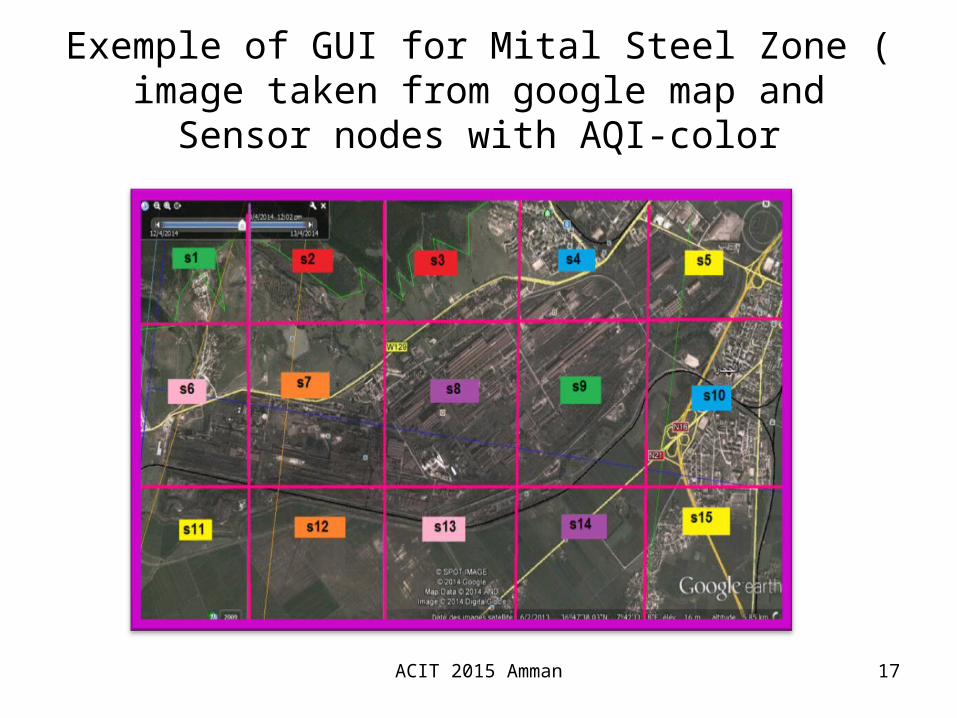
Exemple of GUI for Mital Steel Zone ( image taken from google map and Sensor nodes with AQI-color
ACIT 2015 Amman 18
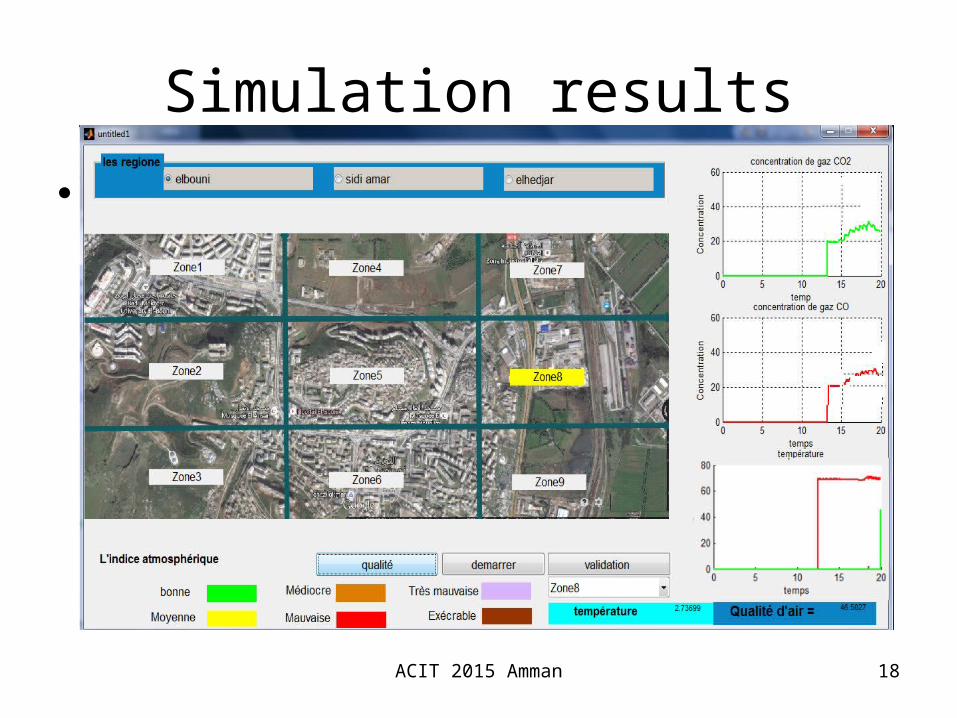
Simulation results
•
ACIT 2015 Amman 19
Scenario 2

ACIT 2015 Amman 20
Results from Clean area in Mountains « Seraidi » in %
• Air Pollution in Seraid Mointains
05
10152025303540
6:00 AM 08:00Am 10:00AM
12:00AM
14:00AM
4:00 PM 6:00 PM 8:00 PM
Hours
PPM
%
CO NO2 LPG
ACIT 2015 Amman 21
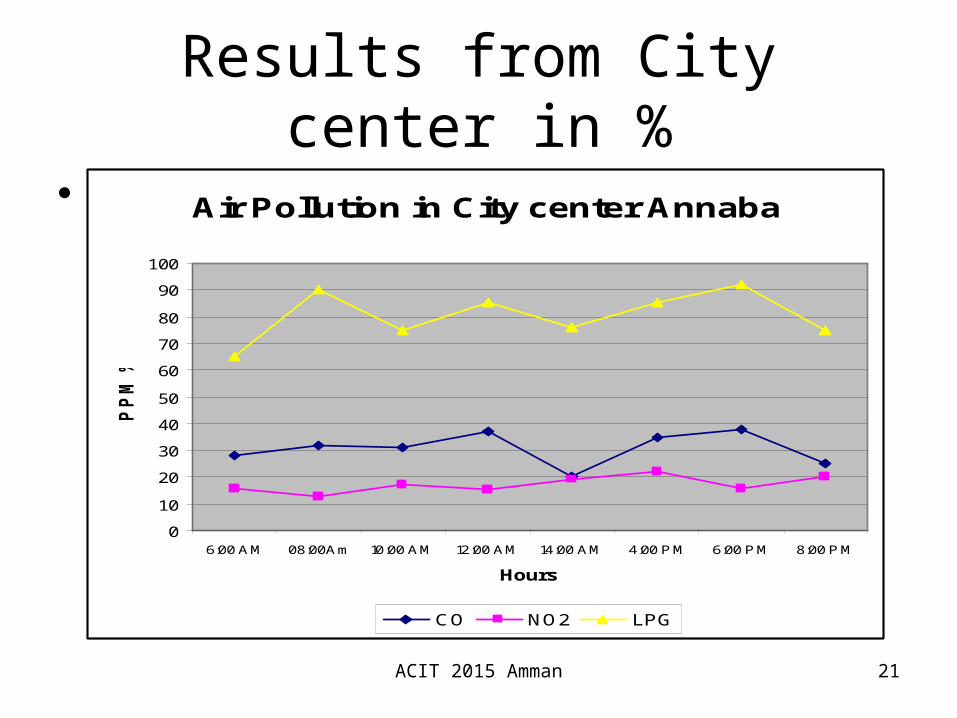
Results from City center in %
• Air Pollution in City center Annaba
0
10
20
30
40
50
60
70
80
90
100
6:00 AM 08:00Am 10:00 AM 12:00 AM 14:00 AM 4:00 P M 6:00 P M 8:00 P M
Hours
PPM
%
CO NO2 LPG
ACIT 2015 Amman 22
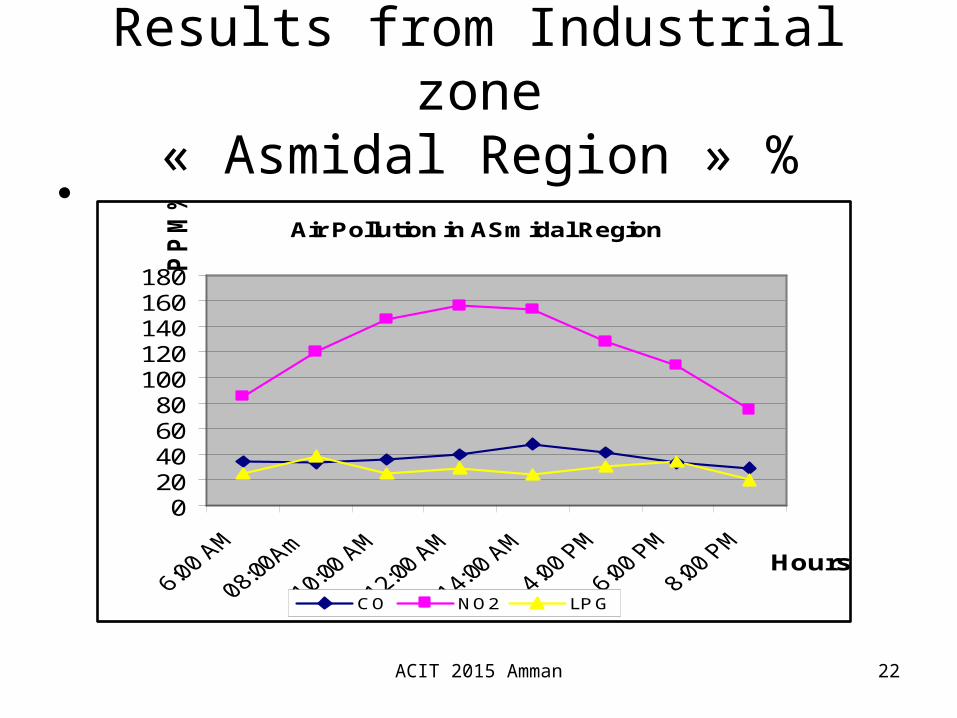
Results from Industrial zone« Asmidal Region » %
• Air Pollution in ASmidal Region
020406080
100120140160180
Hours
PPM
%
CO NO2 LP G
ACIT 2015 Amman 23
Conclusion• AIR Quality monitoring System Design to asses the pollution of air in some parts of
Annaba city using a micro-system, as a node in Wireless Sensor Network (WSN), is proposed in this article.
• The system provides a real-time information about the level of air pollution in different regions, as well as provides alerts in cases of drastic change in quality of air.
• Based on collected information, such data can then be used by the authorities to take prompt actions such as evacuating people or sending emergency response team.
• The proposed design is enhanced by several ways such as: selecting adequacies’ sensors, calibrating these sensors for gas detection, integrating them in a WSN system controlled by an Arduino-MEGA, and finally transmission to the central unit using Xbee modules.
• A Graphic used interface has been presented in this work to simulate the effect of sensors on selected area .
Improvement can be done• Adding other sensors. Improvement on AQM index computation inside the 2323.• Designing A Web-service to get data and represent it on google Map.• The results are interesting, improvements can be done: in providing a web service
page that can provide these data to users, as well as more sophisticated sensors could be used such as MQ-135, MQ-136 and others.

ACIT 2015 Amman 24
Thank You for Your Attention