Embed Size (px)
Citation preview
i
_
DISSERTAÇÃO DE MESTRADO EM EPIDEMIOLOGIA
_
A comparative analysis of psychiatric
emergencies in two different emergency
department models in Portugal
_
Apresentada sob a orientação de Sofia Gonçalves Correia
e co-orientação de Orlando von Doellinger
_
João Leonel Gonçalves de Pinho Felgueiras
_
2017
ii
Título: A comparative analysis of psychiatric emergencies in two different emergency
department models in Portugal
Autor: João Leonel Gonçalves de Pinho Felgueiras
Edição: do autor
Ano: 2017
iii
Investigação realizada no Serviço de Epidemiologia Hospitalar do Centro Hospitalar de
São João, E.P.E., sob a orientação da Professora Doutora Sofia Gonçalves Correia e
co-orientação do Professor Doutor Orlando von Doellinger.
iv
AKNOWLEDGMENTS
Os meus agradecimentos,
à Professora Sofia Correia, pela disponibilidade em se aventurar na orientação deste
projeto e pela aprendizagem que me concedeu, permitindo-me encerrar este ciclo;
ao Professor Orlando von Doellinger, pela sempre inexcedível disponibilidade e
paciência;
ao Pedro Ramos, pelos contributos que sempre me vai oferecendo e que, uma vez mais,
me permitiram concretizar projetos ambiciosos;
ao Hélio Alves, uma vez mais, por ser a mais sapiente muleta, com quem tive o privilégio
de percorrer mais este caminho;
à Dra. Joana Vales e à Engª Carla Roque, pelo pronto auxílio na travessia da maratona
administrativa e tecnológica que envolve a concretização de um projeto desta natureza;
à Catarina Meireles, por tão doce e pacientemente tolerar as centenas de horas que
este manuscrito nos roubou;
aos meus pais, sempre.
v
TABLE OF CONTENTS
ACKNOWLEDGMENTS iv
GRAPHIC LIST vii
TABLE LIST viii
LIST OF ABBREVIATIONS xi
ABSTRACT PT x
ABSTRACT EN xi
CRISIS IN MENTAL HEALTH
DEFINITION 1
PSYCHIATRIC EMERGENCIES 2
MENTAL HEALTH CRISIS SERVICES
EVOLUTION 4
CONSULTANT IN MEDICAL EMERGENCY DEPARTMENT (LIAISON MODEL) 5
DEDICAMENT MENTAL HEALTH WING OF MEDICAL EMERGENCY DEPARTMENT 6
THE PSYCHIATRIC EMERGENCY SERVICES MODEL 7
TREATMENT GOALS OF EMERGENCY PSYCHIATRY 8
OUTCOMES IN PSYCHIATRIC EMERGENCY DEPARTMENTS
HOSPITALIZATION 10
WAITING TIMES 11
FREQUENT USERS 12
LEFT WITHOUT BEING SEEN 13
MENTAL HEALTH IN PORTUGAL
EPIDEMIOLOGY 15
PSYCHIATRIC EMERGENCY DEPARTMENTS IN PORTUGAL 17
OBJECTIVES 19
SETTING
OVERVIEW 20
CENTRO HOSPITALAR DE SÃO JOÃO, E.P.E. 21
CENTRO HOSPITALAR DO TÂMEGA E SOUSA, E.P.E. 22
METHODS 23
ETHICS 23
vi
DATA COLLECTION 23
INCLUSION CRITERIA OPERATIONALIZATION 24
SOCIODEMOGRAPHICS 25
CHARACTERISTICS OF EMERGENCY DEPARTMENT ADMISSIONS 26
OUCTOME INDICATORS 26
STATISTICAL ANALYSIS 27
RESULTS
1.1
SOCIODEMOGRAPHIC VARIABLES 28
DISTRIBUTION BY MONTH 32
DISTRIBUTION BY WEEKDAY 35
DISTRIBUTION BY HOUR OF THE DAY 38
DISTRIBUTION BY MTS FLOWCHART 41
DISTRIBUTION BY MTS DISCRIMINATOR 42
DISTRIBUTION BY DISCHARGE DIAGNOSIS 45
1.2
DISTRIBUTION BY MTS BRACELET COLOR 49
DISTRIBUTION BY DISCHARGE DESTINATION 50
FREQUENT USERS 53
READMISSIONS 54
TIMES 55
DISCUSSION 56
REFERENCES 68
vii
GRAPHICS LIST
GRAPHIC I SOCIODEMOGRAPHICS 30
GRAPHIC II DISTRIBUTION BY MONTH (UMPP) 32
GRAPHIC III DISTRIBUTION BY MONTH (BOTH EDs) 32
GRAPHIC IV DISTRIBUTION BY WEEKDAY (UMPP) 35
GRAPHIC V DISTRIBUTION BY WEEKDAY (BOTH EDs) 35
GRAPHIC VI DISTRIBUTION BY HOUR OF THE DAY (UMPP) 38
GRAPHIC VII DISTRIBUTION BY HOUR OF THE DAY (BOTH EDs) 38
GRAPHIC VIII DISTRIBUTION BY MTS FLOWCHART 41
GRAPHIC IX DISTRIBUTION BY MTS DISCRIMINATOR 43
GRAPHIC X DISTRIBUTION BY DISCHARGE DIAGNOSIS 47
GRAPHIC XI RELATIVE PROPORTION OF DISCHARGE DIAGNOSIS 48
GRAPHIC XII DISTRIBUTION BY MTS BRACELET COLOR 49
GRAPHIC XIII RELATIVE PROPORTION OF DISCHARGE DESTINATION (UMPP) 50
GRAPHIC XIV RELATIVE PROPORTION OF DISCHARGE DESTINATIONS (BOTH EDs) 53
GRAPHIC XV FREQUENT USERS AND READMISSIONS 54
GRAPHIC XVI TIMES 55
viii
TABLES LIST
TABLE I SOCIODEMOGRAPHICS 31
TABLE II DISTRIBUTION BY MONTH 34
TABLE III DISTRBUTION BY WEEKDAY 37
TABLE IV DISTRIBUTION BY HOUR OF THE DAY 40
TABLE V DISTRIBUTION BY MTS FLOWCHART 44
TABLE VI DISTRIBUTION BY MTS DISCRIMINATOR 44
TABLE VII SUMMARY OF OUTCOMES AND INDICATORS 52
ix
LIST OF ABBREVIATIONS
ARS Administração Regional da Saúde
CHSJ Centro Hospitalar de São João, E.P.E.
CHTS Centro Hospitalar do Tâmega e Sousa, E.P.E.
CSP Cuidados de Saúde Primários
DALY’s Disability Adjusted Life Years
ED Emergency Department
ICD-9 International Classification of Diseases, 9th revision
LWBS Left without being seen
MTS Manchester Triage System
NOS Not otherwise specified
PE Psychiatric emergency
SNS Serviço Nacional de Saúde
UMPP Urgência Metropolitana de Psiquiatria do Porto
USF Unidade de Saúde Familiar
x
ABSTRACT PT
Nas últimas décadas tem-se verificado um aumento progressivo do recurso ao serviço
de urgência por causas de natureza psiquiátrica. Esta procura por cuidados urgentes de saúde
mental em contexto de urgência tem levado ao desenvolvimento de diversos modelos de
urgência psiquiátrica. Em Portugal estão instalados diversos serviços de urgência psiquiátrica,
porém, um grande volume de crises de saúde mental continua a ser orientado em serviços de
urgência polivalente, sem cuidados especializados de Psiquiatria.
Este trabalho pretende comparar as urgências psiquiátricas em dois modelos distintos
de serviço de urgência no Norte de Portugal: a Urgência Metropolitana de Psiquiatria do Porto
- um serviço metropolitano de urgência psiquiátrica num hospital terciário (Centro Hospitalar
de São João, E.P.E.) - e o Serviço de Urgência do Centro Hospitalar do Tâmega e Sousa, E.P.E. -
um serviço de urgência polivalente de um hospital secundário. Pretende ainda comparar os
episódios de urgência psiquiátrica na unidade metropolitana em função da sua proveniência.
Foram avaliados todos os episódios de urgência psiquiátrica nas duas unidades
hospitalares durantes os anos de 2015 e 2016 (27532 episódios na UMPP, 11257 episódios no
CHTS) através de dados administrativos recolhidos eletronicamente.
Foram encontradas diferenças estatisticamente significativas entre os dois serviços de
urgência no volume diário de episódios (37,7 na UMPP vs 15,4 no CHTS); em características
sociodemográficas dos doentes (maior proporção de episódios por doentes isentos de taxa
moderadora no CHTS, bem como de doentes com maior proximidade ao hospital); na
distribuição semanal dos episódios; no fluxograma, discriminador e cor de pulseira da Triagem
de Manchester; na distribuição dos diagnósticos de Alta; nos destinos de Alta; na proporção de
episódios por Utilizadores de Elevada Frequência (13,5% na UMPP vs 4,1% no CHTS); nas
Readmissões (às 72h, 7,4% na UMPP vs 2,4% no CHTS); nos tempos de espera Triagem-
observação (23,3 minutos superior no CHTS) e Observação-alta (7,3 minutos superior no
CHTS).
Este trabalho revela diferenças relevantes em vários domínios na orientação de urgências
psiquiátricas em dois modelos distintos de serviço de urgência. Destaca-se a maior frequência
de episódios por Utilizadores de Elevada Frequência e de Readmissões no serviço de urgência
psiquiátrica, sugerindo que este possa estar mais sujeito a uso indevido desta estrutura.
Estes resultados permitem uma melhor compreensão da dinâmica das urgências
psiquiátricas e dos serviços de urgência, que poderão contribuir para alterações que procurem
garantir maior eficácia e eficiência dos serviços de saúde.
xi
ABSTRACT EN
Through the last decades there has been a progressive increase in emergency
department episodes by psychiatric conditions. This demand has led to the development of
various models of psychiatric emergency departments. In Portugal, there are several psychiatric
emergency departments, however, there is still a relevant volume of mental health crisis being
managed in general emergency departments, without specialized psychiatric care.
This work aims to compare psychiatric emergencies in two different emergency
department models in the North of Portugal: Urgência Metropolitana de Psiquiatria do Porto –
a metropolitan psychiatric emergency department within a tertiary hospital (Centro Hospitalar
de São João, E.P.E.) – and the emergency department of Centro Hospitalar do Tâmega e Sousa
– a general emergency department within a secondary hospital. It further aims to compare
psychiatric emergencies in the metropolitan unit according to their origin.
All psychiatric emergencies from 2015 and 2016 were analyzed in the two units (27532
episodes at UMPP, 11257 episodes at CHTS), using electronically collected administrative data.
Statistical significant differences were found between the two units in terms of daily
usage (37,7 episodes at UMPP vs 15,4 at CHTS); patients’ sociodemographic characteristics
(higher proportion of episodes by patients exempted of co-payments at CHTS, as well as by
patients living closer to the ED); episodes’ distribution by weekday; Manchester Triage System
flowchart, discriminator and bracelet color; distribution of discharge diagnosis; distribution of
discharge destination; proportion of episodes by Frequent Users (13.5% at UMPP vs 4.1% at
CHTS); Readmissions (at 72h, 7.4% at UMPP vs 2.4% at CHTS); times of Triage-observation
(23.3 minutes longer at CHTS) and Observation-discharge (7.3 minutes longer at CHTS).
This work reveals several important differences between two different emergency
department models regarding psychiatric emergencies. Higher frequency of episodes by
Frequent Users as well as higher frequency of Readmissions at the psychiatric ED might point to
greater susceptibility to misuse in this unit.
These results contribute to better understand the dynamics of psychiatric emergencies
and emergency departments, which may be of use to future changes in health care services, in
order to achieve better efficacy and efficiency.
1
CRISIS IN MENTAL HEALTH
DEFINITION
As proposed by Caplan (1964) in his Crisis Theory, a crisis is a time limited
response to a life event, which is not solvable with a person’s usual coping mechanisms.
According to Caplan, in crisis, diagnosis is considered less important and irrespective of
symptoms and diagnosis, treatment focused on problem-solving techniques and involving
members of the patient’s social network (Hubbeling & Bertram, 2012).
Many definitions have been now proposed for mental health crisis. Approaches
include self-definition (the service users define their own experience), risk-focused
definition (individuals at risk of harming themselves or others), theoretical definitions,
and negotiated definitions (decisions reached collaboratively by service user, carer or
professional) (Paton et al., 2016). Following a pragmatic service-oriented approach, crisis
brings the service user to the attention of crisis services, for example through the relapse
of an existing mental health condition, resulting in a substantial impact on the life of the
service user and their social network (Joint Commissioning Panel for Mental Health,
2013). Mind (2011) defines mental health crisis when an individual is in a mental or
emotional state where he needs urgent help.
In the London Mental Health Crisis Commissioning Guide (London Strategic
Clinical Networks, 2014), crisis is described as a change in mental wellbeing that is likely
to lead to an unstable or dangerous situation for the individual concerned. Terms such
as ‘emergency care’, ‘urgent care’, ‘crisis care’, ‘unplanned care’ and ‘unscheduled care’
have been used to describe services developed to support and treat those presenting in
crisis.
To clarify the terminology, which has frequently led to confusion amongst
providers, commissioners, service users and carers, a British National Health Service
(NHS) Department of Health Guidance (The Department of Health, 2004) clarified
terms as: Emergency care – An immediate response to time critical healthcare need;
Urgent care - The response before the next in hours or routine (primary care) service
is available; Unscheduled care – Involves services that are available for the public to
access without prior arrangement where there is an urgent actual or perceived need for
intervention by a health or social care professional.
2
PSYCHIATRIC EMERGENCIES
The wider definition of ‘mental health crisis’ emphasizes the notion that each
person’s perception of what constitutes a crisis is individual and reflects their history
and social support network (Mental Health Foundation, 2008). Thus, people will respond
differently to clinical situations which objectively appear similar, some finding the
situation to be manageable, others finding it overwhelming (London Strategic Clinical
Networks, 2014).
For clinical purposes, Bulbena & Martin (2006) propose that a psychiatric
emergency (PE) might be defined as a ‘situation in which the psychopathological
symptoms or a behavior disorder […] are perceived as threatening for the patient, his
family, or others, so that they demand urgent psychiatric intervention’.
According to this notion, Zeller (2010) summarized the most prevalent PE
presentations:
Suicide attempt/ideation: Wasserman (2001) states that suicidal behaviors
can be conceptualized as a complex process that can range from suicidal ideation (which
can be communicated through verbal or non-verbal means) to planning of suicide,
attempting suicide, and in the worst case, suicide. Suicidal behaviors are influenced by
interacting biological, genetic, psychological, social, environmental and situational factors.
In a large study from US Emergency Departments, from 1992 to 2001, visits for suicide
attempt and self-injury increased by 47%, from 0.8 to 1.5 visits per 1000 US population
(Larkin, Smith, & Beautrais, 2008).
Agitation, violent or disruptive behavior: can be concisely described as
“excessive verbal and/or motor behavior” (Citrome, 2002) and may be associated with
multiple medical and psychiatric disturbances. A study from 2005 estimated that 20% to
50% of total PE visits might involve patients at risk for agitation (Marco & Vaughan, 2005).
Allen & Currier (2004) suggest that, in the US, as many as 1.7 million medical Emergency
Departments (ED) contacts per year might involve agitated patients.
Psychosis Leading to Dangerous Behavior or Thoughts: psychotic
symptoms, as hallucinations, thought or behavioral disorganization or delusions might
not represent a PE for itself, but may lead the patient to dangerous behavior or thoughts
3
that can, on their turn, represent serious risk, mainly for suicidal ideation or
agitation/violent behavior (Pandya, Larkin, Randles, Beautrais, & Smith, 2009).
Mania - This phase of the Bipolar Disease spectrum can run with psychotic
symptoms, energy increase, insomnia, impulsivity, and grandiosity, often producing poor
judgment which may lead to dangerous behavior or inability to care for themselves
(Zeller, 2010).
Intoxication states - Severe acute intoxications (alcohol, abuse drugs, or other
substances) are primarily a medical (organic) emergency and must be dealt with by
medical emergency personnel. However, intoxications often lead to suicidal or homicidal
threats, or exacerbate symptoms of another chronic mental illness. In an epidemiological
study from US emergency departments, primary diagnosis of substance abuse was
responsible for 27% of psychiatric-related visits (Hazlett, McCarthy, Londner, & Onyike,
2004).
Anxiety - Anxiety-related presentations accounted for 16% of emergency
department mental health visits from 1992–2001 in a US sample (Smith, Larkin, &
Southwick, 2008). Although it doesn’t fulfill the premises of dangerousness for the
patient or others, thus not being considered a PE per se, anxiety can sometimes be
experienced so intensely that the patient deals with it as an emergency.
Other Common Presentations and Exclusions - Many patients seek help
in emergency department for personal crisis, such as family and interpersonal conflicts,
financial difficulties, social deficiencies, unemployment, etc. These situations, by
themselves, do not represent a PE, unless they conduct to the previous considered
conditions (suicidal thoughts, agitation, etc.). However, they represent a large number
of ED visits, mainly seeking for psychological counseling, access to social services or
other referrals (Zeller, 2010).
4
MENTAL HEALTH CRISIS SERVICES
EVOLUTION
The movement of deinstitutionalization started in the decades of 1950-60
became one of the most important hallmarks of modern Psychiatry (Pow, Baumeister,
Hawkins, Cohen, & Garand, 2015). Patient’s discharge from long-stay psychiatric
hospitals to community structures, along with other structural changes in psychiatric
services (mainly the reduction of available inpatient beds) and transformations in
demographic and socioeconomic factors increased the number of patients with severe
and enduring mental illness living in inner city areas with limited access to supportive
services and, in the beginning of the 1990s (Curry, 1993). These factors, associated with
inadequate community resources, the large numbers of uninsured individuals, and other
causes, have been promoting an ongoing rise of emergency department presentations of
mental health patients (Hazlett et al., 2004). As a result, the management of psychiatric
emergencies has progressed into a subspecialty in its own right (Zeller, 2010).
According to Larkin et al. (2005), between 1992 and 2001, there were 53 million
mental health-related emergency department contacts in the United States, representing
an increase from 4.9% to 6.3% of all emergency department visits. In Germany, Pajonk
et al. (2008) concluded that PE accounted for 10–15% of all calls in the German physician-
based Emergency Medical Services. In another report from German EDs, PE were
reported to have a prevalence of 7.7%, with Psychiatry being the fourth most frequent
discipline in the EDs (Kropp et al., 2007).
In 2004, Pajonk et al. (2004) suggested some reasons for the increase of PEs in
the previous 10 years in Germany: expanded indication to call an emergency physician
(EP); reduced availability of family physicians; increased level of psychosocial stress (e.g.,
due to increased rates of unemployment and debt); isolation due to increased rates of
divorce, family structures breakup and a high number of single homes; increase in
psychiatric morbidity subsequent to survived life-threatening illness or injury; excessive
aging of the population with multimorbidity and use of polypharmacy; huge increase in
binge drinking in young adults.
5
The demands made by these patients on staff time and facilities, together with
the general growth in ED attendances highlighted the need for specialist mental health
knowledge and skills available in these departments (Kendrick, 1996; Younger, 1995).
Once the psychiatric emergency ward has become a primary entry point into the
network of mental health services, the ‘Triage Model’ was conceptualized, in the 1980’s,
and was based upon the premises of rapid evaluation, containment and referral (Gerson
& Bassuk, 1980). According to Zeller (2010), two methods derived from the Triage
Model: the psychiatric consultant seeing patients in the medical emergency department,
and a separate section of the medical emergency department dedicated to mental health
patients, with specially-trained and dedicated staff. Following other concept, there is a
third major model: Psychiatry Emergency Service (PES) model.
CONSULTANT IN MEDICAL EMERGENCY DEPARTMENT (LIAISON MODEL)
This is the most common model in the US. In this design, a mental health
professional consults patients in a medical emergency department. Although preferably
a psychiatrist, in many systems the consultants are psychologists, advanced registered
nurse practitioners, social workers, or licensed marriage/family therapists.
All patients are initially evaluated by an emergency physician, allowing organic
causes of psychiatric symptoms to be excluded or treated before psychiatric
consultation. Aside from being the cheapest and easiest model to implement in a medical
emergency department, it has the advantage of allowing mental health patients to be
treated in the same setting of the other patients, reducing the possibility of
stigmatization.
The absence of permanent mental health professionals at the ED conduces to
greater times of await (that may take several hours), during which the patient may be
receiving little or no treatment. Usually, after consultation, the decision is usually
restricted to the choice either to admit for psychiatric hospitalization or to discharge,
since the emergency department setting is likely not conducive to extended psychiatric
treatment and observation. Moreover, the physical setting of the ED is not frequently
the most adequate for a person in a mental health crisis. Additionally, many emergency
department staff may be undertrained in mental illness. It can occur, in busy emergency
6
departments, to disregard psychiatric patients, resulting in poorer care and pressure to
discharge them.
The use of non-psychiatrist consultants restricts the ability to recommend
medications or to accurately diagnose other organic conditions such as delirium.
However, the mental health nurse practitioner (MHNP) role based in the ED has
emerged as a means of streamlining access to mental health intervention and supporting
ED staff in providing more holistic care (Wand, White, Patching, Dixon, & Green, 2011).
Several institutions in the UK followed an US approach, introducing psychiatric
liaison nurses to their ED (Sinclair et al., 2006). A 2004 NICE Clinical Guideline
recommended that mental health professionals should be integrated into emergency
departments to improve psychosocial assessment and provide training for non-mental
health professionals working in the emergency department, suggesting that experienced
psychiatric nurses have the skills and knowledge to provide appropriate clinical
assessment and make management decisions in the ED setting (National Institute for
Clinical Excellence, 2004). Several years earlier, Catalan et al. (1980) supported the idea
that nurses can be as effective as psychiatrists in the assessment and management of
deliberate self-poisoning patients. Hussein et al. (1997) also presented encouraging
evidence of nurses undertaking clinical assessments in acute psychiatric settings and
reaching similar decisions to their medical colleagues on diagnosis and treatment
programs.
Several articles described mental health liaison services as operating
‘‘successfully’’ in emergency departments (Beech, Parry, & Valiani, 2000; Brendon & Reet,
2000; Callaghan, Eales, Leigh, Smith, & Nichols, 2001; Clarke & Hughes, 2002;
McDonough et al., 2004).
DEDICATED MENTAL HEALTH WING OF MEDICAL EMERGENCY
DEPARTMENT
According to Zeller (2010), this model improves on classic consultation model
by providing a separate, often more nurturing and calming environment. It is frequently
staffed by nurses or other professionals with extra training in mental health, allowing for
more focused and appropriate care for individuals in crisis, and thus avoiding some of
the pitfalls that may confront the psychiatric patient in the general emergency room.
7
Since its location is within a medical emergency department, patients can receive full
medical history and physicals as part of their evaluation. Additionally, because of the
separate setting, there may be less urgency to move patients out and therefore permit
time for medications and interventions to have effect prior to disposition decisions.
THE PSYCHIATRY EMERGENCY SERVICES MODEL
Woo et al. (2007) state that while the consultation model had been the mainstay
for psychiatric emergencies in the 1980s (Lee, Renaud, & Hills, 2003), as the population
of the mentally ill continued to rise, the psychiatric emergency service (PES) model has
emerged as a solution to the upsurge (Allen, 1999). According to the former author, a
typical PES follows the ‘Treatment Model’, where in addition to ‘Triage Model’ capability,
many patients can also be treated to the point of stabilization onsite (Allen, 1996). Zeller
(2010) describes the PES as classically a stand-alone program dedicated solely to the
treatment of individuals in mental health crisis. Such facilities can either be locked,
unlocked, or a combination of the two, and located in-hospital or community based
(ideally situated near a medical emergency department).
Typically, a PES has a 24-hour available mental health staff, with psychiatric nurses,
other mental health professionals, and psychiatrists either onsite or readily available.
This environment allows diagnosis and treatment to be proceeded far more promptly
than in the other models. In a PES, a patient’s psychiatric treatment can begin without
delay, with the potential to achieve quick stabilization. For more complicated patients,
many PESs have extended observation capability, allowing treating patients for longer
periods, which can often be sufficient for many patients to stabilize and thus avoiding
inpatient hospitalization.
In a 1989 study, Gillig et al. (1989) observed that extended observation lowered
inpatient admission rates over a program using the Triage Model from 52% to just 36%.
More recently, Woo compared (2007) compared a US PES model with the previous
Consultant Model, concluding that timeliness of psychiatric evaluation, as defined by the
time elapsed between the documented triage time and time of evaluation completion by
psychiatrists, improved by 48.4%, the amount of emergency medication given decreased
by 27.0%, elopement by 61.5% and seclusion and restraint by 60.0%; he found no

8
statistical significant differences in urine toxicology ordered, follow-up care provided and
readmission rate after 30 days.
Zeller (2010) adds that a PES can be advantageous for medical emergency
departments in decompression of overcrowding, allowing psychiatric patients to be
transferred for their evaluations and treatment rather than waiting for consultants to
arrive at a facility or an inpatient bed to become available. Many PES programs can also
accept ambulances, police deliveries, and self-referrals directly, allowing crisis patients
to avoid medical emergency departments completely.
Although this model is more expensive than the previous, with the cost of 24/7
staffing and of maintaining its own physical plant, if it implemented in facilities or
communities seeing large numbers of acute psychiatric patients per month, it can more
than justify its value by minimizing unnecessary inpatient admissions and shortening
lengths of stay.
TREATMENT GOALS OF EMERGENCY PSYCHIATRY
A high proportion of mental health patients presenting to medical emergency
departments with psychiatric complaints have co-existing medical illnesses or an
undiagnosed medical condition (Carlson, Nayar, & Suh, 1981), which can lead to serious
morbidity if failed to identify (Hall, Popkin, Devaul, Faillace, & Stickney, 1978). Therefore,
the first step (triage) of a psychiatric emergency is to rule out any threatening organic
condition. In some ED models, this procedure is always made by an emergency physician
since all the patients first run through a triage procedure.
Simultaneously, the risk of violence must be assessed to preserve the safety of
the patient, family, other patients and ED staff.
After ensuring patient’s medical stability, managing of the acute crisis follows.
Frequently, this will involve medications, although sometimes brief support
psychotherapy can also be sufficient. The patients who are not able to be stabilized in
the emergency setting will need inpatient admission to resolve the acute condition.
To achieve the best outcomes possible, it is very important that crisis
professionals treat patients in the least restrictive setting, avoiding coercion and manage
9
patients in a supportive, caring, and interpersonal manner, creating with them what is
known as a therapeutic alliance (Zeller, 2010).
The last, but still essential step is to provide the patient an appropriate care plan
for post-discharge: patients can be hospitalized, referred to psychiatric/psychological
urgent or regular appointments, general practitioner (GP) appointments, substance
abuse programs, or other solutions available in the area. Referral to social care is
fundamental in many situations. Psychoeducation, giving instructions to deal with future
crisis episodes, must not be forgotten.
10
OUTCOMES IN PSYCHIATRY EMERGENCY DEPARTMENTS
HOSPITALIZATION
An increased focus on providing care in community settings has taken place in
developed countries in recent decades (Sabes-Figuera et al., 2016). The policy of
redirecting the public health-care budget for long-term assistance of people with chronic
and disabling mental-health needs (Lieberman, Dixon, & Goldman, 2013) and the fiscal
restrictions pressured health-care providers to reduce hospitalizations and lengths-of-
stay (Sharfstein & Dickerson, 2009). Therefore, the number of psychiatric beds
decreased in most European countries in recent years (Knapp et al., 2008). Despite this
trend, psychiatric hospital inpatient services remain an important element of the mental
health care system. In 2010/11 in England, investment in inpatient care for working age
adults was estimated to be £2 billion, representing 38 % of all direct investment for this
population (Mental Health Strategies, 2011).
In Portugal, in the year 2005, hospitalization represented nearly 83% of the public
costs in mental health, whilst in the global National Health Service it accounted for 56%
(Comissão Nacional para a Reestruturação dos Serviços de Saúde Mental, 2007).
Most of the developed countries worldwide implemented policies seeking to
reduce inpatient admissions. This indicator is widely used as an outcome to evaluate the
efficacy and efficiency of health-care policies.
READMISSIONS
Although readmission rates have not been universally accepted as an accurate
measure of quality of care (Madi, Zhao, & Li, 2007), they bring implications for health
care costs, patient quality of life, overall health care cost burden, and health care
workers’ morale. As such, readmission rates most likely will be an indicator of quality
tied to reimbursement and will assume a central role in health care system’s quality
improvement initiatives (Adams & Nielson, 2012). Chan & Ovens (2002) also point that
readmissions often do not lead to any improvement in health outcomes and sometimes
are associated with negative attitudes. Given these findings, in 2009, British Department
of Health defined readmission reduction to general hospitals as a new target (Tadros et
al., 2013).
11
According to Adams & Nielson (2012), many factors contribute to a psychiatric
patients’ need to return to the emergency department including treatment non-
compliance, outpatient provider unavailability, and a patient’s inability to manage their
illness symptoms. Noncompliance with aftercare plan often leads to high rates of
readmission to the ER (Bruffaerts, Sabbe, & Demyttenaere, 2004, 2005). In 1977, Del
Gaudio et al. (1977) already concluded that only 41.8% of PE discharged patients
completed their referral.
Bruffaerts and colleagues (2004) suggest that for some patients, readmission
might be more highly influenced by health-system characteristics (as lack of aftercare
plan, brevity of inpatient stay, and discharge against medical advice) than the severity of
their illness.
A study in the US analyzed the implementation of a ‘Comprehensive Psychiatric
Emergency Program’, which combines a psychiatric emergency department and an
observation unit with a mobile crisis unit, interim crisis unit, and crisis residence. The
goal was to ensure patient compliance with follow up and ease in arranging services,
providing an immediate appointment, providing close follow up, and ensuring a
collaborative and interdisciplinary approach that addresses the patients’ biopsychosocial
needs. Patient outcomes improved and readmissions decreased in the population using
the program. Fifty-five percent of the patients who were seen through this program
were either successfully connected with outpatient providers or were no longer in need
of services (Simakhodskaya, Haddad, Quintero, & Malavade, 2009).
WAITING TIMES
Waiting times in emergency departments are major concern in many countries,
and to deal with this problem, policymakers in Canada, Australia, and England have
instituted health reforms that include setting targets for the time patients spend in the
department (Guttmann, Schull, Vermeulen, & Stukel, 2011).
According to Moshin (2007) , long waiting times can delay every stage of the visit,
from initial assessment, to treatment, or final decision making, and can alter clinicians’
routines and decision making. It is also associated with delays in time sensitive treatment
for serious medical conditions typically requiring admission to hospital (Diercks et al.,
2007).
12
A Canadian study on the association between waiting times and short-term
mortality concluded that the risk of adverse events increased with the mean length of
stay of similar patients in the same shift in the emergency department. Presenting to an
emergency department during shifts with longer waiting times, also reflected in longer
mean length of stay, is associated with a greater risk in the short term of death and
admission to hospital in patients who are well enough to leave the department
(Guttmann et al., 2011).
Patients with psychiatric and drug- or alcohol-related complaints may represent
a disproportionate number of longer wait times in the ED (Wartman, Taggart, & Palm,
1984). A 2004 multi-institutional survey found that psychiatric patients from EDs without
psychiatric consultation had a waiting time two times longer (Mulligan, 2004).
FREQUENT USERS
Patients frequently attending hospitals have been estimated to cost UK health
services approximately £2.3 billion every year (Syed N, 2007). Research suggests that
there are almost half a million frequent attendees in the UK and over a million emergency
admissions to hospitals annually (Sampson, Blanchard, Jones, Tookman, & King, 2009).
In a study from 2006, Zeman & Arfken (2006) concluded that between 20–40%
of all emergency department psychiatric visits are unnecessary. Frequent visitors are
estimated to account for as many as one-third of all visits to psychiatric emergency
services (Ellison, Blum, & Barsky, 1986), contributing to a large proportion of these
unnecessary visits. Staff members may feel antagonized by these frequent visitors
(Arfken, Zeman, Yeager, Mischel, & Amirsadri, 2002), who take up space and time
needed for attending to all patients, and this antagonism may lead to poor rapport and
negative expectations as well as over and undertreatment (Arfken et al., 2004).
Several studies have found that risk factors for frequent visitors include higher
rates of psychiatric hospitalization and lower levels of access to resources (Bassuk &
Gerson, 1980; Dhossche & Ghani, 1998; Ellison et al., 1986; Hansen & Elliott, 1993;
Klinkenberg & Calsyn, 1997; Munves, Trimboli, & North, 1983; Purdie, Honigman, &
Rosen, 1981; Saarento, Hakko, & Joukamaa, 1998; Slaby & Perry, 1980).
13
In a study comparing frequent to infrequent Psychiatric ED visitors, Arfken and
al. (2004) found that frequent visitors had greater utilization of inpatient and outpatient
behavioral health services, general emergency services, and crisis residential services in
the 12 months before the index visit and greater utilization of general emergency
services and psychiatric emergency services in the three months after the index visit.
Frequent visitors’ median financial charge for those services was $16,200 greater (5.9
times greater) than that of infrequent visitors. They concluded that frequent visitors
represent socially unfavoured persons who have high levels of utilization of health care
facilities besides psychiatric emergency services.
LEFT WITHOUT BEING SEEN
For Hsia et al., (2011) the proportion of patients who leave without being seen
(LWBS) in the emergency department is an outcome-oriented measure of impaired
access to emergency care and represents the failure of an emergency care delivery
system to meet its goals of providing care to those most in need. In this study, they
concluded that visitors to different EDs experience a large variation in their probability
of leaving without being seen, and visitors to hospitals serving a high proportion of low-
income and poorly insured patients are at disproportionately higher risk of leaving
without being seen.
The definition of LWBS varies across studies. For instance, while Bassuk &
Gerson (1980) considered more than one ED visit within one year, Arfken et al. (2004)
consider more than six visits within one year.
Although representing a relatively small number of patients, LWBS patients have
a disproportionately contribution for the amount of ED work and global health care
costs (Hsia et al., 2011; Saarento et al., 1998; Sullivan, Bulik, Forman, & Mezzich, 1993;
Sun, Binstadt, Pelletier, & Camargo, 2007).
In a study from 1986, about half of the patients who did not receive a timely
evaluation in an emergency department left without treatment (Weissberg, Heitner,
Lowenstein, & Keefer). Moshin et al. (2007) calculated that the frustration with long
waits can cause up to 10% to leave without being seen.
14
Several studies led to the conclusion that the proportion of annual hospital-level
LWBS visits is the amalgamation of all individual ED visitors’ decisions to leave without
being seen or not and is often used as a marker of ED crowding and is associated with
longer waits (Baker, Stevens, & Brook, 1991; Bindman, Grumbach, Keane, Rauch, & Luce,
1991; Rowe et al., 2006).
Although previous studies suggest that a relevant proportion of LWBS patients
are seriously ill and are at risk of poorer outcomes, thus requiring immediate evaluation
(Baker et al., 1991; Rowe et al., 2006), in a 2011 large cohort study by Guttmann et al.,
(2011) patients who left without being seen were not at higher risk of short term adverse
events.

15
MENTAL HEALTH IN PORTUGAL
EPIDEMIOLOGY
The Portugal National Mental Health Survey, 1st report (Caldas-de-Almeida & Xavier,
2010) is the Portuguese contribution to the World Health Organization ‘Mental Health
Surveys Initiative (WMHSI)’, coordinated by Ronald Kessler (Harvard Medical School).
It was the first large-scale mental health epidemiological study conducted in Portugal.
The results showed that psychiatric disorders have a high prevalence in Portugal
- 1 in 5 individuals presented any kind of psychiatric disorder in the previous 12 months
– the second higher prevalence in Europe, after Northern Ireland, and considerably far
from other southern European countries, which, without no exception, presented much
higher prevalence than the northern ones (Wang et al., 2011). The lifetime prevalence
for, at least, one psychiatric disorder was 42.7%, only surpassed by the US (47.4%). Spain
and Italy, for instance, had their values at, respectively, 19.4% and 18.1%.
The disorders with higher lifetime prevalence were major depressive disorder
(16.7%), specific phobias (10.6%) and alcohol abuse (10%). Anxiety disorders were the
diagnostic group with higher prevalence, followed by affective disorders (19.3%).
Higher prevalence was found amongst women, younger ages (18-34 years),
divorced and widowed. Whereas in women depressive and anxiety disorders are more
common, in men there are impulse control disorders and substance abuse. People with
lower educational level also present more impulse control and substance abuse
disorders.
The results also highlighted that, on the one hand, 15% of the sample got
psychiatric health care in the previous year, mainly in primary care settings. On the other
hand,, the majority (65%) of people with some kind of mental health disorder didn’t get
any mental health care in the previous year, mainly the less severe situations. However,
considering the health care access for the severe patients, Portugal performed 3rd in an
European study (Wang et al., 2011).
In contrast, a relevant group of people who accessed to mental health care in the
previous year did not present any psychiatric disorder, following diagnostic criteria from

16
DSM-IV. Although these persons could present some level of suffering, these numbers
point out to a mal-use of health care services.
The median waiting time between the onset of the disease and the access to
health care was about 4 years for major depressive disorder and 2 to 3 years for
generalized anxiety disorder and panic disorder.
Global Burden of Diseases, Injuries, and Risk Factors (GBD)(Institute for Health
Metrics and Evaluation, 2010) data from 2010 reveals that in Portugal, mental and
behavior disorders account for 11,75% of Disability-Adjusted Life Years (DALY) and for
20,55% of Years Lived with Disability (YLD).
Relevant epidemiological research in Portuguese psychiatric EDs is scarce. A
report from Direcção-Geral da Saúde (Direcção-Geral da Saúde, 2010) (the central
public healthcare department in Portugal) calculated that in 2008 psychiatric
emergencies represented 0,04% of the total ED visits in Portugal (including ED with and
without psychiatric ED and primary care) However, there are some reports on local
units: a 2010 report from a metropolitan ED revealed that psychiatric emergencies
counted for 6,6% of the ED total visits (Polido, 2011). Another analysis in the same unit
revealed that anxiety accounted for 16,2% of the total psychiatric ED visits, substance
abuse 11,3% and suicidal behavior for 9,7% (Pereira, 2011).
In 2013, Alves (2013) studied a sample of 210 psychiatric visitors from a
metropolitan psychiatric ED. 66,2% of the patients were women and mean age was of
45 years; 57% of the patients were exempt of co-payments; 51,4% weren’t having
psychiatric regular follow-up and 47,1% of those with regular follow-up had at last a
consultation in the previous month; 54,7% of the total sample had at least one psychiatric
hospitalization in the previous year. The principal causes for admission were anxiety
(53,8%), depressed mood (48,1%), suicidal behavior/thoughts (32,4%), substance abuse
(16,7%) and aggressiveness (15,7%). The most prevalent diagnosis at discharge were
Adjustment disorder (28%), Depressive disorder (14%), Psychosis not otherwise
specified (10%), Dementia/delirium (8%) and anxiety disorders (7%).
This study also concluded that only 9,5% of the patients were referred from
primary health care, suggesting poor communication between these players in the health
care chain. Data also underlined high waiting times for specialized consultation, poor
17
continuity of care in ambulatory, difficulties in scheduling appointments, barriers in the
access of ambulatory care after hospitalization, aspects that make the emergency
department a most accessible structure for health care. About 21% of the patients were
discharged to inpatient units. Most visits (54,3%) weren’t considered urgent.
The National Plan for Mental Health 2007-2016 also mentioned that the
preferential access to the psychiatric ED suggested difficulties accessing specialized
ambulatory health care (Coordenação Nacional para a Saúde Mental, 2008).
PSYCHIATRIC EMERGENCY DEPARTMENTS IN PORTUGAL
In 2001, the Portuguese government published a document (Rede de
Referenciação Hospitalar de Urgência/Emergência) that defined the national network for
referral within the diverse emergency departments across the country. This document
didn’t include a reference network for mental health emergencies. In 2004, the
document was updated and dispositions were made upon psychiatric emergency
departments (Direcção-Geral da Saúde, 2004).
The document mainly formalizes the pathway through the already existent
structures. The models used by each hospital vary substantially depending on the staff
availability, visits demand and administration policies. Across the nation, not all local
hospitals have a psychiatric ED/liaison team; where they exist, teams could work for 24
hours, 12 hours a day or less; could work all-week or just on working days; could be on
prevention some periods, mainly at night; could receive direct admissions to the ED, or
just by referral after previous medical evaluation.
Globally, each major metropolitan area in Portugal had one or more central ED
that accepted 24/7 referred patients from minor structures, organized hierarchically, in
case these didn’t have an available psychiatric unit for evaluation when the patient
arrived. The distance between these departments could vary from less than 10
kilometers to 100 to 200 km.
Nowadays, this structure remains mainly the same, although there is a tendency
to further centralize the psychiatric ED within a big metropolitan area.
In 2015, a work group from the Portuguese Health Department published a
document in which were defined entities called Local Mental Health Services (Serviços

18
Locais de Saúde Mental) responsible for the integration of mental health care of a
community within a geographical sector with 50.000 to 200.000 inhabitants; those
services should be responsible for permanent admission of psychiatric emergencies,
located into the global ED or other structure for crisis intervention (Ministério da Saúde,
2015).
19
OBJECTIVES
The increasing access to psychiatric emergency departments led to the
development of various models of functioning through the last decades.
Improving accessibility and promoting better care to the mental health patient
generated greater allocation of human and structural resources in the psychiatric ED,
achieving better results, mainly shortening waiting times and inpatient admissions.
However, higher accessibility also eases access for those who use the ED as a bypass of
the health care delivery system, seeking for a quicker, more convenient visit.
This work aims to compare psychiatric emergencies in two different
emergency department models in the north region of Portugal. For that
purpose, the researchers intend to describe psychiatric emergency episodes of 2 different
emergency departments (Centro Hospitalar de São João – CHSJ, and Centro Hospitalar
do Tâmega e Sousa - CHTS) in terms of:
1.1. volume of use and user’s sociodemographic characteristics;
1.2. the severity and indicators of performance.
20
SETTING
OVERVIEW
Public health care in continental Portugal is managed by 5 regional administrations
(Administrações Regionais de Saúde) that coordinate the public health care structures
in each of five major geographical areas in Portugal: Norte, Centro, Lisboa e Vale do
Tejo, Alentejo and Algarve.
The north region of Portugal (NUTS II) has a territorial extension of 21.285,9
km2 (about 23,1% of the country’s area, the third largest) and a resident population of
4.771.788 individuals (37% of the continental population, the largest population in the
country) (Instituto Nacional de Estatística, 2011). This region comprises the districts of
Viana do Castelo, Bragança, Vila Real, Braga, Porto, and the north part of Aveiro, Viseu
and Guarda.
There are 13 hospital centers in this region (some of them with various units,
geographically dispersed): Centro Hospitalar Póvoa de Varzim/Vila do Conde, EPE
(Public Enterprise Entity); Centro Hospitalar Entre Douro e Vouga, EPE; Centro
Hospitalar Médio Ave, EPE; Centro Hospitalar Porto, EPE; Centro Hospitalar Tâmega e
Sousa, EPE; Centro Hospitalar Trás-os-Montes e Alto Douro, EPE; Centro Hospitalar
de Vila Nova de Gaia/Espinho, EPE; Hospital da Senhora da Oliveira Guimarães, EPE;
Centro Hospitalar de São João, EPE; Hospital Santa Maria Maior, EPE; Hospital de Braga;
Unidade Local de Saúde do Nordeste, EPE; Unidade Local de Saúde de Matosinhos, EPE;
Unidade Local de Saúde do Alto Minho, EPE; Instituto Português de Oncologia Francisco
Gentil, EPE; Hospital Magalhães Lemos, EPE.
Of these, only five have a psychiatry emergency department: Unidade Local de
Saúde do Alto Minho, EPE (Unidade Hospitalar de Viana do Castelo); Unidade Local de
Saúde do Nordeste, EPE (Unidade Hospitalar de Bragança); Hospital de Braga; Centro
Hospitalar Trás-os-Montes e Alto Douro, EPE (Unidade Hospitalar de Vila Real); Centro
Hospitalar de São João, EPE (Unidade Hospitalar do Porto). The hospital network allows
the transference of mental health patients, when needed, from units without psychiatric
ED to the closest psychiatric ED available at the time.
21
CENTRO HOSPITALAR DE SÃO JOÃO, EPE.
Centro Hospitalar de São João, EPE., is a tertiary hospital center, the biggest in
northern Portugal and the second in the country. It is composed by two units, Hospital
de São João – Porto, and Hospital de Valongo. For many tertiary procedures, it is the
reference unit for most of the northern Portugal population, and is also the reference
primary and secondary hospital for part of the population of Porto and some neighbor
councils.
This polyvalent ED has within a psychiatric emergency unit – Urgência
Metropolitana de Psiquiatria do Porto (UMPP) – a metropolitan psychiatric ED, working
since 2006. It provides psychiatric emergency care to the population from the reference
geographic area of Centro Hospitalar de São João, Centro Hospitalar do Porto, o
Centro Hospitalar do Tâmega e Sousa, o Centro Hospitalar do Médio Ave, o Centro
Hospitalar de Vila Nova de Gaia/Espinho, o Centro Hospitalar Póvoa de Varzim-Vila do
Conde, o Centro Hospitalar Entre Douro e Vouga, a Unidade Local de Saúde de
Matosinhos and Hospital de Magalhães Lemos. This psychiatric ED serves a
geodemographic area of about 3.000.000 inhabitants from 27 councils.
UMPP is available 24 hours a day, every day of the year, and it receives patients
from 4 possible ways:
1. Directly from the exterior (open-door), for patients with Manchester
Triage System flowchart: self-harm, mental problems, strange
behavior. This includes patients in Portugal’s Mental Health Act;
2. Referred from the hospitals included in the UMPP;
3. Referred from other northern Portuguese hospitals, in periods where
there is no psychiatric ED (Centro Hospitalar de Trás-os-Montes e Alto
Douro and Unidade Local de Saúde do Nordeste at weekends and 0:00h
to 8:00h at week);
4. Referred directly from any other public or private health institution in the
geographical area of assistance.
There are 8 medical teams, composed by psychiatrist and psychiatry residents
from the hospital units integrating the UMPP, responsible for a 24-hour period, weekly,
22
and a rotating weekend shift. The composition of each team, although ruled by some
directives, presents relevant variability.
Physically, the ED it has a space within the general ED and shares its logistics. It
has 2 consultation rooms, 1 nurse room and an observation room.
Governmental data from 2009 (Administração Regional de Saúde do Norte,
2009) conclude that UMPP has about 12.000 episodes per year.
CENTRO HOSPITALAR DO TÂMEGA E SOUSA, EPE.
This hospital center is composed by 2 units: Unidade Padre Américo, in Penafiel
and Unidade Hospital de Amarante. It is a secondary center, so patients needing tertiary
care in certain medical specialties are referred to Centro Hospitalar de São João.
CHTS is the reference hospital center for a population about 520.000 individuals
(the second largest population in the country) from 12 different counties of 4 different
districts.
Unidade Amarante has a basic emergency department, and Unidade Padre
Américo has a polyvalent ED. Both EDs work 24 hours-a-day, all-year, in an open-door
model.
Until February 2011, CHTS had a psychiatry ED in a consultation model, working
from 8:00h to 20:00h., only in weekdays. In the periods without available psychiatric ED,
the patients needing specialized psychiatric management were transferred to the
psychiatric ED in CHSJ (UMPP since 2006). From February 2011 on, CHTS joined UMPP,
and its psychiatrists and psychiatry trainees form a team within UMPP.
Since then, both CHTS EDs don’t have a specific psychiatric area. They receive
psychiatric emergencies from the exterior, which are managed by a general ED physician.
When specialized psychiatric management is needed, the general physician transfers the
patient to UMPP.
23
METHODS
This thesis has an observational and descriptive nature.
For the first objective, all psychiatric emergency visits at UMPP and CHTS
occurred between 1st January 2015 and 31st of December 2016 were eligible.
ETHICS
This work was authorized by the President of the Administração Regional de
Saúde Norte and the Ethics Committee of CHSJ and CHTS.
All statistical analyses were performed on SPSS 24®.
DATA COLLECTION
Data from each ED episode was electronically collected in July 2017. Because of
the different nature of the hospitals’ IT systems, the operationalization of data collection
was different. At Centro Hospitalar de São João (UMPP) data was retrieved using
HVITAL, a data analysis in-house software platform, designed to automatically collect
and analyse all data electronically stored (Almeida, 2016). At Centro Hospitalar do
Tâmega e Sousa, variables were collected using ADW® and SONHO® software.
The following variables were collected:
• sex,
• age,
• admission date,
• ED discharge date,
• ED admission time,
• ED discharge time,
• waiting time between triage and first assessment,
• time between first assessment and discharge,
• MTS discriminator in the first triage,
• MTS fluxogram in the first triage,
• MTS bracelet color in the first triage,

24
• patient’s origin,
• institution of origin,
• co-payment exemption,
• district of residence,
• county of residence,
• parish of residence,
• discharge ICD-9 principal diagnosis code,
• discharge destination,
• discharge destination institution.
Patient’s File number and National Health Service number were used to match
data.
Demographic data for the counties of residence was obtained from Instituto
Nacional de Estatística online databases (data from 2011 national census).
INCLUSION CRITERIA OPERATIONALIZATION
Psychiatric emergency episodes were defined as:
1. for UMPP, episode encoded in HVITAL database as “Area Urgência = Psiquiatria”
(an episode managed in the psychiatric ED, independently of its origin or discharge
destination);
2. for CHTS,
i. episode with MTS flowchart of admission: self-harm, mental problems,
strange behavior or overdose and poisoning
AND
ii. episode with MTS discriminator of admission:
• significant psychiatric history;
• deep anguish;
• moderate to high risk of self-injury;
• moderate to high risk of aggression;
• disruptive behavior.
OR
iii. episode with discharge principal diagnosis (ICD-9):
25
• 290 to 319 – Mental Disorders;
• V11 - Personal history of mental disorder;
• V40 - Mental and behavioral problems;
• V60 - Housing household and economic circumstances;
• V61 - Other family circumstances;
• V62 - Other psychosocial circumstances;
• V69 - Problems related to lifestyle;
• E95 – Suicide and self-inflicted injury.
For objective 1.1, UMPP episodes were categorized in 3 groups according to their origin,
and compared:
• Exterior (INEM; Saúde24; exterior);
• Primary care ( ARS/health centers);
• Hospital transfer (other hospital; inpatient units; day hospital; outpatient units;
private practice).
CHTS episodes were not categorized, since this is a secondary hospital unit, thus
receiving patients mainly from the exterior (in this sample, 94.6%).
The two EDs ware compared.
For objective 1.2, UMPP visits were classified as follows:
o Without previous evaluation: INEM; Saúde24; exterior;
o With previous evaluation: ARS; health centers; other hospital; inpatient
units; day hospital; outpatient units; private practice; ED.
For the same reason stated before, CHTS visits were not categorized.
SOCIO-DEMOGRAPHICS
• Age, categorized in groups
o 18-24 years;
o 25-39 years;
o 40-64 years;
o 65-80 years;
o >80 years.
26
• Sex (male and female)
• Distance to ED (the rectilinear distance between the parish of residence centroid
and the hospital, calculated using ArcGis®), categorized in groups
o <10km;
o 10-30km;
o 30-50km;
o >50km.
• Exemption of co-payments (exempt vs not-exempt);
CHARACTERISTICS OF EMERGENCY DEPARTMENT ADMISSIONS
• Number of daily visits;
• Distribution by year, week and day (time) of admission;
• Distribution by MTS flowchart
o mental disorder;
o strange behavior;
o self-injury;
o overdose and poisoning;
o all other flowcharts were classified as ‘others’.
• Distribution by MTS discriminator
o significant psychiatric history;
o deep anguish;
o moderate to high risk of self-injury;
o moderate to high risk of aggression;
o disruptive behavior;
o all other discriminators were classified as ‘others’.
• Discharge diagnosis (ICD-9 principal diagnosis from 290 to 319, V11, V40, V60,
V61, V62, V69 and E95; all others were classified as ‘others’);
OUTCOME INDICATORS
• MTS bracelet color:
o Blue and White;
o Green;
27
o Yellow;
o Orange.
• Frequent users, defined as the proportion of patients with 4 or more ED
episodes within 12 months, from index visit.
• Discharge destination:
o Left without being seen;
o Exterior (ARS/Health Centers, outpatient consultation, exterior not
otherwise specified, others);
o Hospitalization in psychiatry unit;
o Hospitalization in a non-psychiatric unit;
o Left against medical approval.
• Re-admissions:
o 24 hours after index episode;
o 48 hours after index episode;
o 72 hours after index episode.
• Times:
o Waiting time for assessment (time between the end of MTS triage and
the first medical assessment);
o Total time of assessment (time between first medical assessment and
clinical discharge).
STATISTICAL ANALYSIS
For objective 1.1, UMPP and CTHS emergency departments were compared in
terms of patients’ socio-demographics and characteristics of emergency department
admissions; for objective 1.2, EDs were compared in terms of outcome indicators.
Analyses were further stratified according the origin of admission, as stated before.
Chi-square (χ2) test was performed to assess differences in categorical variables
and student’s t-test or Mann-Whitney U test in continuous variables, as appropriate
(normality was tested by the Kolmogorov-Smirnov test).
Statistical significance was assumed for an α=0.05.
28
RESULTS
1.1
SOCIODEMOGRAPHIC VARIABLES
Urgência Metropolitana de Psiquiatria do Porto had a total 27532 episodes in the
two years included in this study (5.5% of all CHSJ ED’s visits in the same period), 14025
in 2015 and 13507 in 2016, with an average of 37.7 visits per day. According to the
previously defined categories for origin, 17857 (69.9%) episodes arrived in the ED from
the Exterior, 7204 (26.2%) from hospital institutions (1628 visits, 5.9 of total, from
CHTS) and 2462 (8.9%) form Primary Care. In 9 episodes, the origin data was missing.
Centro Hospitalar do Tâmega e Sousa had a total 11257 episodes in the same
period (2.8% of all CHTS ED’s visits), 5737 in 2015 and 5520 in 2016, with an average of
15,4 visits per day. The difference in the average number of daily visits was statistically
significant (p<0.001). Regarding the origin, 297 episodes (2.6%) were transferred from
hospital institutions, 318 (2.8%) from primary care, and the clear majority, 10581
episodes (94,6%), arrived from the exterior.
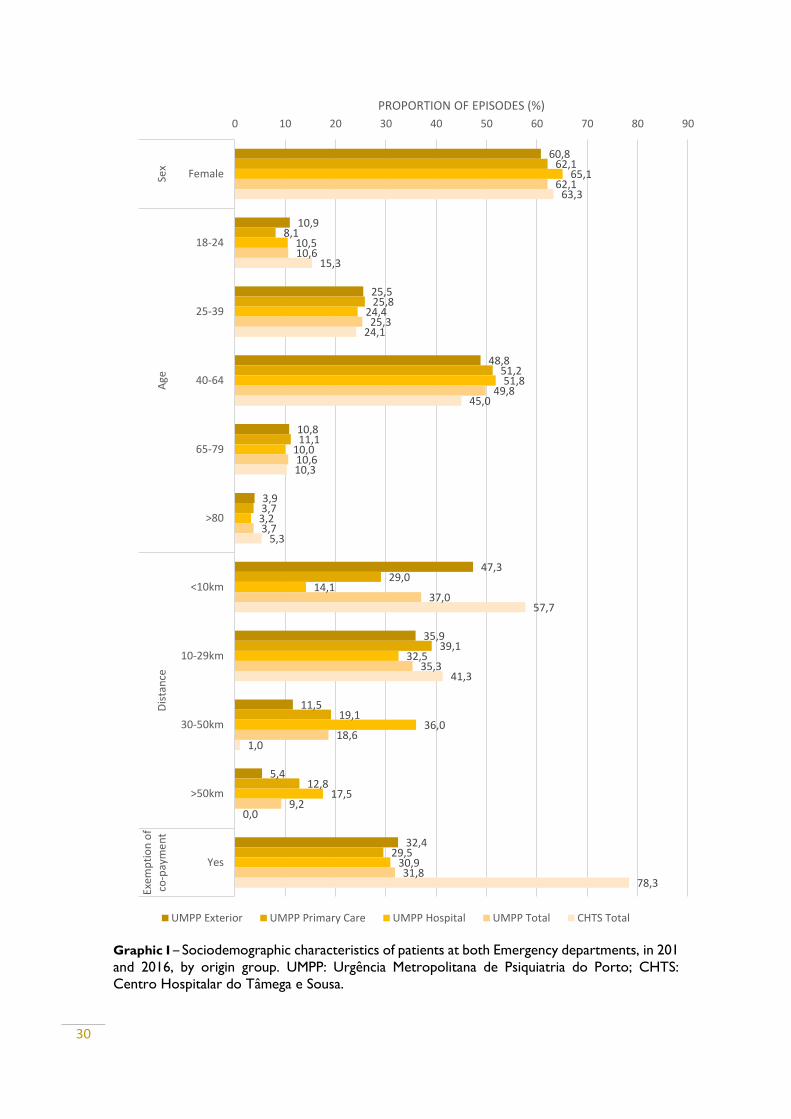
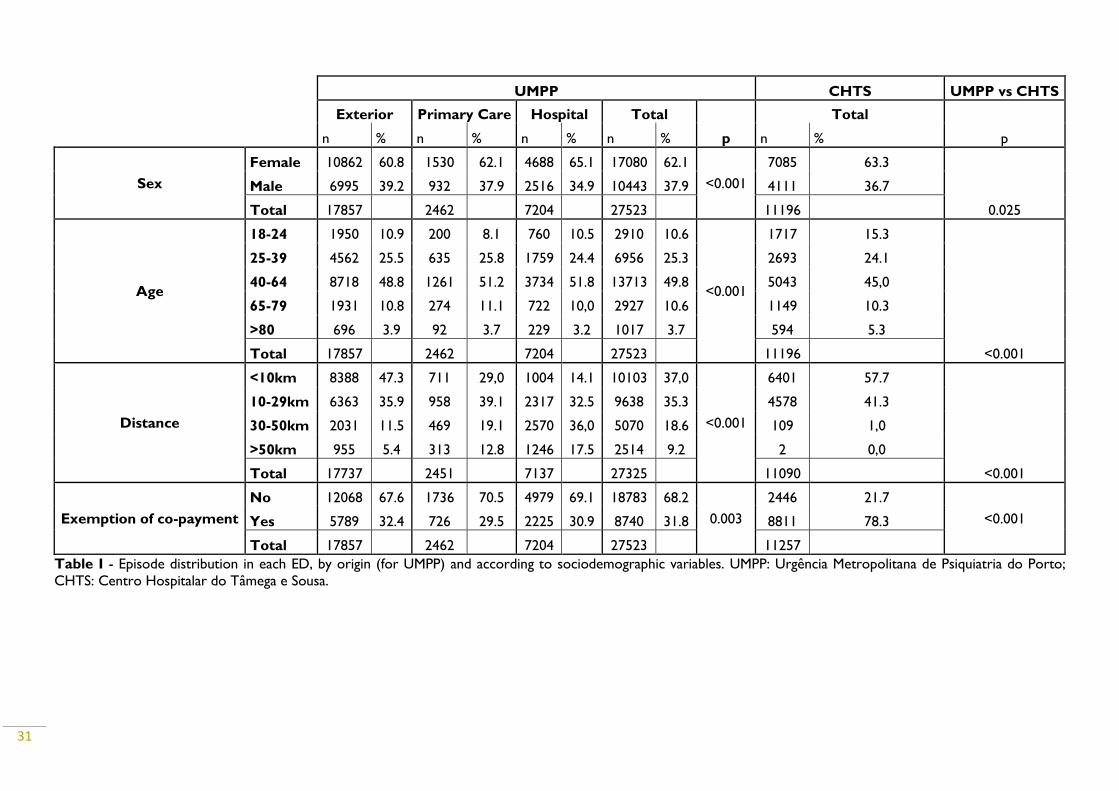
Table 1 presents the distribution of episodes’ sociodemographic variables for
both EDs. Graphic I displays the proportion of for each variable, by ED’s totals and by
origin group (for UMPP).
All UMPP’s origin group had higher proportion of visits by women, but this
proportion was greater in visitors from hospital institutions (65.1%). Sex proportion
according the group of origin are statistically significant (p<0.001).
Even though statistically significant different (p=0.025), sex distribution is very
similar between EDs, also with higher proportion of women (62.1% in UMPP and 63.3%
in CHTS).
The age group 40 to 64-year-old was largely the most frequent group of visitors
in each origin group (48.8% in exterior, 51.2% in primary care and 51.8% in hospital),
followed by patients aged between 25 and 39 years (25.5% in exterior, 25.8% in primary
care and 24.4% in hospital). While 18-24 was the third most frequent group for visitor
from exterior (10.5%) and hospital institutions (10.9%), for primary care, it was the 65-
79 (11.1%). The least frequent group was, for all origins, the >80, accounting for less
29
than 4% in every group. Differences between origin group are statistically significant
(p<0.001).
Although statistically significant different (p<0.001), age distribution was also
similar between EDs. The most frequent group was 40-64 (49.8% for UMPP and 45.0%
for CHTS), followed by 25-39 (25.3% for UMPP and 24.1% for CHTS). The major
difference appears in group 18-24, where CHTS has a larger proportion (15.3%) than
UMPP (10.6%). Groups 65-79 has again similar proportions in each ED (10.6% for UMPP
and 10,3% for CHTS). The least frequent group was >80 (3.7% for UMPP and 5.3% for
CHTS).
The distribution of visits according to distance to the ED varies substantially
according to origin group. Visitors from the exterior tend to live closer to the hospital
(proportion of visits diminishes consistently as the distance increases). Almost half the
visits from the exterior (47.3%) are due to patients that live less than 10km away from
CHSJ, whilst only 5.4% are from patients that live more than 50km away. In the case of
primary care visitors, the majority (39.1%) has their residence between 10 and 29km
from CHSJ, followed by less than 10km (29.0%). The proportion of visits from hospital
transfer increase as the distance also increases, until 30-50km, the group with most visits
(36.0%). Differences between origin group are statistically significant (p<0.001).
The UMPP overall number of visits follows the pattern of its most numbered
group of origin, exterior visits, with proportion of patients diminishing consistently as
the distance increases. The same pattern is observed in CHTS, but here almost 99% of
visits came from patients that live less than 30km away (57.7% from <10km and 41.3%
from 10-29km). Differences between ED are statistically significant (p<0.001).
The proportion of visits exempted of co-payments is similar between UMPP’s
origin group, accounting for about one-third of visits. The proportion is higher in
exterior (32.4%), followed by hospital transfer (30.9%) by primary care (29.5%).
Differences are statistically significant (p=0.003).
This proportion differs largely between EDs. Contrary to UMPP (31.8%), most
visits in CHTS (78.3%) are exempted of co-payments. This difference is statistically
significant (p<0.001).
30
Graphic I – Sociodemographic characteristics of patients at both Emergency departments, in 201
and 2016, by origin group. UMPP: Urgência Metropolitana de Psiquiatria do Porto; CHTS:
Centro Hospitalar do Tâmega e Sousa.
60,8
10,9
25,5
48,8
10,8
3,9
47,3
35,9
11,5
5,4
32,4
62,1
8,1
25,8
51,2
11,1
3,7
29,0
39,1
19,1
12,8
29,5
65,1
10,5
24,4
51,8
10,0
3,2
14,1
32,5
36,0
17,5
30,9
62,1
10,6
25,3
49,8
10,6
3,7
37,0
35,3
18,6
9,2
31,8
63,3
15,3
24,1
45,0
10,3
5,3
57,7
41,3
1,0
0,0
78,3
0 10 20 30 40 50 60 70 80 90
Female
18-24
25-39
40-64
65-79
>80
<10km
10-29km
30-50km
>50km
Yes
Sex
Age
Dis
tan
ceEx
emp
tio
n o
fco
-pay
me
nt
PROPORTION OF EPISODES (%)
UMPP Exterior UMPP Primary Care UMPP Hospital UMPP Total CHTS Total
31
UMPP CHTS UMPP vs CHTS
Exterior Primary Care Hospital Total
p
Total
p n % n % n % n % n %
Sex
Female 10862 60.8 1530 62.1 4688 65.1 17080 62.1
<0.001
7085 63.3
0.025
Male 6995 39.2 932 37.9 2516 34.9 10443 37.9 4111 36.7
Total 17857 2462 7204 27523 11196
Age
18-24 1950 10.9 200 8.1 760 10.5 2910 10.6
<0.001
1717 15.3
<0.001
25-39 4562 25.5 635 25.8 1759 24.4 6956 25.3 2693 24.1
40-64 8718 48.8 1261 51.2 3734 51.8 13713 49.8 5043 45,0
65-79 1931 10.8 274 11.1 722 10,0 2927 10.6 1149 10.3
>80 696 3.9 92 3.7 229 3.2 1017 3.7 594 5.3
Total 17857 2462 7204 27523 11196
Distance
<10km 8388 47.3 711 29,0 1004 14.1 10103 37,0
<0.001
6401 57.7
<0.001
10-29km 6363 35.9 958 39.1 2317 32.5 9638 35.3 4578 41.3
30-50km 2031 11.5 469 19.1 2570 36,0 5070 18.6 109 1,0
>50km 955 5.4 313 12.8 1246 17.5 2514 9.2 2 0,0
Total 17737 2451 7137 27325 11090
Exemption of co-payment
No 12068 67.6 1736 70.5 4979 69.1 18783 68.2
0.003
2446 21.7
<0.001 Yes 5789 32.4 726 29.5 2225 30.9 8740 31.8 8811 78.3
Total 17857 2462 7204 27523 11257
Table I - Episode distribution in each ED, by origin (for UMPP) and according to sociodemographic variables. UMPP: Urgência Metropolitana de Psiquiatria do Porto;
CHTS: Centro Hospitalar do Tâmega e Sousa.

32
DISTRIBUTION BY MONTH
Table II presents ED’s visit distribution according to month of the year (by origin
for UMPP and totals for UMPP and CHTS). Graph II and Graph III display this variation,
respectively, for UMPP’s categories of origin and for both ED’s totals.
Graphic II - UMPP proportion of visits in 2015 and 2016 by month of the year, according to the
origin group. UMPP: Urgência Metropolitana de Psiquiatria do Porto; CHTS: Centro Hospitalar
do Tâmega e Sousa.
Graphic III - Emergency Departments’ proportion of visits in 2015 and 2016 by month of the
year. UMPP: Urgência Metropolitana de Psiquiatria do Porto; CHTS: Centro Hospitalar do
Tâmega e Sousa.
8,0
7,1
8,18,2
8,4
8,9
9,3
9,6
8,5 8,6
7,77,6
7,47,6
8,7
10,0
8,7 8,7
9,5
8,18,2
8,8
7,9
6,5
7,57,4
8,7
9,3
8,7 8,8
9,5 9,5
8,2 8,2
7,1 7,1
6,0
6,5
7,0
7,5
8,0
8,5
9,0
9,5
10,0
10,5
Jan Feb Mar Apr May Jun Jul Aug Sep Oct Nov Dec
PR
OP
OR
TIO
N O
F EP
ISO
DES
(%
)
Exterior Primary Care Hospital
7,8
7,2
8,3
8,78,5
8,8
9,4 9,4
8,4 8,5
7,67,3
7,6
7,0
8,5
9,09,2
9,0
10,3
9,3
7,87,6
6,9
7,7
6,0
6,5
7,0
7,5
8,0
8,5
9,0
9,5
10,0
10,5
11,0
Jan Feb Mar Apr May Jun Jul Aug Sep Oct Nov Dec
PR
OP
OR
TIO
N O
F EP
IDO
SDES
(%
)
UMPP Total CHTS
33
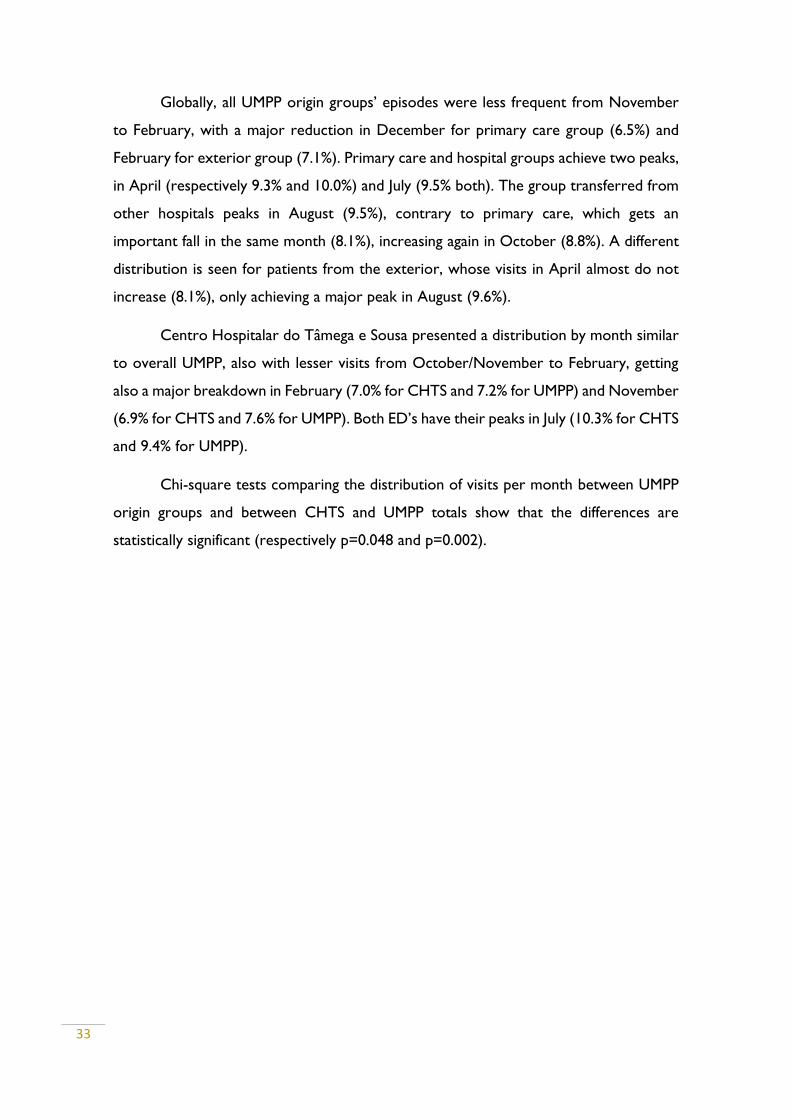
Globally, all UMPP origin groups’ episodes were less frequent from November
to February, with a major reduction in December for primary care group (6.5%) and
February for exterior group (7.1%). Primary care and hospital groups achieve two peaks,
in April (respectively 9.3% and 10.0%) and July (9.5% both). The group transferred from
other hospitals peaks in August (9.5%), contrary to primary care, which gets an
important fall in the same month (8.1%), increasing again in October (8.8%). A different
distribution is seen for patients from the exterior, whose visits in April almost do not
increase (8.1%), only achieving a major peak in August (9.6%).
Centro Hospitalar do Tâmega e Sousa presented a distribution by month similar
to overall UMPP, also with lesser visits from October/November to February, getting
also a major breakdown in February (7.0% for CHTS and 7.2% for UMPP) and November
(6.9% for CHTS and 7.6% for UMPP). Both ED’s have their peaks in July (10.3% for CHTS
and 9.4% for UMPP).
Chi-square tests comparing the distribution of visits per month between UMPP
origin groups and between CHTS and UMPP totals show that the differences are
statistically significant (respectively p=0.048 and p=0.002).
34
UMPP CHTS UMPP vs CHTS
Exterior Primary Care Hospital Total p Total p
Month n % n % n % n % n %
Jan 1430 8.0 183 7.4 540 7.5 2153 7.8 0.048
859 7.6 0.002
Feb 1264 7.1 187 7.6 532 7.4 1983 7.2
783 7
Mar 1449 8.1 213 8.7 629 8.7 2291 8.3
960 8.5
Apr 1473 8.2 246 10.0 673 9.3 2392 8.7
1012 9
May 1507 8.4 213 8.7 628 8.7 2348 8.5
1031 9.2
Jun 1585 8.9 215 8.7 635 8.8 2435 8.8
1009 9
Jul 1663 9.3 233 9.5 683 9.5 2579 9.4
1165 10.3
Aug 1713 9.6 199 8.1 681 9.5 2593 9.4
1044 9.3
Sep 1521 8.5 202 8.2 588 8.2 2311 8.4
881 7.8
Oct 1532 8.6 217 8.8 588 8.2 2337 8.5
860 7.6
Nov 1371 7.7 195 7.9 515 7.1 2081 7.6
781 6.9
Dec 1349 7.6 159 6.5 512 7.1 2020 7.3
872 7.7
Total 17857 2462 7204 27523
11257
Table II - Episode distribution in each ED, by origin (for UMPP) and according to month. UMPP: Urgência Metropolitana de Psiquiatria do Porto; CHTS: Centro Hospitalar
do Tâmega e Sousa.
35
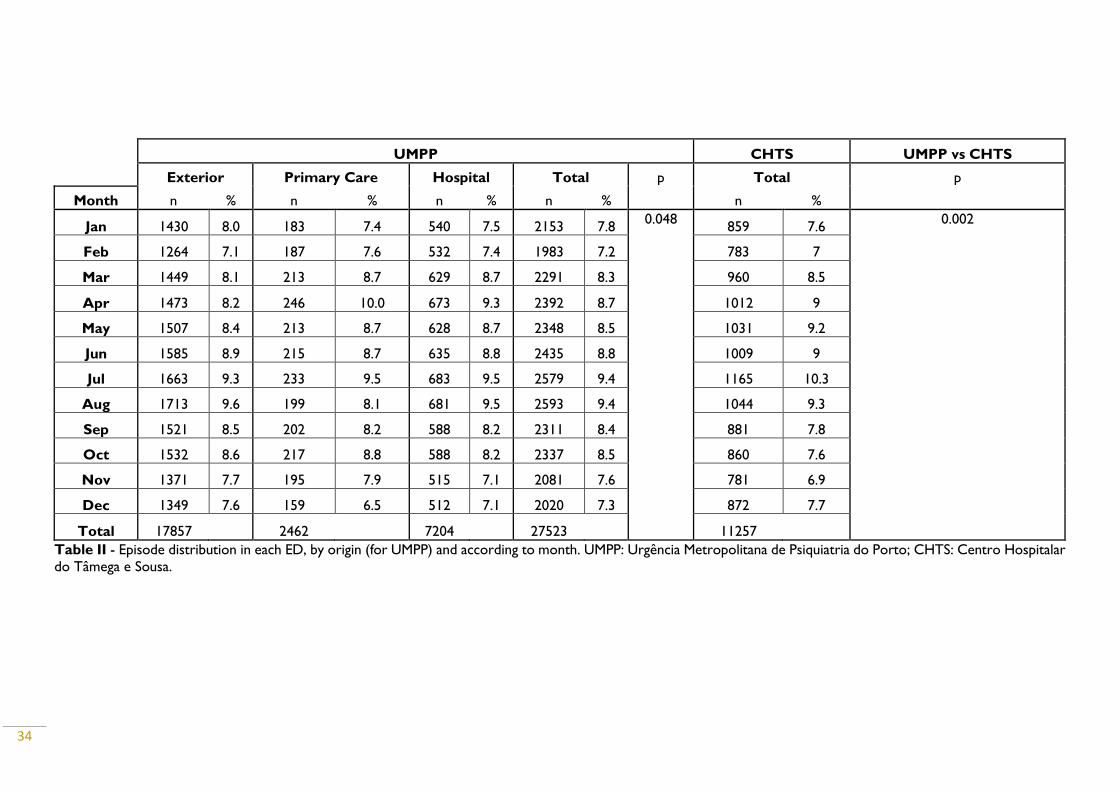
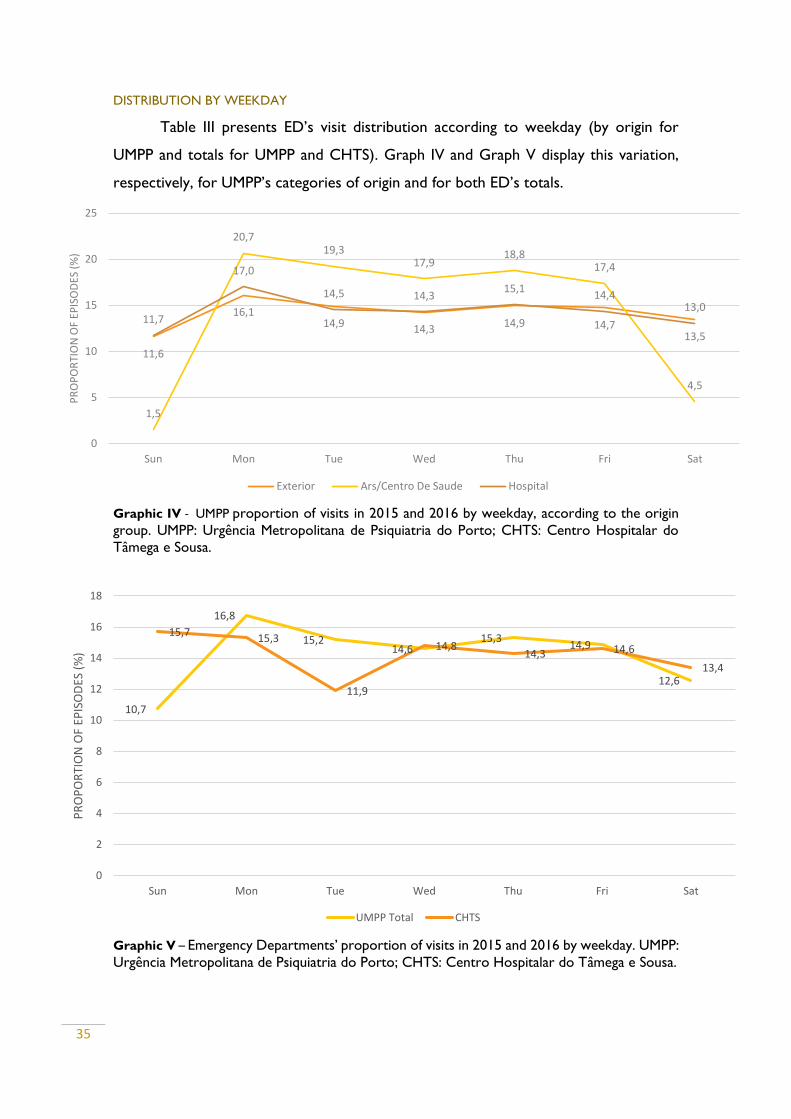
DISTRIBUTION BY WEEKDAY
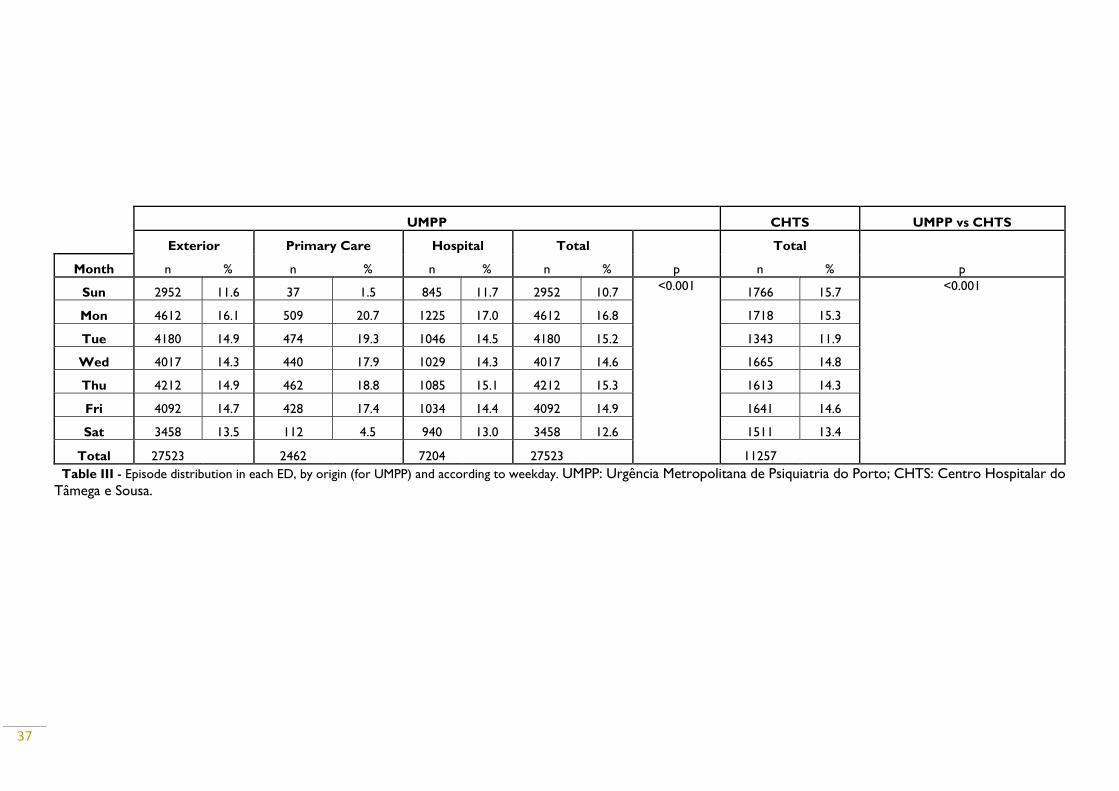
Table III presents ED’s visit distribution according to weekday (by origin for
UMPP and totals for UMPP and CHTS). Graph IV and Graph V display this variation,
respectively, for UMPP’s categories of origin and for both ED’s totals.
Graphic IV - UMPP proportion of visits in 2015 and 2016 by weekday, according to the origin
group. UMPP: Urgência Metropolitana de Psiquiatria do Porto; CHTS: Centro Hospitalar do
Tâmega e Sousa.
Graphic V – Emergency Departments’ proportion of visits in 2015 and 2016 by weekday. UMPP:
Urgência Metropolitana de Psiquiatria do Porto; CHTS: Centro Hospitalar do Tâmega e Sousa.
11,6
16,114,9 14,3
14,9 14,713,5
1,5
20,719,3
17,918,8
17,4
4,5
11,7
17,0
14,5 14,315,1
14,413,0
0
5
10
15
20
25
Sun Mon Tue Wed Thu Fri Sat
PR
OP
OR
TIO
N O
F EP
ISO
DES
(%
)
Exterior Ars/Centro De Saude Hospital
10,7
16,8
15,214,6
15,314,9
12,6
15,715,3
11,9
14,814,3 14,6
13,4
0
2
4
6
8
10
12
14
16
18
Sun Mon Tue Wed Thu Fri Sat
PR
OP
OR
TIO
N O
F EP
ISO
DES
(%
)
UMPP Total CHTS
36
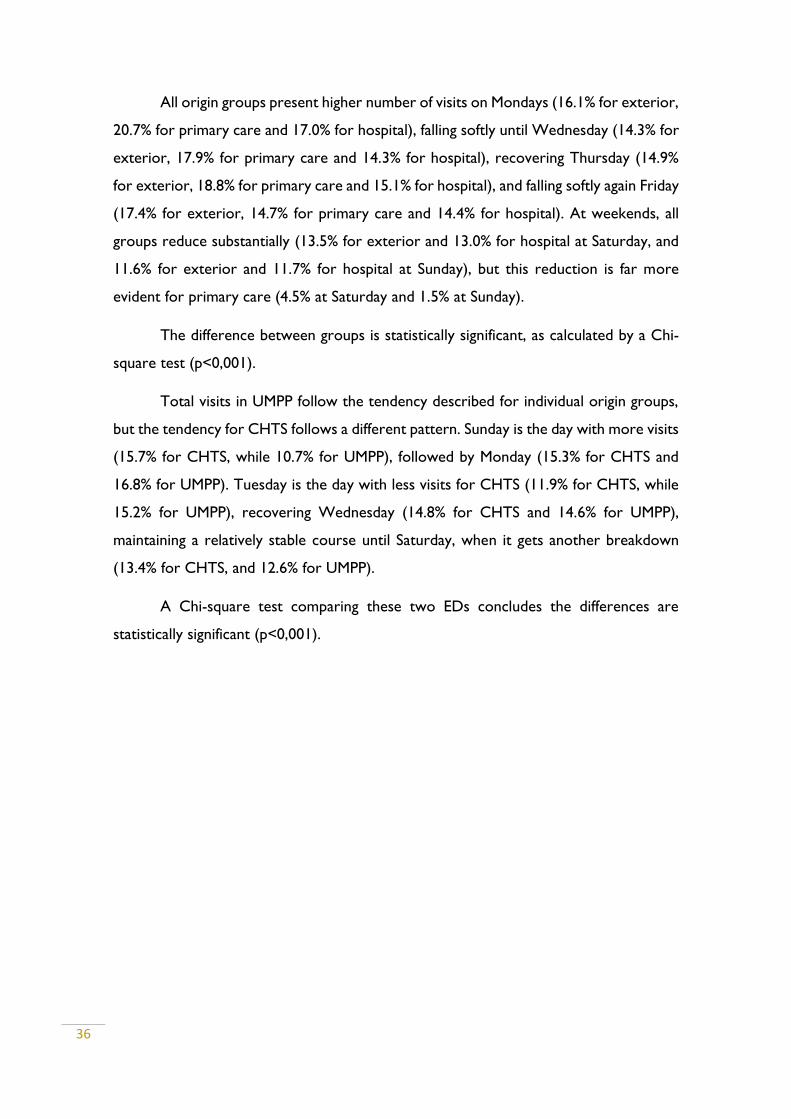
All origin groups present higher number of visits on Mondays (16.1% for exterior,
20.7% for primary care and 17.0% for hospital), falling softly until Wednesday (14.3% for
exterior, 17.9% for primary care and 14.3% for hospital), recovering Thursday (14.9%
for exterior, 18.8% for primary care and 15.1% for hospital), and falling softly again Friday
(17.4% for exterior, 14.7% for primary care and 14.4% for hospital). At weekends, all
groups reduce substantially (13.5% for exterior and 13.0% for hospital at Saturday, and
11.6% for exterior and 11.7% for hospital at Sunday), but this reduction is far more
evident for primary care (4.5% at Saturday and 1.5% at Sunday).
The difference between groups is statistically significant, as calculated by a Chi-
square test (p<0,001).
Total visits in UMPP follow the tendency described for individual origin groups,
but the tendency for CHTS follows a different pattern. Sunday is the day with more visits
(15.7% for CHTS, while 10.7% for UMPP), followed by Monday (15.3% for CHTS and
16.8% for UMPP). Tuesday is the day with less visits for CHTS (11.9% for CHTS, while
15.2% for UMPP), recovering Wednesday (14.8% for CHTS and 14.6% for UMPP),
maintaining a relatively stable course until Saturday, when it gets another breakdown
(13.4% for CHTS, and 12.6% for UMPP).
A Chi-square test comparing these two EDs concludes the differences are
statistically significant (p<0,001).
37
UMPP CHTS UMPP vs CHTS
Exterior Primary Care Hospital Total
p
Total
p Month n % n % n % n % n %
Sun 2952 11.6 37 1.5 845 11.7 2952 10.7 <0.001
1766 15.7 <0.001
Mon 4612 16.1 509 20.7 1225 17.0 4612 16.8 1718 15.3
Tue 4180 14.9 474 19.3 1046 14.5 4180 15.2 1343 11.9
Wed 4017 14.3 440 17.9 1029 14.3 4017 14.6 1665 14.8
Thu 4212 14.9 462 18.8 1085 15.1 4212 15.3 1613 14.3
Fri 4092 14.7 428 17.4 1034 14.4 4092 14.9 1641 14.6
Sat 3458 13.5 112 4.5 940 13.0 3458 12.6 1511 13.4
Total 27523 2462 7204 27523 11257 Table III - Episode distribution in each ED, by origin (for UMPP) and according to weekday. UMPP: Urgência Metropolitana de Psiquiatria do Porto; CHTS: Centro Hospitalar do
Tâmega e Sousa.
38
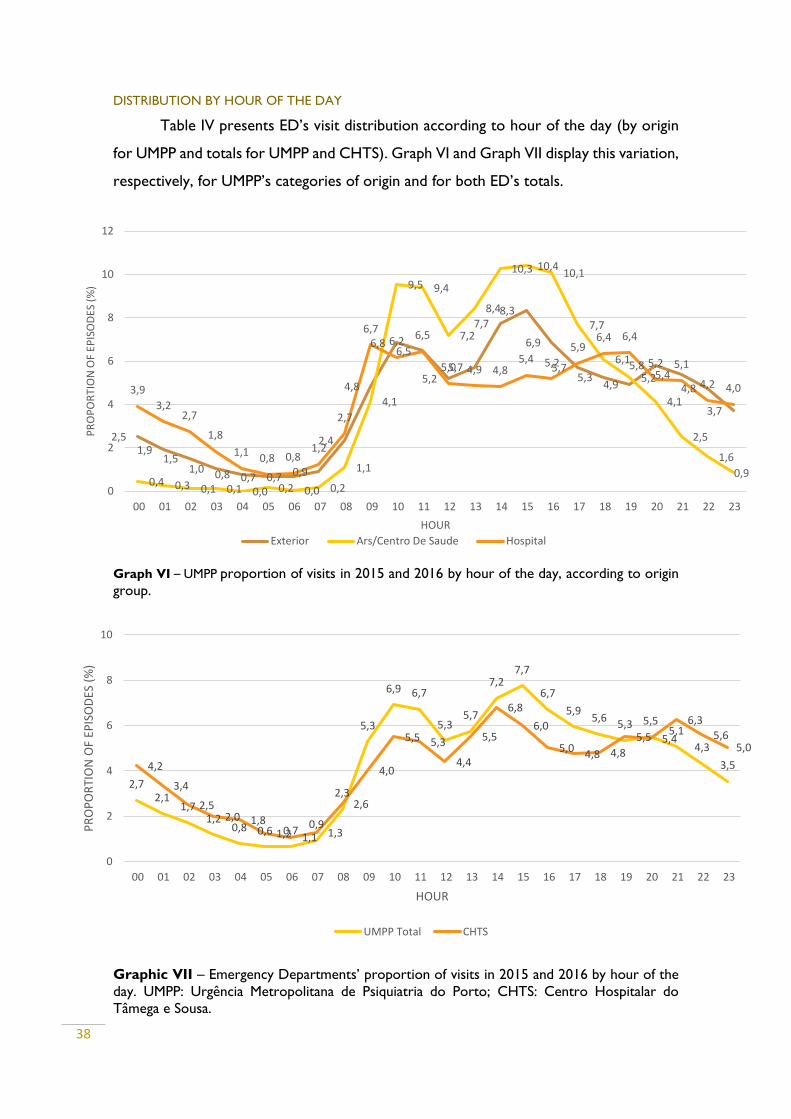
DISTRIBUTION BY HOUR OF THE DAY
Table IV presents ED’s visit distribution according to hour of the day (by origin
for UMPP and totals for UMPP and CHTS). Graph VI and Graph VII display this variation,
respectively, for UMPP’s categories of origin and for both ED’s totals.
Graph VI – UMPP proportion of visits in 2015 and 2016 by hour of the day, according to origin
group.
Graphic VII – Emergency Departments’ proportion of visits in 2015 and 2016 by hour of the
day. UMPP: Urgência Metropolitana de Psiquiatria do Porto; CHTS: Centro Hospitalar do
Tâmega e Sousa.
2,51,9
1,51,0 0,8 0,7 0,7 0,9
2,4
4,8
6,86,5
5,25,7
7,78,3
6,9
5,75,3
4,9
5,85,4
4,8
3,7
0,4 0,3 0,1 0,1 0,0 0,2 0,0 0,2
1,1
4,1
9,5 9,4
7,2
8,4
10,3 10,410,1
7,7
6,1
5,2
4,1
2,5
1,6
0,9
3,9
3,22,7
1,8
1,10,8 0,8
1,2
2,7
6,76,2
6,5
5,0 4,9 4,85,4 5,2
5,96,4 6,4
5,2 5,1
4,2 4,0
0
2
4
6
8
10
12
00 01 02 03 04 05 06 07 08 09 10 11 12 13 14 15 16 17 18 19 20 21 22 23
PR
OP
OR
TIO
N O
F EP
ISO
DES
(%
)
HOUR
Exterior Ars/Centro De Saude Hospital
2,72,1
1,71,2
0,8 0,6 0,70,9
2,3
5,3
6,9 6,7
5,35,7
7,27,7
6,7
5,95,6
5,3 5,55,1
4,3
3,54,2
3,4
2,52,0 1,8
1,2 1,1 1,3
2,6
4,0
5,5 5,3
4,4
5,5
6,8
6,0
5,04,8 4,8
5,5 5,4
6,3
5,65,0
0
2
4
6
8
10
00 01 02 03 04 05 06 07 08 09 10 11 12 13 14 15 16 17 18 19 20 21 22 23
PR
OP
OR
TIO
N O
F EP
ISO
DES
(%
)
HOUR
UMPP Total CHTS
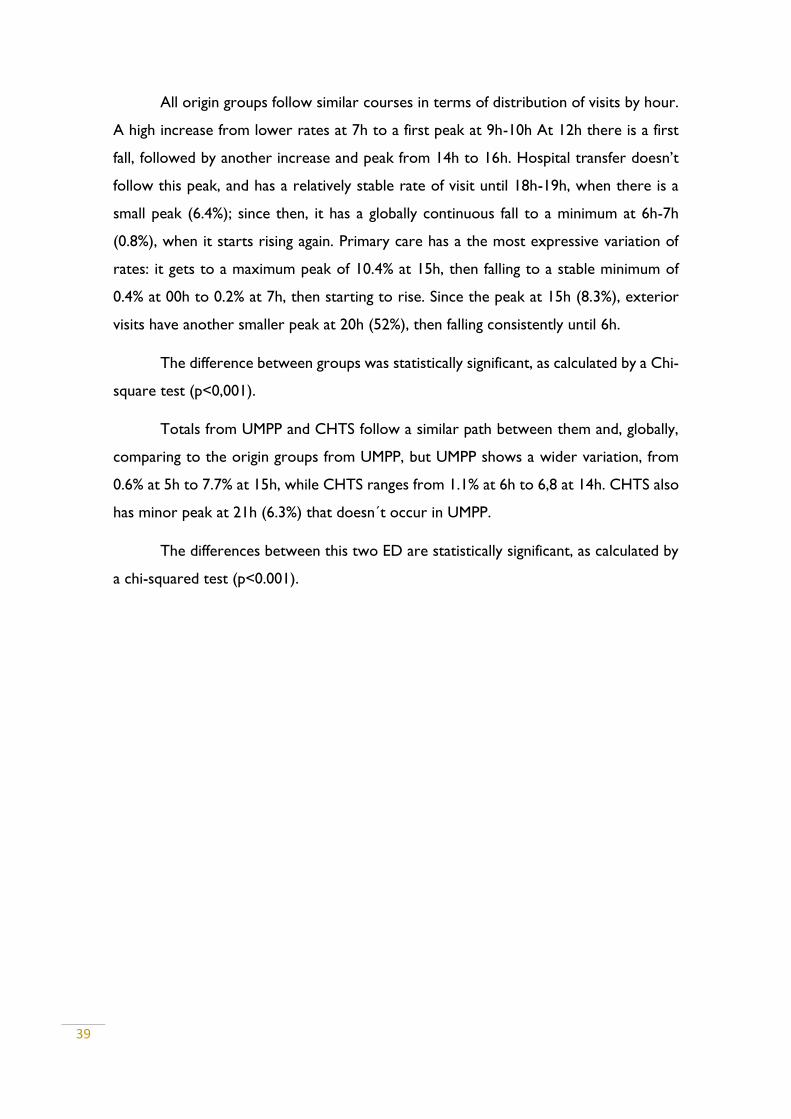
39
All origin groups follow similar courses in terms of distribution of visits by hour.
A high increase from lower rates at 7h to a first peak at 9h-10h At 12h there is a first
fall, followed by another increase and peak from 14h to 16h. Hospital transfer doesn’t
follow this peak, and has a relatively stable rate of visit until 18h-19h, when there is a
small peak (6.4%); since then, it has a globally continuous fall to a minimum at 6h-7h
(0.8%), when it starts rising again. Primary care has a the most expressive variation of
rates: it gets to a maximum peak of 10.4% at 15h, then falling to a stable minimum of
0.4% at 00h to 0.2% at 7h, then starting to rise. Since the peak at 15h (8.3%), exterior
visits have another smaller peak at 20h (52%), then falling consistently until 6h.
The difference between groups was statistically significant, as calculated by a Chi-
square test (p<0,001).
Totals from UMPP and CHTS follow a similar path between them and, globally,
comparing to the origin groups from UMPP, but UMPP shows a wider variation, from
0.6% at 5h to 7.7% at 15h, while CHTS ranges from 1.1% at 6h to 6,8 at 14h. CHTS also
has minor peak at 21h (6.3%) that doesn´t occur in UMPP.
The differences between this two ED are statistically significant, as calculated by
a chi-squared test (p<0.001).
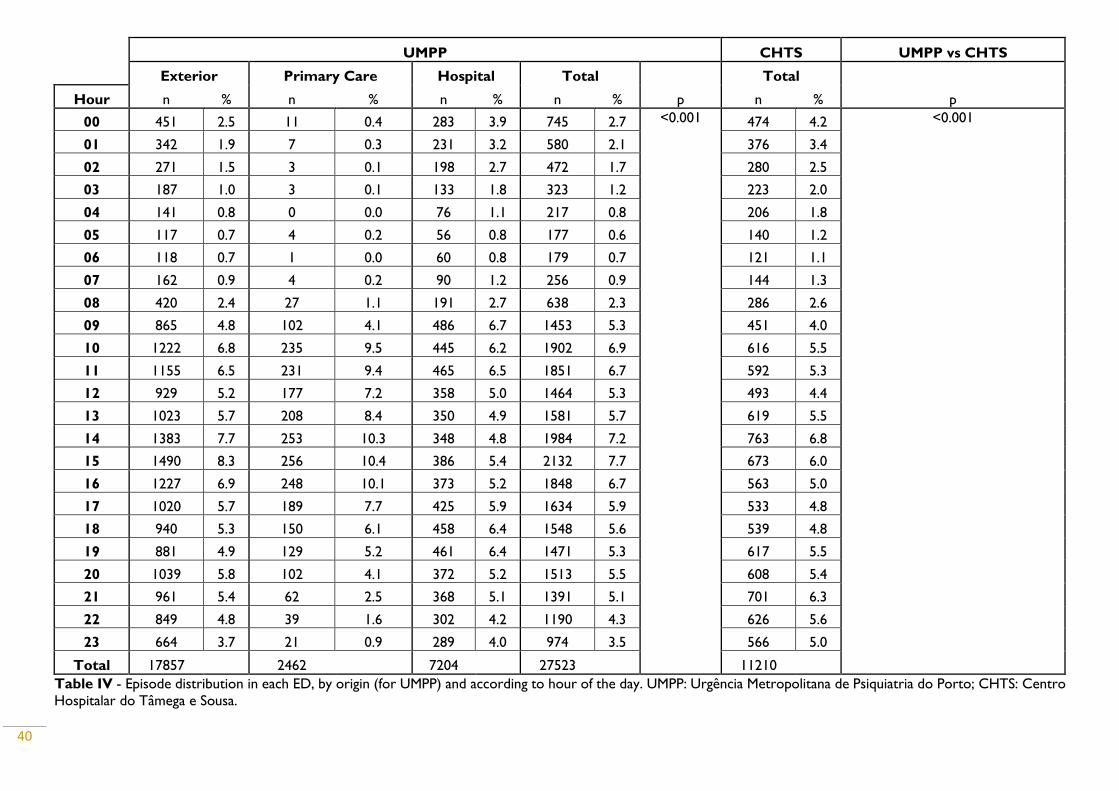
40
UMPP CHTS UMPP vs CHTS
Exterior Primary Care Hospital Total
p
Total
p Hour n % n % n % n % n %
00 451 2.5 11 0.4 283 3.9 745 2.7 <0.001 474 4.2 <0.001
01 342 1.9 7 0.3 231 3.2 580 2.1 376 3.4
02 271 1.5 3 0.1 198 2.7 472 1.7 280 2.5
03 187 1.0 3 0.1 133 1.8 323 1.2 223 2.0
04 141 0.8 0 0.0 76 1.1 217 0.8 206 1.8
05 117 0.7 4 0.2 56 0.8 177 0.6 140 1.2
06 118 0.7 1 0.0 60 0.8 179 0.7 121 1.1
07 162 0.9 4 0.2 90 1.2 256 0.9 144 1.3
08 420 2.4 27 1.1 191 2.7 638 2.3 286 2.6
09 865 4.8 102 4.1 486 6.7 1453 5.3 451 4.0
10 1222 6.8 235 9.5 445 6.2 1902 6.9 616 5.5
11 1155 6.5 231 9.4 465 6.5 1851 6.7 592 5.3
12 929 5.2 177 7.2 358 5.0 1464 5.3 493 4.4
13 1023 5.7 208 8.4 350 4.9 1581 5.7 619 5.5
14 1383 7.7 253 10.3 348 4.8 1984 7.2 763 6.8
15 1490 8.3 256 10.4 386 5.4 2132 7.7 673 6.0
16 1227 6.9 248 10.1 373 5.2 1848 6.7 563 5.0
17 1020 5.7 189 7.7 425 5.9 1634 5.9 533 4.8
18 940 5.3 150 6.1 458 6.4 1548 5.6 539 4.8
19 881 4.9 129 5.2 461 6.4 1471 5.3 617 5.5
20 1039 5.8 102 4.1 372 5.2 1513 5.5 608 5.4
21 961 5.4 62 2.5 368 5.1 1391 5.1 701 6.3
22 849 4.8 39 1.6 302 4.2 1190 4.3 626 5.6
23 664 3.7 21 0.9 289 4.0 974 3.5 566 5.0
Total 17857 2462 7204 27523 11210 Table IV - Episode distribution in each ED, by origin (for UMPP) and according to hour of the day. UMPP: Urgência Metropolitana de Psiquiatria do Porto; CHTS: Centro
Hospitalar do Tâmega e Sousa.
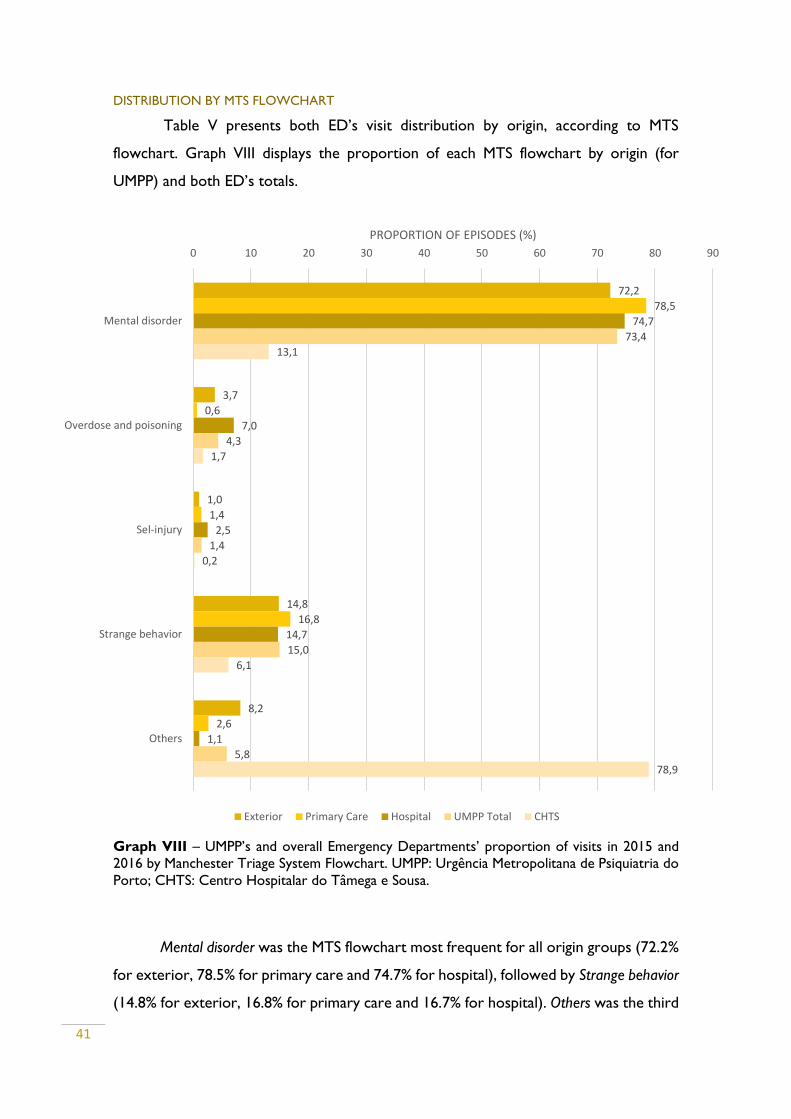
41
DISTRIBUTION BY MTS FLOWCHART
Table V presents both ED’s visit distribution by origin, according to MTS
flowchart. Graph VIII displays the proportion of each MTS flowchart by origin (for
UMPP) and both ED’s totals.
Graph VIII – UMPP’s and overall Emergency Departments’ proportion of visits in 2015 and
2016 by Manchester Triage System Flowchart. UMPP: Urgência Metropolitana de Psiquiatria do
Porto; CHTS: Centro Hospitalar do Tâmega e Sousa.
Mental disorder was the MTS flowchart most frequent for all origin groups (72.2%
for exterior, 78.5% for primary care and 74.7% for hospital), followed by Strange behavior
(14.8% for exterior, 16.8% for primary care and 16.7% for hospital). Others was the third
72,2
3,7
1,0
14,8
8,2
78,5
0,6
1,4
16,8
2,6
74,7
7,0
2,5
14,7
1,1
73,4
4,3
1,4
15,0
5,8
13,1
1,7
0,2
6,1
78,9
0 10 20 30 40 50 60 70 80 90
Mental disorder
Overdose and poisoning
Sel-injury
Strange behavior
Others
PROPORTION OF EPISODES (%)
Exterior Primary Care Hospital UMPP Total CHTS
42
most frequent flowchart for exterior (8.2%) and primary care (2.6%), but the least
frequent for hospital (1.1%), whose third most frequent flowchart was Overdose and
poisoning (7.0%). The latter flowchart was the least frequent to primary care (0.6%). Self-
injury (1.0%) was the least common flowchart for exterior visits.
Difference between these groups was statistically significant, as calculated by a
Chi-square test (p<0.001).
The distribution for CHTS was very different. Others was by far the most frequent
flowchart (78.9%), whereas in overall UMPP it accounts for only 5.8%. Mental disorder
was the second most frequent flowchart for CHTS (13.1%) and the most frequent in
UMPP (5.8%). For CHTS, then follows strange behavior (6.1%), overdose and poisoning
(1.7%) and self-injury (0.2%), while in UMPP, they account, respectively, for 15.0%, 4.3%
and 1.4%.
The difference between these EDs was statistically significant, according to a Chi-
square test (p<0.001).
DISTRIBUTION BY MTS DISCRIMINATOR
Table VI presents both ED’s visit distribution by origin, according to MTS
discriminator. Graph IX displays the proportion of each MTS discriminator by origin (for
UMPP) and both ED’s totals.
Significant psychiatry history was the most frequent MTS discriminator in all UMPP
origin groups (47.3% for exterior, 43.0% for primary care and 48.8% for hospital). For
exterior visits, it follows Others (21.7%), Deep anguish (13.3%), Moderate to high-risk of
self-injury (9.0%), Moderate to high risk of aggression (8.0%) and, at last, Disruptive behavior
(0.6%), which was also the least frequent discriminator for primary care (1.3%) and
hospital transfers (1.2%). For primary care, the second most frequent discriminator was
Moderate to high-risk of self-injury (21.4%), followed by Deep anguish (16.3%), Others
(10.6%) and Moderate to high-risk of aggression (7.3%). For hospital transfer, the second
most frequent discriminator was Moderate to high-risk of self-injury (28.5%), followed by
Deep anguish (8.5%), Others (7.0%) and Moderate to high-risk of aggression (5.9%).
The differences between origin groups were statistically significant, as performed
by a Chi-square test (p<0.001).
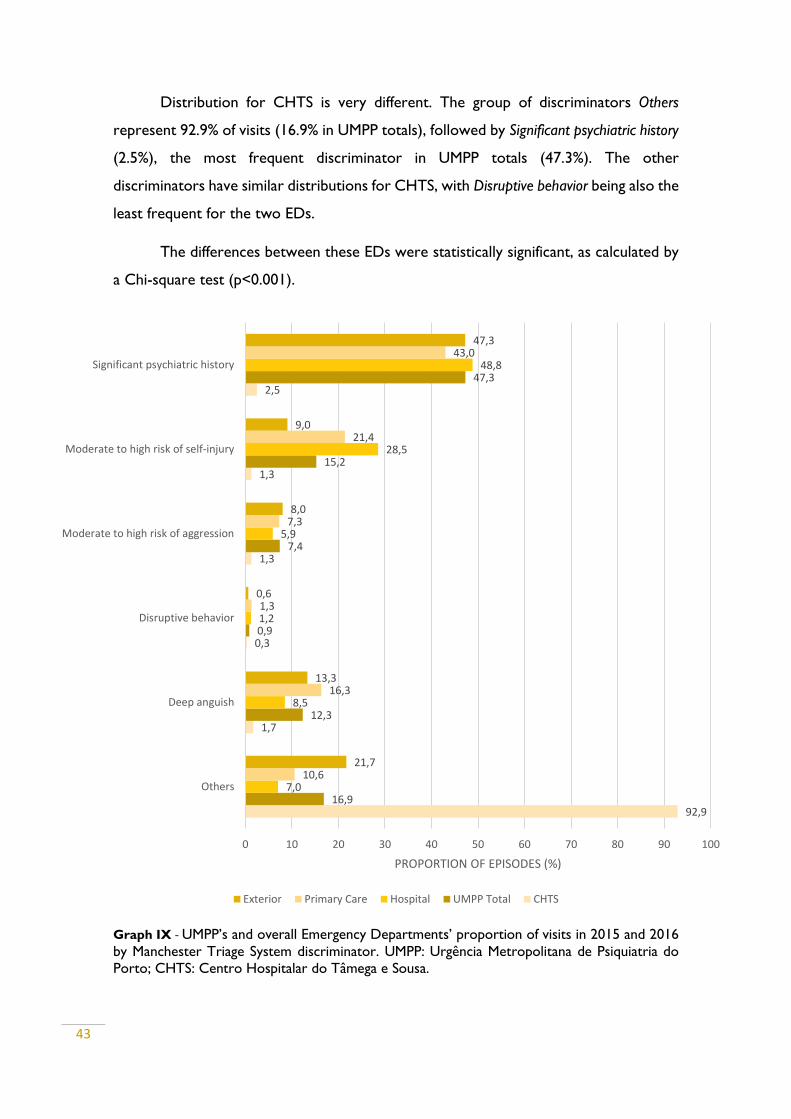
43
Distribution for CHTS is very different. The group of discriminators Others
represent 92.9% of visits (16.9% in UMPP totals), followed by Significant psychiatric history
(2.5%), the most frequent discriminator in UMPP totals (47.3%). The other
discriminators have similar distributions for CHTS, with Disruptive behavior being also the
least frequent for the two EDs.
The differences between these EDs were statistically significant, as calculated by
a Chi-square test (p<0.001).
Graph IX - UMPP’s and overall Emergency Departments’ proportion of visits in 2015 and 2016
by Manchester Triage System discriminator. UMPP: Urgência Metropolitana de Psiquiatria do
Porto; CHTS: Centro Hospitalar do Tâmega e Sousa.
92,9
1,7
0,3
1,3
1,3
2,5
16,9
12,3
0,9
7,4
15,2
47,3
7,0
8,5
1,2
5,9
28,5
48,8
10,6
16,3
1,3
7,3
21,4
43,0
21,7
13,3
0,6
8,0
9,0
47,3
0 10 20 30 40 50 60 70 80 90 100
Others
Deep anguish
Disruptive behavior
Moderate to high risk of aggression
Moderate to high risk of self-injury
Significant psychiatric history
PROPORTION OF EPISODES (%)
Exterior Primary Care Hospital UMPP Total CHTS
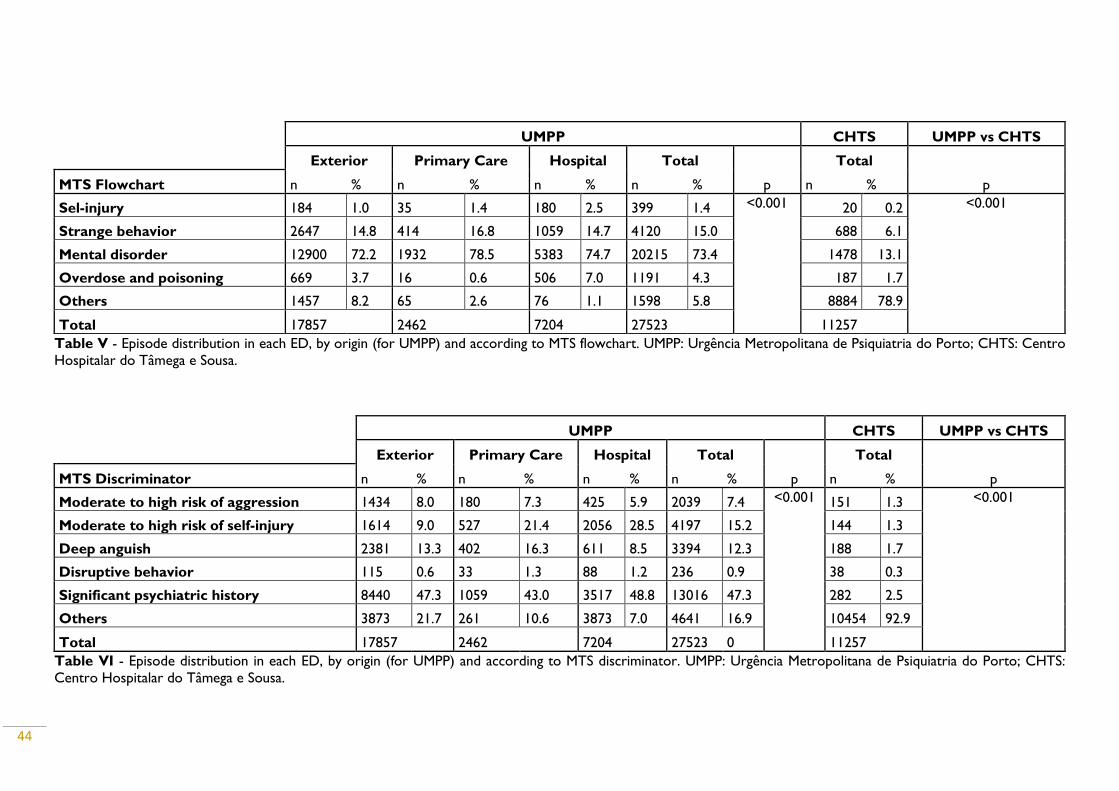
44
Table V - Episode distribution in each ED, by origin (for UMPP) and according to MTS flowchart. UMPP: Urgência Metropolitana de Psiquiatria do Porto; CHTS: Centro
Hospitalar do Tâmega e Sousa.
UMPP CHTS UMPP vs CHTS
Exterior Primary Care Hospital Total
p
Total
p MTS Discriminator n % n % n % n % n %
Moderate to high risk of aggression 1434 8.0 180 7.3 425 5.9 2039 7.4 <0.001 151 1.3 <0.001
Moderate to high risk of self-injury 1614 9.0 527 21.4 2056 28.5 4197 15.2 144 1.3
Deep anguish 2381 13.3 402 16.3 611 8.5 3394 12.3 188 1.7
Disruptive behavior 115 0.6 33 1.3 88 1.2 236 0.9 38 0.3
Significant psychiatric history 8440 47.3 1059 43.0 3517 48.8 13016 47.3 282 2.5
Others 3873 21.7 261 10.6 3873 7.0 4641 16.9 10454 92.9
Total 17857 2462 7204 27523 0 11257
Table VI - Episode distribution in each ED, by origin (for UMPP) and according to MTS discriminator. UMPP: Urgência Metropolitana de Psiquiatria do Porto; CHTS:
Centro Hospitalar do Tâmega e Sousa.
UMPP CHTS UMPP vs CHTS
Exterior Primary Care Hospital Total
p
Total
p MTS Flowchart n % n % n % n % n %
Sel-injury 184 1.0 35 1.4 180 2.5 399 1.4 <0.001 20 0.2 <0.001
Strange behavior 2647 14.8 414 16.8 1059 14.7 4120 15.0 688 6.1
Mental disorder 12900 72.2 1932 78.5 5383 74.7 20215 73.4 1478 13.1
Overdose and poisoning 669 3.7 16 0.6 506 7.0 1191 4.3 187 1.7
Others 1457 8.2 65 2.6 76 1.1 1598 5.8 8884 78.9
Total 17857 2462 7204 27523 11257
45
DISTRIBUTION BY DISCHARGE DIAGNOSIS
Table VI presents both ED’s visit distribution by origin (for UMPP) and both ED’s
totals, according to CID-9 diagnosis at discharge. Graph IX displays the proportion of
each diagnosis by origin (for UMPP) and both ED’s totals.
The distribution of UMPP origin groups and totals, and CHTS differs
considerably. For UMPP origin groups, Neurotic disorders (ICD-9: 300) was globally the
most frequent discharge diagnosis, accounting for 21.6% of total episodes at UMPP. It
was also the most frequent diagnosis in visits from the exterior (25.9%), but not for
primary care and for hospital, respectively with a proportion of 18.0% and12.0%. About
85% of the specific diagnosis for Neurotic disorders refer to Anxiety states (ICD-9: 300.0
and subdivisions).
For hospital group, the most frequent diagnosis was Others (all the diagnosis not
directly related to mental health), with 19.6% of this group’s visits; for exterior, Others
represented 13.8% of visits and 8.6% for primary care; globally, this was the third most
frequent diagnosis. The most frequent specific diagnosis within Others are Poisoning by
other and unspecified drugs and medicinal substances (ICD-9: 977.9), accounting for 29% of
this group’s visits and Insomnia (ICD-9: 780.52), with almost 15%.
The most frequent diagnosis for primary care (26.1%) was Depressive disorders
(ICD-9: 311), being the second most frequent globally (15.2%) and the second most
frequent for hospital transfer visits (16.2%).
Other frequent diagnoses were, for all UMPP visits, decreasingly, Adjustment
reaction (ICD-9: 309), 8.5% of total visits; Other non-organic psychoses (ICD-9: 298), 6.0%;
Disturbance of conduct not elsewhere classified (ICD-9: 312) 5.0%; Suicidal ideation (ICD-9:
V62), 4.6%, Episodic mood disorders (ICD-9: 296) 4.5%; Schizophrenic disorders (ICD-9:
295), 3.7%; and Dementias (ICD-9: 290), 3.2%.
The differences in the distribution of diagnosis between groups were found
statistically significant (p<0.001), as calculated by a Chi-square test.
For CHTS, the most frequent diagnosis was, by far, Neurotic disorders (ICD-9:
300), with 67.5% of all visits in this ED, whereas for overall UMPP, it represented 216%
of visits; 88% of these visits at CHTS had a specific sub-diagnosis of Anxiety states (ICD-
9: 300.0 and subdivisions). Non-dependent drug abuse (ICD-9: 305) was the second most
46
frequent diagnosis for CHTS (8.5%, and 1.0% for UMPP), followed by Alcohol dependence
syndrome (ICD-9: 303), 4.0% of visits (2.7% for UMPP); Special symptoms or syndromes,
not elsewhere classified (ICD-9: 307), 3.1% (0.2% for UMPP); Disturbance of conduct, not
elsewhere classified (ICD-9: 312), 3.0% (5.0% for UMPP); and Dementias (ICD-9: 290),
2.5% (3.2% for UMPP). Others, a relevant group for UMPP (14.1%), only represents 0.2%
of visits in CHTS.
The differences in the distribution of diagnosis between EDs were found
statistically significant (p<0.001), using a Chi-square test.
Graphic IV allows to compare proportion between group of origin for each
diagnosis, adjusted for the total number of visits. For example, when adjusted by total
number of visits of each group, it is more likely that a visit from an individual with
Schizophrenia (ICD-9: 295) enters the ED from the exterior than from primary care.
For Neurotic disorders (ICD-9: 300), it is, on the one hand, more likely that a visit of an
individual enters the ED from the exterior, followed by primary care; on the other hand,
it is very less likely that a visit from an individual with this diagnosis was transferred from
a hospital institution. For Alcohol dependence syndrome, the proportion was similar
between groups.
Except for Alcoholic psychoses (ICD-9: 291) and Other organic psychotic conditions
(chronic) (ICD-9: 294), the ICD-9 group of Psychoses (290-299) is much more common
in UMPP than in CHTS. The relative proportion of diagnoses in these two EDs is globally
very heterogeneous.
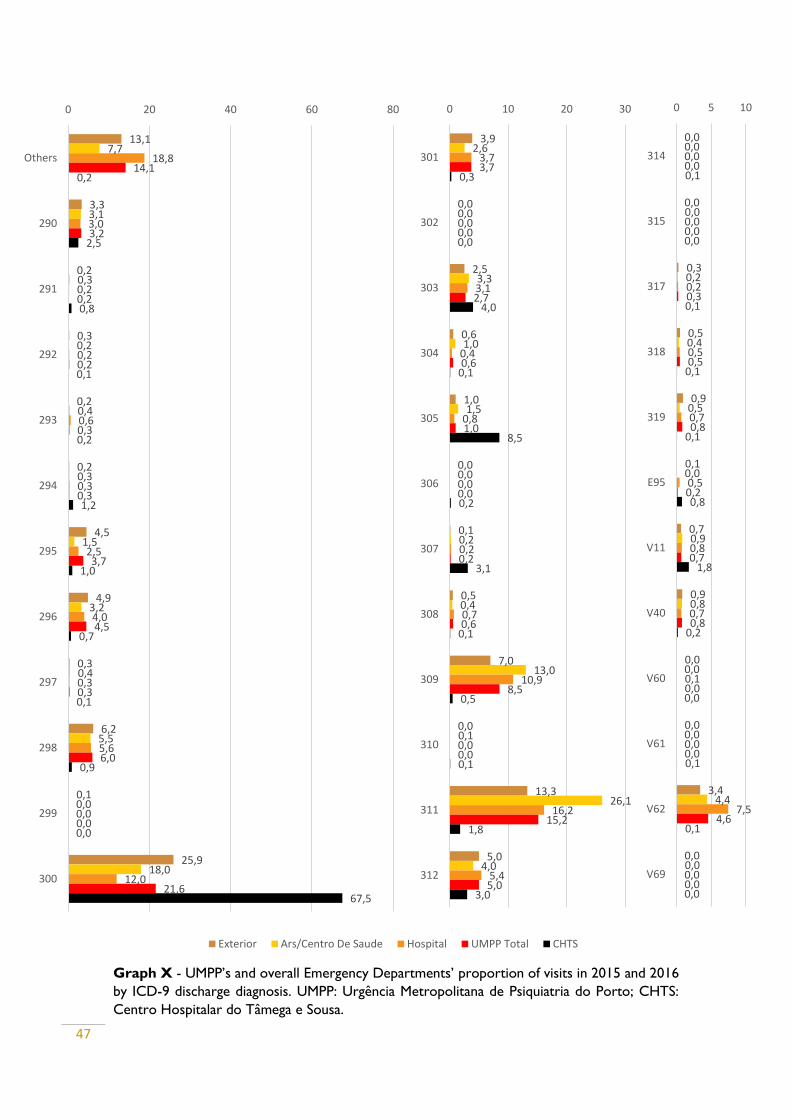
47
Graph X - UMPP’s and overall Emergency Departments’ proportion of visits in 2015 and 2016
by ICD-9 discharge diagnosis. UMPP: Urgência Metropolitana de Psiquiatria do Porto; CHTS:
Centro Hospitalar do Tâmega e Sousa.
13,1
3,3
0,2
0,3
0,2
0,2
4,5
4,9
0,3
6,2
0,1
25,9
7,7
3,1
0,3
0,2
0,4
0,3
1,5
3,2
0,4
5,5
0,0
18,0
18,8
3,0
0,2
0,2
0,6
0,3
2,5
4,0
0,3
5,6
0,0
12,0
14,1
3,2
0,2
0,2
0,3
0,3
3,7
4,5
0,3
6,0
0,0
21,6
0,2
2,5
0,8
0,1
0,2
1,2
1,0
0,7
0,1
0,9
0,0
67,5
0 20 40 60 80
Others
290
291
292
293
294
295
296
297
298
299
300
Exterior Ars/Centro De Saude Hospital UMPP Total CHTS
3,9
0,0
2,5
0,6
1,0
0,0
0,1
0,5
7,0
0,0
13,3
5,0
2,6
0,0
3,3
1,0
1,5
0,0
0,2
0,4
13,0
0,1
26,1
4,0
3,7
0,0
3,1
0,4
0,8
0,0
0,2
0,7
10,9
0,0
16,2
5,4
3,7
0,0
2,7
0,6
1,0
0,0
0,2
0,6
8,5
0,0
15,2
5,0
0,3
0,0
4,0
0,1
8,5
0,2
3,1
0,1
0,5
0,1
1,8
3,0
0 10 20 30
301
302
303
304
305
306
307
308
309
310
311
312
0,0
0,0
0,3
0,5
0,9
0,1
0,7
0,9
0,0
0,0
3,4
0,0
0,0
0,0
0,2
0,4
0,5
0,0
0,9
0,8
0,0
0,0
4,4
0,0
0,0
0,0
0,2
0,5
0,7
0,5
0,8
0,7
0,1
0,0
7,5
0,0
0,0
0,0
0,3
0,5
0,8
0,2
0,7
0,8
0,0
0,0
4,6
0,0
0,1
0,0
0,1
0,1
0,1
0,8
1,8
0,2
0,0
0,1
0,1
0,0
0 5 10
314
315
317
318
319
E95
V11
V40
V60
V61
V62
V69
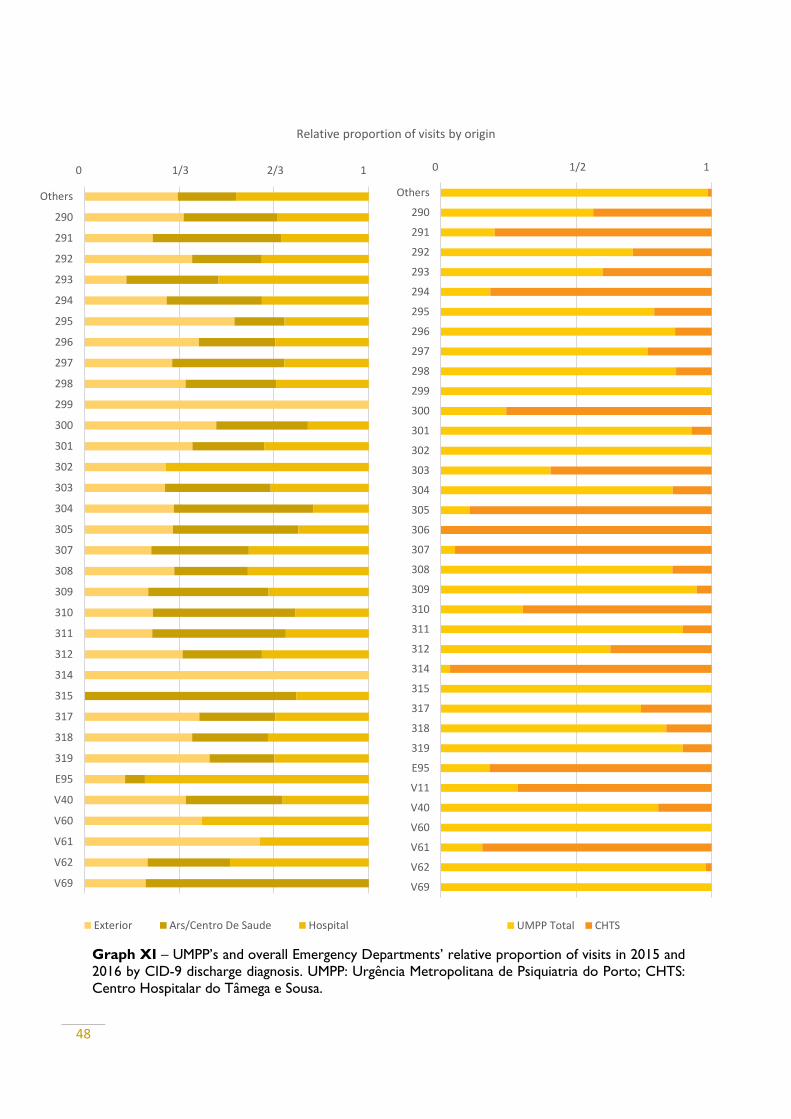
48
Graph XI displays the relative proportion of episodes in each discharge diagnosis,
by origin (for UMPP) and ED’s totals0 1/3 2/3 1
Others
290
291
292
293
294
295
296
297
298
299
300
301
302
303
304
305
307
308
309
310
311
312
314
315
317
318
319
E95
V40
V60
V61
V62
V69
Relative proportion of visits by origin
Exterior Ars/Centro De Saude Hospital
Graph XI – UMPP’s and overall Emergency Departments’ relative proportion of visits in 2015 and
2016 by CID-9 discharge diagnosis. UMPP: Urgência Metropolitana de Psiquiatria do Porto; CHTS:
Centro Hospitalar do Tâmega e Sousa.
0 1/2 1
Others
290
291
292
293
294
295
296
297
298
299
300
301
302
303
304
305
306
307
308
309
310
311
312
314
315
317
318
319
E95
V11
V40
V60
V61
V62
V69
UMPP Total CHTS
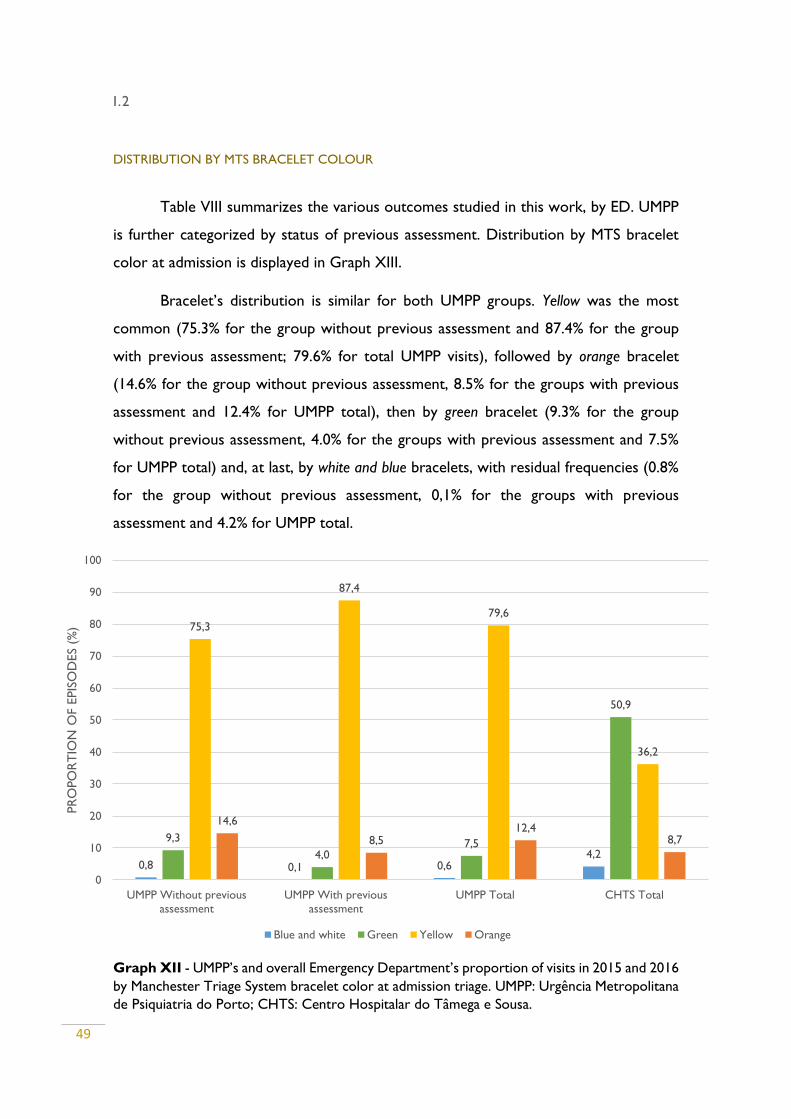
49
I.2
DISTRIBUTION BY MTS BRACELET COLOUR
Table VIII summarizes the various outcomes studied in this work, by ED. UMPP
is further categorized by status of previous assessment. Distribution by MTS bracelet
color at admission is displayed in Graph XIII.
Bracelet’s distribution is similar for both UMPP groups. Yellow was the most
common (75.3% for the group without previous assessment and 87.4% for the group
with previous assessment; 79.6% for total UMPP visits), followed by orange bracelet
(14.6% for the group without previous assessment, 8.5% for the groups with previous
assessment and 12.4% for UMPP total), then by green bracelet (9.3% for the group
without previous assessment, 4.0% for the groups with previous assessment and 7.5%
for UMPP total) and, at last, by white and blue bracelets, with residual frequencies (0.8%
for the group without previous assessment, 0,1% for the groups with previous
assessment and 4.2% for UMPP total.
Graph XII - UMPP’s and overall Emergency Department’s proportion of visits in 2015 and 2016
by Manchester Triage System bracelet color at admission triage. UMPP: Urgência Metropolitana
de Psiquiatria do Porto; CHTS: Centro Hospitalar do Tâmega e Sousa.
0,8 0,1 0,64,2
9,3
4,07,5
50,9
75,3
87,4
79,6
36,2
14,6
8,512,4
8,7
0
10
20
30
40
50
60
70
80
90
100
UMPP Without previous
assessment
UMPP With previous
assessment
UMPP Total CHTS Total
PR
OPO
RT
ION
OF E
PIS
OD
ES
(%)
Blue and white Green Yellow Orange
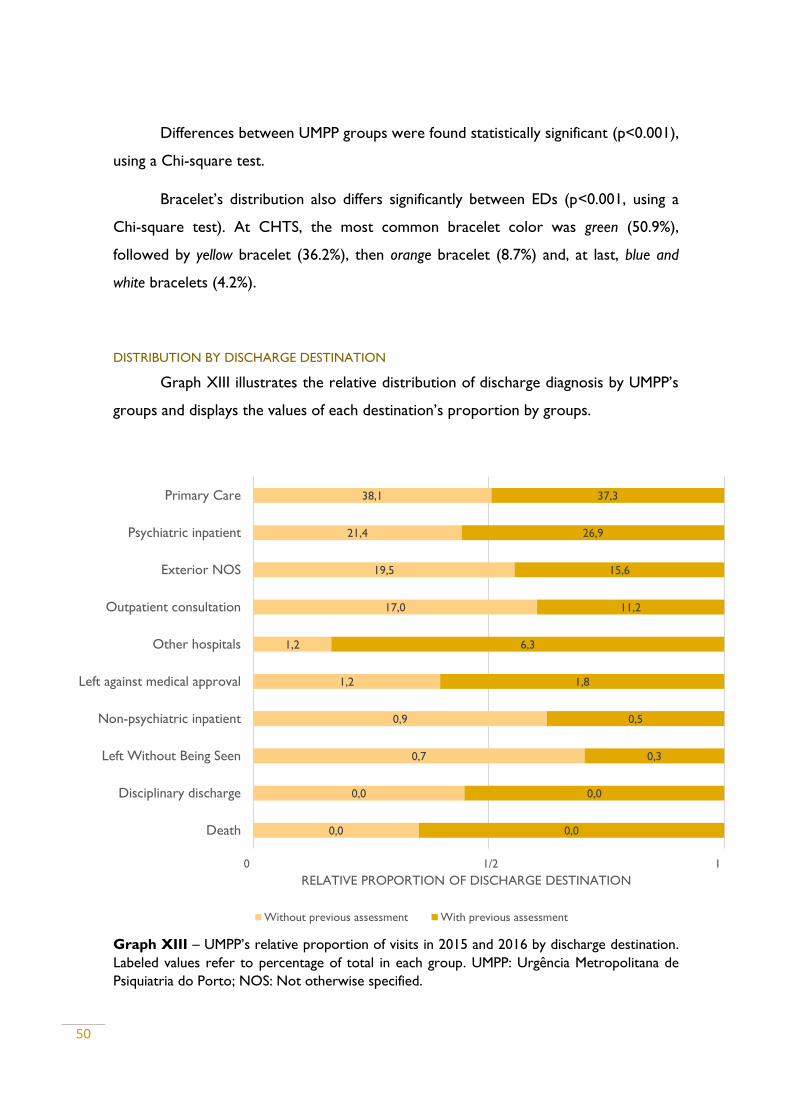
50
Differences between UMPP groups were found statistically significant (p<0.001),
using a Chi-square test.
Bracelet’s distribution also differs significantly between EDs (p<0.001, using a
Chi-square test). At CHTS, the most common bracelet color was green (50.9%),
followed by yellow bracelet (36.2%), then orange bracelet (8.7%) and, at last, blue and
white bracelets (4.2%).
DISTRIBUTION BY DISCHARGE DESTINATION
Graph XIII illustrates the relative distribution of discharge diagnosis by UMPP’s
groups and displays the values of each destination’s proportion by groups.
Graph XIII – UMPP’s relative proportion of visits in 2015 and 2016 by discharge destination.
Labeled values refer to percentage of total in each group. UMPP: Urgência Metropolitana de
Psiquiatria do Porto; NOS: Not otherwise specified.
0,0
0,0
0,7
0,9
1,2
1,2
17,0
19,5
21,4
38,1
0,0
0,0
0,3
0,5
1,8
6,3
11,2
15,6
26,9
37,3
0 1/2 1
Death
Disciplinary discharge
Left Without Being Seen
Non-psychiatric inpatient
Left against medical approval
Other hospitals
Outpatient consultation
Exterior NOS
Psychiatric inpatient
Primary Care
RELATIVE PROPORTION OF DISCHARGE DESTINATION
Without previous assessment With previous assessment
51
Both groups’ distribution follows similar patterns. Primary care was the most
common destination at discharge (38.1% for the group without previous assessment and
37.3% for the group with previous assessment), followed by psychiatric inpatient (21.4%
vs 26.9%), exterior NOS (19.5% vs 15.6%), outpatient consultation (17.0% vs 11.2%),
transference to other hospitals (1.2% vs 6.3%), left against medical advice (1.2% vs 1.8%), non-
psychiatric inpatient (0.9% vs 0.5%) and LWBS (0.7% vs 0.3%). Disciplinary discharge and
death are residual discharge outcomes, both with values close to 0.0% in both groups.
This difference was found statistically significant (p<0.001), using Chi-square test.
Analyzing the relative proportion of discharge destination between both groups,
we can observe that the biggest difference lies in transference to other hospital, with a
much higher relative frequency in the group with previous assessment (6.3% vs 1.2%).
Psychiatric inpatient was relatively more frequent in the group with previous
assessment (26.9% vs 21.4%) and this difference was also statistically significant
(p<0.001), using a Chi-square test
Left without being seen was also relatively more frequent in the group without
previous assessment (0.7% vs 0.3%, p<0.001), as well as non-psychiatric inpatient (0.9% vs
0.5%, p=0.001). Left without medical approval as more relatively more frequent in the
group with previous assessment (1.8% vs 1.2%, p<0.001).
Grouping all the other possible discharge destinations than psychiatric
hospitalization, non-psychiatric hospitalization, LWBS and left against medical approval, into a
category generically called exterior, has a distribution also statistically significant between
groups (75.8% for the group without previous assessment vs 70.4, p=0.001), as can be
seen in Table VII.
Graph XIV displays the relative proportion of the main discharge destinations
(for the purpose of this work) between UMPP and CHTS and the values of destination’s
frequency in each ED.
There were only psychiatric hospitalizations in UMPP (23.3% vs 0.0%, p<0.001).
Differences between ED were statistically significant (p<0.001) in LWBS (0.6% in
UMPP vs 1.3% for CHTS), left against medical approval (1.4% in UMPP vs 0.3% for CHTS)
and exterior (73.9% in UMPP vs 97.8% for CHTS).
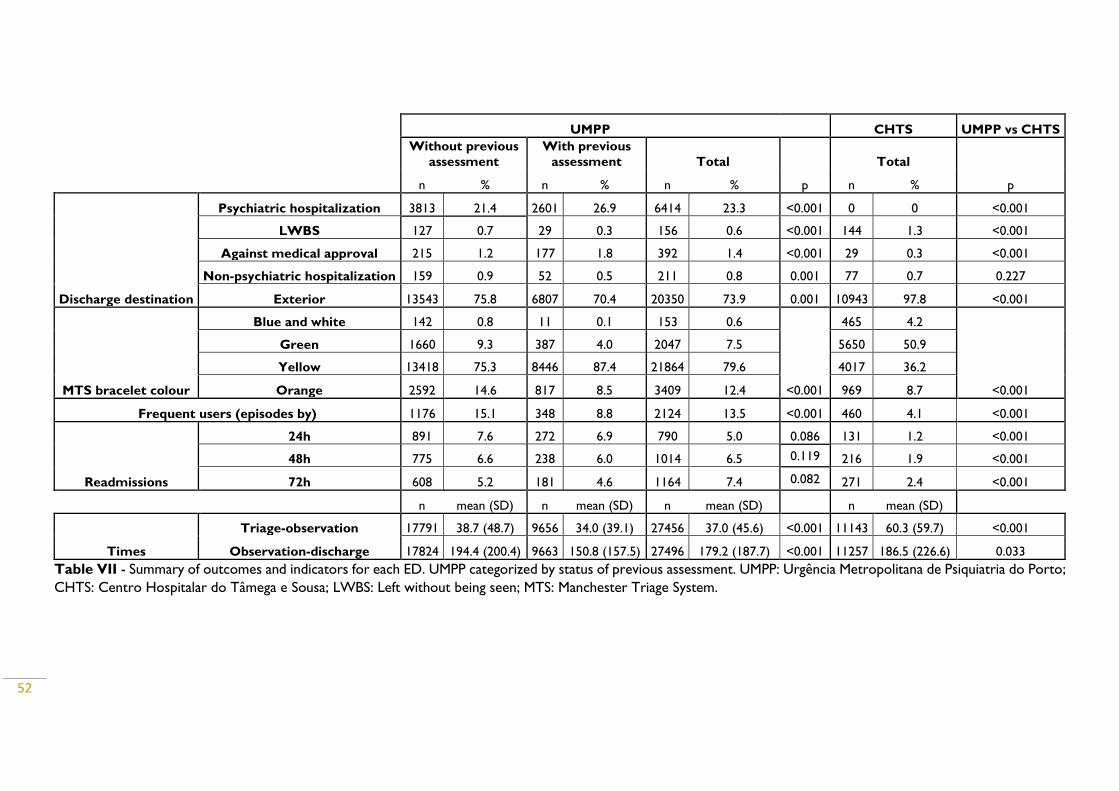
52
Table VII - Summary of outcomes and indicators for each ED. UMPP categorized by status of previous assessment. UMPP: Urgência Metropolitana de Psiquiatria do Porto;
CHTS: Centro Hospitalar do Tâmega e Sousa; LWBS: Left without being seen; MTS: Manchester Triage System.
UMPP CHTS UMPP vs CHTS
Without previous
assessment
With previous
assessment Total
p
Total
p n % n % n % n %
Discharge destination
Psychiatric hospitalization 3813 21.4 2601 26.9 6414 23.3 <0.001 0 0 <0.001
LWBS 127 0.7 29 0.3 156 0.6 <0.001 144 1.3 <0.001
Against medical approval 215 1.2 177 1.8 392 1.4 <0.001 29 0.3 <0.001
Non-psychiatric hospitalization 159 0.9 52 0.5 211 0.8 0.001 77 0.7 0.227
Exterior 13543 75.8 6807 70.4 20350 73.9 0.001 10943 97.8 <0.001
MTS bracelet colour
Blue and white 142 0.8 11 0.1 153 0.6
<0.001
465 4.2
<0.001
Green 1660 9.3 387 4.0 2047 7.5 5650 50.9
Yellow 13418 75.3 8446 87.4 21864 79.6 4017 36.2
Orange 2592 14.6 817 8.5 3409 12.4 969 8.7
Frequent users (episodes by) 1176 15.1 348 8.8 2124 13.5 <0.001 460 4.1 <0.001
Readmissions
24h 891 7.6 272 6.9 790 5.0 0.086 131 1.2 <0.001
48h 775 6.6 238 6.0 1014 6.5 0.119 216 1.9 <0.001
72h 608 5.2 181 4.6 1164 7.4 0.082 271 2.4 <0.001
n mean (SD) n mean (SD) n mean (SD) n mean (SD)
Times
Triage-observation 17791 38.7 (48.7) 9656 34.0 (39.1) 27456 37.0 (45.6) <0.001 11143 60.3 (59.7) <0.001
Observation-discharge 17824 194.4 (200.4) 9663 150.8 (157.5) 27496 179.2 (187.7) <0.001 11257 186.5 (226.6) 0.033
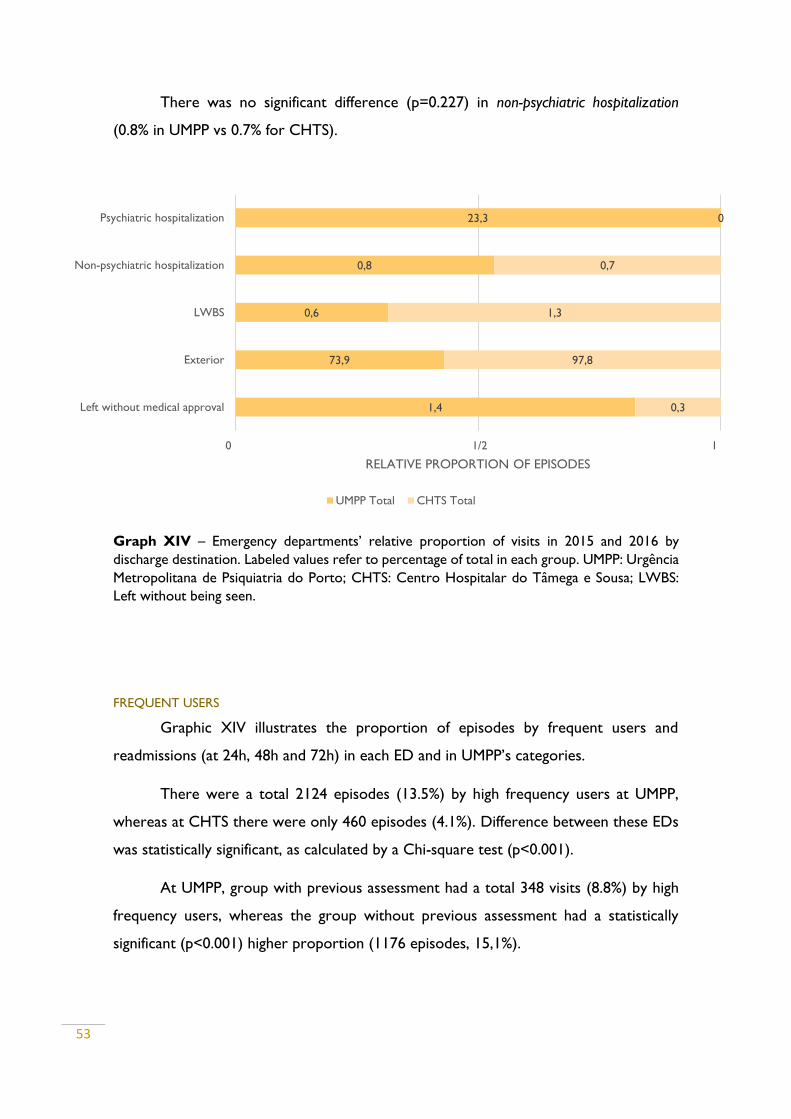
53
There was no significant difference (p=0.227) in non-psychiatric hospitalization
(0.8% in UMPP vs 0.7% for CHTS).
Graph XIV – Emergency departments’ relative proportion of visits in 2015 and 2016 by
discharge destination. Labeled values refer to percentage of total in each group. UMPP: Urgência
Metropolitana de Psiquiatria do Porto; CHTS: Centro Hospitalar do Tâmega e Sousa; LWBS:
Left without being seen.
FREQUENT USERS
Graphic XIV illustrates the proportion of episodes by frequent users and
readmissions (at 24h, 48h and 72h) in each ED and in UMPP’s categories.
There were a total 2124 episodes (13.5%) by high frequency users at UMPP,
whereas at CHTS there were only 460 episodes (4.1%). Difference between these EDs
was statistically significant, as calculated by a Chi-square test (p<0.001).
At UMPP, group with previous assessment had a total 348 visits (8.8%) by high
frequency users, whereas the group without previous assessment had a statistically
significant (p<0.001) higher proportion (1176 episodes, 15,1%).
1,4
73,9
0,6
0,8
23,3
0,3
97,8
1,3
0,7
0
0 1/2 1
Left without medical approval
Exterior
LWBS
Non-psychiatric hospitalization
Psychiatric hospitalization
RELATIVE PROPORTION OF EPISODES
UMPP Total CHTS Total
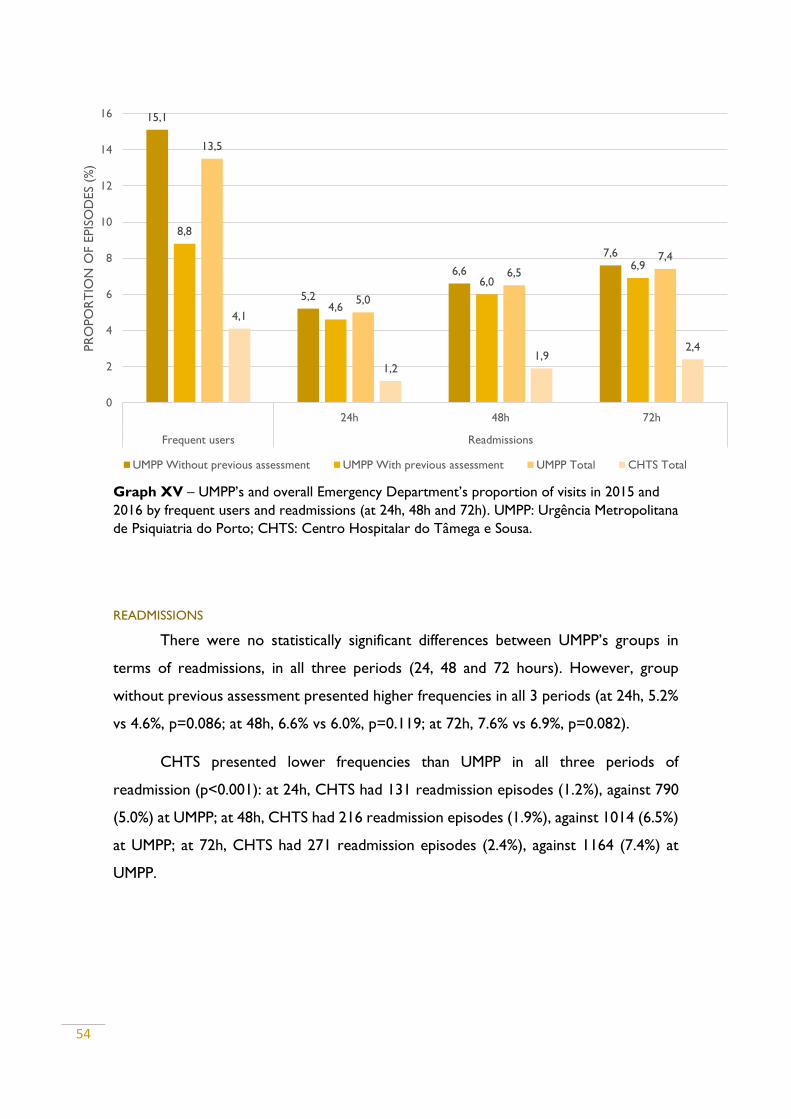
54
Graph XV – UMPP’s and overall Emergency Department’s proportion of visits in 2015 and
2016 by frequent users and readmissions (at 24h, 48h and 72h). UMPP: Urgência Metropolitana
de Psiquiatria do Porto; CHTS: Centro Hospitalar do Tâmega e Sousa.
READMISSIONS
There were no statistically significant differences between UMPP’s groups in
terms of readmissions, in all three periods (24, 48 and 72 hours). However, group
without previous assessment presented higher frequencies in all 3 periods (at 24h, 5.2%
vs 4.6%, p=0.086; at 48h, 6.6% vs 6.0%, p=0.119; at 72h, 7.6% vs 6.9%, p=0.082).
CHTS presented lower frequencies than UMPP in all three periods of
readmission (p<0.001): at 24h, CHTS had 131 readmission episodes (1.2%), against 790
(5.0%) at UMPP; at 48h, CHTS had 216 readmission episodes (1.9%), against 1014 (6.5%)
at UMPP; at 72h, CHTS had 271 readmission episodes (2.4%), against 1164 (7.4%) at
UMPP.
15,1
5,2
6,6
7,6
8,8
4,6
6,0
6,9
13,5
5,0
6,5
7,4
4,1
1,21,9
2,4
0
2
4
6
8
10
12
14
16
24h 48h 72h
Frequent users Readmissions
PR
OPO
RT
ION
OF E
PIS
OD
ES
(%)
UMPP Without previous assessment UMPP With previous assessment UMPP Total CHTS Total
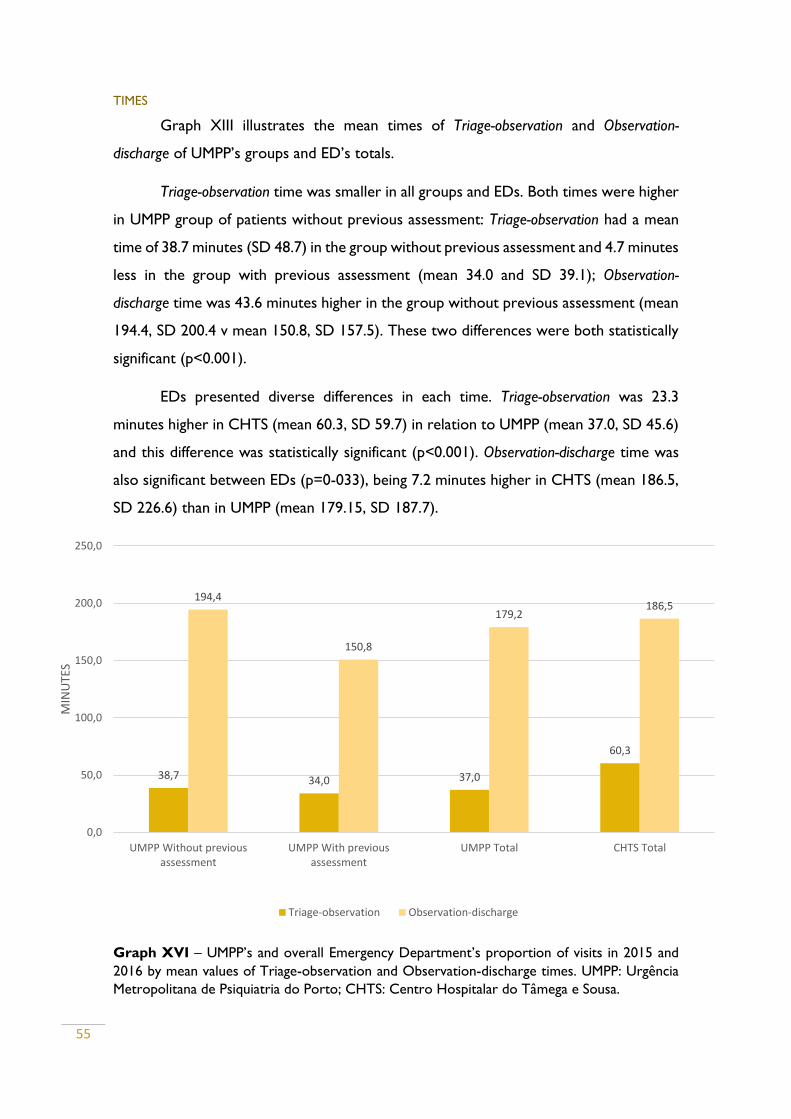
55
TIMES
Graph XIII illustrates the mean times of Triage-observation and Observation-
discharge of UMPP’s groups and ED’s totals.
Triage-observation time was smaller in all groups and EDs. Both times were higher
in UMPP group of patients without previous assessment: Triage-observation had a mean
time of 38.7 minutes (SD 48.7) in the group without previous assessment and 4.7 minutes
less in the group with previous assessment (mean 34.0 and SD 39.1); Observation-
discharge time was 43.6 minutes higher in the group without previous assessment (mean
194.4, SD 200.4 v mean 150.8, SD 157.5). These two differences were both statistically
significant (p<0.001).
EDs presented diverse differences in each time. Triage-observation was 23.3
minutes higher in CHTS (mean 60.3, SD 59.7) in relation to UMPP (mean 37.0, SD 45.6)
and this difference was statistically significant (p<0.001). Observation-discharge time was
also significant between EDs (p=0-033), being 7.2 minutes higher in CHTS (mean 186.5,
SD 226.6) than in UMPP (mean 179.15, SD 187.7).
Graph XVI – UMPP’s and overall Emergency Department’s proportion of visits in 2015 and
2016 by mean values of Triage-observation and Observation-discharge times. UMPP: Urgência
Metropolitana de Psiquiatria do Porto; CHTS: Centro Hospitalar do Tâmega e Sousa.
38,7 34,0 37,0
60,3
194,4
150,8
179,2186,5
0,0
50,0
100,0
150,0
200,0
250,0
UMPP Without previousassessment
UMPP With previousassessment
UMPP Total CHTS Total
MIN
UTE
S
Triage-observation Observation-discharge
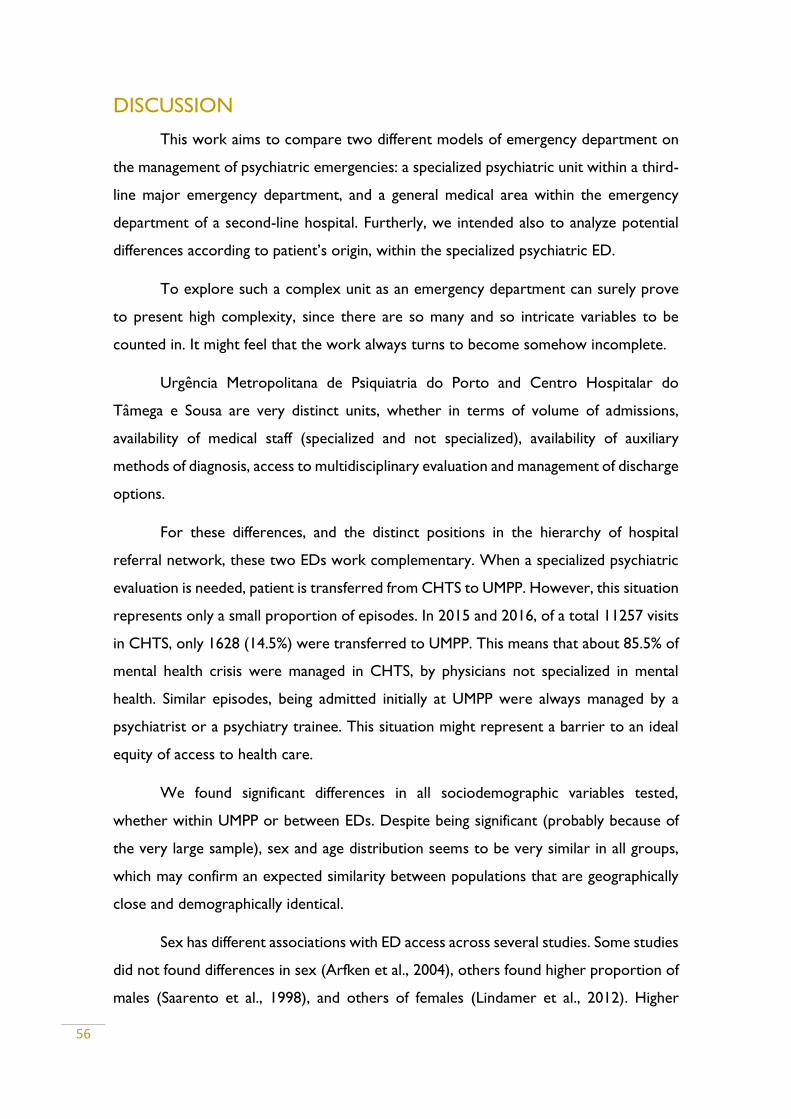
56
DISCUSSION
This work aims to compare two different models of emergency department on
the management of psychiatric emergencies: a specialized psychiatric unit within a third-
line major emergency department, and a general medical area within the emergency
department of a second-line hospital. Furtherly, we intended also to analyze potential
differences according to patient’s origin, within the specialized psychiatric ED.
To explore such a complex unit as an emergency department can surely prove
to present high complexity, since there are so many and so intricate variables to be
counted in. It might feel that the work always turns to become somehow incomplete.
Urgência Metropolitana de Psiquiatria do Porto and Centro Hospitalar do
Tâmega e Sousa are very distinct units, whether in terms of volume of admissions,
availability of medical staff (specialized and not specialized), availability of auxiliary
methods of diagnosis, access to multidisciplinary evaluation and management of discharge
options.
For these differences, and the distinct positions in the hierarchy of hospital
referral network, these two EDs work complementary. When a specialized psychiatric
evaluation is needed, patient is transferred from CHTS to UMPP. However, this situation
represents only a small proportion of episodes. In 2015 and 2016, of a total 11257 visits
in CHTS, only 1628 (14.5%) were transferred to UMPP. This means that about 85.5% of
mental health crisis were managed in CHTS, by physicians not specialized in mental
health. Similar episodes, being admitted initially at UMPP were always managed by a
psychiatrist or a psychiatry trainee. This situation might represent a barrier to an ideal
equity of access to health care.
We found significant differences in all sociodemographic variables tested,
whether within UMPP or between EDs. Despite being significant (probably because of
the very large sample), sex and age distribution seems to be very similar in all groups,
which may confirm an expected similarity between populations that are geographically
close and demographically identical.
Sex has different associations with ED access across several studies. Some studies
did not found differences in sex (Arfken et al., 2004), others found higher proportion of
males (Saarento et al., 1998), and others of females (Lindamer et al., 2012). Higher
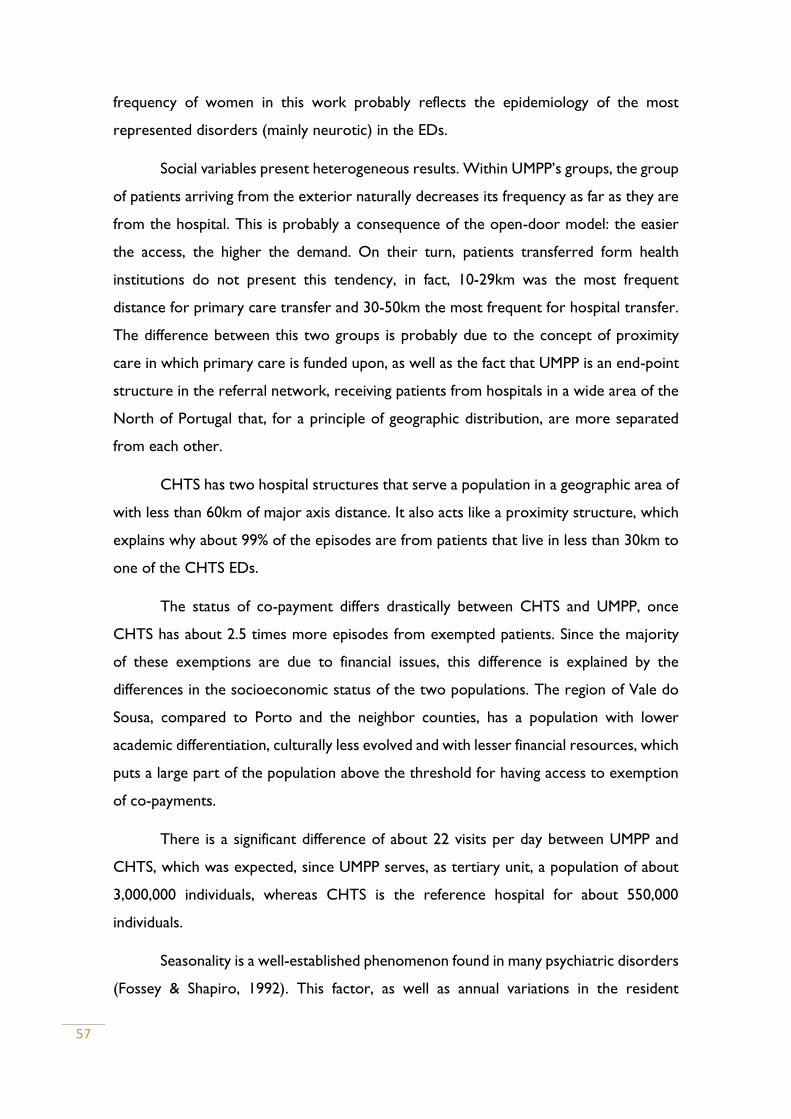
57
frequency of women in this work probably reflects the epidemiology of the most
represented disorders (mainly neurotic) in the EDs.
Social variables present heterogeneous results. Within UMPP’s groups, the group
of patients arriving from the exterior naturally decreases its frequency as far as they are
from the hospital. This is probably a consequence of the open-door model: the easier
the access, the higher the demand. On their turn, patients transferred form health
institutions do not present this tendency, in fact, 10-29km was the most frequent
distance for primary care transfer and 30-50km the most frequent for hospital transfer.
The difference between this two groups is probably due to the concept of proximity
care in which primary care is funded upon, as well as the fact that UMPP is an end-point
structure in the referral network, receiving patients from hospitals in a wide area of the
North of Portugal that, for a principle of geographic distribution, are more separated
from each other.
CHTS has two hospital structures that serve a population in a geographic area of
with less than 60km of major axis distance. It also acts like a proximity structure, which
explains why about 99% of the episodes are from patients that live in less than 30km to
one of the CHTS EDs.
The status of co-payment differs drastically between CHTS and UMPP, once
CHTS has about 2.5 times more episodes from exempted patients. Since the majority
of these exemptions are due to financial issues, this difference is explained by the
differences in the socioeconomic status of the two populations. The region of Vale do
Sousa, compared to Porto and the neighbor counties, has a population with lower
academic differentiation, culturally less evolved and with lesser financial resources, which
puts a large part of the population above the threshold for having access to exemption
of co-payments.
There is a significant difference of about 22 visits per day between UMPP and
CHTS, which was expected, since UMPP serves, as tertiary unit, a population of about
3,000,000 individuals, whereas CHTS is the reference hospital for about 550,000
individuals.
Seasonality is a well-established phenomenon found in many psychiatric disorders
(Fossey & Shapiro, 1992). This factor, as well as annual variations in the resident
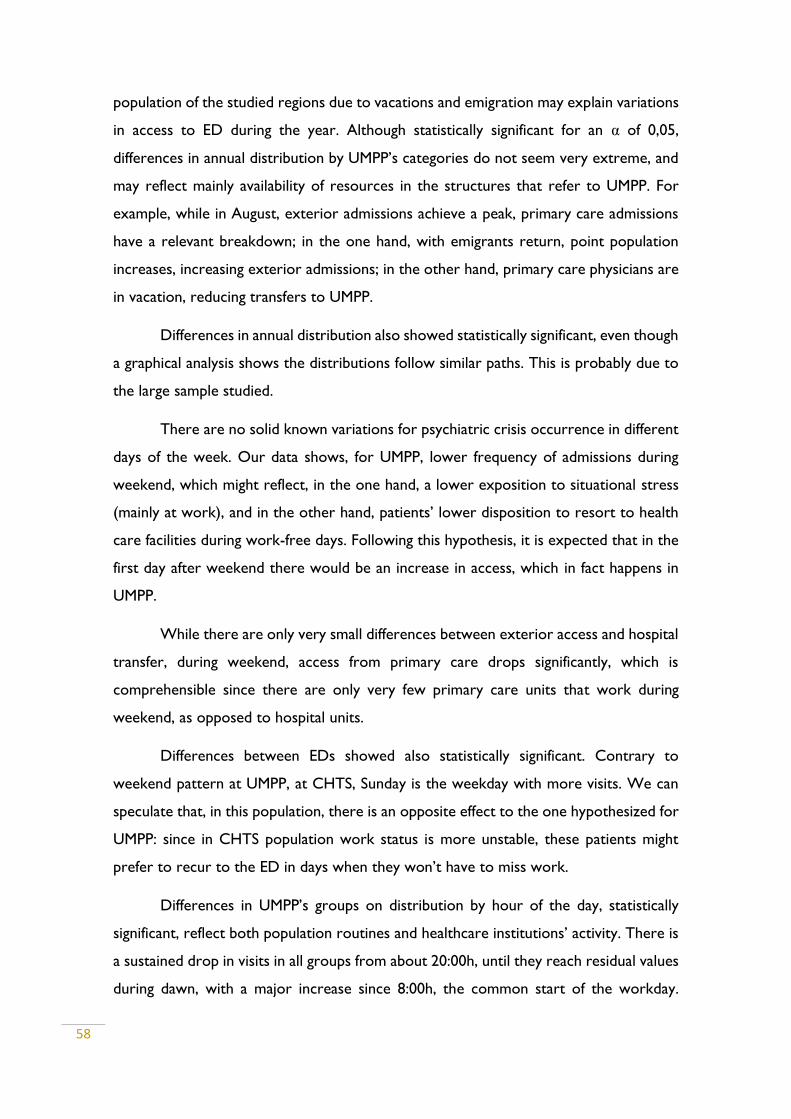
58
population of the studied regions due to vacations and emigration may explain variations
in access to ED during the year. Although statistically significant for an α of 0,05,
differences in annual distribution by UMPP’s categories do not seem very extreme, and
may reflect mainly availability of resources in the structures that refer to UMPP. For
example, while in August, exterior admissions achieve a peak, primary care admissions
have a relevant breakdown; in the one hand, with emigrants return, point population
increases, increasing exterior admissions; in the other hand, primary care physicians are
in vacation, reducing transfers to UMPP.
Differences in annual distribution also showed statistically significant, even though
a graphical analysis shows the distributions follow similar paths. This is probably due to
the large sample studied.
There are no solid known variations for psychiatric crisis occurrence in different
days of the week. Our data shows, for UMPP, lower frequency of admissions during
weekend, which might reflect, in the one hand, a lower exposition to situational stress
(mainly at work), and in the other hand, patients’ lower disposition to resort to health
care facilities during work-free days. Following this hypothesis, it is expected that in the
first day after weekend there would be an increase in access, which in fact happens in
UMPP.
While there are only very small differences between exterior access and hospital
transfer, during weekend, access from primary care drops significantly, which is
comprehensible since there are only very few primary care units that work during
weekend, as opposed to hospital units.
Differences between EDs showed also statistically significant. Contrary to
weekend pattern at UMPP, at CHTS, Sunday is the weekday with more visits. We can
speculate that, in this population, there is an opposite effect to the one hypothesized for
UMPP: since in CHTS population work status is more unstable, these patients might
prefer to recur to the ED in days when they won’t have to miss work.
Differences in UMPP’s groups on distribution by hour of the day, statistically
significant, reflect both population routines and healthcare institutions’ activity. There is
a sustained drop in visits in all groups from about 20:00h, until they reach residual values
during dawn, with a major increase since 8:00h, the common start of the workday.
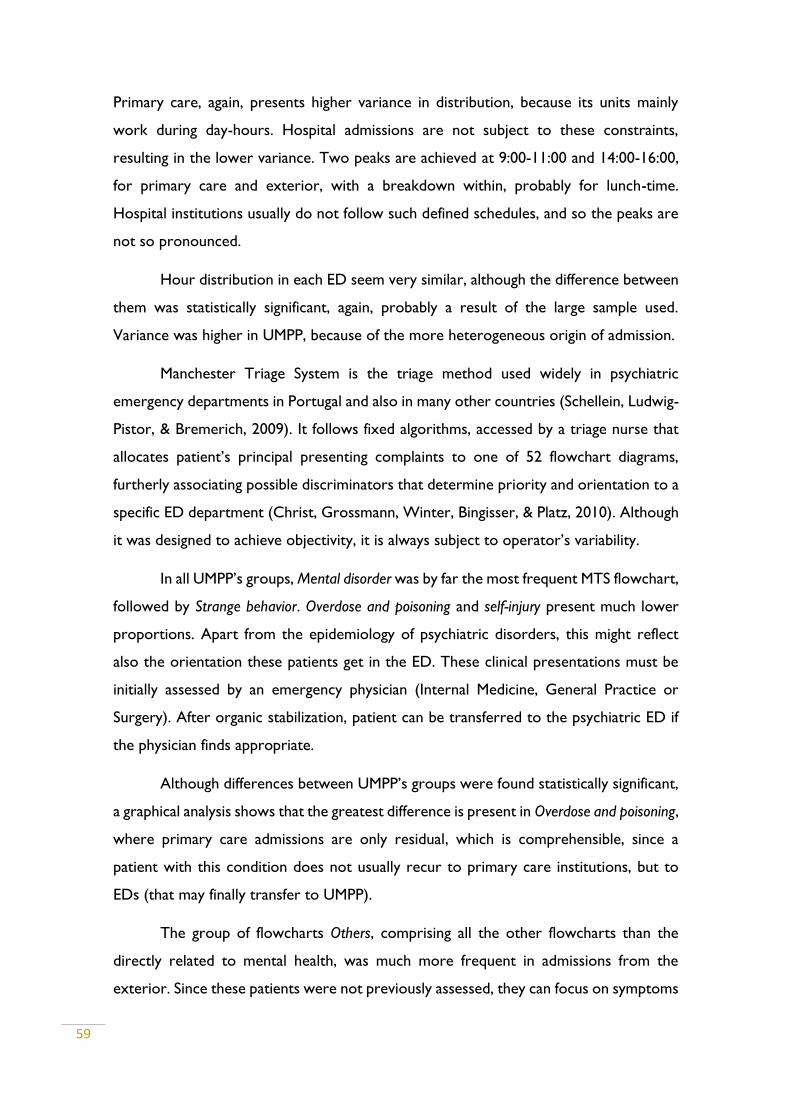
59
Primary care, again, presents higher variance in distribution, because its units mainly
work during day-hours. Hospital admissions are not subject to these constraints,
resulting in the lower variance. Two peaks are achieved at 9:00-11:00 and 14:00-16:00,
for primary care and exterior, with a breakdown within, probably for lunch-time.
Hospital institutions usually do not follow such defined schedules, and so the peaks are
not so pronounced.
Hour distribution in each ED seem very similar, although the difference between
them was statistically significant, again, probably a result of the large sample used.
Variance was higher in UMPP, because of the more heterogeneous origin of admission.
Manchester Triage System is the triage method used widely in psychiatric
emergency departments in Portugal and also in many other countries (Schellein, Ludwig-
Pistor, & Bremerich, 2009). It follows fixed algorithms, accessed by a triage nurse that
allocates patient’s principal presenting complaints to one of 52 flowchart diagrams,
furtherly associating possible discriminators that determine priority and orientation to a
specific ED department (Christ, Grossmann, Winter, Bingisser, & Platz, 2010). Although
it was designed to achieve objectivity, it is always subject to operator’s variability.
In all UMPP’s groups, Mental disorder was by far the most frequent MTS flowchart,
followed by Strange behavior. Overdose and poisoning and self-injury present much lower
proportions. Apart from the epidemiology of psychiatric disorders, this might reflect
also the orientation these patients get in the ED. These clinical presentations must be
initially assessed by an emergency physician (Internal Medicine, General Practice or
Surgery). After organic stabilization, patient can be transferred to the psychiatric ED if
the physician finds appropriate.
Although differences between UMPP’s groups were found statistically significant,
a graphical analysis shows that the greatest difference is present in Overdose and poisoning,
where primary care admissions are only residual, which is comprehensible, since a
patient with this condition does not usually recur to primary care institutions, but to
EDs (that may finally transfer to UMPP).
The group of flowcharts Others, comprising all the other flowcharts than the
directly related to mental health, was much more frequent in admissions from the
exterior. Since these patients were not previously assessed, they can focus on symptoms
60
that initially may be related to other domains and be directed to other areas in the ED.
After the first assessment, finding psychiatric symptoms, the physician might transfer the
patient to psychiatric ED.
Distribution between EDs follows very different patterns, the difference being
statistically significant. At CHTS, the clear majority of patients has a flowchart at
admission not related to mental health, which means that they got a psychiatric diagnosis
at discharge. This big difference can be explained partly by different operators executing
the triage process, higher proportion of patients admitted from the exterior at CHTS,
patient’s characteristics and as a result of the operationalization of the inclusion criteria
used to define psychiatric emergency in CHTS (different than UMPP’s). Also, the fact
that there is no psychiatric ED in this emergency department, might induce the triage
nurse to disregard for the mental health related flowcharts.
The same hypothesis may explain differences between EDs in terms of MTS
discriminator, where the category Others is even more frequent at CHTS.
Origin groups at UMPP also showed significant differences in MTS Discriminator.
Significant psychiatric history is the most frequent discriminator in all groups, with similar
frequencies. Group Others also appears with more frequency in episodes from the
exterior, probably for the same reasons stated before for MTS flowchart, but here more
frequently than before. Risk of self-injury is the second most frequent discriminator in
episodes from hospital transference, representing patients that are previously accessed
for attempted or self-injury thoughts and transferred for UMPP for psychiatric
assessment; the same happens, less frequently, in primary care. Risk of aggression doesn’t
seem to vary substantially between groups. Disruptive behavior is less frequent in episodes
arriving from the exterior, representing probably individuals only from CHSJ area of
referral or neighbor counties, since these patients usually require rapid contention. Deep
anguish is more frequent in primary care and exterior, probably reflecting less exuberant
episodes that do not require immediate contention.
Neurotic states were the most common diagnosis in both EDs, but its frequency
was more than 3 times higher at CHTS. More specifically, Anxiety states represented
more than 85% of these episodes. Although a mental health crisis, an Anxiety state
usually does not represent a psychiatric emergency needing assessment by psychiatrist
in an acute phase. Stabilization of the acute crisis can be achieved by any general physician

61
in a primary care setting or even in ED. This justifies why its frequency was lower in
individuals arriving at UMPP from primary care and hospital transfer than in those from
the exterior.
Others was the most common diagnosis in episodes transferred from hospital and
the third most frequent in all UMPP (14.1%). Less than half of its specific sub-diagnosis
at UMPP were Poisoning by other and unspecified drugs and medicinal substances and
Insomnia, the first being related to psychiatry usually as a means of self-injury, a clinical
situation usually requiring psychiatric assessment. The other half was probably ‘false’
psychiatric emergencies, this is, episodes referred to psychiatric ED that were not real
psychiatric emergencies.
The difference from CHTS in the frequency of the group Others, with only a
residual value, is a consequence of the inclusion criteria operationalization used to define
psychiatric emergency at CHTS.
Depressive disorders was the most frequent diagnosis for primary care admissions,
which might mean that depressed patients primarily resort to primary care for this
condition, being transferred finally to psychiatric emergency, usually by risk of self-injury,
which was the second most frequent MTS flowchart in admissions from primary care.
Psychoses, a paradigmatic group of psychiatric disorders, only account for a
minority of episodes. This might reflect, in the one hand, the higher prevalence in the
population of Mood disorders, Anxiety disorders and Adjustment reactions, against
Psychotic disorders; in the other hand, it might reflect as well, a lower predisposition to
resort to medical by psychotic patients, who usually lack insight for their condition.
After Neurotic disorders, the most frequent diagnosis at CHTS were substance
use-related disorders (alcohol and other drugs), with much higher frequencies than
UMPP. This is very likely to be a consequence of the epidemiology of these disorders in
this population.
Globally, differences in diagnosis between EDs might reflect differences in
population’s epidemiology, differences in medical staff ability to define a psychiatric
diagnosis (although never very accurate in a ED setting, attribution of a psychiatric
diagnosis should be more accurate in the psychiatric ED) and differences in the model
of the ED (the psychiatric having more variability of diagnosis).
62
Manchester Triage System’s validity in psychiatric emergencies has long been
disputed. However, as in other medical areas, its color scale should represent gravity of
an episode (Azeredo, Guedes, Rebelo de Almeida, Chianca, & Martins, 2015).
MTS bracelet distribution by status of previous assessment at UMPP, significantly
different, reveals lower frequency of less severe categories (blue and white and green) in
the group with previous assessment. This was expected, since situations without gravity
are not supposed to be transferred to an emergency department, especially after an
assessment was made by a medical doctor.
Orange bracelets, the highest gravity group evaluated (red bracelets were
excluded since, by definition, represent medical emergencies), have higher frequencies
in the group without previous assessment. These clinical situations require rapid
response; in psychiatry emergencies, usually represent agitation states, needing fast
stabilization. Patients arriving after previous assessment are usually already stabilized in
terms of agitation or imminent risk of self-harm or aggression, so they fit no more in an
orange bracelet.
Bracelet’s distribution in CHTS is very different from UMPP. Lower severity
categories (blue and white and green) have much higher frequencies. Green was the most
frequent bracelet (whereas in UMPP it was yellow). Yellow and orange bracelets had lower
frequencies than at UMPP.
These differences, statistically significant, might represent a globally lower
severity of episodes at CHTS. As a specialized psychiatric ED, UMPP receives transferred
patients in need of urgent psychiatric care, and these patients, by definition, should get
higher severity bracelets; CHTS receives mainly patients from the exterior. Once again,
differences between EDs may also be affected by different triage nurse operators.
All UMPP’s discharge destinations (categorized in five groups) by status of
previous assessment had statistically significant differences.
Psychiatric hospitalization was 26% higher in the group with previous assessment,
probably reflecting the hypothesis that transferred patients present more severe
situations. Some of them are only transferred to UMPP to proceed to hospitalization. In
the referral regions of the hospitals included in the UMPP, psychiatric hospitalizations
63
are, in their majority, proceeded via UMPP, since there are only few exceptions to
proceed to inpatient directly in the inpatient facilities.
Hospitalization in CHTS psychiatric inpatient unit is, besides few exceptions, only
made via UMPP. This explains why there are no discharges to psychiatric hospitalization
in CHTS ED: these patients must get to UMPP to proceed to it.
Non-psychiatric hospitalization was an uncommon outcome (which is expectable,
since we analyzed psychiatric events). It was almost twice more frequent in the group
without previous assessment. This probably reflects again cases of ‘false’ psychiatric
emergencies, which are more prone to happen when there is no previous medical
assessment before referring to ED. There were no differences in this outcome between
EDs.
Discharges against medical approval were more common in the group with
previous medical assessment. This situation usually happens when a patient refuses
hospitalization and does not have criteria for a compulsive hospitalization. Thus, it is
comprehensible that this outcome is also more frequent within the group with more
hospitalizations.
The same principle applies to the differences in this outcome between EDs,
where UMPP has a higher frequency than CHTS. At CHTS, discharges against medical
approval usually occur when a patient refuses transferal (mainly to UMPP) and cannot
be compulsively transferred.
Being left without being seen is also a rare outcome in both EDs. At UMPP, it is
more frequent in the group without previous assessment. It is unlikely that an individual
already assessed by a doctor and transferred to another health institution, knowing he
really needs further medical evaluation, opts to abandon the ED without being seen. It
may also a consequence of the higher waiting times (Triage-observation) in the group
without previous assessment.
Episodes from patients left without being seen are also more frequent at CHTS
than UMPP, probably for the same reasons stated above: at CHTS, more than 94% of
patients arrive from exterior. Waiting time for observation is even longer for CHTS.
Discharges to Exterior (as a group including all other discharge options), are also
more frequent in episodes without previous assessment, probably as a consequence of
64
higher rates of psychiatric inpatient (the second most common discharge outcome at
UMPP, after discharge do primary care, which doesn’t have an important difference
between groups) in the other group.
A remark must be made about discharge with transference to other hospital, a
much more frequent outcome in UMPP’s group of episodes with previous assessment.
It probably represents patients transferred for psychiatric evaluation at UMPP that do
not meet criteria to psychiatric hospitalization and need to return to the origin hospital
to complete a possible organic assessment or to guarantee patient’s transportation.
All differences in times analyzed for UMPP’s groups or for ED were found
statistically significant.
Triage-observation time had a mean 4.7 minutes higher in the group without
previous assessment, which is probably a consequence of the time doctors take to
prepare patient’s assessment: in the case of transferred patients, they usually bring a
summary of the episode, making the fundamental information more easily accessible.
The same principle might justify the mean difference of 43.6 minutes in
Observation-discharge time, lower in the group with previous assessment. In addition to
the already available medical information summarizing the previous assessment, many
patients transferred from hospital institution have already been submitted to auxiliary
diagnostic tests, that do not need to be processed again at UMPP.
Triage-observation time has a mean 23.3 minutes higher at CHTS than UMPP. This
might reflect higher frequency of MTS bracelets with less gravity and eventually
differences in medical staff (possibly not matching adequately ED’s volume of
admissions).
Observation-discharge time had a mean 7.3 minutes higher in CHTS than UMPP.
Although statistically significant (p=0.033), this difference is not very expressive, and
might also traduce differences in ED’s logistics.
High frequency users and readmission results must be evaluated with caution. In
the absence SNS user number at UMPP to calculate these variables, we used Patient’s
File number. Unfortunately, only 42.9% of the total episodes didn’t have data on this
number. At CHTS, we had data on SNS user number for all patients, and to be as
65
accurate possible in this ED, it was the linking variable used to calculate the same
variables.
Given the large number of episodes at UMPP, loss of statistical power wouldn’t
be the main problem, but the possibility to introduce selection bias, which may have
overestimated the true difference between EDs.
We do not know the criteria to have been attributed a Patient’s File number at
CHSJ, but even if all the patients without this number do not represent a high frequency
user or a readmission, UMPP would always have higher proportion of episodes in each
of these indicators, since the differences to CHTS are more than three times higher in
all of them: 3.3 times more episodes by high frequency users, 4.1 times more
readmissions at 24h, 3.4 more readmissions at 48h and 3.1 times more readmissions at
72h.
This problem should not have been extended to the differences between groups
at UMPP, since we used Patient’s File number for both. Group without previous
assessment had 1,7 times higher proportion of visits of high frequency users; this
difference was statistically significant.
There were no statistically significant differences between UMPP’s groups in
readmissions, even though the group without previous assessment had higher
proportion in all times of readmission.
There are many factors influencing access and outcomes to the ED. Many of them
could not be included in this work, either because data on them was not available and
because it would provide too much information to be assimilated in one academic work.
Our results point to relevant differences in psychiatric emergencies between
psychiatric ED and a general ED without psychiatric specialization. Although many of
them might be a reflex of differences in the populations studied or the ED’s
characteristics, some indicators point to higher misuse of the ED, such as higher
proportion of high frequency users and readmissions, as well as higher frequency of
possible ‘non-psychiatric’ episodes. Other indicators point to higher usage of the non-
psychiatric ED by episodes with less severe gravity.
Relevant differences have also been found between groups with different status
of previous assessment. Globally, episodes from patients with previous assessment seem
66
more severe, more accurately ‘psychiatric’, less prone to high frequency users and are
dealt more quickly.
These results can contribute to better understand the functioning of the units
studied, the differences between them and, possibly, to shed some light on future
strategies to achieve better performance at EDs, reduce misusage and pursuit higher
equity.
British National Institute for Health and Care Excellence guidelines for adult
mental health state the assessment and referral procedures for urgent and crisis mental
health should include alternatives to emergency department, such as 24-hour helplines,
crisis resolution and home treatment teams, and the ability to self-refer (London
Strategic Clinical Networks, 2014).
Some of the mentioned structures already exist in the North of Portugal: SNS
24® telephone helpline and crisis outpatient consultation but, at our knowledge, there
are no relevant studies evaluating their efficacy and efficiency.
Misuse of the psychiatric EDs has already been overviewed in this work.
Consistent explanations for this phenomenon in UMPP have already been proposed by
Alves (2013), who found that barriers in the access to mental health care in the
established network (primary care, outpatient consultation, community psychiatric
services, social support, etc.) led to a bypass in this system, and patients looked for
support in the ED, as a structure with easier access.
There are many relevant works approaching Health Systems’ accessibility and
usage. Godlberg & Huxley (1980) developed a model to characterize mental health
patient’s pathway through health care facilities, identifying its obstacles.
Further research should be performed to evaluate efficacy and efficiency of
alternative or complementary models of psychiatric ED, as access only by previous
assessment, or nurse triage, a method with consistent results in some countries (Sinclair
et al., 2006; Wand, 2004; Wand et al., 2011).
This work faces some relevant limitations, the greatest being the different
inclusion criteria operationalization assumed for each ED. Since the definition of
psychiatric emergency was different for each ED, there could have been selection bias
67
influencing result’s validity. The same problem poses, as already mentioned, for the
calculation of high frequency users and readmission.
Analyzing two different hospital structures (secondary vs tertiary, local vs
metropolitan) in terms of referral population, human and non-human resources,
logistics, may affect comparability of the pursued outcomes.
Also, the quality of the data analyzed cannot always be guaranteed. Most variables
are informatically introduced by doctors in the ED software, while managing patients. In
an environment with such high levels of stress, as an ED, this information may not be
the most accurate. As discussed before, discharge diagnoses are an example.

68
REFERENCES
Adams, P. & Nielson, H. (2012). Evidence based practice: decreasing psychiatric revisits
to the emergency department. Issues Ment Health Nurs, 33(8), 536-543.
doi:10.3109/01612840.2012.687803
Administração Regional de Saúde do Norte. (2009). Perfil de Saúde da Região Norte.
Retrieved from
Allen, M. H. (1996). Definitive treatment in the psychiatric emergency service. Psychiatr
Q, 67(4), 247-262.
Allen, M. H. (1999). Level 1 psychiatric emergency services. The tools of the crisis sector.
Psychiatr Clin North Am, 22(4), 713-734, vii.
Allen, M. H., & Currier, G. W. (2004). Use of restraints and pharmacotherapy in
academic psychiatric emergency services. Gen Hosp Psychiatry, 26(1), 42-49.
Almeida, J. P. (2016). A disruptive Big data approach to leverage the efficiency in
management and clinical decision support in a Hospital. Porto Biomedical Journal,
1(1), 40-42.
Alves, A. A. A. (2013). Perfil de Utilização da Urgência Metropolitana do Porto: um contributo
para a análise dos cuidados de Saúde Mental na região. Retrieved from Lisboa:
http://hdl.handle.net/10362/12161
Arfken, C. L., Zeman, L. L., Yeager, L., Mischel, E., & Amirsadri, A. (2002). Frequent
visitors to psychiatric emergency services: staff attitudes and temporal patterns.
J Behav Health Serv Res, 29(4), 490-496.
Arfken, C. L., Zeman, L. L., Yeager, L., White, A., Mischel, E., & Amirsadri, A. (2004).
Case-control study of frequent visitors to an urban psychiatric emergency
service. Psychiatr Serv, 55(3), 295-301. doi:10.1176/appi.ps.55.3.295
Azeredo, T. R., Guedes, H. M., Rebelo de Almeida, R. A., Chianca, T. C., & Martins, J. C.
(2015). Efficacy of the Manchester Triage System: a systematic review. Int Emerg
Nurs, 23(2), 47-52. doi:10.1016/j.ienj.2014.06.001
69
Baker, D. W., Stevens, C. D., & Brook, R. H. (1991). Patients who leave a public hospital
emergency department without being seen by a physician. Causes and
consequences. JAMA, 266(8), 1085-1090.
Bassuk, E., & Gerson, S. (1980). Chronic crisis patients: a discrete clinical group. Am J
Psychiatry, 137(12), 1513-1517. doi:10.1176/ajp.137.12.1513
Beech, B., Parry, L., & Valiani, D. (2000). A pilot project to determine the demand for
and utility of an out-of-hours psychiatric service run by on-call psychiatric nurses
in an A&E department. J Psychiatr Ment Health Nurs, 7(6), 547-553.
Bindman, A. B., Grumbach, K., Keane, D., Rauch, L., & Luce, J. M. (1991). Consequences
of queuing for care at a public hospital emergency department. JAMA, 266(8),
1091-1096.
Brendon, S., & Reet, M. (2000). Establishing a mental health liaison nurse service: lessons
for the future. Nurs Stand, 14(17), 43-47.
Bruffaerts, R., Sabbe, M., & Demyttenaere, K. (2004). Effects of patient and health-system
characteristics on community tenure of discharged psychiatric inpatients.
Psychiatr Serv, 55(6), 685-690. doi:10.1176/appi.ps.55.6.685
Bruffaerts, R., Sabbe, M., & Demyttenaere, K. (2005). Predicting community tenure in
patients with recurrent utilization of a psychiatric emergency service. Gen Hosp
Psychiatry, 27(4), 269-274. doi:10.1016/j.genhosppsych.2005.04.003
Bulbena A, M. M. (2006). Urgencias Psiquiátricas. In J. V. Ruiloba, ed. Introdución a la
Psicopatología y la Psiquiatría (pp. 799-812). Barcelona: Elsevier Masson.
Caldas-de-Almeida, J. M., & Xavier, M. (2010). The World Health Mental Health Survey
Iniciative. NMHS (Portugal National Mental Health Survey). Retrieved from Lisboa:
Callaghan, P., Eales, S., Leigh, L., Smith, A., & Nichols, J. (2001). Characteristics of an
Accident and Emergency liaison mental health service in East London. J Adv Nurs,
35(6), 812-818.
Caplan, G. (1964). Principles of Preventative Psychiatry. London: Tavistock Publications
Limited.
Carlson, R. J., Nayar, N., & Suh, M. (1981). Physical disorders among emergency
psychiatric patients. Can J Psychiatry, 26(1), 65-67.
70
Catalan, J., Marsack, P., Hawton, K. E., Whitwell, D., Fagg, J., & Bancroft, J. H. (1980).
Comparison of doctors and nurses in the assessment of deliberate self-poisoning
patients. Psychol Med, 10(3), 483-491.
Chan, B. T., & Ovens, H. J. (2002). Frequent users of emergency departments. Do they
also use family physicians' services? Can Fam Physician, 48, 1654-1660.
Christ, M., Grossmann, F., Winter, D., Bingisser, R., & Platz, E. (2010). Modern triage in
the emergency department. Dtsch Arztebl Int, 107(50), 892-898.
doi:10.3238/arztebl.2010.0892
Citrome, L. (2002). Atypical antipsychotics for acute agitation. New intramuscular
options offer advantages. Postgrad Med, 112(6), 85-88, 94-86.
Clarke, D. E., & Hughes, L. G. (2002). Quality practice. Psychiatric nurses in hospital
emergency departments. Can Nurse, 98(10), 23-26.
Comissão Nacional para a Reestruturação dos Serviços de Saúde Mental. (2007).
Reestruturação e Desenvolvimento dos Serviços de Saúde Mental em Portugal: Plano
de Acção 2007-2016. Retrieved from
Coordenação Nacional para a Saúde Mental. (2008). Plano Nacional de Saúde Mental
2007-2016 — Resumo Executivo. Lisboa.
Curry, J. L. (1993). The care of psychiatric patients in the emergency department. J Emerg
Nurs, 19(5), 396-407.
Del Gaudio, A. C., Carpenter, P. J., Stein, L. S., & Morrow, G. (1977). Characteristics of
patients completing referrals from an emergency department to a psychiatric
outpatient clinic. Compr Psychiatry, 18(3), 301-307.
Dhossche, D. M., & Ghani, S. O. (1998). A study on recidivism in the psychiatric
emergency room. Ann Clin Psychiatry, 10(2), 59-67.
Diercks, D. B., Roe, M. T., Chen, A. Y., Peacock, W. F., Kirk, J. D., Pollack, C. V., Jr., . . .
Peterson, E. D. (2007). Prolonged emergency department stays of non-ST-
segment-elevation myocardial infarction patients are associated with worse
adherence to the American College of Cardiology/American Heart Association
guidelines for management and increased adverse events. Ann Emerg Med, 50(5),
489-496. doi:10.1016/j.annemergmed.2007.03.033
71
Direcção-Geral da Saúde. (2004). Rede de Referenciação de Psiquiatria e Saúde Mental.
Retrieved from Lisboa:
Direcção-Geral da Saúde. (2010). Elementos estatísticos: Informação Geral: Saúde/2008.
Retrieved from
Ellison, J. M., Blum, N., & Barsky, A. J. (1986). Repeat visitors in the psychiatric emergency
service: a critical review of the data. Hosp Community Psychiatry, 37(1), 37-41.
Fossey, E., & Shapiro, C. M. (1992). Seasonality in psychiatry--a review. Can J Psychiatry,
37(5), 299-308.
Gerson, S., & Bassuk, E. (1980). Psychiatric emergencies: an overview. Am J Psychiatry,
137(1), 1-11. doi:10.1176/ajp.137.1.1
Gillig, P. M., Hillard, J. R., Bell, J., Combs, H. E., Martin, C., & Deddens, J. A. (1989). The
psychiatric emergency service holding area: effect on utilization of inpatient
resources. Am J Psychiatry, 146(3), 369-372. doi:10.1176/ajp.146.3.369
Goldberg, D., & Huxley, P. (1980). Mental illness in the community: the pathway to psychiatric
care. London: Tavistock, UK.
Guttmann, A., Schull, M. J., Vermeulen, M. J., & Stukel, T. A. (2011). Association between
waiting times and short term mortality and hospital admission after departure
from emergency department: population based cohort study from Ontario,
Canada. BMJ, 342, d2983. doi:10.1136/bmj.d2983
Hall, R. C., Popkin, M. K., Devaul, R. A., Faillace, L. A., & Stickney, S. K. (1978). Physical
illness presenting as psychiatric disease. Arch Gen Psychiatry, 35(11), 1315-1320.
Hansen, T. E., & Elliott, K. D. (1993). Frequent psychiatric visitors to a Veterans Affairs
medical center emergency care unit. Hosp Community Psychiatry, 44(4), 372-375.
Hazlett, S. B., McCarthy, M. L., Londner, M. S., & Onyike, C. U. (2004). Epidemiology of
adult psychiatric visits to US emergency departments. Acad Emerg Med, 11(2),
193-195.
Hsia, R. Y., Asch, S. M., Weiss, R. E., Zingmond, D., Liang, L. J., Han, W., . . . Sun, B. C.
(2011). Hospital determinants of emergency department left without being seen
rates. Ann Emerg Med, 58(1), 24-32 e23. doi:10.1016/j.annemergmed.2011.01.009
72
Hubbeling, D., & Bertram, R. (2012). Crisis resolution teams in the UK and elsewhere. J
Ment Health, 21(3), 285-295. doi:10.3109/09638237.2011.637999
Hussein, A. M. M., Smith, C., Isherwood, G., et al. (1997). Working in harmony: a study
to examine the nursing ability to carry out clinical assessment in psychiatric care.
Psychiatric Care, 4(6), 265-268.
Institute for Health Metrics and Evaluation. (2010). http://www.healthdata.org/
Instituto Nacional de Estatística. (2011). Retrieved from Online:
https://www.ine.pt/xportal/xmain?xpid=INE&xpgid=ine_indicadores&indOcorr
Cod=0005889&contexto=pi&selTab=tab0
Joint Commissioning Panel for Mental Health. (2013). Guidance for Commissioners of Acute
Care – Inpatient and Crisis Home Treatment. London.
Kendrick, S. (1996). The pattern of increase in emergency hospital admissions in
Scotland. Health Bull (Edinb), 54(2), 169-183.
Klinkenberg, W. D., & Calsyn, R. J. (1997). The moderating effects of race on return
visits to the psychiatric emergency room. Psychiatr Serv, 48(7), 942-945.
doi:10.1176/ps.48.7.942
Knapp, M., McDaid, D., Medeiros, H., Becker, T., Johnson, S., Kilian, R., . . . Tatar, M.
(2008). Economics, mental health and policy: An overview. London: Mental Health
Economics European Network.
Kropp, S., Andreis, C., te Wildt, B., Sieberer, M., Ziegenbein, M., & Huber, T. J. (2007).
[Characteristics of psychiatric patients in the accident and emergency
department (ED)]. Psychiatr Prax, 34(2), 72-75. doi:10.1055/s-2005-915330
Larkin, G. L., Claassen, C. A., Emond, J. A., Pelletier, A. J., & Camargo, C. A. (2005).
Trends in U.S. emergency department visits for mental health conditions, 1992
to 2001. Psychiatr Serv, 56(6), 671-677. doi:10.1176/appi.ps.56.6.671
Larkin, G. L., Smith, R. P., & Beautrais, A. L. (2008). Trends in US emergency department
visits for suicide attempts, 1992-2001. Crisis, 29(2), 73-80. doi:10.1027/0227-
5910.29.2.73
73
Lee, T. S., Renaud, E. F., & Hills, O. F. (2003). Emergency psychiatry: an emergency
treatment hub-and-spoke model for psychiatric emergency services. Psychiatr
Serv, 54(12), 1590-1591, 1594. doi:10.1176/appi.ps.54.12.1590
Lieberman, J. A., Dixon, L. B., & Goldman, H. H. (2013). Early detection and intervention
in schizophrenia: a new therapeutic model. JAMA, 310(7), 689-690.
doi:10.1001/jama.2013.8804
Lindamer, L. A., Liu, L., Sommerfeld, D. H., Folsom, D. P., Hawthorne, W., Garcia, P., . .
. Jeste, D. V. (2012). Predisposing, enabling, and need factors associated with high
service use in a public mental health system. Adm Policy Ment Health, 39(3), 200-
209. doi:10.1007/s10488-011-0350-3
London Strategic Clinical Networks. (2014). London Mental Health Crisis Commissioning
Guide. London: London Strategic Clinical Networks.
Madi, N., Zhao, H., & Li, J. F. (2007). Hospital readmissions for patients with mental
illness in Canada. Healthc Q, 10(2), 30-32.
Marco, C. A., & Vaughan, J. (2005). Emergency management of agitation in schizophrenia.
Am J Emerg Med, 23(6), 767-776. doi:10.1016/j.ajem.2005.02.050
McDonough, S., Wynaden, D., Finn, M., McGowan, S., Chapman, R., & Hood, S. (2004).
Emergency department mental health triage consultancy service: an evaluation of
the first year of the service. Accid Emerg Nurs, 12(1), 31-38.
Mental Health Foundation. (2008). Mental health in Scotland: National Standards for Crisis
Service: Crisis services practice toolkit. Retrieved from
http://www.scotland.gov.uk/resource/doc/924/0072211.pdf.
Mental Health Strategies. (2011). National Survey of Investment in Adult Mental Health
Services. Retrieved from
Mind. (2011). Listening to Experience: An Independent Inquiry into Acute and Crisis
Mental Healthcare. In Mind. London.
Ministério da Saúde. (2015). Rede Nacional de Especialidade Hospitalar e de Referenciação
de Saúde Mental e Psiquiatria.
Mohsin, M., Forero, R., Ieraci, S., Bauman, A. E., Young, L., & Santiano, N. (2007). A
population follow-up study of patients who left an emergency department
74
without being seen by a medical officer. Emerg Med J, 24(3), 175-179.
doi:10.1136/emj.2006.038679
Mulligan, K. (2004). ER docs report large increase in psychiatric patients. Psychiatr News
[serial on the Internet], 39(12), 10.
Munves, P. I., Trimboli, F., & North, A. J. (1983). A study of repeat visits to a psychiatric
emergency room. Hosp Community Psychiatry, 34(7), 634-638.
National Institute for Clinical Excellence. (2004). Self harm. The short-term physical and
psychological management and secondary prevention of selfharm in primary and
secondary care, Clinical Guideline 16. Retrieved from
www.nice.org.uk/CG016NICEguideline.
Pajonk, F. G., Lubda, J., Sittinger, H., Moecke, H., Andresen, B., & Von Knobelsdorff, G.
(2004). [Assessment of psychiatric emergencies by physicians in the pre-hospital
emergency medical system. A re-evaluation after 7 years]. Anaesthesist, 53(8),
709-716. doi:10.1007/s00101-004-0703-3
Pajonk, F. G., Schmitt, P., Biedler, A., Richter, J. C., Meyer, W., Luiz, T., & Madler, C.
(2008). Psychiatric emergencies in prehospital emergency medical systems: a
prospective comparison of two urban settings. Gen Hosp Psychiatry, 30(4), 360-
366. doi:10.1016/j.genhosppsych.2008.03.005
Pandya, A., Larkin, G. L., Randles, R., Beautrais, A. L., & Smith, R. P. (2009).
Epidemiological trends in psychosis-related Emergency Department visits in the
United States, 1992-2001. Schizophr Res, 110(1-3), 28-32.
doi:10.1016/j.schres.2008.12.015
Paton, F., Wright, K., Ayre, N., Dare, C., Johnson, S., Lloyd-Evans, B., . . . Meader, N.
(2016). Improving outcomes for people in mental health crisis: a rapid synthesis
of the evidence for available models of care. Health Technol Assess, 20(3), 1-162.
doi:10.3310/hta20030
Pereira, S. e. a. (2011). Casuística da Urgência Psiquiátrica dos Hospitais da Universidade
de Coimbra no primeiro semestre de 2010. Parte 2 - Caracterização clínica.
Psiquiatria Clínica, 32(3), 153-160.
75
Polido, F. (2011). Casuística da Urgência Psiquiátrica dos Hospitais da Universidade de
Coimbra no primeiro semestre de 2010. Parte 1 - Caracterização sócio-
demográfica. Psiquiatria Clínica, 32(3), 149-152.
Pow, J. L., Baumeister, A. A., Hawkins, M. F., Cohen, A. S., & Garand, J. C. (2015).
Deinstitutionalization of American public hospitals for the mentally ill before and
after the introduction of antipsychotic medications. Harv Rev Psychiatry, 23(3),
176-187. doi:10.1097/HRP.0000000000000046
Purdie, F. R., Honigman, B., & Rosen, P. (1981). The chronic emergency department
patient. Ann Emerg Med, 10(6), 298-301.
Rowe, B. H., Channan, P., Bullard, M., Blitz, S., Saunders, L. D., Rosychuk, R. J., . . .
Holroyd, B. R. (2006). Characteristics of patients who leave emergency
departments without being seen. Acad Emerg Med, 13(8), 848-852.
doi:10.1197/j.aem.2006.01.028
Saarento, O., Hakko, H., & Joukamaa, M. (1998). Repeated use of psychiatric emergency
out-patient services among new patients: a 3-year follow-up study. Acta Psychiatr
Scand, 98(4), 276-282.
Sabes-Figuera, R., McCrone, P., Csipke, E., Craig, T. K., Rose, D., Sharma, B., & Wykes,
T. (2016). Predicting psychiatric inpatient costs. Soc Psychiatry Psychiatr Epidemiol,
51(2), 303-308. doi:10.1007/s00127-015-1152-9
Sampson, E. L., Blanchard, M. R., Jones, L., Tookman, A., & King, M. (2009). Dementia in
the acute hospital: prospective cohort study of prevalence and mortality. Br J
Psychiatry, 195(1), 61-66. doi:10.1192/bjp.bp.108.055335
Schellein, O., Ludwig-Pistor, F., & Bremerich, D. H. (2009). [Manchester triage system.
Process optimization in the interdisciplinary emergency department].
Anaesthesist, 58(2), 163-170. doi:10.1007/s00101-008-1477-9
Sharfstein, S. S., & Dickerson, F. B. (2009). Hospital psychiatry for the twenty-first
century. Health Aff (Millwood), 28(3), 685-688. doi:10.1377/hlthaff.28.3.685
Simakhodskaya, Z., Haddad, F., Quintero, M., & Malavade, K. (2009). Innovative use of
crisis intervention services with psychiatric emergency room patients. Primary
Psychiatry, 16(9), 60–65.
76
Sinclair, L., Hunter, R., Hagen, S., Nelson, D., Hunt, J., & Group, E. M. H. S. (2006). How
effective are mental health nurses in A&E departments? Emerg Med J, 23(9), 687-
692. doi:10.1136/emj.2005.033175
Slaby, A. E., & Perry, P. L. (1980). Use and abuse of psychiatric emergency services. Int J
Psychiatry Med, 10(1), 1-8.
Smith, R. P., Larkin, G. L., & Southwick, S. M. (2008). Trends in U.S. emergency
department visits for anxiety-related mental health conditions, 1992-2001. J Clin
Psychiatry, 69(2), 286-294.
Sullivan, P. F., Bulik, C. M., Forman, S. D., & Mezzich, J. E. (1993). Characteristics of
repeat users of a psychiatric emergency service. Hosp Community Psychiatry, 44(4),
376-380.
Sun, B. C., Binstadt, E. S., Pelletier, A., & Camargo, C. A., Jr. (2007). Characteristics and
temporal trends of "left before being seen" visits in US emergency departments,
1995-2002. J Emerg Med, 32(2), 211-215. doi:10.1016/j.jemermed.2006.05.045
Syed N, C., P. (2007). Frequent Hospital Admissions. Retrieved from
Tadros, G., Salama, R. A., Kingston, P., Mustafa, N., Johnson, E., & Pannell, R. e. a. (2013).
Impact of an integrated rapid response psychiatric liaison team on quality
improvement and cost savings: the Birmingham RAID model. Psychiatrist, 37, 4-
10.
The Department of Health. (2004). Guidance on telephone access to out of hours sought to
clarify commonly used terms. Retrieved from
http://webarchive.nationalarchives.gov.uk/20130107105354/http://www.dh.gov.u
k/prod_consum_dh/groups/dh_digitalassets/@dh/@en/documents/digitalasset/d
h_4106290.pdf.
Wand, T. (2004). Mental health liaison nursing in the emergency department: on-site
expertise and enhanced coordination of care. Aust J Adv Nurs, 22(2), 25-31.
Wand, T., White, K., Patching, J., Dixon, J., & Green, T. (2011). An emergency
department-based mental health nurse practitioner outpatient service: part 1,
participant evaluation. Int J Ment Health Nurs, 20(6), 392-400. doi:10.1111/j.1447-
0349.2011.00744.x
77
Wang, P. S., Aguilar-Gaxiola, S., AlHamzawi, A. O., Alonso, J., Andrade, L. H.,
Angermeyer, M., . . . Kessler, R. C. (2011). Treated and untreated prevalence of
mental disorder worldwide. In G. S. G. Thornicroft, K. Mueser & B. Drake (Ed.),
Oxford Textbook of Community Mental Health (pp. 50-66). New York: Oxford
University Press.
Wartman, S. A., Taggart, M. P., & Palm, E. (1984). Emergency room leavers: a
demographic and interview profile. J Community Health, 9(4), 261-268.
Wasserman, D. (2001). A stress-vulnerability model and the development of the suicidal
process. In D. Wasserman (Ed.), Suicide: An Unnecessary Death (pp. 13-27).
London: Martin Dunitz.
Weissberg, M. P., Heitner, M., Lowenstein, S. R., & Keefer, G. (1986). Patients who leave
without being seen. Ann Emerg Med, 15(7), 813-817.
Woo, B. K., Chan, V. T., Ghobrial, N., & Sevilla, C. C. (2007). Comparison of two models
for delivery of services in psychiatric emergencies. Gen Hosp Psychiatry, 29(6),
489-491. doi:10.1016/j.genhosppsych.2007.07.004
Younger, T. S. (1995). Understanding and managing the trend in emergency admissions in the
UK: a review of the literature. Leeds: NHS Executive.
Zeller, S. L. (2010). Treatment of Psychiatric Patients in Emergency Settings. Primary
Psychiatry, 17(6), 35-41.
Zeman, L., & Arfken, C. L. (2006). Decreasing unnecessary care in a psychiatric
emergency service. Psychiatr Serv, 57(1), 137-138. doi:10.1176/appi.ps.57.1.137


![revista portuguesa de - Universidade de Coimbra...DSM-5 (American Psychiatric Association [APA], 2014), o FIB é denominado Fun cionamento Intelectual‑Limite e está inserido em](https://img.document.onl/doc/110x75/609998df91c631202a52186c/revista-portuguesa-de-universidade-de-coimbra-dsm-5-american-psychiatric.jpg)