Embed Size (px)
Citation preview
Accepted Manuscript
Title: AnXPS study of Au alloyed Al-O sputtered coatings
Authors: N.M. Figueiredo, N.J.M. Carvalho, A. Cavaleiro
PII: S0169-4332(11)00140-1DOI: doi:10.1016/j.apsusc.2011.01.104Reference: APSUSC 21328
To appear in: APSUSC
Received date: 29-7-2010Revised date: 7-1-2011Accepted date: 21-1-2011
Please cite this article as: N.M. Figueiredo, N.J.M. Carvalho, A. Cavaleiro, AnXPSstudy of Au alloyed Al-O sputtered coatings, Applied Surface Science (2010),doi:10.1016/j.apsusc.2011.01.104
This is a PDF file of an unedited manuscript that has been accepted for publication.As a service to our customers we are providing this early version of the manuscript.The manuscript will undergo copyediting, typesetting, and review of the resulting proofbefore it is published in its final form. Please note that during the production processerrors may be discovered which could affect the content, and all legal disclaimers thatapply to the journal pertain.

Page 1 of 21
Accep
ted
Man
uscr
ipt
Page 1 of 21
Accep
ted
Man
uscr
ipt
> Nanocomposite films of Au clusters in an Al-O matrix were reactive-sputtered.
> The chemical bonding and the Au clusters size were studied by X-ray photoelectron
spectroscopy (XPS).
> In the as-deposited films the Au is present from individual atoms to small clusters
up to 1-2 nm.
> With annealing temperature, Au clustering in the dielectric matrix was observed.
*Research Highlights
Page 2 of 21
Accep
ted
Man
uscr
ipt
Page 2 of 21
Accep
ted
Man
uscr
ipt
An XPS study of Au alloyed Al-O sputtered coatings
N.M. Figueiredo1*
, N.J.M. Carvalho2, A. Cavaleiro
1
(1) SEG-CEMUC – Department of Mechanical Engineering, University of Coimbra,
Portugal
(2) Bekaert Advanced Coatings NV, Deinze, Belgium
*Corresponding author. Tel.: +351 239 790 745; fax: +351 239 790 701; e-mail
address: [email protected]
Keywords: XPS, Al2O3-Au, Au clusters, charging effect
Abstract
The focus of this research is the X-ray photoelectron spectroscopy (XPS)
analysis of thin films consisting of Au metal clusters embedded in a dielectric matrix
of Al-O coatings. The coatings were deposited by co-sputtering an Al+Au target in a
reactive atmosphere with Au contents up to 8 at.%. The Al-O matrix was kept
amorphous even after annealing at 1000°C. In the as-deposited films the presence of
Au clusters with sizes smaller than 1-2 nm (not detected by XRD) was demonstrated
by XPS. With increasing annealing temperature, Au clustering in the dielectric matrix
was also confirmed by XPS, in agreement with XRD results.
Introduction
XPS is a powerful technique that can yield valuable data about elemental
composition, the oxidation state of elements and in favorable cases on the dispersion
of one phase over another [1]. XPS is extensively used to study metal-oxide
interactions providing information about the electronic structures at the interface and
enabling the understanding of charge transfer processes at metal/oxide interfaces.
Moreover, this technique is also surface-sensitive and, thus, it can detect small
changes in surface chemical composition, e.g. surface diffusion and interdiffusion [2].
Nanocomposite coatings consisting of Au nanoparticles inserted in a dielectric
matrix have been developed in recent years for many different applications, such as
surface enhanced Raman spectroscopy (SERS), chemical and biological sensors,
*Manuscript

Page 3 of 21
Accep
ted
Man
uscr
ipt
Page 3 of 21
Accep
ted
Man
uscr
ipt
biomedical diagnosis and treatments, photovoltaic cells, lithography and near-field
imaging, nano-wave-guides, non-linear optical devices, heat assisted magnetic
recording (HAMR) and optical scissors [3]. The present paper aims to use XPS as a
tool to understand the distribution (qualitatively and quantitatively) of Au atoms in an
aluminum oxide matrix and the possible interactions that might occur between Au and
the matrix elements, before and after thermal annealing treatments.
Experimental Details
The coatings were deposited by pulsed d.c. reactive magnetron sputtering
from an aluminum target incrusted with different amounts of gold in a reactive
atmosphere (Ar+O2). Briefly, the strategy consisted of drilling two circular holes in
the target, on each side of the erosion track, and inserting gold pieces of varying
length and number inside the grooves. The samples were placed in the substrate
holder in front of the target not surpassing the zones defined by the incrusted Au
strips. The power density applied to the target was constant at 4 W.cm-2
. The
deposition pressure was fixed at approximately 0.5-0.6 Pa. Before deposition, an
ultimate vacuum pressure better than 1×10⁻³
Pa was reached. All the coatings were
deposited on silicon (111) plates. The substrate surface was ion cleaned with an ion
gun.
The thickness of the films was determined by profilometry using a
Perthometer S4P model with a type T1 RFHTB50 mechanical head. The chemical
composition of the coatings was determined by Cameca SX-50 electron probe
microanalysis (EPMA) apparatus with wavelength-dispersive X-ray spectroscopy
(WDX) operating at 10 keV and the structure of the films was analyzed by X-ray
diffraction (XRD) using a Philips (PANalytical) diffractometer with Co-Kα radiation
in grazing incident configuration (GIXRD), with an incident angle of 2°. XPS data
were acquired by using a Physical Electronics Quantum 2000 Scanning ESCA
Microprobe. This system uses monochromatized Al-Kα radiation (h = 1486.6 eV) as
the excitation source. The analyzer with a take-off angle of 45° was operated at a
constant pass energy of 23.5 eV. Depth profiling was performed using the Ar+ ion gun
(2.5 keV) with a sputtering rate of ~0.1 nm/sec. All the peak fittings were performed
Page 4 of 21
Accep
ted
Man
uscr
ipt
Page 4 of 21
Accep
ted
Man
uscr
ipt
applying Shirley background correction and using the proper area relation between
the doublets and a fixed spin-orbit splitting.
Basic Characterization
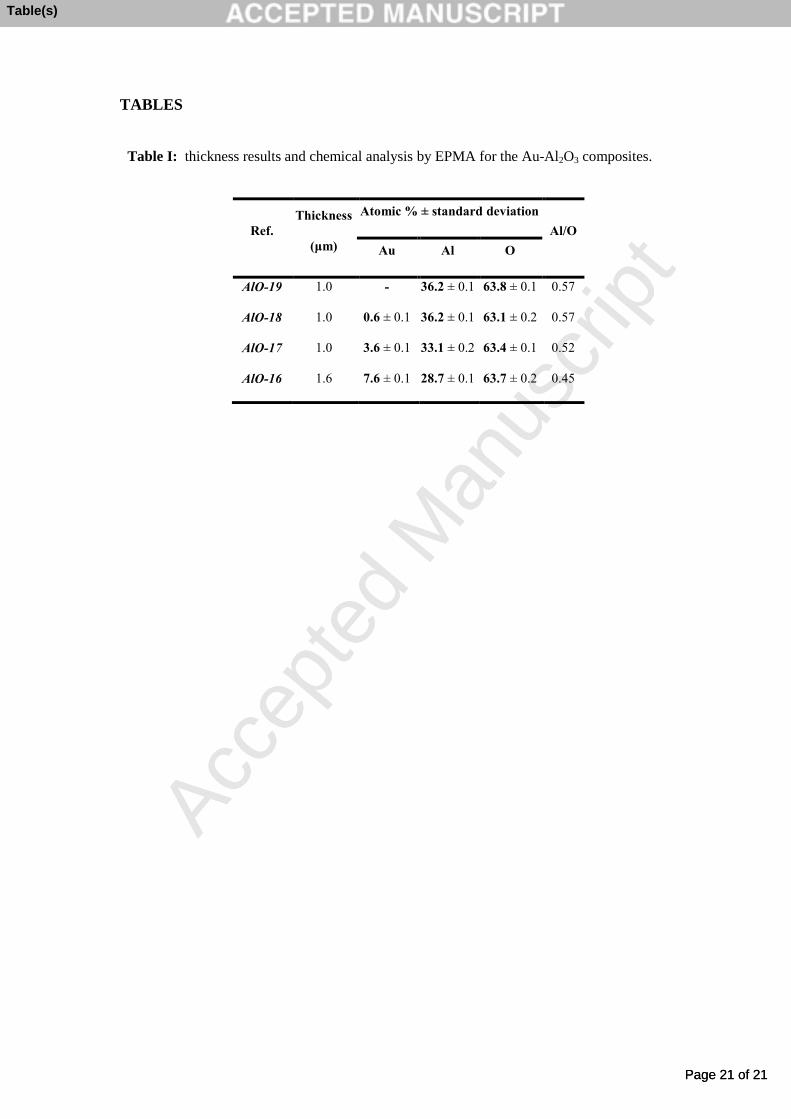
The deposited coatings from the system Al-O-Au had gold contents from 0 up
to 8 at.% (Table I) and all the samples revealed themselves to be over-stoichiometric
in oxygen with regard to Al2O3, this difference being accentuated by the increase in
gold. Considering that the amount of oxygen is kept approximately constant,
independent of the Au content, this result suggests that the Au is most probably
substituting Al which, in such a case, would lead to an overall decrease in the Al/O
ratio.
All the Al-O+Au coatings revealed to be XRD amorphous in the as-grown
condition; the presence of neither gold nor Al-O matrix peaks was detected whatever
the Au content was. Only for annealing temperatures equal to or above 400°C were
the first signs of Au crystallization detected for the coating with the highest gold
content. The crystallinity of Au was greatly improved for higher annealing
temperatures, especially at 1000°C. The narrowing of the peaks with increasing
annealing temperatures suggested different sizes of Au nanoparticles. After the
application of the Scherrer equation to the integral breadth of the XRD peaks, an
estimation of the size of Au nanoparticles for the sample with 7.6% at. Au at 400°C
and 1000°C was 3 nm and 25 nm, respectively. The sample containing 3.5% at. Au
only crystallized at 1000 ºC and the grain size was approximately 10 nm. In any case,
no signs of the crystallization of the Al-O matrix could be observed. The annealing
also gave rise to blistering of the coatings, particularly at 1000 ºC, where flaking off
was clearly observed in several surface zones. All the results of this basic
characterization are to be published soon.
XPS analysis
The charging effects frequently arising during XPS measurements were
corrected by assuming that the C-C bond from the contamination layer had a binding
energy (BE) of 284.7 eV in the C 1s spectrum. As the C 1s peak vanished completely

Page 5 of 21
Accep
ted
Man
uscr
ipt
Page 5 of 21
Accep
ted
Man
uscr
ipt
after surface cleaning by ion bombardment, the internal reference for peak position
correction was taken from the major contribution of the Al-O bond peak either from
the O 1s spectrum (with BE at 531.5 eV) or from the Al 2p spectrum (BE at 74.6 eV).
The Au 4f level gives two photoemission peaks, 4f7/2 and 4f5/2 with an
intensity ratio of 4:3 and an energy difference, the spin-orbit splitting, of 3.65 eV [4].
The Al 2p and Si 2p levels give the 2p3/2 and 2p1/2 doublets. Their intensity ratio is 2:1
and the spin-orbit splitting of the doublets is 0.4 eV [5] and 0.6 eV [6], respectively.
These values were taken into account whenever deconvolution of the peaks was
performed. From now on, whenever a binding energy for the Au 4f peak is referred to
it takes into account the 4f7/2 contribution. In the same way, for the Al 2p and Si 2p
cases, the BE values take into account the major 2p3/2 contribution.
As deposited samples
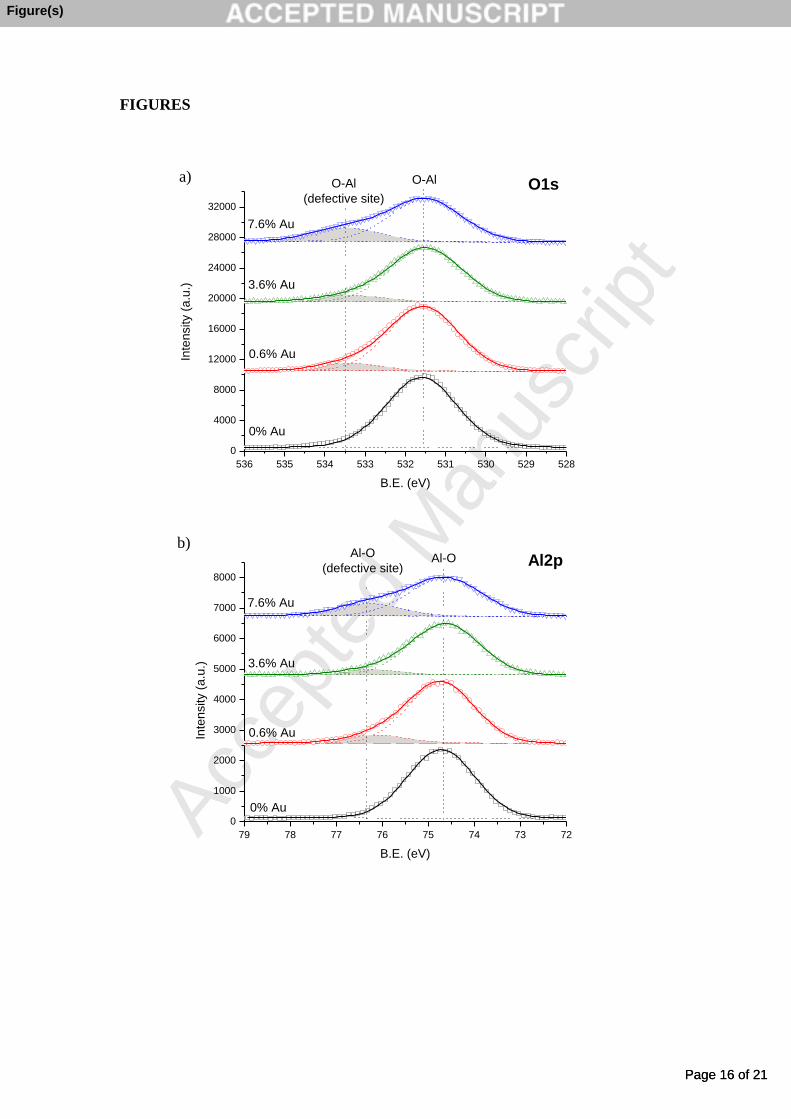
For all the as-deposited samples the O 1s spectra, achieved after the samples
have been ion bombarded for surface cleaning, were deconvoluted and the main peak
was fixed (figure 1 a)) at 531.5 eV, the characteristic value of the O-Al bond in
alumina [7], serving as internal reference. As expected, the main peak in the Al 2p
spectrum (figure 1 b)) is located around 74.6 0.1 eV [7], the value of the Al-O bond
in that compound. In the Au doped samples, specially for the one with the highest Au
content (7.6% at Au), the presence of a small shoulder in the higher energy region of
both O 1s and Al 2p spectra, at 533.3 eV and 76.4 eV, respectively, was noted.
The Au 4f XPS spectrum of the sample with less gold content (0.6% at. Au) in
figure 1 c) shows a peak at ~85 eV, a value significantly higher than the BE of
elemental Au, that could indicate an emission from a different, strongly electron-
withdrawing chemical environment, which might be the case of isolated atoms or
nano-clusters of gold surrounded by the oxide matrix [8]. This peak should not be
related exclusively to Au-oxide since no new low binding energy (LBE) peak was
detected in the O 1s spectrum that could indicate such an electronic transition (as
compared with the sample without gold). Moreover, the oxidation of small gold Au
clusters (2-13 atoms) is usually distinguished in the Au 4f XPS spectrum by a
chemical shift of ~1.5 eV [9], a value appreciably higher than the one observed in the
present case. Rao et al. [10] reported, when analyzing the BE of gold deposited onto
Page 6 of 21
Accep
ted
Man
uscr
ipt
Page 6 of 21
Accep
ted
Man
uscr
ipt
highly oriented pyrolitic graphite (HOPG) that, when going from bulk gold to gold
clusters with sizes lower than 2 nm, the core-level binding energy increased to a
maximum of 0.8 eV (corresponding to clusters with diameters close to 0.5 nm), this
phenomenon being mainly attributed to a decrease in the core-hole screening by
conduction electrons, as a result of the discretization of the conduction band [10, 11,
12, 13]. For large clusters of diameters superior to 4 nm, the BE closely approximated
the bulk metal value. Similar results were obtained by Dong et al. [14], while studying
the size-selectivity in the oxidation behaviour of Au nanoparticles supported on silica
surfaces, where identical positive shifts were observed in the Au 4f core level up to
0.8 eV with decreasing cluster size. In a more extensive study, Mason [11] compiled a
series of observed core-level BE shifts for several metal-substrate combinations
arising from the shrinking of the metallic clusters, and reported a maximum BE shift
of 1.1 for the Au-Al2O3 system. However, in the current study, the Au clusters are
expected to be dispersed throughout the oxide matrix, and not only on its surface,
which can result in a broader range of values for the shifts in BE. In embedded
clusters a possible reduction in cluster charging due to the increased contact area and
the increased polarization energy can be countered by the absence of image charge
screening, resulting in higher BE shifts [15]. Dalacu et al. [15] observed higher BE
shifts for Au clusters embedded in SiO2 than when they are simply supported in the
oxide surface.
In conclusion, the peak at 85 eV in the Au 4f XPS spectrum of the sample
with less gold content is hereby attributed to small gold clusters with diameters
inferior than 1-2 nm (probably closer to 0.5 nm), which can be as small as isolated
atoms, embedded in the Al-O matrix. The fact that this peak possesses enlarged full-
width at half maximum (FWHM) when compared to bulk Au (~2 eV compared to ~1
eV) is also an expected result since the line-width is also believed to increase with
decreasing screening; line broadenings of about 1 eV have been previously observed
for small Au clusters supported in Al2O3 [11] [15]. Additionally, since the BE shift
increases with the decrease in cluster size, the peak broadening could indicate the
presence of clusters of different sizes (broad size distribution).
At first glance, the two high binding energy (HBE) peaks occurring in the Al
2p and O 1s spectra could be attributed to a hydroxide compound, such as Al(OH)3
[4]. However, this could only make sense at the surface of the samples and not
throughout the depth profile after surface ion bombardment. Moreover, if such a bond

Page 7 of 21
Accep
ted
Man
uscr
ipt
Page 7 of 21
Accep
ted
Man
uscr
ipt
existed it should be detected with similar intensities in all the samples, including the
Au-free one. The HBE peaks can be explained by changes in the electron transfer
between the oxide and the gold occurring during XPS analysis. The interaction of
gold atoms and the alumina matrix can change significantly depending on the way the
gold is arranged in relation to the matrix. Dong et al. [9] carried out an XPS study of
the oxidation behavior of size-selected gold clusters (2-13 atoms) deposited on silica
and graphite and observed that the chemical properties of the Au clusters drastically
changed with the number of atoms and could be significantly influenced by
interaction with the metal-support. For the graphite substrate only Au8 was
susceptible to being oxidized, contrasting with the silica case, where other-numbered
clusters tended to show higher reactivity towards oxidation. Thus, it is admissible to
expect some preferential interaction between Au atoms and Al or O atoms in alumina,
depending on Au cluster size. The fact that either HBE peaks surge exclusively in the
O 1s and Al 2p spectra of Au containing samples or no new Au contribution arose in
the Au 4f spectrum, besides the one above described, strongly suggests that the HBE
peaks cannot be related to any new Au bond. Therefore, the features appearing in
HBE values in Al 2p and O 1s spectra must originate from Al-O -like bonds, although
attributable to different chemical environments.
In literature, other studies can be found that make reference to such HBE
contributions. Chen et al. [16], in an XPS study of oxide film growth on Mg and Al
surfaces, noticed the presence of oxygen atoms in two different chemical
environments, one (the LBE peak) corresponding to oxygen atoms in the oxide lattice
(O2-
) of aluminum oxide (532.1 eV) or magnesium oxide (531 eV) and the other
(HBE peak) corresponding to oxygen atoms near vacancy-type defects in the oxide
film (with BE close to 533.5 eV for Al2O3 and to 533.2 eV for MgO). A similar
occurrence was also observed by Splinter et al. [17]. In the current study, it is thus
suggested that the HBE peaks probably originate from Al-O bonds related to atoms
situated in sites adjacent to metal cation vacancies. The integration of Au in the oxide
lattice is thermodynamically less stable than for the Al atoms and could lead to a more
defective environment during film growth. Furthermore, these defects can be created
by the procedure used for XPS analysis, as will be shown later.
With the gold increase in the coatings, besides the peak at 85 0.1 eV, a new
peak at lower BE (84.1 0.1 eV) started to occur. If for the sample with intermediate
Page 8 of 21
Accep
ted
Man
uscr
ipt
Page 8 of 21
Accep
ted
Man
uscr
ipt
gold concentration (3.5% at. Au) it is a minor contribution it becomes the major peak
in the sample with the highest gold content (7.6% at. Au). This new peak is positioned
close to the BE of bulk gold, suggesting the progressive enlargement of the clusters
with the increase in gold concentration. Therefore, these results seem to indicate that
the samples always contain gold in different states, isolated atoms, small (metallic
clusters) and very small (non-metallic) particles. Although this coexistence was
observed before by, e.g., Qian en al. [18] for Au particles dispersed in SiO2, the
existence of Au-Au “bulk-like” bonds in the Au 4f XPS spectrum (characteristic of
clusters with sizes bigger than 2-4 nm) in the as deposited samples contradicts what
was observed in XRD analysis, where no Au fcc peak could be detected. In order to
shed some light on these contradictory results, a closer analysis of the XPS spectra
registered before and after each progressive step of Ar+ sputtering was performed.
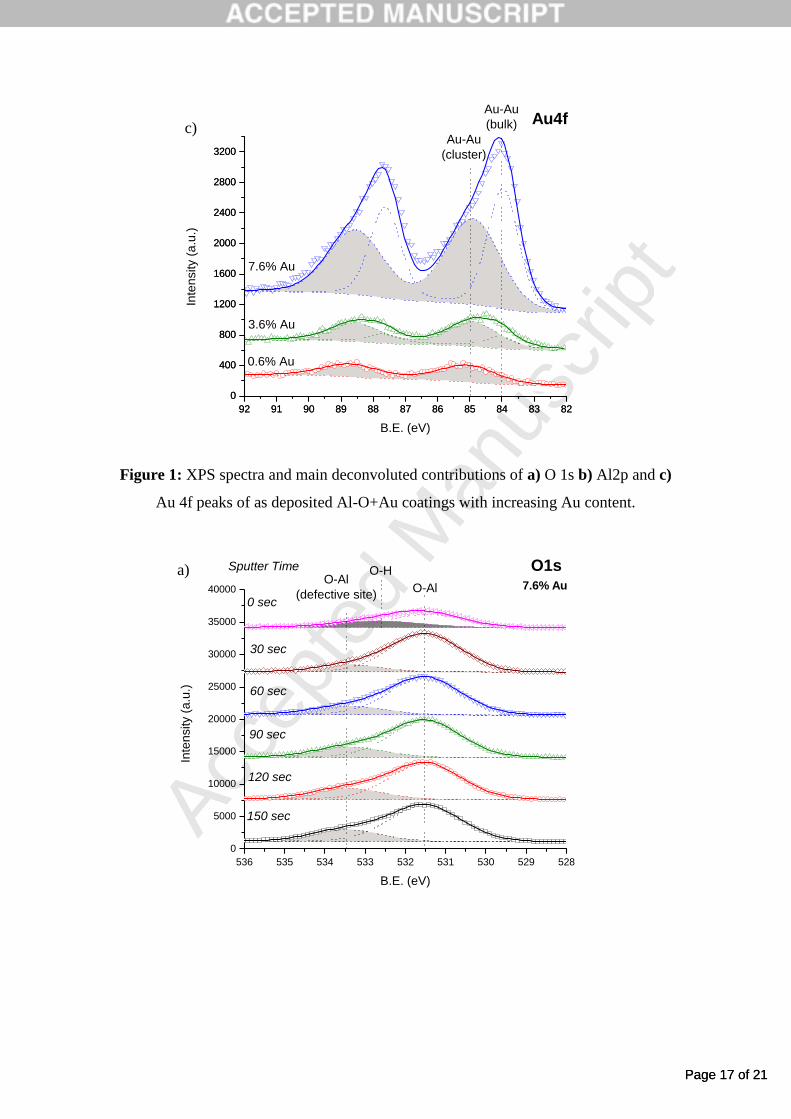
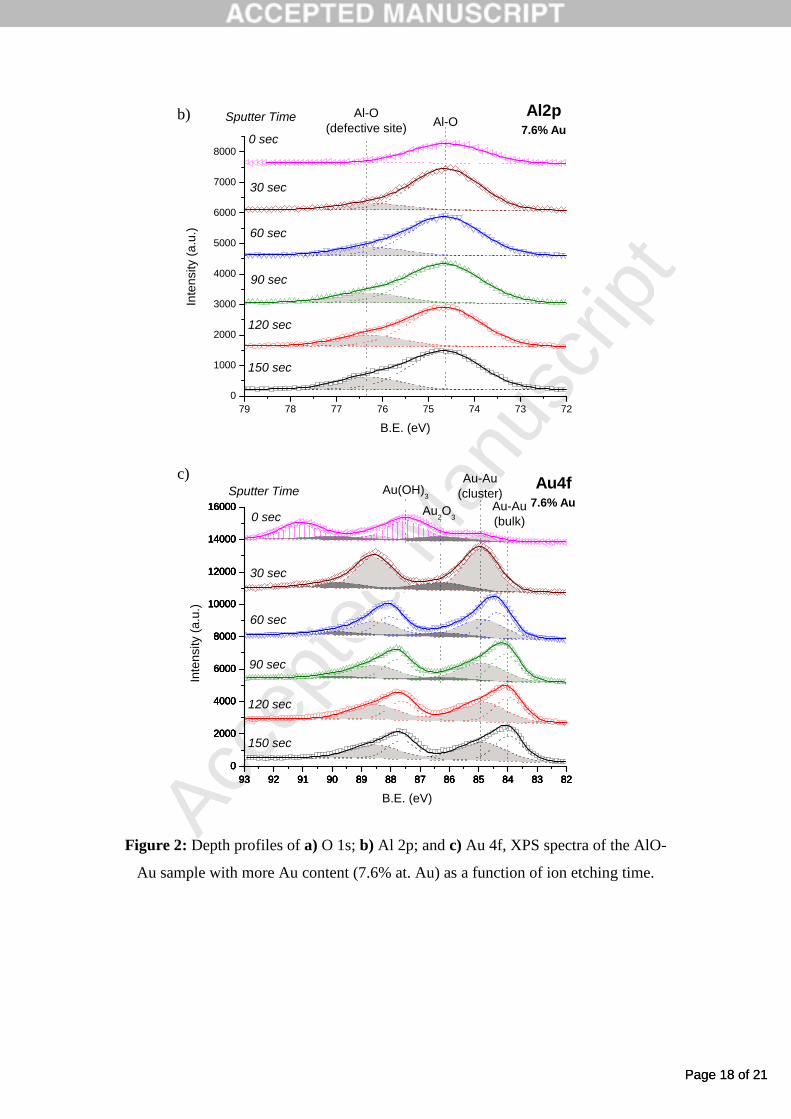
For the sample with 7.6% at. Au, the Au 4f surface spectrum (figure 2 c))
obtained before ion bombardment shows: (i) a small peak located at 84.9 eV, which,
as discussed above, is attributed to Au in the form of very small nanoparticles; (ii) a
HBE peak, located around 87.5 eV, characteristic of Au-oxide in the hydrated form,
possibly Au(OH)3 in good agreement with the literature ([19] and [20]) and confirmed
in the O 1s spectrum (figure 2 a)) by the HBE peak at 532.6 eV; (iii) a small peak at
86.3 eV, which can be tentatively attributed to a non-hydrated Au-oxide compound
[19]. The second contribution, corresponding to gold(III) hydroxide, should be
originated after deposition, with the contact of the sample with the moisture of the
atmosphere. The latter peak is only detected for this sample with the highest Au
content and it is interpreted on the basis of isolated Au atoms in substitution of Al in
the amorphous alumina network. If the Au content is high enough, which is not the
case for the samples with lower Au content, it is possible in some cases to simulate
Au coordination; as in Au2O3. For lower Au contents, the presence of Au atoms in
substitution of Al can also be envisaged but the probability that the exact coordination
of Au2O3 occurs in a particular place is much lower.
After the first step of Ar+ sputtering the contamination layers were removed
and the hydrated peak (Au(OH)3) vanished. Only the other two peaks could be
observed in the Au 4f spectrum (figure 2 c)), the major one at 84.9 eV (very small
clusters) and the small one at 86.3 eV (corresponding to the non-hydrated Au-oxide
compound). With further Ar+ bombardment, a new peak starts to be detected, firstly
around 84.4 eV and then stabilizing close to 84 eV, the BE value characteristic of the
Page 9 of 21
Accep
ted
Man
uscr
ipt
Page 9 of 21
Accep
ted
Man
uscr
ipt
Au-Au bulk bond. These results suggest cluster growth induced by the sputtering
process. The Ar+ bombardment has a double effect on the surface layers: firstly, the
transfer of the kinetic energy of the ions to the surface atoms favors Au diffusion and
aggregation and, secondly, breaking the low energy bond of Au-O, locally creates
metal cation defect sites. Therefore, the detection by XPS after surface ion cleaning of
either the Au-Au bulk bond peak in the Au 4f spectrum (figure 2 c)) or the HBE peaks
in O 1s and Al 2p spectra (figures 2 a) and b)) are now understood.
This is clearly shown in figure 2 a) for the evolution of the O 1s core level
with sputtering time. After the removal of the first contamination layers, the
hydroxide peak near 532.6 eV disappeared (in good agreement with the Au 4f profile)
and the HBE peak located around 533.3 eV, attributed above to oxygen atoms near
site defects, starts to be detected. This peak increased in area with sputtering time,
showing the increasing removal of Au atoms (clustering) leaving more and more
cation vacancy-type defect sites. Similarly, for the Al 2p XPS spectra (figure 2 b)) the
small HBE peak located near 76.2 eV progressively increased in area with sputtering
time, following the same trend as O 1s.
An alternative interpretation can be suggested for the HBE peaks in the Al2p
and O1s spectra, by admitting the presence of localized charging in particular regions
of the surface (non-uniform surface charging). With the cluster growth (after the
successive sputtering steps), the “Au clusters” peak positioned in the Au4f spectrum
at ~85eV has an additional contribution from the charging of some of the larger Au
clusters (located around ~84 eV). As a consequence, the broadening of the HBE Au4f
peak can be attributed to both the final state effects and the charging of some of the
bigger clusters arising from non-uniform surface charging.
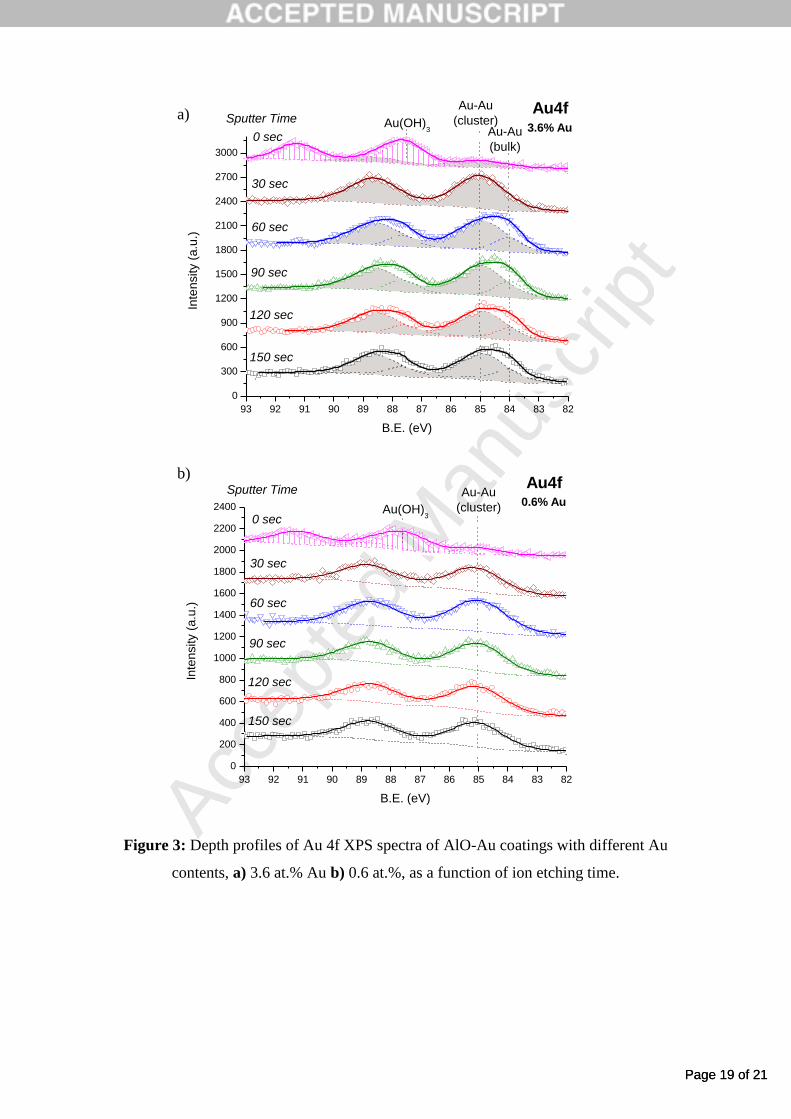
For the samples with lower Au contents (0.6 and 3.6 at.% Au) the spectra at
the surface are very similar, with the predominance of the hydroxide peak and the
small peak located close to 85 eV and corresponding to the very small Au clusters. In
no case did the peaks related to the Au2O3 phase have to be considered to ensure a
good fit during spectra deconvolution. After the first step of surface cleaning, both the
disappearance of the hydroxide peak and an increase in the intensity of the Au-bonds
in small clusters were observed for both samples. The positive shifts of approximately
1 eV in relation to Au-Au bulk gold suggest clusters with dimensions less than 0.5-1
nm (usually these dimensions correspond in the literature to the maximum shifts that
are observed; see e.g. [11] and [14]). This step should represent the real structure of
Page 10 of 21
Accep
ted
Man
uscr
ipt
Page 10 of 21
Accep
ted
Man
uscr
ipt
the coatings in the as-deposited state. For the 3.6 at.% Au sample (figure 3 a)), further
ion bombardment made a new LBE peak appear, originating from the Au-Au bulk-
like bonds, similar to what was described for the 7.6 at.% sample, meaning that
cluster growth occurred during ion bombardment. The sample with the lowest Au
content (figure 3 b)) only showed a single peak (~85 eV) even after the maximum
sputtering time studied in this investigation. This must be related to the much higher
spacing existing between Au atoms/aggregates in this case (due to decreased volume
fraction of Au in the matrix).
Annealed samples
In order to understand the influence of the annealing temperature on the
structure of the Au-doped coatings, the sample with 3.6 at.% Au was annealed at 2
different temperatures, 400 ºC and 1000 ºC. For comparison, the coating without Au
was also annealed at 400 ºC. In the latter case, no visible changes in the XPS spectra
were found regarding the position, shape and area of the peaks, when compared to the
as-deposited condition, before and after the different steps of ion sputtering.
For the Au-containing coating, after annealing at 400°C, before Ar+
bombardment, a new peak in the Si 2p range with a BE of ~102.8 eV, corresponding
to the Si-O bond of the SiO2 compound is shown [21, 22]. In agreement with this, a
HBE peak at 532.7 eV was detected in the O 1s spectrum [22]. This is an expected
result since the coatings started to flake off locally at this temperature due to the
formation of blisters, exposing the oxidized silicon substrate. Furthermore, in contrast
to the as-deposited samples, no Au(OH)3 compound was detected in the Au 4f region
(figure 4). As the temperature increases it is expected that Au(OH)3 decomposes into
metallic Au [19, 20]. However, as the sample again comes in contact with the
atmosphere, it would be expected to react again with the humid air, forming the
Au(OH)3 compound. The non-detection of this bond points to cluster growth, with the
consequent diminishing of reactivity [23], in good agreement with the literature. Park
et. al [20] got similar results while studying the oxidation of Au clusters deposited
onto Al2O3; the oxidized gold species, both Au2O3 and Au(OH)3, mostly decomposed
into metallic species after annealing at 400°C. This is confirmed by the only peak
present in the Au 4f surface spectrum, with BE close to 84.5 eV; the shift of +0.5 eV
in relation to the Au-Au bulk signal is much lower than the +1.0 eV shift verified on
Page 11 of 21
Accep
ted
Man
uscr
ipt
Page 11 of 21
Accep
ted
Man
uscr
ipt
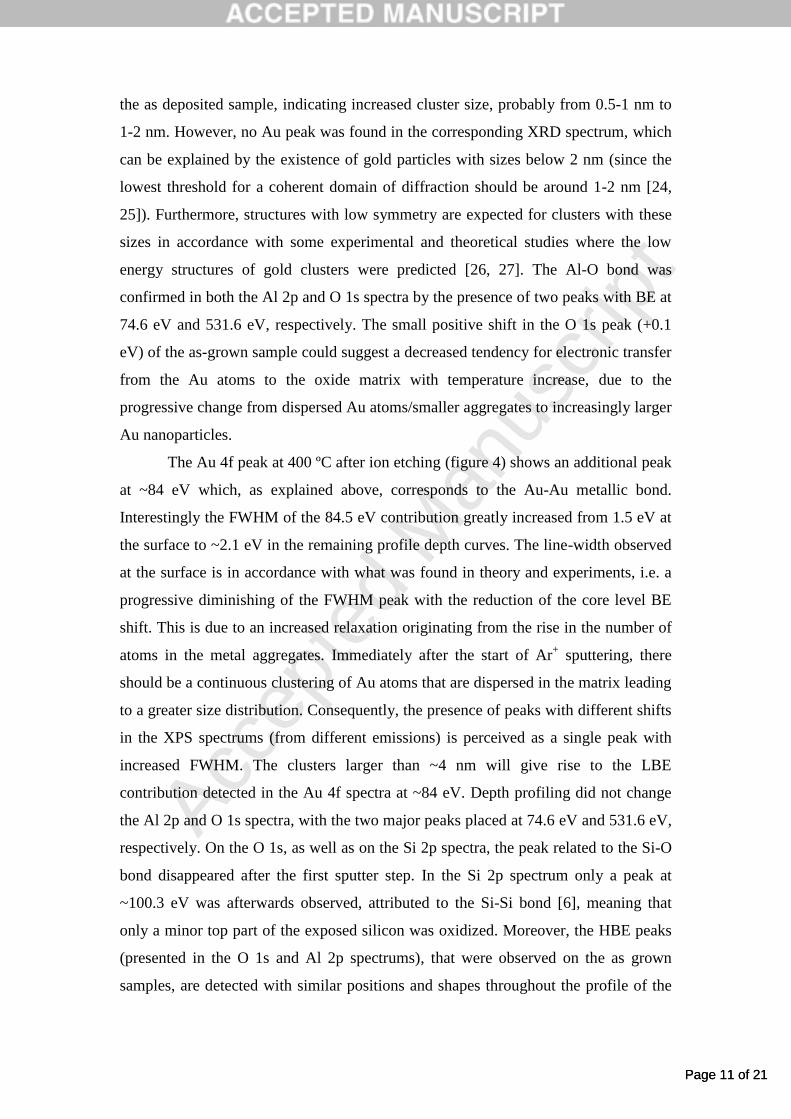
the as deposited sample, indicating increased cluster size, probably from 0.5-1 nm to
1-2 nm. However, no Au peak was found in the corresponding XRD spectrum, which
can be explained by the existence of gold particles with sizes below 2 nm (since the
lowest threshold for a coherent domain of diffraction should be around 1-2 nm [24,
25]). Furthermore, structures with low symmetry are expected for clusters with these
sizes in accordance with some experimental and theoretical studies where the low
energy structures of gold clusters were predicted [26, 27]. The Al-O bond was
confirmed in both the Al 2p and O 1s spectra by the presence of two peaks with BE at
74.6 eV and 531.6 eV, respectively. The small positive shift in the O 1s peak (+0.1
eV) of the as-grown sample could suggest a decreased tendency for electronic transfer
from the Au atoms to the oxide matrix with temperature increase, due to the
progressive change from dispersed Au atoms/smaller aggregates to increasingly larger
Au nanoparticles.
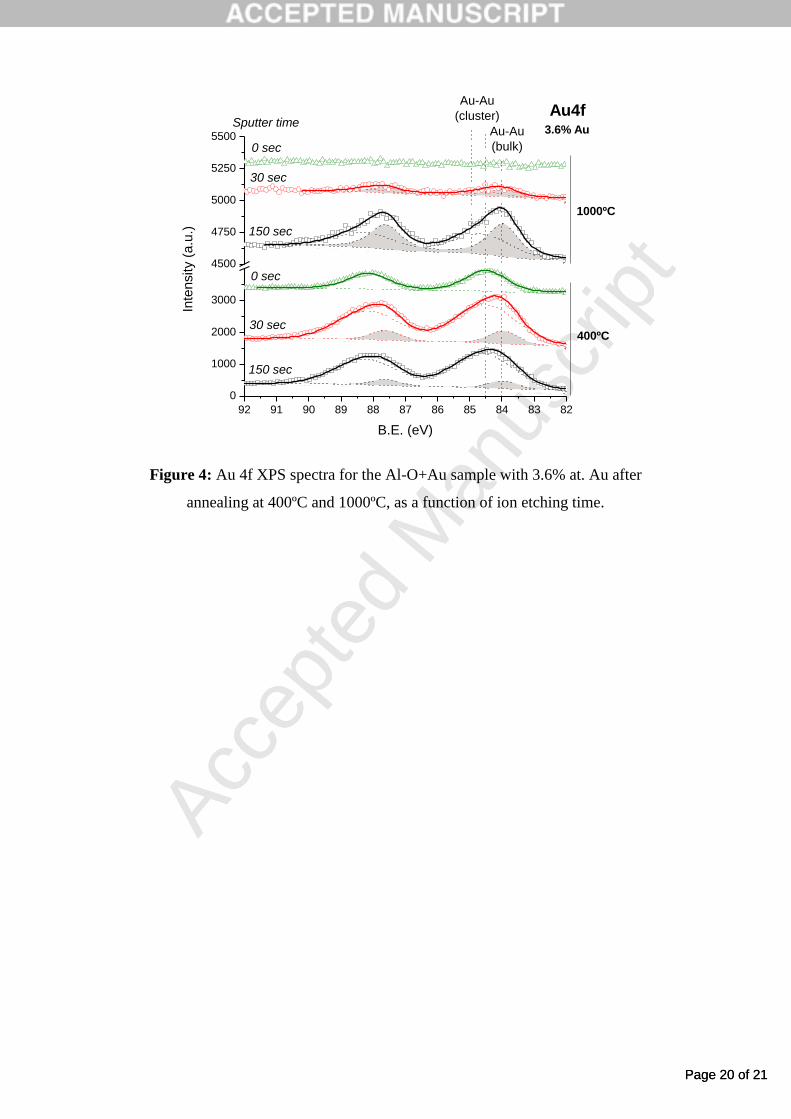
The Au 4f peak at 400 ºC after ion etching (figure 4) shows an additional peak
at ~84 eV which, as explained above, corresponds to the Au-Au metallic bond.
Interestingly the FWHM of the 84.5 eV contribution greatly increased from 1.5 eV at
the surface to ~2.1 eV in the remaining profile depth curves. The line-width observed
at the surface is in accordance with what was found in theory and experiments, i.e. a
progressive diminishing of the FWHM peak with the reduction of the core level BE
shift. This is due to an increased relaxation originating from the rise in the number of
atoms in the metal aggregates. Immediately after the start of Ar+ sputtering, there
should be a continuous clustering of Au atoms that are dispersed in the matrix leading
to a greater size distribution. Consequently, the presence of peaks with different shifts
in the XPS spectrums (from different emissions) is perceived as a single peak with
increased FWHM. The clusters larger than ~4 nm will give rise to the LBE
contribution detected in the Au 4f spectra at ~84 eV. Depth profiling did not change
the Al 2p and O 1s spectra, with the two major peaks placed at 74.6 eV and 531.6 eV,
respectively. On the O 1s, as well as on the Si 2p spectra, the peak related to the Si-O
bond disappeared after the first sputter step. In the Si 2p spectrum only a peak at
~100.3 eV was afterwards observed, attributed to the Si-Si bond [6], meaning that
only a minor top part of the exposed silicon was oxidized. Moreover, the HBE peaks
(presented in the O 1s and Al 2p spectrums), that were observed on the as grown
samples, are detected with similar positions and shapes throughout the profile of the

Page 12 of 21
Accep
ted
Man
uscr
ipt
Page 12 of 21
Accep
ted
Man
uscr
ipt
annealed film, thus suggesting that cation metal vacancies are retained despite the
temperature and the sputtering.
After annealing at 1000°C (1h), a depletion of Au close to the surface of the
film was observed (figure 4). At the original surface, no trace of Au could be detected
in the Au 4f spectrum. However, immediately after the first step of surface layer
removal, a small Au 4f contribution could be distinguished, that progressively
increased in area with the sputter time. The 4f7/2 peak was composed of two distinct
contributions: (i) a major one with BE of ~84 eV, characteristic of the Au atoms in
bulk gold, thus confirming the results of XRD analysis with the presence of Au
nanoparticles with sizes of approximately 10 nm, a value estimated by the Scherrer
equation, and (ii) a smaller one at BE close to ~84.5 eV, characteristic of Au atoms in
clusters with sizes inferior to 2 nm. For this second peak, its FWHM increases
progressively from 1.5 eV, after 30 seconds of sputter time, to 2.1 eV in the last
profile curve, after 150 seconds of Ar+ sputtering. This enlargement suggests a
broadening in the range of cluster sizes with sputter time, from isolated atoms to 1-2
nm. The final structure of the coatings should thus consist of a bimodal distribution of
Au, with large Au clusters (~10 nm) and the remaining Au distributed in the oxide
matrix atomically or in the form of very small precipitates.
All the profile curves of the O 1s spectrum showed a contribution at BE of
532.6 eV, which neatly fits the O-Si bond of the fully oxidized silicon (SiO2) of the
exposed substrate zones. In good agreement with this, the Si 2p spectrum shows only
one peak at ~102.8 eV (Si-O in SiO2), with similar shapes in all the profile curves,
indicating that the oxidation of the Si substrate underwent several nanometers in
depth. Overlapping in this zone, on the O 1s spectrum, the HBE peak attributed to the
vacancy defect-type sites should likely exist. The presence of an HBE peak in the Al
2p spectra corroborates this possibility.
Conclusion
On the basis of the EPMA, XRD and XPS results, the proposed structure of
the film is that of a phase-separated material consisting of a mixture of an Al2O3
matrix coexisting with Au in the form of small or very small clusters (sizes < 1-2 nm).
The Au element is also integrated into the oxide network with a probable Au2O3

Page 13 of 21
Accep
ted
Man
uscr
ipt
Page 13 of 21
Accep
ted
Man
uscr
ipt
environment, especially for the film with the highest Au content, 7.6 % at. Au, where
the probability that at a particular site the occurrence of the exact coordination of
Au2O3 is higher. All the as-grown coatings containing Au presented at the surface a
small amount of Au hydroxide. The Au oxide phases have no long-range order
detectable by XRD and the Au phase is present in the form of aggregates with sizes
smaller than 1 nm, thus being also out of the range of XRD detection. Cluster growth
was promoted with temperature increase. After annealing at 400ºC, in the sample with
intermediate amounts of Au (3.6% at.) the Au clusters were enlarged from 0.5-1 nm
to 1-2 nm, but were still not detected by XRD, suggesting an amorphous structure.
For annealing at 1000ºC the results indicate the coexistence in the oxide matrix of
bigger clusters (with sizes close to 10 nm) together with some smaller ones (< 1-2
nm) originating from Au atoms that were initially trapped in the matrix.
Acknowledgements
This research is partially sponsored by FEDER funds through the program
COMPETE - Programa Operacional Factores de Competitividade - and by national
funds through FCT - Fundação para a Ciência e a Tecnologia -, under the project
DECOMAT: PTDC/CTM/70037/2006.

Page 14 of 21
Accep
ted
Man
uscr
ipt
Page 14 of 21
Accep
ted
Man
uscr
ipt
References
[1] J.W. Niemantsverdriet, Spectroscopy in Catalysis – An Introduction, Wiley-
VCH Verlag GmbH, Weinheim, 2000
[2] Q. Fu, T. Wagner, Surf. Sci. Rep. 62 (2007) 431-498
[3] D. Sarid, W.A. Challenger, "Modern Introduction to Surface Plasmons -
Theory, Mathematica Modeling and Applications", Cambridge University
Presse, UK, 2010
[4] C.D. Wagner, W.M. Riggs, L.E. Davis, J.F. Moulder, G.E. Muilenberg,
Handbook of X-ray Photoelectron Spectroscopy, Perkin-Elmer Corporation,
Minnesota, 1978
[5] D. Wolf, S. Yip, Materials interfaces: atomic-level structure and properties,
Chapman & Hall, London, 1992
[6] P. Sangpour, O. Akhavan, A.Z. Moshfegh, M. Roozbehi, Appl. Surf. Sci. 254
(2007) 286-290
[7] B.L. Moroz, P.A. Pyrjaev, V.I. Zaikovskii, V.I. Bukhtiyarov, Catal. Today
144 (2009) 292-305
[8] C. Xu, T. Sritharan, S.G. Mhaisalkar, M. Srinivasan, S. Zhang, App. Surf. Sci.
253 (2007) 6217-6221
[9] D.C. Lim, R. Dietsche, G. Gantefor, Y.D. Kim, “Size-selected Au clusters
deposited on SiO2/Si: Stability of clusters under ambient pressure and
elevated temperatures”, Appl. Surf. Sci. (2009), Article in press
(doi:10.1016/j.apsusc.2009.05.071)
[10] C.N.R. Rao, V. Vijayakrishnan, H.N. Aiyer, G.U. Kulkarni, G.N. Subbanna, J.
Phys. Chem. 97 (1993) 11157-11169
[11] M.G. Mason, Phys. Rev. B 27 (1983) 748-762
[12] T.T. Magkoev, K. Christmann, A.M.C. Moutinho, Y. Murata, Surf. Sci. 515
(2002) 538-552
[13] D.C. Lim, Y.D. Kim, Letter to the Editor/App. Surf. Sci. 253 (2006) 2984-
2987
[14] D.C. Lim, I.L. –Salido, R. Dietsche, M. Bubek, Y.D. Kim, Angew. Chem. Int.
45 (2006) 2413-2415
[15] D. Dalacu, J.E.K. –Sapieha, L. Martinu, Surf. Sci. 472 (2001) 33-40
Page 15 of 21
Accep
ted
Man
uscr
ipt
Page 15 of 21
Accep
ted
Man
uscr
ipt
[16] C. Chen, S.J. Splinter, T. Do, N.S. McIntyre, Surf. Sci. 382 (1997) L652-L657
[17] D.C. Lim, I.L. –Salido, R. Dietsche, M. Bubek, Y.D. Kim, Surf. Sci. 600
(2006) 507-513
[18] K. Qian, Z. Jiang, W. Huang, J. Mol. Catal. A: Chem. 264 (2007) 26-32
[19] P.M.A. Sherwood, J. Vac. Sci. Technol. A 9 (1991) 1493-1500
[20] E.D. Park, J.S. Lee, J. Catal. 186 (1999) 1-11
[21] J. Koo, S. Kim, S. Jeon, H. Jeon, Y. Kim, Y. Won, J. Korean Phys. Soc. 48
(2006) 131-136
[22] N. Bogdanchikova, A. Pestryakov, M.H. Farias, J.A. Diaz, M. Avalos, J.
Navarrete, Solid State Sci. 10 (2008) 908-914
[23] B. Hvolbaek, T.V.W. Janssens, B.S. Clausen, H. Falsig, C.H. Christensen,
J.K. Norskov, Nanotoday 2 (2007) 14-18
[24] N.M.G. Parreira, T. Polcar, A. Cavaleiro, Surface & Coatings Technology 201
(2007) 7076-7082
[25] J. Wang, W.M. Lau and Q. Li, J. Appl. Phys. 97 (2005) 114304
[26] A. Sebetci, Z.B. Guvenç, Modeling Simul. Mater. Sci. Eng. 13 (2005) 683-698
[27] T.G. Schaaff, M.N. Shafigullin, J.T. Khoury, I. Vezmar, R.L. Whetten, W.G.
Cullen, P.N. First, J. Phys. Chem. B 101 (1997) 7885-7891
Page 16 of 21
Accep
ted
Man
uscr
ipt
Page 16 of 21
Accep
ted
Man
uscr
ipt
FIGURES
536 535 534 533 532 531 530 529 528
0
4000
8000
12000
16000
20000
24000
28000
32000
Inte
nsity (
a.u
.)
B.E. (eV)
O1sO-Al
(defective site)
O-Al
7.6% Au
3.6% Au
0.6% Au
0% Au
79 78 77 76 75 74 73 72
0
1000
2000
3000
4000
5000
6000
7000
8000
Inte
nsity (
a.u
.)
B.E. (eV)
Al2pAl-O
(defective site)Al-O
7.6% Au
3.6% Au
0.6% Au
0% Au
a)
b)
Figure(s)
Page 17 of 21
Accep
ted
Man
uscr
ipt
Page 17 of 21
Accep
ted
Man
uscr
ipt
Figure 1: XPS spectra and main deconvoluted contributions of a) O 1s b) Al2p and c)
Au 4f peaks of as deposited Al-O+Au coatings with increasing Au content.
92 91 90 89 88 87 86 85 84 83 82
0
400
800
1200
1600
2000
2400
2800
3200
Inte
nsity (
a.u
.)
B.E. (eV)
0.6% Au
3.6% Au
7.6% Au
Au4fAu-Au
(bulk)
Au-Au
(cluster)
92 91 90 89 88 87 86 85 84 83 82
0
400
800
1200
1600
2000
2400
2800
3200
536 535 534 533 532 531 530 529 528
0
5000
10000
15000
20000
25000
30000
35000
40000
Sputter Time
7.6% Au
O1s
Inte
nsity (
a.u
.)
B.E. (eV)
0 sec
30 sec
60 sec
90 sec
120 sec
150 sec
O-Al
O-HO-Al
(defective site)
c)
a)
Page 18 of 21
Accep
ted
Man
uscr
ipt
Page 18 of 21
Accep
ted
Man
uscr
ipt
Figure 2: Depth profiles of a) O 1s; b) Al 2p; and c) Au 4f, XPS spectra of the AlO-
Au sample with more Au content (7.6% at. Au) as a function of ion etching time.
79 78 77 76 75 74 73 72
0
1000
2000
3000
4000
5000
6000
7000
8000
Sputter Time7.6% Au
Inte
nsity (
a.u
.)
B.E. (eV)
0 sec
30 sec
60 sec
90 sec
120 sec
150 sec
Al2pAl-O
Al-O
(defective site)
93 92 91 90 89 88 87 86 85 84 83 82
0
2000
4000
6000
8000
10000
12000
14000
16000
Sputter Time
B.E. (eV)
In
ten
sity (
a.u
.)
Au2O
3
Au(OH)3
0 sec
30 sec
60 sec
90 sec
120 sec
150 sec
7.6% Au
Au4f
Au-Au
(bulk)
Au-Au
(cluster)
93 92 91 90 89 88 87 86 85 84 83 82
0
2000
4000
6000
8000
10000
12000
14000
16000
93 92 91 90 89 88 87 86 85 84 83 82
0
2000
4000
6000
8000
10000
12000
14000
16000
93 92 91 90 89 88 87 86 85 84 83 82
0
2000
4000
6000
8000
10000
12000
14000
16000
c)
b)
Page 19 of 21
Accep
ted
Man
uscr
ipt
Page 19 of 21
Accep
ted
Man
uscr
ipt
Figure 3: Depth profiles of Au 4f XPS spectra of AlO-Au coatings with different Au
contents, a) 3.6 at.% Au b) 0.6 at.%, as a function of ion etching time.
93 92 91 90 89 88 87 86 85 84 83 82
0
300
600
900
1200
1500
1800
2100
2400
2700
3000
Sputter Time3.6% Au
Inte
nsity (
a.u
.)
B.E. (eV)
Au4f
Au-Au
(bulk)
Au-Au
(cluster)Au(OH)3
0 sec
30 sec
60 sec
90 sec
120 sec
150 sec
93 92 91 90 89 88 87 86 85 84 83 82
0
200
400
600
800
1000
1200
1400
1600
1800
2000
2200
2400
Sputter Time
Inte
nsity (
a.u
.)
B.E. (eV)
Au4fAu-Au
(cluster)Au(OH)30 sec
30 sec
60 sec
90 sec
120 sec
150 sec
0.6% Au
a)
b)
Page 20 of 21
Accep
ted
Man
uscr
ipt
Page 20 of 21
Accep
ted
Man
uscr
ipt
Figure 4: Au 4f XPS spectra for the Al-O+Au sample with 3.6% at. Au after
annealing at 400ºC and 1000ºC, as a function of ion etching time.
92 91 90 89 88 87 86 85 84 83 82
0
1000
2000
3000
4500
4750
5000
5250
5500
Sputter timeAu-Au
(bulk)
Au-Au
(cluster)
150 sec
150 sec
30 sec
30 sec
0 sec
0 sec
1000ºC
Inte
nsity (
a.u
.)
B.E. (eV)
3.6% Au
Au4f
400ºC
Page 21 of 21
Accep
ted
Man
uscr
ipt
Page 21 of 21
Accep
ted
Man
uscr
ipt
TABLES
Table I: thickness results and chemical analysis by EPMA for the Au-Al2O3 composites.
Ref.
Thickness
(μm)
Atomic % ± standard deviation
Al/O
Au Al O
AlO-19 1.0 - 36.2 ± 0.1 63.8 ± 0.1 0.57
AlO-18 1.0 0.6 ± 0.1 36.2 ± 0.1 63.1 ± 0.2 0.57
AlO-17 1.0 3.6 ± 0.1 33.1 ± 0.2 63.4 ± 0.1 0.52
AlO-16 1.6 7.6 ± 0.1 28.7 ± 0.1 63.7 ± 0.2 0.45
Table(s)