Embed Size (px)
Citation preview

15
Anuário do Instituto de Geociências - UFRJ www.anuario.igeo.ufrj.br
The Use of CloudSat Data to Characterize The Microphysical Structure of Extreme Precipitation Events over South and Southeast of Brazil
Uso dos Dados do Satélite CloudSat para Caracterização da Estrutura Microfísica de Eventos de Precipitação Extrema Sobre as Regiões Sul e Sudeste do Brasil
Bruno Muniz Duarte; José Ricardo de Almeida França & Leonardo Abreu Jorge Justo
Universidade Federal do Rio de Janeiro, IGEO/CCMN, Departamento de Meteorologia, Av. Athos da Silveira Ramos, 274, 21910-200. Rio de Janeiro, Brasil
E-mails: [email protected]; [email protected]; [email protected] em: 11/01/2018 Aprovado em: 02/01/2018
DOI: http://dx.doi.org/10.11137/2018_1_15_27
Resumo
O objetivo deste trabalho é investigar a estrutura microfísica das nuvens de eventos de precipitação extrema nas regiões sul e sudeste do Brasil. Sete casos foram estudados com dados do satélite CloudSat, através de seu radar perfilador de 94 GHz, complementados com estimativas de precipitação do satélite Aqua. Os parâmetros analisados foram: raio efetivo, conteúdo de água e concentração de partículas, cada uma para água líquida e gelo, criando um conjunto de seis variáveis. Nos aspectos gerais, os resultados revelaram eventos com predomínio de nuvens do tipo Nimbostratus, com altos valores de parâmetros de água líquida, e eventos com predomínio de nuvens Cumulonimbus, onde a presença de partículas de gelo assume papel mais importante na correlação com os extremos de precipitação. Perfis verticais no local de maior precipitação estimada foram analisados individualmente para cada caso, o que levou à separação de dois grupos de casos: Grupo A, com as maiores taxas estimadas de precipitação; e Grupo B, com as taxas relativamente menores. O Grupo A apresentou valores notadamente mais baixos para os parâmetros de água líquida na parte baixa da nuvem. Por exemplo, na altitude de 2 km, a média de raio efetivo ficou em torno de 5 µm, contra 10 µm no Grupo B. Na análise dos parâmetros de gelo, o Grupo A apresentou valores relativamente mais altos na parte alta da nuvem. O conteúdo de gelo alcançou máximos entre 1 e 1,5 gm-3, enquanto apenas um dos casos do Grupo B ultrapassou 0,5 gm-3. O topo das nuvens no Grupo A ficou em torno de 14 km, enquanto no Grupo B ficou entre 10 e 11 km. Os resultados encontrados são validados por observações obtidas em metodologias anteriores, que permitiam somente medidas locais. O CloudSat preenche os espaços, revelando a imagem completa. Será preciso expandir o número de casos estudados para que se encontre as assinaturas microfísicas de eventos extremos, e este trabalho contribui como ponto de partida para futuros estudos e até ferramentas operacionais.Palavras-chave: microfísica de nuvens; CloudSat; sensoriamento remoto; eventos extremos
Abstract
The goal of this work is to investigate the microphysical structure of clouds formed in extreme precipitation events in south and southeast of Brazil. Seven cases were studied with data from CloudSat satellite, through its 94-GHZ profiling radar, complemented by precipitation estimates from Aqua satellite. The analyzed parameters were: effective radius, water content and particle concentration, all for liquid water and ice, creating a set of six variables. In general aspects, the results revealed events containing mainly Nimbostratus (Ns), with high values of liquid parameters, and events with Cumulonimbus (Cb) predominance, where the presence of ice plays a more important role in correlating with precipitation extremes. The profiles at the location of most intense precipitation were individually analyzed for each case, which leads to a clear distinction between two groups, one with the highest precipitation-rate cases (Group A) and the other gathering the lowest-rate cases (Group B). Group A presented notably lower values of liquid water parameters in the lower portion of the cloud. For example, at an altitude of 2 km, effective radius was around 5 µm, compared to 10 µm for Group B. As for ice parameters analysis, Group A presented relatively higher values in the upper portion of the cloud. Ice water content reached peaks between 1 and 1.5 gm-3, while only one case in Group B exceeded 0.5 gm-3. Cloud tops in Group A went up to around 14 km and between 10 and 11 km in Group B. The results found are validated by observations obtained from previous methodologies, which allowed only for local measurements. CloudSat fills the gaps and unveils the entire picture. It will be necessary to expand the number of case studies in order to find actual microphysical signature of extreme events, and this paper contributes as a starting point for future works and even operational tools.Keywords: cloud microphysics; CloudSat; remote sensing; extreme events
A n u á r i o d o I n s t i t u t o d e G e o c i ê n c i a s - U F R JISSN 0101-9759 e-ISSN 1982-3908 - Vol. 41 - 1 / 2018 p. 15-27

16A n u á r i o d o I n s t i t u t o d e G e o c i ê n c i a s - U F R JISSN 0101-9759 e-ISSN 1982-3908 - Vol. 41 - 1 / 2018 p. 15-27
The Use of CloudSat Data to Characterize The Microphysical Structure of Extreme Precipitation Events over South and Southeast of BrazilBruno Muniz Duarte; José Ricardo de Almeida França & Leonardo Abreu Jorge Justo
1 Introduction
The main motivations for studying meteorology are the tragic consequences that some weather phenomena can cause, with strong winds and heavy precipitation being the most mentioned associated hazards. These are called extreme events, and the common factor to almost all of them is the presence of clouds. Therefore, it is to expect that a good understanding of what happens in the interior of these clouds should provide valuable information that later can help prevent such consequences.
When cloud physics research started benefiting from the use of aircraft, cloud structure started to be unveiled. In that sense, papers that stood out were: Warner (1955), Battan & Reitan (1957), Squires (1958), Chylek (1977), Hobbs et al. (1980), Gerber (1984), Carey et al. (2008), Khain et al. (2012) and (Wang et al., 2012).
The next stage of scientific evolution in cloud research came with remote sensing techniques, detailed by Liou (2002). Besides the visualization of large-scale cloud systems and their geographical position, satellites allowed the retrieval of small-scale parameters through advanced multispectral algorithms, making microphysical properties part of satellite products. The following authors provide greater detail on that subject: Szczodrak et al. (2001), Kawamoto et al. (2001), Duarte & França (2009) and França & Duarte (2009).
Rosenfeld et al. (2008) studied microphysical characteristics associated with severe weather, developing a conceptual model that defined a microphysical signature for convective clouds that precede tornadoes or large hail storms. The work used numerical simulations and satellite data to describe how the cloud top evolves during its vertical growth, analyzing particle effective radius, thermodynamic phase, and corresponding air temperature. It shows that large hail is favored when small particles are found at lower levels because it inhibits rain formation when the cloud is in the warm stage. Hence, most of the condensate can reach supercooled levels without having formed precipitation embryos. As updrafts get more intense, hail can grow larger inside the cloud, and tornadoes occur in supercells with extreme cases of intense updrafts (Rasmussen & Blanchard, 1998; Hamill & Church, 2000).
Before the satellites, ground radars were already used for monitoring mesoscale cloud systems (Battan & Theiss, 1972; Rogers & Yau, 1989) and they also went through an important evolution, making it possible for them to be applied to microphysical studies. As radars of millimeter wavelengths were developed, as opposed to the conventional centimeter typically operated, non-precipitating clouds could be “seen” by the sensors (Liou, 2002). In this context, NASA combined the two most common remote sensing techniques and in 2006 launched the CloudSat satellite, carrying a 94-GHz radar called Cloud Profiling Radar (CPR) (Stephens et al., 2002). The main purpose of the project is to provide information on radiation of each vertical level, a gap left by other satellites. Since the launch, CloudSat has been used by researchers in climate or mesoscale areas (Haynes & Stephens, 2007; Luo et al., 2008; Luo et al., 2009; Huang et al., 2012; Zhang et al., 2014).
Setvak et al. (2013) present one of the rare documented studies using CloudSat in Brazil and other parts of Latin America. They show a combined analysis of A-Train satellites for selected storm events, one being in western Brazil (22 December 2007) and another in Argentina/Uruguai (23 December 2009). Only the basic data were shown, not resorting to the available retrieved parameters.
This paper uses data from CloudSat satellite to characterize microphysical properties of extreme events over the south and southeast of Brazil. Aqua satellite is also used to complement the analysis with estimates of precipitation. CloudSat flies the first space-based millimeter-wavelength cloud radar, hence providing plenty and new data on large cloud systems. Therefore, a secondary goal is to evaluate how appropriate this new tool is for the proposed work.
2 Methods and Data 2.1 The CloudSat Mission and the A-Train
CloudSat is inserted in a project that involves five other polar-orbiting satellites flying in formation just a few minutes apart. This is called the A-Train Constellation (Stephens, 2002), where A stands for afternoon, indicating the period of the day that the composition crosses the Equator. All members of the A-Train Constellation are environmental

17A n u á r i o d o I n s t i t u t o d e G e o c i ê n c i a s - U F R JISSN 0101-9759 e-ISSN 1982-3908 - Vol. 41 - 1 / 2018 p. 15-27
The Use of CloudSat Data to Characterize The Microphysical Structure of Extreme Precipitation Events over South and Southeast of BrazilBruno Muniz Duarte; José Ricardo de Almeida França & Leonardo Abreu Jorge Justo
satellites that complement each other, with the purpose to build a monitoring system of the earth’s climate components and understand them in greater depth, due to growing climate change concerns. The system’s synergy has been applied to a number of studies in cloud microphysics and weather phenomena (Das et al., 2013; Setvak et al., 2013; Tourville et al., 2015).
2.2 The Cloud Profiling Radar (CPR)
The CPR, only payload instrument carried by the satellite, has a frequency of 94 GHz (W band), which was necessary to obtain the desired power without making the antenna too long. Unlike other kinds of sensors, the CPR does not scan the atmosphere horizontally, but generates a curtain, or one two-dimensional cross-section, through the atmosphere along the orbital trajectory of the satellite, with a range vertical resolution of approximately 485 m, oversampled to 240 m, and a horizontal footprint of 1.4 km (Marchand et al., 2008). The poor horizontal coverage makes it impossible to fully depict a cloud system, and a certain degree of luck is required for the satellite to pass over the system of interest and over a relevant portion of it. More details can be found on Stephens et al. (2008).
2.3 Variables and Algorithm Description
In order to microphysically characterize the selected cloud systems of this study, three quantities are used: effective radius, particle concentration and water content, all for liquid water and ice, resulting in six variables. Vertical profiles of these variables are presented for the whole satellite passage extent over the cloud system, creating a vertical cross-section image of it. All of the above estimates are contained in the Radar-Visible Optical Depth Cloud Water Content Product (2B-CWC-RVOD).
CloudSat has Radar limitations when it comes to heavy precipitation detection (Tourville et al., 2015). Therefore, the distributions of the microphysical quantities are confronted with precipitation rates provided by the AMSR-E (Advanced Microwave Scanning Radiometer-Earth Observing System) instrument (Kummerow & Ferraro, 2014), on board of Aqua satellite, which is a member of the A-Train.
Since Aqua scans the atmosphere horizontally, the closest pixels to the CloudSat trajectory are used by the algorithm, therefore it becomes a CloudSat product, and the resolution is also adjusted to match the native products. In order to refine the analysis process, individual soundings for each variable at the coordinates where precipitation rates are highest are shown.
It is important to highlight here one aspect of the product algorithm that will affect the visualization of the variables and their interpretation. The CloudSat Process Description Document for the product used in this work (CloudSat Data Processing Document, 2008) explains that at temperatures above 0°C all present water is considered liquid, while below temperatures of -20°C all water is considered to be ice. In the 0 to -20°C interval the two profiles are combined through a simple (linear) interpolation based on temperature, such that liquid content gradually disappears at -20°C and ice gradually disappears at 0°C. For this reason, cross sections shown in the next chapter are abruptly interrupted when these limits are reached.
Since the CloudSat mission goal is to retrieve clouds microphysical parameters, the algorithm has to include some sort of filter to prevent precipitation drops from entering the profiles. Currently, it uses a simple method that considers reflectivity returns greater than -15 dBZ likely to be drizzle or rain. The profile is not discarded but is given a flag indicating that precipitation is possibly occurring. However, in practice, the presence of any significant precipitation often causes the retrieval to fail to converge, resulting in an error condition (CloudSat Data Processing Document, 2008). Precipitation-sized particles imply in a deviation from the previously assumed log-normal distribution for particle concentration.
2.4 Events
The seven case studies analyzed in the present work and presented below were preferentially selected from “Climanálise” bulletins, issued every month by the Center for Weather Prediction and Climate Studies/National Institute for Space Research (CPTEC/INPE) on http://climanalise.cptec.inpe.br/~rclimanl/boletim/. The south and southeast regions of Brazil were chosen due to population concentration in this part of the country,

18A n u á r i o d o I n s t i t u t o d e G e o c i ê n c i a s - U F R JISSN 0101-9759 e-ISSN 1982-3908 - Vol. 41 - 1 / 2018 p. 15-27
The Use of CloudSat Data to Characterize The Microphysical Structure of Extreme Precipitation Events over South and Southeast of BrazilBruno Muniz Duarte; José Ricardo de Almeida França & Leonardo Abreu Jorge Justo
a contributing factor for extreme events to produce more damage. These documents highlight the most significant precipitation-related events for the particular month, among other meteorological aspects. Thus, no quantitative criteria were used to classify an extreme event. All reports of precipitation quantity mentioned in the cases below were extracted from the Climanálise bulletins. This section describes each case study with essential information on synoptic environment in which the mesoscale phenomena were embedded. The synoptic charts referred to below (not shown) were obtained from the Navy Hydrography Center - Marine Meteorological Service of Brazil.
2.4.1 Case 1 - 20 August 2007
The weather system of the first case was the only one located almost entirely over the ocean, drifting from the initial proposal, and hence no information available from Climanálise. However, since it was a well-configured extratropical cyclone, it was thought to be a good opportunity to characterize this sort of phenomenon with CloudSat. The satellite passed over the cyclone at 0425UTC and the synoptic chart from 1200UTC depicts a 1000 hPa low-pressure system with the associated cold, warm and occluded fronts. Figure 1a shows the GOES infrared image from 0415UTC and the poleward trajectory of CloudSat.
2.4.2 Case 2 - 09 November 2007
A low-pressure region evolving into a frontal system was the synoptic environment when CloudSat passed over south of Brazil at 0505UTC. The synoptic charts from 0000UTC and 1200UTC show the deepening process, and a cold front is identified at 1200UTC. The infrared image from 0515UTC (Figure 1b) shows a not yet organized area of instability with deep convection clouds and cirrus on the CPR path.
This system caused a precipitation amount of 75.2 mm throughout the day in the city of Ivaí, PR; 86.6 mm in Londrina, PR; and 100 mm in Campo Mourão, PR. Additionally, a station in the city of Passo Fundo, RS, recorded gusts of up to 120 km/h and power outage.
2.4.3 Case 3 - 13 March 2008
At 0430UTC, CloudSat intercepted an area of instability over the state of São Paulo, southeast of Brazil. The synoptic charts of 0000UTC and 1200UTC show a cold front located in the Atlantic Ocean coupling with a low-pressure system over the continent. Figure 1c identifies the position of the mesoscale system with the infrared image from 0500UTC, suggesting its development in a pre-frontal environment.
Weather stations recorded amounts of 123.2 mm of precipitation in Iguapé, SP and 84 mm in Guarulhos, SP, between March 13th and March 14th, and on the following days, the synoptic picture evolved into a South Atlantic Convergence Zone (SACZ).
2.4.4 Case 4 - 09 June 2008
The edge of an extratropical cyclone hit the state of Rio Grande do Sul, the southernmost state of Brazil, causing damage to the capital, Porto Alegre, RS. Unroofing and falling trees were some of the consequences that strong winds brought to the city, as reported by the Climanálise bulletin. The recorded value at the airport weather station was 72 km/h at 2347UTC and the 10 June 0000UTC synoptic chart identifies the system close to the shore. The CloudSat passage (at 1730UTC) was not exactly over Porto Alegre, but near enough to capture some of the mesoscale activities associated with the system. Figure 1d shows the equatorward trajectory of CloudSat with the infrared image on the background.
2.4.5 Case 5 - 03 January 2009
A frontogenesis associated with a low-pressure system influenced the weather of south and southeast of Brazil on this day. CloudSat passed over the state of Rio Grande do Sul at 1735UTC and encountered formations, as can be seen on Figure 1e that shows the infrared image from 1745UTC and the CloudSat trajectory overlapped. The image also shows that the clouds of such formations appear with little brightness, indicating relatively warm tops and moderate vertical development, that is, no thunderstorms. CloudSat provides a cloud

19A n u á r i o d o I n s t i t u t o d e G e o c i ê n c i a s - U F R JISSN 0101-9759 e-ISSN 1982-3908 - Vol. 41 - 1 / 2018 p. 15-27
The Use of CloudSat Data to Characterize The Microphysical Structure of Extreme Precipitation Events over South and Southeast of BrazilBruno Muniz Duarte; José Ricardo de Almeida França & Leonardo Abreu Jorge Justo
classification product (Wang et al., 2011), which, coherently, identifies most of the clouds of this system as nimbostratus. The city of Torres, RS, approximately 300 km from the CloudSat trajectory, recorded an amount of 108 mm of precipitation between January 3rd and January 4th, and observation from the Porto Alegre airport weather station shows continuous light to moderate rain from 2200UTC of January 2nd to 0800UTC of January 4th. Such persistence explains the amount recorded since there were no significant vertical development clouds.
2.4.6 Case 6 - 21 January 2010
The event described in this case happened in the state of São Paulo at the same location as the one from case 3. The synoptic analysis is also similar, as a cold front was approaching the southeast of Brazil and mesoscale instabilities were being triggered in the pre-frontal environment. The CloudSat passage was at 0445UTC and the synoptic charts from 0000UTC and 1200UTC, as well as the infrared image of 0430UTC (Figure 1f) illustrate the conditions.
The Climanálise bulletin for this period only informs that amounts greater than 100 mm were recorded in weather stations of São Paulo, SP but does not give further details about damages or exact quantities.
2.4.7 Case 7 - 06 April 2010
In this case, a cold front over the state of Espírito Santo still influenced the weather in the city of Rio de Janeiro, where the system had passed a couple of days before. The amount of precipitation between April 5th and April 6th exceeded 300 mm, one of the greatest historical records of the city. After 36 hours of continuous moderate to heavy rain, the result was the occurrence of many mudslides that caused over 250 fatalities and 10,800 left homeless. Besides, generalized floods affected the daily life of all citizens.
CloudSat flew over Rio de Janeiro at 0424UTC and the amount of precipitation at one of the city’s rainfall stations from 0335UTC and 0435UTC was 21.6 mm. The infrared image shown in Figure 1g reveals that the most vertically developed clouds had, in fact, moved northeast and the predominant formations over Rio de Janeiro were lower-topped
clouds, confirmed by the absence of thunderstorm observations from the airport station throughout the entire precipitation period. However, the CloudSat product classified most of the system as deep convection, suggesting a possible mix of nimbostratus and towering cumulus.
3 Results and Discussion3.1 Vertical Cross Sections and General Aspects
This section presents the CloudSat vertical cross sections of each microphysical quantity for case 2 (Figure 2), along with precipitation rates estimated by the AMSR-E product. A discussion of general aspects applied to all cases then follows. It is important to remember the mixed phase limitation mentioned in section 2.3, which produces the abrupt interruptions of data and can affect the reliability of the 0°C to -20°C range.
The AMSR-E methodology was unable to detect precipitation rates for case 5, in spite of continuous records in nearby surface stations. Synoptic conditions favored the occurrence of rain in extensive areas, therefore such inability can be explained by the fact that AMSR-E precipitation detection is based on brightness temperature (Kummerow & Ferraro, 2014), a method best suited for convective rain, which was not the case for this event.
According to the CloudSat classification product (not shown), cases 4 and 5 were the only ones with nimbostratus predominance, while case 3 exhibits a clear division between nimbostratus and deep convection clouds. All other cases presented deep convection predominance. The highest rates of precipitation in the studied cases are associated with deep convection, which corroborates with the AMSR-E methodology not being able to detect precipitation from nimbostratus or stratiform clouds.
Since there were three cases (3, 4 and 5) with nimbostratus predominance, it was possible to gather some microphysical characteristics of these formations when linked to extreme events. All cross sections of parameters for liquid water displayed relative maxima well marked below the -20°C isotherm. In those regions, particle concentration was in the 90-100 cm-3 range in cases 4 and 5, and a little lower in case 3 (80-90 cm-3 range). As for

20A n u á r i o d o I n s t i t u t o d e G e o c i ê n c i a s - U F R JISSN 0101-9759 e-ISSN 1982-3908 - Vol. 41 - 1 / 2018 p. 15-27
The Use of CloudSat Data to Characterize The Microphysical Structure of Extreme Precipitation Events over South and Southeast of BrazilBruno Muniz Duarte; José Ricardo de Almeida França & Leonardo Abreu Jorge Justo
liquid water content (LWC), the referred maxima varied from 0.5 gm-3 in case 3, 1.2 gm-3 in case 4 and 1.6 gm-3 in case 5. Particle concentration and LWC presented their maximum along the 0°C isotherm, while particle effective radius maximum location tended to follow cloud top height. Where cloud tops are relatively low, such maxima appear between 0 and -10°C, and for higher cloud tops, between -10 and -20°C. This is probably due to more active updrafts inside the cloud. In case 3, effective radius maximum reached 18 µm, while in cases 4 and 5 they were found in the 20-22 µm interval. Ice parameters showed low values with little variation for the nimbostratus cases, especially particle concentration and ice content.
It is interesting to note that the cloud classification product does not take into account microphysical properties of the cloud. Hence, the pattern found for the cases studied here could complement future classification methods. The current CloudSat product considers parameters like cloud base and top heights, optical thickness, the presence of ice and surface precipitation. The method also uses the aid of the Light Detection and Ranging (LIDAR) on board of CALIPSO satellite, member of the A-Train constellation which passes 15 seconds after CloudSat.
A general aspect of deep convection cases to be highlighted here is that maximum cores for
Figure 1 GOES Infrared images showing the cloud system and the trajectory of CloudSat for cases 1(A) to 7(G).

21A n u á r i o d o I n s t i t u t o d e G e o c i ê n c i a s - U F R JISSN 0101-9759 e-ISSN 1982-3908 - Vol. 41 - 1 / 2018 p. 15-27
The Use of CloudSat Data to Characterize The Microphysical Structure of Extreme Precipitation Events over South and Southeast of BrazilBruno Muniz Duarte; José Ricardo de Almeida França & Leonardo Abreu Jorge Justo
Figure 2 (A) to (F): Vertical
cross sections showing the distribution of the
microphysical parameters for case 2 (09 November
2007) and precipitation rate estimated by the AMSR-E sensor for
CloudSat’s trajectory (G).

22A n u á r i o d o I n s t i t u t o d e G e o c i ê n c i a s - U F R JISSN 0101-9759 e-ISSN 1982-3908 - Vol. 41 - 1 / 2018 p. 15-27
The Use of CloudSat Data to Characterize The Microphysical Structure of Extreme Precipitation Events over South and Southeast of BrazilBruno Muniz Duarte; José Ricardo de Almeida França & Leonardo Abreu Jorge Justo
each ice parameter tended to be positioned into a specific portion of the cloud. Effective radii showed higher values on the lowest part of the graph (right above 0°C isotherm), ranging from 130 to 160 µm, while ice concentration maxima were located near cloud tops, with values ranging from 370 to 600 L-1, approximately. Ice water content (IWC) cores settled in the central portion, between -20 and -50°C and its cores’ values ranged from 0.8 to 2 gm-3.
Turning the analysis more specifically to extreme events, now we consider how microphysical parameters behave at the positions where the highest precipitation rates are found. The first thing to notice is the importance of significant presence of ice particles to establish the preferential position of highest rates since in all cases the position of the main precipitation peak coincided with relative or absolute maxima of ice parameters. Another favorable structure that seems to be correlated with high precipitation rates is the concomitant presence of liquid water and ice maximum cores. In case 2, for instance, the highest values of droplet effective radius are on the same vertical axis of the maximum cores of ice effective radius (Figure 2). Although less significant, a relative maximum of droplet concentration and LWC are also observed in the same axis. Other cases follow this tendency and it is also
noticeable that regions of high ice parameters values that do not meet a maximum of liquid water values lead to little or non-observed detected precipitation.
CloudSat results for LWC values at high precipitation rate locations seemed to be lower than expected, with maximum found between 1.5 and 1.6 gm-3, associated with nimbostratus clouds. According to Heymsfield & Musil (1982), cumuliform deep convection clouds can reach LWC values twice as high, but our results for this cloud type showed maxima of fewer than 1 gm-3. Such discrepancy still requires research to be explained, but could be related to the cloud development stage or the presence of precipitation-induced downdrafts
3.2 Individual Vertical Profiles
In order to deepen the analysis of clouds that trigger extreme conditions of precipitation, a local approach is now considered by taking the individual vertical profile of the highest precipitation peak for each case. The results are shown in Figure 3 for liquid water parameters and in Figure 4 for ice parameters. Naturally, since the CloudSat product did not detect any precipitation for case 5, it is not included in this analysis, making it a total of six cases.
Figure 3 Vertical profiles of each parameter at the location where the highest precipitation rate was detected in each case along CloudSat’s trajectory. (A) Droplet effective radius (B) droplet number concentration and (C) liquid water content.

23A n u á r i o d o I n s t i t u t o d e G e o c i ê n c i a s - U F R JISSN 0101-9759 e-ISSN 1982-3908 - Vol. 41 - 1 / 2018 p. 15-27
The Use of CloudSat Data to Characterize The Microphysical Structure of Extreme Precipitation Events over South and Southeast of BrazilBruno Muniz Duarte; José Ricardo de Almeida França & Leonardo Abreu Jorge Justo
Before interpreting Figures 3 and 4, it is worth to highlight the approximate values of precipitation rate for the six cases. They are displayed in Table 1.
In Figures 3 and 4 it is possible to distinguish two clear groups of profiles, one formed by cases 2 (09 November 2007), 3 (13 March 2008) and 6 (21 January 2010), and another formed by cases 1 (20 August 2007), 4 (09 June 2008) and 7 (06 April 2010). Looking now at Table 1, one can notice that such separation coincides with the cases with highest and lowest precipitation rates. The first group, hereafter called Group A, consists of the highest values (10, 14 and 18 mm/h) and highest cloud tops, while the other, hereafter called Group B, gathers the cases with lowest rates (4, 4 and 7 mm/h) and lowest cloud tops. Using this distinction, the microphysical characteristics of each group can be assessed separately.
Case Highest precipitation rates (mmh-1)1 – 20 Aug 2007 72 – 09 Nov 2007 183 – 13 Mar 2008 144 – 09 Jun 2008 46 – 21 Jan 2010 107 – 06 Apr 2010 4
Table 1 Approximate values of the highest precipitation rates detected in each studied case.
The profiles of Group A show lower values of liquid water parameters compared to Group B, suggesting the influence of updrafts to decrease the amount of liquid particles at levels near cloud base (concentration and mass), as well as the size of the existing ones. The profile of case 2, event for which the highest precipitation rate was detected, displays a pronounced minimum in all three parameters of liquid water at around 2 km of height. High values of ice parameters at upper levels confirm the importance of microphysical processes of ice in generating heavy precipitation.
Groups A and B show the same pattern for droplet effective radius (Figure 3a), with Group A dislocated about 5 µm to the lower values. The particles increase in size with height and tend to stabilize in the last kilometers. The ice effective radius of both groups appear mixed at lower levels (Figure 4a), however, Group B presents a sharp decline after 6 km of height, while Group A decreases more smoothly and reaches higher altitudes. Droplet concentration of Group B starts the profile at 70 cm-3 at cloud base and increases with height until it reaches a critical point (3 km for cases 1 and 4; 4.5 km for case 7) where values decrease rapidly. Group A starts the profile at around 50 cm-3 (except case 2, which started at 60 cm-3 due to the minimum at 2 km) until mixing with Group B profiles at between
Figure 4 Vertical profiles of each
parameter at the location where the
highest precipitation rate was detected
in each case along CloudSat’s
trajectory. (A) Ice particle effective
radius (B)ice particle number
concentration and (C) ice water
content.

24A n u á r i o d o I n s t i t u t o d e G e o c i ê n c i a s - U F R JISSN 0101-9759 e-ISSN 1982-3908 - Vol. 41 - 1 / 2018 p. 15-27
The Use of CloudSat Data to Characterize The Microphysical Structure of Extreme Precipitation Events over South and Southeast of BrazilBruno Muniz Duarte; José Ricardo de Almeida França & Leonardo Abreu Jorge Justo
4.5 and 5 km (Figure 3b). Ice particle concentration profiles of Groups A and B (Figure 4b) show linear increase and stabilization at around 7 km for Group B and 12 Km for Group A (except for case 2, which presents intermediate characteristics). LWC profiles of Group A start with very low values at cloud base until around 3 km, after which there is a slight increase to a maximum of approximately 0.17 gm-3 at 5 km, then decreasing again after 6 km height (Figure 3c). Group B presented a less uniform pattern, such that the only common characteristic is the sharp decline after a critical height. IWC profiles increase values with height until a certain level where Group A stabilizes and then decreases and Group B decreases immediately (Figure 4c). The height of such level varied significantly among the cases, making the maximum value the distinctive factor. In Group A values exceeded 1 gm-3, while 0.6 gm-3 was never reached in Group B.
Before finishing the results discussion, two cases deserve a little more attention. First, case 1 and the fact that it occurred over the ocean. The theory states that low availability of condensation nuclei over maritime surfaces leads to larger droplets, and the comparison among the profiles of droplet effective radius in Figure 3a shows that case 1 has the highest values. In order to correctly assess this aspect of the result, the comparison should be made with clouds of the same LWC; however, this indicates the good reliability of CloudSat data.
The other highlight is case 7, which also presented unique characteristics. The vertical cross sections show lower and more irregular cloud tops, compared to the other six cases. Protuberances can be observed, and these may be related to more intense local updrafts, which would reaffirm the deep convection classification given by the CloudSat product (not shown), despite the relatively low cloud tops. However, characteristics of stratiform clouds, like nimbostratus, are also present: high values of liquid water parameters at low levels and low precipitation rate detected by AMSR-E and surface stations (coherent with the typical moderate and continuous precipitation from nimbostratus).
3.3 The Attenuation Problem
It was said in chapter 2 that the presence of precipitation would cause problems for the retrieval
of cloud properties, due to the high sensitivity of the radar to precipitation-sized particles, a characteristic inherent to the frequency of 94GHz used by the CPR.
Such problems, in the form of attenuation of the signal, may explain one of the main features seen in the profiles, as the example of Figure 5 suggests. It shows the reflectivity signals for case 1, where a clear attenuation can be seen near the surface of the regions that coincide with higher precipitation peaks from the AMSR-E product. The dashed line marks the 10 dbZ threshold, which is part of the filter applied by Justo & França (2016) to detect compromised signals due to precipitation from deep convection or Nimbostratus clouds, and the individual profile from case 1 used in Figures 3 and 4 fall under the filtered area. Therefore, attenuation by precipitating particles is thought to be a significant contributing factor to account for the low level reduction of liquid water parameters of cases with highest AMSR-E precipitation rates.
4. Conclusions
The present paper uses CloudSat satellite data to investigate microphysical characteristics of clouds associated with extreme precipitation events. Along with its trajectory, CloudSat provides continuous vertical profiles of many microphysical parameters and it is the state-of-the-art remote sensing tool for wide range cloud studies. Two specific objectives have been proposed in this study, and this section discusses how much was achieved for each one.
(a) Microphysical characteristics. The first one refers to the physical and microphysical characteristics of extreme precipitation events occurring in the south and southeast regions of Brazil. Through the 7 studied cases, CloudSat data managed to detect specific features for two distinct types of precipitation events: moderate continuous rain (nimbostratus) and deep convection (cumulonimbus).
Systems with nimbostratus predominance have high values of all liquid water parameters: particle effective radius, particle concentration, and LWC. Concentration and LWC core regions were found near the 0°C isotherm, while effective radius maxima could be found above, following spatial variation of the cloud tops. Precipitation rates from

25A n u á r i o d o I n s t i t u t o d e G e o c i ê n c i a s - U F R JISSN 0101-9759 e-ISSN 1982-3908 - Vol. 41 - 1 / 2018 p. 15-27
The Use of CloudSat Data to Characterize The Microphysical Structure of Extreme Precipitation Events over South and Southeast of BrazilBruno Muniz Duarte; José Ricardo de Almeida França & Leonardo Abreu Jorge Justo
the AMSR-E sensor (on board of Aqua satellite, also a member of the A-Train) were not significant, which could be related to the fact that its algorithm uses brightness temperature to infer the values.
For deep convection events, the ice parameters played a more important role. Strong updrafts inherent to these formations prevent liquid water from accumulating at lower levels, but one could possibly find high values of effective radius, concentration, and LWC at heights above the -20°C isotherm, which is the CloudSat upper limit for these parameters. The ice parameters structure for cumulonimbus shows core regions of effective radius near the 0°C isotherm, while ice concentration maxima are found near cloud top, with IWC nuclei in between.
Vertical profiles at the location of the highest precipitation rate were also prepared for each parameter. With the profiles displayed together, it became possible to distinguish two groups of cases, one with the highest precipitation rates (Group A) e one with the lowest rates (Group B). Compared to Group B, Group A showed the following tendencies: higher cloud tops; lower values of liquid water parameters at lower levels; higher values of ice parameters at mid and higher levels of the cloud.
The next steps suggested for this particular objective include: vertical profiles for different regions of the system other than the highest precipitation rate location, with temperature or pressure as vertical coordinate; use of vertical velocity estimates in order to infer the cloud development stage (other methods, such as numerical modeling); comparing CloudSat data with MODIS data, taking advantage of the A-Train constellation. In addition, the spatial and temporal variability of cloud systems that generate intense precipitation are very large, especially deep convection, such that the few cases analyzed here cannot be said to be representative of an average microphysical structure, both qualitatively and quantitatively. However, this does not make the results obtained here any less valuable, for it is the first attempt to depict microphysical properties of extreme events in south and southeast of Brazil. Therefore, more cases need to be studied in order to expand the data base and find actual microphysical signatures of these systems in these regions.
(b) CloudSat potential. The second objective aims to assess how suitable CloudSat can be for microphysical studies of mesoscale events. The results above show the innovative features of CloudSat products, as the CPR is the only satellite-boarded instrument capable of providing continuous
Figure 5 (A): Radar reflectivity for case 1. (B): AMSR-E precipitation and reflectivity near the surface.
26A n u á r i o d o I n s t i t u t o d e G e o c i ê n c i a s - U F R JISSN 0101-9759 e-ISSN 1982-3908 - Vol. 41 - 1 / 2018 p. 15-27
The Use of CloudSat Data to Characterize The Microphysical Structure of Extreme Precipitation Events over South and Southeast of BrazilBruno Muniz Duarte; José Ricardo de Almeida França & Leonardo Abreu Jorge Justo
vertical profiles along its track. The generated cross sections can help visualize regions of maxima and minimum, cloud top and base, the degree of cloud stratification, among other general characteristics of the system’s structure. Overall, the microphysical properties found in this study fell within what was expected from previous studies using other means of observation, giving consistency and reliability to CloudSat data. Such previous methods are only capable of measuring parameters locally or with poor resolution. The CloudSat method comes to fill the gaps, allowing for the entire picture to be seen, reducing interpolations and parameters estimates.
Regarding the limitations, it is important to highlight the algorithm’s poor treatment for the interval between 0°C and -20°C. If a specific study needs accurate information on water phase in this temperature range, CloudSat may not be enough for taking satisfying conclusions. However, for an overview assessment of a cloud system, it contributes a lot for microphysical structure knowledge, because the assumed condition is usually true.
Lastly, this sudden increase in cloud data brought by CloudSat, followed by the results of this study, certainly contributes for the future development of operational microphysical products to be used daily in meteorological offices. Such implementation would improve the quality of short- and mid-term forecasts, mitigating the effects of extreme precipitation events.
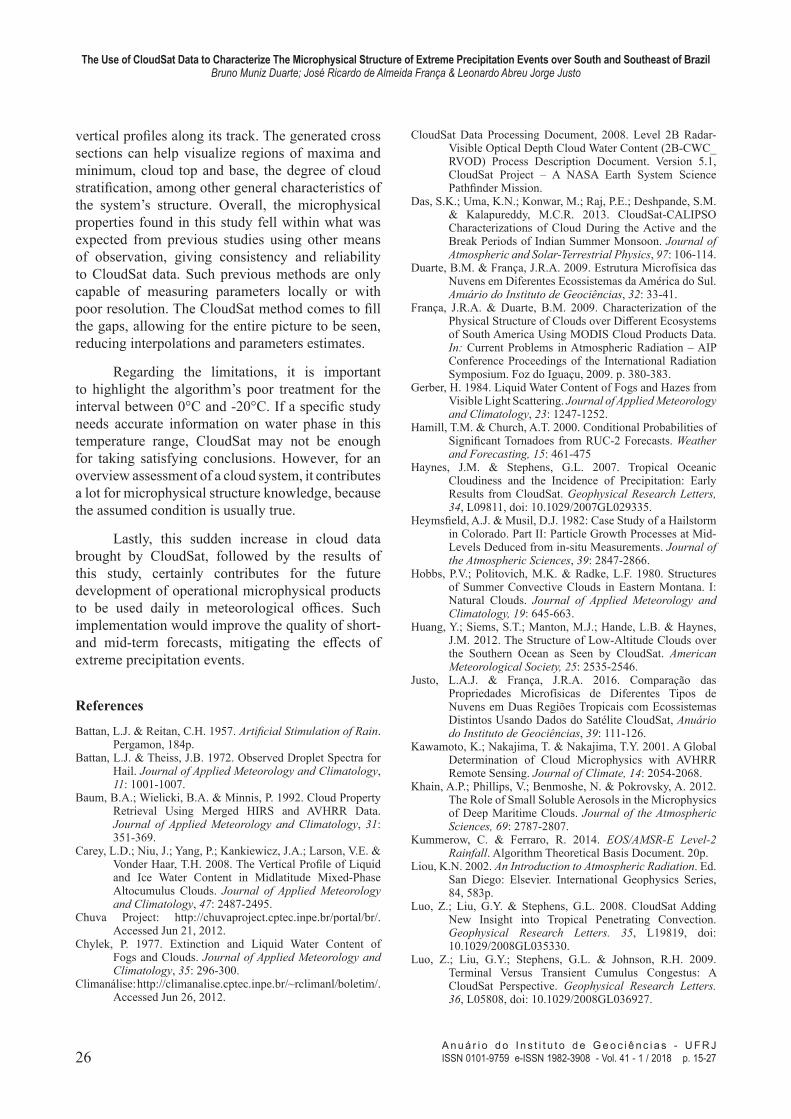
References
Battan, L.J. & Reitan, C.H. 1957. Artificial Stimulation of Rain. Pergamon, 184p.
Battan, L.J. & Theiss, J.B. 1972. Observed Droplet Spectra for Hail. Journal of Applied Meteorology and Climatology, 11: 1001-1007.
Baum, B.A.; Wielicki, B.A. & Minnis, P. 1992. Cloud Property Retrieval Using Merged HIRS and AVHRR Data. Journal of Applied Meteorology and Climatology, 31: 351-369.
Carey, L.D.; Niu, J.; Yang, P.; Kankiewicz, J.A.; Larson, V.E. & Vonder Haar, T.H. 2008. The Vertical Profile of Liquid and Ice Water Content in Midlatitude Mixed-Phase Altocumulus Clouds. Journal of Applied Meteorology and Climatology, 47: 2487-2495.
Chuva Project: http://chuvaproject.cptec.inpe.br/portal/br/. Accessed Jun 21, 2012.
Chylek, P. 1977. Extinction and Liquid Water Content of Fogs and Clouds. Journal of Applied Meteorology and Climatology, 35: 296-300.
Climanálise: http://climanalise.cptec.inpe.br/~rclimanl/boletim/. Accessed Jun 26, 2012.
CloudSat Data Processing Document, 2008. Level 2B Radar-Visible Optical Depth Cloud Water Content (2B-CWC_RVOD) Process Description Document. Version 5.1, CloudSat Project – A NASA Earth System Science Pathfinder Mission.
Das, S.K.; Uma, K.N.; Konwar, M.; Raj, P.E.; Deshpande, S.M. & Kalapureddy, M.C.R. 2013. CloudSat-CALIPSO Characterizations of Cloud During the Active and the Break Periods of Indian Summer Monsoon. Journal of Atmospheric and Solar-Terrestrial Physics, 97: 106-114.
Duarte, B.M. & França, J.R.A. 2009. Estrutura Microfísica das Nuvens em Diferentes Ecossistemas da América do Sul. Anuário do Instituto de Geociências, 32: 33-41.
França, J.R.A. & Duarte, B.M. 2009. Characterization of the Physical Structure of Clouds over Different Ecosystems of South America Using MODIS Cloud Products Data. In: Current Problems in Atmospheric Radiation – AIP Conference Proceedings of the International Radiation Symposium. Foz do Iguaçu, 2009. p. 380-383.
Gerber, H. 1984. Liquid Water Content of Fogs and Hazes from Visible Light Scattering. Journal of Applied Meteorology and Climatology, 23: 1247-1252.
Hamill, T.M. & Church, A.T. 2000. Conditional Probabilities of Significant Tornadoes from RUC-2 Forecasts. Weather and Forecasting, 15: 461-475
Haynes, J.M. & Stephens, G.L. 2007. Tropical Oceanic Cloudiness and the Incidence of Precipitation: Early Results from CloudSat. Geophysical Research Letters, 34, L09811, doi: 10.1029/2007GL029335.
Heymsfield, A.J. & Musil, D.J. 1982: Case Study of a Hailstorm in Colorado. Part II: Particle Growth Processes at Mid-Levels Deduced from in-situ Measurements. Journal of the Atmospheric Sciences, 39: 2847-2866.
Hobbs, P.V.; Politovich, M.K. & Radke, L.F. 1980. Structures of Summer Convective Clouds in Eastern Montana. I: Natural Clouds. Journal of Applied Meteorology and Climatology, 19: 645-663.
Huang, Y.; Siems, S.T.; Manton, M.J.; Hande, L.B. & Haynes, J.M. 2012. The Structure of Low-Altitude Clouds over the Southern Ocean as Seen by CloudSat. American Meteorological Society, 25: 2535-2546.
Justo, L.A.J. & França, J.R.A. 2016. Comparação das Propriedades Microfísicas de Diferentes Tipos de Nuvens em Duas Regiões Tropicais com Ecossistemas Distintos Usando Dados do Satélite CloudSat, Anuário do Instituto de Geociências, 39: 111-126.
Kawamoto, K.; Nakajima, T. & Nakajima, T.Y. 2001. A Global Determination of Cloud Microphysics with AVHRR Remote Sensing. Journal of Climate, 14: 2054-2068.
Khain, A.P.; Phillips, V.; Benmoshe, N. & Pokrovsky, A. 2012. The Role of Small Soluble Aerosols in the Microphysics of Deep Maritime Clouds. Journal of the Atmospheric Sciences, 69: 2787-2807.
Kummerow, C. & Ferraro, R. 2014. EOS/AMSR-E Level-2 Rainfall. Algorithm Theoretical Basis Document. 20p.
Liou, K.N. 2002. An Introduction to Atmospheric Radiation. Ed. San Diego: Elsevier. International Geophysics Series, 84, 583p.
Luo, Z.; Liu, G.Y. & Stephens, G.L. 2008. CloudSat Adding New Insight into Tropical Penetrating Convection. Geophysical Research Letters. 35, L19819, doi: 10.1029/2008GL035330.
Luo, Z.; Liu, G.Y.; Stephens, G.L. & Johnson, R.H. 2009. Terminal Versus Transient Cumulus Congestus: A CloudSat Perspective. Geophysical Research Letters. 36, L05808, doi: 10.1029/2008GL036927.

27A n u á r i o d o I n s t i t u t o d e G e o c i ê n c i a s - U F R JISSN 0101-9759 e-ISSN 1982-3908 - Vol. 41 - 1 / 2018 p. 15-27
The Use of CloudSat Data to Characterize The Microphysical Structure of Extreme Precipitation Events over South and Southeast of BrazilBruno Muniz Duarte; José Ricardo de Almeida França & Leonardo Abreu Jorge Justo
Marchand, R.; Mace, G.G.; Ackerman, T. & Stephens, G. 2008. Hydrometeor Detection Using Cloudsat – An Earth-Orbiting 94-GHz Cloud Radar. Journal of Atmospheric and Oceanic Technology, 25: 519-533.
Rasmussen, E.N. & Blanchard, D.O. 1998. A Baseline Climatology of Sounding-Derived Supercell and Tornado Forecast Parameters. Weather and Forecasting, 13: 1148-1164.
Rogers, R.R. & Yau, M.K. 1989. A Short Course in Cloud Physics. International Series in Natural Philosophy, Butterworth-Heinemann, third edition, 113, 290p.
Rosenfeld, D.; Woodley, W.L.; Lerner, A.; Kelman, G. & Lindsey, D.T. 2008. Satellite Detection of Severe Convective Storms by their Retrieved Vertical Profiles of Cloud Particle Effective Radius and Thermodynamic Phase. Journal of Geophysical Research. 113, D04208, doi: 10.1029/2007JD008600.
Setvak, M.; Bedka, K.; Lindsey, D.T.; Sokol, A.; Charvat, Z.; St’astka, J. & Wang, P.K. 2013. A-Train Observations of Deep Convective Storm Tops. Atmos. Res., 123: 229-248.
Squires, P. 1958. The Microstructure and Colloidal Stability of Warm Clouds. Tellus, 10: 256-271.
Stephens, G.L.; Vane, D.G.; Boain, R.J.; Mace, G.G.; Sassen, K.; Wang, Z.; Illingworth, A.J.; O’connor, E.J.; Rossow, W.B.; Durden, S.L.; Miller, S.D.; Austin, R.T.; Benedetti, A. & Mitrescu, C. 2002. The CloudSat and the A-Train Mission – A New Dimension of Space-Based Observations of Clouds and Precipitation. Bulletin of the American Meteorological Society, 83: 1771-1790.
Stephens, G.L.; Vane, D.G.; Tanelli, S.; Im, E.; Durden, S.;
Rokey, M.; Reinke, D.; Partain, P.; Mace, G.G.; Austin, R.; L’ Ecuyer, T.; Haynes, J.; Lebsock, M.; Suzuki, K.; Waliser, D.; Wu, D.; Kay, J.; Gettelman, A.; Wang, Z. & Marchand, R. 2008. CloudSat Mission: Performance and Early Science After the First Year of Operation. Journal of Geophysical Research. 113, D00A18, doi:10.1029/2008JD009982.
Szczodrak, M.; Austin, P.H. & Krummel, P.B. 2001. Variability of Optical Depth and Effective Radius in Marine Stratocumulus Clouds. Journal of the Atmospheric Sciences, 58: 2912-2926.
Tourville, N.; Stephens, G.; De Maria, M. & Vane, D. 2015. Remote Sensing of Tropical Cyclones – Observations from CloudSat and A-Train Profilers. Bulletin of the American Meteorological Society, 96: 609-622.
Wang, Z.; French, J.; Vali, G.; Wechsler, P.; Haimov, S.; Rodi, A.; Deng, M.; Leon, D.; Snider, J.; Peng, L. & Pazmany, A.L. 2012. Single Aircraft Integration of Remote-Sensing and In Situ Sampling for the Study of Cloud Microphysics and Dynamics. Bulletin of the American Meteorological Society, 93: 653-668.
Warner, J. 1955. The Water Content of Cumuliform Cloud. Tellus. 7: 449-457.
Zhang, D.; Luo, T.; Liu, D. & Wang, Z. 2013. Spatial Scales of Altocumulus Clouds Observed with Collocated CALIPSO and CloudSat Measurements. Atmospheric Research, 149: 58-69.
Zuidema, P. & Hartmann, D.L. 1995. Satellite Determination of Stratus Cloud Microphysical Properties. Journal of Climate, 8: 1638-1657.