Embed Size (px)
Citation preview
UNIVERSIDADE FEDERAL DO RIO GRANDE
INSTITUTO DE OCEANOGRAFIA PROGRAMA DE PÓS-GRADUAÇÃO EM OCEANOGRAFIA
BIOLÓGICA
AVALIAÇÃO DO COMPORTAMENTO OSMORREGULATÓRIO DA TAINHA Mugil
liza: IMPLICAÇÕES PARA SUA PRODUÇÃO EM CATIVEIRO
VIVIANA LISBOA DA CUNHA
Tese apresentada ao Programa
de Pós Graduação em
Oceanografia Biológica da
Universidade Federal do Rio
Grande, como requisito parcial à
obtenção do título de DOUTOR.
Orientador: ADALTO BIANCHINI
RIO GRANDE Dezembro, 2012

ii
DEDICATÓRIA
Dedico esta tese a pessoa que tive a bênção de ter como avó; “Tantas querida”. (in memonriam).
iii
AGRADECIMENTOS
Ao meu orientador, professor Adalto Bianchini, que no decorrer desses anos me tornou
uma pessoa melhor.
Aos membros da banca, por terem aceitado o convite e pela colaboração para o
aprimoramento desta tese.
Agradeço ao curso de Pós Graduação em Oceanografia Biológica, por ter me dado a
oportunidade de cursar o doutorado.
Ao CNPq, Capes e Ministério da Pesca e Aquicultura, por terem possibilitado a minha
dedicação aos estudos.
Aos amigos do grupo de pesquisa Piscicultura Estuarina e Marinha, do Projeto Camarão
e do Laboratório de Piscicultura Estuarina e Marinha que tenho o prazer de conviver.
A meus amigos–família, por serem os melhores que uma pessoa pode ter.
A todos os anjos que cruzaram o meu caminho e possibilitaram a minha caminhada
durante este processo, especialmente a Vera Olvera, Indianara Barcaroli e ao professor
Eduardo Secchi.
Agradeço a minha família, que mesmo distante se faz sempre presente.
Agradeço ao que, na sua forma particular de ser, se manteve sempre ao meu lado.
E, finalmente, para todos nós, deixo esta frase;

iv
“Conheça todas as teorias, domine todas as técnicas, mas ao tocar uma alma humana
seja apenas outra alma humana”.
(Carl G. Jung).
v
ÍNDICE
RESUMO ..................................................................................................................... 1
ABSTRACT ................................................................................................................. 3
1. INTRODUÇÃO GERAL .................................................................................. 4
1.1. A Tainha Mugil liza .............................................................................. 4
1.1.1. Identificação e caracterização da espécie ................................. 4
1.1.2. Distribuição............................................................................... 5
1.1.3. Ciclo de vida ............................................................................. 6
1.2. A pesca da tainha na Região Sul do Brasil ........................................... 7
1.3. A criação de Mugil liza em cativeiro .................................................... 8
1.3.1. Reprodução ................................................................................ 8
1.3.2. Larvicultura e produção de juvenis ......................................... 10
1.3.3. Crescimento ............................................................................. 12
1.4. Aspectos fisiológicos associados à Aquicultura .................................. 15
1.4.1. Metabolismo e crescimento ..................................................... 15
1.4.2. Reserva energética ................................................................... 16
1.4.3. Avaliação do metabolismo ...................................................... 16
1.4.4. A osmorregulação ................................................................... 18
1.4.5. Osmorregulação versus Aquicultura ........................................ 28

vi
1.5. A pesca e a aquicultura ........................................................................ 30
2. OBJETIVOS .................................................................................................... 33
2.1. Objetivo principal ................................................................................ 33
2.2. Objetivos específicos ........................................................................... 33
3. METODOLOGIA GERAL .............................................................................. 35
3.1. Local ...................................................................................................... 35
3.2. Origem dos animais ............................................................................. 35
3.3. Condições experimentais ..................................................................... 36
3.4. Parâmetros analisados ...................................................................................... 37
3.4.1. Índices zootécnicos ............................................................................. 38
3.4.2. Osmolalidade plasmática .................................................................... 38
3.4.3. Atividade da Na+ – K+ – ATPase ......................................................... 39
3.4.4. Taxa de consumo de oxigênio corporal ................................................ 40
3.4.5. Conteúdo hepático de glicogênio ........................................................ 41
3.4.6. Análise dos dados ................................................................................ 42
CAPÍTULO I: A aclimatação de juvenis de Mugil liza a salinidade ambiental ......... 44
CAPÍTULO II: O efeito da salinidade na sobrevivência, crescimento e parâmetros
bioquímicos em juvenis da tainha Mugil liza .............................................................. 46
CAPÍTULO III: O teor de sódio na dieta para juvenis de Mugil liza mantidos em água
doce .............................................................................................................................. 48
CONCLUSÕES GERAIS ............................................................................................ 51

vii
CONSIDERAÇÕES FINAIS ...................................................................................... 53
BIBLIOGRAFIA ......................................................................................................... 56
ANEXO I: Acclimation of juvenile lebranche mullet Mugil liza to environmental
salinity………………………..……………………….………..…………………….. 67
ANEXO II: Effect of salinity on survival, growth and biochemical parameters in
juvenile Lebranch Mugil liza……………………………...……………...………….. 93
ANEXO III: Dietary Salt Supplementation for Juvenile Lebranche Mullet Mugil liza
Reared in Freshwater ………………………………………………...…….………... 118

1
RESUMO 1
A “Teoria isosmótica” postula que o ambiente isosmótico beneficia o crescimento de 2
peixes teleósteo por minimizar o gasto energético com a osmorregulação. Entretanto, 3
como a significância do gasto energético com osmorregulação, além de mudar durante o 4
período de desenvolvimento, é espécie-específica, o objetivo desta tese foi verificar se a 5
“Teoria Isosmótica” é aplicável para Mugil liza. No experimento I foi verificado que o 6
ambiente isosmótico para a espécie ocorre na salinidade 13,5‰ e que a faixa de 7
variação entre 5 e 40‰ de salinidade, ao final de 15 dias, não influenciou (p>0,05) a 8
sobrevivência (100%), a osmolalidade plasmática (417,6 ± 18,0 mOsmol Kg-1) e a taxa 9
de consumo de oxigênio (0,39 ± 0,03 mg O2 g-1 h-1). Que a atividade da Na+, K+-ATPase 10
branquial apresentou o padrão “U” como resposta, com maior atividade nas salinidades 11
extremas (5‰ e 40‰), complementada pela resposta da reserva de glicogênio hepático, 12
que apresentou menor concentração (p<0,05) nas salinidades extremas. No experimento 13
II, após serem mantidos por 40 dias nas salinidades correspondentes a 0, 50, 100 e 14
200% do ponto isosmótico de teleósteos, especificamente o crescimento e a taxa de 15
crescimento específica (G) foram prejudicados em água doce (p<0,05). O experimento 16
III teve como objetivo então verificar se o menor crescimento dos indivíduos mantidos 17
em água doce poderia ser compensado através da adição de sódio na ração. O melhor 18
crescimento foi observado nos indivíduos alimentados com o teor de sódio igual a 5,4% 19
e o efeito contrário foi observado nos teores acima deste nível (8,0 e 13,2%), entretanto 20
o melhor teor de sódio estimado foi de 2,6%. Os resultados desta tese permitem concluir 21
que M. liza tolera um ampla faixa salinidade e, apesar de apresentar uma tendência de 22

2
menor gasto energético em torno da salinidade isosmótica, a quantidade de energia 23
poupada pelos indivíduos nesta faixa de desenvolvimento não foi significativa para 24
incrementar o crescimento. As evidências descritas no presente estudo apontam o 25
potencial de criação da tainha M. liza em ampla faixa de salinidade. 26
27
28
29
30
31
3
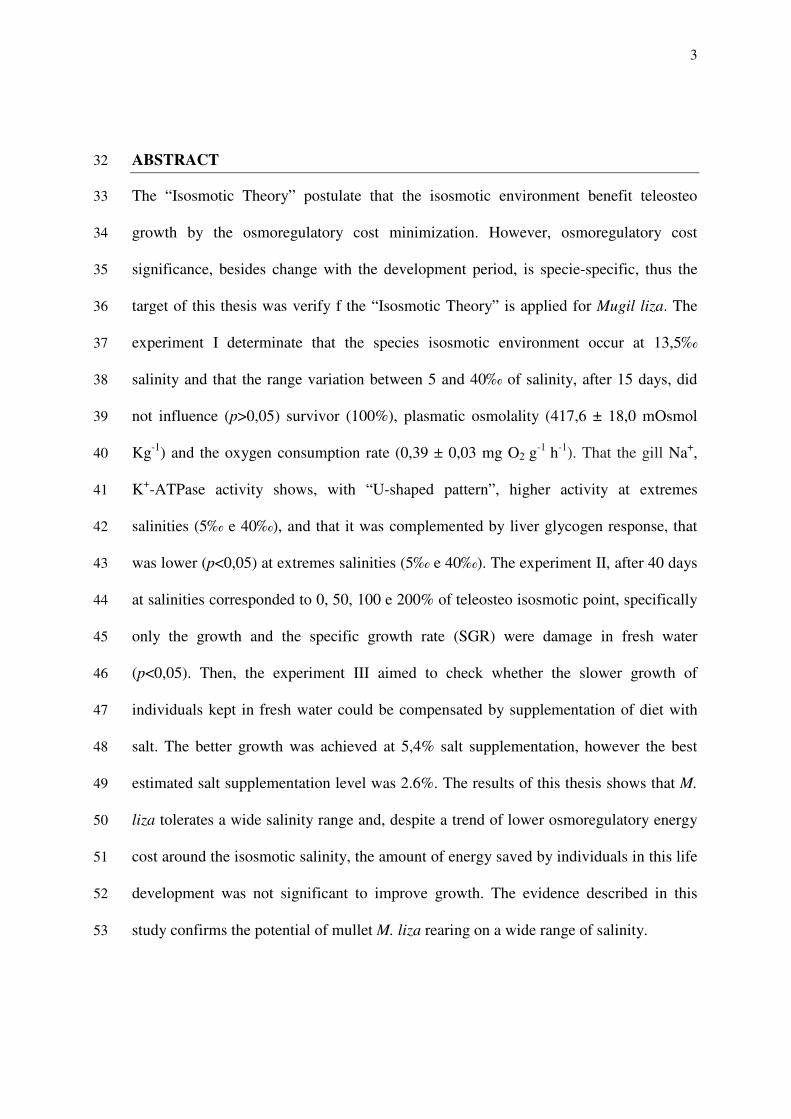
ABSTRACT 32
The “Isosmotic Theory” postulate that the isosmotic environment benefit teleosteo 33
growth by the osmoregulatory cost minimization. However, osmoregulatory cost 34
significance, besides change with the development period, is specie-specific, thus the 35
target of this thesis was verify f the “Isosmotic Theory” is applied for Mugil liza. The 36
experiment I determinate that the species isosmotic environment occur at 13,5‰ 37
salinity and that the range variation between 5 and 40‰ of salinity, after 15 days, did 38
not influence (p>0,05) survivor (100%), plasmatic osmolality (417,6 ± 18,0 mOsmol 39
Kg-1) and the oxygen consumption rate (0,39 ± 0,03 mg O2 g-1 h-1). That the gill Na+, 40
K+-ATPase activity shows, with “U-shaped pattern”, higher activity at extremes 41
salinities (5‰ e 40‰), and that it was complemented by liver glycogen response, that 42
was lower (p<0,05) at extremes salinities (5‰ e 40‰). The experiment II, after 40 days 43
at salinities corresponded to 0, 50, 100 e 200% of teleosteo isosmotic point, specifically 44
only the growth and the specific growth rate (SGR) were damage in fresh water 45
(p<0,05). Then, the experiment III aimed to check whether the slower growth of 46
individuals kept in fresh water could be compensated by supplementation of diet with 47
salt. The better growth was achieved at 5,4% salt supplementation, however the best 48
estimated salt supplementation level was 2.6%. The results of this thesis shows that M. 49
liza tolerates a wide salinity range and, despite a trend of lower osmoregulatory energy 50
cost around the isosmotic salinity, the amount of energy saved by individuals in this life 51
development was not significant to improve growth. The evidence described in this 52
study confirms the potential of mullet M. liza rearing on a wide range of salinity. 53

4
1. INTRODUÇÃO GERAL 54
55
1.1. A tainha Mugil liza 56
O status taxonômico da espécie identificada até então como Mugil platanus foi 57
revisado por Menezes et al. (2010) e foi constatado que a correta nomenclatura de M. 58
platanus é na verdade Mugil liza (Fig. 1). 59
60
61
Figura 1. Espécime de Mugil liza (Foto:Viviana Lisboa). 62
63
1.1.1. Identificação - caracterização da espécie 64
Classe Osteichthyes 65
Subclasse Actinopterygii 66
Infraclasse Teleostei 67
Superordem Acanthopterygii 68
Ordem Mugiliformes 69
Família Mugilidae 70
Gênero Mugil 71

5
Espécie Mugil liza 72
73
A tainha M. liza (Valenciennes, 1836) é caracterizada por apresentar o valor 74
total de 11 como resultado da soma de seus raios e espinhos da nadadeira anal, que 75
podem estar distribuídos em 3 espinhos e 8 raios ou 2 espinhos e 9 raios. Seu corpo 76
alongado e fusiforme possui estrias horizontais escuras facilmente identificadas, 77
enquanto seus olhos possuem uma pálpebra adiposa (Fig. 1). Trata-se de espécie de 78
hábito alimentar detritívoro – iliófago, com registro de exemplares de até 1 m e 8 kg, e 79
longevidade por volta de 15 anos (Menezes & Figueiredo 1980, Fischer et al. 2011). É 80
uma espécie ovípara com desova total de ovos pelágicos não adesivos, com diâmetro 81
médio de 0,46 mm, sendo r-estrategista com fecundidade variando de 0,5 a 2,4 milhões 82
de ovócitos para fêmeas de 40 a 65 cm (Menezes & Figueiredo 1980, Vieira 1991, 83
Miranda Filho et al. 2010, Fischer et al. 2011). 84
85
1.1.2. Distribuição 86
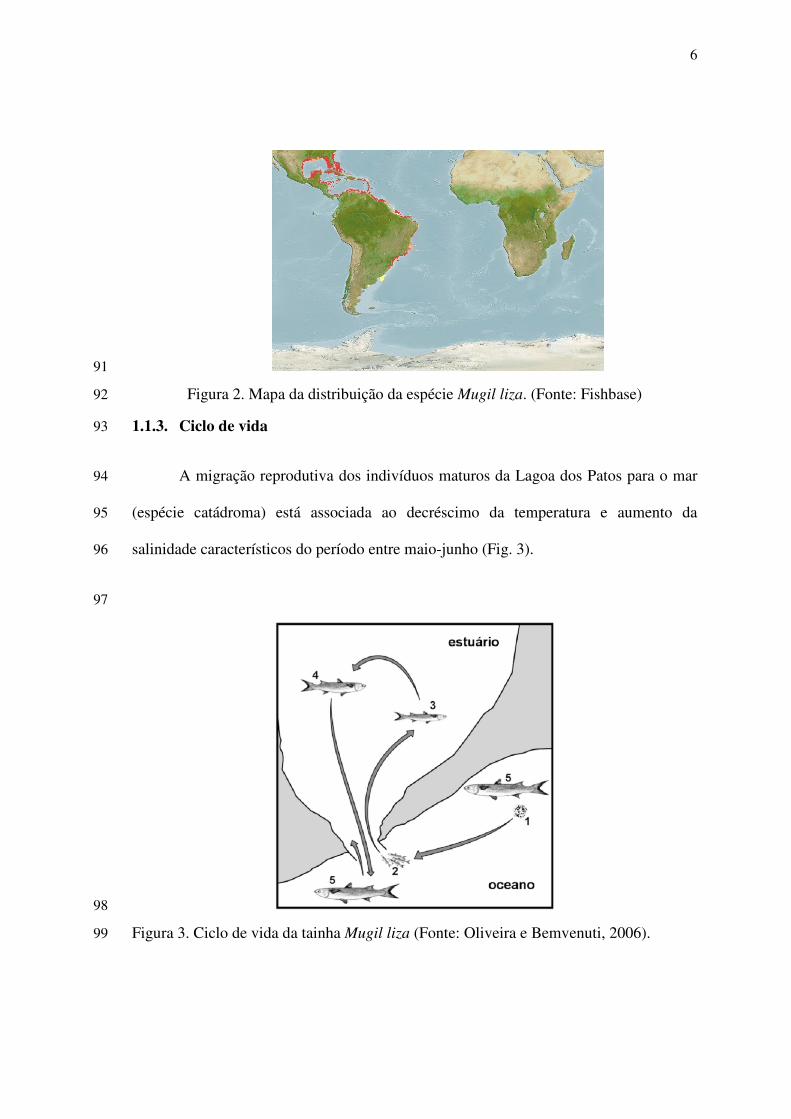
A tainha M. liza habita águas tropicais e subtropicais da Flórida até a Argentina 87
e especificamente no Rio Grande do Sul, a região estuarina e costa adjacente da Lagoa 88
dos Patos (Vieira 1991, Fischer et al. 2011) (Fig. 2). Esta espécie é classificada como 89
sendo estuarino dependente (Oliveira & Bemvenuti 2006). 90
6
91
Figura 2. Mapa da distribuição da espécie Mugil liza. (Fonte: Fishbase) 92
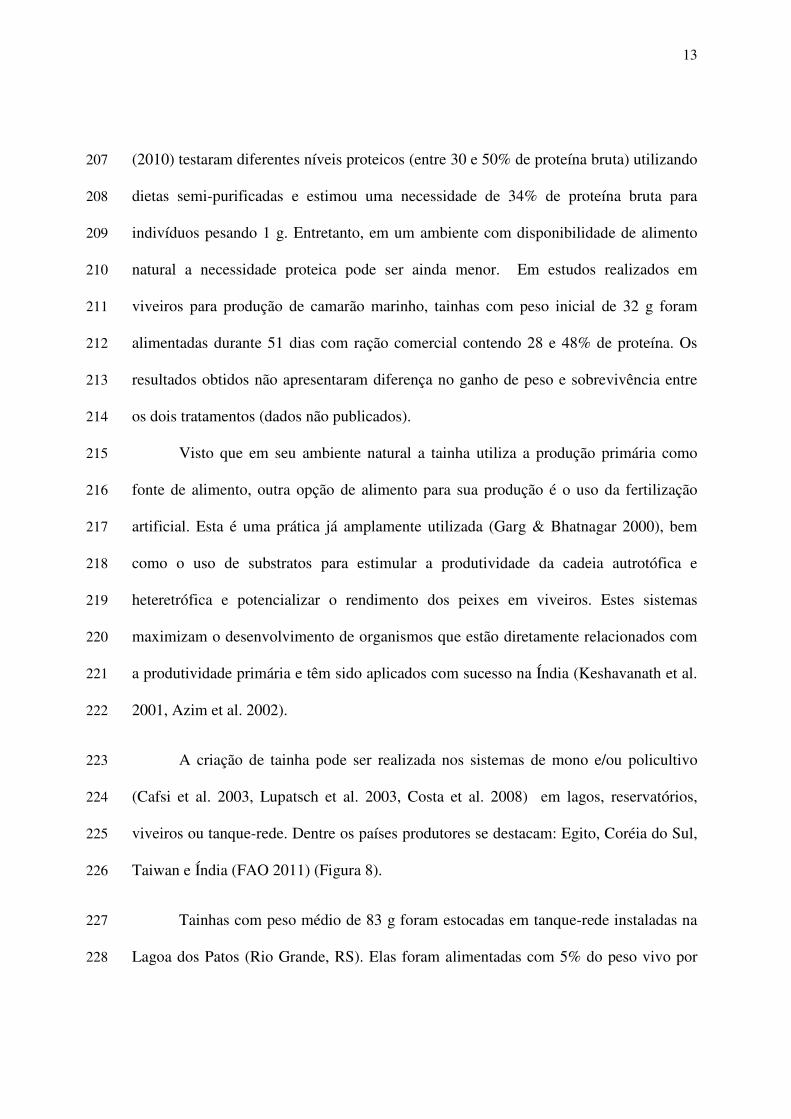
1.1.3. Ciclo de vida 93
A migração reprodutiva dos indivíduos maturos da Lagoa dos Patos para o mar 94
(espécie catádroma) está associada ao decréscimo da temperatura e aumento da 95
salinidade característicos do período entre maio-junho (Fig. 3). 96
97
98
Figura 3. Ciclo de vida da tainha Mugil liza (Fonte: Oliveira e Bemvenuti, 2006). 99

7
Já a migração dos indivíduos jovens para o estuário da Lagoa dos Patos está 100
relacionada a transição do modo de vida pelágico para bentônico e lá permanecem até a 101
sua maturação sexual, que ocorre por volta dos dois anos de vida para os machos e três 102
anos de vida para as fêmeas (Vieira 1991, Miranda Filho et al. 2010). 103
104
1.2. A pesca da tainha na Região Sul do Brasil 105
A tainha é um recurso economicamente importante no Sul do Brasil, 106
principalmente para a pesca artesanal (Reis & D´Incao 2000) (Fig. 4). 107
108
Figura 4. Pesca artesanal da tainha Mugil liza no litoral de SC (Fonte: Jornal Ilha Capital) 109
110
O decréscimo da captura da sardinha verdadeira (Sardinella brasiliensis) e a 111
valorização da tainha e de sua ova no mercado desde o ano 2000 motivaram a 112
intensificação do esforço de pesca sobre este recurso, que passou a ser disputado entre a 113
pesca artesanal e industrial. Em 2004, a tainha ingressou na lista das espécies sobre-114
exploradas ou ameaçadas de sobre-exploração (IN MMA n°5 05/2004), quando foi dado 115

8
um prazo de dez a 9 anos para organização e execução de um Plano de Gestão para sua 116
pesca. Quatro anos depois foi instituída a instrução normativa do IBAMA n°171/2008, 117
onde ficaram estabelecidas as normas para exploração deste recurso na região Sudeste e 118
Sul. Até o momento, baseado nos dados de 2008, 2009 e 2010, o que se observa é uma 119
estabilização da sua produção pela pesca extrativista marinha em torno de 4% do valor 120
nacional total de pesca marinha (MPA 2008/2009). O Plano de Gestão para sua pesca 121
ainda não foi estabelecido. 122
123
1.3. Criação da tainha Mugil liza em cativeiro 124
Do ponto de vista da aquicultura, M. liza é uma espécie rústica, de fácil manejo e 125
adaptação ao cativeiro, que aceita fácil a dieta artificial e oferece mais oportunidade de 126
criação devido a possibilidade de uso de diferentes fontes de água (Fonseca Neto & 127
Spach 1998/1999). 128
Aliado a estas características, por ser uma espécie de baixo nível trófico, a 129
alimentação em cativeiro pode ser realizada com uso de ração com baixo teor de 130
proteína animal (Godinho et al. 1988, Carvalho et al. 2010), minimizando a questão do 131
uso de elevadas quantidades de farinha de peixe característica para espécies carnívoras. 132
133
1.3.1. Reprodução 134
O protocolo para reprodução em cativeiro e obtenção de juvenis de M. liza ainda 135
não está bem definido. Entretanto, vários estudos sobre sua biologia reprodutiva foram 136
realizados e podem ajudar a estabelecer uma metodologia para sua reprodução em 137

9
cativeiro. Em seu habitat natural, o aumento da salinidade e a queda brusca da 138
temperatura são apontados como “gatilho” para sua migração reprodutiva, 139
popularmente conhecida como “corrida da tainha Seu desenvolvimento gonadal foi 140
dividido em cinco etapas (Andrade-Talmelli et al. 1996). 141
Reprodutores de tainha não são mantidos rotineiramente em laboratório no 142
Brasil, pois há dificuldade em obter a vitelogênese completa em cativeiro. A desova é 143
obtida através de indução hormonal de indivíduos maturos capturados na natureza 144
(Figura 5). 145
Godinho et al. (1993) verificaram que fêmeas com oócitos com diâmetro médio 146
variando entre 586 e 625 µm apresentaram melhores resultados quando induzidas com 147
duas doses de HCG, sendo a primeira de 20.000 UI/Kg e a segunda de 40.000 UI/Kg. A 148
desova ocorre por volta de 54 h após a segunda aplicação do hormônio realizada num 149
intervalo de 24 h. 150
Figura. 5. Processo de extrusão em exemplar de Mugil liza. (Fonte: http://ipesca.tripod.com/maricult.htm)

10
A dose está acima da usualmente utilizada para outras espécies e isso ocorre 151
devido a tainha ser uma espécie com desova total. 152
O desenvolvimento de pesquisas para determinação do hormônio adequado, 153
dose e via de aplicação (injeção ou peletts) são importantes para otimizar a obtenção de 154
ovos de qualidade para fertilização artificial, visto que a criação comercial não deveria 155
depender de juvenis capturados na natureza como ocorre em outros países. 156
157
1.3.2. Larvicultura e produção de juvenis 158
A larvicultura da tainha (Figura 6) é feita em sistema de água verde com a 159
microalga (Nannochloropsis oculata) (Yamanaka et al. 1991) (Figura 7A). A primeira 160
alimentação das larvas (Figura 6) é realizada com rotíferos (Brachionus plicatilis) 161
(Figura 7B), que são oferecidos a partir do quarto dia de vida. 162
A substituição dos rotíferos por náuplios de Artemia sp. (Figura 7C) pode ser 163
realizada após o 24° dia da eclosão (Yamanaka et al. 1991). 164
Figura. 6. Larva de Mugil sp.(Fonte: http://www.pesca.sp.gov.br/imagens.php?pag=5
165

11
Já Galvão et al. (1997) mantiveram a alimentação de larvas com rotíferos e N. 166
oculata até o 40° dia, acrescentado náuplios de Artemia sp. do 20° ao 60° dia. Tanto o 167
rotífero quanto a Artemia sp. podem ser ainda enriquecidos com ácidos graxos 168
altamente insaturados melhorando assim valor nutricional e consequentemente 169
aprimorando a qualidade da larva. 170
A baixa atividade enzimática durante a fase larval dificulta a utilização de ração 171
desde as primeiras fases desenvolvimento (Galvão et al. 1997). A substituição do 172
alimento vivo por dietas inertes pode ser realizada com a co-alimentação de ração e 173
náuplios de Artemia sp. a partir do 24° após a eclosão (Godinho 2005). Já Galvão et al. 174
(1997) realizaram esta transição a partir do 40°dia, oferecendo uma co-alimentação com 175
dieta microparticulada de 400µm com 45% de proteína bruta. 176
177
Figura. 7. Itens alimentares utilizados na larvicultura de Mugil liza. A. Microalga 178
Nannochloropsis oculata. B. Rotífero Branchionus plicatilis. C. Náuplio de Artêmia 179
Artemia sp. (Fonte: http://www.sbae-180
industries.be/Technology/specs/Nannochloropsis.html, 181
http://www.nikonsmallworld.com/gallery/year/2007/41, 182
http://wsww.reefcorner.org/forum/topic.asp?TOPIC_ID=133672) 183
184
A B C

12
A alimentação de pequenos juvenis (peso inicial de 136 mg) deve ser feita com 185
uma taxa de arraçoamento de 15% do peso para otimizar a conversão alimentar e a taxa 186
de crescimento (Sampaio et al. 1998). 187
Scorvo Filho et al. (1992) sugerem a densidade de estocagem de 5 indivíduos/m2 188
para juvenis com 22 mg. Já Sampaio et al. (2001) verificaram que para juvenis de 250 189
mg a densidade de 10 juvenis/L permite a produção de um número maior de indivíduos, 190
enquanto que densidade mais baixa (1 indivíduo/L) proporciona melhor qualidade de 191
água e maior sobrevivência. 192
A temperatura ideal para a criação de juvenis de tainha é de 30°C (Okamoto et 193
al. 2006). Apesar de ser uma espécie eurialina, Fonseca e Spach (1998/1999) afirmam 194
que antes da transferência para a água doce, os juvenis (indivíduos entre 28 e 33 mm) 195
devem ser aclimatados inicialmente à salinidade 5. 196
A manutenção da qualidade de água dever ser uma preocupação constante em 197
todas as fases de criação. Miranda et al. (1995) observaram que concentrações a partir 198
de 2 ppm de amônia total causam redução no crescimento de juvenis de tainha. Sampaio 199
et al. (2002) estudaram a toxicidade aguda da amônia e do nitrito e demonstraram que a 200
toxicidade aumenta em água doce quando comparado com juvenis aclimatados em 201
salinidade mais elevada. 202
203
1.2.3. Crescimento 204
O hábito alimentar de M. liza se diferencia de acordo com a fase de seu ciclo de 205
vida, passando de planctófago a iliófago (Oliveira & Soares 1996). Carvalho et al. 206
13
(2010) testaram diferentes níveis proteicos (entre 30 e 50% de proteína bruta) utilizando 207
dietas semi-purificadas e estimou uma necessidade de 34% de proteína bruta para 208
indivíduos pesando 1 g. Entretanto, em um ambiente com disponibilidade de alimento 209
natural a necessidade proteica pode ser ainda menor. Em estudos realizados em 210
viveiros para produção de camarão marinho, tainhas com peso inicial de 32 g foram 211
alimentadas durante 51 dias com ração comercial contendo 28 e 48% de proteína. Os 212
resultados obtidos não apresentaram diferença no ganho de peso e sobrevivência entre 213
os dois tratamentos (dados não publicados). 214
Visto que em seu ambiente natural a tainha utiliza a produção primária como 215
fonte de alimento, outra opção de alimento para sua produção é o uso da fertilização 216
artificial. Esta é uma prática já amplamente utilizada (Garg & Bhatnagar 2000), bem 217
como o uso de substratos para estimular a produtividade da cadeia autrotófica e 218
heteretrófica e potencializar o rendimento dos peixes em viveiros. Estes sistemas 219
maximizam o desenvolvimento de organismos que estão diretamente relacionados com 220
a produtividade primária e têm sido aplicados com sucesso na Índia (Keshavanath et al. 221
2001, Azim et al. 2002). 222
A criação de tainha pode ser realizada nos sistemas de mono e/ou policultivo 223
(Cafsi et al. 2003, Lupatsch et al. 2003, Costa et al. 2008) em lagos, reservatórios, 224
viveiros ou tanque-rede. Dentre os países produtores se destacam: Egito, Coréia do Sul, 225
Taiwan e Índia (FAO 2011) (Figura 8). 226
Tainhas com peso médio de 83 g foram estocadas em tanque-rede instaladas na 227
Lagoa dos Patos (Rio Grande, RS). Elas foram alimentadas com 5% do peso vivo por 228

14
dia com ração extrusada (45% de proteína bruta) e foi observada uma boa 229
sobrevivência, consumo do biofilme e a taxa de crescimento diária de 0,38%/dia 230
(Maçada et al. 2000). Este crescimento foi considerado lento, quando comparado com o 231
de tainha criada em viveiros estuarinos utilizados normalmente para a criação de 232
camarão, que atingiu 1,9%/dia (dados não publicados). 233
234
235
Figura. 8. Produto da engorda de Mugil sp. em sistema de gaiolas no sul da Índia. 236 (Fonte: http://www.cmfri.org.in/news36.html) 237 238
O policultivo é uma técnica que visa maior aproveitamento das fontes de 239
alimento e do espaço, buscando um aumento da produção por unidade de área de 240
cultivo, sendo esta prática considerada ambientalmente mais eficiente que o 241
monocultivo. A tainha e o camarão são espécies compatíveis, sendo a soma da 242
produtividade primária com o fornecimento de ração para o camarão um fator positivo, 243
fazendo dos viveiros de policultivo um ambiente favorável ao desenvolvimento da 244
tainha, sem haver prejuízo para o camarão. Costa et al. (2008) comprovaram a 245
viabilidade técnica do policultivo da tainha M. liza com o camarão Litopenaeus 246

15
vannamei, demonstrando que esta pode ser uma alternativa viável para o cultivo destas 247
duas espécies. 248
A utilização de gaiolas ou cercados para os camarões dentro de viveiros com tainhas 249
(Figura 9) também facilitaria a captura dos camarões no momento da despesca, visto 250
que os camarões atingem o tamanho comercial mais que a tainha. 251
252
Figura 9. Cercados utilizados na engorda experimental da tainha Mugil liza em viveiro 253 de camarão da fazenda CARCIBRAS (Foto: Danilo de Castro Faria). 254
255
1.4. Aspectos fisiológicos associados à aquicultura 256
257
1.4.1. Metabolismo e crescimento 258
A premissa para o funcionamento de um organismo é o seu suprimento de 259
energia. Em peixes, assim como para outros vertebrados, esta energia provém da 260
oxidação de compostos orgânicos (carboidratos, lipídeos e proteínas) ricos em energia. 261
A energia de compostos orgânicos é liberada na forma de calor e para ser utilizada pelo 262
organismo, é “transformada” através do Ciclo de Krebs e cadeia respiratória em energia 263

16
química, a adenosina trifosfato ou ATP (Nelson & Cox 2007). Logo, o ATP pode ser 264
considerado a moeda da economia metabólica. O crescimento do organismo pode ser 265
considerado uma consequência do “lucro energético líquido”, ou seja, quando a 266
quantidade de energia obtida do alimento é suficiente para pagar o gasto energético com 267
manutenção dos processos vitais e a sobra, esta “energia líquida”, pode então ser 268
investida no processo de crescimento, o qual é definido por Morgan et al. (2000) como 269
sendo o incremento de proteínas devido a sua taxa de síntese ser maior que a sua taxa de 270
degradação. 271
272
1.4.2. Reserva energética 273
Quando a obtenção de energia metabólica é suficiente para manter o 274
metabolismo basal, promover o crescimento e ainda permitir uma “sobra” energética é 275
possível que essa energia extra seja armazenada no organismo sob a forma de 276
carboidrato de reserva, o glicogênio, e/ou na forma de gordura (Meurer et al. 2002). O 277
principal sítio de conversão de glicose em glicogênio (glicogenogênese) e o principal 278
local de reserva deste carboidrato é o fígado (Baldisserotto 2009). Já a gordura é 279
acumulada principalmente no tecido adiposo, mas também no fígado e músculo (Van 280
Den Thillart & Van Raaij 1995). Apesar de, quando necessário, o organismo priorizar o 281
uso das reservas energéticas na forma de glicogênio e de lipídio, a proteína corporal 282
também pode ser utilizada como fonte energética (Tseng & Hwang 2008). 283
284
1.4.3. Avaliação do metabolismo 285

17
O efeito de alguma variável (i.e. nutricional ou ambiental) sobre a dinâmica 286
energética de um organismo é usualmente estudado através do monitoramento de 287
indicadores do status metabólico, i.e. a taxa de consumo de oxigênio e a dinâmica das 288
reservas energéticas. Especificamente quando se busca avaliar o efeito da salinidade, 289
inclui-se o monitoramento da atividade da Na+, K+-ATPase (McCormick 1995, Da Silva 290
Rocha et al. 2005, Baldisserotto et al. 2007, Saoud et al. 2007). 291
A atividade da Na+,K+-ATPase está diretamente correlacionada com o 292
funcionamento do mecanismo osmorregulatório (Baldisserotto et al. 2007) e devido a 293
sua elevada importância seu funcionamento, bem como seu comportamento em 294
diferentes salinidades, está destacado no itens 1.4.4 dessa tese. 295
Já o consumo de oxigênio e o conteúdo de glicogênio hepático são parâmetros 296
indiretamente correlacionados à osmorregulação. O consumo de oxigênio reflete o 297
processo de liberação da energia das moléculas orgânicas, ou seja, a respiração. 298
Entretanto, o processo respiratório não supre energia somente para o mecanismo 299
osmorregulatório e sim para todas as funções fisiológicas (Marshall & Grosell 2006). E 300
no caso de ocorrer um déficit energético, na maioria dos peixes, é a glicogenólise que o 301
organismo busca como primeira opção para reparar/sanar esta “demanda metabólica 302
global” e não somente referente à demanda osmorregulatória (Tseng & Hwang 2008). 303
As respostas do consumo de oxigênio em função da salinidade ambiental foram 304
descritas por Kinne (1967) como estando enquadradas em quatro tipos. Na resposta 305
Tipo 1, o efeito da salinidade no metabolismo, especialmente após adequado período de 306
18
aclimatação, é inexpressivo e por isso não altera a taxa de consumo de oxigênio. Peixes 307
que apresentam a resposta do Tipo 1 são geralmente aqueles considerados eurialinos. 308
309
1.4.4. A osmorregulação 310
Do ponto de vista fisiológico, o ambiente aquático pode ser classificado de 311
acordo com a sua concentração osmótica em relação aos fluídos corporais dos animais 312
que nele habitam como sendo hiposmótico, isosmótico ou hiperosmótico, caso 313
apresentem valor, respectivamente, menor, igual ou superior àquele dos fluídos 314
corporais. Já do ponto de vista ambiental, a resolução n°357 de 17 de março de 2005 do 315
Conselho Nacional do Meio Ambiente (CONAMA) classifica as águas de acordo com 316
sua salinidade, sendo água doce aquela com salinidade inferior ou igual a 0,5, água 317
salobra aquela de salinidade superior a 0,5 e inferior a 30, e água salina aquela com teor 318
de sal igual ou superior à salinidade 30. 319
Osmorregulação é a função fisiológica responsável por manter a concentração 320
osmótica dos fluídos corpóreos independente da concentração osmótica da salinidade do 321
meio que o circunda (Marshall & Grosell 2006). A maioria dos peixes se encontra em 322
ambientes que não são isosmóticos aos seus fluídos corpóreos, ou seja, a concentração 323
osmótica do meio interno difere daquela do meio externo. Os peixes que possuem este 324
mecanismo fisiológico são classificados como osmorreguladores e os que não o 325
possuem como osmoconformadores (Baldisserotto 2009). 326
Todos os peixes teleósteos são osmorreguladores no ambiente em que vivem e 327
algumas espécies possuem ainda a capacidade de sintetizar novas proteínas de 328
19
transporte (i.e., Na+,K+-ATPase) à medida que se movem entre os ambientes de 329
diferentes salinidades (Kidder III et al.2006). Essas são classificadas como eurialinas e 330
podem habitar áreas com uma ampla faixa de salinidade. De qualquer forma, em 331
ambiente hiposmótico será realizado trabalho osmorregulatório para manter a 332
concentração osmótica interna acima daquela do meio externo (hiper-regulação), assim 333
como em ambiente hiperosmótico será realizado trabalho osmorregulatório para manter 334
a concentração osmótica interna abaixo daquela do meio externo (hipo-regulação) 335
(Marshall & Grosell 2006, Baldisserotto 2009). 336
337
A Na+,K
+-ATPase 338
A Família das enzimas conhecidas como “ATPases” são caracterizadas por 339
catalisarem a hidrólise do ATP. Neste processo, além da formação do ADP (adenosina 340
difosfato) e a disponibilização de fosfato inorgânico, ocorre a liberação de energia 341
(Nelson & Cox 2007). Especificamente, a Na+,K+-ATPase emprega esta energia na 342
execução de trabalho osmótico , i.e., para gerar potencial de membrana e efetuar 343
transporte ativo de íons, sendo local de ocorrência é a célula de cloreto, que por sua vez 344
encontram-se nos filamentos branquiais (Hwang & Lee 2007). 345
A relação da atividade da Na+,K+-ATPase com a salinidade pode apresentar dois 346
tipos de resposta: (1) linear - quando o aumento da atividade é diretamente proporcional 347
ao aumento da salinidade, e (2) “Padrão U” - quando ocorrem maiores valores de 348
atividade enzimática em salinidades extremas (Herrera et al. 2009). 349
350

20
A osmorregulação em água salgada – Hipo-regulação 351
O desafio osmorregulatório enfrentado por peixes teleósteos em ambiente 352
hiperosmótico em relação ao seu fluído interno é a perda de água por osmose e o ganho 353
excessivo de íons por difusão (Figura 10) (Marshall & Grosell 2006). Para manter a 354
concentração osmótica sanguínea mais ou menos constante neste tipo de ambiente, 355
deverá ser executado trabalho osmótico para compensar a perda osmótica de água e 356
eliminar o ganho difusivo de íons (Baldisserotto 2009) (Figura 11). Neste contexto, os 357
principais órgãos “recrutados” para realização deste trabalho osmótico são o esôfago, o 358
intestino, as brânquias, o rim e a bexiga urinária (Baldisserotto et al. 2007). 359
360
Figura 10. Esquema ilustrativo das vias de perda (azul) e ganho (verde) de íons e água em 361 ambiente hiper-osmótico (Fonte: Baldisserotto 2009). 362
363
No intuito de manter o balanço osmótico sanguíneo, os teleósteos em ambiente 364
marinho ingerem água salgada para posterior absorção osmótica de água “doce”. A 365
absorção de água “doce” na porção posterior do intestino é possível porque a água 366
salgada ingerida é dessalinizada ao longo do trato digestório (Taylor & Grosell 2006). 367
21
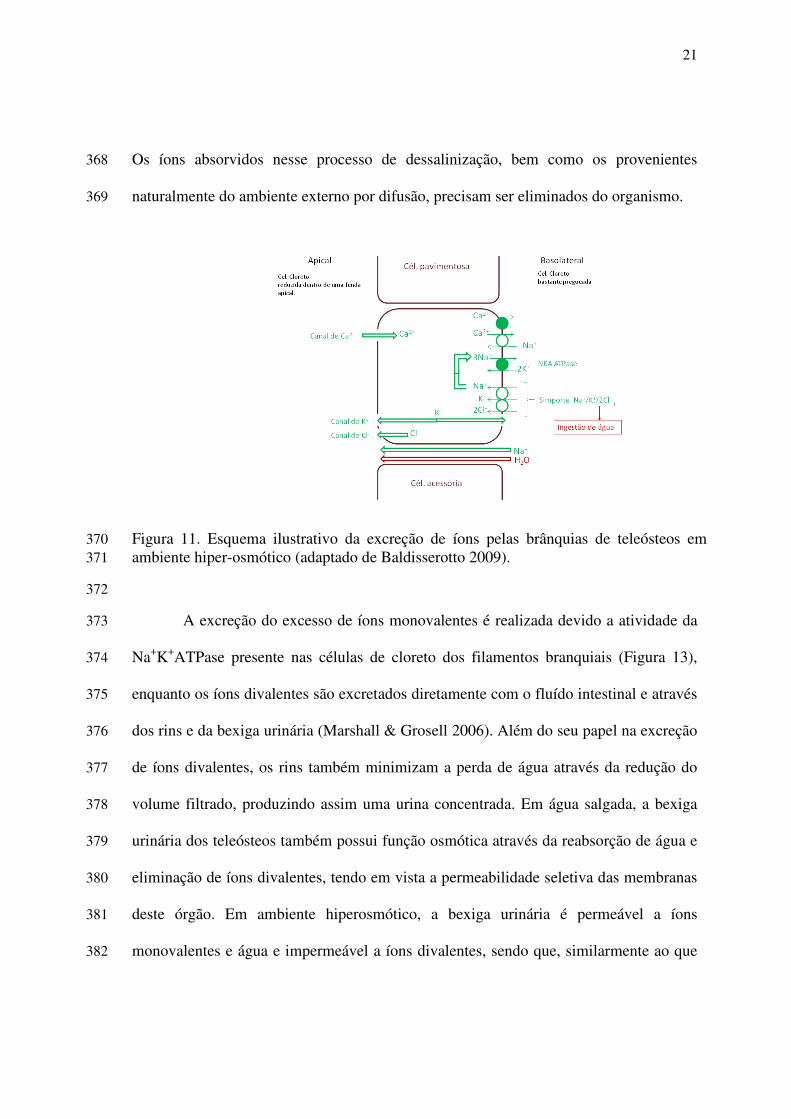
Os íons absorvidos nesse processo de dessalinização, bem como os provenientes 368
naturalmente do ambiente externo por difusão, precisam ser eliminados do organismo. 369
Figura 11. Esquema ilustrativo da excreção de íons pelas brânquias de teleósteos em 370 ambiente hiper-osmótico (adaptado de Baldisserotto 2009). 371
372
A excreção do excesso de íons monovalentes é realizada devido a atividade da 373
Na+K+ATPase presente nas células de cloreto dos filamentos branquiais (Figura 13), 374
enquanto os íons divalentes são excretados diretamente com o fluído intestinal e através 375
dos rins e da bexiga urinária (Marshall & Grosell 2006). Além do seu papel na excreção 376
de íons divalentes, os rins também minimizam a perda de água através da redução do 377
volume filtrado, produzindo assim uma urina concentrada. Em água salgada, a bexiga 378
urinária dos teleósteos também possui função osmótica através da reabsorção de água e 379
eliminação de íons divalentes, tendo em vista a permeabilidade seletiva das membranas 380
deste órgão. Em ambiente hiperosmótico, a bexiga urinária é permeável a íons 381
monovalentes e água e impermeável a íons divalentes, sendo que, similarmente ao que 382
22
ocorre no intestino, a reabsorção de íons monovalentes ocorre na verdade para 383
possibilitar a posterior reabsorção de água (Baldisserotto 2009). 384
385
A osmorregulação em água doce – Hiper-regulação 386
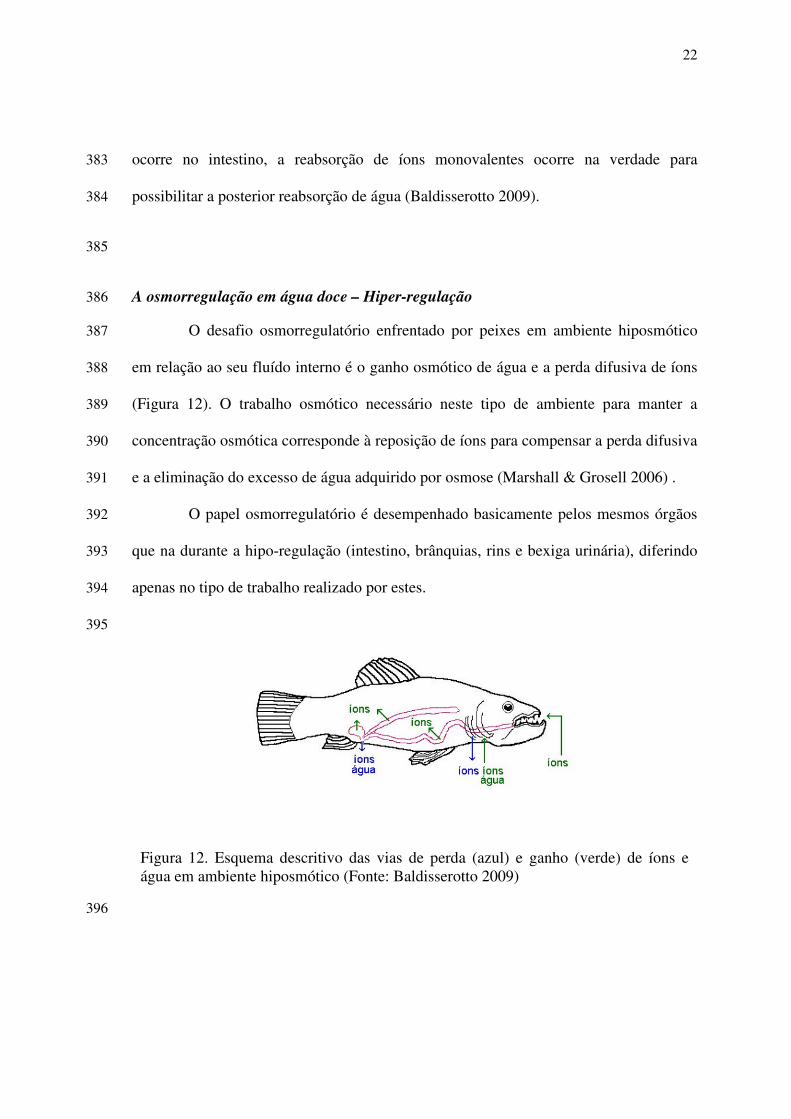
O desafio osmorregulatório enfrentado por peixes em ambiente hiposmótico 387
em relação ao seu fluído interno é o ganho osmótico de água e a perda difusiva de íons 388
(Figura 12). O trabalho osmótico necessário neste tipo de ambiente para manter a 389
concentração osmótica corresponde à reposição de íons para compensar a perda difusiva 390
e a eliminação do excesso de água adquirido por osmose (Marshall & Grosell 2006) . 391
O papel osmorregulatório é desempenhado basicamente pelos mesmos órgãos 392
que na durante a hipo-regulação (intestino, brânquias, rins e bexiga urinária), diferindo 393
apenas no tipo de trabalho realizado por estes. 394
395
Figura 12. Esquema descritivo das vias de perda (azul) e ganho (verde) de íons e água em ambiente hiposmótico (Fonte: Baldisserotto 2009)
396

23
Para manter o equilíbrio osmótico, os rins e a bexiga urinária dos teleósteos em 397
ambiente dulcícola são responsáveis por manter uma elevada taxa de filtração, no 398
intuito de maximizar a produção e a excreção de um elevado volume de urina 399
(Baldisserotto 2009). 400
Por sua vez, o intestino, como na hipo-regulação, desempenha o papel de absorver 401
os íons através da ação da Na+,K+-ATPase. Entretanto, os íons absorvidos, ao invés de 402
serem eliminados, são mantidos no plasma para compensar a perda difusiva natural 403
destes íons para o ambiente externo. Além disso, os íons absorvidos no intestino 404
também não são mais provenientes da ingestão da água salgada, que não ocorre em 405
ambiente hiposmótico, e sim do alimento ingerido (Baldisserotto et al. 2007). 406
Em relação ao que é observado em ambiente hiperosmótico, o papel da Na+,K+-407
ATPase branquial é invertido em ambiente hiposmótico. Neste caso, esta enzima é 408
responsável pela reposição de íons perdidos por difusão através da geração de um 409
gradiente favorável a captação destes íons no ambiente (Hwang & Lee 2007) (Figura 410
13). 411

24
Figura 13. Esquema ilustrativo da captação de íons pelas brânquias de teleósteos em 412 ambiente hiposmótico (adaptado de Baldisserotto 2009). 413
414
Osmorregulação e outras funções fisiológicas 415
Em geral, o estudo das funções fisiológicas é compartimentalizado, visando 416
facilitar a compreensão do funcionamento dos organismos. No entanto, os mecanismos 417
fisiológicos atuam como um conjunto de elementos que interagem entre si e se 418
complementam, visando à manutenção da homeostasia do organismo (Jobling 1994). 419
No que se referem aos mecanismos osmorregulatórios, estes também interagem e se 420
complementam com outras funções fisiológicas e, por isso, a complexidade na 421
identificação de uma resposta fisiológica frente a uma variável especifica (Boeuf & 422
Payan 2001). Dentre as funções que interagem com os processos osmorregulatórios, 423
encontram-se a respiração, manutenção do equilíbrio ácido-base e a absorção de 424
nutrientes (Baldisserotto 2009). 425
25
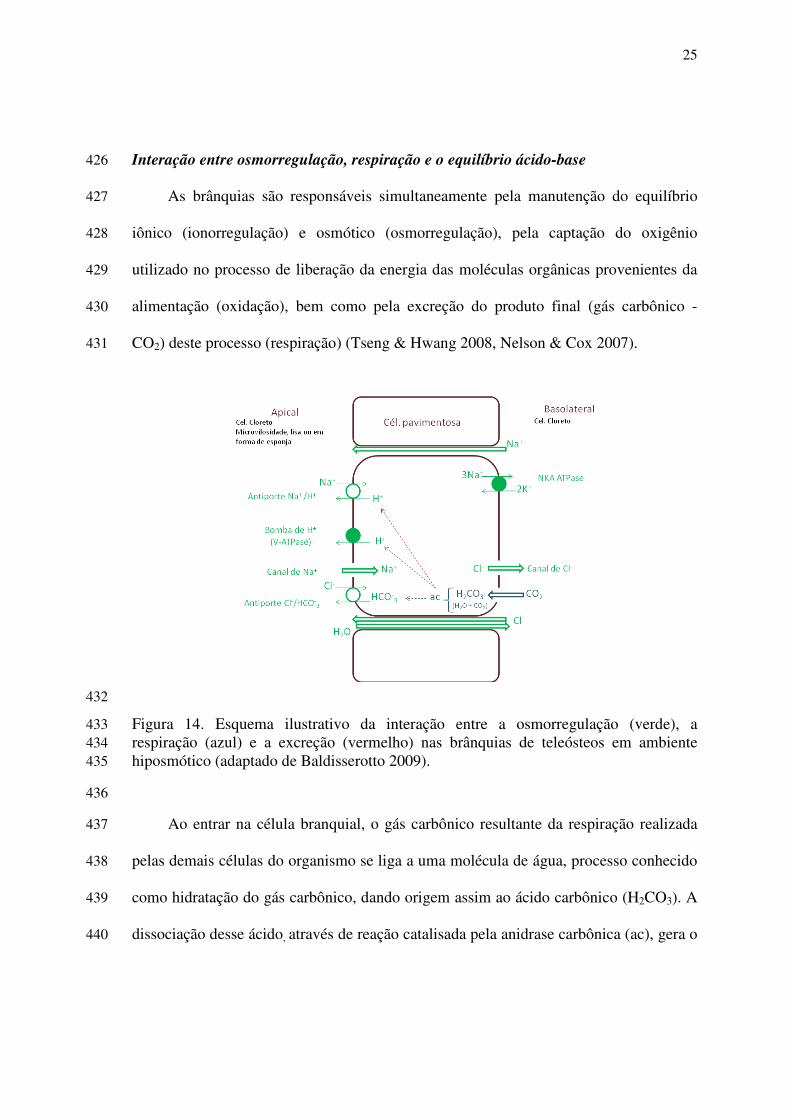
Interação entre osmorregulação, respiração e o equilíbrio ácido-base 426
As brânquias são responsáveis simultaneamente pela manutenção do equilíbrio 427
iônico (ionorregulação) e osmótico (osmorregulação), pela captação do oxigênio 428
utilizado no processo de liberação da energia das moléculas orgânicas provenientes da 429
alimentação (oxidação), bem como pela excreção do produto final (gás carbônico - 430
CO2) deste processo (respiração) (Tseng & Hwang 2008, Nelson & Cox 2007). 431
432
Figura 14. Esquema ilustrativo da interação entre a osmorregulação (verde), a 433 respiração (azul) e a excreção (vermelho) nas brânquias de teleósteos em ambiente 434 hiposmótico (adaptado de Baldisserotto 2009). 435
436
Ao entrar na célula branquial, o gás carbônico resultante da respiração realizada 437
pelas demais células do organismo se liga a uma molécula de água, processo conhecido 438
como hidratação do gás carbônico, dando origem assim ao ácido carbônico (H2CO3). A 439
dissociação desse ácido, através de reação catalisada pela anidrase carbônica (ac), gera o 440

26
íon bicarbonato (HCO3-), o qual é excretado da brânquia para o meio ambiente durante 441
o processo de absorção do íon cloreto (Cl-) a partir deste. Este processo é realizado pelo 442
antiporte Cl-/HCO3- presente na membrana apical da célula branquial. Além do HCO3
-, 443
a dissociação do H2CO3 também gera o íon hidrogênio (H+), o qual é excretado da 444
célula ambiental para o meio ambiente durante o processo de absorção do Na+ a partir 445
deste. Por sua vez, este processo é realizado pelo antiporte Na+/H+ ou a bomba de H+ 446
(V-ATPase) presentes na membrana apical da célula branquial (Marsahll & Grosell 447
2006) (Figura 14). 448
449
Interação entre osmorregulação e absorção de nutrientes 450
Como todos os demais animais, os peixes se alimentam visando à obtenção de 451
substratos energéticos para manutenção do seu metabolismo (catabolismo e anabolismo) 452
(Nelson & Cox 2007). Entretanto, a ingestão e digestão do alimento, por si só, não 453
garante seu aproveitamento (absorção) pelo animal (Gatlin III 2002). 454
Após a digestão dos alimentos, as unidades estruturais básicas das proteínas, 455
carboidratos e lipídios são absorvidas para corrente sanguínea dos peixes, processo este 456
que ocorre no intestino. Entretanto, a presença de Na+ no lúmen intestinal é um dos 457
elementos fundamentais para a absorção dos aminoácidos (aa), da glicose e dos ácidos 458
graxos, a qual ocorre na porção apical das células de revestimento das vilosidades 459
intestinais, conhecidas como enterócitos (Baldisserotto 2009). 460

27
461
Figura 15. Esquema ilustrativo da interação entre a osmorregulação (verde) e a absorção 462 de nutrientes (vermelho) no intestino de teleósteos (adaptado de Baldisserotto 2009). 463
464
A absorção das proteínas pode ocorrer por duas vias. Uma delas ocorre através da 465
membrana apical com a molécula na sua forma íntegra e/ou na forma de peptídeos, 466
processo este que ocorre através do co-transporte com o H+. Este simporte é viabilizado 467
pela ação do antiporte Na+/H+, o qual gera gradiente favorável à entrada de H+ nos 468
enterócitos (Figura 15). Uma vez dentro destas células, as peptidases intracelulares 469
realizam a hidrólise das proteínas e peptídeos em aminoácidos, os quais são então 470
transferidos para a corrente sanguínea. A outra via de absorção das proteínas e 471
peptídeos é realizada através da membrana apical na forma de aminoácidos por ação do 472
simporte aa/Na+. Por sua vez, este simporte é viabilizado pela ação da Na+,K+-ATPase, 473
que cria gradiente favorável à entrada de Na+ nos enterócitos (Baldisserotto et al. 2009). 474

28
O transporte da glicose, unidade estrutural básica dos carboidratos, ocorre através 475
do simporte glicose/Na+ na membrana apical do enterócito e do transportador GLUT 2 476
ou por exocitose na membrana basolateral desta célula. Por fim, no caso da absorção de 477
ácidos graxos de cadeia longa, que assim como os ácidos graxos de cadeia curta, 478
constituem a unidade estrutural básica dos lipídios, a contribuição do Na+ ocorre de 479
forma mais indireta, através da ação dos sais biliares. A ação destes sais permite a 480
formação de micelas de lipídios, as quais possibilitam o contato dos graxos de cadeia 481
longa com a membrana apical, onde são transportados por difusão e ressintetizados sob 482
a forma de triglicerídeos no retículo endoplasmático liso. Por sua vez, os triglicerídeos 483
seguem para o citoplasma do enterócito através das lipoproteínas e, a seguir, para os 484
capilares sanguíneos (Baldisserotto et al. 2009). 485
486
1.4.5. Osmorregulação versus Aquicultura 487
A “Teoria isosmótica” 488
A aquicultura procura dispor ao organismo criado um ambiente que proporcione 489
a maximização do seu crescimento. Este objetivo é buscado através da manipulação de 490
fatores bióticos e abióticos que influenciam o crescimento. Dentre os fatores abióticos 491
manipuláveis, a salinidade é um dos mais focados devido sua comprovada influencia 492
não só no crescimento, mas também em outras funções fisiológicas (Jobling 1994, 493
Boeuf & Payan 2001, Sampaio & Bianchini 2002, Nordlie 2009, Rodhy et al. 2010, 494
O´Neill et al. 2011, Pérez et al. 2011). Peixes são capazes de manter seu equilíbrio 495

29
iônico e osmótico independente do ambiente externo, entretanto o funcionamento deste 496
mecanismo demanda gasto de energia metabólica (Sampaio & Bianchini 2002). 497
De acordo com Jobling (1994) o crescimento é o resultado da diferença entre a 498
energia suprida pelo consumo de alimento e o gasto metabólico com a manutenção dos 499
processos vitais para manutenção da vida. A “Teoria Isosmótica” então se baseia na 500
hipótese de que o crescimento é incrementado em um ambiente onde não existe um 501
gradiente osmótico entre os fluídos corporais (milieu intérieur) do peixe e o ambiente 502
externo que o circunda, ou seja, quando os ambientes são isosmóticos (Woo & Kelly 503
1995, Boeuf & Payan 2001, Sampaio & Bianchini 2002, Herrera et al. 2009, Nordlie 504
2009). De modo geral, para peixes teleósteos, a osmolaridade dos fluídos corpóreo varia 505
entre 280-320 mOsm, o que corresponde a um ambiente isosmótico na salinidade ~12‰ 506
(Woo & Kelly 1995, Boeuf & Payan 2001, Sampaio & Bianchini 2002, Tsuzuki et al. 507
2007, Herrera et al. 2009, Nordlie 2009). Entretanto, a significância do gasto energético 508
osmorregulatório tem se mostrado ser espécie-específica e mudar durante o período de 509
desenvolvimento (Morgan & Iwama 1991, Boeuf & Payan 2001, Kidder III et al. 2006). 510
Peixes eurialinos podem viver em uma ampla faixa de salinidade devido a sua 511
habilidade de sintetizar novas proteínas de transporte de sal ao longo de seu 512
deslocamento entre ambientes de diferentes salinidades (Kidder III et al. 2006). Esta 513
característica biológica favorece o desenvolvimento e a criação de peixes eurialinos, 514
visto que é possível a utilização de águas de diferentes salinidades, de acordo com as 515
suas disponibilidades e condições econômicas. 516
517

30
1.5. A pesca e aquicultura 518
O Brasil contribuiu em 2009 com 0.86% da produção mundial de pescado 519
(pesca e aquicultura), ocupando assim a 18ª posição no ranking dos maiores produtores 520
de pescado, que tem a China, Indonésia e Peru como primeiro, segundo e terceiro países 521
mais produtivos, respectivamente. Entretanto, se considerarmos apenas o pescado 522
produzido pela pesca, o Brasil ocupa apenas a 23ª posição no ranking mundial (MPA 523
2008/2009). 524
No contexto nacional, a produção brasileira de pescado apresentou em 2010 525
um crescimento de 2% em relação a 2009. Este acréscimo foi devido ao incremento na 526
produção da pesca extrativa continental (3,9%) e da aquicultura continental (16,9%) e 527
marinha (9%). Por sua vez, a pesca extrativa marinha apresentou uma redução de 8,4% 528
em relação a 2009. No ranking das espécies mais pescadas, em ordem crescente, estão a 529
sardinha verdadeira, a corvina, a pescada amarela, o bonito-listrado e a tainha. 530
Apesar de ocupar o 5º lugar na produção da pesca nacional, no contexto local a 531
tainha é uma espécie de grande aceitação no mercado interno e feiras livres. Esta 532
espécie é usualmente comercializada eviscerada, mas também pode ser encontrada na 533
forma de filé. Outro produto proveniente da tainha e que possui grande valor de 534
mercado é a ova, caviar ou “bottarga” (Fig. 16), como é conhecida no mundo da 535
gastronomia (Ramírez et al. 2007). Esta iguaria possui uma elevada demanda para 536
exportação, alcançando o preço de até R$ 2,00 por grama do produto (Fig. 17). 537

31
Figura 16. Ova de tainha Mugil sp.” in natura”. (Fonte: http://www.tungpao.com/en/news.html)
O fato é que o mercado consumidor existe, mas há carência de tecnologias de 538
produção e de investimentos para incrementar o produto final e melhorar a qualidade 539
além de diversificar da oferta de produtos de origem marinha (Ferreira et al. 2006). Para 540
agravar a situação, na verdade também há a carência do produto em si, já que de modo 541
geral sua oferta se restringe basicamente ao período reprodutivo. 542
Figura 17. Ova de Mugil sp. embalada a vácuo. (Fonte: http://www.newsobserver.com/2010/10/17/742582/real-fish.html)
543
Desta forma, a criação da tainha em cativeiro pode ser uma alternativa para 544
suprir a demanda existente, além de contribuir para a redução da exploração pesqueira e 545

32
recuperação dos estoques naturais. Para tanto, é necessário que sejam conhecidos os 546
aspectos fundamentais da fisiologia da espécie, sobretudo os mecanismos associados a 547
adaptação à salinidade do ambiente. 548
549
550
551
552
553
554
555
556
557
558
559
560
561

33
2. OBJETIVOS 562
563
2.1. Objetivo principal 564
O principal objetivo desta tese foi avaliar o comportamento osmorregulatório da 565
tainha Mugil liza e a implicação dos conhecimentos gerados na produção desta espécie 566
em cativeiro. 567
568
2.2. Objetivos específicos 569
570
2.2.1. Verificar o efeito de diferentes salinidades sobre a (Experimento 1): 571
� Sobrevivência; 572
� Consumo de oxigênio corporal; 573
� Atividade da Na+/K+-ATPase branquial; 574
� Reserva de glicogênio hepático da tainha M.S liza; 575
� Determinar o ponto isosmótico da tainha M. liza. 576
577
2.2.2. Verificar o efeito da condição hipo-, iso- e hiper-osmótica - “Teoria Isosmótica” 578
- da água sobre a (Experimento 2): 579
� Sobrevivência; 580
� Consumo de alimento; 581
� Parâmetros zootécnicos; 582
� Consumo de oxigênio corporal; 583
� Atividade da Na+/K+-ATPase branquial; 584

34
� Reserva de glicogênio hepático da tainha M.liza; 585
586
2.2.3. Avaliar o efeito do teor de Na+ na dieta, em água doce, sobre a (Experimento 3): 587
� Sobrevivência; 588
� Consumo de alimento; 589
� Parâmetros zootécnicos; 590
� Atividade da Na+/K+-ATPase branquial; 591
� Reserva de glicogênio hepático da tainha M.liza. 592
593
594
595
596
597
598
599
600
601
602
603
604
605
606

35
3. METODOLOGIA GERAL 607 608
3.1. Local de realização dos experimentos 609
A parte experimental desta tese foi realizada no Laboratório de Piscicultura 610
Estuarina (LAPEM) do Instituto de Oceanografia (IO) - FURG, enquanto as análises 611
laboratoriais foram realizadas no Laboratório de Zoofisiologia do Instituto de Ciências 612
Biológicas - ICB - FURG. 613
614
3.2. Origem dos animais 615
Todos os espécimes utilizados foram pescados com rede de arrasto na praia do 616
Cassino e mantidos em caixas com água salgada do ambiente até serem transportadas 617
para a LAPEM, onde foram aclimatados às condições experimentais (Fig. 20). 618
619
Figura 17. Captura de espécimes de M. liza na praia do Cassino (Foto: Viviana Lisboa). 620
36
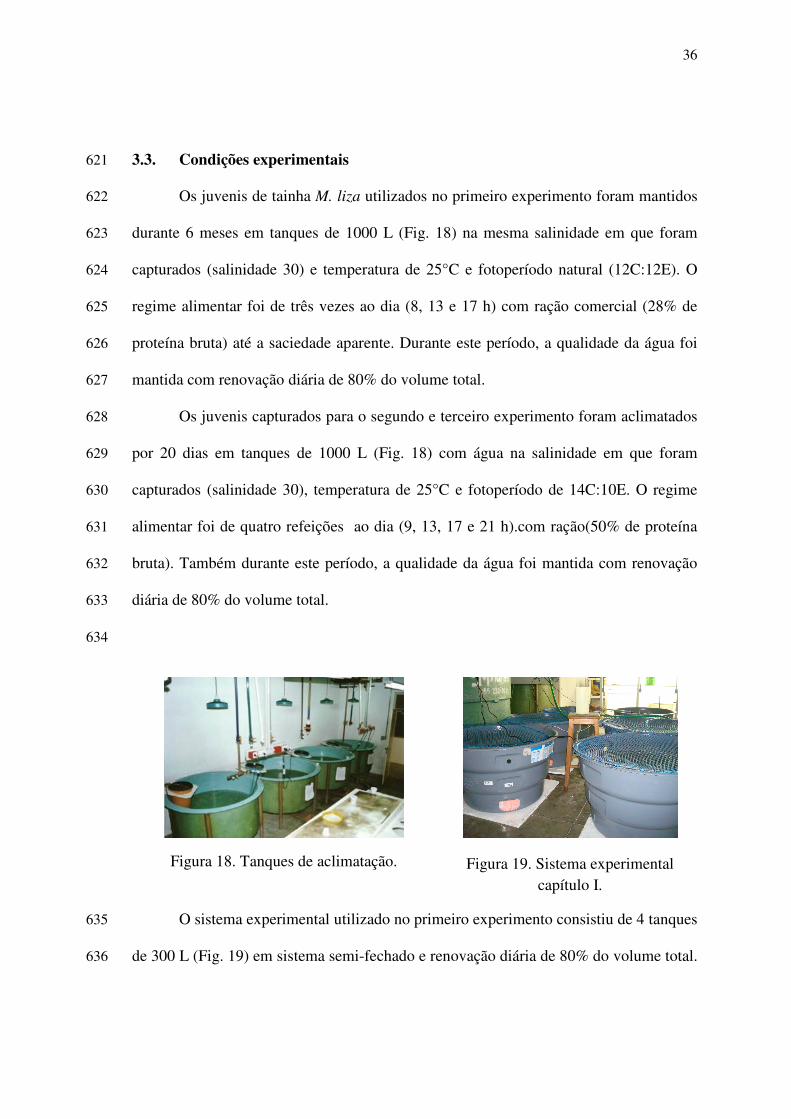
3.3. Condições experimentais 621
Os juvenis de tainha M. liza utilizados no primeiro experimento foram mantidos 622
durante 6 meses em tanques de 1000 L (Fig. 18) na mesma salinidade em que foram 623
capturados (salinidade 30) e temperatura de 25°C e fotoperíodo natural (12C:12E). O 624
regime alimentar foi de três vezes ao dia (8, 13 e 17 h) com ração comercial (28% de 625
proteína bruta) até a saciedade aparente. Durante este período, a qualidade da água foi 626
mantida com renovação diária de 80% do volume total. 627
Os juvenis capturados para o segundo e terceiro experimento foram aclimatados 628
por 20 dias em tanques de 1000 L (Fig. 18) com água na salinidade em que foram 629
capturados (salinidade 30), temperatura de 25°C e fotoperíodo de 14C:10E. O regime 630
alimentar foi de quatro refeições ao dia (9, 13, 17 e 21 h).com ração(50% de proteína 631
bruta). Também durante este período, a qualidade da água foi mantida com renovação 632
diária de 80% do volume total. 633
634
Figura 18. Tanques de aclimatação.
Figura 19. Sistema experimental capítulo I.
O sistema experimental utilizado no primeiro experimento consistiu de 4 tanques 635
de 300 L (Fig. 19) em sistema semi-fechado e renovação diária de 80% do volume total. 636

37
Já o sistema utilizado no segundo e terceiro experimento foi composto de 16 tanques de 637
50 L (Fig. 20) em sistema de recirculação, tratamento com UV e filtro mecânico e 638
biológico (Fig. 21). 639
Figura 20. Sistema experimental experimento II (Foto: Viviana Lisboa).
Figura 21. Biofiltro (Foto: Viviana Lisboa)
640
Figura 22. Biometrias (Foto: Cristina Avelar)
Figura 23. Coleta de tecidos (Foto: Andrea Ferreto)
641
3.4. Parâmetros analisados 642
Ao final do período de experimental, os peixes foram anestesiados e procedidas as 643
medidas biométricas (Fig. 26) e a coleta de tecidos (sangue, brânquias e fígado) (Fig. 26). 644
645

38
3.4.1. Índices zootécnicos 646
Ao final dos experimentos foram avaliados os seguintes parâmetros: 647
- Percentual de sobrevivência 100)( xNi
NfNiS
−= 648
onde: Ni é o número inicial e Nf é o número final de peixes. 649
- Taxa específica de crescimento (SGR) 100xTempo
LnpiLnpf
−= 650
onde: pi e pf são o peso inicial e final do peixe, respectivamente. 651
- Eficiência alimentar
=
)(
)()(
gAO
gGBEA 652
onde: GB é o ganho de biomassa e AO é o alimento ofertado (g). 653
- Coeficiente de variação do peso 100)(
)( xgMpeso
DECVpeso
= 654
onde: DE é o desvio padrão e Mpeso é a média do peso. 655
- Fator de condição
=
)(
)()(
3 cmC
gpesoFC 656
onde: C é o comprimento total (cm). 657
658
3.4.2. Osmolalidade plasmática 659
A osmolalidade plasmática foi determinada por depressão do ponto de 660
congelamento, utilizando-se um semi-micro osmômetro (Knauer, Alemanha) (Figura 661
24). Os resultados serão expressos em mOsmoles/Kg H2O. 662

39
Figura 24. Semi-micro osmômetro utilizado para determinação da osmolalidade (Foto: Viviana Lisboa)
3.4.3. Atividade da Na+,K+-ATPase 663
A análise da atividade da enzima foi realizada de acordo com a metodologia 664
descrita por McCormick (1993). As amostras de brânquias coletadas foram 665
homogeneizadas com 300 µl de tampão SEID em homogeneizador do tipo Potter (Nova 666
Técnica – Piracicaba, SP, Brasil; Fig. 25) e posteriormente centrifugadas (Mikro22R, 667
Hettich, Alemanha) a 4°C durante 1 min. 668
669
670
Figura 25. Homogeneizador do tipo Potter utilizado para homogeneizar as amostras de 671
tecidos. (Foto: Viviana Lisboa) 672

40
A placa de determinação foi montada (Figura 26) com 10 µl do sobrenadante e 673
300 µl das soluções de reação (soluções A e B) e a absorbância lida em leitora de 674
microplaca (VICTORTM2, Perkin Elmer, EUA) (Fig. 31). Por sua vez, a análise da 675
concentração de proteína no homogeneizado foi realizada utilizando-se um kit 676
comercial de reagentes para determinação de proteínas totais (Doles, Goiânia, GO, 677
Brasil). 678
Figura 26. Montagem da placa para análise da atividade enzimática (Foto: Clívea Martins)
3.4.4. Taxa de consumo de oxigênio corporal 679
O consumo de oxigênio foi medido de acordo com a metodologia descrita por 680
Cunha et al. (2009). A concentração de oxigênio foi medida a cada 15 min com auxílio 681
de um oxímetro (modelo YSI 55, Hexis) (Fig. 27). Somente foram realizadas medidas 682
quando a teor de oxigênio dissolvido na água era igual ou superior a 70% de saturação, 683
a fim de evitar o efeito da redução do teor de oxigênio dissolvido sobre a taxa 684

41
respiratória do peixe. A taxa de consumo de oxigênio (OCR) foi então calculada 685
conforme a seguinte fórmula: 686
TxB
xVOfOiOCR
)( −= 687
onde: Oi e Of correspondem respectivamente às concentrações inicial e final de 688
oxigênio (mg O2 L-1), V é o volume do tanque (L), B é a biomassa no tanque (g) 689
e T é o tempo durante o qual foi realizada a medição (h). 690
Figura 27. Medida do consumo de oxigênio (Foto: Joana Vogeley)
691
3.4.5. Conteúdo hepático de glicogênio 692
A análise da concentração hepática de glicogênio foi realizada através da 693
metodologia glicose-oxidase adaptada de Carr & Neff (1984). As amostras de fígado 694
foram coletadas foram pesadas (± 200 mg) e homogeneizadas com tampão citrato de 695
sódio (0,1 M) na proporção de 10% do peso da amostra. Após homogeneização, as 696
amostras permaneceram em banho-maria por 5min. Foi então coletada uma alíquota de 697
42
100 µl de homogeneizado e adicionados 20 µl de amiloglucosidase que, junto com os 698
padrões de glicogênio, foram mantidos em estufa a 55°C durante 2,5 h. Após este 699
período, as amostras foram centrifugadas a 7.000 rpm durante 30 min. 700
O padrão 1 correspondeu a 300 µl de reagente de cor e 10 µl de glicogênio, 701
enquanto o padrão 2 foi feito com 300 µl de reagente de cor e 10 µl de glicose. A placa 702
de determinação foi preparada (Figura 28) com 300 µl reagente de cor (Kit Glicose 703
enzimática líquida, DOLES, Goiânia, GO, Brasil), 10 µl da amostra, 10 µl de tampão 704
citrato de sódio e os padrões de glicogênio e glicose (Fig. 18). A absorbância das 705
amostras foi lida em leitor de microplaca (Vitor, Perkin-Elmer, EUA) (Fig. 29). 706
707
Figura 28. Montagem da placa (Foto: Clívea Martins)
Figura 29. Analisador de microplaca (Foto: Clívea Martins)
708
3.5. Análise dos dados 709
Para cada parâmetro analisado nos três experimentos, os dados médios (± erro 710
padrão) foram comparados entre si por análise de variância (ANOVA) seguida do teste 711
43
a posteriori de Tukey. Os pressupostos da ANOVA (normalidade dos dados e 712
homogeneidade de variâncias) foram previamente testados. O nível de significância a 713
adotado foi de 95% (α = 0,05). A comparação entre as médias dos valores da 714
osmolalidade da água de cada salinidade testada e do plasma no experimento 1foi 715
realizada com o teste t de “Student” não pareado. Para determinação do ponto 716
isosmótico, as médias dos valores da osmolalidade da água e do plasma foram 717
submetidos a regressão linear. O coeficiente de correlação de Pearson foi utilizado na 718
avaliação da correlação entre o consumo de oxigênio corporal e a atividade da Na+,K+-719
ATPase branquial no experimento 2. Os dados da atividade da Na+,K+-ATPase 720
branquial e concentração de glicogênio hepático no experimento 1 e os dados de ganho 721
de peso e nível de suplementação de sal no experimento 3 foram sujeitos a análise de 722
regressão não-linear (polinomial, quadrática) e para o cálculo do melhor nível de 723
suplementação de sal no experimento 3 foi aplicada a fórmula –b/2a (Shearer 2000). 724
725
726
727
728
729
730
731

44
CAPÍTULO I 732
733
734
735
736
737
738
739
A aclimatação de juvenis de Mugil liza a salinidade ambiental 740
741
742
743
744
745
746
747
748
749
750
751
1 Artigo submetido a revista Aquaculture Research. 752
2 A forma integral deste estudo se encontra no Anexo I desta Tese. 753
45
RESUMO 754
755
A sobrevivência e os parâmetros fisiológicos associados com o metabolismo e a 756
osmorregulação foram avaliados em juvenis da tainha Mugil liza aclimatados em 757
diferentes salinidades (5, 10, 20, 30 e 40‰) durante 15 dias. A temperatura (25°C) e o 758
fotoperíodo (12D:12N) foram controlados. Os peixes foram alimentados duas vezes ao 759
dia com ração comercial (28% PB) até a saciedade aparente. Após a aclimatação, foi 760
medida a taxa corporal de consumo de oxigênio e os peixes foram eutanizados para 761
coleta de sangue, brânquias e fígado. A faixa de salinidade testada não apresentou 762
influencia sobre a taxa corporal de consumo de oxigênio (0,39 ± 0,03 mg O2 g-1h-1) e a 763
osmolalidade plasmática (417,6 ± 18,0 mOsmol Kg-1). O ponto isosmótico foi estimado 764
em 412,7 mOsmol Kg-1 (13,5‰ salinidade). A atividade da Na+,K+-ATPase branquial 765
foi menor nas salinidades 20 e 30‰, enquanto o concentração de glicogênio hepático 766
foi maior na salinidade 20‰. Os resultados indicam que juvenis de M. liza são capazes 767
de se aclimatar em um curto intervalo de tempo (15 dias) a uma ampla faixa de 768
salinidade (5-40‰). Esta habilidade é possível devido a ajustes na atividade da Na+,K+-769
ATPase branquial e do metabolismo do energético para regular a osmolalidade 770
plasmática e o metabolismo energético aeróbico. Finalmente, os resultados apontam 771
para possibilidade da criação de juvenis da tainha M. liza em águas estuarinas e 772
marinhas. 773
774
775

46
CAPÍTULO II 776
777
778
779
780
781
782
783
784
785
786
O efeito da salinidade na sobrevivência, crescimento e parâmetros bioquímicos em 787
juvenis da tainha Mugil liza 788
789
790
791
792
793
794
795
796
797
798
1 Artigo submetido a revista Aquaculture Research. 799
2 A forma integral deste estudo se encontra no Anexo II desta Tese. 800

47
RESUMO 801
802
Teoricamente o custo energético da osmorregulação pode ser minimizado quando um peixe 803
teleosteo é mantido numa condição isosmótica. Também é esperado que a energia poupada 804
nessa condição possa beneficiar o crescimento. Portanto, o objetivo desse estudo foi avaliar o 805
crescimento e a performance metabólica de juvenis da tainha Mugil liza criada durante 40 dias 806
nas salinidades (0, 6, 12 e 24‰) correspondentes a 0, 50, 100 e 200% do ponto isosmótico da 807
espécie (salinidade 12‰). Os tratamentos foram realizados com quatro repetições contendo 30 808
peixes por tanque (peso 0,48 ± 0,1 g e comprimento 3,27 ± 0,1cm). A temperatura da água e a 809
saturação de oxigênio foram mantidas em 28,2 ± 0,1°C e acima de 90%, respectivamente. Os 810
peixes foram alimentados com dieta artificial (50% PB) quatro vezes ao dia até a saciedade 811
aparente. Os resultados demonstraram que a salinidade influencia o crescimento de juvenis da 812
tainha. Os exemplares criados na salinidade 24‰ cresceram mais que os mantidos em água 813
doce (salinidade 0 ‰). A atividade da enzima Na+,K+-ATPase nas brânquias e o consumo de 814
oxigênio apresentaram o padrão de resposta quadrático, com a ocorrência dos valores menores 815
nas salinidades intermediárias. Já o conteúdo de glicogênio hepático apresentou uma relação 816
direta com o aumento da salinidade, mas não houve diferença significativa entre as salinidades. 817
Analisados em conjunto, os resultados indicam que a demanda energética da osmorregulação 818
em juvenis de M. liza pode ser minimizada em ambiente isosmótico. Entretanto, a quantidade de 819
energia poupada parece não ser suficientemente significante para beneficiar o seu crescimento. 820
Também há uma indicação de que a tainha é capaz de alternar seu substrato energético durante a 821
sua aclimatação à salinidade. 822
Palavras-chave: glicogênio, crescimento, tainha, Na+/K+-ATPase, salinidade, consumo de 823
oxigênio. 824

48
CAPÍTULO III 825
826 827
828
829
830
831
832
833
834
835
A suplementação de sal na dieta para juvenis de Mugil liza mantidos em água doce 836
837
838
839
840
841
842
843
844
845
846
847
1 Artigo no formato de submissão para revista Fish Physiology and Biochemistry. 848
2 A forma integral deste estudo se encontra no Anexo III desta Tese. 849

49
RESUMO 850
A suplementação de sal na dieta para peixes marinhos/estuarinos é utilizada para 851
melhorar seu desempenho quando criados em baixa salinidade e/ou em água doce. A 852
tainha Mugil liza é uma espécie eurialina e pode ser criada em água doce. O objetivo 853
deste estudo foi avaliar sua performance zootécnica e fisiológica em água doce e 854
alimentados com ração suplementada com quatro níveis de NaCl durante 45 dias. A 855
concentração de sal (Na+) das dietas foi determinada por espectrofotômetro de absorção 856
atômica e correspondeu a 0,9, 5,4, 8,0, e 13,2% de suplementação de sal (SS). Um total 857
de 240 peixes (peso 4,5 ± 0,1g e comprimento 7,41 ± 0,03cm) foi distribuído 858
aleatoriamente em 16 tanques colocados em um sistema de recirculação de água 859
equipado com filtro mecânico e biológico, controle de temperatura e esterilização por 860
UV. A temperatura se manteve em 27 °C, a saturação de oxigênio acima de 89% e o 861
fotoperíodo foi de 14C:14E. Os peixes foram alimentados três vezes ao dia até a 862
saciedade aparente. A sobrevivência (S), eficiência alimentar aparente (EAA) e a 863
concentração de glicogênio hepático entre os tratamentos foram similares (p>0,05). 864
Entretanto, a taxa de crescimento específica (G), o consumo de ração e o Coeficiente de 865
Condição de Fulton (FC) decresceram com o aumento dos níveis de suplementação de 866
sal (p<0,05). A concentração de Na+ acima de 5,4% prejudicou o crescimento das 867
tainhas, enquanto a G e AFC e a atividade da Na+- K+- ATPase foram, respectivamente, 868
mais baixos e mais alta especificamente em 13,2% SS (p<0,05). A similaridade da EAA 869
entre os tratamentos associado a menor G, menor consumo de alimento, a maior 870
atividade da Na+- K+- ATPase em 13,2% SS pode ser causada pela pior palatabilidade 871

50
da ração e pelo aumento na secreção de sal em excesso na dieta. Finalmente, os juvenis 872
de tainha alimentados com ração suplementada até 5,4% SS apresentaram uma resposta 873
zootécnica e fisiológica positiva, comparada a juvenis alimentados com a maior 874
concentração de sal. Entretanto, o melhor nível de Na+ para o crescimento foi 875
determinado em 2,6%. 876
Palavras-chave: Suplementação de sal, osmorregulação, água doce. 877
878
879
880
881
882
883
884
885
886
887
888
889
890
891
892
893
894

51
CONCLUSÕES GERAIS 895
896
Capítulo I 897
A partir dos resultados obtidos no primeiro experimento foi possível calcular a 898
salinidade isosmótica da espécie em estudo, tendo assim sido possível demonstrar que 899
juvenis da tainha Mugil liza possui um mecanismo osmorregulatório bem desenvolvido, 900
que lhe capacita a tolerar uma ampla faixa de variação de salinidade de forma tão 901
eficiente que nenhum dos parâmetros fisiológicos analisados no estudo para monitorar o 902
comportamento da espécie frente à salinidade ambiental foi afetado por este parâmetro. 903
Entretanto, o suprimento de energia metabólica necessária para a manutenção da 904
osmorregulação parece ser pelo menos em parte, oriunda da mobilização das reservas 905
hepáticas de glicogênio. 906
Capítulo II 907
Os resultados obtidos no segundo experimento demonstraram que a tainha M. 908
liza em seus estágios iniciais do desenvolvimento também possuem seus mecanismos 909
osmorregulatórios bem estabelecidos e que existe uma tendência de menor gasto 910
energético em salinidades ambientais em torno daquela isosmótica em relação aos 911
fluídos corporais do peixe. Entretanto, a quantidade de energia poupada nesta condição 912
ambiental não é significativamente suficiente para incrementar o crescimento do animal, 913
que por sua vez está reduzido em água doce quando comparado com aquele observado 914
em águas salobras e marinhas. Além disso, foi observado que nesta faixa de 915

52
desenvolvimento o fornecimento de energia metabólica para a manutenção da 916
osmorregulação não provém de suas reservas hepáticas de glicogênio. 917
918
Capítulo III 919
O terceiro experimento demonstrou que a suplementação de sal na dieta para 920
juvenis de M. liza mantidos em água doce proporcionou um resultado positivo tanto em 921
seu desempenho zootécnico quanto fisiológico. Entretanto, a suplementação de sal na 922
dieta deve ser aplicada em níveis adequados para espécie, visto que quando realizada 923
em excesso pode, além de prejudicar a palatabilidade do alimento e afetar/diminuir o 924
seu consumo, gera um maior gasto energético devido a necessidade de excretar este 925
excesso de sal do organismo. Também deve ser levada em consideração a manutenção 926
do equilíbrio nutricional da ração após a manipulação desta, visto que seu desbalanço 927
nutricional também pode afetar o crescimento de forma indireta. Similarmente, o 928
fornecimento de energia metabólica para o reestabelecimento da homeostase parece não 929
ser proveniente das reservas energéticas de glicogênio hepático. Desta forma, o melhor 930
nível de suplementação de sal na dieta para juvenis desta espécie foi estimado em 2,6%. 931
932
933
934
935
936

53
CONSIDERAÇÕES FINAIS 937
Esta tese foi desenvolvida com o objetivo de avaliar o efeito da 938
salinidade no desempenho zootécnico e fisiológico da tainha Mugil liza e sua 939
implicação no desenvolvimento de tecnologia para sua produção em cativeiro. 940
Inicialmente, exemplares da espécie foram submetidos a uma ampla faixa de salinidade 941
para, além de avaliar seu comportamento osmorregulatório, determinar a salinidade 942
ambiental que é isosmótica aos fluídos corporais do peixe. Os resultados demonstraram 943
que juvenis de M. liza são capazes de manter sua homeostasia osmorregulatória 944
independente da salinidade ambiental e que, ao menos em parte, o custo energético dos 945
processos fisiológicos para reestabelecer sua homeostasia provém da mobilização de 946
suas resevas de glicogênio hepático. 947
Uma vez que foi descrito para algumas espécies, e não para outras, que o 948
crescimento é incrementado em salinidade isosmótica, no segundo experimento 949
realizado nesta tese exemplares de M. liza foram submetidos por 40 dias a salinidades 950
correspondentes a 0, 50, 100 e 200% da salinidade isosmótica, a fim de verificar se a 951
“Teoria Isosmótica” seria aplicável à espécie em estudo. Os resultados obtidos 952
demonstraram que a salinidade ambiental na faixa testada não afetou a sobrevivência da 953
tainha. Além disso, mostrou que indivíduos nas fases iniciais de desenvolvimento 954
também conseguem manter a sua homeostasia osmótica independente da salinidade do 955
ambiente externo, apresentando uma tendência geral de menor gasto energético com a 956
osmorregulação quando a salinidade do meio externo está isosmótica àquela do meio 957
interno. No entanto, ficou evidente que o ambiente dulcícola prejudica o crescimento 958

54
dos indivíduos da espécie estudada. Também foi observado que nesta faixa de 959
desenvolvimento o fornecimento de energia metabólica para a manutenção de sua 960
homeostase não provém da mobilização das reservas de glicogênio hepático. 961
Visto que o crescimento foi prejudicado em água doce e que a suplementação de 962
sal na ração é uma prática estabelecida para algumas espécies, o terceiro estudo foi 963
desenvolvido para avaliar se a suplementação de sal poderia amenizar o efeito negativo 964
do ambiente dulcícola sobre o crescimento de juvenis da tainha M. liza. Exemplares 965
juvenis desta espécie foram então mantidos em água doce e alimentados com ração 966
suplementada com 0,9, 5,4, 8,0 e 13,2% de sódio na ração durante 45 dias. A 967
suplementação de sal até atingir um conteúdo de 5,4% de sal na ração proporcionou um 968
resultado positivo tanto no desempenho zootécnico quanto fisiológico da espécie. No 969
entanto, o teor de sódio ideal na ração foi estimado em 2,6%. Assim, fica claro que a 970
suplementação de sal na dieta deve ser aplicada em níveis adequados para cada espécie, 971
visto que o excesso de sal pode prejudicar a palatabilidade do alimento e, 972
consequentemente, diminuir o seu consumo. Além disso, o excesso de sal também pode 973
elevar o gasto energético devido à necessidade de excreção deste excesso de sal pelo 974
organismo. Também deve ser levada em consideração a necessidade da manutenção do 975
equilíbrio nutricional da ração, pois a manipulação da ração pode provocar um 976
desbalanço nutricional e de forma indireta prejudicar o crescimento do peixe. 977
Similarmente ao observado no segundo experimento, a energia canalizada para o 978
reestabelecimento da homeostase em tainhas mantidas em água doce e alimentadas com 979

55
ração suplementada com sal parece não ser proveniente das reservas energéticas de 980
glicogênio hepático. 981
De modo geral, os resultados apresentados nesta tese demonstram que a tainha 982
M. liza possui um mecanismo osmorregulatório bem desenvolvido desde seus estágios 983
iniciais de desenvolvimento, capacitando assim a espécie a manter sua homeostasia 984
osmorregulatória independente da salinidade ambiental. Entretanto, o tipo de substrato 985
priorizado na manutenção da demanda energética excedente em situações não ideais 986
para a manutenção do funcionamento dos processos fisiológicos difere com o período 987
de desenvolvimento. Por fim, a presente tese confirma o potencial que M. liza possui 988
para aquicultura. Porém, mais estudos são necessários para o estabelecimento da 989
tecnologia de criação desta espécie. 990
991
992
993
994
995
996
997
998
999
1000

56
BIBLIOGRAFIA 1001
ANDRADE-TALMELLI, EF, E ROMAGOSA, MY NARAHARA & HM GODINHO. 1002
1996. Características reprodutivas de tainha Mugil planatus (Teleostei, 1003
Peciformes, Mugilidae) da região estuarino-lagunar de Cananéia, São Paulo. 1004
Revista Ceres, 43 (246): 165-185. 1005
AZIM, ME, MCJ VERDEGEM, MM RAHMAN, MA WAHAB, AA DAM VAN & 1006
MCM BEVERIDGE. 2002. Evaluation of polyculture of Indian major carps in 1007
periphyton-based ponds. Aquaculture, 213: 131–149. 1008
BALDISSEROTTO B 2009. Fisiologia de Peixes Aplicada à Piscicultura, 2 ed., Editora 1009
UFSM. Santa Maria. Brasil. 352p. 1010
BALDISSEROTTO B, ROMERO JMM. & KAPOOR BG. 2007. Fish Osmoregulation. 1011
Science Publishers. New Hampshire. USA. 527p. 1012
BOEUF G & P PAYAN. 2001. How should salinity influence fish growth? 1013
Comparative Biochemistry and Physiology C, 130: 411–423. 1014
CAFSI, M EL, MS ROMDHANE, A CHAUOUCH, W MASMOUDIA, S KHE´RIJIA, 1015
F CHANUSSOTD & CHER`RIF. 2003. Qualitative needs of lipids by mullet, 1016
Mugil cephalus, fry during freshwater acclimation. Aquaculture, 225: 233-241. 1017
CANDIDO, AS, AP MELO JÚNIOR, CHA SANTOS, HJMS COSTA & MA 1018
IGARASHI. 2006. Policultivo do camarão marinho (Litopenaeus vannamei) com 1019
tilápia do Nilo (Oreochromis niloticus). Arq. ciên. vet. zool., 9 (1): 9-14. 1020

57
CARR, RS & JM NEFF. 1984. Quantitative semi-automated enzymatic assay for tissue 1021
glycogen. Comparative Biochemistry and Physiology B, 77: 447-449. 1022
CARVALHO, CVA, A BIANCHINI, M TESSER & LA SAMPAIO. 2010. The effect of 1023
protein levels on growth, postprandial excretion and tryptic activity of juvenile 1024
mullet Mugil planatus (Gunther). Aquaculture Research, 41: 511-518. 1025
COSTA, LCO, LFM NEVES, JA XAVIER, VC LISBOA, MRC FIGUEIREDO & WFB 1026
WASIELESKY JR. 2008. Policultivo de tainha Mugil platanus com camarão 1027
Litopenaeus vannamei em viveiros de terra no extreme sul do Brasil. 45ª Reunião 1028
Anual da Sociedade Brasileira de Zootecnia. Anais. Lavras, MG – UFLA. 1029
CUNHA VL, RV RODRIGUES, MH OKAMOTO & LA SAMPAIO. 2009. Consumo 1030
de oxigênio pós-prandial de juvenis do pampo Trachinotus marginatus. Ciência 1031
Rural, 49: 1257-1259. 1032
DA SILVA ROCHA A.J., V GOMES, P.VAN NGAN, M.J. DE A.C.R. PASSO, R.R. 1033
FÚRIA. 2005. Metabolic demand and growth of juveniles of Centropomus 1034
parallelus as function of salinity. Journal of Experimental Marine Biology and 1035
Ecology 316: 157-165. 1036
FERREIRA, FA. 2006. Desenvolvimento de produto tipo caviar a base de ovas de 1037
tainha (Mugil platanus). Dissertação de Mestrado em Engenharia de Alimentos, 1038
Universidade Federal do Rio Grande (FURG), Brasil, 77 p. 1039

58
FISCHER, LG, JP VIEIRA & LED PEREIRA. 2011. Peixes estuarinos e 1040
costeiros. 2.ed. Rio Grande, Luciano Gomes Fischer. 130 p. 1041
FONSECA NETO & H SPACH. 1998/1999. Survival of juveniles of Mugil platanus 1042
Günther, 1880 (Pisces, Mugilidae) in different salinities. Boletim do Instituto de 1043
Pesca, 25:13-17. 1044
FOOD and AGRICULTURE ORGANIZATION of the UNITED NATIONS (FAO) 1045
2010. The State of World Fisheries and Aquaculture 2010. Rome, FAO – Fisheries 1046
and Aquaculture department. 197p. Disponível na internet no endereço: 1047
http://www.fao.org/docrep/013/i1820e/i1820e.pdf. Acessado em 24/10/2012. 1048
GALVÃO, MSN, N YAMANAKA, N FENERICH-VERANI & CMM PIMENTEL. 1049
1997. Estudos preliminares sobre enzimas digestivas proteolíticas da tainha Mugil 1050
planatus Günther, 1880 (Osteichthyes, Mugilidae) durante as fases larval e 1051
juvenil. Boletim do Instituto de Pesca, 24: 101-110. 1052
GARG, SK & A BHATNAGAR. 2000. Effect of fertilization frequency on pond 1053
productivity and fish biomass in stillwater ponds stocked with Cirrhinus mrigala 1054
(Ham.). Aquaculture Research, 31: 409–414. 1055
GATLIN III, DM. 2002. Fish Nutrition. JE Halver and RW Hardy (Eds.), 3rd edition. 1056
London: Academic Press. 1057
GODINHO, HM, PCS SERRALHEIRO & JD SCORVO FILHO. 1988. Revisão e 1058
discussão de trabalhos sobre a espécie do gênero Mugil (Teleostei, Peciformes, 1059

59
Mugilidae) da costa brasileira (Lat.3°S-33°S). Boletim do Instituto de Pesca, 1060
15(1): 67-80. 1061
GODINHO HM, ET KAVAMOTO, EF ANDRADE-TALMELLI, PCS 1062
SERRALHEIRO, P PAIVA & EM FERRAZ.1993. Induced spawning of the 1063
mullet Mugil pl atanus (Gunther, 1880), in Cananéia, São Paulo, Brazil. Boletim 1064
do Instituto de Pesca, 20: 59-66. 1065
GODINHO, HM. 2005. Tainha. Páginas 433-444 In: BALDISSEROTTO, B, LC 1066
GOMES, (Org.). Espécies Nativas para Piscicultura no Brasil. UFSM Press, Santa 1067
Maria pp. 541-558. 1068
HANDELAND SO, A BERGE, BTH BJORNSSON & SO STEFANSSON. 1998. 1069
Effect of temperature and salinity on osmoregulation and growth of Atlantic 1070
salmon (Salmo salar L.) smolts in seawater. Aquaculture, 168: 289-302. 1071
HERRERA M, L VARGAS-CHACOFF, I HACHERO, I RUÍZ-JARABO, A 1072
RODILES, JIN NAVAS & JM MANCERA. 2009. Osmoregulatory changes in 1073
wedge sole (Dicologoglossa cuneata Moreau, 1881) after acclimation to different 1074
environmental salinities. Aquaculture Research, 40: 762-771. 1075
HWANG P-P & LEE T-T. 2007. New insights into fish ion regulation and 1076
mitochondrion-rich cells. Comparative Biochemistry and Physiology A, 148: 479-1077
497. 1078
JOBLING, M. 1994. Fish Bioenergetics. London: Chapman & Hall. 294 p. 1079

60
KESHAVANATH, P, TJ RAMESH, B GANGADHAR, MCM BEVERIDGE, AA 1080
VAN DAM & MCJ VERDEGEM. 2001. Farm evaluation of Indian major carp 1081
production with sugarcane Bagasse as substrate for periphyton. Asian Fish. Sci., 1082
14: 367–376. 1083
KIDDER III GW, CW PETERSEN & RL PRESTON. 2006. Energetics of 1084
osmoregulation: II. Water Flux and osmoregulatory Work in the Euryhaline Fish, 1085
Fundulus heteroclitus. Journal of Experimental Zoology A, 305: 318-327. 1086
KINNE, O. 1967. Physiology of estuarine organisms with especial reference to salinity 1087
and temperature: general aspects, p: 525-540. In: LAUFF, GH (ED). Estuaries. 1088
Hardcover, Washington, DC, 757 p. 1089
LUPARSCH, I, T KATZ & DL ANGEL. 2003. Assessment of removal efficiency of 1090
fish farm effluents by grey mullets: a nutritional approach. Aquaculture Research, 1091
34: 1367-1377. 1092
MAÇADA, AP, MH OKAMOTO & LA SAMPAIO. 2000. Avaliação preliminar do 1093
cultivo de tainha Mugil platanus em tanque-rede. In: XIII Semana Nacional de 1094
Oceanografia (Anais), Itajaí, SC, 684-686 p. 1095
MC CORMICK, SD. 1993. Methods for non-lethal gill biopsy and measurement of Na+, 1096
K+-ATPase activity. Canadian Journal of Aquatic Sciences, 50: 656-658. 1097
MENEZES, AN & JL FIGUEIREDO 1980. Manual de peixes marinhos do sudeste do 1098
Brasil. São Paulo, USP. 96 p. 1099

61
MENEZES, NA, C OLIVEIRA & M NIRCHIO. 2010. An old taxonomic dilemma: the 1100
identity of the western south Atlantic lebranche mullet (Teleostei: Perciformes: 1101
Mugilidae). Zootaxa, 2519: 59-68. 1102
MEURER, F, C HAYASHI, WR BOSCOLO & CM SOARES. 2002. Lipídeos na 1103
Alimentação de Alevinos Revertidos de Tilápia do Nilo (Oreochromis niloticus, 1104
L.). R. Bras. Zootec., 32 (2): 566-573. 1105
MINISTÉRIO da PESCA e AQUICULTURA (MPA). 2010. BOLETIM 1106
ESTATÍSITCO DA PESCA E AQUICULTURA. Brasil 2008-2009. 101p. 1107
Disponível em: 1108
http://www.sepaq.pa.gov.br/files/u1/anuario_da_pesca_completo.pdf. Acessado 1109
em 24/10/2012. 1110
MIRANDA-FILHO, KC, W WASIELESKY & AP MAÇADA. 1995. Efeito da amônia 1111
e nitrito no crescimento da tainha Mugil platanus (Pisces:Mugilidae). Revista 1112
Brasileira de Biologia, 55: 45-50. 1113
MIRANDA FILHO, K, MB TESSER., LA SAMPAIO & HM GODINHO. 2010. 1114
Tainha. 541-558 p. In: BALDISSEROTTO, B & LC GOMES. Espécies Nativas 1115
para Piscicultura no Brasil, 2° edição. (ed. by B.). Editora da UFSM, Santa Maria. 1116
606 p. 1117
MORGAN, JD & GK IWAMA. 1991. Effects of salinity on growth, metabolism and 1118
ion regulation juvenile rainbow and steelhead trout (Oncorhynchus mykiss) and 1119
62
Chinook salmon (Oncorhynchus tshawytscha). Canadian Journal of Fisheries and 1120
Aquatic Sciences, 48: 2083-2094. 1121
MORGAN, IJ, ID MCCARTHY & NB METCALFE. 2000. Life-history strategies and 1122
protein metabolism in overwintering juvenile Atlantic salmon: growth is enhanced 1123
in early migrants through lower protein turnover. Journal of Fish Biology, 56: 1124
637-647. 1125
NELSON, DL & MM COX 2007. Lehninger, Principles of Biochemistry, 4 ed., Worth 1126
Pusblishers, New York. 1127
NORDLIE, FG. 2009. Environmental influences on regulation of blood plasma serum 1128
components in teleost fish: a review. Rev. Fish Biol. Fisheries, 19: 481-564. 1129
OKAMOTO, MH, LA SAMPAIO & AP MAÇADA. 2006. Efeito da temperatura sobre 1130
o crescimento e a sobrevivência de juvenis da tainha Mugil platanus Günther, 1131
1880. Atlântica, 28: 61-66. 1132
OLIVEIRA, AF & MA BEMVENUTI. 2006. Ciclo de vida de alguns peixes do estuário 1133
da Lagoa dos Patos, RS, informações para o ensino fundamental e médio. 1134
Cadernos de Ecologia Aquática, 1(2): 16-29. 1135
OLIVEIRA, IR & LSH SOARES. 1996. Alimentação da tainha Mugil platanus 1136
Günther, 1880 (Pisces: Mugilidae), da região estuarino-lagunas de Cananéia, São 1137
Paulo, Brasil. Boletim do Instituto de Pesca, 23: 95–104. 1138

63
O´NEILL, B, F DE RAEDEMAECKER, D MCGRATH & D BROPHY. 2011. An 1139
experimental investigation of salinity effects on growth, development and 1140
condition in European flounder (Platichthys flesus L.). Journal of Experimental 1141
Marine Biology and Ecology, 410: 39-44. 1142
PÉREZ-ROBLES, J, AD RE, I GIFFARD-MENA & F DÍAZ. 2011. Interactive effects 1143
of salinity on oxygen consumption, ammonium excretion, osmoregulation and 1144
Na+/K+-ATPase expression in bullseye puffer (Sphoeroides annulatus, Jenyns 1145
1842). Aquaculture Research, 43:1372-1383. 1146
RAMÍREZ, JA, A DEL ÁNGEL, RM URESTI, G VELASQUEZ & M VÁSQUES. 1147
2007. Low-salt restructured products from striped mullet (Mugil cephalus) using 1148
microbial transglutaminase or whey protein concentrate as additives. Food 1149
Chemistry, 102: 243-249. 1150
REIS, EG & F D’ INCAO. 2000. The present status of artisanal fisheries of extreme 1151
Southern Brazil: an effort to wards community-based management. Ocean & 1152
Coastal Management, 43: 585-595. 1153
ROMAGOSA, E, EFA TALMELLI, MY NARAHARA & HM GODINHO. 1999. Tipo 1154
de desova e fecundidade da Mugil platanus da região estuarino-lagunar de 1155
Cananéia, SP. Revista Atlântica, 22: 5-12. 1156

64
RODHY NR, NA NISSIF & KL MAIN 2010. Effects of salinity on growth and survival 1157
of common snook Centropomus undecimalis (Bloch, 1792) larvae. Aquaculture 1158
Research, 41:357-360. 1159
SCORVO FILHO, JD, ERA DIAS, LMS AYROZA & PFC NOVATO. 1992. Efeito da 1160
densidade sobre o desenvolvimento de alevinos da tainha listrada (Mugil 1161
platanus) em água doce. Boletim do Instituto de Pesca, 19: 105-109. 1162
SAMPAIO, LA, A MINILLO & AH FERREIRA. 1998. Growth of juvenile mullet 1163
(Mugil platanus) fed on different rations. In: Aquicultura Brasil ’98 (Anais), 1164
Recife, PB, 2: 109-115p. 1165
SAMPAIO, LA, AH FERREIRA & MB TESSER. 2001. Effect of stocking density on 1166
laboratory rearing of mullet fingerlings, Mugil platanus (Gunther, 1880). Act 1167
Scientiarum, 23: 471-475. 1168
SAMPAIO, LA & A BIANCHINI. 2002. Salinity effects on osmoregulation and growth 1169
of the euryhaline flounder Paralichthys orbignyanus. Journal of Experimental 1170
Marine Biology and Ecology, 269: 187-196. 1171
SAMPAIO, LA, W WASIELESKY JR & KC MIRANDA FILHO. 2002. Effect of 1172
salinity on acute toxicity of ammonia and nitrite to juvenile Mugil platanus. 1173
Bulletin of Environmental Contamination and Toxicology, 68: 668-674. 1174
SAOUD I.P., S. KREYDIYYEH, A. CHALFOUN & M. FAKIH. 2007. Influence of 1175
salinity on survival, growth, plasma osmolality and gill Na+-K+-ATPase activity in 1176

65
the rabbitfish Siganus rivulatus. Journal of Experimental Marine Biology and 1177
Ecology 348, 183-190. 1178
TAYLOR, JR & GROSELL. 2006. Feeding and osmoregulation: dual function of the 1179
marine teleost intestine. The Journal of Experimental Biology, 209: 2939-2951. 1180
TSENG, Y-C & P-P HWANG. 2008. Some insights into energy metabolism for 1181
osmoregulation in fish. Comparative Biochemistry and Physiology C 148: 419-1182
429. 1183
TSUZUKI, MY, JK SUGAI, JC MACIEL, CJ FRANCISCO & VR CERQUEIRA. 1184
2001. Survival, growth and digestive enzyme activity of juveniles of the fat snook 1185
(Centropomus parallelus) reared at different salinities. Aquaculture, 261: 319-1186
325. 1187
YAMANAKA, N, MSN GALVÃO, JR OLIVEIRA, CMM PIMENTEL, S TANJI, RA 1188
SILVA, MC PORTELLA, NET ROJAS & E ABUD. 1991. Larvicultura da tainha 1189
Mugil planatus em Cananéia, SP. In: Encontro Nacional de Pesca e Aqüicultura, 1190
Santos. Resumos... p.96. 1191
WOO, NYS & SP KELLY.1995. Effects of salinity and nutritional status on growth and 1192
metabolism of Sparus sarba in closed seawater system. Aquaculture, 135: 229-1193
238. 1194
VAN DEN THILLART, G & M VAN RAAIJ. 1995. Endogenous fuels; noninvasive 1195
versus invasive. In: HOCHACHKA PW & TP MOMMSEN (Eds).Biochemistry 1196

66
and Molecular Biology of Fishes, Volume 4, Metabolic Biochemistry, Elsevier 1197
Science, Amsterdam. 33-63 p. 1198
VIEIRA, JP. 1991. Juvenile Mullets (Pisces: Mugilidae) in the Estuary of Lagoa dos 1199
Patos, RS, Brazil. Copeia, 2: 409-418. 1200
VIEIRA, JP & C SCALABRIN. 1991. Migração reprodutiva da “tainha” (Mugil 1201
platanus) Günther 1880, no sul do Brasil. Atlântica, 13: 131-141. 1202
1203
1204
1205
1206
1207
1208
1209
1210
1211
1212
1213

67
ANEXO I 1214
1215
1216
1217
1218
1219
1220
1221
1222
Acclimation of juvenile lebranche mullet Mugil liza to environmental salinity 1223
1224
1225
1226
1227
1228
1229
1230
1231
1232
1233
1234
1235
Artigo submetido a revista Aquaculture Research 1236
68
Acclimation of juvenile lebranche mullet Mugil liza to environmental salinity 1237
Viviana Lisboa da Cunha1, Indianara Fernanda Barcarolli2, Luís André Sampaio3 and Adalto 1238
Bianchini2* 1239
1240
1Universidade Federal do Rio Grande - FURG, Instituto de Oceanografia, Programa de Pós-1241
graduação em Oceanografia Biológica, Av. Itália km 8, Campus Carreiros, 96203-900, Rio 1242
Grande, RS, Brazil 1243
1244
2Universidade Federal do Rio Grande – FU 1245
RG, Instituto de Ciências Biológicas, Av. Itália km 8, Campus Carreiros, 96203-900, Rio 1246
Grande, RS, Brazil 1247
1248
3Universidade Federal do Rio Grande - FURG, Instituto de Oceanografia, Laboratório de 1249
Piscicultura Marinha, Rua do Hotel nº 02, 96203-900, Querência, Rio Grande, RS, Brazil 1250
1251
*Corresponding author: Adalto Bianchini, Universidade Federal do Rio Grande - FURG, 1252
Instituto de Ciências Biológicas, Av. Itália km 8, Campus Carreiros, 96203-900, Rio Grande, 1253
RS, Brazil. Tel./Fax.: +55 53 3293 5193; e-mail: [email protected] 1254
1255
Running title: Salinity acclimation in juvenile mullet 1256

69
1257
Keywords: glycogen, mullet, Na+,K+-ATPase, salinity, osmoregulation, oxygen consumption 1258
Abstract 1259
Survival and physiological parameters associated with metabolism and osmoregulation were 1260
evaluated in juveniles of the lebranche mullet Mugil liza acclimated to different water salinities 1261
(5, 10, 20, 30, and 40‰) for 15 days. Room temperature (25°C) and photoperiod (12L:12D) 1262
were fixed. Fish were fed twice-a-day with commercial diet (28% crude protein) until satiation. 1263
After acclimation, whole-body oxygen consumption was measured and fish were euthanized 1264
and sampled for blood, gills, and liver. Whole-body oxygen consumption (0.39 ± 0.03 mg O2 g-1265
1h-1) and blood osmolality (417.6 ± 18.0 mOsmol Kg-1) did not change in the range of salinities 1266
tested. The isosmotic point was estimated as 412.7 mOsmol Kg-1 (13.5‰ salinity). Gill Na+,K+-1267
ATPase activity was lower at 20 and 30‰, while liver glycogen content was higher at 20‰ 1268
salinity. These results indicate that juvenile M. liza is able to acclimate for a short-period of 1269
time (15 days) to a wide range of salinities (5-40‰). This condition is achieved through 1270
adjustments in gill Na+,K+-ATPase activity and carbohydrate metabolism to regulate plasma 1271
osmolality and aerobic/energy metabolism. Therefore, our findings support the idea of growing 1272
juvenile lebranche M. liza in estuarine and marine waters.1273

70
1. Introduction 1274
1275
Aquaculture practices seek to develop a healthy and sustainable environment through 1276
the control of biotic and abiotic factors in order to maximize fish growth. Among abiotic 1277
factors, the influence of water salinity on fish growth has been widely reported (Tandler, Anav 1278
& Choshniak 1995; Woo & Kelly 1995; Sampaio & Bianchini 2002; Barman, Jana, Garg, 1279
Bhatnagar & Arasu 2005; Resley, Webb Jr. & Holt 2006). 1280
Euryhaline teleost fish can activate biochemical and physiological mechanisms to face 1281
changes in environmental salinity. In low salinities, i.e. below the isosmotic point, they absorb 1282
salts (Na+ and Cl-) through the gills to counteract the diffusive loss of ions. In turn, the osmotic 1283
gain of water is compensated by production and copious excretion of dilute urine. In high 1284
salinities, i.e. above the isosmotic point, they drink and desalinize salt water at the digestive 1285
tract. In this case, water is osmotically absorbed through the intestinal wall and the excess of 1286
salts (Na+ and Cl-) is actively secreted at the gills. As a result, a water gain and salt loss is 1287
achieved, thus counteracting the obligatory osmotic loss of water and the diffusive gain of salts 1288
associated with the osmotic gradient existing between the fish blood plasma and salt water. 1289
Playing with these homeostatic mechanisms, euryhaline teleost fish are able to keep their blood 1290
osmolality more or less constant over a wide range of water salinities (Baldisseroto 2009). 1291
It is clear from the above that changes in energy consumption are expected to occur 1292
associated with fish osmotic regulation over a wide range of environmental salinities. According 1293
to Handeland, Berge, Bjornsson and Stefansson (1998), the osmoregulatory cost is proportional 1294
to the osmotic gradient. Therefore, lower energy expenditure would be expected to occur when 1295
fish blood plasma is isosmotic with the environmental medium. Indeed, an isosmotic 1296
71
environment has been reported to maximize fish growth, since less energy would be spent in the 1297
osmoregulatory process (Woo & Kelly 1995; Boeuf & Payan 2001; Sampaio & Bianchini 2002; 1298
Tsuzuki, Sugai, Maciel & Cerqueira 2007; Herrera, Vargas-Chacoff, Hachero, Ruíz-Jarabo, 1299
Rodiles, Navas & Mancera 2009; Nordlie 2009). This phenomenon will be referred hereafter as 1300
the “Isosmotic Theory”. According to this theory, the energy spared on osmoregulation can be 1301
used for fish growth maximization. However, there is still no consensus on the significance of 1302
the energy sparing mechanism as being an important one that would actually improve fish 1303
growth. Furthermore, this phenomenon seems to be species-specific (Jobling 1994). Accurate 1304
measurements of the amount of energy spared when fish are maintained at an isosmotic 1305
environment are difficult to perform because of the complex interactions existing among the 1306
osmoregulatory mechanisms and other physiological processes, which are in turn influenced by 1307
environmental factors, as well as the methodology employed. Boeuf and Payan (2001) reported 1308
that the energy spared by fish with osmoregulation can range from 10% to more than 50% of the 1309
total energy budget. 1310
Blood osmolality, gill Na+,K+-ATPase activity, whole-body oxygen consumption and 1311
liver glycogen content are physiological parameters usually measured to evaluate the effect of 1312
salinity in fish (McCormick 1995; Da Silva Rocha, Gomes, Van Ngan, Passo & Fúria 2005; 1313
Baldisserotto, Romero & Kapoor 2007; Saoud, Kreydiyyeh, Chalfoun & Fakih 2007). While 1314
blood osmolality and gill Na+,K+-ATPase activity are directly related to the function of the 1315
osmoregulatory mechanisms, whole-body oxygen consumption and liver glycogen content are 1316
indirectly associated with the osmotic energy demand. 1317
The taxonomic status of Mugilidae from the Caribbean and South American Atlantic 1318
coast has been recently revised. Fish previously identified as Mugil platanus are now correctly 1319
identified as the lebranche mullet Mugil liza (Menezes, Oliveira and Nirchio 2010). This teleost 1320

72
fish is an important item for estuarine and coastal fisheries in Southern South America (Reis & 1321
D’Incao 2000). Furthermore, it has being considered for aquaculture in estuarine and marine 1322
waters in Brazil. The lebranche mullet shows a small dietary protein requirement (Carvalho, 1323
Bianchini, Tesser & Sampaio 2010), thus occupying a low position in the food web (Oliveira & 1324
Soares, 1996). 1325
It was shown that growth of juvenile M. liza is improved at temperatures between 25 and 1326
30°C (Okamoto, Sampaio & Maçada 2006). However, little is known about the salinity effect 1327
on juvenile lebranche mullet. Sampaio, Wasielesky Jr. and Miranda Filho (2002) showed that 1328
tolerance of juvenile lebranche mullet to ammonia and nitrite is improved in fish acclimated to 1329
intermediate and high salinities respect to those maintained in fresh water. Fonseca Neto and 1330
Spach (1998/1999) reported no mortality after 96 h of abrupt transfer of juvenile M. liza from 1331
salt water (salinity 30‰ salinity) to lower salinities (15, 10 and 5‰ salinity). However, no data 1332
on juvenile lebranche mullet acclimated to different salinities are reported. 1333
In light of the above, the main objective of the present study was to evaluate survival and 1334
the response of physiological parameters associated with osmoregulation in juveniles of the 1335
lebranche mullet M. liza acclimated to a wide range of salinities (5-40‰ salinity). Physiological 1336
endpoints analyzed included blood osmolality, gill Na+,K+-ATPase activity, whole-body oxygen 1337
consumption, and liver glycogen content. 1338
1339
2. Materials and Methods 1340
1341
2.1 Fish collection and acclimation 1342

73
Juvenile M. liza were captured at Cassino Beach (Rio Grande, RS, southern Brazil) and 1343
transferred to the Laboratory of Marine Fish Culture of the Universidade Federal do Rio Grande 1344
– FURG (Rio Grande, RS, southern Brazil). Fish acclimation to laboratory conditions was 1345
performed in two 1,000-L tanks containing salt water at 25°C and salinity corresponding to that 1346
of the collection site (salinity 30‰ salinity). Tanks were maintained under natural photoperiod 1347
(12 h L:12 h D). Fish were fed twice-a-day (from 10:00 to 11:00 h and from 17:00 to 18:00 h) 1348
with a commercial diet (28% crude protein) until satiation. Feces produced were siphoned out 1349
daily and at least 50% of the experimental medium was renewed. 1350
1351
2.2 Experimental design 1352
1353
After acclimation to laboratory conditions for 20 days, 30 fish (wet body weight: 56 ± 0.9 1354
g; total length: 18.0 ± 0.1 cm) were starved for 24 h, individually weighed (wet body weight; 1355
electronic scale; precision: 0.01 g) and measured (total length), randomly divided into five 1356
groups (6 fish per tank). Juvenile mullets were abruptly transferred from salt water at salinity 1357
30‰ salinity to salt water at salinity 5, 10, 20, 30 or 40‰ salinity. Salt water at the different 1358
experimental salinities was obtained by diluting concentrated salt water (salinity 40‰ salinity) 1359
with tap water. In turn, concentrated salt water was obtained by evaporation at 50°C. Fish were 1360
maintained at the experimental salinities for 15 days. Water temperature, dissolved oxygen 1361
content (oxymeter YSI Model), salinity (refractometer, Atago), pH (pH meter, Quimis), and 1362
total ammonia (APHA 2005) were measured daily. Water samples were also collected over the 1363
experimental period for osmolality measurements using a semi-micro osmometer (Knauer, 1364
Germany) based on the freezing depression point. 1365

74
2.3 Whole-body oxygen consumption 1366
At the end of the experimental period, whole-body oxygen consumption was measured 1367
following the procedures described by Cunha, Rodrigues, Okamoto and Sampaio (2009). 1368
Dissolved oxygen content in the water was recorded every 15 min using an oximeter (YSI 1369
model Hexis 55). Measurements were performed until the water saturation level with oxygen 1370
dropped to 70% of its maximum to avoid a possible effect of this water parameter on fish 1371
oxygen consumption. The rate of oxygen consumption (OC) was calculated using the following 1372
equation: 1373
OC = (Oi-Of)xV)/TxB 1374
where Oi and Of correspond to the initial and final dissolved oxygen content in the water (mg O2 1375
L-1), respectively, V is the tank volume (L), B is the fish biomass (g), and T is the measurement 1376
duration (h). 1377
1378
2.4 Tissue collection and analysis 1379
1380
After the oxygen consumption measurement, fish were anesthetized (50 ppm benzocain) 1381
and blood samples were collected by heart puncture using 1-mL heparinized disposable syringes 1382
and centrifuged. Plasma obtained was collected and stored in ultrafreezer (-80oC) for further 1383
osmolality measurement, as described below. The second gill arch at the left side of the gill 1384
chamber and the liver were dissected, immediately frozen in liquid nitrogen and stored in 1385
ultrafreezer (-80°C) for further measurement of gill Na+,K+-ATPase activity and liver glycogen 1386
content, respectively, as described below. 1387

75
Fish plasma osmolality was determined using the semi-micro osmometer (Knauer, 1388
Germany) based on the freezing depression point. The fish isosmotic point was assessed by 1389
considering the intersection of the isosmotic line with the regression line estimated between 1390
plasma and water osmolality as described by Sampaio and Bianchini (2002). 1391
Gill samples were homogenized with 300 µl SEID buffer (pH 7.3) and centrifuged at 1392
10,000 g for 30 min (4°C). The supernatant was used for Na+,K+-ATPase activity determination 1393
following procedures described by McCormick (1993). 1394
Liver glycogen content was determined using an adaptation of the method of Carr and 1395
Neff (1984). Glucose concentration was analyzed using a commercial reagent kit based on the 1396
glucose-oxidase method (Doles, Goiânia, GO, Brazil). 1397
1398
2.5. Data presentation and analysis 1399
1400
Results were expressed as mean ± standard error (n = 6). For whole-body oxygen 1401
consumption and plasma osmolality data, significant differences among salinities were assessed 1402
by One-Way analysis of variance (ANOVA) followed by the Tukey’s test. For each salinity, 1403
comparison of mean values between water and plasma osmolality was performed using the non-1404
paired Student t-test. Water and plasma osmolality data were subjected to linear regression 1405
analysis. Gill Na+,K+-ATPase activity and liver glycogen content data were subjected to non-1406
linear regression analysis (polynomial, quadratic). For all analyses, the level of significance 1407
adopted was 95% (α = 0.05). 1408
1409
76
3. Results 1410
1411
Dissolved oxygen content, temperature and ammonia concentration (NH3-N) in the water 1412
did not change throughout the experimental period and among treatments (P > 0.05). Therefore, 1413
a general mean value was calculated for dissolved oxygen content (6.34 ± 0.18 mg O2 L-1), 1414
temperature (24.0 ± 0.20°C) and ammonia concentration (0.03 ± 0.00 NH3-N). However, water 1415
pH increased significantly (P < 0.05) from 7.70 ± 0.06 at 5‰ salinity to 8.02 ± 0.06 at 40‰ 1416
salinity. 1417
No fish mortality was observed over the whole experimental period. No significant 1418
change was observed in whole-body oxygen consumption in the range of salinities tested. The 1419
general mean value was 0.39 ± 0.03 mg O2 g-1 h-1. Also, plasma osmotic concentration did not 1420
change among water salinities. The general mean value was 417.6 ± 18.0 mOsmol Kg-1. 1421
However, a significant difference was observed between plasma and water osmolality in all 1422
salinities tested, except at 10‰ salinity. Plasma osmolality was higher than water osmolality in 1423
fish maintained at 5‰ salinity and lower than water osmolality in fish kept at 20, 30 and 40‰ 1424
salinity (Table 1). The slope value of the regression line between plasma and water osmolality 1425
was not significant (b = 0.023; P > 0.05). The isosmotic point of juvenile lebranche mullet was 1426
estimated as 412.7 mOsmol Kg-1, which corresponded to 13.5‰ salinity. 1427
Gill Na+,K+-ATPase activity was lower at intermediate salinities (20 and 30‰) and 1428
higher at extreme salinities (5 and 40‰), thus following an inverse polynomial quadratic 1429
function (Fig. 1). In contrast, liver glycogen content was higher in fish maintained at 20‰ 1430
salinity than in those maintained at 5 or 40‰ salinity, thus following a direct polynomial 1431
quadratic function (Fig. 2). 1432
77
4. Discussion 1433
In the present study, we analyzed the effect of salinity on survival, blood osmolality, gill 1434
Na+,K+-ATPase activity, whole-body oxygen consumption and liver glycogen content in 1435
juveniles of the lebranche mullet M. liza acclimated to different salinities (5-40‰). Results from 1436
this study improve our knowledge on the osmoregulation ability of this fish species, thus 1437
providing more information supporting its possible cultivation in estuarine and coastal waters in 1438
southern South America. 1439
Like other Mugilidae, M. liza inhabits estuarine waters as nursery ground. When the 1440
breeding season approaches, they migrate to the ocean for spawning and return as juveniles to 1441
the estuary for feeding purposes (Vieira, Castello & Pereira 1998). Therefore, it is clear that M. 1442
liza is naturally subjected to important changes in environmental salinity over its life cycle. An 1443
adequate ability to cope with these changes is imperative for M. liza to complete its life cycle. 1444
This ability was clearly observed in juvenile M. liza exposed to a wide range of salinities. This 1445
statement is based on the following facts: (1) juvenile mullets tested in the present study were 1446
able to survive after abrupt transfer from 30‰ to different experimental salinities (5-40‰); (2) 1447
no significant change in plasma osmolality was observed after acclimation of juvenile mullets to 1448
different environmental salinities, and (3) the slope of the regression line between plasma and 1449
water osmolality was not significant (b = 0.023), indicating a strong capacity of juvenile mullets 1450
to regulate plasma osmolality in a wide range of water salinities. 1451
The well-developed osmoregulatory capability showed by juvenile M. liza tested in the 1452
present study (180 mm body length) combined with the fact that juvenile M. liza smaller than 1453
28-33 mm are not able to tolerate abrupt transfer from 30‰ salinity to fresh water (Fonseca & 1454
Spach 1998/1999) suggests that juvenile lebranche mullets has already fully developed their 1455

78
osmoregulatory ability. In fact, changes in this ability are shown to occur over the ontogenetic 1456
development of other fish species such as the fat snook Centropomus parallelus (Tsuzuki et al. 1457
2007) and the Brazilian flounder Paralichthys orbignyanus (Sampaio, Freitas, Okamoto, 1458
Louzada, Rodrigues & Robaldo 2007). Unfortunately, there is no report describing the 1459
ontogenesis of osmoregulation in the lebranche mullet M. liza. However, the fact that the full 1460
osmoregulatory capability of the stripped mullet M. cephalus is reached when individuals 1461
achieve 40-69 mm body length (Nordlie, Szelistowski & Nordlie 1982) supports the idea that a 1462
fully developed osmoregulatory ability is already present in juveniles of the lebranche mullet M. 1463
liza tested in the present study (180 mm body length). 1464
As observed in the present study, no significant effect of water salinity changes on 1465
plasma osmolality is generally observed in euryhaline teleost fish. However, a slightly positive 1466
correlation between environmental and plasma osmolality is commonly observed. This fact 1467
could be associated with the dehydration suffered by fish exposed to hyperosmotic 1468
environments (Sampaio & Bianchini 2002; Lin, Chen & Lee 2003; Resley et al. 2006; Saoud et 1469
al. 2007). However, this seems not to be the case for juvenile lebranche mullets since the slope 1470
of the regression line between plasma and water osmolality found was not significant (b = 1471
0.023). In fact, plasma osmolality in the lebranche mullet M. liza (mean value: 417.6 ± 18.0 1472
mOsmol Kg-1) was maintained above the mean value of plasma osmolality reported for 1473
diadromous fish (fresh water: 310.0 ± 6.5 mOsmol Kg-1; sea water: 402.6 ± 20.4 mOsmol Kg-1474
1), including the stripped mullet M. cephalus (fresh water: 326.7 mOsmol Kg-1; sea water: 356.7 1475
mOsmol Kg-1) (Nordlie et al. 1982; Nordlie 2009). 1476
The isosmotic point for the juvenile lebranche mullet was estimated as 412.7 mOsmol 1477
Kg-1, which corresponded to 13.5‰ salinity. In this case, fish is hyper-regulating above this 1478
environmental salinity and hypo-regulating above it. According to the “Isosmotic Theory”, a 1479

79
lower gill Na+,K+-ATPase activity and oxygen consumption would be expected in water 1480
salinities close to the isosmotic point. Reduced energy consumption, indirectly indicated in the 1481
present study by higher liver glycogen content, would be also expected in water salinities close 1482
to that where fish is isosmotic respect to the environment. However, whole-body oxygen 1483
consumption of juvenile lebranche mullet did no change significantly among water salinities. 1484
Moreover, despite the gill Na+,K+-ATPase activity and liver glycogen content followed a U-1485
shape curve according to the water salinity, the lower mean value of enzyme activity was 1486
observed at 20 and 30‰ salinity and the higher mean value of liver glycogen content was found 1487
at 20‰ salinity. Therefore, these findings clearly do not support the “Isosmotic Theory”. 1488
Regarding gill Na+,K+-ATPase activity, our data are in contrast to those reported for 1489
juvenile coho salmon Oncorhynchus kisutch (Morgan & Iwama 1998) and gilthead sea bream 1490
Sparus aurata (Laiz-Carrión, Sangiao-Alvarellos, Guzmán, Río, Soengas, Mancera 2005). In 1491
these fish species, gill enzyme activity also followed a U-shape pattern with the environmental 1492
salinity, but the lowest value was found in water salinity close to the isosmotic point. 1493
Nevertheless, our results are in agreement with those reported for the rabbitfish Siganus 1494
rivulatus, where enzyme activity also followed a U-shape pattern across a wide range of water 1495
salinities with the lower values being observed in water salinities not close to that corresponding 1496
to the isosmotic point (14.6‰ salinity) (Saoud et al. 2007). Furthermore, it was shown that gill 1497
Na+,K+-ATPase activity in the milkefish Chanos chanos did not show a clear pattern of change 1498
across salinities, with the lower enzyme activity value being found at 35‰ salinity (Lin et al. 1499
2003). Actually, Morgan and Iwama (1998) have suggested that the response of the gill Na+,K+-1500
ATPase activity to environmental salinity may be species-dependent, which could explain the 1501
great variability observed among euryhaline fish species. 1502

80
In contrast to our findings, oxygen consumption in M. cephalus acclimated for 8 days in 1503
laboratory augmented with increasing water salinity (Nordlie & Leffler 1975). In turn, the 1504
oxygen consumption changes observed in the present study with the juvenile M. liza acclimated 1505
for 15 days to different environmental salinities correspond to the Type 1 response described by 1506
Kinne (1967). Similar to our findings, Morgan and Iwama (1998) reported that water salinity 1507
did not influence oxygen consumption in juvenile coho salmon. Therefore, it seems that 15 days 1508
is a suitable period of time to acclimate the juvenile lebranche M. liza to different environmental 1509
salinities without changes in the aerobic metabolism. 1510
Osmoregulation is an energy demanding activity and is fuelled mainly by glucose (Pérez-1511
Robles, Re, Giffard-Mena & Díaz 2011). This carbohydrate is an important source that provides 1512
energy for animal metabolism and an increased plasma concentration of this metabolite after 1513
osmotic stress has been reported for several fish species (Herrera et al. 2009). Depending on 1514
stress intensity and duration, the plasma glucose level can be sustained through glycogenolysis 1515
(Baldisserotto et al. 2007), which is a known secondary response to stress (Urbinate & Carneiro 1516
2004). The liver glycogen concentration in juvenile lebranche significantly decreased at the 1517
extreme salinities tested (0 and 40‰). This finding is in complete agreement with that observed 1518
for gill Na+,K+-ATPase activity, suggesting that the energy demand to regulate the plasma 1519
osmotic concentration in extreme conditions was likely provided through glucose oxidation. In 1520
this case, a higher glycogen mobilization from liver would occur, thus leading to the observed 1521
lower glycogen content in the liver. 1522
Finally, many authors have discussed on the advantages of keeping fish under isosmotic 1523
conditions. This practice would imply that the energy saved in the absence of an important 1524
osmotic work could maximize fish growth (Boeuf & Payan 2001; Saoud et al. 2007; Tsuzuki et 1525
al. 2007). However, this theory seems to be species-specific, since it has been proved for some 1526

81
fish species (Woo & Kelly 1995), but not for other (Sampaio & Bianchini 2002). Therefore, 1527
results from the present study will be useful to select the ‘ideal’ water salinity for growing the 1528
juvenile lebranche M. liza and whether the ‘Isosmotic Theory’ can be considered for this 1529
species. Also, it is important to note that our findings clearly indicate that juvenile lebranche M. 1530
liza is able to keep its plasma osmotic homeostasis after 15 days after of acclimation to a wide 1531
range of salinities through adequate adjustments in gill Na+,K+-ATPase and liver glycogen 1532
metabolism, without significant changes in the aerobic metabolism. 1533
1534
5. Acknowledgments 1535
V.L. Cunha is a PhD fellowship from the Conselho Nacional de Desenvolvimento 1536
Científico e Tecnológico (CNPq, Brasília, DF, Brazil). L.A. Sampaio and A. Bianchini are 1537
research fellows from the Brazilian CNPq. A. Bianchini is also supported by the International 1538
Canadian Research Chair Program (International Development Research Centre – IDRC, 1539
Ottawa, Canada). 1540
1541
6. References 1542
Amaral M.C., Bonecker A.C.T. & Ortiz C.H.D. (2001) Activity determination of Na+ K+-1543
ATPase and Mg++-ATPase enzymes in the gill of Poecilia vivipara (Osteichthyes, 1544
Cyprinodontiformes) in different salinities. Brazilian Archives of Biology and Technology 1545
44, 1-6. 1546
APHA (2005) Standard Methods for the Examination of Water and Wastewater, 21st Ed. 1547
American Public Health Association. Washington. 1193p. 1548
82
Baldisserotto B. (2009). Fisiologia de Peixes Aplicada à Piscicultura, 2 ed., Editora UFSM. 1549
Santa Maria. Brasil. 352p. 1550
Baldisserotto B., Romero J.M.M. & Kapoor B.G. (2007). Fish Osmoregulation. Science 1551
Publishers. New Hampshire. USA. 527p. 1552
Barman U.K., Jana S.N., Garg S.K., Bhatnagar A. & Arasu A.R.T. (2005). Effect of inland 1553
water salinity on growth, feed conversion efficiency and intestinal enzyme activity in 1554
growing grey mullet, Mugil cephalus (Linn.): Field and laboratory studies. Aquaculture 1555
International 13, 241-256. 1556
Boeuf G. & Payan P. (2001) How should salinity influence fish growth? Comparative 1557
Biochemistry and Physiology C 130, 411-423. 1558
Carr R.S. & Neff J.M. (1984) Quantitative semi-automated enzymatic assay for tissue glycogen. 1559
Comparative Biochemistry and Physiology B 77, 447-449. 1560
Carvalho C.V.A., Bianchini A., Tesser M. & Sampaio L.A. (2010) The effect of protein levels 1561
on growth, postprandial excretion and tryptic activity of juvenile mullet Mugil planatus 1562
(Gunther). Aquaculture Research 41, 511-518. 1563
Cunha V.L, Rodrigues R.V., Okamoto M.H. & Sampaio L.A. (2009) Consumo de oxigênio pós-1564
prandial de juvenis do pampo Trachinotus marginatus. Ciência Rural 49, 1257-1259. 1565
Da Silva Rocha A.J., Gomes V., Van Ngan P., Passo M.J. de A.C.R., Fúria R.R. (2005) 1566
Metabolic demand and growth of juveniles of Centropomus parallelus as function of 1567
salinity. Journal of Experimental Marine Biology and Ecology 316, 157-165. 1568

83
Fielder D.S., Bardsley W.J., Allan G.L. & Pankhurst P.M. (2005) The effects of salinity and 1569
temperature on growth and survival of Australina snapper, Pagrus auratus, larvae. 1570
Aquaculture 250, 201-214. 1571
Fonseca Neto & Spach H. (1998/1999) Survival of juveniles of Mugil platanus Günther, 1880 1572
(Pisces, Mugilidae) in different salinities. Boletim do Instituto de Pesca 25, 13-17. 1573
Galvão M.S.N., Yamanaka N., Fenerich-Verani N. & Pimentel C.M.M. (1997) Estudos 1574
preliminares sobre enzimas digestivas proteolíticas da tainha Mugil platanus Gunther, 1575
1880 (Osteichthyes, Mugilidae) durante as fases larval e juvenil. Boletim do Instituto de 1576
Pesca 24, 101-110. 1577
Godinho H.M., Kavamoto E.T., Andrade-Talmelli E.F., Serralheiro P.C.S., Paiva P. & Ferraz 1578
E.M. (1993) Induced spawning of the mullet Mugil platanus Gunther, 1880, in Cananéia, 1579
São Paulo, Brazil. Boletim do Instituto de Pesca 20, 59-66. 1580
Handeland S.O., Berge A., Bjornsson B.T., & Stefansson S.O. (1998) Effect of temperature and 1581
salinity on osmoregulation and growth of Atlantic salmon (Salmo salar L.) smolts in 1582
seawater. Aquaculture 168, 289-302. 1583
Herrera M., Vargas-Chacoff L., Hachero I., Ruíz-Jarabo I., Rodiles A., Navas J.I.N. & Mancera 1584
J.M. (2009) Osmoregulatory changes in wedge sole (Dicologoglossa cuneata Moreau, 1585
1881) after acclimation to different environmental salinities. Aquaculture Research 40, 1586
762-771. 1587
Jensen M.K., Madsen S.S. & Kristiansen K. (1998) Osmoregulation ns salinity effects on 1588
expression and activity of Na+,K+-ATPase in gills of European sea bass, Dicentrarchus 1589
labrax (L.). Journal of Experimental Zoology 282, 290-300. 1590
84
Jobling M. (1994) Fish Bioenergetics. Chapman & Hall, London, 294p. 1591
Kantin R. & Baumgarten M.G.Z. (1982) Observações hidrográficas no estuário da Lagoa dos 1592
Patos: distribuição e flutuação dos sais nutrientes. Atlântica 5, 76-92. 1593
Kim W.S., Kim J.M., Kim M.S., Park C.W. & Huh H.T. (1998) Effects of sudden changes in 1594
salinity on endogenous rhythms of spotted sea bass Lateolabrax sp. Marine Biology 131, 1595
219-225. 1596
Kinne O. (1967) Physiology of estuarine organisms with especial reference to salinity and 1597
temperature: general aspects. In: Estuaries (ed. by G.H. Lauff). American Association for 1598
the Advancement of Science Publication 83, 525-540. 1599
Laiz-Carrión R., Sangiao-Alvarellos S., Guzmán J.M., Río M.P.M., Soengas J.L. & Mancera 1600
J.M. (2005) Growth performance of gilthead sea bream Sparus aurata in different 1601
osmotic conditions: Implications for osmoregulation and energy metabolism. Aquaculture 1602
250, 849-861. 1603
Lin Y.M., Chen C.N. & Lee T.H. (2003) The expression of Gill Na, K-ATPase in milkefish, 1604
Chanos chanos, acclimated to seawater, brackish water and fresh water. Comparative 1605
Biochemistry and Physiology A, 135, 489-497. 1606
Maçada A.P., Okamoto M.H. & Sampaio L.A. (2000) Avaliação preliminar do cultivo de tainha 1607
Mugil platanus em tanque-rede. In: XIII Semana Nacional de Oceanografia (Anais), pp. 1608
684-686. Itajaí. 1609
Marshall W.S. (2002) Na+, Cl-, Ca2+ and Zn2+ transport by fish gills: retrospective review and 1610
prospective synthesis. Journal of Experimental Zoology 293, 264-283. 1611
85
Marshall W.S. & Grosell M. (2006) Ion transport, osmoregulation, and acid-base balance. In: 1612
The Physiology of Fishes (ed. by D.H. Evans & J.B. Claiborne), pp. 177-230. Taylor & 1613
Francis, Boca Raton. 1614
McCormick S.D. (1995) Hormonal control of gill Na+, K+ -ATPase and chloride cell function. 1615
In: Cellular and Molecular Approaches to Fish Regulation. (ed. by T.J. Shuttleworth & 1616
C.M. Wood), pp. 285-315. Academic Press, San Diego. 1617
McCormick S.D (1993) Methods for non-lethal gill biopsy and measurement of Na+, K+-1618
ATPase activity. Canadian Journal of Aquatic Sciences 50, 656-658. 1619
Menezes N.A., Oliveira C. & Nirchio M. (2010) An old taxonomic dilemma: the identity of the 1620
western south Atlantic lebranche mullet (Teleostei: Perciformes: Mugilidae). Zootaxa 1621
2519, 59-68. 1622
Miranda Filho K., Tesser M.B., Sampaio L.A. & Godinho H.M. (2010) Tainha. In: Espécies 1623
Nativas para Piscicultura no Brasil (ed. by B. Baldisserotto, L.C. Gomes), pp. 541-558. 1624
Editora da UFSM, Santa Maria. 1625
Mommsen T.H., Vijayan M.M & Moon T.W. (1999) Cortisol in teleost: dynamics, mechanisms 1626
of action, and metabolic regulation. Reviews in Fish Biology and Fisheries 9, 211-268. 1627
Morgan J.D. & Iwama G.K. (1998) Salinity effects on oxygen consumption, gill Na+, K+ - 1628
ATPase and ion regulation in juvenile coho salmon. Journal of Fish Biology 53, 1110-1629
1119. 1630
Morgan J.D & Iwama G.K. (1991) Effects of sanlinity on growth, metabolism and ion 1631
regulation juvenile rainbow and steelhead trout (Oncorhynchus mykiss) and Chinook 1632

86
salmon (Oncorhynchus tshawytscha). Canadian Journal of Fisheries and Aquatic 1633
Sciences 48, 2083-2094. 1634
Nordlie F.G. & Leffler C.W. (1975) Ion regulation and the energetic of osmoregulation in Mugil 1635
cephalus Lin. Comparative Biochemistry and Physiology A 51, 125-131. 1636
Nordlie F.G., Szelistowski W.A., Nordlie W.C. (1982) Ontogenesis of osmotic regulation in 1637
stripped mullet, Mugil cephalus L. Journal of Fish Biology 20, 79-86. 1638
Nordlie F.G. (2009). Environmental influences on regulation of blood plasma serum 1639
components in teleost fish: a review. Reviews in Fish Biology and Fisheries 19, 481-564. 1640
Okamoto M.H, Sampaio L.A. & Maçada A.O. (2006) Efeito da temperatura sobre o crescimento 1641
e a sobrevivência de juvenis da tainha Mugil platanus Gunther, 1880. Atlântica 28, 61-66. 1642
Oliveira I.R. & Soares L.S.H. (1996) Alimentação da tainha Mugil platanus Gunther, 1880) 1643
(Pisces: Mugilidae), da região estuarino-lagunar de Cananéia, São Paulo, Brasil. Boletim 1644
do Instituto de Pesca 23, 95-104. 1645
Pérez-Robles J., Re A.D., Giffard-Mena I. & Díaz F. (2011) Interactive effects of salinity on 1646
oxygen consumption, ammonium excretion, osmoregulation and Na+/K+-ATPase 1647
expression in bullseye puffer (Sphoeroides annulatus, Jenyns 1842). Aquaculture 1648
Research 1-12. 1649
Reis E.G. & D’Incao F. (2000). The present status of artisanal fisheries of extreme Southern 1650
Brazil: an effort to wards community-based management. Ocean & Coastal Management 1651
43, 585-595. 1652
87
Resley M.J., Webb Jr. K.A. & Holt G.J. (2006) Growth and survival of juvenile cobia, 1653
Rachycentron canadum, at different salinities in recirculating aquaculture system. 1654
Aquaculture 253, 398-407. 1655
Sampaio L.A., Minillo A. & Ferreira A.H. (1998) Growth of juvenile mullet (Mugil platanus) 1656
fed on different rations. In: Aquicultura Brasil ’98 (Anais 2), pp. 109-115. Recife. 1657
Sampaio A.L., Ferreira A.H. & Tesser M.B. (2001) Effect of stocking density on laboratory 1658
rearing of mullet fingerlings, Mugil platanus (Günter, 1880). Acta Scientiarum 23, 471-1659
475. 1660
Sampaio L.A. & Bianchini A. (2002) Salinity effects on osmoregulation and growth of the 1661
euryhaline flounder Paralichthys orbignyanus. Journal of Experimental Marine Biology 1662
and Ecology 269, 187-196. 1663
Sampaio L.A., Wasielesky Jr W., Miranda Filho K.C. (2002) Effect of salinity on acute toxicity 1664
of ammonia and nitrite to juvenile Mugil platanus. Bulletin of Environmental 1665
Contamination and Toxicology 68, 668-674. 1666
Sampaio L.A., Freitas L.S., Okamoto M.H., Louzada L.R., Rodrigues R.V. & Robaldo R.B. 1667
(2007) Effects of salinity on Brazilian flounder Paralichthys orbignyanus from 1668
fertilization to juvenile settlement. Aquaculture 262, 340-346. 1669
Saoud I.P., Kreydiyyeh S., Chalfoun A. & Fakih M. (2007) Influence of salinity on survival, 1670
growth, plasma osmolality and gill Na+-K+-ATPase activity in the rabbitfish Siganus 1671
rivulatus. Journal of Experimental Marine Biology and Ecology 348, 183-190. 1672
Skou J.C. (1988) The identification of sodium pump. Bioscience Reports 18, 1-14. 1673

88
Tandler A., Anav F.A. & Choshniak I. (1995) The effect of salinity on growth rate, survival and 1674
swimbladder inflammation in gilthead seabream, Sparus aurata, larvae. Aquaculture 135, 1675
343-353. 1676
Tsuzuki M.Y., Sugai J.K., Maciel J.C., Francisco C.J. & Cerqueira V.R. (2001) Survival, 1677
growth and digestive enzyme activity of juveniles of the fat snook (Centropomus 1678
parallelus) reared at different salinities. Aquaculture 261, 319-325. 1679
Urbinati E.C., Caneiro P.C.F. (2004) Práticas de manejo e estresse dos peixes em piscicultura. 1680
In: Tópicos Especiais em Piscicultura de Água Doce Tropical Intensiva (ed. by J.E.P. 1681
Cyrino, E.C. Urbinati, D.M. Fracalossi, N. Castegnolli, pp. 171-194. Editora TechArt, 1682
São Paulo. 1683
Vieira J.P., Castello J.P. & Pereira L.E. (1998) A ictiofauna. In: Os ecossistemas Costeiro e 1684
Marinho do Extremo Sul do Brasil (ed. by U. Seeliger, C. Odebrecht, J.P. Castello), pp. 1685
60-68. Editora Ecoscientia, Rio Grande. 1686
Woo Y.S. & Kelly S.P. (1995) Effects of nutritional status on growth and metabolism of Sparus 1687
sarba in closed seawater system. Aquaculture 135, 229-238. 1688
1689
1690
1691
1692
1693

89
Figure legends 1694
1695
Figure 1. Gill Na+,K+-ATPase activity in juveniles of the lebranche mullet Mugil liza 1696
maintained at different salinities for 15 days. Values are expressed as mean ± standard error (n = 1697
6). Data were fitted using a non-linear regression analysis (polynomial; quadratic). 1698
1699
Figure 2. Liver glycogen content in juveniles of the lebranche mullet Mugil liza 1700
maintained at different salinities for 15 days. Values are expressed as mean ± standard 1701
error (n = 6). Data were fitted using non-linear regression analysis (polynomial; 1702
quadratic). 1703
1704
1705
1706
1707
1708
1709
1710
1711
1712
1713

90
Table 1. Water osmolality, blood osmolality and oxygen consumption of juvenile 1714
lebranche mullet Mugil liza maintained in different salinities for 15 days1. 1715
Salinity
(‰)
Water osmolality
(mOsm Kg-1)
Blood osmolality
(mOsm Kg-1)
Oxygen consumption
(mg O2 g-1h-1)
5 168 ± 3.1 473.4 ± 41.4* 0.36 ± 0.08
10 332 ± 4.7 330.0 ± 4.1 0.43 ± 0.03
20 565 ± 2.5 401.5 ± 11.8* 0.38 ± 0.07
30 910 ± 5.2 467.4 ± 35.8* 0.32 ± 0.05
40 1080 ± 3.5 414.4 ± 54.5* 0.36 ± 0.07
1 Data are expressed as mean ± standard error (n = 6). * indicates significant difference between 1716
water and blood osmolality for each experimental salinity (P < 0.05). 1717

91
Figure 1718
1 Salinity (‰)
0 10 20 30 40 50
Na
+,K
+-A
TP
ase
activity
(µm
ole
s A
DP
mg
pro
tein
-1 h
-1)
0.0
0.5
1.0
1.5
2.0
2.5
3.0
y = 1.9780 - 0.0935x + 0.0023x2
(R2 = 0.93; P < 0.05)
1719
1720
1721
1722
1723
1724
1725
1726
1727
1728

92
Figure 2 1729
Salinity (‰)
0 10 20 30 40 50
Gly
co
ge
n c
on
ten
t(m
g g
tis
su
e-1
)
0.00
0.05
0.10
0.15
0.20
0.25
0.30
y = 0.1089 + 0.0102x - 0.0002x2
(R2 = 0.86; P < 0.05)
1730

93
ANEXO II 1731
1732
1733
1734
1735
1736
1737
1738
1739
1740
1741
Effect of salinity on survival, growth and biochemical parameters in juvenile Lebranch Mugil 1742
liza 1743
1744
1745
1746
1747
1748
1749
1750
1751
1752
1753
1 Artigo submetido a revista Aquaculture Research 1754
94
Effect of salinity on survival, growth and biochemical parameters in juvenile Lebranch 1755
Mugil liza 1756
1757
Viviana Lisboa da Cunha1, Indianara Fernanda Barcarolli2, Luís André Sampaio3 and Adalto 1758
Bianchini2* 1759
1760
1Universidade Federal do Rio Grande - FURG, Instituto de Oceanografia, Programa de Pós-1761
graduação em Oceanografia Biológica, Av. Itália km 8, Campus Carreiros, 96203-900, Rio 1762
Grande, RS, Brazil 1763
1764
2Universidade Federal do Rio Grande - FURG, Instituto de Ciências Biológicas, Av. Itália km 8, 1765
Campus Carreiros, 96203-900, Rio Grande, RS, Brazil 1766
3Universidade Federal do Rio Grande - FURG, Instituto de Oceanografia, Laboratório de 1767
Piscicultura Marinha, Rua do Hotel nº 02, 96203-900, Querência, Rio Grande, RS, Brazil 1768
*Corresponding author: Adalto Bianchini, Universidade Federal do Rio Grande - FURG, 1769
Instituto de Ciências Biológicas, Av. Itália km 8, Campus Carreiros, 96203-900, Rio Grande, 1770
RS, Brazil. Tel./Fax.: +55 53 3293 5193; e-mail: [email protected] 1771
1772
Running title: salinity effect on mullet growth 1773
Keywords: glycogen, growth, mullet, Na+/K+-ATPase, salinity, oxygen consumption1774

95
Abstract 1775
It has been hypothesized that energy cost involved in osmoregulation can be minimized 1776
when teleost fish are maintained under an isosmotic condition. It is also expected that the 1777
energy spared could improve fish growth. Therefore, the aim of the present study was to 1778
evaluate growth and metabolic performance of juveniles of the lebranche mullet Mugil liza 1779
reared for 40 days at different water salinities (0, 6, 12 and 24 ppt) corresponding to 0, 50, 100 1780
and 200% of the species isosmotic point (salinity 12‰). Tests were performed in quadruplicate 1781
using 30 fish per tank (0.48 ± 0.1 g wet body weight; 3.27 ± 0.1 cm total length). Water 1782
temperature and oxygen saturation were kept at 28.2 ± 0.1°C and above 90%, respectively. Fish 1783
were fed with artificial diet (50% crude protein) four times a day until apparent satiation. 1784
Results showed that salinity influenced juvenile mullet growth. Fish reared at salinity 24 ppt 1785
grew better than those kept in fresh water (salinity 0). Gill Na+,K+-ATPase activity and whole-1786
body oxygen consumption showed an U-shape-type response over the range of salinities tested, 1787
with the lower values being observed at the intermediate salinities. In contrast, liver glycogen 1788
content tended to augment with increasing salinity, although no significant difference was 1789
observed among salinities. Taken altogether, these findings indicate that the energy demand for 1790
osmorregulation in juvenile M. liza can be minimized when fish are reared under isosmotic 1791
condition. However, the amount of energy saved seems not significant enough to improve 1792
juvenile mullet growth. They also suggest that M. liza is able to alternate between different 1793
energy-rich substrates during acclimation to water salinity. 1794
1795

96
1. Introduction 1796
Aquaculture seeks to provide an ideal and healthy environment in order to maximize 1797
fish growth in a shorter period of time. Among environmental parameters affecting fish growth, 1798
salinity is one of the most extensively studied, since it is a determinant factor for fish growth 1799
(Jobling 1994; Boeuf & Payan 2001; Sampaio & Bianchini 2002; Nordlie 2009; Rodhy, Nissif 1800
& Main 2010; Pérez-Robles, Giffard-Mena & Díaz 2011; O´Neill, Raedemaecker, McGrath & 1801
Brophy 2011). 1802
Teleost fish are able to maintain ionic and osmotic homeostasis in their body fluids at 1803
different environmental salinities through osmoregulatory mechanisms, which are energy 1804
demanding processes (Sampaio & Bianchini 2002). In turn, growth is the net result from the 1805
difference between the energy provided by food ingestion and the metabolic expenditure 1806
(Jobbling 1994). Considering that the osmoregulatory cost is proportional to the osmotic 1807
gradient existing between the fish body fluids and the external medium (Handeland, Berge, 1808
Bjornsson & Stefansson 1998), it is reasonable to expect that growth of fish reared in water with 1809
salinity near its isosmotic environment will be maximized. In teleosts, the isosmotic point 1810
generally corresponds to the water salinity of 12‰ (Woo & Kelly 1995; Boeuf & Payan 2001; 1811
Sampaio & Bianchini 2002; Tsuzuki, Sugai, Maciel, Francisco & Cerqueira 2007; Herrera, 1812
Vargas-Chacoff, Hachero, Ruíz-Jarabo, Rodiles, Navas & Mancera 2009; Nordlie 2009). 1813
However, the significance of the energy spared under isosmotic conditions remains 1814
controversial (Boeuf & Payan 2001; Kidder III, Petersen & Preston 2006). In addition, optimal 1815
salinities for growth and metabolic rates are influenced by other factors including species and 1816
developmental status (Morgan & Iwama, 1991). 1817

97
The metabolic energetic demand is met by energy-rich macronutrients such as 1818
carbohydrates, lipids and proteins that can either be used directly as fuel (respiratory substrates) 1819
or be stored within the body. Although lipid contain more energy, the preferably macronutrient 1820
used as fuel by cells are carbohydrates like glucose, that can also be stored as glycogen (Jobling 1821
1984). Although glucose is the main cellular metabolic energy source, under unfavorable 1822
environmental conditions fish can change its metabolic energy production and utilization in 1823
order to supplement/complement its energy supply by using other metabolic substrates (Tseng 1824
& Hwang 2008). 1825
Euryaline fish can live in a wide range of environmental salinities due to their ability to 1826
synthesize new salt-transporting proteins as the fish moves from salt to freshwater and vice 1827
versa (Kidder III et al. 2006). Therefore, it is possible to use water from different sources to 1828
develop the euryaline fish culture. 1829
The lebrance mullet Mugil liza is an euryaline species. It is an important resource 1830
caught by fishermen in the Atlantic coast of Southern South America (Reis & D’Incao 2000) 1831
and has a good acceptance in the market (Vieira 1985). Furthermore, its low position in the food 1832
web (Oliveira & Soares 1996), ready acceptance of commercial diets and easy handling have 1833
attracted the attention of fish farmers. Therefore, many studies have been developed to ascertain 1834
its aquaculture potential. Briefly, studies conducted so far with this species were on artificial 1835
fertilization (Godinho, Kavamoto, Andrade-Talmelli, Serralheira, Paiva & Ferraz 1993), 1836
larviculture (Galvão, Yamanaka, Fenerich-Verani & Pimentel 1997), feeding ration (Sampaio, 1837
Minillo & Ferreira 1998), optimal stocking density (Sampaio, Ferreira & Tesser 2001), optimal 1838
temperature (Okamoto, Sampaio & Maçada 2006), and protein requirement (Carvalho , 1839
Bianchini, Tesser & Sampaio 2010). Specifically on salinity, it is known that juveniles directly 1840
transferred from salt water (30‰) to dilute salinities down to 5‰ do not induce any mortality 1841

98
after 96 h of transference (Fonseca Neto and Spach (1998/1999). It is also known that ammonia 1842
and nitrite toxicity is minimized at intermediate and high salinities, when compared to that 1843
observed in juvenile kept in fresh water (Sampaio, Wasielesky Jr. & Miranda Filho 2002). 1844
However, little is known about the effect of salinity on juvenile lebranche growth. 1845
In light of the background described above, the main objective of the present study was 1846
to evaluate the effect of water salinity on survival, growth, total apparent food consumption, 1847
feed efficiency (FE), Fulton coefficient (FC), gill Na+,K+-ATPase activity (NKA), whole-body 1848
oxygen consumption rate (OCR) and liver glycogen content in juvenile mullet M. liza. Water 1849
salinities tested corresponded to 0, 50, 100 and 200% of that described as being isosmotic with 1850
the body fluids of the studied species. 1851
1852
2. Materials and Methods 1853
1854
2.1. Fish acclimation and experimental design 1855
1856
Juvenile M. liza were captured at Cassino Beach (Southern Brazil) and transferred to our 1857
Laboratory of Marine Fish Culture. Acclimation was made in two 1,000-L tanks containing 1858
fresh water at 25°C. Room photoperiod was set at 14L:10D. Fish were fed four times a day 1859
(9:00, 13:00, 17:00 and 21:00 h) with a commercial diet (NRD 50% crude protein, INVE) until 1860
apparent satiation. These conditions were also maintained during the experimental period. Fish 1861
feces were siphoned out once daily, when at least 50% of the water was renewed. 1862

99
After a 20-days period of acclimation, 480 fish (body wet weight: 0.48 ± 0.01 g; total 1863
length: 3.27 ± 0.01 cm) were randomly stocked in 16 tanks (50 L). Tanks were kept using 1864
recirculating aquaculture systems, equipped with mechanical and biological filters, UV 1865
sterilization, and temperature controllers. Experimental salinities tested were 0, 6, 12 and 24‰, 1866
which corresponds to 0, 50, 100 and 200% of the isosmotic salinity for most teleost fish. 1867
Acclimation to the experimental salinity was performed by a daily increase in 6 units of water 1868
salinity from 0 up to 24‰. Experimental salinities were obtained by a mixture of dechlorinated 1869
tap water with natural sea water. Dissolved oxygen concentration, water temperature (oxymeter 1870
YSI Model), salinity (refractometer, Atago), pH (pH meter, Quimis) and total ammonia (APHA, 1871
2005) were measured daily over the 40-days experimental period. 1872
1873
2.2 Survival, growth and zootechnical parameters 1874
1875
Fish survival (S) was expressed as percentage of total fish tested according to the 1876
following equation: S = [(Ni-Nf)/Ni] x100, where Ni is the number of fish stocked in the tank at 1877
the beginning of the experiment and Nf corresponds to the number of living fish after 48 h of 1878
experiment. 1879
All fish were weighed every 20 days using an electronic balance (to the nearest 0.01 g). 1880
Feeding was stopped 24 h before fish weight measurement. Specific growth rate (G) was 1881
expressed in percentage and calculated according to the following equation: G = [(lnWf-1882
lnWi)/T]x100, where Wf and Wi is the fish body mass at the beginning and the end of the 1883
experiment, respectively. 1884

100
Feed efficiency (FE) was calculated based on the following equation: FE = (BG/DFO), 1885
where BG is the biomass gain (g) and DFO is the dry feed offered (g). 1886
Weight coefficient variation (WCV) was calculated using the following expression: 1887
WCV = (SD/MW)x100, where SD is the standard deviation and MW is the mean weight (g). 1888
Condition factor (CF) was calculated using the following equation: CF = (BW/L3), 1889
where BW is the body weight (g) and L is the fish length (cm). 1890
1891
2.3 Whole-body oxygen consumption 1892
1893
At the end of the 40-days experimental period, whole-body oxygen consumption was 1894
measured following procedures described by Cunha, Rodrigues, Okamoto and Sampaio (2009). 1895
The oxygen concentration in the water was recorded every 15 min with an oximeter (YSI model 1896
Hexis 55) until it dropped to 70 % of the oxygen saturation to avoid a possible influence on the 1897
oxygen saturation level on fish oxygen consumption. Oxygen consumption rate (OCR) was 1898
calculated using the following equation: OCR = [(Oi-Of)xV/(TxB)], where Oi and Of correspond 1899
to the water oxygen content (mg O2 L-1) at the beginning and the end of the measurement 1900
period, respectively; V is the tank volume (L); B is the fish biomass (g) and T is the 1901
measurement duration (h). Results were expressed in mg O2 g wet body mass-1 h-1. 1902
1903
2.4 Tissue sample collection and biochemical analyses 1904
1905

101
After the oxygen measurement, fish were anesthetized (50 ppm benzocain) and immediately 1906
killed by spinal section. The second gill arch, at the left side, and liver were immediately 1907
dissected, frozen in liquid nitrogen and stored at -80°C for further measurement of gill NKA 1908
and liver glycogen content, as described below. 1909
Gills were homogenized in 300 µl of cold buffer (pH 7.3) containing 150 mM sucrose, 10 1910
mM ethylenediaminetetraacetic acid, 50 mM imidazole, and 11.5 mM sodium deoxycholate, 1911
and centrifuged at 10,000 x g for 30 s (4°C). The supernatant was used for NKA measurement 1912
following the protocol described by McCormick (1993). Sample absorbance was measured 1913
using a spectrophotometer (ELX 800 Universal Microplate Reader/Bio-Teck Instruments, 1914
Winooski, Vermont, USA). The protein concentration in the supernatant was determined using a 1915
commercial reagent kit based on the Biuret reagent (Doles, Goiânia, GO, Brazil). Enzyme 1916
activity was expressed in µmoles ADP mg protein-1 h-1. 1917
Liver samples were weighed and homogenized in 100 mM sodium citrate solution (10% 1918
weight/volume). Glycogen concentration was determined using an adaptation of the method 1919
described by Carr and Neff (1984). In this case, glucose concentration in the samples was 1920
measured using a commercial reagent kit based on the glucose-oxidase method (Doles, Goiânia, 1921
GO, Brazil). Sample absorbance was measured using a spectrophotometer (ELX 800 Universal 1922
Microplate Reader/Bio-Teck Instruments, Winooski, Vermont, USA). Results were expressed in 1923
mg g wet tissue-1. 1924
1925
2.5 Data presentation analysis 1926
1927

102
Results were expressed as mean ± standard error. Mean values were compared using 1928
One-Way analysis of variance (ANOVA) followed by the Tukey test. Mean values were 1929
considered significantly different when P < 0.05. Correlation between OCR and NKA was 1930
evaluated using the Pearson correlation index (R). 1931
1932
3. Results 1933
1934
During the experimental period, mean water temperature and NH3-N concentration did 1935
not differ among treatments. Mean values corresponded to 28.2 ± 0.1°C and 0.02± 0.00 mg L-1, 1936
respectively, while oxygen saturation remained above 90% saturation (p>0.05). Mean water pH 1937
was similar among salinities 6, 12 and 24‰ (general mean = 8.20 ± 0.02) (p>0.05), but higher 1938
than in fresh water (6.93 ± 0.01) (p<0.05). 1939
There was no effect of water salinity on fish survival, which was close to 100% in all 1940
treatments (p>0.05). Fish weight, length, and SGR were significantly affected by water salinity. 1941
They increased with increasing salinity, being significantly higher in salinity 24‰ than in fresh 1942
water (p<0.05). However, CF was similar in all salinities (p>0.05) (Table 1). Also, FE, total 1943
apparent food consumption, gill NKA, OCR, and liver glycogen content did not differ among 1944
salinities (p>0.05). However, it is important to note that mean values of NKA showed the “U-1945
shaped” type response across the range of salinities tested, being lower near the isosmotic 1946
salinity (6-12 ppt) and higher at the extremer salinities tested (0 and 24 ppt) (Fig. 1). OCR 1947
followed a similar pattern to that described for gill NKA (Fig. 2). In fact, a significant and 1948
positive correlation was observed between gill NKA and OCR (OCR = 0.049 + 0.119 x NKA; R 1949
103
= 0.942). Also, no significant difference was observed in liver glycogen content among 1950
salinities. However, a tendency of increase was observed with increasing salinity (Fig. 3). 1951
1952
4. Discussion 1953
1954
The main question addressed in the present study was to assess how significant would be 1955
the impact of the energy demand associated with osmoregulation on growth performance of 1956
juvenile mullet M. liza. In general, fish held in hypo or hyperosmotic environments would show 1957
additional energy requirements for osmoregulation that could hamper growth when compared to 1958
those kept at an isosmotic environment (Woo & Kelly 1995; Boeuf & Payan 2001; Sampaio & 1959
Bianchini 2002; Tsuzuki et al. 2007; Tseng & Hwang 2008; Herrera et al. 2009; Pérez-Robles et 1960
al. 2011). It is important to note that the energy cost associated with osmoregulation may vary at 1961
the different ontogenetic developmental stages. Also, response to salinity has shown to be 1962
highly variable among fish species. This variation is likely associated with the interaction 1963
between osmoregulatory mechanisms with other physiological processes (Jobling 1994; 1964
Imsland, Bonga, Ham & Stefansson 2002) and fish ecology (O´Neill et al. 2011). 1965
Among all growth performance indexes and biochemical parameters analyzed in the 1966
juvenile mullet M. liza only growth measured as wet body mass was affected by water salinity. 1967
Furthermore, a significant difference among treatments was observed only between fish 1968
acclimated to fresh water and those maintained in the higher water salinity tested (24 ppt). 1969
As the mullet M. liza, the flatfish Paralichthys orbignyanus is also an euryaline species 1970
showing reduced growth in fresh water (Sampaio & Bianchini 2002). According to these 1971
104
authors, the lower growth in such environment is a result of an increased gill NKA activity and 1972
consequently higher energy expenditure associated with osmoregulation. In fact, the 1973
osmoregulatory energy demand is usually directly correlated to gill NKA (Laiz-Carrión et al. 1974
200). In turn, OCR is often used to estimate the metabolic status of fish subjected to different 1975
water salinities (Kim et al. 1998; Sampaio & Bianchini 2002; Da Silva Rocha, Gomes, Van 1976
Ngan, Passo & Fúria 2005). It is important to note that OCR was significantly and positively 1977
correlated with the gill NKA in juvenile M. liza over the range of salinities tested. In the 1978
metabolic context, this finding clearly indicate that the osmotic comfort zone for juvenile M. 1979
liza corresponds to water salinities in or around the isosmotic environmental condition. 1980
Actually, the response of gill NKA observed in juvenile M. liza in the range of salinities tested 1981
corresponds to the “U-shaped” marine euryhaline model reported by Jensen, Madsen and 1982
Kristiansen (1998), Boeuf and Payan (2001) and Varsamos, Nebel & Charmantier (2002). 1983
Jensen et al. (1998) highlighted that this pattern could represent an adaptive mechanism to 1984
improve the energy use since it allows fish to maintain a low gill NKA when facing a wide 1985
salinity gradient. 1986
In light of the discussed above, the lower growth observed in juvenile M. liza maintained 1987
in fresh water seems to be related to a higher energy cost associated with osmoregulation in 1988
fresh water than in salt water (24 ppt). Although no significant difference was observed in gill 1989
NKA, OCR and liver glycogen content among salinities, the trends of higher gill NKA and 1990
OCR combined with the trend of a lower liver glycogen content observed in fish maintained in 1991
fresh water supports this idea. However, it is possible that the observed difference in growth is 1992
likely caused by a combination of increased energy demand for osmoregulation combined with 1993
that to maintain other physiological process. This statement is based on the fact that trends of 1994
increase in gill NKA and OCR were also observed in juvenile M. liza maintained in the higher 1995

105
salinity tested (24 ppt), but no decrease in liver glycogen content was observed. In this osmotic 1996
condition, an even trend of increase in liver glycogen content was noted. The possible use of an 1997
alternative source of energy than carbohydrates by fish maintained in fresh water, as discussed 1998
below, cannot be ruled out. 1999
In fish, plasma glucose level necessary to meet the metabolic energy requirement can be 2000
maintained based on glycogen reserves (Baldisserotto et al. 2007; Pérez-Robles et al. 2011). 2001
However, stress induced by changes in water salinity can induce alterations in metabolic energy 2002
production and utilization. Therefore, energy supply during acclimation to environmental 2003
salinity can be fulfilled by other metabolic substrates than carbohydrates, such as proteins and 2004
lipids (Tseng et al. 2008). In fact,Woo and Kelly (1995) reported that the growth improvement 2005
observed in Sparus sarba at the isosmotic salinity could be assigned to either a reduction in 2006
metabolism when fish is maintained under an isosmotic condition or a metabolic reorganization 2007
in order to prioritize the use of carbohydrates and lipids while proteins are spared and used for 2008
growth. 2009
The “U-shaped” pattern observed for gill NKA and OCR over the range of salinities 2010
tested indicates the energy demand associated with osmoregulation is reduced at intermediate 2011
salinities. Therefore, it would be expected that liver glycogen content could be higher under this 2012
osmotic condition if only carbohydrates were being used to fulfill the energy demand associated 2013
with osmoregulation. However, the higher content of liver glycogen was observed in juvenile 2014
M. liza maintained at the higher salinity tested (24 ppt). This finding clearly indicates that the 2015
additional energy demand imposed by exposure to high salinity is being supplied, at least in 2016
part, by other energy substrates than liver glycogen. In fact, Cafsi et al. (2003) reported that 2017
lipid is also important source of energy during salinity acclimation in the mullet M. cephalus. 2018
Therefore, it seems that M. liza is able to reorganize its metabolism in order to prioritize the 2019
106
metabolic use alternative energy-rich substrates like proteins or lipids when exposed to 24 ppt, 2020
as already reported for other euryhaline fish (Woo & Kelly 1995; Tseng et al. 2008). 2021
Considering the facts that M. liza is an iliophagus fish (Oliveira & Soares 1996) and that the 2022
optimal dietary level of proteins required by this fish corresponds to 35% crude protein 2023
(Carvalho et al. 2010), no protein shortage for fish growth would be expected to occur since the 2024
feed employed in the present study had 50% crude protein. 2025
Although growth was significantly affected only in fresh water, it is important to note that 2026
the best mean increment in growth was observed when juvenile M. liza was maintained in a 2027
water salinity corresponding to the double of the relative value considered as isosmotic for 2028
teleost fish. This finding clearly indicates that the isosmotic salinity is not necessarily the 2029
optimal condition for fish growth, as previously reported for other marine fish (O´Neill et al. 2030
2011). Despite that a lower growth performance of juvenile M. liza was observed in fresh water, 2031
the result obtained was better than that found for other Brazilian marine fish such as the fat 2032
snook Centropomus parallelus (Tsuzuki et al. 2001), the flatfish P. orbignyanus (Sampaio and 2033
Bianchini 2002) and the cobia Rachycentron canadum (Resley, Webb Jr. & Holt 2006) under 2034
similar experimental conditions. 2035
Finally, it is important to note that the mullet M. liza is a catadromous species spawning 2036
in open sea, with juveniles smaller than 5.0 cm being usually being recruited to the estuary 2037
(Menezes & Figueiredo 1985; Vieira 1991). Considering that M. liza is an euryhaline species of 2038
marine origin, it is reasonable to suggest that fresh water can disturb the development of fries 2039
and juveniles of M. liza smaller than 5.0 cm. In this context, it is worth to mention that fish can 2040
choose its preferential ambient not necessarily based upon the metabolic advantage associated 2041
with the isosmotic condition but also considering food competition and predation (O´Neill et al. 2042
2011; Halpin 2000). Therefore, a fish preference for estuarine areas can be considered in this 2043

107
context, as they provide adequate protection and food availability while showing highly 2044
variability in their physicochemical conditions, including salinity. 2045
In conclusion, data reported in the present study show that energy demand for 2046
osmoregulation in juvenile M. liza can be minimized in water salinity close to the isosmotic 2047
conditions. However, the amount of energy spared under this condition is not enough to 2048
improve growth in juvenile mullets. They also suggest that M. liza is able to alternate the use of 2049
energy-rich substrates according to the environmental salinity. 2050
2051
5. Acknowledgments 2052
2053
V.L. Cunha is a PhD fellowship from the Conselho Nacional de Desenvolvimento 2054
Cientifico e Tecnológico (CNPq, Brasília, DF, Brazil). L.A. Sampaio and A. Bianchini are 2055
research fellows from the Brazilian CNPq. A. Bianchini is also supported by the International 2056
Canadian Research Chair Program (International Development Research Centre, Ottawa, 2057
Canada). 2058
2059
6. References 2060
2061
APHA (2005) Standard Methods for examination of Water and Wastewater, 21st edn. American 2062
Public Health Association, Washington, DC. 1193pp. 2063

108
Baldisserotto B., Romero J.M.M. & Kapoor B.G. (2007) Fish Osmoregulation, Science 2064
Publishers, New Hampshire. 527p. 2065
Boeuf G. & Payan P. (2001) How should salinity influence fish growth? Comparative 2066
Biochemistry and Physiology C 130, 411–423. 2067
Carvalho C.V.A., Bianchini A., Tesser M. & Sampaio L.A (2010) The effect of protein levels 2068
on growth, postprandial excretion and tryptic activity of juvenile mullet Mugil platanus 2069
(Gunther). Aquaculture Research 41, 511-518. 2070
Cunha V.L, Rodrigues R.V., Okamoto M.H. & Sampaio L.A (2009) Consumo de oxigênio pós-2071
prandial de juvenis do pampo Trachinotus marginatus. Ciência Rural 49 (4), 1257-1259. 2072
Da Silva Rocha A.J., Gomes V., Van Ngan P., Passo M.J. de A.C.R. & Fúria R.R. (2005) 2073
Metabolic demand and growth of juvenile of Centropomus parallelus as function of 2074
salinity. Journal of experimental Marine and Biology Ecology 316, 157-165. 2075
Fonseca Neto & Spach (1998/1999) Survival of juveniles of Mugil platanus Günther, 1880 2076
(Pisces, Mugilidae) in different salinities. Boletim do Instituto de Pesca 25, 13-17. 2077
Galvão M.S.N, Yamanaka N., Fenerich-Verani N., Pimentel C.M.M. (1997) Preliminary studies 2078
on proteolytic digestive enzymes in the larval and juvenile stages of the mullet Mugil 2079
platanus Gunther, 1880 (Osteichthyes, Mugilidae). Boletim do Instituto de Pesca 24, 101-2080
110. 2081
Godinho H.M., Kavamoto E.T., Andrade-Talmelli E.F., Serralheiro P.C.S., Paiva P. & Ferraz 2082
E.M. (1993) Induced spawning of the mullet Mugil platanus GUNTHER, 1880, in 2083
Cananéia, São Paulo, Brazil. Boletim do Instituto de Pesca 20, 59-66. 2084

109
Halpin, P.M. (2000) Habitat use by intertidal salt-marsh fish: trade-offs between predation and 2085
growth. Marine Ecology Progress Series 198, 203-214. 2086
Handeland S.O., Berge A., Bjornsson B.Th. & Stefansson S.O. (1998) Effect of temperature and 2087
salinity on osmoregulation and growth of Atlantic salmon (Salmo salar L.) smolts in 2088
seawater. Aquaculture 168, 289-302. 2089
Herrera M., Vargas-Chacoff L., Hachero I., Ruíz-Jarabo I., Rodiles A., Navas J.I.N. & Mancera 2090
J.M. (2009) Osmoregulatory changes in wedge sole (Dicologoglossa cuneata Moreau, 2091
1881) after acclimation to different environmental salinities. Aquaculture Research 40, 2092
762-771. 2093
Imsland A.K, Foss A., Bonga S.W., Ham E.V. & Stefansson S.O. (2002) Comparison of growth 2094
and RNA: DNA rations in three populations of juvenile turbot reared at two salinities. 2095
Journal of Fish Biology 60, 288-300. 2096
Jensen M.K. Madsen S.S. & Kristiansen K. (1998) Osmoregulation and salinity effects on the 2097
expression and activity of Na+,K+-ATPase in the gill of european sea bass Dicentrarchus 2098
labrax (L.). The Journal of Experimental Zoology 282, 290-300. 2099
Jobling M. (1994) Fish Bioenergetics. Chapman & Hall, London. 294p. 2100
Kidder III G.W., Petersen C.W & Preston R.L. (2006) Energetics of osmoregulation: II. Water 2101
flux and osmoregulatory work in the euryhaline fish, Fundulus heteroclitus. Journal of 2102
Experimental Zoology A 305, 318-327. 2103
Laiz-Carrión R., Sagiao-Alvarellos, Guzmán J.M., Del Río M.P.M., Soengas J.L. & Mancera 2104
J.M. (2005) Growth performance of gilthead sea bream Sparus aurata in different 2105

110
osmotic conditions: Implications for osmoregulation and energy metabolism. Aquaculture 2106
250, 849-861. 2107
McCormick S.D (1993) Methods for non-lethal gill biopsy and measurement of Na+, K+ -2108
ATPase activity. Canadian Journal of Fisheries and Aquatic Sciences 50, 656-658. 2109
Menezes A.N. & Figueiredo J.L. (1985) Manual de peixes marinhos do Sudeste do Brasil V. 2110
Teleostei (4). Museu de Zoologia da Universidade de São Paulo, São Paulo. 105p. 2111
Menezes N.A., Oliveira C. & Nirchio M. (2010) An old taxonomic dilemma: the identity of the 2112
western south Atlantic lebranche mullet (Teleostei: Perciformes: Mugilidae). Zootaxa, 2113
2519, 59-68. 2114
Morgan J.D & Iwama G.K (1991) Effects of salinity on growth, metabolism and ion regulation 2115
juvenile rainbow and steelhead trout (Oncorhynchus mykiss) and Chinook salmon 2116
(Oncorhynchus tshawytscha). Canadian Journal of Fisheries and Aquatic Sciences 48, 2117
2083-2094. 2118
Nordlie, F.G. 2009. Environmental influences on regulation of blood plasma serum components 2119
in teleost fish: a review. Review in Fish Biology and Fisheries 19, 481-564. 2120
Okamoto M.H, Sampaio L.A & Maçada A.O. (2006) Efeito da temperatura sobre o crescimento 2121
e a sobrevivência de juvenis da tainha Mugil platanus Gunther, 1880. Atlântica 28, 61-66. 2122
Oliveira I.R & Soares L.S.H. (1996) Alimentação da tainha Mugil platanus Gunther, 1880) 2123
(Pisces: Mugilidae), da região estuarino-lagunar de Cananéia, São Paulo, Brasil. Boletim 2124
do Instituto de Pesca 23, 95-104. 2125

111
O´Neill B., Raedemaecker F.De, McGrath D. & Brophy D. (2011) An experimental 2126
investigation of salinity effects on growth, development and condition in European 2127
flounder (Platichthys flesus L.). Journal of Experimental Marine Biology and Ecology 2128
410, 39-44. 2129
Pérez-Robles J., Re A.D., Giffard-Mena I. & Díaz F. (2011) Interactive effects of salinity on 2130
oxygen consumption, ammonium excretion, osmoregulation and Na+/K+-ATPase 2131
expression in bullseye puffer (Sphoeroides annulatus, Jenyns 1842). Aquaculture 2132
Research 43 1372-1383. 2133
Reis E.G. & Incao F.D’ (2000). The present status of artisanal fisheries of extreme Southern 2134
Brazil: an effort to wards community-based management. Ocean & Coastal Management 2135
43, 585-595. 2136
Resley J.M., Webb Jr. K.A., Holt G.J (2006) Growth and survival of juvenile cobia, 2137
Rachycentron canadum, at different salinities in recirculating aquaculture system. 2138
Aquaculture 253, 398-407. 2139
Rodhy N.R., Nissif N.A. & Main K.L. (2010) Effects of salinity on growth and survival of 2140
common snook Centropomus undecimalis (Bloch, 1792) larvae. Aquaculture Research 2141
41, 357-360. 2142
Sampaio L.A., Minillo A. & Ferreira A.H. (1998) Growth of juvenile mullet (Mugil platanus) 2143
fed on different rations. In: Aquicultura Brasil ’98 (Anais), Recife, 2, 109-115. 2144
Sampaio A.L., Ferreira A.H. & Tesser M.B (2001) Effect of stocking density on laboratory 2145
rearing of mullet fingerlings, Mugil platanus (Günter, 1880). Acta Scientiarum 23, 471-2146
475. 2147

112
Sampaio L.A. & Bianchini A. (2002) Salinity effects on osmoregulation and growth of the 2148
euryhaline flounder Paralichthys orbignyanus. Journal of Experimental Marine Biology 2149
and Ecology 269, 187-196. 2150
Sampaio L.A., Wasielesky Jr W., Miranda Filho K.C. (2002) Effect of salinity on acute toxicity 2151
of ammonia and nitrite to juvenile Mugil platanus. Bulletin of Environmental 2152
Contamination and Toxicology 68, 668-674. 2153
Skou J.C. (1988) The identification of sodium pump. Bioscience Reports 18, 1-14. 2154
Tseng Y-C & Hwang P-P (2008) Some insights into energy metabolism for osmoregulation in 2155
fish. Comparative Biochemistry and Physiology C 148, 419-429. 2156
Tsuzuki M.Y., Sugai, J.K., Maciel, Francisco. C.J. & Cerqueira, V.R. (2001) Survival, growth 2157
and digestive enzyme activity of juveniles of the fat snook (Centropomus parallelus) 2158
reared at different salinities. Aquaculture 261, 319-325. 2159
Varsamos S., Nebel C. & Charmantier G. (2005) Ontogeny of osmoregulation in postembryonic 2160
fish: A review. Comparative Biochemistry and Physiology A 141, 401-429. 2161
Vieira J.P. (1991) Juvenile mullets (Pisces: Mugilidae) in the estuary of Lagoa dos Patos, RS, 2162
Brazil. Copeia 2, 409-418. 2163
Woo N.Y.S. & Kelly S.P. (1995) Effects of salinity and nutritional status on growth and 2164
metabolism of Sparus sarba in closed seawater system. Aquaculture 135, 229-238. 2165
2166
113
Figure legends 2167
2168
Figure 1. Gill Na+- K+- ATPase activity in juvenile lebranche Mugil liza after acclimation to 2169
different salinities for 40 days. Data are mean ± standard error (n=6). 2170
2171
Figure 2. Whole-body oxygen consumption in juvenile lebranche mullet Mugil liza after 2172
acclimation to different salinities for 40 days. Data are mean ± standard error (n=6). 2173
2174
Figure 3. Liver glycogen content in juvenile lebranche mullet Mugil liza after acclimation to 2175
different salinities for 40 days. Data are mean ± standard error (n=6). 2176
2177

114
Table 1. Body weight, weight coefficient variation (CV) specific growth rate (SGR), feed 2178
efficiency (FE) and Fulton coefficient (FC) in juvenile lebranche mullet Mugil liza maintained 2179
in different salinities for 40 days1. 2180
2181
Parameter Salinity (ppt)
0 6 12 24
Initial body weight (g) 0.48 ± 0.00 0.46 ± 0.02 0.48 ± 0.00 0.49 ± 0.01
Final body weight (g) 6.16± 0.17a 6.50 ± 0.12ab 6.77 ± 0.08b 7.22 ± 0.05b
CV 0.20 ± 0.01 0.22 ± 0.01 0.21 ± 0.01 0.18 ± 0.01
SGR (g/day) 6.39± 0.06a 6.44 ± 0.07ab 6.762 ± 0.06ab 6.78 ± 0.07b
FE (gain/g dry feed) 0.79 ± 0.04 0.80 ± 0.03 0.82 ± 0.02 0.80 ± 0.03
FC 2.36± 0.07 2.44 ± 0.03 2.51 ± 0.02 2.62 ± 0.02
1 Data are expressed as mean ± standard error (n = 20). * Different letters denote significant 2182
difference among treatments (P < 0.05). 2183
2184

115
Figure 1 2185
2186
2187

116
Figure 2 2188
2189
2190

117
Figure 3 2191
2192
2193
2194
2195
2196
2197
2198
2199
2200
2201
2202
2203
2204
2205
2206

118
ANEXO III 2207
2208
2209
2210
2211
2212
2213
2214
2215
2216
Dietary Salt Supplementation for Juvenile Lebranche Mullet Mugil liza Reared in 2217
Freshwater 2218
2219
2220
2221
2222
2223
2224
2225
2226
2227
2228
2229
1 Artigo no formato de submissão para revista Fish Physiology and Biochemistry.2230
119
Dietary Salt Supplementation for Juvenile Lebranche Mullet Mugil liza Reared in 2231
Freshwater 2232
2233
Viviana Lisboa da Cunha1, Indiana Barcarolli1, Luís André Sampaio2 and Adalto 2234
Bianchini1. 2235
2236
1 Federal University of Rio Grande (FURG), Institute of Oceanography, Program of 2237
Biological Oceanography, Institute of Biological Science, CP 474, 96201-900 – Rio 2238
Grande – RS – Brasil. E-mail: [email protected], 2239
[email protected], [email protected] 2240
2241
2 Federal University of Rio Grande (FURG), Institute of Oceanography, Program of 2242
Aquaculture, Laboratory of Marine Fish Culture, Rio Grande - RS, CP 474, CEP 96201-2243
900, Brazil. E-mail: [email protected] 2244
2245
2246

120
Abstract 2247
The use of dietary salt supplementation for marine/estuarine fish reared in low 2248
salinities and/or freshwater is being adopted to increase aquaculture performance of 2249
these species. The lebranche mullet Mugil liza is euryhaline and can be reared in 2250
freshwater. The aim of this study was to evaluate the zootechnical and physiological 2251
performance of juvenile mullet fed on diets supplemented with four levels of NaCl over 2252
45 days in freshwater. Salt (Na+) content in the diets was determined by an atomic 2253
absorption spectrophotometer and they were equal to 0.9, 5.4, 8.0, and 13.2% salt 2254
supplementation (SS). A total of 240 fish (weight 4.5 ± 0.07g and length 7.41 ± 0.03cm) 2255
were randomly distributed into 16 tanks (50L) maintained in a RAS equipped with 2256
mechanical and biological filter, plus temperature controller and an UV sterilizer. 2257
Temperature was maintained at 27 °C, oxygen saturation above 89% and photoperiod 2258
was 14L:10D. Fish were fed on the experimental diets three times per day until apparent 2259
satiation. Survival, feed efficiency (FE) and liver glycogen concentration were similar 2260
among treatments (p>0.05). However, specific growth rate (SGR), apparent food 2261
consumption (AFC), and Fulton’s Condition Factor decreased as the salt content of the 2262
diets increased (p<0.05). Na+ content above 5.4% hampered fish growth, while SGR, 2263
AFC and gill Na+- K+- ATPase were lower specifically at 13.2% SS (p<0.05). The lack 2264
of difference in FE among treatments associated to the lower SGR, lower AFC and the 2265
higher gill Na+- K+- ATPase activity at 13.2% SS can be a consequence of poorer 2266
palatability of the diet and the increased salt secretion due to the high dietary salt 2267
content. Finally, juvenile mullet fed a diet containing up to 5.4% SS show positive 2268

121
zootechnical and physiological responses compared to mullet fed diets with higher salt 2269
content. However, the best dietary Na+ level corresponds to 2.6%. 2270
Key-words: Salt supplementation, osmoregulation, freshwater. 2271
Introduction 2272
Mullets, especially the flathead grey mullet Mugil cephalus, have been produced 2273
in different countries such as Egypt, Korea, Taiwan and India (FAO 2010), where they 2274
are reared in low salinity waters (Cardona, 2000; Khériji et al. 2003). 2275
The lebranche mullet Mugil liza occur from Florida (EUA) to the South Western 2276
Coast of the Atlantic Ocean (Fischer et al. 2011; Miranda Filho et al. 2012). The 2277
juveniles of this estuarine-dependent species (Bemvenuti and Oliveira 2006) inhabit the 2278
estuary until they reach sexual maturity, when they migrate towards the sea to 2279
reproduce (Menezes and Figueiredo 1985; Vieira 1991). This species is an important 2280
item for estuarine and coastal fisheries in Southern Brazil (Vieira 1985; Reis & D’Incao 2281
2000) and has aroused interest as aquaculture candidate. 2282
Characteristics of lebranche mullet, such as its omnivorous feeding strategy, and 2283
consequently, the low dietary protein requirement (Oliveira and Soares 1996; Carvalho 2284
et al. 2001), the high tolerance to ammonia, nitrite, and nitrate concentrations (Miranda-2285
Filho et al. 1995; Sampaio et al. 2002; Poersh et al. 2007), and the wide range of 2286
tolerance to temperature (Okamoto et al. 2006) and salinity (Fonseca and Spach 2287
1998/1999), make it a species with good potential for aquaculture proposes. Besides, 2288
122
juvenile mullet easily show adaptation to captivity, evidenced by the readily acceptance 2289
of artificial diets enable its production in lakes, reservoirs, ponds or cages in mono or 2290
policulture (Scorvo Filho et al. 1992; Scorvo Filho et al. 1995). However, although M. 2291
liza individuals larger than 3 cm can tolerate salinities from seawater to freshwater 2292
(Fonseca and Spach 1998/1999), juvenile M. liza growth is hampered/damage in 2293
freshwater (Lisboa, chapter 2). 2294
The whole functional and metabolic system operation of an organism in any 2295
environment rely on homeostase and metabolism maintenance. In order to maintain its 2296
homeostase and metabolism in low salinities, teleosteos need to face, among other 2297
challenges, ion loss and excessive water gain. In order to compensate ion loss, fish 2298
actively uptake ions from its surrounding medium and/or from diet (Karnaky 1998; 2299
Baldisserotto et al 2007; Wood 2001; Marshall and Grosell 2006). 2300
The uptake of sodium uptake from the water occurs through the chloride cell 2301
apical membrane, by the sodium channel. The sodium entrance through the apical 2302
membrane is possible due to an electrical gradient that favors sodium entry, which in 2303
turn is generated by the basal Na+- K+- ATPase and apical V-H+-ATPase. Moreover, at 2304
the same time that Na+- K+- ATPase generates the electrical gradient for cellular apical 2305
sodium uptake, this enzyme also is responsible for sodium transport from the cells to the 2306
plasma. As well, the chloride uptake from the water to the plasma occurs through the 2307
chloride cell apical membrane, however via apical Cl-/HCO-3 exchanger and then by 2308
basal chloride channel. However, this ion uptake is an energy demanding process 2309
(Boeuf & Payan 2001; Marshall and Grosell 2006; Baldisserotto et al 2007). 2310

123
To operate the ion transport, the Na+- K+- ATPase and V-H+-ATPase require 2311
energy, the energy that could be used for growth (Baldisserotto et al 2007; Wood 2001; 2312
Karnaky 1998). However, since fish have mechanisms that enable ion uptake from the 2313
digestory tract, dietary salt supplementation could decrease metabolic cost with the 2314
active ion uptake from the environment and thus sparing energy for growth (Gatlin et al 2315
1992; Nandeesha et al. 2000; Eroldogan et al. 2005; Appelbaum and Arockiaraj 2009; 2316
Cnaani et al. 2010). Moreover, sodium plays a fundamental role in the absorption of 2317
nutrients, since the sodium presence is one of requirements to amino acids, glucose and 2318
fatty acids absorption (Klein et al 1998; Harpaz et al 2005; Baldisserotto 2009). 2319
The purpose of this study was to investigate the dietary salt supplementation on 2320
the overall performance of juvenile M. liza reared in freshwater. 2321
2322
2. Materials and methods 2323
2324
2.1. Experimental fish 2325
Juvenile (1.8±0.8g) Mugil liza were captured at Cassino Beach (Southern Brazil) 2326
with a beach seine net and taken to the Laboratory of Marine Fish Culture at the Federal 2327
University of Rio Grande (FURG). Acclimation to laboratory conditions was made in a 2328
single 1,000L tank for 20 days. During this period fish were fed 3x/day until apparent 2329
satiation with a commercial diet (Aqua Line Supra Tilapia Gaiola - 32% protein, 7% 2330
lipid, 3,500Kcal/Kg). 2331

124
2.2. Experimental set-up 2332
The experimental system consisted of 16 tanks (50L) placed in a RAS composed 2333
of a biofilter, a mechanical filter, an UV sterilizer, and a temperature controller. The 2334
water flow rate in the tanks was 400mL/min. Photoperiod was controlled by a timer 2335
(14L:10D) and the water quality control was similar to acclimation period. Acclimation 2336
to low salinity was made during one week by reducing the salinity to 50% per day with 2337
de-chlorinated tap water. Fifteen fish (4.5±0.7g) were than randomly stocked into each 2338
of the 16 experimental tanks. There were no significant differences among the mean 2339
weight of fish among experimental tanks at the onset of the experiment (p>0.05). 2340
Growth measurements (total weight and length) were taken at 15-day intervals on all 2341
fish anesthetized (50ppm benzocain). 2342
Fish were hand fed until apparent satiation 3x/day (0900, 1300 and 1700 h). In 2343
order to minimize salt leaching, food was offered in small portions, ensuring fish would 2344
consume it in 4s. Total apparent food consumption (TAFC) was estimated by the sum of 2345
all feed offered for each tank during the experiment. 2346
2347
2.3. Water quality 2348
Water temperature, dissolved oxygen content and saturation (oxymeter YSI M), 2349
salinity (refractometer, Atago), pH (pH meter, Quimis), and total ammonia (APHA 2350

125
2005) were measured daily and averaged respectively, 27.09 ± 0.04°C, 7.02 ± 0.04 mg 2351
O2. L-1, 89.0 ± 0.5%, 0‰, 7.91 ± 0.02; and 0.01 ± 0.01 (N-NH3). 2352
2353
2.4. Diet preparation 2354
Four levels of salt supplementation (SS) were tested on the same diet used during 2355
the acclimation period. The basal diet was ground, and NaCl previously dissolved in 2356
water was added. The mixture was forced through a meat grinder with 2 mm-diameter 2357
opening. The non-supplemented diet went through the same procedure, but no salt was 2358
added. Afterwards, pellets were dried in an oven at 60°C and stored in plastic bags at -2359
20°C until use. The actual Na+ concentrations after supplementation of the diet with salt 2360
correspond to 0.9%, 5.4%, 8.0%, and 13.2%. 2361
2362
2.5. Survival, growth and feed parameters 2363
At the end of experiment, the following parameters were measured: 2364
Survival 100)( xNi
NfNiS
−= ; Ni is the initial and Nf is the final number of fish. 2365
Daily specific growth rate (G) =Lnfw − Lniw
day
x100; fw and iw are final and initial 2366
mean weight. 2367
Weight gain (WG) = 100 × (fw/iw). 2368

126
Fulton’s Condition Factor
=
)(
)()(
3 cmL
gBWK ; BW is the body weight (g) and L is the 2369
length (cm). 2370
Feed Conversion Efficiency (FCE) =BG(g)
FC(g)
: BG is biomass gain and FC is dry feed 2371
consumed (g). 2372
Weight coefficient of variation 100)(
)( xgMW
SDWCV
= ; SD is standard deviation and 2373
MW is the mean weight. 2374
2375
2.6. Tissues collection and analysis 2376
At the end of experimental period, fish were anesthetized (50 ppm benzocain) 2377
and blood samples were collected from the caudal vein with 1-mL heparinized syringes. 2378
Plasma was separated by a refrigerated centrifuge (3500 rpm, at 4°C for 15min) and 2379
stored at -80°C. Also gill and liver samples were collected for subsequent determination 2380
of Na+- K+- ATPase activity and liver glycogen content. 2381
For Na+ content determination, diet samples were weighed, dried, and 2382
completely digested in opened eppendorf tube containing 500µl of HNO3 (Suprapur®, 2383
MERCK, HAAR, GERMANY) during 3 days. Digested samples were centrifuged (10 2384
min; 4°C; 10,000 g; Mikro22R, HETTICH, GERMANY) and the supernatant was 2385

127
collected for sodium measurements by an atomic absorption spectrophotometer (GBC 2386
AAS 932 PLUS). 2387
Gill samples were homogenized with 300 µl SEID buffer (pH 7.3) and centrifuged 2388
at 10,000 g for 30 min (4°C). The supernatant was used for gill NKA activity 2389
determination following procedures described by McCormick (1993). 2390
Liver glycogen content was determined using an adaptation of the method of Carr 2391
and Neff (1984). Glucose concentration was analyzed using a commercial reagent kit 2392
based on the glucose-oxidase method (Doles, Goiânia, GO, Brazil). 2393
2394
2.7. Statistical analysis 2395
The results were analyzed by One-Way analysis of variance (ANOVA) followed 2396
by the Test of Tukey. All analyses were performed with significance level of P < 0.05. 2397
Weight gain and SS data were analyzed by non-linear regression analysis (quadratic). 2398
The SS that result in maximum WG was calculated by –b/2a (Shearer 2000)2399

128
3. Results 2400
2401
Survival of juvenile lebranche mullet was not affected (p>0.05) and eventual 2402
mortalities were due to fish jumping out of the tank. 2403
The dietary salt supplementation affected growth of juvenile lebranche mullet. 2404
The final weight was higher for fish fed the two lowest salt supplemented diets, while 2405
fish fed the diet containing 13.2% SS achieved the lowest final weight (p<0.05). The 2406
reduced weight gain was already noticeable 15 days after the start of the experiment 2407
(Figure 1). The SGR followed the same trend, where the growth rate of fish fed the 2408
largest amount of salt was significantly reduced (p<0.05). However, there was no 2409
influence of the dietary salt content on the coefficient of variation of the final weight 2410
(p>0.05). 2411
Food consumption was similar for fish fed diets containing up to 8.0% SS 2412
(p>0.05), but it decreased sharply for those fed the diet supplemented with 13.2% salt 2413
(p<0.05). The Fulton’s Condition Factor (K) was also lower for fish fed the highest salt 2414
supplementation level (p<0.05) (Table 1). 2415
Among the physiological parameters, the dietary salt supplementation affected 2416
gill Na+- K+- ATPase activity (p<0.05) (Figure 2), but not the liver glycogen content 2417
(Figure 3), that were similar among treatments (p>0.05). The gill Na+- K+- ATPase 2418
activity differed between fish fed diets 5.4 and 13.2% SS, with the highest activity at the 2419
higher dietary Na+ level. 2420

129
The ideal salt supplementation level was estimated by quadratic linear regression 2421
between experimental salt supplementation levels and WG and it corresponds to 2.6% 2422
Na+ 2423
3. Discussion 2424
2425
Juvenile M. liza showed a strong osmoregulatory capacity, confirming that it can 2426
be reared in freshwater (chapter 1). It was further observed that growth of juvenile 2427
lebranche mullet was hampered when they were reared in freshwater and hiposmotic 2428
environments (chapter 2), thus the present study was conducted to evaluate whether 2429
dietary salt supplementation could mitigate the negative effect of limited environmental 2430
salt availability. 2431
Salinity can influence fish growth by several ways as it interferes on hormonal 2432
pathways, on digestive performance, food intake, and/or metabolic state (Boeuf and 2433
Payan 2001). In a metabolic point of view, growth damage in low salinity could occur 2434
due to the energy expenditure with active uptake of ions from the surrounding medium 2435
and/or from diet, in order to reestablish homeostasis (Gatlin III et al. 1992; Karnaky 2436
1998; Wood 2001; Baldisserotto et al 2007). Thus, it has been proven for some species 2437
reared in freshwater, that dietary salt supplementation enhances fish growth due to 2438
decreased osmoregulatory cost, as the energy spared could be used to increase growth 2439
(Eroldogan et al. 2005; Appelbaum and Arockiaraj 2009; Cnaani et al. 2010). 2440

130
Within the range of dietary Na+ tested in this study, juvenile lebranche mullet 2441
responded positively up to the 5.4% SS. Feed efficiency was similar, but food 2442
consumption was lower at the highest level of salt inclusion in the diet, thus suggesting 2443
there was a palatability problem with the increased salt content. 2444
Smith et al. (1995) discussed about the consequences of excessive salt for fish, 2445
which is characterized by the increased gill Na+ efflux. The gill Na+- K+- ATPase 2446
activity was higher specifically at the highest SS level, corroborating with the supposed 2447
osmoregulatory work performance in order to secrete the salt excess arising in excess 2448
from the diet. Therefore, lower growth at high SS level can be attributed to the salt 2449
excess effect on food consumption and also on the osmoregulatory energy demand. 2450
The presumed energy demand as consequence of higher gill Na+ -K+ -ATPase 2451
activity supposedly should be supplied by liver glycogen mobilization, however there is 2452
no SS effect on liver glycogen storage. Based on reports of Woo and Kelly (1995) and 2453
Tseng et al. (2008), at this osmotic condition, the M. liza metabolism probably is based 2454
on other subtracts as energy source. Furthermore, the possibility that indeed, at this 2455
developmental stage, metabolism maybe resorts to other energy-rich substrate to match, 2456
when necessary, the extra energy demand should be evaluated. 2457
The quadratic regression pointed to 2.6% as the best salt supplementation level for 2458
growth of juvenile M. liza. This level is equivalent to that observed for other fish 2459
species (Table 2) that, in general, show moderate levels of dietary salt requirement (1-2460
3%) in order to cope with low salinity, or even in fresh water, as it was the case of the 2461
131
present study (Gatlin III et al. 1992; Shiau and Li-Shan 2004; Eroldogan et al. 2005; 2462
Cnaani et al. 2010). Finally, juvenile mullet fed a diet containing up to 5.4% SS show 2463
positive zootechnical and physiological responses compared to mullet fed diets with 2464
higher salt content. However, the best dietary Na+ level was estimated at 2.6%. 2465

132
4. Reference 2466
2467
Appelbaum S, Arockiaraj AJ (2009) Salt incorporated diets for enhancing growth 2468
performance and survival in gilthead sea bream Sparus aurata L. juveniles reared 2469
in low saline brackish water. Sci. Mar. (Barc.) 73(S1):213-217 2470
Carr RS, Neff JM (1984) Quantitative semi-automated enzymatic assay for tissue 2471
glycogen. Comparative Biochemistry and Physiology B 77:447-449 2472
Cardona L (2000) Effects of salinity on the habitat selection and growth performance of 2473
Mediterranean flathead grey mullet Mugil cephalus (Osteichthyes, Mugilidae). 2474
Estuarine and Coastal Shelf Science 50:727-737 2475
Cnaani A, Barki A, Slosman T, Scharcanski A, Milstein A, Harpaz S (2010) Dietary salt 2476
supplement increases the growth rate in freshwater cultured tilapia hybrids. 2477
Aquaculture Research 41:1545-1548 2478
Baldisserotto B, Mancera Romero JM, Kapoor BG (Eds) (2007) Fish Osmoregulation, 2479
Ed. Science Publishers, Santa Maria, 527p. 2480
Boeuf G, Payan P (2001) How should salinity influence fish growth? Comparative 2481
Biochemistry and Physiology C 130:411–423 2482
133
Carvalho CVA, Bianchini A, Tesser M, Sampaio LA (2010) The effect of protein levels 2483
on growth, postprandial excretion and tryptic activity of juvenile mullet Mugil 2484
planatus (Gunther). Aquaculture Research 41:511-518 2485
Eroldogan OT, Kumlu M, Kir M, Kiris GA (2005) Enhancement of growth and feed 2486
utilization of the European sea bass (Dicentrarchus labrax) fed supplementary 2487
dietary salt in freshwater. Aquaculture Research 36:361-369 2488
Food and Agriculture Organization of the United Nations (FAO) 2010. The State of 2489
World Fisheries and Aquaculture 2010. Rome, FAO – Fisheries and Aquaculture 2490
department. 197p. Available on internet at: 2491
http://www.fao.org/docrep/013/i1820e/i1820e.pdf. Accessed in 24/10/2012. 2492
Fonseca Neto, Spach H (1998/1999) Survival of juveniles of Mugil platanus Günther, 2493
1880 (Pisces, Mugilidae) in different salinities. Boletim do Instituto de Pesca 2494
25:13-17 2495
Fontaínhas-Fernandes A, Gomes E, Reis-Henriques MA, Coimbra J (2002) Effect of 2496
supplemental dietary sodium chloride on growth rate of tilapia Oreochromis 2497
niloticus reared in variable salinities. Arquivo Brasileiro de Medicina Veterinária 2498
e Zootecnia 54:04-21 2499
Gatlin DM, MacKenzie DS, Craig SR, Neill WH (1992) Effect of dietary sodium 2500
chloride on red drum juveniles in waters of various salinities. Progressive Fishery 2501
Culture 54:220-227 2502

134
Harpaz S, Hakim Y, Slosman T, Eroldogan OT (2005) Effects of adding salt to the diet 2503
of Asian sea bass Lates calcarifer reared in fresh or salt water recirculating tanks, 2504
on growth and brush border enzyme activity. Aquaculture 248:315-324 2505
Karnaky KJ Jr (1998) Osmotic and ionic regulation. In: Evans DH, editor. The 2506
Physiology of Fishes. Boca Raton: CRC Press vol., pp 157-176Khériji SM, Cafsi 2507
M El, Masmoudi W, Castell JD, Romdhane MS (2003) Salinity and temperature 2508
effects on the lipid composition of mullet sea fry (Mugil cephalus, Linne, 1758). 2509
Aquaculture International 11:571-582 2510
McCormick SD (1993) Methods for non-lethal gill biopsy and measurement of Na+, K+-2511
ATPase activity. Canadian Journal of Aquatic Sciences 50:656-658 2512
Marshall WS, Grosell M (2006) Ion transport, osmoregulation and acid-base balance. 2513
In: Evans DH, Claiborne JB (eds) The Physiology of Fishes. CRC Press, Boca 2514
Raton, FL, pp 177-230 2515
Menezes NA, Figueiredo JL (1980) Manual de peixes marinhos do sudeste do Brasil. 2516
São Paulo, USP. pp 96 2517
Miranda-Filho KC, Wasielesky W, Maçada AP (1995) Efeito da amônia e nitrito no 2518
crescimento da tainha Mugil platanus (Pisces: Mugilidae). Revista Brasileira de 2519
Biologia 55:45-50 2520

135
Miranda Filho K, Tesser MB, Sampaio LA, Godinho HM (2012) Tainha. In: 2521
Baldisserotto B, Gomes LC (eds) Espécies Nativas para Piscicultura no Brasil. 2522
UFSM Press, Santa Maria pp. 541-558 2523
Okamoto MH, Sampaio LA, Maçada AP (2006) Efeito da temperatura sobre o 2524
crescimento e a sobrevivência de juvenis da tainha Mugil platanus Günther, 1880. 2525
Atlântica 28:61-66 2526
Nandeesha MC, Gangadhara B, Keshavanath P, Varghese TJ (2000) Effect of dietary 2527
sodium chloride supplementation on growth, biochemical composition and 2528
digestive enzyme activity of young Cyprinus carpio (Linn.) and Cirrhinus 2529
mrigala (Ham.). Journal of Aquatic Tropical 15:135-144 2530
Oliveira IR, Soares LSH (1996) Alimentação da tainha Mugil platanus Günther, 1880 2531
(Pisces: Mugilidae), da região estuarino-lagunar de Cananéia, São Paulo, Brasil. 2532
Boletim do Instituto de Pesca 23:95–104 2533
O´Neill, Bernadette, Raedemarcker F De, McGrath D, Brophy D (2011) An 2534
experimental investigation of salinity effects on growth, development and 2535
condition in the European flounder (Platichthys flesus. L.). Journal of 2536
Experimental Marine Biology and Ecology 410:39-44 2537
Halpin PM (2000) Habitat use by intertidal salt-marsh fish: trade-offs between predation 2538
and growth. Marine and Ecology Progress Series 198:203-214 2539

136
Poersh LH, Santos MHS, Miranda-Filho KC, Wasielesky W (2007) Efeito agudo do 2540
nitrato sobre alevinos da tainha Mugil platanus (Pisces:Mugilidae). Boletim do 2541
Instituto de Pesca 33 (2):247-252 2542
Reis EG, D’Incao F (2000) The present status of artisanal fisheries of extreme Southern 2543
Brazil: an effort towards community-based management. Ocean & Coastal 2544
Management 43:585-595 2545
Salman NA, Eddy FB (1988) Effect of dietary sodium chloride on growth food intake 2546
and conversion efficiency in rainbow trout (Salmo gairdneri Richardson). 2547
Aquaculture 70:131-144 2548
Sampaio LA, Bianchini B (2002) Salinity effects on osmoregulation and growth of the 2549
euryhaline flounder Paralichthys orbignyanus. Journal of Experimental Marine 2550
Biology and Ecology 269:187-196 2551
Sampaio LA, Wasielesky W, Miranda Filho KC (2002) Effect of salinity on acute 2552
toxicity of ammonia and nitrite to juvenile Mugil platanus. Bulletin of 2553
Environmental Contamination and Toxicology 68:668-674 2554
Scorvo Filho JD, Dias Era, Ayroza LMS, Novato PFC (1992) Efeito da densidade sobre 2555
o desenvolvimento de alevinos da tainha listrada (Mugil platanus) em água doce. 2556
Boletim do Instituto de Pesca 19:105-109 2557
Scorvo Filho JD, Ayroza LMS, Novato PFC, Dia Era (1995) Efeito da densidade de 2558
estocagem sobre o crescimento da tainha listrada (Mugil platanus) criada em 2559

137
mono e policultivo com carpa comum (Cyprinus carpio) na região do Vale do 2560
Ribeira, SP. Boletim do Instituto de Pesca 22(2):85-93 2561
Shearer KD (2000) Experimental design, statistical analysis and modeling of dietary 2562
nutrient requirement studies for fish: a critical review. Aquaculture Nutrition 2563
6:91-102 2564
Shi-Yen, Li-Shan (2004) Dietary sodium requirement determined for juvenile hybrid 2565
tilapia (Oreochromis niloticus x O. aureus) reared in fresh water and seawater. 2566
British Journal of Nutrition 91:585-590 2567
Smith NF, Eddy FB, Talbot C (1995) Effect of dietary salt load on transepithelial Na+ 2568
exchange in freshwater rainbow trout (Oncorhynchus mykiss). The Journal of 2569
Experimental Biology 198:2359-2364Tseng Yung-Che, Hwang, Pung-Pung 2570
(2008) Some insights into energy metabolism for osmoregulation in fish. 2571
Comparative Biochemistry and Physiology C 148:419-429 2572
Tsuzuki MY, Sugai JK, Maciel, Francisco CJ, Cerqueira VR (2001) Survival, growth 2573
and digestive enzyme activity of juveniles of the fat snook (Centropomus 2574
parallelus) reared at different salinities. Aquaculture 261:319-325 2575
Vieira JP (1985) Distribuição, abundância e alimentação dos jovens de Mugilidae no 2576
estuário da Lagoa dos Patos e movimentos reprodutivos da “Tainha” (Mugil 2577
platanus Gunther, 1880) no litoral sul do Brasil. Dissertação de Mestrado em 2578

138
Oceanografia Biológica, Universidade Federal do Rio Grande (FURG), Brasil, 2579
104 p 2580
Vieira JP, Scalabrin C (1991) Migração reprodutiva da “tainha” (Mugil platanus) 2581
Günther 1880, no sul do Brasil. Atlântica 13:131-141 2582
Wood CM (2001) Toxic responses of the gill. In: Schlenk D, Benson W.H (eds.) Target 2583
Organ Toxicity in Marine and Freshwater Teleosts, Vol. 1, Organs, London, pp 1-2584
89 2585
Woo NYS, Kelly SP (1995) Effects of salinity and nutritional status on growth and 2586
metabolism of Sparus sarba in closed seawater system. Aquaculture 135:229-238. 2587

139
Table 1. Weight gain (WG), weight coefficient of variation (CV), specific growth rate 2588
(SGR), feed efficiency (FE), food consumption (FC) and Fulton coefficient (K) (±SE) 2589
in juvenile lebranche mullet Mugil liza fed on diets supplemented with different levels 2590
of NaCl and reared in freshwater for 45 days1. 2591
Parameter Salt Supplementation (%)
0.9 5.4 8.0 13.2
WG (%) 280,27± 10,83 a
286,42 ± 9,97 a
273,18 ± 8,02 a
209,21 ± 11,50 b
CV weigh 0.13 ± 0.01 0.14 ± 0.01 0.16 ± 0.01 0.12 ± 0.01
SGR 2.57 ± 0.10 a 2.63 ± 0.09 ab
2.51 ± 0.07 ab 1.83 ± 0.13 b
FE 0.37 ± 0.02 0.39 ± 0.01 0.36 ± 0.01 0.32 ± 0.02
FC (g) 332.95 ± 9.32 a 325.50 ± 16.26 a 314.48 ± 2.37 a 226.65 ± 8.18 b
K 2.90± 0.03a 3.06 ± 0.02
a 2.81 ± 0.02
a 2.34 ± 0.01
b
1 Data are expressed as mean ± standard error (n = 6). Different letters indicates significant 2592
difference (P < 0.05). 2593
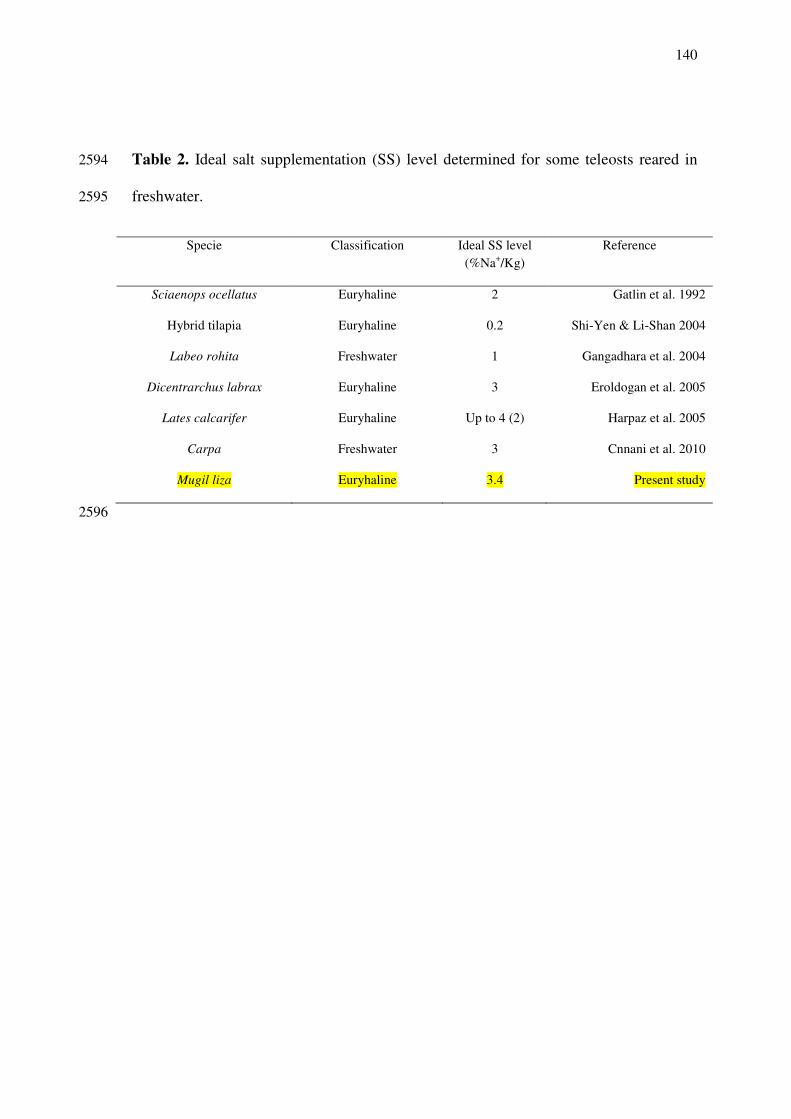
140
Table 2. Ideal salt supplementation (SS) level determined for some teleosts reared in 2594
freshwater. 2595
Specie Classification Ideal SS level (%Na+/Kg)
Reference
Sciaenops ocellatus Euryhaline 2 Gatlin et al. 1992
Hybrid tilapia Euryhaline 0.2 Shi-Yen & Li-Shan 2004
Labeo rohita Freshwater 1 Gangadhara et al. 2004
Dicentrarchus labrax Euryhaline 3 Eroldogan et al. 2005
Lates calcarifer Euryhaline Up to 4 (2) Harpaz et al. 2005
Carpa Freshwater 3 Cnnani et al. 2010
Mugil liza Euryhaline 3.4 Present study
2596
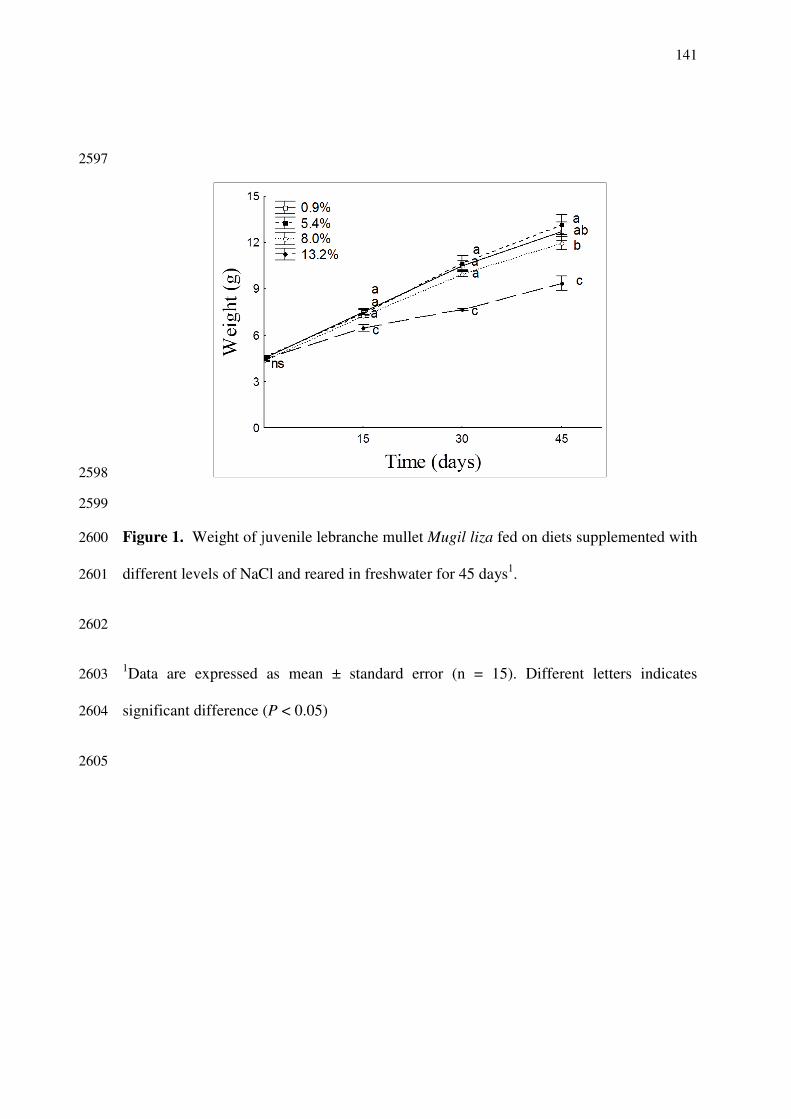
141
2597
2598
2599
Figure 1. Weight of juvenile lebranche mullet Mugil liza fed on diets supplemented with 2600
different levels of NaCl and reared in freshwater for 45 days1. 2601
2602
1Data are expressed as mean ± standard error (n = 15). Different letters indicates 2603
significant difference (P < 0.05) 2604
2605
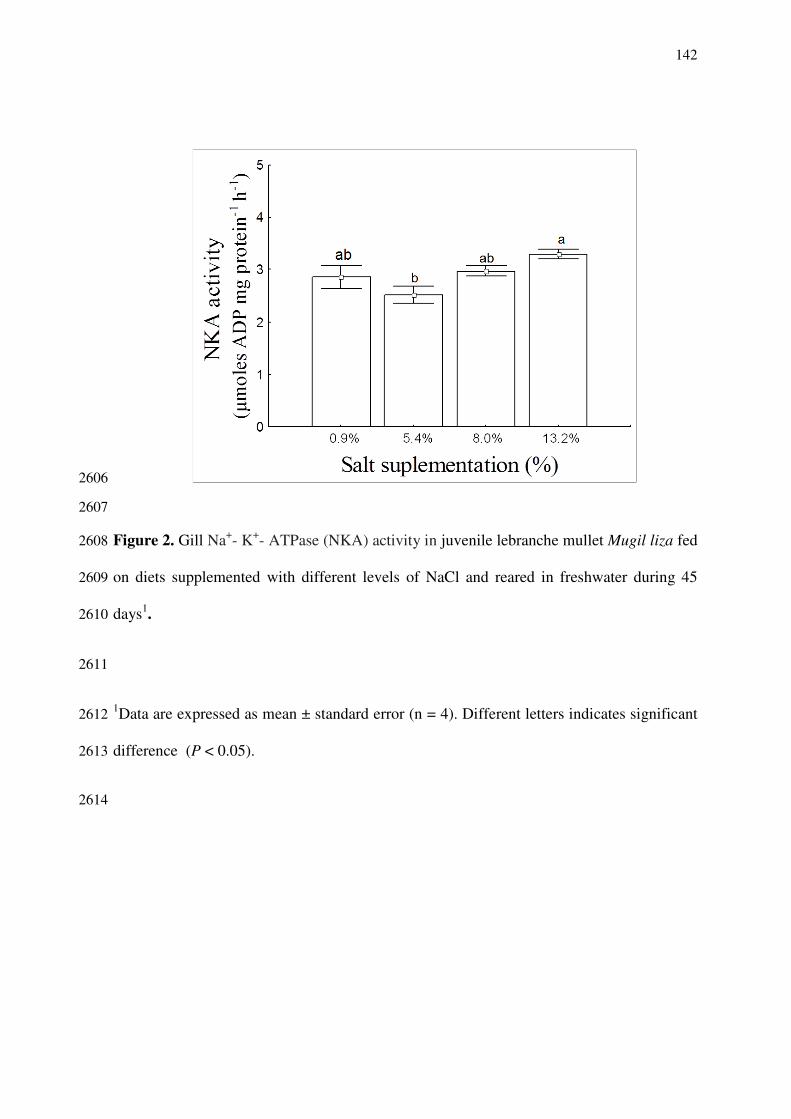
142
2606
2607
Figure 2. Gill Na+- K+- ATPase (NKA) activity in juvenile lebranche mullet Mugil liza fed 2608
on diets supplemented with different levels of NaCl and reared in freshwater during 45 2609
days1. 2610
2611
1Data are expressed as mean ± standard error (n = 4). Different letters indicates significant 2612
difference (P < 0.05). 2613
2614

147
2615 2616
2617 Figure 3. Liver glycogen in juvenile lebranche mullet Mugil liza fed on diets 2618
supplemented with different levels of NaCl and reared in freshwater during 45 days1. 2619
2620
1Data are expressed as mean ± standard error (n = 4). 2621
2622
2623


![PRINCÍPIOS PROCESSUAIS - cleberdemetrio.adv.br · princípios lógicos elementares do pensamento]. Princípio do terceiro excluído: princípio que postula a inexistência de](https://img.document.onl/doc/110x75/5bf31a2809d3f26f7c8b65ec/principios-processuais-principios-logicos-elementares-do-pensamento-principio.jpg)