Embed Size (px)
Citation preview
UNIVERSIDADE DE BRASÍLIA (UNB)
INSTITUTO DE GEOCIÊNCIAS (IG)
PÓS-GRADUAÇÃO EM GEOLOGIA
Daniela Schievano de Campos
CARACTERIZAÇÃO DOS ALVOS CASCAVEL E TINTEIRO,
GREENSTONE BELT DE FAINA, GO: IMPLICAÇÕES NA
IDENTIFICAÇÃO DE NOVOS ALVOS POTENCIAIS PARA EXPLORAÇÃO
MINERAL
DISSERTAÇÃO DE MESTRADO n° 351
Brasília – DF
2015
UNIVERSIDADE DE BRASÍLIA (UNB)
INSTITUTO DE GEOCIÊNCIAS (IG)
PÓS-GRADUAÇÃO EM GEOLOGIA
Daniela Schievano de Campos
CARACTERIZAÇÃO DOS ALVOS CASCAVEL E TINTEIRO,
GREENSTONE BELT DE FAINA, GO: IMPLICAÇÕES NA
IDENTIFICAÇÃO DE NOVOS ALVOS POTENCIAIS PARA EXPLORAÇÃO
MINERAL
Orientadora: Prof. Dra. Adalene Moreira Silva (UnB)
Co-Orientadora: Prof. Dra. Catarina Labouré Bemfica Toledo (UnB)
Dissertação de Mestrado apresentado à Banca
Examinadora do Instituto de Geociências da
Universidade de Brasília, como exigência para
obtenção do título de mestre em Geologia.
Brasília, 2015
UNIVERSIDADE DE BRASÍLIA
Instituto de Geociências
CARACTERIZAÇÃO DOS ALVOS CASCAVEL E TINTEIRO,
GREENSTONE BELT DE FAINA, GO: IMPLICAÇÕES NA
IDENTIFICAÇÃO DE NOVOS ALVOS POTENCIAIS PARA EXPLORAÇÃO
MINERAL
Daniela Schievano de Campos
BANCA EXAMINADORA
Prof. Dra. Adalene Moreira Silva (UnB)
Presidente
Prof. Dr. Jaime Estevão Scandolara
Membro Externo
Prof. Dr. Augusto C.B. Pires
Membro Interno
Brasília, 25 de agosto de 2015.
FICHA CATALOGRÁFICA

Aos meus queridos pais, João e Márcia,
e ao Ricardo Lívio,
pelo carinho e paciência,
meu eterno agradecimento!
i
Agradecimentos
A realização deste trabalho só foi possível graças à colaboração e à amizade de pessoas
muito especiais às quais gostaria de expressar meus sinceros agradecimentos.
Primeiramente agradeço a Deus por sempre estar presente em todos os momentos.
Aos meus queridos pais, João e Márcia, pelo apoio e pelo amor incondicional.
Ao meu noivo, Ricardo Lívio, pela paciência e por todas as dicas e discussões geológicas.
Sem você eu não teria ido tão longe...
Às professoras Adalene Moreira Silva e Catarina L. B. Toledo, por toda orientação,
incentivo, amizade e por contribuírem para minha formação acadêmica e profissional.
A Orinoco do Brasil Mineração Ltda., por todo suporte e pela liberação dos dados utilizados
neste trabalho, em especial a toda equipe do projeto Curral de Pedras. Aos geólogos Marcelo
Juliano de Carvalho, Vinícius Gomes Rodrigues, Kawinã Araujo e Tiago Vaz Andrade. Ao Cícero
(o Cicínho), pela companhia e apoio durante a segunda etapa de campo. Ao querido Tião e sua
esposa Luíza, pela amizade e hospitalidade. A equipe: Marcílio, Lukinha, Fabinho, Nenê e Tinteiro,
por todo auxílio prestado.
Ao seu Elídio César Neto, morador de Faina e fiel companheiro durante a primeira etapa de
campo.
A toda equipe do Laboratório de Microssonda Eletrônica do Instituto de Geociências da
UnB: ao professor Nilson Francisquini Botelho, Jacqueline Menez, Federico Alberto Cuadros,
Ricardo Lívio Santos Marques e Íris Dias Santos, pelo apoio, análises e por sempre me receberem
tão bem!
Aos queridos Maria Clara e Alberto, pelo suporte, paciência e carinho recebidos durante
toda minha estadia em Brasília.
Aos professores Tati de Almeida e Hardy Jost, e aos alunos Túlio Marques Soares, Hugo
Vidal, Eduardo Mansur e Gabriella Fazzio. Aos funcionários da UnB: Rogério, Abel, Alice, Stela e
Dione.
ii
SUMÁRIO
RESUMO............................................................................................................................. .............................vi
ABSTRACT.....................................................................................................................................................vii
I. INTRODUÇÃO ............................................................................................................................................1
1.1 -APRESENTAÇÃO...........................................................................................................................2
1.2 - OBJETIVOS.................................. ................................................................................................4
1.3 - LOCALIZAÇÃO E ACESSO À ÁREA.................................... .......................................................5
1.4 - MATERIAIS E MÉTODOS...........................................................................................................6
1.4.1 – Materiais...................................................................................................................................6
1.4.1.1 – Dados Cartográficos......................................................................................................6
1.4.1.2 – Dados aerogeofísicos no Greenstone Belt de Faina....................................................7
1.4.1.3 – Imagem de satélite.........................................................................................................7
1.4.1.4 – Testemunhos de sondagem.............................................................................................7
1.4.1.5 – Petrografia.....................................................................................................................8
1.4.1.6 – Geoquímica....................................................................................................................8
1.4.2. – Métodos de Trabalho..............................................................................................................8
1.4.2.1 – Pesquisa Bibliográfica....................................................................................................9
1.4.2.2 – Processamento e interpretação dos dados aerogeofísicos de alta resolução................9
1.4.2.3 – Processamento de dados geoquímicos............................................................................9
1.4.2.4 – Coleta das propriedades físicas de rocha.......................................................................9
1.4.2.5 – Mapeamento geológico.................................................................................................10
1.4.2.6 – Estudos petrográficos....................................................................................................10
1.4.2.7 – Microssonda Eletrônica................................................................................................10
1.4.2.8 – Integração de dados em um mapa prospectivo.............................................................10
1.5 - ESTRUTURA DA DISSERTAÇÃO.................... ........................................................................11
II. ARTIGO.................................................................................................................................... .................12
ABSTRACT.....................................................................................................................................................13
1. Introduction..............................................................................................................................................14
2. Geologic Context and Mineralization in the Faina Greenstone Belt...................................................16
2.1. Regional Geology...............................................................................................................................16
2.2. Faina and Serra de Santa Rita Greenstone Belts...............................................................................17
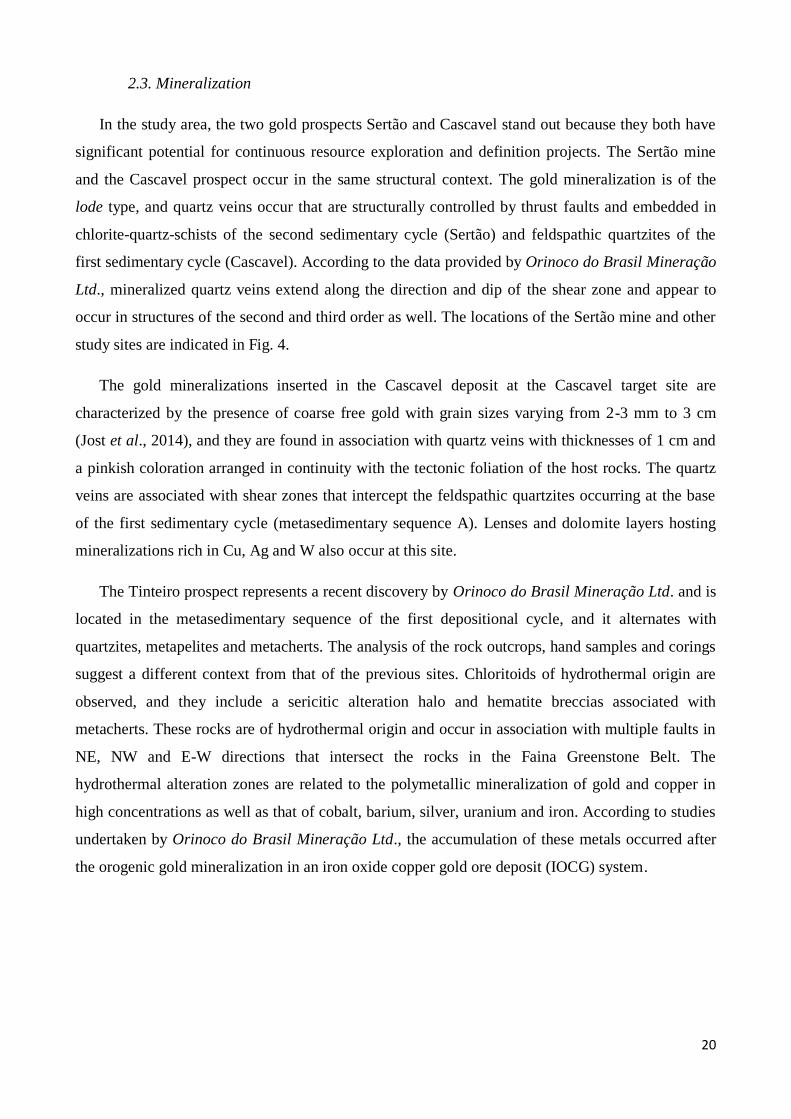
2.3. Mineralization............................................................................................................................. ........20
3. Airborne Geophysical Data and Other Multi-Source Data..................................................................22
4. Data Processing and Interpretation........................................................................................................23
4.1. Geophysical Data...............................................................................................................................23
4.1.1. Aeromagnetic Data.....................................................................................................................24
4.1.2. Gama Spectrometry Data .........................................................................................................25
4.1.3. Interpretation of Aeromagnetic Data.........................................................................................27
4.1.4. Interpretation of Gamma Spectrometry Data.............................................................................29
4.2. Geologic Data....................................................................................................................................29
4.3. Petrography and Electronic Microprobe Analysis............................................................................30
4.4. Drill Cores .......................................................................................................................................30
iii
4.5. Geochemical Data.............................................................................................................................30
5. Polymetallic and Gold Mineralizations in the Faina Greenstone Belt................................................32
5.1. Cascavel Target..................................................................................................................................32
5.1.1. Lithological and Structural Controls................................... ......................................................32
5.1.2. Hydrothermal Alteration Zones..................................................................................................33
5.1.3. Physical Properties of Rocks......................................................................................................37
5.1.4. Geochemistry..............................................................................................................................40
5.1.5. Mineral Exploration Vectors......................................................................................................42
5.2. TinteiroTarget.....................................................................................................................................42
5.2.1. Lithological and Structural Controls ........................................................................................42
5.2.2. Hydrothermal Alteration Zones..................................................................................................44
5.2.3. Rock Physical Properties............................................................................................................47
5.2.4. Geochemistry..............................................................................................................................48
5.2.5. Mineral Exploration Vectors......................................................................................................49
6. Data Integration in Prospectivity Maps – Selecting New Target sites.................................................49
6.1. Cascavel Target..................................................................................................................................51
6.2. Tinteiro Target....................................................................................................................................52
7. Validation and Evaluation of the Best Predictors.................................................................................56
8. Discussion and Conclusions.....................................................................................................................60
9. Acknowledgments.....................................................................................................................................61
10. References..................................................................................................................................................61
III. DISCUSSÕES E CONSIDERAÇÕES FINAIS.....................................................................................65
IV. REFERÊNCIAS............................................................................................................................. ...........68
LISTA DE FIGURAS
I. INTRODUÇÃO
Fig. 1. Fluxograma descritivo das principais etapas envolvidas no modelo de exploração mineral. Este
diagrama é baseado na metodologia proposta por Pan & Harris (2000), Harris & Sanborn-Barrie (2006) e
modificado de Nykänen (2008) e Costa e Silva et al. (2013).............................................................................4
Fig.2. Localização da área de estudo e vias de acesso (parte dos dados foi extraído da base de dados base
map).....................................................................................................................................................................6
II. ARTIGO
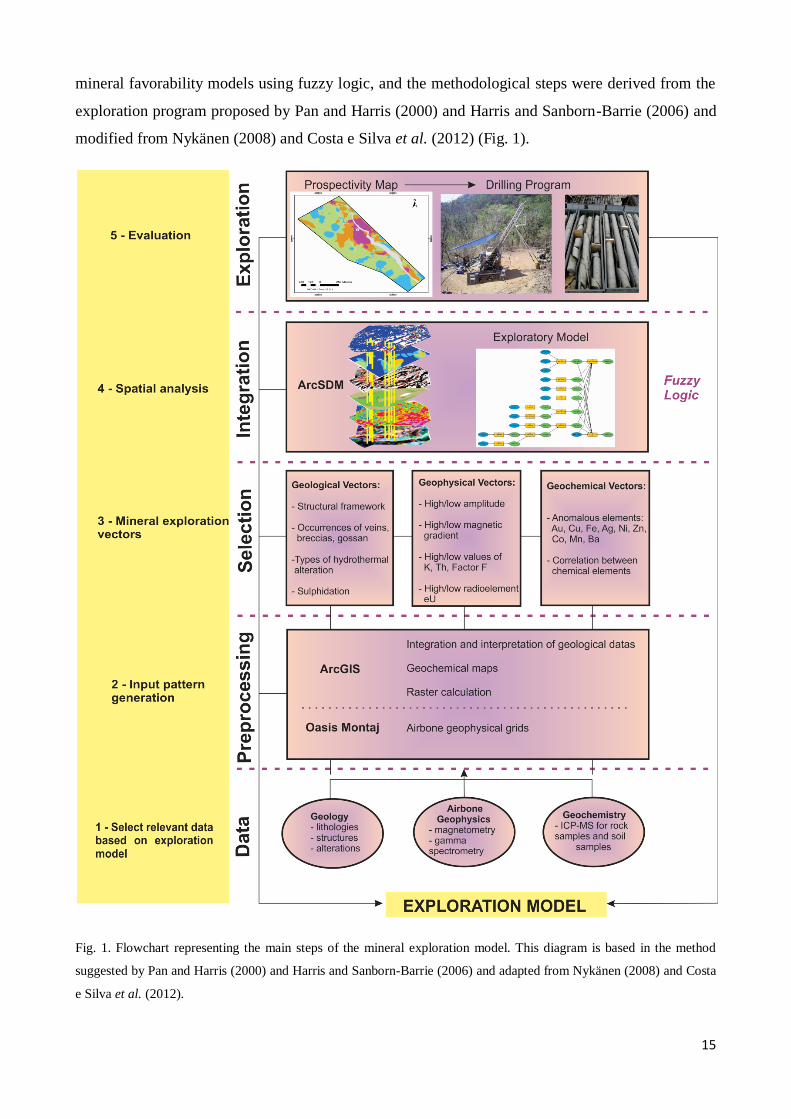
Fig.1. Flowchart representing the main steps of the mineral exploration model. This diagram is based in the
method suggested by Pan and Harris (2000) and Harris and Sanborn-Barrie (2006) and adapted from
Nykänen (2008) and Costa and Silva et al. (2012). ........................................................................................15
Fig.2. Simplified geologic map of the Archean-Paleoproterozoic Terrane in Goiás (Pimentel et al., 2000)...17
Fig.3. Regional geologic map of the Faina Greenstone Belt produced by Toledo et al. (2014). The black
polygon indicates the study area mapped at the 1:10,000 scale, which is shown in Fig.8...............................19
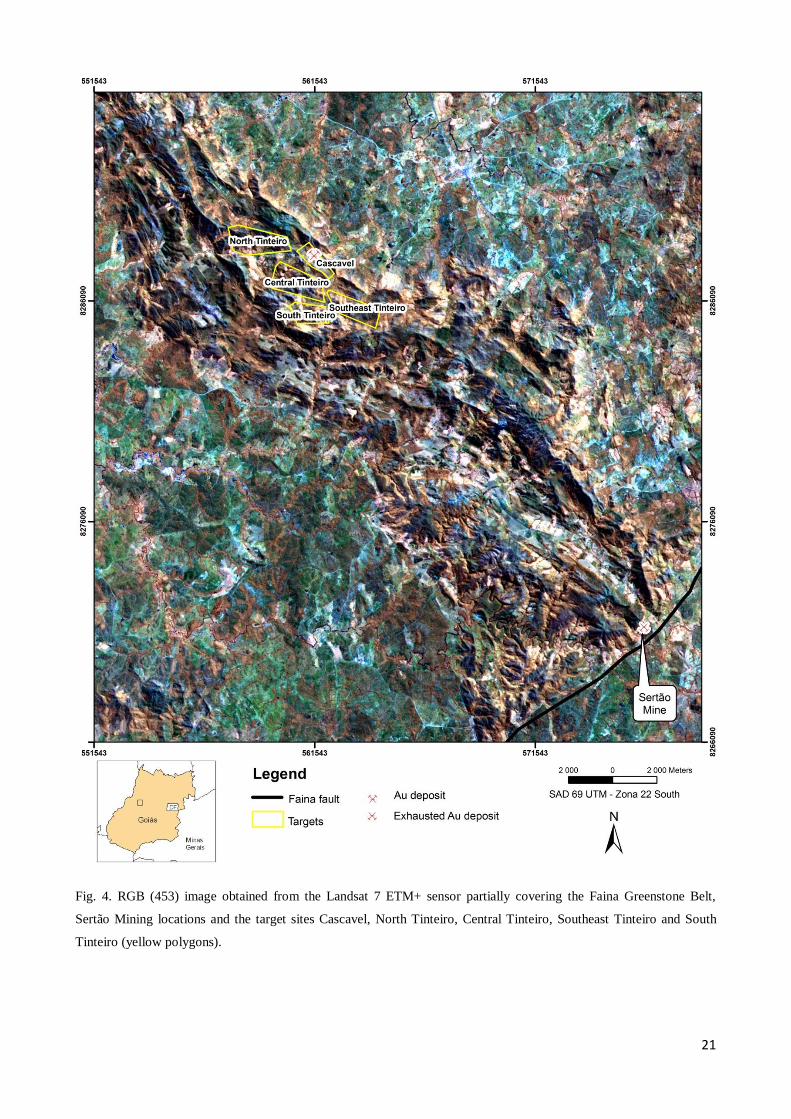
Fig.4. RGB (453) image obtained from the Landsat 7 ETM+ sensor partially covering the Faina Greenstone
Belt, Sertão Mining locations and the target sites Cascavel, North Tinteiro, Central Tinteiro, Southeast
Tinteiro and South Tinteiro (yellow polygons).................................................................................................21
Fig. 5. Main aeromagnetic products: a) TMI, b) ASA, c) Dx, d) Dy and and) Dz. The black outline indicates
the main sites analyzed in this study: A – Cascavel, B – North Tinteiro, C – Central Tinteiro, D – Southeast
Tinteiro and E – South Tinteiro........................................................................................................................25
Fig. 6. K (%), eU (ppm) and eTh (ppm) concentrations used to identify the hydrothermal alteration zones,
and the RGB image, which is essential for the geologic mapping and shows the Cascavel and Tinteiro target
sites....................................................................................................................................................................27
iv
Fig. 7. Map showing the first vertical derivative (Dz) of the anomalous magnetic field in the study area and
identifying the main geologic structures interpreted based on the Dz, Dy, and RGB 453 image of the Landsat
7 ETM+ sensor. The boreholes conducted by the Orinoco do Brasil Mineração Ltd. are indicated by the
green marker.................................................................................................................................... ..................28
Fig. 8. Geologic map of the study area at the 1:10,000 scale covering the Cascavel and Tinteiro target sites;
the map was produced by integrating the geologic map created by Toledo et al. (2014) at the 1:25,000 scale,
the geologic map created by Orinoco do Brasil Mineração Ltd. and data obtained in this study, and it shows
the boundaries of the hydrothermal alteration halos.........................................................................................31
Fig. 9. Main rocks found in Cascavel: a) quartzite; b) feldspathic quartzite; c) weathered metapelite; and d)
intercalated carbonaceous schists in metarhythmite packages..........................................................................32
Fig. 10. . Photos of the Cascavel site gallery: a) fine pinkish quartz vein (marked in yellow) from 10 to 50
cm thick and hosted in quartzite with green muscovite; b), c) and d) spots of free gold in the quartz vein or at
the contact of the vein with the host rock. Photos: Orinoco do Brasil Mineração Ltd....................................34
Fig. 11. A. Description of the borehole CDP-04 showing mineralized layers. Photomicrography: a) S-C
foliation marked by muscovite in quartz-muscovite schist; and b) deformed potassium feldspar, showing
pressure shadows filled with biotite. The muscovite is older than the biotite. B. Description of the borehole
CDP-09 showing mineralized layers. Photomicrography: c) hydrothermal muscovite (1) formed from biotite
(2); d) feldspathic quartzite with muscovite; and e) late euhedral pyrite. Note: Bt – biotite, KF – potassium
feldspar, Musc – muscovite, Qz – quartz, Py – pyrite, Chl – chlorite..............................................................36
Fig. 12. Representation of the hydrothermal alteration halos in the Cascavel site; the inner halo is represented
by the mineralized zone and the external halo by distal zone 2........................................................................37
Fig. 13. Magnetic susceptibility measurements (*10-3
SI) obtained for boreholes CDP-04 and CDP-09.
Layers with high magnetic susceptibility values are associated with metapelites, meta-ultramafics and
carbonaceous schists. Layers with biotite mineralization layers, such as at 113 m in CDP-04 and at 221 m in
CDP-09, represent magnetic susceptibility peak values...................................................................................38
Fig. 14. Measurements of the radioelements K, U and Th and the Fk factor (in cpm, counts per minute) in the
boreholes CDP-04 and CDP-09. Mineralized layers show peak values of radioelement K, which was
highlighted by the Fk factor..............................................................................................................................39
Fig. 15. Distribution of the elements Au, Cu, Zn, Ni, Co, Cr, Pb and W (in ppm) along the boreholes CDP-04
and CDP-09, and possible correlations (red circles).........................................................................................41
Fig. 16. Photos of the rocks found in Tinteiro: a) quartzite with muscovite is massive and gray; b) quartz-
muscovite schist is weathered and folded; c) quartz-chlorite-muscovite schist is greenish; d) massive
metachert is formed mainly by quartz; and e) finely laminated metachert shows bands rich in quartz
alternated with bands rich in muscovite and biotite..........................................................................................43
Fig. 17. a) Hydrothermal alteration characteristic of the Tinteiro site, which shows solid portions of
goethite/hematite in metachert, consisting of hematite breccia; b) hematite breccia is highly weathered and
contains green muscovite; c) photomicrography of the metallic gray cement of the hematite breccia (Musc –
muscovite; Ox – oxides, such as goethite and hematite); d) detail of the breccia formed by irregular
fragments of metachert cemented by metallic bluish gray material; e) and f) backscatter images of the
manganiferous breccia cement showing that e) 1, 2 and 3 are hollandite (lighter) and 4, 5 and 6 are
lithiophorite (darker); and f) 1 is hollandite, 2, 3 and 4 are lithiophorite, and 5 and 6 are
muscovite..........................................................................................................................................................45
Fig. 18. Chemical analyses of the borehole TIN-1A, highlighting the layer intercepting the manganiferous
breccia and showing anomalous concentrations of Ag, Ba, Pb and V in addition to Co, Cu, Mn, Ni, Zn and
Li, which occur in the lithiophorite structure....................................................................................................47
Fig. 19. Steps of the fuzzy logic method in the development of the mineral exploration model. Modified
from Nykänen et al. (2008)...............................................................................................................................50
Fig. 20. Flowchart representing the steps of the fuzzy logic method and the resulting prospectivity map for
Cascavel. The largest region showing high favorability coincides with the Cascavel
deposit...............................................................................................................................................................52
Fig. 21. Flowchart representing the elements, fuzzy membership function and fuzzy operators, and the
prospectivity maps produced for a) North Tinteiro and b) Central Tinteiro, which contains
cobalt.................................................................................................................................................................54
Fig. 22. Flowchart representing the elements, fuzzy membership function and fuzzy operators, and the
prospectivity maps produced for a) Southeast Tinteiro and b) South Tinteiro, which both contain
silver.................................................................................................................................................... ..............55
v
Fig. 23. Prospectivity map for the Cascavel site integrated with the soil grid, mineralized quartz veins
associated with the Cascavel deposit, and the main lineaments identified from aeromagnetic images. The soil
grid refinement over the area showing the highest favorability indicates an anomalous concentration of gold
in this region. The concentration of the radioelement K (%) indicates that the region of highest favorability is
associated with high K concentration...............................................................................................................57
Fig. 24. Prospectivity map for the Tinteiro site: a) North Tinteiro and b) Central Tinteiro. The integration of
the prospectivity maps with the results from the chemical analyses on the rock and soil samples and the cores
validated certain high-favorability zones. These zones are intersected by lineaments and associated with high
magnetic amplitudes..........................................................................................................................................58
Fig. 25. Prospectivity map for the Tinteiro site: a) Southeast Tinteiro and b) South Tinteiro. The integration
of the prospectivity maps with the results from the chemical analyses on the rock and soil samples and cores
validate some high-favorability zones. These zones are intersected by lineaments and are associated with
high magnetic amplitudes.................................................................................................................................59
LISTA DE TABELAS
Table 1. Rock samples from the Cascavel site gallery.....................................................................................34
Table 2. Paragenesis of the hydrothermal alteration halo in Cascavel.............................................................37
Table 3. Main mineral exploration vectors identified for the Cascavel target site...........................................42
Table 4. Paragenesis of the hydrothermal alteration halos in Tinteiro prospect..............................................47
Table 5. Statistical values of the magnetic susceptibility in the samples from Tinteiro; M: Mean, S.D.:
standard deviation.............................................................................................................................................48
Table 6. Main mineral exploration vectors identified in the Tinteiro target site..............................................49
Table 7. Fuzzy operators described by An et al. (1991) and Bonham-Carter (1994)......................................50
Table 8. Fuzzy membership values assigned to each lithology........................................................................50
vi
RESUMO
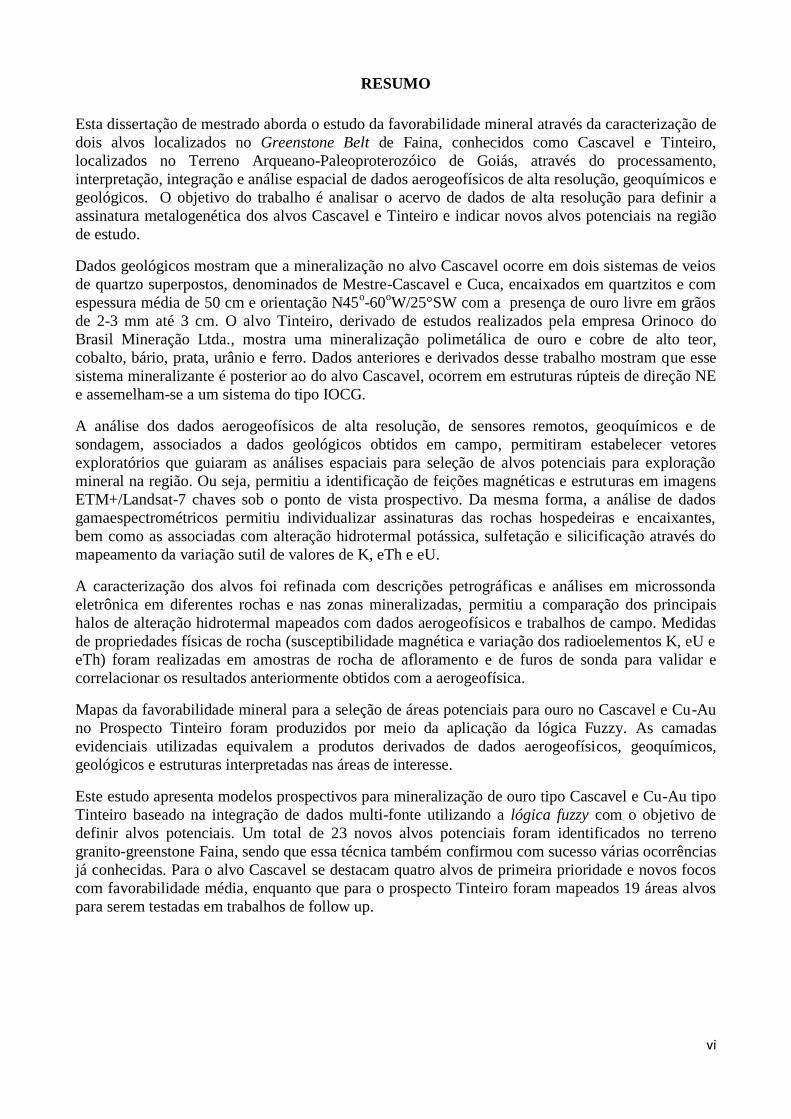
Esta dissertação de mestrado aborda o estudo da favorabilidade mineral através da caracterização de
dois alvos localizados no Greenstone Belt de Faina, conhecidos como Cascavel e Tinteiro,
localizados no Terreno Arqueano-Paleoproterozóico de Goiás, através do processamento,
interpretação, integração e análise espacial de dados aerogeofísicos de alta resolução, geoquímicos e
geológicos. O objetivo do trabalho é analisar o acervo de dados de alta resolução para definir a
assinatura metalogenética dos alvos Cascavel e Tinteiro e indicar novos alvos potenciais na região
de estudo.
Dados geológicos mostram que a mineralização no alvo Cascavel ocorre em dois sistemas de veios
de quartzo superpostos, denominados de Mestre-Cascavel e Cuca, encaixados em quartzitos e com
espessura média de 50 cm e orientação N45o-60
oW/25°SW com a presença de ouro livre em grãos
de 2-3 mm até 3 cm. O alvo Tinteiro, derivado de estudos realizados pela empresa Orinoco do
Brasil Mineração Ltda., mostra uma mineralização polimetálica de ouro e cobre de alto teor,
cobalto, bário, prata, urânio e ferro. Dados anteriores e derivados desse trabalho mostram que esse
sistema mineralizante é posterior ao do alvo Cascavel, ocorrem em estruturas rúpteis de direção NE
e assemelham-se a um sistema do tipo IOCG.
A análise dos dados aerogeofísicos de alta resolução, de sensores remotos, geoquímicos e de
sondagem, associados a dados geológicos obtidos em campo, permitiram estabelecer vetores
exploratórios que guiaram as análises espaciais para seleção de alvos potenciais para exploração
mineral na região. Ou seja, permitiu a identificação de feições magnéticas e estruturas em imagens
ETM+/Landsat-7 chaves sob o ponto de vista prospectivo. Da mesma forma, a análise de dados
gamaespectrométricos permitiu individualizar assinaturas das rochas hospedeiras e encaixantes,
bem como as associadas com alteração hidrotermal potássica, sulfetação e silicificação através do
mapeamento da variação sutil de valores de K, eTh e eU.
A caracterização dos alvos foi refinada com descrições petrográficas e análises em microssonda
eletrônica em diferentes rochas e nas zonas mineralizadas, permitiu a comparação dos principais
halos de alteração hidrotermal mapeados com dados aerogeofísicos e trabalhos de campo. Medidas
de propriedades físicas de rocha (susceptibilidade magnética e variação dos radioelementos K, eU e
eTh) foram realizadas em amostras de rocha de afloramento e de furos de sonda para validar e
correlacionar os resultados anteriormente obtidos com a aerogeofísica.
Mapas da favorabilidade mineral para a seleção de áreas potenciais para ouro no Cascavel e Cu-Au
no Prospecto Tinteiro foram produzidos por meio da aplicação da lógica Fuzzy. As camadas
evidenciais utilizadas equivalem a produtos derivados de dados aerogeofísicos, geoquímicos,
geológicos e estruturas interpretadas nas áreas de interesse.
Este estudo apresenta modelos prospectivos para mineralização de ouro tipo Cascavel e Cu-Au tipo
Tinteiro baseado na integração de dados multi-fonte utilizando a lógica fuzzy com o objetivo de
definir alvos potenciais. Um total de 23 novos alvos potenciais foram identificados no terreno
granito-greenstone Faina, sendo que essa técnica também confirmou com sucesso várias ocorrências
já conhecidas. Para o alvo Cascavel se destacam quatro alvos de primeira prioridade e novos focos
com favorabilidade média, enquanto que para o prospecto Tinteiro foram mapeados 19 áreas alvos
para serem testadas em trabalhos de follow up.
vii
ABSTRACT
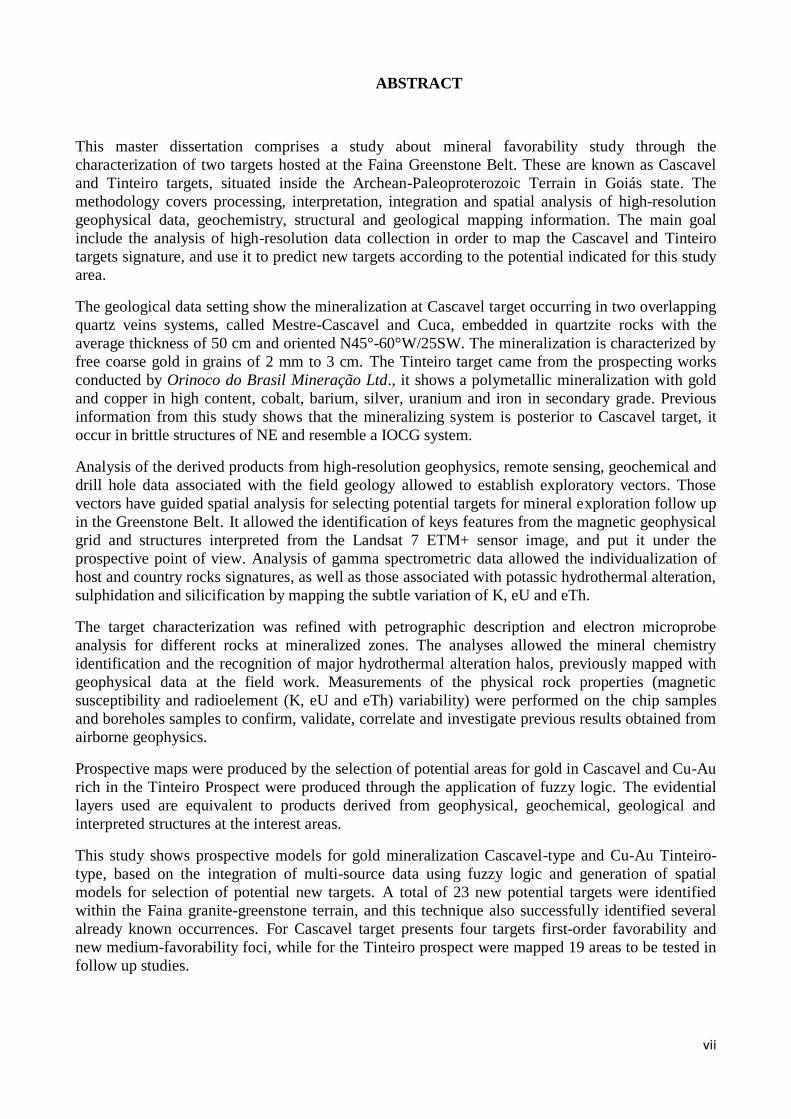
This master dissertation comprises a study about mineral favorability study through the
characterization of two targets hosted at the Faina Greenstone Belt. These are known as Cascavel
and Tinteiro targets, situated inside the Archean-Paleoproterozoic Terrain in Goiás state. The
methodology covers processing, interpretation, integration and spatial analysis of high-resolution
geophysical data, geochemistry, structural and geological mapping information. The main goal
include the analysis of high-resolution data collection in order to map the Cascavel and Tinteiro
targets signature, and use it to predict new targets according to the potential indicated for this study
area.
The geological data setting show the mineralization at Cascavel target occurring in two overlapping
quartz veins systems, called Mestre-Cascavel and Cuca, embedded in quartzite rocks with the
average thickness of 50 cm and oriented N45°-60°W/25SW. The mineralization is characterized by
free coarse gold in grains of 2 mm to 3 cm. The Tinteiro target came from the prospecting works
conducted by Orinoco do Brasil Mineração Ltd., it shows a polymetallic mineralization with gold
and copper in high content, cobalt, barium, silver, uranium and iron in secondary grade. Previous
information from this study shows that the mineralizing system is posterior to Cascavel target, it
occur in brittle structures of NE and resemble a IOCG system.
Analysis of the derived products from high-resolution geophysics, remote sensing, geochemical and
drill hole data associated with the field geology allowed to establish exploratory vectors. Those
vectors have guided spatial analysis for selecting potential targets for mineral exploration follow up
in the Greenstone Belt. It allowed the identification of keys features from the magnetic geophysical
grid and structures interpreted from the Landsat 7 ETM+ sensor image, and put it under the
prospective point of view. Analysis of gamma spectrometric data allowed the individualization of
host and country rocks signatures, as well as those associated with potassic hydrothermal alteration,
sulphidation and silicification by mapping the subtle variation of K, eU and eTh.
The target characterization was refined with petrographic description and electron microprobe
analysis for different rocks at mineralized zones. The analyses allowed the mineral chemistry
identification and the recognition of major hydrothermal alteration halos, previously mapped with
geophysical data at the field work. Measurements of the physical rock properties (magnetic
susceptibility and radioelement (K, eU and eTh) variability) were performed on the chip samples
and boreholes samples to confirm, validate, correlate and investigate previous results obtained from
airborne geophysics.
Prospective maps were produced by the selection of potential areas for gold in Cascavel and Cu-Au
rich in the Tinteiro Prospect were produced through the application of fuzzy logic. The evidential
layers used are equivalent to products derived from geophysical, geochemical, geological and
interpreted structures at the interest areas.
This study shows prospective models for gold mineralization Cascavel-type and Cu-Au Tinteiro-
type, based on the integration of multi-source data using fuzzy logic and generation of spatial
models for selection of potential new targets. A total of 23 new potential targets were identified
within the Faina granite-greenstone terrain, and this technique also successfully identified several
already known occurrences. For Cascavel target presents four targets first-order favorability and
new medium-favorability foci, while for the Tinteiro prospect were mapped 19 areas to be tested in
follow up studies.

1
I. INTRODUÇÃO
2
1. INTRODUÇÃO
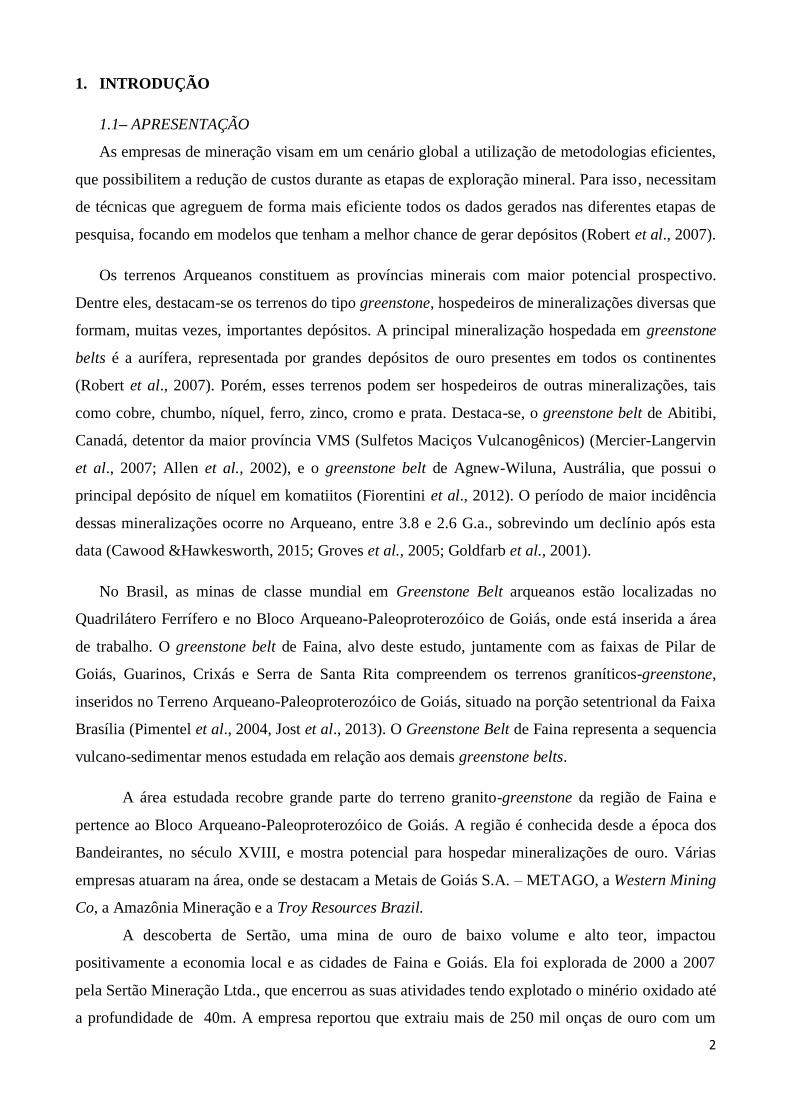
1.1– APRESENTAÇÃO
As empresas de mineração visam em um cenário global a utilização de metodologias eficientes,
que possibilitem a redução de custos durante as etapas de exploração mineral. Para isso, necessitam
de técnicas que agreguem de forma mais eficiente todos os dados gerados nas diferentes etapas de
pesquisa, focando em modelos que tenham a melhor chance de gerar depósitos (Robert et al., 2007).
Os terrenos Arqueanos constituem as províncias minerais com maior potencial prospectivo.
Dentre eles, destacam-se os terrenos do tipo greenstone, hospedeiros de mineralizações diversas que
formam, muitas vezes, importantes depósitos. A principal mineralização hospedada em greenstone
belts é a aurífera, representada por grandes depósitos de ouro presentes em todos os continentes
(Robert et al., 2007). Porém, esses terrenos podem ser hospedeiros de outras mineralizações, tais
como cobre, chumbo, níquel, ferro, zinco, cromo e prata. Destaca-se, o greenstone belt de Abitibi,
Canadá, detentor da maior província VMS (Sulfetos Maciços Vulcanogênicos) (Mercier-Langervin
et al., 2007; Allen et al., 2002), e o greenstone belt de Agnew-Wiluna, Austrália, que possui o
principal depósito de níquel em komatiitos (Fiorentini et al., 2012). O período de maior incidência
dessas mineralizações ocorre no Arqueano, entre 3.8 e 2.6 G.a., sobrevindo um declínio após esta
data (Cawood &Hawkesworth, 2015; Groves et al., 2005; Goldfarb et al., 2001).
No Brasil, as minas de classe mundial em Greenstone Belt arqueanos estão localizadas no
Quadrilátero Ferrífero e no Bloco Arqueano-Paleoproterozóico de Goiás, onde está inserida a área
de trabalho. O greenstone belt de Faina, alvo deste estudo, juntamente com as faixas de Pilar de
Goiás, Guarinos, Crixás e Serra de Santa Rita compreendem os terrenos graníticos-greenstone,
inseridos no Terreno Arqueano-Paleoproterozóico de Goiás, situado na porção setentrional da Faixa
Brasília (Pimentel et al., 2004, Jost et al., 2013). O Greenstone Belt de Faina representa a sequencia
vulcano-sedimentar menos estudada em relação aos demais greenstone belts.
A área estudada recobre grande parte do terreno granito-greenstone da região de Faina e
pertence ao Bloco Arqueano-Paleoproterozóico de Goiás. A região é conhecida desde a época dos
Bandeirantes, no século XVIII, e mostra potencial para hospedar mineralizações de ouro. Várias
empresas atuaram na área, onde se destacam a Metais de Goiás S.A. – METAGO, a Western Mining
Co, a Amazônia Mineração e a Troy Resources Brazil.
A descoberta de Sertão, uma mina de ouro de baixo volume e alto teor, impactou
positivamente a economia local e as cidades de Faina e Goiás. Ela foi explorada de 2000 a 2007
pela Sertão Mineração Ltda., que encerrou as suas atividades tendo explotado o minério oxidado até
a profundidade de 40m. A empresa reportou que extraiu mais de 250 mil onças de ouro com um
3
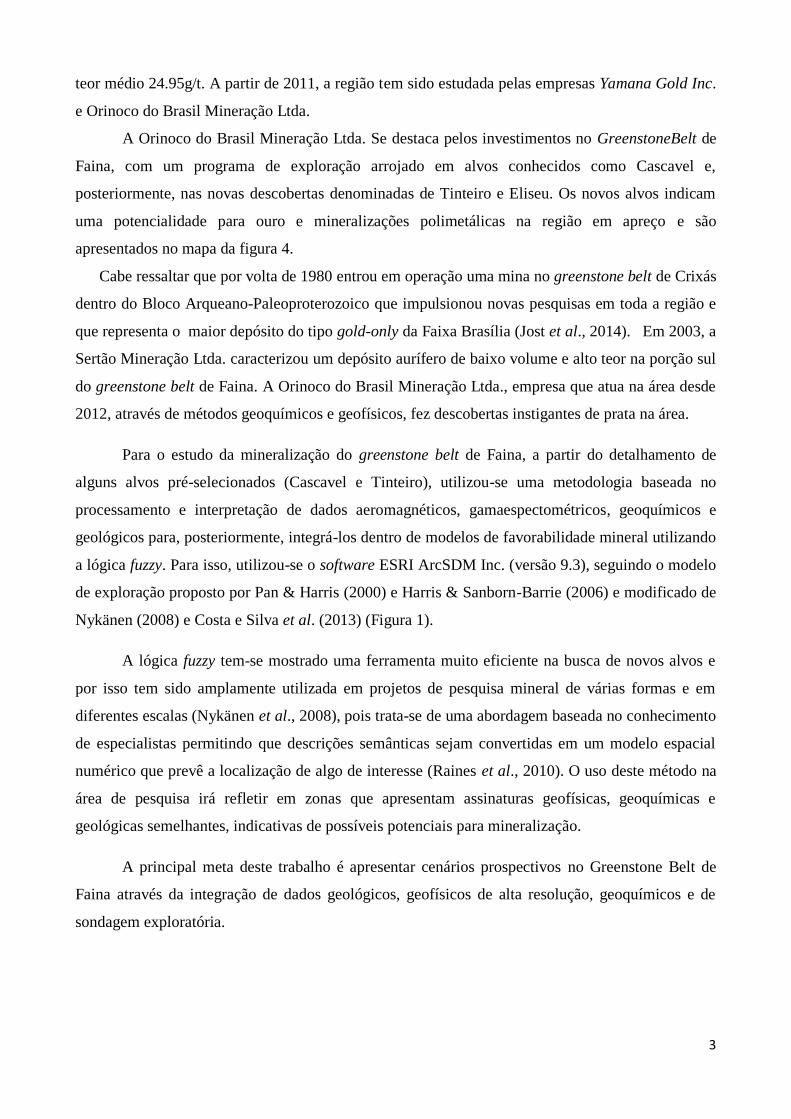
teor médio 24.95g/t. A partir de 2011, a região tem sido estudada pelas empresas Yamana Gold Inc.
e Orinoco do Brasil Mineração Ltda.
A Orinoco do Brasil Mineração Ltda. Se destaca pelos investimentos no GreenstoneBelt de
Faina, com um programa de exploração arrojado em alvos conhecidos como Cascavel e,
posteriormente, nas novas descobertas denominadas de Tinteiro e Eliseu. Os novos alvos indicam
uma potencialidade para ouro e mineralizações polimetálicas na região em apreço e são
apresentados no mapa da figura 4.
Cabe ressaltar que por volta de 1980 entrou em operação uma mina no greenstone belt de Crixás
dentro do Bloco Arqueano-Paleoproterozoico que impulsionou novas pesquisas em toda a região e
que representa o maior depósito do tipo gold-only da Faixa Brasília (Jost et al., 2014). Em 2003, a
Sertão Mineração Ltda. caracterizou um depósito aurífero de baixo volume e alto teor na porção sul
do greenstone belt de Faina. A Orinoco do Brasil Mineração Ltda., empresa que atua na área desde
2012, através de métodos geoquímicos e geofísicos, fez descobertas instigantes de prata na área.
Para o estudo da mineralização do greenstone belt de Faina, a partir do detalhamento de
alguns alvos pré-selecionados (Cascavel e Tinteiro), utilizou-se uma metodologia baseada no
processamento e interpretação de dados aeromagnéticos, gamaespectométricos, geoquímicos e
geológicos para, posteriormente, integrá-los dentro de modelos de favorabilidade mineral utilizando
a lógica fuzzy. Para isso, utilizou-se o software ESRI ArcSDM Inc. (versão 9.3), seguindo o modelo
de exploração proposto por Pan & Harris (2000) e Harris & Sanborn-Barrie (2006) e modificado de
Nykänen (2008) e Costa e Silva et al. (2013) (Figura 1).
A lógica fuzzy tem-se mostrado uma ferramenta muito eficiente na busca de novos alvos e
por isso tem sido amplamente utilizada em projetos de pesquisa mineral de várias formas e em
diferentes escalas (Nykänen et al., 2008), pois trata-se de uma abordagem baseada no conhecimento
de especialistas permitindo que descrições semânticas sejam convertidas em um modelo espacial
numérico que prevê a localização de algo de interesse (Raines et al., 2010). O uso deste método na
área de pesquisa irá refletir em zonas que apresentam assinaturas geofísicas, geoquímicas e
geológicas semelhantes, indicativas de possíveis potenciais para mineralização.
A principal meta deste trabalho é apresentar cenários prospectivos no Greenstone Belt de
Faina através da integração de dados geológicos, geofísicos de alta resolução, geoquímicos e de
sondagem exploratória.
4
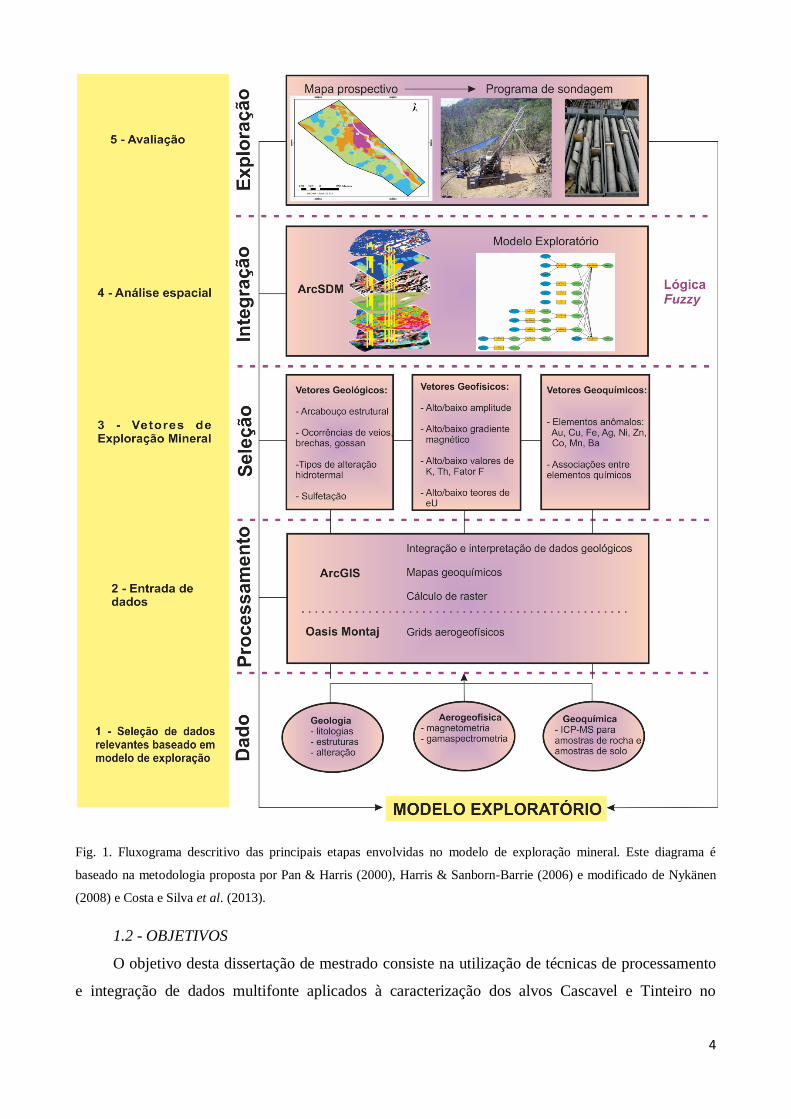
Fig. 1. Fluxograma descritivo das principais etapas envolvidas no modelo de exploração mineral. Este diagrama é
baseado na metodologia proposta por Pan & Harris (2000), Harris & Sanborn-Barrie (2006) e modificado de Nykänen
(2008) e Costa e Silva et al. (2013).
1.2 - OBJETIVOS
O objetivo desta dissertação de mestrado consiste na utilização de técnicas de processamento
e integração de dados multifonte aplicados à caracterização dos alvos Cascavel e Tinteiro no
5
Greenstone Belt de Faina. Ao final, pretende-se apontar novos alvos potenciais na região em
apreço, por meio da análise espacial utilizando lógica fuzzy.
Os objetivos específicos incluem:
o cartografar estruturas regionais e locais com o intuito de definir zonas com potencial
metalogenético através da investigação qualitativa de dados aeromagnetométricos e de
imagens do sensor ETM+/Landsat 7;
o caracterizar a assinatura gamaespectrométrica das principais rochas dos alvos Cascavel e
Tinteiro, bem como mapear as variações do teor de radiolementos que indiquem zonas de
alteração hidrotermal;
o caracterizar petrograficamente os halos de alteração hidrotermal mapeados através dos dados
gamaespectrométricos e em trabalho de campo para refinar os vetores indicados pela
gamaespectrometria;
o caracterização química dos alvos utilizando processamento de dados geoquímicos em
amostras de rocha, solo e furos de sondagem e geração de produtos derivados para análise
espacial;
o coleta de dados de propriedade físicas de rocha com o intuito de refinar a interpretação dos
dados aerogeofísicos;
o gerar mapas de favorabilidade mineral através da aplicação da lógica fuzzy a partir dos
produtos derivados dos dados multi-fonte para os alvos Cascavel e Tinteiro, com intuito de
apontar novos alvos potenciais para exploração mineral.
1.3 - LOCALIZAÇÃO E ACESSO A ÁREA
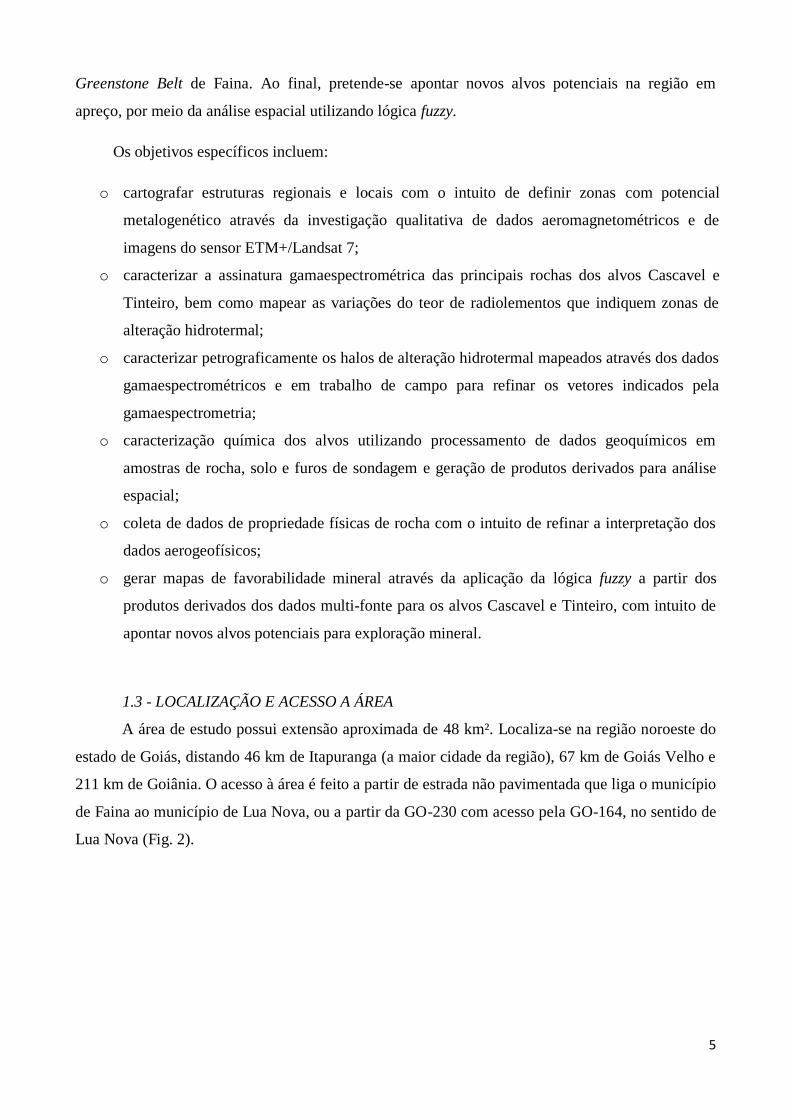
A área de estudo possui extensão aproximada de 48 km². Localiza-se na região noroeste do
estado de Goiás, distando 46 km de Itapuranga (a maior cidade da região), 67 km de Goiás Velho e
211 km de Goiânia. O acesso à área é feito a partir de estrada não pavimentada que liga o município
de Faina ao município de Lua Nova, ou a partir da GO-230 com acesso pela GO-164, no sentido de
Lua Nova (Fig. 2).
6
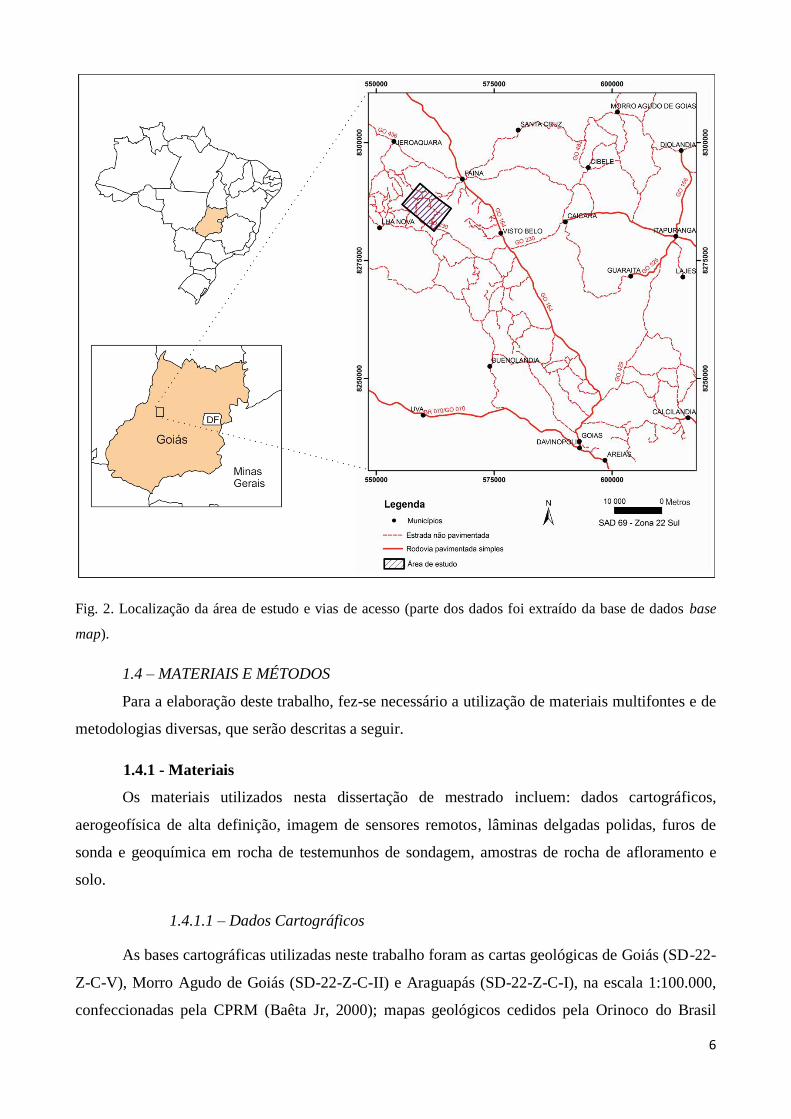
Fig. 2. Localização da área de estudo e vias de acesso (parte dos dados foi extraído da base de dados base
map).
1.4 – MATERIAIS E MÉTODOS
Para a elaboração deste trabalho, fez-se necessário a utilização de materiais multifontes e de
metodologias diversas, que serão descritas a seguir.
1.4.1 - Materiais
Os materiais utilizados nesta dissertação de mestrado incluem: dados cartográficos,
aerogeofísica de alta definição, imagem de sensores remotos, lâminas delgadas polidas, furos de
sonda e geoquímica em rocha de testemunhos de sondagem, amostras de rocha de afloramento e
solo.
1.4.1.1 – Dados Cartográficos
As bases cartográficas utilizadas neste trabalho foram as cartas geológicas de Goiás (SD-22-
Z-C-V), Morro Agudo de Goiás (SD-22-Z-C-II) e Araguapás (SD-22-Z-C-I), na escala 1:100.000,
confeccionadas pela CPRM (Baêta Jr, 2000); mapas geológicos cedidos pela Orinoco do Brasil
7
Mineração Ltda. na escala 1:25.000, abrangendo a área dos alvos na escala 1:10.000; mapa
geológico regional que recobre o Greenstone Belt de Faina e parte do Greenstone Belt Serra de
Santa Rita em escala 1:25.000 de Toledo et al. (2014). Os dados destes mapas foram agregados a
novos dados de campo para confecção de um mapa geológico integrado.
1.4.1.2 – Dados aerogeofísicos no Greenstone Belt de Faina
Os dados aeromagnetométricos e gamaespectrométricos de alta resolução, cedidos pela
Orinoco Brasil Mineração Ltda., foram executados pela empresa Lasa Prospecções S.A. entre os
dias 10 e 14 de agosto de 2013. A altura de voo foi fixada em 50 metros sobre o terreno, com linhas
de voo espaçadas de 200 metros, direção NS, e linhas de controle espaçadas de 1000 metros, com
direção EW, recobrindo uma área de 1.562,38 km². Para este levantamento foi utilizado um
helicóptero Esquilo AS-350BA. Uma área de detalhe foi recoberta com espaçamento de linhas de
voo de 100 m e linhas de controle de 500 m, sobre os alvos Cascavel e Tinteiro, atingindo uma área
de aproximadamente 48 km².
1.4.1.3 – Imagem de sensores remotos
Foi utilizada imagem de sensores remotos para o reconhecimento e interpretação de
estruturas geológicas de primeira, segunda e terceira ordens. Inicialmente a interpretação de
estruturas e domínios geológicos foi realizada sobre imagem do satélite Landsat 7, sensor Enhanced
Thematic Mapper Plus (ETM+), orbita/ponto 223/071, de 08/05/2010; obtida via download grátis
no site da USGS - United the States Geological Survey. Para a interpretação utilizou-se a
composição colorida RGB com as bandas 4, 5 e 3 respectivamente. Esta composição colorida foi
“fundida” com a banda pancromática (banda 8) via algoritmo de componentes principais
objetivando unir a melhor resolução espacial da banda 8 com as informações multiespectrais das
demais bandas. Foram interpretadas estruturas lineares de relevo e drenagem (lineamentos) da
imagem e a estas atribuídas significado geológico conforme informações de campo associadas com
a experiência do foto-intérprete.
1.4.1.4 – Testemunhos de sondagem
Foi disponibilizada uma base de 50 furos de sonda, com descrição geológica prévia e
resultados geoquímicos, pertencentes aos alvos Cascavel e Tinteiro. Destes, foram selecionados
dois furos do alvo Cascavel, por terem interceptados intervalos mineralizados, e cinco furos do alvo
Tinteiro. Alguns destes furos foram descritos e amostrados para este trabalho, o que permitiu a
realização de análise petrográfica e medidas de propriedades físicas de rochas, tais como
susceptibilidade magnética, utilizando o equipamento MPP-EM2S+ (Multi Parameter Probe),
8
desenvolvido pela INSTRUMENTATION GDD INC., e gamaespectrometria a partir do aparelho
BGO-SUPER-SPEC RS 230, disponibilizados pelo Instituto de Geociências da Universidade de
Brasília (UnB).
1.4.1.5 – Petrografia
Foram confeccionadas 93 seções polidas. Destas, 35 lâminas foram obtidas de amostras de
campo referentes à regional e aos alvos, enquanto 58 foram efetuadas de amostras de furo de
sondagem dos alvos Cascavel e Tinteiro. Algumas lâminas petrográficas foram analisadas no
Laboratório de Microssonda Eletrônica (JEOL JXA-8230 Electron Probe Microanalyzer) do
Instituto de Geociência (UnB), caracterizando a composição química dos minerais presentes nos
halos de alteração hidrotermal.
1.4.1.6 – Geoquímica
Foram utilizadas análises geoquímicas referentes a rochas de furos de sonda, amostras de
rocha de afloramento, de solo e sedimento de corrente realizadas e cedidas pelas empresas Troy
Exploração Mineral Ltda. e Orinoco do Brasil Mineração Ltda. Os tipos de análise compreendem
Screen Fire Assay e ICP- mass spectrometry (ICP-MS), realizados pelos laboratórios ALS
Minerals, Intertek, SGS Minerals Services e ACME Analytical Laboratories LTD.
As análises de ICP- mass spectrometry (ICP-MS) foram utilizadas para dosagem de óxidos e
vários elementos menores em amostras de 0,25g. Cada amostra preparada é diluída com ácidos
perclórico, nítrico, fluorídrico e clorídrico. O resíduo é complementado com ácido clorídrico diluído
e analisado por ICP- atomic emission spectroscopy (ICP-AES). Os resultados são revisados para
altas concentrações de bismuto, mercúrio, molibdênio, prata e tungstênio, que estejam em
conformidade. Cumprindo este critério, as amostras são então analisadas para ICP-MS.
Os elementos químicos processados neste trabalho são os que mostraram teores anômalos
em alguns furos de sonda e amostras de afloramento, tais como Au, Cu, Ag, Ni, Fe, Co e Ba, e
alguns elementos farejadores, objetivando delimitar zonas anômalas e determinar a correlação entre
tais elementos e feições geológico-estruturais.
1.4.2. – Métodos de Trabalho
Os métodos incluem processamento e interpretação de dados aerogeofísicos e geoquímicos,
mapeamento geológico, medidas das propriedades físicas de rochas, descrições petrográficas
(macro e microscópicas) e análises de microssonda eletrônica.
9
1.4.2.1 – Pesquisa Bibliográfica
Inicialmente, foi feito o levantamento bibliográfico das principais pesquisas realizadas nos
greenstone belts de Faina e Serra de santa Rita, e nos demais cinturões arqueanos do Terreno
Arqueano-Paleoproterozóico de Goiás, bem como artigos referentes á Faixa Brasília, e de outros
temas de crucial interesse para este trabalho.
1.4.2.2 – Processamento e interpretação dos dados aerogeofísicos de alta resolução
A partir de processamento dos dados aerogeofísicos de alta resolução da área total e da área
de detalhe, foram elaborados mapas aeromagnetométricos e gamaespectrométricos, utilizando-se o
software GEOSOFT Inc. OASIS Montaj. A técnica de interpolação utilizada com os dados
magnetométricos e gamaespectrométricos consiste no método bi-direcional, com o tamanho de
célula da malha de ¼ do espaçamento entre as linhas de voo. Os principais produtos derivados
utilizados neste trabalho consistem de amplitude do sinal analítico (ASA), derivada horizontal em x
(Dx), derivada horizontal em y (Dy), derivada vertical (Dz), amplitude do gradiente horizontal
calculado a partir de Dx e Dy (AGHT) e modelo digital de terreno (DTM) para os dados
magnetométricos, além das imagens dos canais de K(%), eU(ppm) e eTh(ppm), imagem ternária
(RGB) e fator Fk, para os dados gamaespectrométricos.
1.4.2.3 – Processamento de dados geoquímicos
Os dados geoquímicos referentes a amostras de solo e rocha foram “tratados” utilizando-se o
software ESRI ArcGIS Inc. (versão 9.3). Os elementos químicos processados neste trabalho são os
que mostraram teores anômalos em alguns furos de sonda e amostras de afloramento, tais como Au,
Cu, Ag, Ni, Fe, Co e Ba, e alguns elementos farejadores, objetivando delimitar zonas anômalas e
determinar a correlação entre tais elementos e feições geológico-estruturais.
1.4.2.4 – Coleta das propriedades físicas de rocha
Foram coletados dados de propriedades físicas de rocha ao longo dos furos de sonda CDP-
04 e CDP-09 e em amostras de rocha coletadas em campo referentes ao alvo Tinteiro, tais como
susceptibilidade magnética, condutividade elétrica e radiação gama. Para a aquisição dos dados de
susceptibilidade magnética e condutividade foi utilizado o equipamento MPP-EM2S+ (Multi
Parameter Probe), desenvolvido pela INSTRUMENTATION GDD INC., e gamaespectrometria a
partir do aparelho BGO-SUPER-SPEC RS 230, disponibilizados pelo Instituto de Geociências da
Universidade de Brasília (UnB). Este consiste em uma sonda ligada a uma unidade de leitura (PDA)
e possibilita a determinação da susceptibilidade magnética (10-3 SI) e valores de condutividade
10
elétrica relativa e absoluta (Mhos/m) em amostras. Os parâmetros do equipamento utilizado na
coleta de dados foram taxa de amostragem de 10 vezes por segundo e taxa apresentada a cada 0,5
segundo. A coleta dos radioelementos K, eTh e eU foi realizada utilizando-se o gamaespectrômetro
portátil de 256 canais BGO-SUPER-SPEC RS 230, fabricado pela Exploranium, que consiste de um
espectrômetro com detector para medições com germanato de bismuto (Bi4Ge3012 ou BGO).
1.4.2.5 – Mapeamento geológico
Durante o mês de fevereiro de 2014 foi realizado trabalho de campo para reconhecimento
regional. Posteriormente, foi realizada campanha de campo no mês de abril com objetivo de checar
os domínios geofísicos e obter mapa geológico e estrutural de parte do greenstone belt de Faina, na
escala 1:25.000. Em outubro de 2014 foi realizada nova campanha de campo com objetivo de
elaborar mapa geológico na escala 1:10.000 sobre a área dos alvos Cascavel e Tinteiro. Para a
confecção dos mapas geológicos utilizou-se o software ESRI ArcMap Inc. (versão 9.3).
1.4.2.6 – Estudos petrográficos
Para a descrição petrográfica foi utilizado o microscópio Olympus (modelo BX60FS –
Olympus Optical Co. Ltd.) no Laboratório de Microscopia da Universidade de Brasília (UnB).
Neste estudo utilizou-se de luz transmitida, na identificação de minerais translúcidos, e luz refletida,
para minerais opacos como sulfetos e óxidos. Esta etapa foi primordial na separação e
caracterização de halos de alteração hidrotermal.
1.4.2.7 – Microssonda Eletrônica
Lâminas das amostras dos furos CDP-04 e CDP-09 referentes à zona mineralizada, nos
intervalos proximais e distais da mineralização foram analisadas no Laboratório de Microssonda
Eletrônica (JEOL JXA-8230 Electron Probe Microanalyzer) do Instituto de Geociência (UnB),
objetivando caracterizar a composição química dos minerais presentes nos halos de alteração
associados ao evento hidrotermal que gerou a mineralização. Foram também analisadas lâminas
pertencentes a amostras de rocha obtidas em afloramento e furos de sondagem do alvo Tinteiro
referentes a brechas manganesíferas, brechas hematíticas e gossan. As análises de microssonda
foram realizadas em silicatos, carbonatos, sulfetos e óxidos.
1.4.2.8 – Integração de dados em um mapa prospectivo
A integração dos dados geofísicos, geoquímicos e geológicos fez-se utilizando a
metodologia lógica fuzzy com o intuito de gerar cenários prospectivos indicando regiões potenciais
nos alvos Cascavel e Tinteiro. Para isso, utilizou-se o software ESRI ArcSDM Inc. (versão 9.3).
11
1.5. - ESTRUTURA DA DISSERTAÇÃO
Esta dissertação de mestrado se divide em três partes. A primeira introduz o trabalho
apresentando a localização da área, objetivos do estudo e metodologia utilizada. A segunda parte é
composta pelo artigo: “PROSPECTIVITY ANALYSIS OF GOLD AND IRON OXIDE COPPER-
GOLD-(SILVER) MINERALIZATIONS USING HIGH RESOLUTION AIRBORNE
GEOPHYSICAL AND MULTI-SOURCE DATA FROM THE FAINA GREENSTONE BELT,
BRAZIL”. A terceira contém discussões e considerações finais.

12
II. ARTIGO
13
PROSPECTIVITY ANALYSIS OF GOLD AND IRON OXIDE COPPER-GOLD-(SILVER)
MINERALIZATIONS USING HIGH RESOLUTION AIRBORNE GEOPHYSICAL AND
MULTI-SOURCE DATA FROM THE FAINA GREENSTONE BELT, BRAZIL
Daniela S. de Camposa,*, Adalene M. Silva
a, Catarina L.B. Toledo
a, Marcelo J. de Carvalho
b,
Vinícius G. Rodriguesb, Kawinã Araujo
b
a Institute of Geosciences/University of Brasília. Campus Universitário Darcy Ribeiro S/n, Asa Norte,
Brasília – DF. Zip code: 70910-900, Brazil.
b Orinoco do Brasil Mineração Ltda. Rua Padre Arnaldo, n°32, Centro. Cidade de Goiás, GO. Zip
code:76600-000, Brazil.
* Corresponding author: e-mail, [email protected]
ABSTRACT
The Faina Greenstone Belt is located in the southern sector of the Goiás Archean block and has
been investigated since the 18th
century because of its gold deposits. Recent studies have revealed
the polymetallic potential of the belt, which is indicated by the anomalous levels of Ag, Cu, Fe and
Co in addition to Mn, Ba, Li, Ni, Cr and Zn. This study was developed based on a detailed analysis
of two selected target sites, Cascavel and Tinteiro, and multisource data, such as airborne
geophysics, geochemistry and geological information, were used to create a final prospectivity map
from the integration of all these data. The applied methodology used to obtain this map was fuzzy
logic.
The gold mineralization of Cascavel target is inserted in an orogenic system and occurs in two
overlapping quartz veins systems, called Mestre-Cascavel and Cuca, embedded in quartzite with an
average thickness of 50 cm and guidance N45°-60°W/25°SW with free coarse gold in grains 2-3
mm to 3 cm. The potentiality map created for this prospect generated four first-order favorable
areas for mineralization and new medium-favorability foci. The Tinteiro area, derived from studies
conducted by Orinoco do Brasil Mineração Ltd., shows polymetallic mineralization associated with
an iron oxide copper gold ore deposit (IOCG) system poterior to Cascavel target mineralization. Its
prospectivity map generated 19 new target sites with the potential for Au, Cu and Ag
mineralization, suggesting new directions for future prospecting programs.
Keywords: Faina Greenstone Belt, aeromagnetometry, gamma spectrometry, gold mineralization,
polymetallic mineralization, fuzzy logic.
14
1. Introduction
Globally, mining companies seek to utilize prospectives efficient methods that decrease costs
during mineral exploration stages. To achieve such goals, they must utilize techniques that
efficiently aggregate the data generated in the different stages of a given study by focusing on
models that have a greater likelihood of estimating deposits (Robert et al., 2007). Magnetic surveys
coupled with high-resolution gamma spectrometry data represent available technology in airborne
geophysics for the detection of relevant structures for mineral exploration, and they have been
shown to be efficient in the selection of follow-up target sites in tropical terranes (Costa e Silva et
al., 2012; Carrino et al., 2011).
The Faina Greenstone Belt is the target of this study, and along with the Pilar de Goiás,
Guarinos, Crixás and Serra de Santa Rita belts, it is part of the granite-greenstone terranes of the
Archean-Paleoproterozoic terrane of Goiás, which is located in the northern sector of the Brasília
belt (Pimentel et al., 2004, Jost et al., 2005, Jost et al. 2013). This region has been investigated
since the time of the Bandeirantes explorers (18th
and 19th
centuries) and shows the potential to host
gold (Au) mineralizations. Several companies have mined in the area, including the well-known
Metais de Goiás S.A. (METAGO), Western Mining Co., Amazônia Mineração and Troy Resources
Brazil.
The discovery of Sertão, a low-volume and high-concentration gold mine, had a positive impact
on the local economy and on the cities of Faina and Goiás. The mine was explored in the period
from 2000 to 2007 by Sertão Mineração Ltd., which ceased its activities after exploiting the
oxidized ore to a depth of 40 m. The company reported the extraction more than 250,000 ounces of
gold, with a mean content of 24.95 g/t. Since 2011, the area has been studied by Yamana Gold Inc.
and Orinoco do Brasil Mineração Ltd.
Orinoco do Brasil Mineração Ltd. is particularly relevant because of its investments in the
Faina Greenstone Belt, including an innovative exploration program for known target sites, such as
Cascavel, and the discovery of the new target sites of Tinteiro and Eliseu. The new target sites
indicate a potential for gold and polymetallic mineralizations in the region. Additionally, the
company resumed and intensified their studies in the Mina de Sertão site, and they plan to reopen it
as an underground mine (http://orinocogold.com/).
This study focused on detailing two selected target mineralization sites (Cascavel and Tinteiro)
of the Faina Greenstone Belt using a methodology based on the processing and interpretation of
aeromagnetic, gamma spectrometry and geochemical data. The data were then integrated into
15
mineral favorability models using fuzzy logic, and the methodological steps were derived from the
exploration program proposed by Pan and Harris (2000) and Harris and Sanborn-Barrie (2006) and
modified from Nykänen (2008) and Costa e Silva et al. (2012) (Fig. 1).
Fig. 1. Flowchart representing the main steps of the mineral exploration model. This diagram is based in the method
suggested by Pan and Harris (2000) and Harris and Sanborn-Barrie (2006) and adapted from Nykänen (2008) and Costa
e Silva et al. (2012).
16
Fuzzy logic has been shown to be an efficient tool in the search for new prospecting targets;
therefore, it has been widely used in mineral study projects of various types and scales (Nykänen et
al., 2008). Fuzzy logic is an approach based on expert knowledge and converts semantic
descriptions into numerical spatial models that predict the location of the object of interest (Raines
et al., 2010). The application of this method in the study area will show zones with similar
geophysical, geochemical and geological signatures, thus indicating potential gold or polymetallic
mineralization hosts. In recent decades, the application of this methodology has provided excellent
results in areas where limited information is available, and it has provided high-level prospecting
scenarios in established mining areas (Nykänen, 2008; Costa e Silva et al., 2012).
The main goal of this study is to generate mineral favorability models for the Faina Greenstone
Belt by using fuzzy logic to integrate geological, geochemical, coring, and high-resolution
geophysical data. The aim is to identify new exploration vectors for the study sites and generate
new prospecting scenarios for the Faina Greenstone Belt.
2. Geologic Context and Mineralization in the Faina Greenstone Belt
2.1. Regional Geology
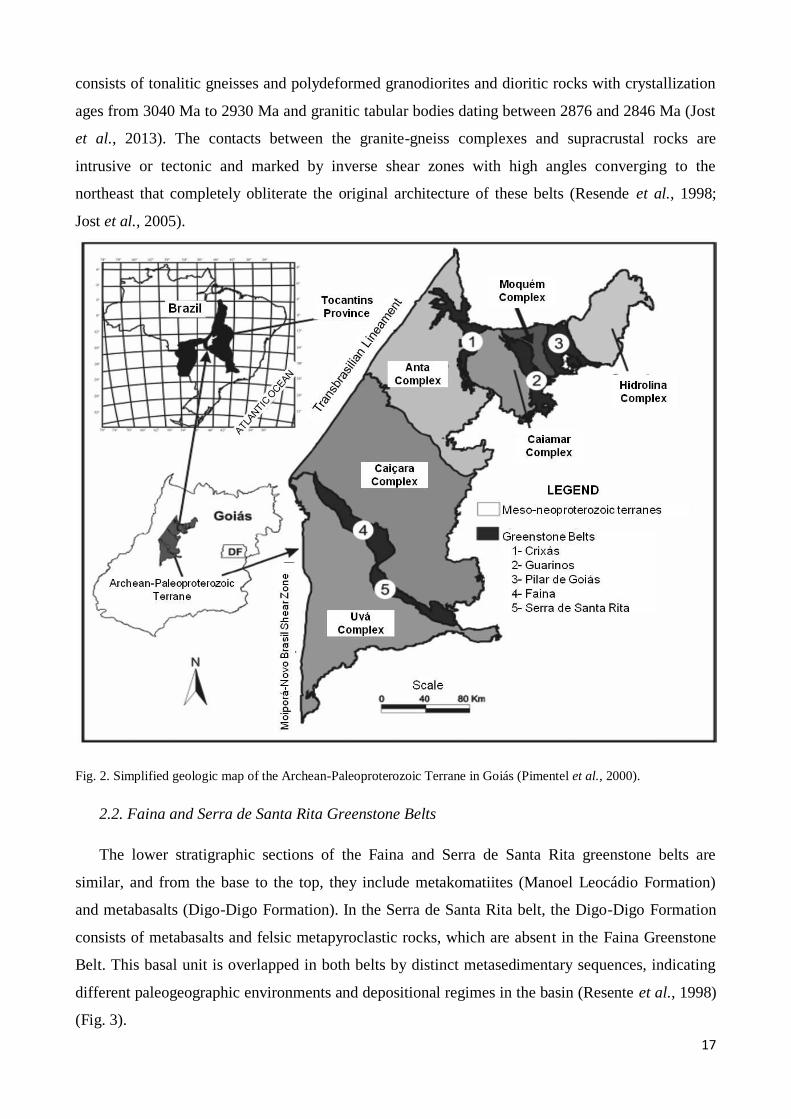
The study area is located within the Archean-Paleoproterozoic terrane of Goiás in the Brasília
fold belt within Tocantins Province (Pimentel et al., 2000, Queiroz et al., 2008, Jost et al., 2013)
(Fig. 2). The Archean-Paleoproterozoic terrane of Goiás extends over approximately 50,000 km2,
and approximately 30% of it consists of volcano-sedimentary sequences of the greenstone belt type
and 70% consists of granite-gneiss rocks, thus forming a typical granite-greenstone terrane (Fig. 2)
(Almeida et al., 1977; Danni et al., 1981; Jost and Oliveira, 1991; Kuyumjian and Jost, 2006). The
greenstone belts occur in five narrow belts, three of which (Crixás, Guarinos and Pilar de Goiás)
are located in the northern end and two of which (Serra de Santa Rita and Faina) are located in the
southern end. These belts host important gold deposits and are preserved in elongated synforms
isolated by the Archean granite-gneiss complexes Hidrolina, Moquém, Caiamar, Anta, Caiçara and
Uvá (Pimentel et al., 2000; Jost and Fortes, 2001) (Fig. 2).
The greenstone belts Serra de Santa Rita and Faina are located in the southern part of the
granite-greenstone terrane, and they are structured in a syncline that is NW-SE aligned, 150-km
long and 6 km wide (Kuyumjian and Jost, 2006; Baeta et al., 1998). These belts are separated by the
strike-slip Faina Fault, which is aligned N30E (Resende et al., 1998), and they are located between
two granite-gneiss complexes with distinct geologic evolution. The Caiçara complex to the north
consists of 3.1 Ga old tonalitic gneisses and intrusive granodiorites, monzogranites and charnockite
series, with ages between 2838 and 2818 Ma (Beghelli Junior, 2012). The Uvá complex to the south
17
consists of tonalitic gneisses and polydeformed granodiorites and dioritic rocks with crystallization
ages from 3040 Ma to 2930 Ma and granitic tabular bodies dating between 2876 and 2846 Ma (Jost
et al., 2013). The contacts between the granite-gneiss complexes and supracrustal rocks are
intrusive or tectonic and marked by inverse shear zones with high angles converging to the
northeast that completely obliterate the original architecture of these belts (Resende et al., 1998;
Jost et al., 2005).
Fig. 2. Simplified geologic map of the Archean-Paleoproterozoic Terrane in Goiás (Pimentel et al., 2000).
2.2. Faina and Serra de Santa Rita Greenstone Belts
The lower stratigraphic sections of the Faina and Serra de Santa Rita greenstone belts are
similar, and from the base to the top, they include metakomatiites (Manoel Leocádio Formation)
and metabasalts (Digo-Digo Formation). In the Serra de Santa Rita belt, the Digo-Digo Formation
consists of metabasalts and felsic metapyroclastic rocks, which are absent in the Faina Greenstone
Belt. This basal unit is overlapped in both belts by distinct metasedimentary sequences, indicating
different paleogeographic environments and depositional regimes in the basin (Resente et al., 1998)
(Fig. 3).
18
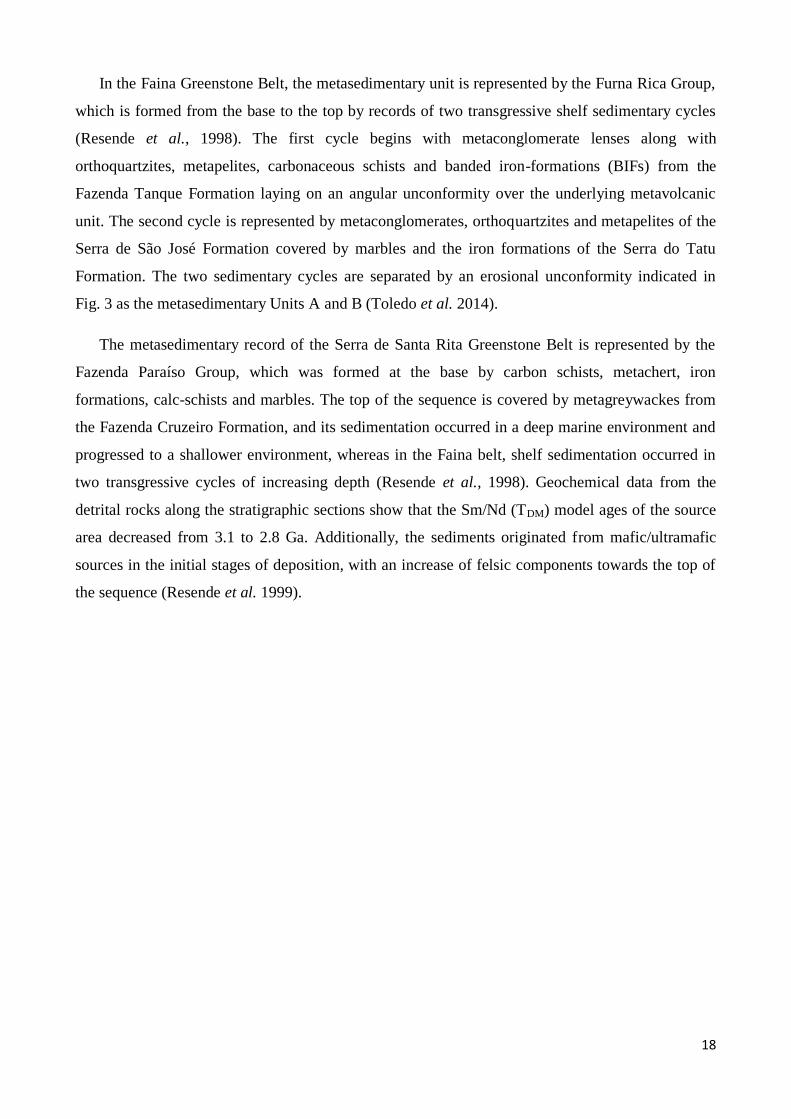
In the Faina Greenstone Belt, the metasedimentary unit is represented by the Furna Rica Group,
which is formed from the base to the top by records of two transgressive shelf sedimentary cycles
(Resende et al., 1998). The first cycle begins with metaconglomerate lenses along with
orthoquartzites, metapelites, carbonaceous schists and banded iron-formations (BIFs) from the
Fazenda Tanque Formation laying on an angular unconformity over the underlying metavolcanic
unit. The second cycle is represented by metaconglomerates, orthoquartzites and metapelites of the
Serra de São José Formation covered by marbles and the iron formations of the Serra do Tatu
Formation. The two sedimentary cycles are separated by an erosional unconformity indicated in
Fig. 3 as the metasedimentary Units A and B (Toledo et al. 2014).
The metasedimentary record of the Serra de Santa Rita Greenstone Belt is represented by the
Fazenda Paraíso Group, which was formed at the base by carbon schists, metachert, iron
formations, calc-schists and marbles. The top of the sequence is covered by metagreywackes from
the Fazenda Cruzeiro Formation, and its sedimentation occurred in a deep marine environment and
progressed to a shallower environment, whereas in the Faina belt, shelf sedimentation occurred in
two transgressive cycles of increasing depth (Resende et al., 1998). Geochemical data from the
detrital rocks along the stratigraphic sections show that the Sm/Nd (TDM) model ages of the source
area decreased from 3.1 to 2.8 Ga. Additionally, the sediments originated from mafic/ultramafic
sources in the initial stages of deposition, with an increase of felsic components towards the top of
the sequence (Resende et al. 1999).
19
Fig. 3. Simplified regional geologic map of the Faina Greenstone Belt produced by Toledo et al. (2014). The black polygon indicates the study area mapped at the 1:10,000 scale,
which is shown in Fig. 8.
20
2.3. Mineralization
In the study area, the two gold prospects Sertão and Cascavel stand out because they both have
significant potential for continuous resource exploration and definition projects. The Sertão mine
and the Cascavel prospect occur in the same structural context. The gold mineralization is of the
lode type, and quartz veins occur that are structurally controlled by thrust faults and embedded in
chlorite-quartz-schists of the second sedimentary cycle (Sertão) and feldspathic quartzites of the
first sedimentary cycle (Cascavel). According to the data provided by Orinoco do Brasil Mineração
Ltd., mineralized quartz veins extend along the direction and dip of the shear zone and appear to
occur in structures of the second and third order as well. The locations of the Sertão mine and other
study sites are indicated in Fig. 4.
The gold mineralizations inserted in the Cascavel deposit at the Cascavel target site are
characterized by the presence of coarse free gold with grain sizes varying from 2-3 mm to 3 cm
(Jost et al., 2014), and they are found in association with quartz veins with thicknesses of 1 cm and
a pinkish coloration arranged in continuity with the tectonic foliation of the host rocks. The quartz
veins are associated with shear zones that intercept the feldspathic quartzites occurring at the base
of the first sedimentary cycle (metasedimentary sequence A). Lenses and dolomite layers hosting
mineralizations rich in Cu, Ag and W also occur at this site.
The Tinteiro prospect represents a recent discovery by Orinoco do Brasil Mineração Ltd. and is
located in the metasedimentary sequence of the first depositional cycle, and it alternates with
quartzites, metapelites and metacherts. The analysis of the rock outcrops, hand samples and corings
suggest a different context from that of the previous sites. Chloritoids of hydrothermal origin are
observed, and they include a sericitic alteration halo and hematite breccias associated with
metacherts. These rocks are of hydrothermal origin and occur in association with multiple faults in
NE, NW and E-W directions that intersect the rocks in the Faina Greenstone Belt. The
hydrothermal alteration zones are related to the polymetallic mineralization of gold and copper in
high concentrations as well as that of cobalt, barium, silver, uranium and iron. According to studies
undertaken by Orinoco do Brasil Mineração Ltd., the accumulation of these metals occurred after
the orogenic gold mineralization in an iron oxide copper gold ore deposit (IOCG) system.
21
Fig. 4. RGB (453) image obtained from the Landsat 7 ETM+ sensor partially covering the Faina Greenstone Belt,
Sertão Mining locations and the target sites Cascavel, North Tinteiro, Central Tinteiro, Southeast Tinteiro and South
Tinteiro (yellow polygons).
22
3. Airborne Geophysical Data and Other Multi-Source Data
The Faina Greenstone Belt was covered by aeromagnetic and high-resolution gamma
spectrometry surveys covering a total area of 1,562.38 km² and with a flight altitude 50 m above the
terrain and flight lines spaced 200 m apart in a N-S direction and control lines spaced 1000 m apart
in an E-W direction. A detailed area was covered by flight and control lines spaced 100 m and 500
m apart, respectively, over the Cascavel and Tinteiro sites. The aeromagnetic and gamma
spectrometry data grids were created using the software Oasis Montaj (Geosoft Inc.). The gamma
spectrometry data were interpolated using a bi-directional method with the grid cell size set to 25%
of the distance between flight lines.
Images from the Landsat 7 Enhanced Thematic Mapper Plus (ETM+) sensor was used to
interpret the airborne geophysical data to identify the main geologic features, with the RGB color
composite bands 4, 5 and 3, respectively, selected and then fused with band 8 through a principal
component algorithm. The image from orbit/spot 223/071 was made available by Orinoco do Brasil
Mineração Ltd.
In this study, a geologic map that covers the Faina Greenstone Belt and part of the Serra de
Santa Rita Greenstone Belt at a 1:25,000 scale was used (Toledo et al. 2014) along with geologic
data obtained from two field trips, and these data were able to refine the regional geologic map
within 1:25,000 scale inside the study area. Subsequently, the geologic mapping was performed at a
1:10,000 scale for the Cascavel and Tinteiro target sites. For the final integration of the results,
geologic data provided by Orinoco do Brasil Mineração Ltd. were integrated. The geologic maps
were created using ArcMap software (version 9.3) (ESRI).
To characterize the physical properties and mineralogical and chemical behavior of the
mineralized zones of the region, 7 of the 50 probing holes that intercepted the mineralized bodies of
the Cascavel and Tinteiro target sites, which were made available by Orinoco do Brasil Mineração
Ltd., were selected.
Petrographic studies of the transmitted and reflected light were undertaken using 70 thin
polished sections and an Olympus BX60FS microscope (Olympus Optical Co. Ltd.), which was
made available by the Laboratory of Microscopy of the University of Brasília (UnB). These
analyses aimed to identify and characterize the hydrothermal alterations and mineralization zones.
Chemical mineral analyses were conducted in the Electronic Microprobe Laboratory of the
Instituto de Geociências (UnB) using the superprobe model JEOL JXA-8230. The voltages used
were 15 kV and 20 kV. Specific minerals were analyzed when required to assist in the petrographic
23
descriptions and in the mineralogical characterizations of the hydrothermal alteration zones of both
mineralization systems, which have been previously described.
During field work, the physical property data of the host rocks in the mineralized and non-
mineralized zones were collected, including the magnetic susceptibility, electrical conductivity, and
gamma radiation. The magnetic susceptibility and conductivity data were obtained using the MPP-
EM2S+ (Multi-Parameter Probe) instrument (Instrumentation GDD, INC.). This instrument consists
of a gun-shaped probe connected to a reading unit (PDA – personal digital assistant) that measured
magnetic susceptibility (10-3
SI) and relative and absolute electrical conductivity values (Mho/m).
The parameter settings of the equipment used for the data collection included the following:
sampling rate at 10 times per second and display rate at every 0.5 seconds. The radioelements K,
eTh and eU were measured every 5 minutes per sample using the 256-channel portable gamma
spectrometer RS 230 BGO Super-SPEC (Exploranium), which is a spectrometer with a Bismuth
Germanate oxide (Bi4Ge3012 or BGO).
The geochemical analysis used data on the major, minor and trace elements of the mineralized
zones and its surroundings, which were collected in samples obtained from boreholes, rocks, soil,
and stream sediment provided by the companies Troy Exploração Mineral Ltd. and Orinoco do
Brasil Mineração Ltd. The analyses included a screen fire assay and inductively coupled plasma
mass spectrometry (ICP-MS), which were conducted by the laboratories ALS Minerals, Intertek,
SGS Minerals Services and ACME Analytical Laboratories Ltd. The geochemical data for the soil
and rock samples were processed using ArcGIS (version 9.3) (ESRI). The chemical elements
included in this study were those that exhibited anomalous concentrations in certain boreholes and
field samples and included AU, Cu, Ag, Ni, Fe, Co and Ba as well as certain pathfinder elements,
and these anomalous elements were used to identify anomalous zones and determine the correlation
between these elements and the previously mapped geological-structural features.
The integration of all data was conducted using ArcSDM software (version 9.3) (ESRI), with
the objective of creating the final exploration map using fuzzy logic tecnhique.
4. Data Processing and Interpretation
4.1. Geophysical Data
The high-resolution airborne geophysical data partially covering the Faina Greenstone Belt were
processed following state-of-the-art pre-processing and processing methods (interpolation and
microleveling), and the maps were transformed in two steps. After the grid interpolation of the
anomalous magnetic field, the K (%), eTh (ppm), eU (ppm) channels, and the total count (µR/h),
24
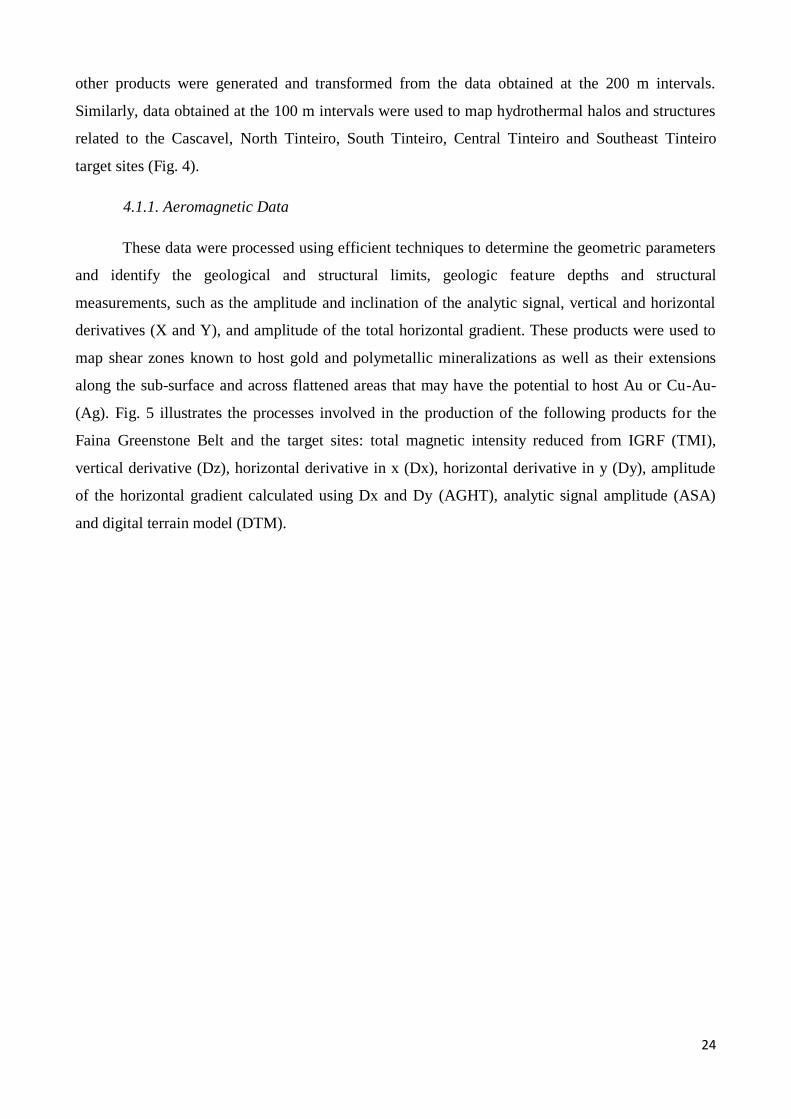
other products were generated and transformed from the data obtained at the 200 m intervals.
Similarly, data obtained at the 100 m intervals were used to map hydrothermal halos and structures
related to the Cascavel, North Tinteiro, South Tinteiro, Central Tinteiro and Southeast Tinteiro
target sites (Fig. 4).
4.1.1. Aeromagnetic Data
These data were processed using efficient techniques to determine the geometric parameters
and identify the geological and structural limits, geologic feature depths and structural
measurements, such as the amplitude and inclination of the analytic signal, vertical and horizontal
derivatives (X and Y), and amplitude of the total horizontal gradient. These products were used to
map shear zones known to host gold and polymetallic mineralizations as well as their extensions
along the sub-surface and across flattened areas that may have the potential to host Au or Cu-Au-
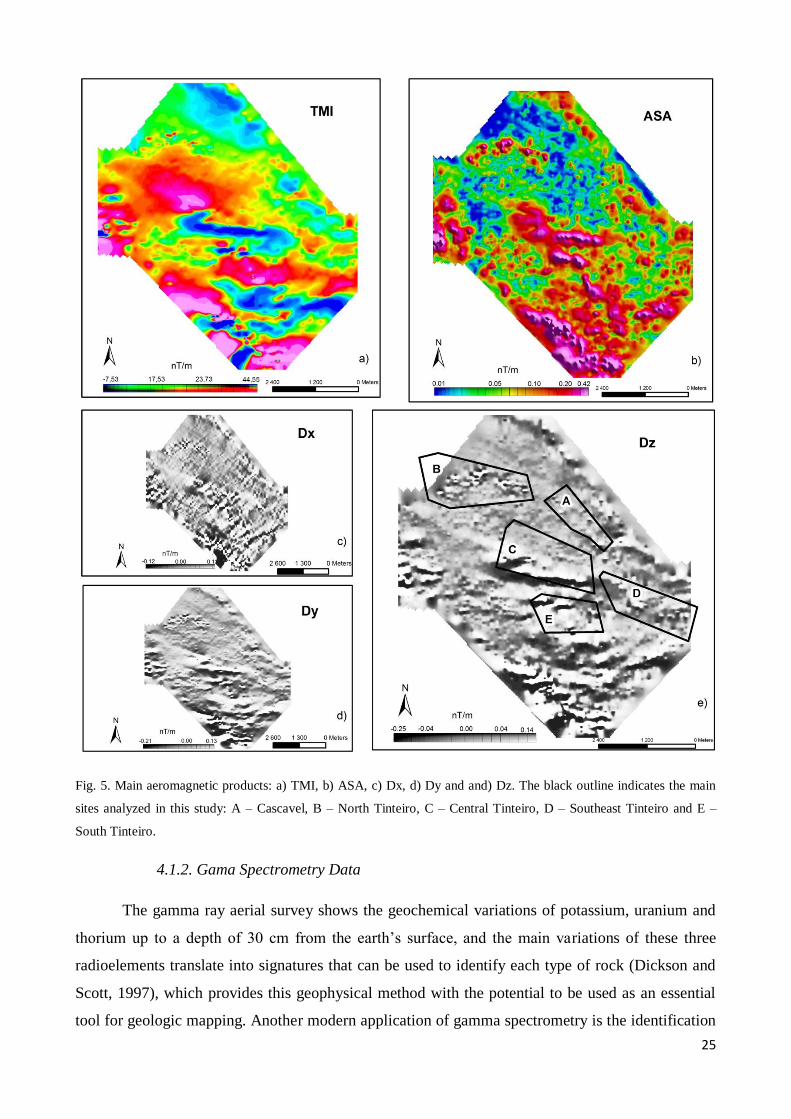
(Ag). Fig. 5 illustrates the processes involved in the production of the following products for the
Faina Greenstone Belt and the target sites: total magnetic intensity reduced from IGRF (TMI),
vertical derivative (Dz), horizontal derivative in x (Dx), horizontal derivative in y (Dy), amplitude
of the horizontal gradient calculated using Dx and Dy (AGHT), analytic signal amplitude (ASA)
and digital terrain model (DTM).
25
Fig. 5. Main aeromagnetic products: a) TMI, b) ASA, c) Dx, d) Dy and and) Dz. The black outline indicates the main
sites analyzed in this study: A – Cascavel, B – North Tinteiro, C – Central Tinteiro, D – Southeast Tinteiro and E –
South Tinteiro.
4.1.2. Gama Spectrometry Data
The gamma ray aerial survey shows the geochemical variations of potassium, uranium and
thorium up to a depth of 30 cm from the earth’s surface, and the main variations of these three
radioelements translate into signatures that can be used to identify each type of rock (Dickson and
Scott, 1997), which provides this geophysical method with the potential to be used as an essential
tool for geologic mapping. Another modern application of gamma spectrometry is the identification
26
of hydrothermal alteration areas and their relationships with the mineralizing processes of different
geologic environments.
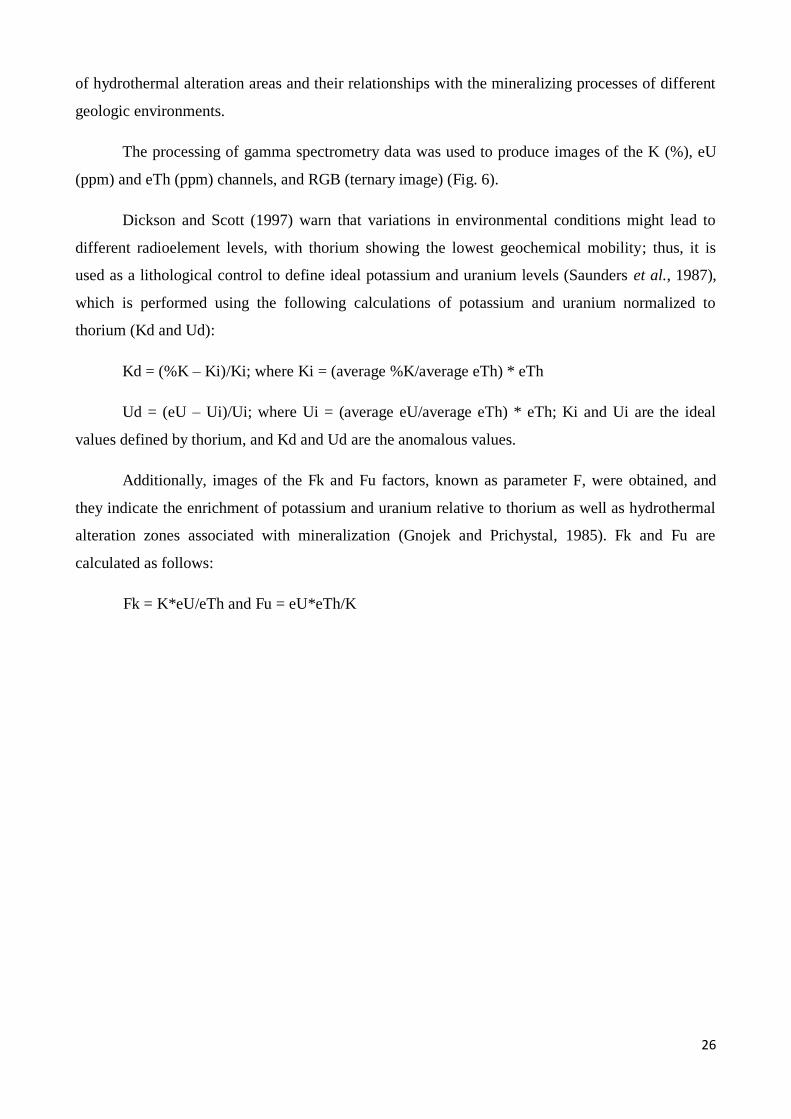
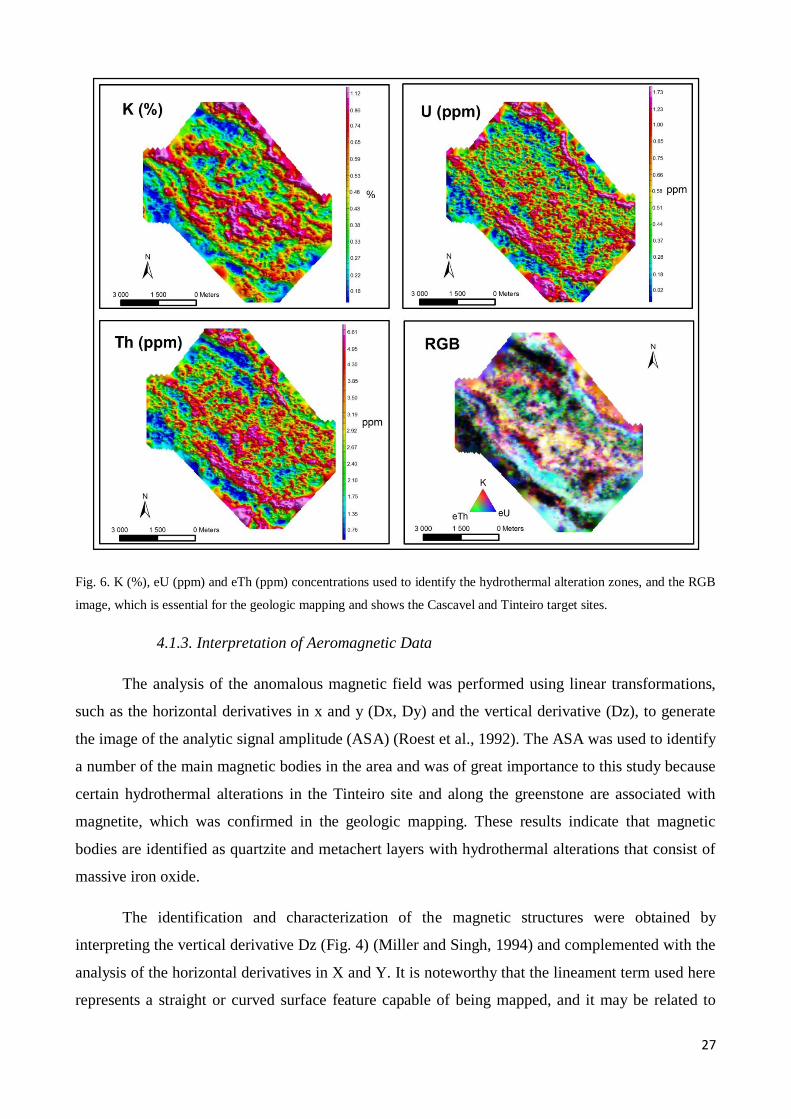
The processing of gamma spectrometry data was used to produce images of the K (%), eU
(ppm) and eTh (ppm) channels, and RGB (ternary image) (Fig. 6).
Dickson and Scott (1997) warn that variations in environmental conditions might lead to
different radioelement levels, with thorium showing the lowest geochemical mobility; thus, it is
used as a lithological control to define ideal potassium and uranium levels (Saunders et al., 1987),
which is performed using the following calculations of potassium and uranium normalized to
thorium (Kd and Ud):
Kd = (%K – Ki)/Ki; where Ki = (average %K/average eTh) * eTh
Ud = (eU – Ui)/Ui; where Ui = (average eU/average eTh) * eTh; Ki and Ui are the ideal
values defined by thorium, and Kd and Ud are the anomalous values.
Additionally, images of the Fk and Fu factors, known as parameter F, were obtained, and
they indicate the enrichment of potassium and uranium relative to thorium as well as hydrothermal
alteration zones associated with mineralization (Gnojek and Prichystal, 1985). Fk and Fu are
calculated as follows:
Fk = K*eU/eTh and Fu = eU*eTh/K
27
Fig. 6. K (%), eU (ppm) and eTh (ppm) concentrations used to identify the hydrothermal alteration zones, and the RGB
image, which is essential for the geologic mapping and shows the Cascavel and Tinteiro target sites.
4.1.3. Interpretation of Aeromagnetic Data
The analysis of the anomalous magnetic field was performed using linear transformations,
such as the horizontal derivatives in x and y (Dx, Dy) and the vertical derivative (Dz), to generate
the image of the analytic signal amplitude (ASA) (Roest et al., 1992). The ASA was used to identify
a number of the main magnetic bodies in the area and was of great importance to this study because
certain hydrothermal alterations in the Tinteiro site and along the greenstone are associated with
magnetite, which was confirmed in the geologic mapping. These results indicate that magnetic
bodies are identified as quartzite and metachert layers with hydrothermal alterations that consist of
massive iron oxide.
The identification and characterization of the magnetic structures were obtained by
interpreting the vertical derivative Dz (Fig. 4) (Miller and Singh, 1994) and complemented with the
analysis of the horizontal derivatives in X and Y. It is noteworthy that the lineament term used here
represents a straight or curved surface feature capable of being mapped, and it may be related to
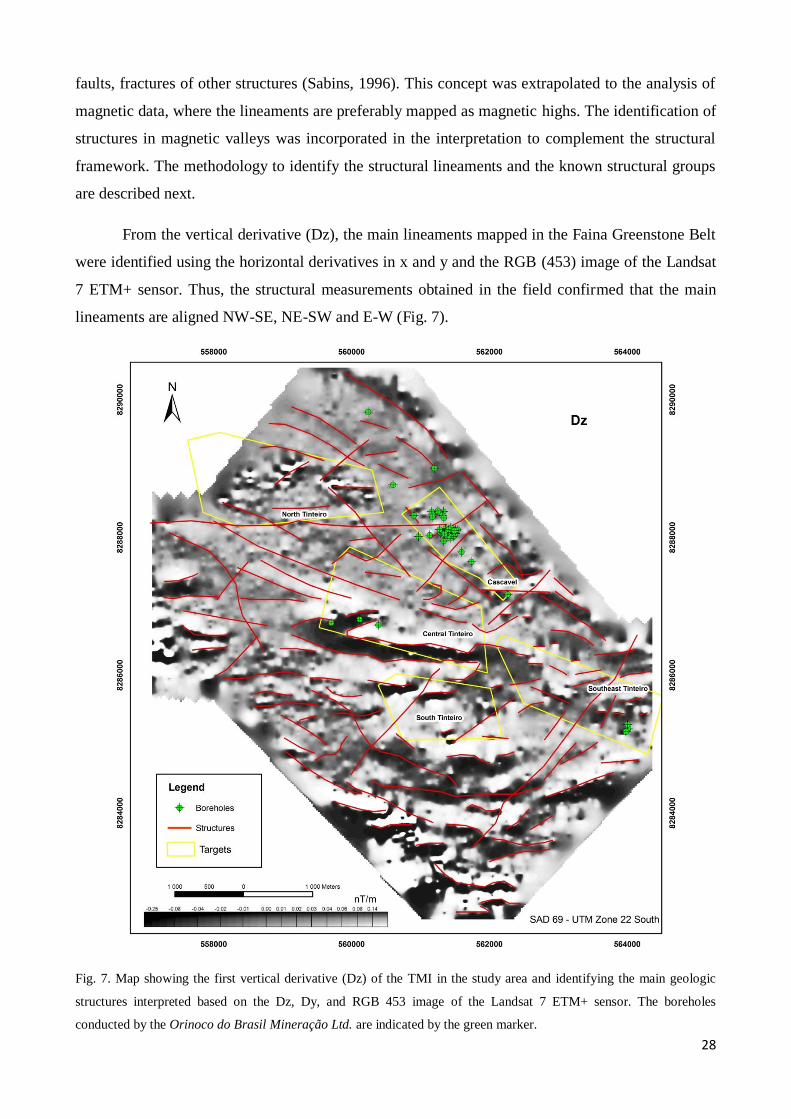
28
faults, fractures of other structures (Sabins, 1996). This concept was extrapolated to the analysis of
magnetic data, where the lineaments are preferably mapped as magnetic highs. The identification of
structures in magnetic valleys was incorporated in the interpretation to complement the structural
framework. The methodology to identify the structural lineaments and the known structural groups
are described next.
From the vertical derivative (Dz), the main lineaments mapped in the Faina Greenstone Belt
were identified using the horizontal derivatives in x and y and the RGB (453) image of the Landsat
7 ETM+ sensor. Thus, the structural measurements obtained in the field confirmed that the main
lineaments are aligned NW-SE, NE-SW and E-W (Fig. 7).
Fig. 7. Map showing the first vertical derivative (Dz) of the TMI in the study area and identifying the main geologic
structures interpreted based on the Dz, Dy, and RGB 453 image of the Landsat 7 ETM+ sensor. The boreholes
conducted by the Orinoco do Brasil Mineração Ltd. are indicated by the green marker.
29
4.1.4. Interpretation of Gamma Spectrometry Data
The mineralizations hosted in the Faina belt are associated with hydrothermal processes,
such as sericitization, chloritization, silicification, carbonatation and sulphitation. The occurrence of
minerals generated by potassic alterations, such as sericite, biotite and potassium feldspar, warrants
the use of gamma spectrometry as a key tool in this study.
The ternary image (RGB) obtained by processing the K (%), eU (ppm) and eTh (ppm) data
(Fig. 6) was used to differentiate the lithological domains in the area, which helped to characterize
the different lithotypes during the regional geologic mapping and separate certain hydrothermal
halos.
The domains represented by low levels of the three radioelements are represented in the
ternary map in dark colors (black to dark blue) and indicate mafic-ultramafic rocks at the base of
the stratigraphic sequence. These lithotypes are found in the W-SW and NE portions of the area.
Within the metasedimentary sequence, a domain with low levels of K (%), eTh and eU is observed,
and it was formed by dolomites and quartzites rich in massive iron oxide.
Certain domains identified in the map were easily correlated with the lithology observed in
the field; however, in certain areas, this correlation was not effective and required additional
attention and caution in the data interpretation.
4.2. Geologic Data
Geologic mapping at the scale 1:10,000 (Fig. 8) was conducted for the Cascavel and Tinteiro
target sites. The data show that they are hosted in rocks belonging to the first depositional cycle
proposed by Resende et al. (1998). The geologic units in these areas are ultramafic schists of the
volcanic sequence and rocks of the metasedimentary sequence A (Toledo et al., 2014). The volcanic
sequence is characterized by a small talc-schist lens within a package of metacherts in the
southeastern sector of the North Tinteiro site. The metasedimentary sequence A is represented in
the area by quartzites, feldspathic quartzites, metapelites, metarhythmites, metacherts, dolomitic
marbles and carbonaceous schists.
The mapping was also used to verify previously identified structures from airborne geophysical
images, such as faults with a NE-SW direction parallel to the Faina fault and large lineaments
concordant with the greenstone syncline at a NW-SE attitude.
30
4.3. Petrography and Electronic Microprobe Analysis
The petrographic description and the electronic microprobe analysis were crucial in delineating
the hydrothermal alteration zones in each deposit and improving our understanding of the gold and
polymetallic mineralizations.
4.4. Drill Cores
The description of the borehole cores was used to identify the relationship between
mineralization and the host rock as well as the rock's stratigraphic location. The hydrothermal
alteration zones were identified in each borehole, and this information was applied during field
work. For this purpose, two boreholes from the Cascavel site were selected (CDP-04 and CDP-09)
and five boreholes from the Tinteiro site were selected (TIN-1A, TIN-2, TIN-3, TIN-4 and TIN-6),
and they all showed positive results for gold and other elements. These boreholes were
systematically sampled to collect examples from each different lithotype, which were then used to
produce polished thin sections.
4.5. Geochemical Data
The geochemical data obtained from the rock samples were used to create geochemical
maps for each element that indicated their distribution at the site and their correlation with other
elements. Certain associations between elements were corroborated during the geochemical analysis
of the borehole cores.
A number of soil samples were analyzed only for gold; therefore, it was difficult to use these
data to create element maps. However, the geochemistry of the soil was useful in the validation of
zones with high mineral favorability obtained according to the different prospecting scenarios.
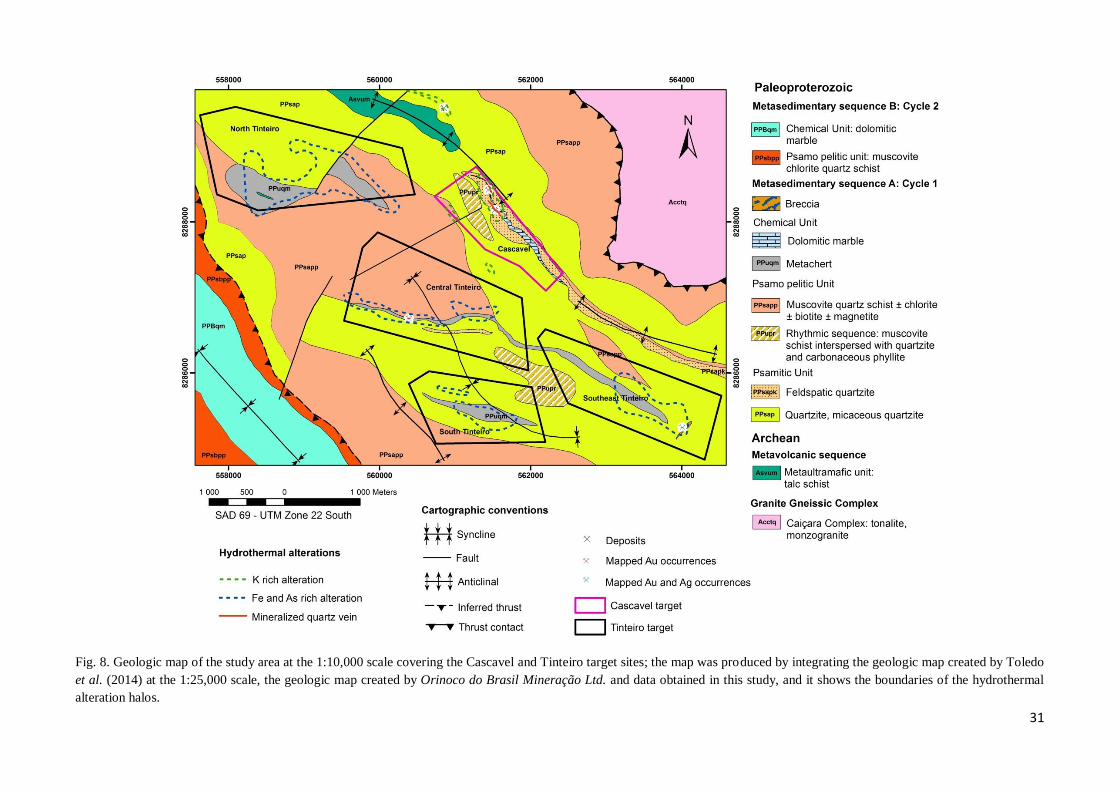
31
Fig. 8. Geologic map of the study area at the 1:10,000 scale covering the Cascavel and Tinteiro target sites; the map was produced by integrating the geologic map created by Toledo
et al. (2014) at the 1:25,000 scale, the geologic map created by Orinoco do Brasil Mineração Ltd. and data obtained in this study, and it shows the boundaries of the hydrothermal
alteration halos.
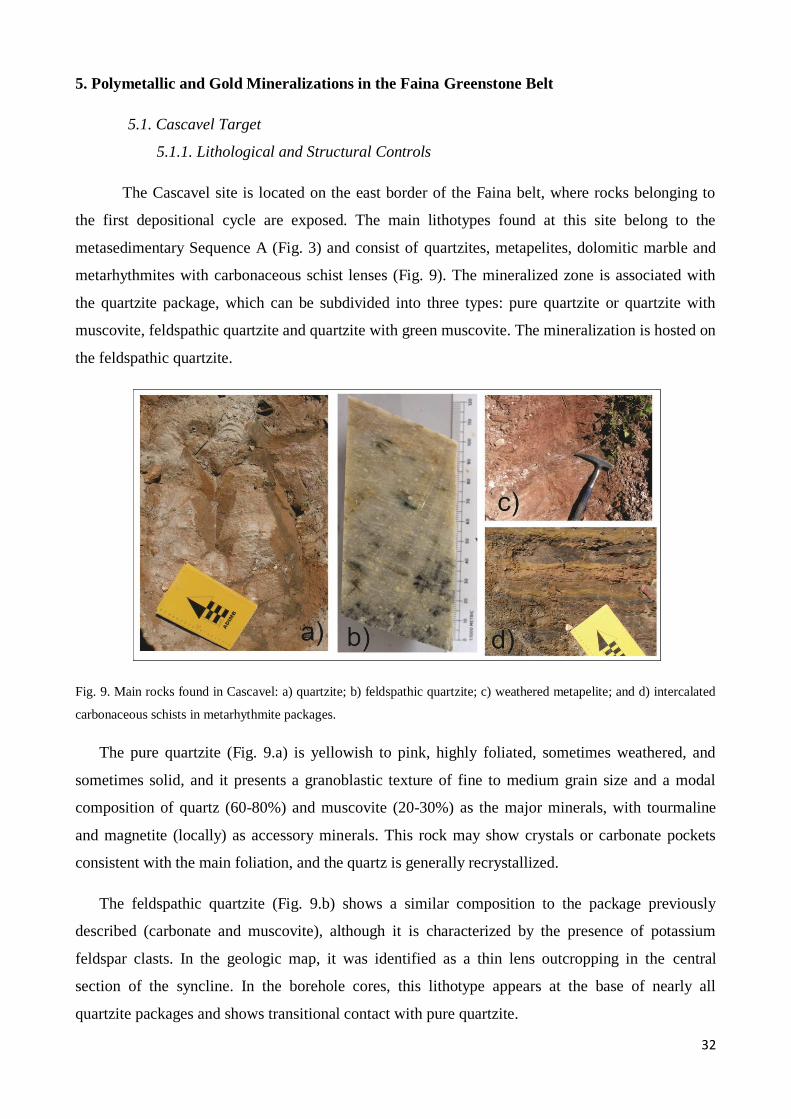
32
5. Polymetallic and Gold Mineralizations in the Faina Greenstone Belt
5.1. Cascavel Target
5.1.1. Lithological and Structural Controls
The Cascavel site is located on the east border of the Faina belt, where rocks belonging to
the first depositional cycle are exposed. The main lithotypes found at this site belong to the
metasedimentary Sequence A (Fig. 3) and consist of quartzites, metapelites, dolomitic marble and
metarhythmites with carbonaceous schist lenses (Fig. 9). The mineralized zone is associated with
the quartzite package, which can be subdivided into three types: pure quartzite or quartzite with
muscovite, feldspathic quartzite and quartzite with green muscovite. The mineralization is hosted on
the feldspathic quartzite.
Fig. 9. Main rocks found in Cascavel: a) quartzite; b) feldspathic quartzite; c) weathered metapelite; and d) intercalated
carbonaceous schists in metarhythmite packages.
The pure quartzite (Fig. 9.a) is yellowish to pink, highly foliated, sometimes weathered, and
sometimes solid, and it presents a granoblastic texture of fine to medium grain size and a modal
composition of quartz (60-80%) and muscovite (20-30%) as the major minerals, with tourmaline
and magnetite (locally) as accessory minerals. This rock may show crystals or carbonate pockets
consistent with the main foliation, and the quartz is generally recrystallized.
The feldspathic quartzite (Fig. 9.b) shows a similar composition to the package previously
described (carbonate and muscovite), although it is characterized by the presence of potassium
feldspar clasts. In the geologic map, it was identified as a thin lens outcropping in the central
section of the syncline. In the borehole cores, this lithotype appears at the base of nearly all
quartzite packages and shows transitional contact with pure quartzite.
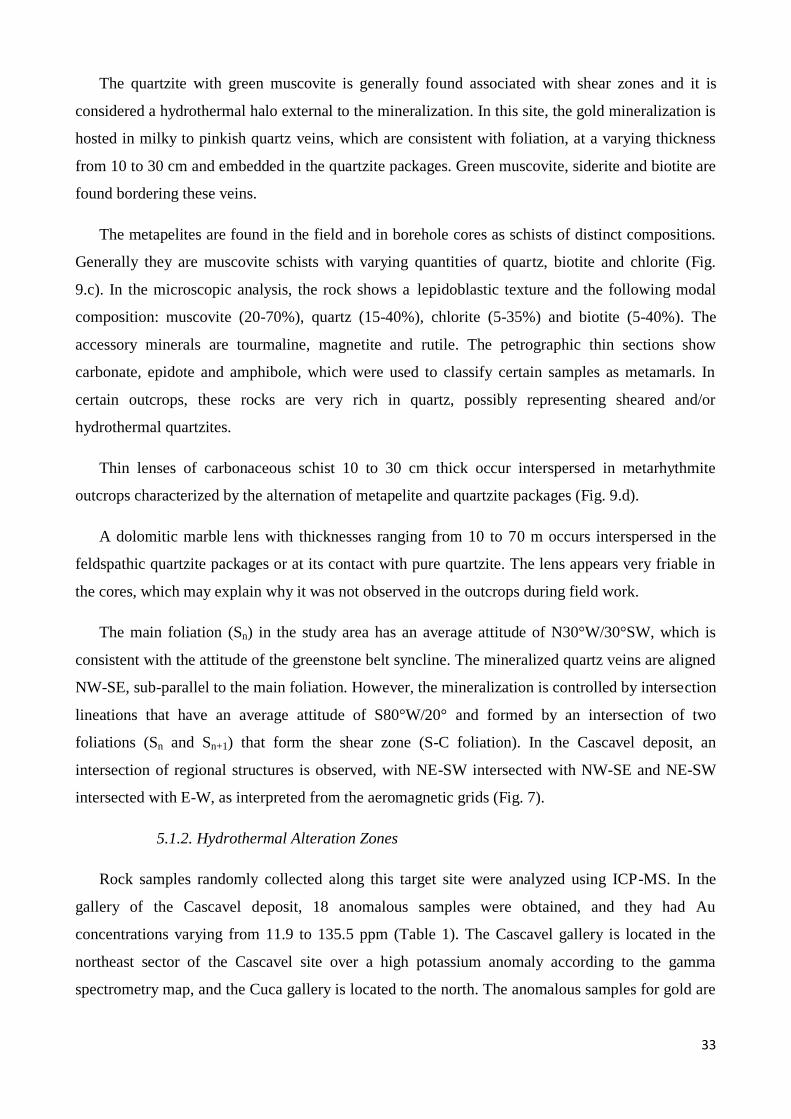
33
The quartzite with green muscovite is generally found associated with shear zones and it is
considered a hydrothermal halo external to the mineralization. In this site, the gold mineralization is
hosted in milky to pinkish quartz veins, which are consistent with foliation, at a varying thickness
from 10 to 30 cm and embedded in the quartzite packages. Green muscovite, siderite and biotite are
found bordering these veins.
The metapelites are found in the field and in borehole cores as schists of distinct compositions.
Generally they are muscovite schists with varying quantities of quartz, biotite and chlorite (Fig.
9.c). In the microscopic analysis, the rock shows a lepidoblastic texture and the following modal
composition: muscovite (20-70%), quartz (15-40%), chlorite (5-35%) and biotite (5-40%). The
accessory minerals are tourmaline, magnetite and rutile. The petrographic thin sections show
carbonate, epidote and amphibole, which were used to classify certain samples as metamarls. In
certain outcrops, these rocks are very rich in quartz, possibly representing sheared and/or
hydrothermal quartzites.
Thin lenses of carbonaceous schist 10 to 30 cm thick occur interspersed in metarhythmite
outcrops characterized by the alternation of metapelite and quartzite packages (Fig. 9.d).
A dolomitic marble lens with thicknesses ranging from 10 to 70 m occurs interspersed in the
feldspathic quartzite packages or at its contact with pure quartzite. The lens appears very friable in
the cores, which may explain why it was not observed in the outcrops during field work.
The main foliation (Sn) in the study area has an average attitude of N30°W/30°SW, which is
consistent with the attitude of the greenstone belt syncline. The mineralized quartz veins are aligned
NW-SE, sub-parallel to the main foliation. However, the mineralization is controlled by intersection
lineations that have an average attitude of S80°W/20° and formed by an intersection of two
foliations (Sn and Sn+1) that form the shear zone (S-C foliation). In the Cascavel deposit, an
intersection of regional structures is observed, with NE-SW intersected with NW-SE and NE-SW
intersected with E-W, as interpreted from the aeromagnetic grids (Fig. 7).
5.1.2. Hydrothermal Alteration Zones
Rock samples randomly collected along this target site were analyzed using ICP-MS. In the
gallery of the Cascavel deposit, 18 anomalous samples were obtained, and they had Au
concentrations varying from 11.9 to 135.5 ppm (Table 1). The Cascavel gallery is located in the
northeast sector of the Cascavel site over a high potassium anomaly according to the gamma
spectrometry map, and the Cuca gallery is located to the north. The anomalous samples for gold are
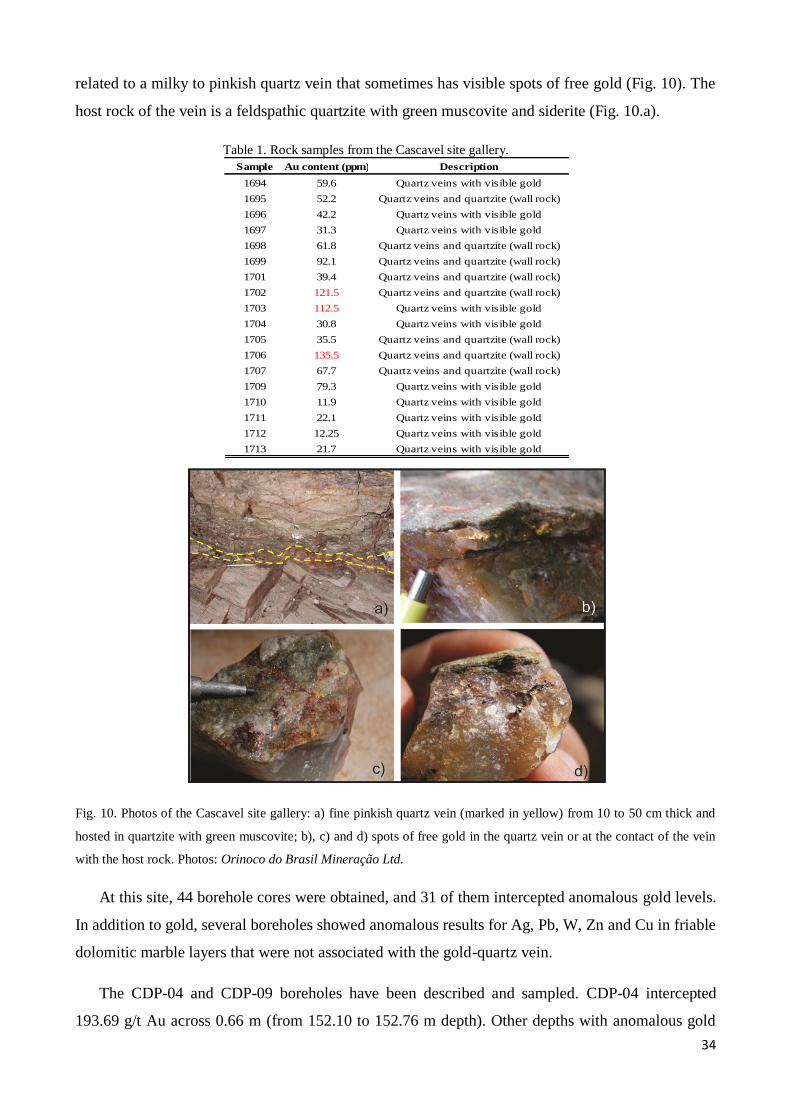
34
related to a milky to pinkish quartz vein that sometimes has visible spots of free gold (Fig. 10). The
host rock of the vein is a feldspathic quartzite with green muscovite and siderite (Fig. 10.a).
Table 1. Rock samples from the Cascavel site gallery.
Fig. 10. Photos of the Cascavel site gallery: a) fine pinkish quartz vein (marked in yellow) from 10 to 50 cm thick and
hosted in quartzite with green muscovite; b), c) and d) spots of free gold in the quartz vein or at the contact of the vein
with the host rock. Photos: Orinoco do Brasil Mineração Ltd.
At this site, 44 borehole cores were obtained, and 31 of them intercepted anomalous gold levels.
In addition to gold, several boreholes showed anomalous results for Ag, Pb, W, Zn and Cu in friable
dolomitic marble layers that were not associated with the gold-quartz vein.
The CDP-04 and CDP-09 boreholes have been described and sampled. CDP-04 intercepted
193.69 g/t Au across 0.66 m (from 152.10 to 152.76 m depth). Other depths with anomalous gold
Sample Au content (ppm) Description
1694 59.6 Quartz veins with visible gold
1695 52.2 Quartz veins and quartzite (wall rock)
1696 42.2 Quartz veins with visible gold
1697 31.3 Quartz veins with visible gold
1698 61.8 Quartz veins and quartzite (wall rock)
1699 92.1 Quartz veins and quartzite (wall rock)
1701 39.4 Quartz veins and quartzite (wall rock)
1702 121.5 Quartz veins and quartzite (wall rock)
1703 112.5 Quartz veins with visible gold
1704 30.8 Quartz veins with visible gold
1705 35.5 Quartz veins and quartzite (wall rock)
1706 135.5 Quartz veins and quartzite (wall rock)
1707 67.7 Quartz veins and quartzite (wall rock)
1709 79.3 Quartz veins with visible gold
1710 11.9 Quartz veins with visible gold
1711 22.1 Quartz veins with visible gold
1712 12.25 Quartz veins with visible gold
1713 21.7 Quartz veins with visible gold
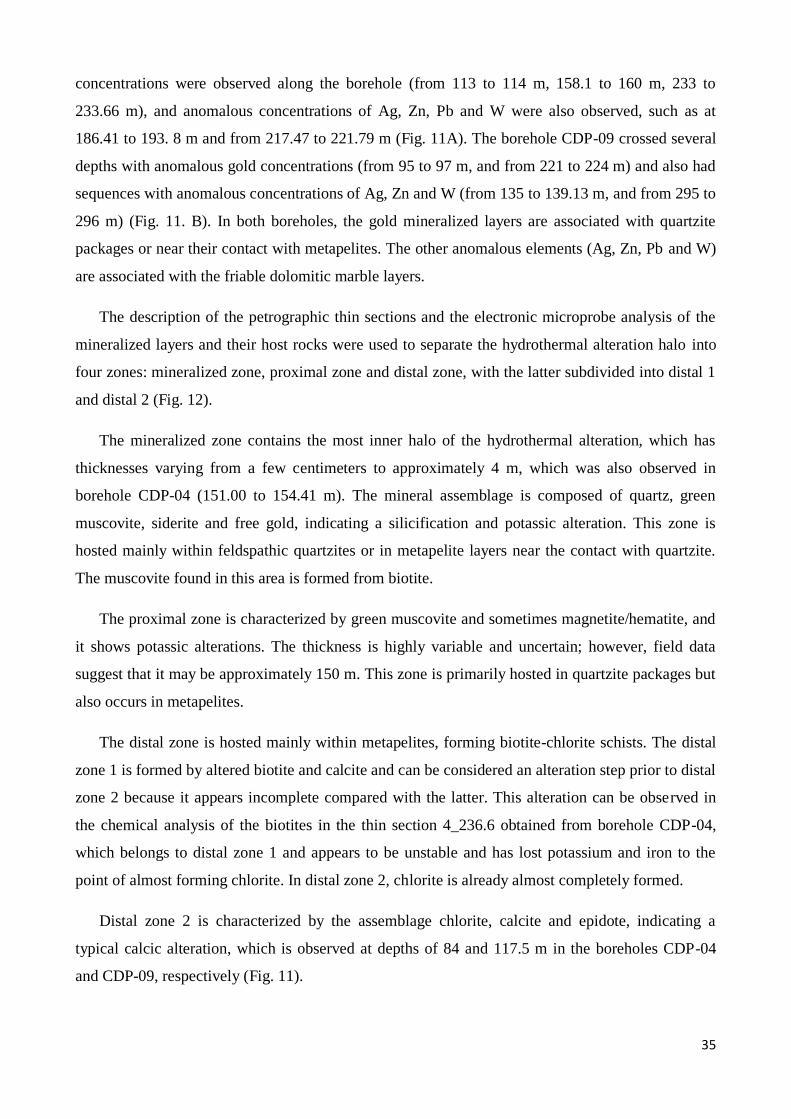
35
concentrations were observed along the borehole (from 113 to 114 m, 158.1 to 160 m, 233 to
233.66 m), and anomalous concentrations of Ag, Zn, Pb and W were also observed, such as at
186.41 to 193. 8 m and from 217.47 to 221.79 m (Fig. 11A). The borehole CDP-09 crossed several
depths with anomalous gold concentrations (from 95 to 97 m, and from 221 to 224 m) and also had
sequences with anomalous concentrations of Ag, Zn and W (from 135 to 139.13 m, and from 295 to
296 m) (Fig. 11. B). In both boreholes, the gold mineralized layers are associated with quartzite
packages or near their contact with metapelites. The other anomalous elements (Ag, Zn, Pb and W)
are associated with the friable dolomitic marble layers.
The description of the petrographic thin sections and the electronic microprobe analysis of the
mineralized layers and their host rocks were used to separate the hydrothermal alteration halo into
four zones: mineralized zone, proximal zone and distal zone, with the latter subdivided into distal 1
and distal 2 (Fig. 12).
The mineralized zone contains the most inner halo of the hydrothermal alteration, which has
thicknesses varying from a few centimeters to approximately 4 m, which was also observed in
borehole CDP-04 (151.00 to 154.41 m). The mineral assemblage is composed of quartz, green
muscovite, siderite and free gold, indicating a silicification and potassic alteration. This zone is
hosted mainly within feldspathic quartzites or in metapelite layers near the contact with quartzite.
The muscovite found in this area is formed from biotite.
The proximal zone is characterized by green muscovite and sometimes magnetite/hematite, and
it shows potassic alterations. The thickness is highly variable and uncertain; however, field data
suggest that it may be approximately 150 m. This zone is primarily hosted in quartzite packages but
also occurs in metapelites.
The distal zone is hosted mainly within metapelites, forming biotite-chlorite schists. The distal
zone 1 is formed by altered biotite and calcite and can be considered an alteration step prior to distal
zone 2 because it appears incomplete compared with the latter. This alteration can be observed in
the chemical analysis of the biotites in the thin section 4_236.6 obtained from borehole CDP-04,
which belongs to distal zone 1 and appears to be unstable and has lost potassium and iron to the
point of almost forming chlorite. In distal zone 2, chlorite is already almost completely formed.
Distal zone 2 is characterized by the assemblage chlorite, calcite and epidote, indicating a
typical calcic alteration, which is observed at depths of 84 and 117.5 m in the boreholes CDP-04
and CDP-09, respectively (Fig. 11).
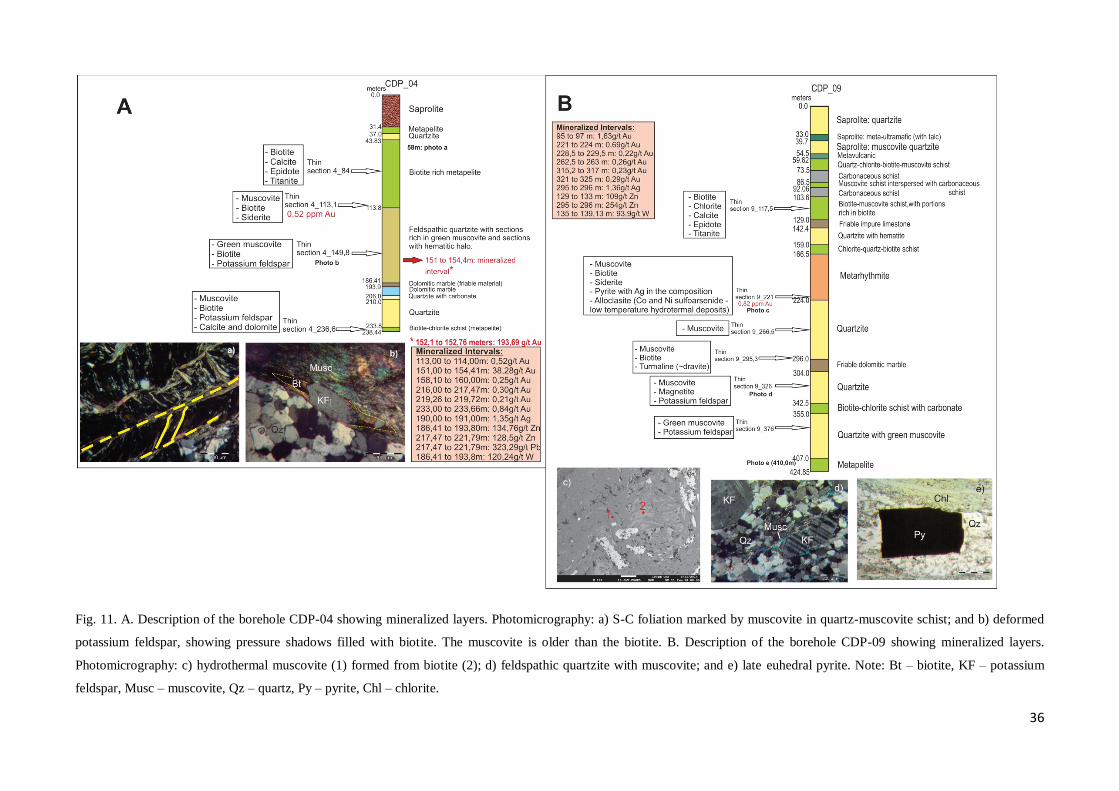
36
Fig. 11. A. Description of the borehole CDP-04 showing mineralized layers. Photomicrography: a) S-C foliation marked by muscovite in quartz-muscovite schist; and b) deformed
potassium feldspar, showing pressure shadows filled with biotite. The muscovite is older than the biotite. B. Description of the borehole CDP-09 showing mineralized layers.
Photomicrography: c) hydrothermal muscovite (1) formed from biotite (2); d) feldspathic quartzite with muscovite; and e) late euhedral pyrite. Note: Bt – biotite, KF – potassium
feldspar, Musc – muscovite, Qz – quartz, Py – pyrite, Chl – chlorite.
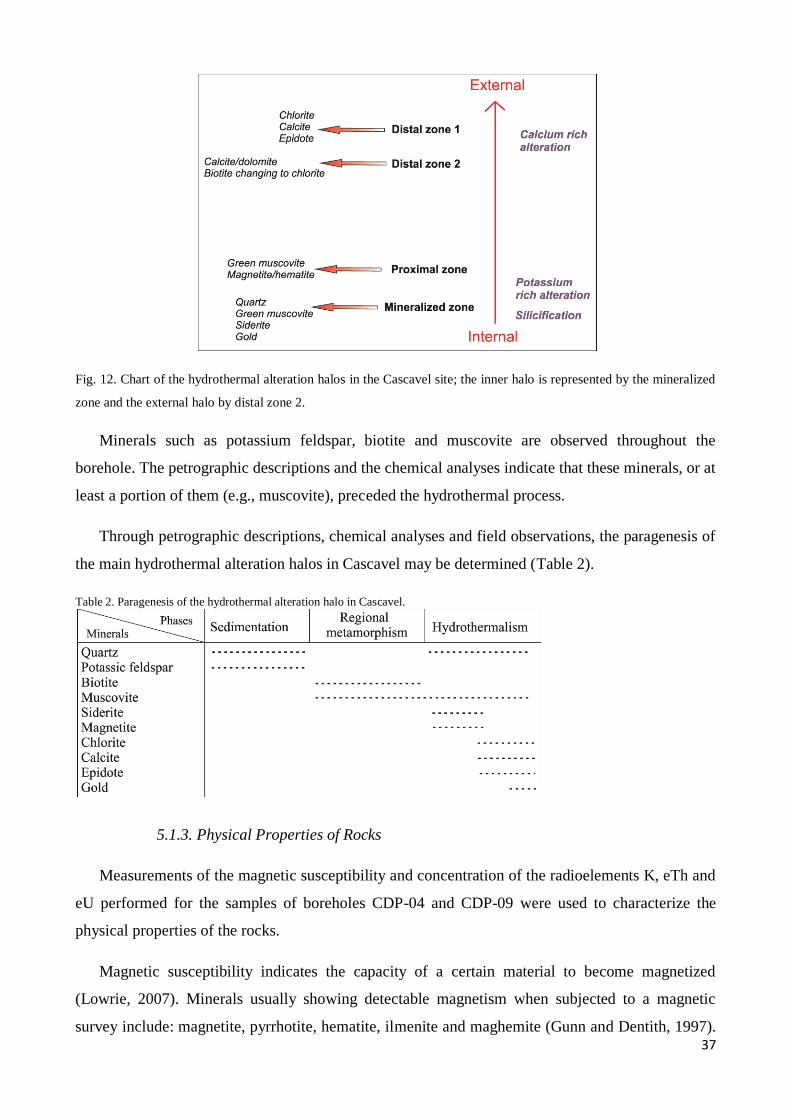
37
Fig. 12. Chart of the hydrothermal alteration halos in the Cascavel site; the inner halo is represented by the mineralized
zone and the external halo by distal zone 2.
Minerals such as potassium feldspar, biotite and muscovite are observed throughout the
borehole. The petrographic descriptions and the chemical analyses indicate that these minerals, or at
least a portion of them (e.g., muscovite), preceded the hydrothermal process.
Through petrographic descriptions, chemical analyses and field observations, the paragenesis of
the main hydrothermal alteration halos in Cascavel may be determined (Table 2).
Table 2. Paragenesis of the hydrothermal alteration halo in Cascavel.
5.1.3. Physical Properties of Rocks
Measurements of the magnetic susceptibility and concentration of the radioelements K, eTh and
eU performed for the samples of boreholes CDP-04 and CDP-09 were used to characterize the
physical properties of the rocks.
Magnetic susceptibility indicates the capacity of a certain material to become magnetized
(Lowrie, 2007). Minerals usually showing detectable magnetism when subjected to a magnetic
survey include: magnetite, pyrrhotite, hematite, ilmenite and maghemite (Gunn and Dentith, 1997).
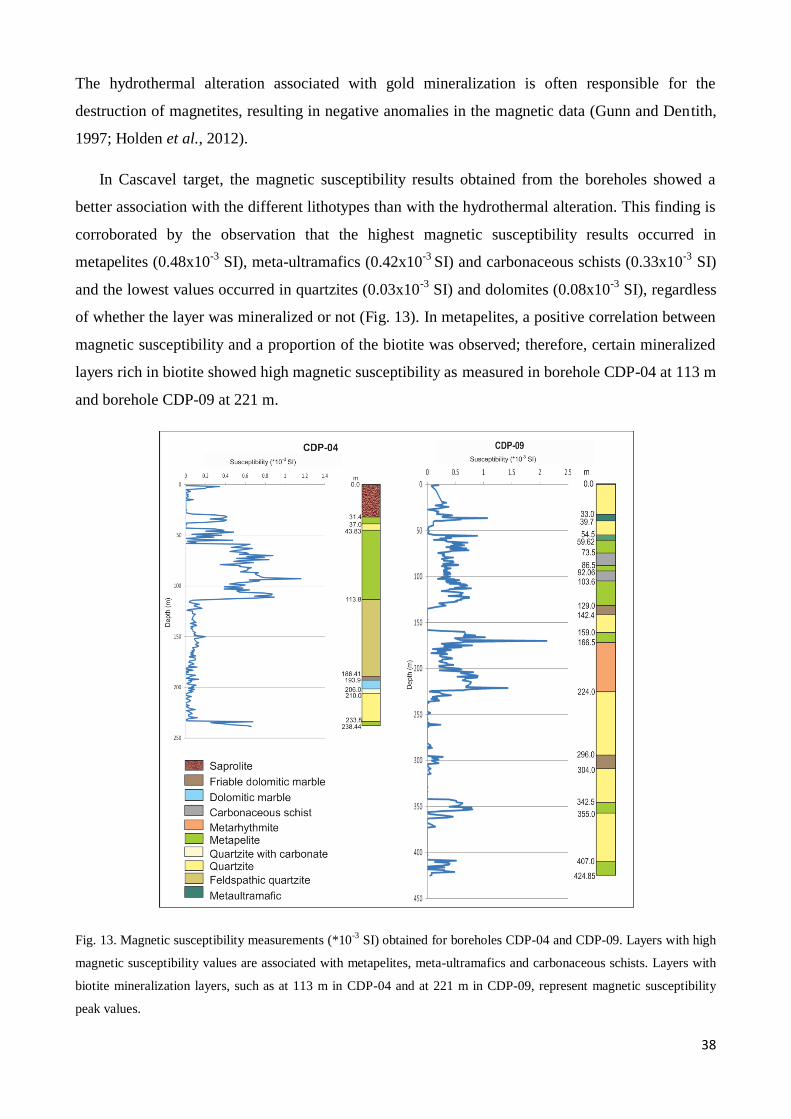
38
The hydrothermal alteration associated with gold mineralization is often responsible for the
destruction of magnetites, resulting in negative anomalies in the magnetic data (Gunn and Dentith,
1997; Holden et al., 2012).
In Cascavel target, the magnetic susceptibility results obtained from the boreholes showed a
better association with the different lithotypes than with the hydrothermal alteration. This finding is
corroborated by the observation that the highest magnetic susceptibility results occurred in
metapelites (0.48x10⁻³
SI), meta-ultramafics (0.42x10⁻³
SI) and carbonaceous schists (0.33x10⁻³
SI)
and the lowest values occurred in quartzites (0.03x10⁻³
SI) and dolomites (0.08x10⁻³
SI), regardless
of whether the layer was mineralized or not (Fig. 13). In metapelites, a positive correlation between
magnetic susceptibility and a proportion of the biotite was observed; therefore, certain mineralized
layers rich in biotite showed high magnetic susceptibility as measured in borehole CDP-04 at 113 m
and borehole CDP-09 at 221 m.
Fig. 13. Magnetic susceptibility measurements (*10-3
SI) obtained for boreholes CDP-04 and CDP-09. Layers with high
magnetic susceptibility values are associated with metapelites, meta-ultramafics and carbonaceous schists. Layers with
biotite mineralization layers, such as at 113 m in CDP-04 and at 221 m in CDP-09, represent magnetic susceptibility
peak values.
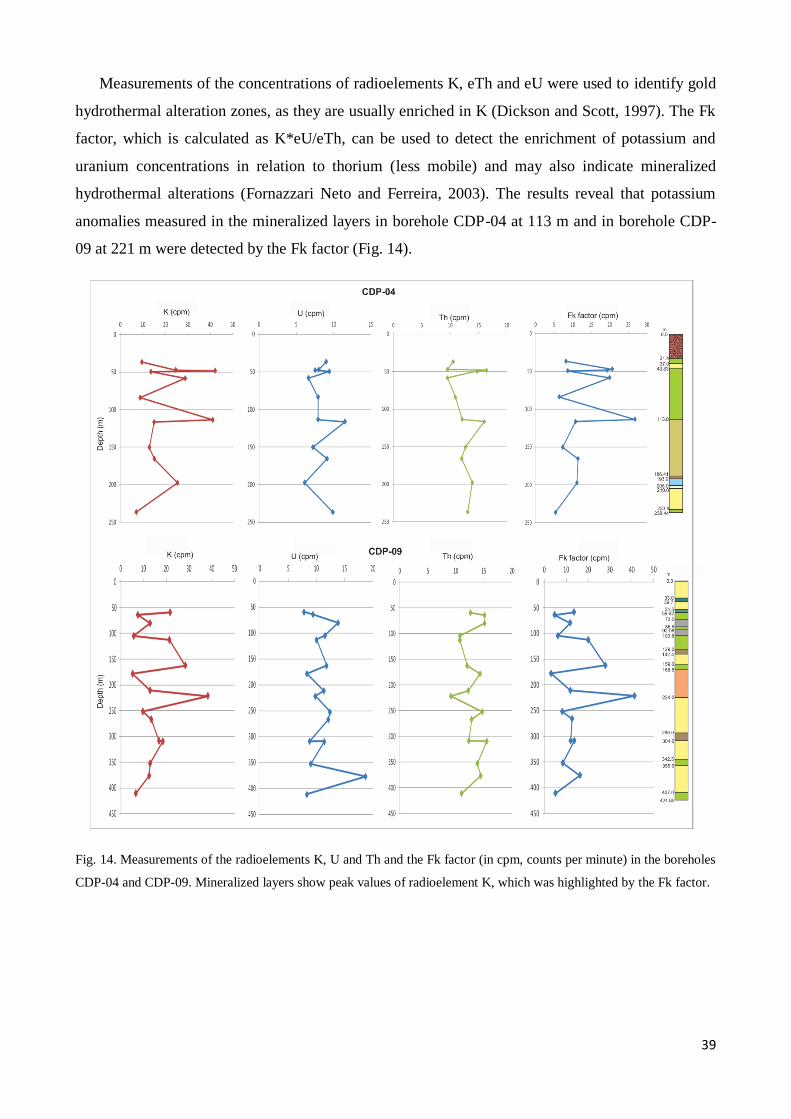
39
Measurements of the concentrations of radioelements K, eTh and eU were used to identify gold
hydrothermal alteration zones, as they are usually enriched in K (Dickson and Scott, 1997). The Fk
factor, which is calculated as K*eU/eTh, can be used to detect the enrichment of potassium and
uranium concentrations in relation to thorium (less mobile) and may also indicate mineralized
hydrothermal alterations (Fornazzari Neto and Ferreira, 2003). The results reveal that potassium
anomalies measured in the mineralized layers in borehole CDP-04 at 113 m and in borehole CDP-
09 at 221 m were detected by the Fk factor (Fig. 14).
Fig. 14. Measurements of the radioelements K, U and Th and the Fk factor (in cpm, counts per minute) in the boreholes
CDP-04 and CDP-09. Mineralized layers show peak values of radioelement K, which was highlighted by the Fk factor.
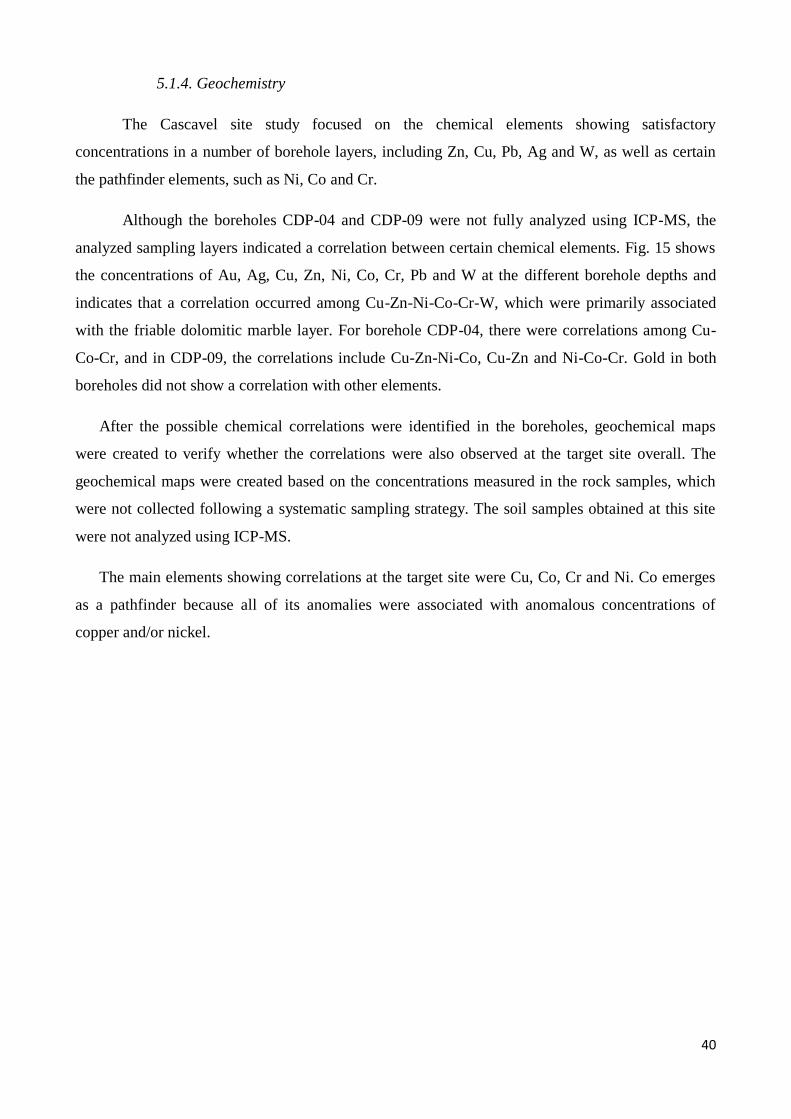
40
5.1.4. Geochemistry
The Cascavel site study focused on the chemical elements showing satisfactory
concentrations in a number of borehole layers, including Zn, Cu, Pb, Ag and W, as well as certain
the pathfinder elements, such as Ni, Co and Cr.
Although the boreholes CDP-04 and CDP-09 were not fully analyzed using ICP-MS, the
analyzed sampling layers indicated a correlation between certain chemical elements. Fig. 15 shows
the concentrations of Au, Ag, Cu, Zn, Ni, Co, Cr, Pb and W at the different borehole depths and
indicates that a correlation occurred among Cu-Zn-Ni-Co-Cr-W, which were primarily associated
with the friable dolomitic marble layer. For borehole CDP-04, there were correlations among Cu-
Co-Cr, and in CDP-09, the correlations include Cu-Zn-Ni-Co, Cu-Zn and Ni-Co-Cr. Gold in both
boreholes did not show a correlation with other elements.
After the possible chemical correlations were identified in the boreholes, geochemical maps
were created to verify whether the correlations were also observed at the target site overall. The
geochemical maps were created based on the concentrations measured in the rock samples, which
were not collected following a systematic sampling strategy. The soil samples obtained at this site
were not analyzed using ICP-MS.
The main elements showing correlations at the target site were Cu, Co, Cr and Ni. Co emerges
as a pathfinder because all of its anomalies were associated with anomalous concentrations of
copper and/or nickel.
41
Fig. 15. Distribution of the elements Au, Cu, Zn, Ni, Co, Cr, Pb and W (in ppm) along the boreholes CDP-04 and CDP-09, and possible correlations (red circles).
42
5.1.5. Mineral Exploration Vectors
By processing and interpreting the geophysical, geochemical and geological data available, the
main exploration vectors were identified and subsequently used in the production of the final
prospectivity map. These vectors are summarized in Table 3 and discussed later in the article.
Table 3. Main mineral exploration vectors identified for the Cascavel target site.
5.2. TinteiroTarget
5.2.1. Lithological and Structural Controls
The Tinteiro target site is located west of Cascavel in the central greenstone region. The site is
divided into four sub-sites: North Tinteiro, Central Tinteiro, Southeast Tinteiro and South Tinteiro
(Fig. 3). The main lithotypes of Tinteiro are quartzite, feldspathic quartzite, metapelite, metachert
and talc schist, which belong to the metasedimentary sequence A (Fig. 8). Gold, copper, silver and
iron mineralizations often occur associated with the metachert and take the form of hematite
breccias, manganiferous breccias or gossan.
The quartzite (Fig. 16.a) occurs as massive outcrops that are usually found at the bottom of
streams in a wide range of colors, including white, yellowish, pinkish and grayish, and it has a
granoblastic texture with fine-to-medium-sized grains and a modal composition of quartz (60-85%)
and muscovite (5-30%) as the major minerals and magnetite, tourmaline and sulfites the as
accessory minerals. Alterations rich in iron oxides are common. A feldspathic quartzite lens
intruded in the quartzite occurs in the south section of Central Tinteiro, and it is similar to the
feldspathic quartzite lens found in Cascavel.
The metapelites have a lepidoblastic texture, and they form schists with variable compositions
and concentrations of muscovite (20-60%), chlorite (5-20%) and quartz (10-30%) (Fig. 16.b, c).
The metapelites are usually thinly layered and of greenish color or reddish when weathered. Pyrite
and magnetite crystals occur locally. In South Tinteiro, fine-grained greenish chloritoid lenses occur
within the metapelite.
Geophysical Vectors Geochemical Vectors Geological Vectors
Low amplitude Au anomalous
Low magnetic gradient Some anomalies Cu
High K radioelement K rich alteration
Mineralization in quartz veins
Exploration Vectors: Cascavel Target
Intersection of NW-SE, E-W and NE-SW
structures
Mineralization next to lithological contacts
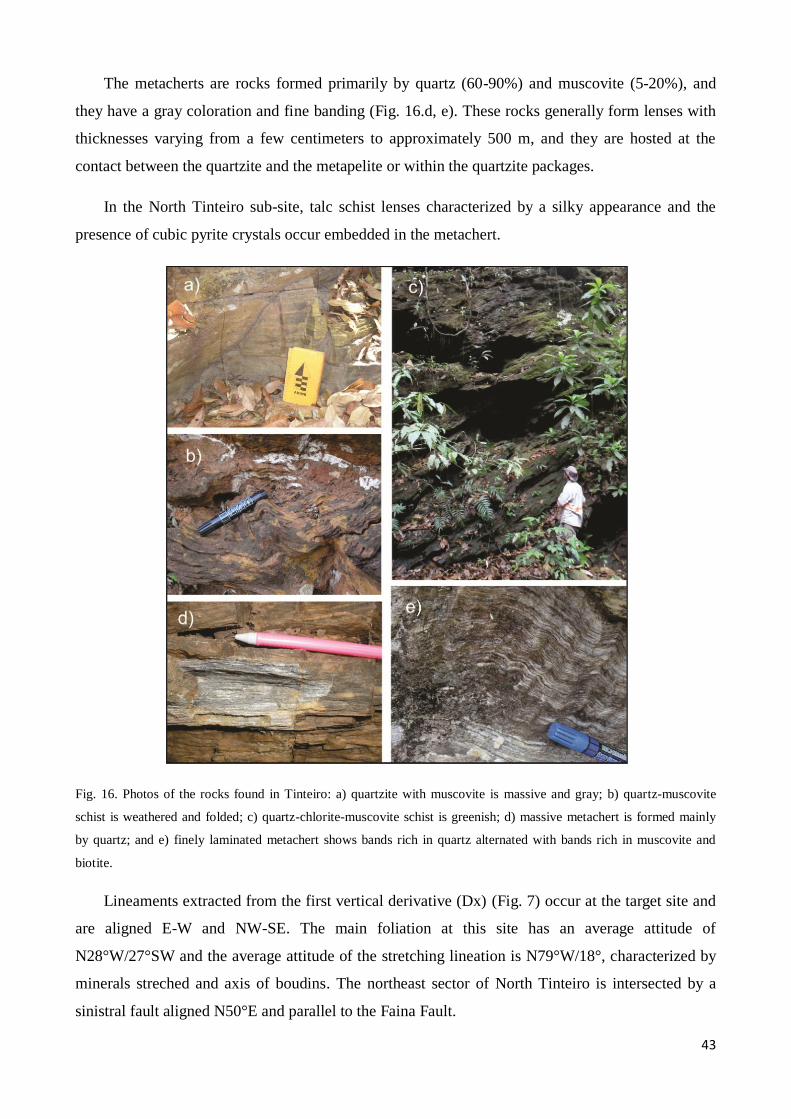
43
The metacherts are rocks formed primarily by quartz (60-90%) and muscovite (5-20%), and
they have a gray coloration and fine banding (Fig. 16.d, e). These rocks generally form lenses with
thicknesses varying from a few centimeters to approximately 500 m, and they are hosted at the
contact between the quartzite and the metapelite or within the quartzite packages.
In the North Tinteiro sub-site, talc schist lenses characterized by a silky appearance and the
presence of cubic pyrite crystals occur embedded in the metachert.
Fig. 16. Photos of the rocks found in Tinteiro: a) quartzite with muscovite is massive and gray; b) quartz-muscovite
schist is weathered and folded; c) quartz-chlorite-muscovite schist is greenish; d) massive metachert is formed mainly
by quartz; and e) finely laminated metachert shows bands rich in quartz alternated with bands rich in muscovite and
biotite.
Lineaments extracted from the first vertical derivative (Dx) (Fig. 7) occur at the target site and
are aligned E-W and NW-SE. The main foliation at this site has an average attitude of
N28°W/27°SW and the average attitude of the stretching lineation is N79°W/18°, characterized by
minerals streched and axis of boudins. The northeast sector of North Tinteiro is intersected by a
sinistral fault aligned N50°E and parallel to the Faina Fault.
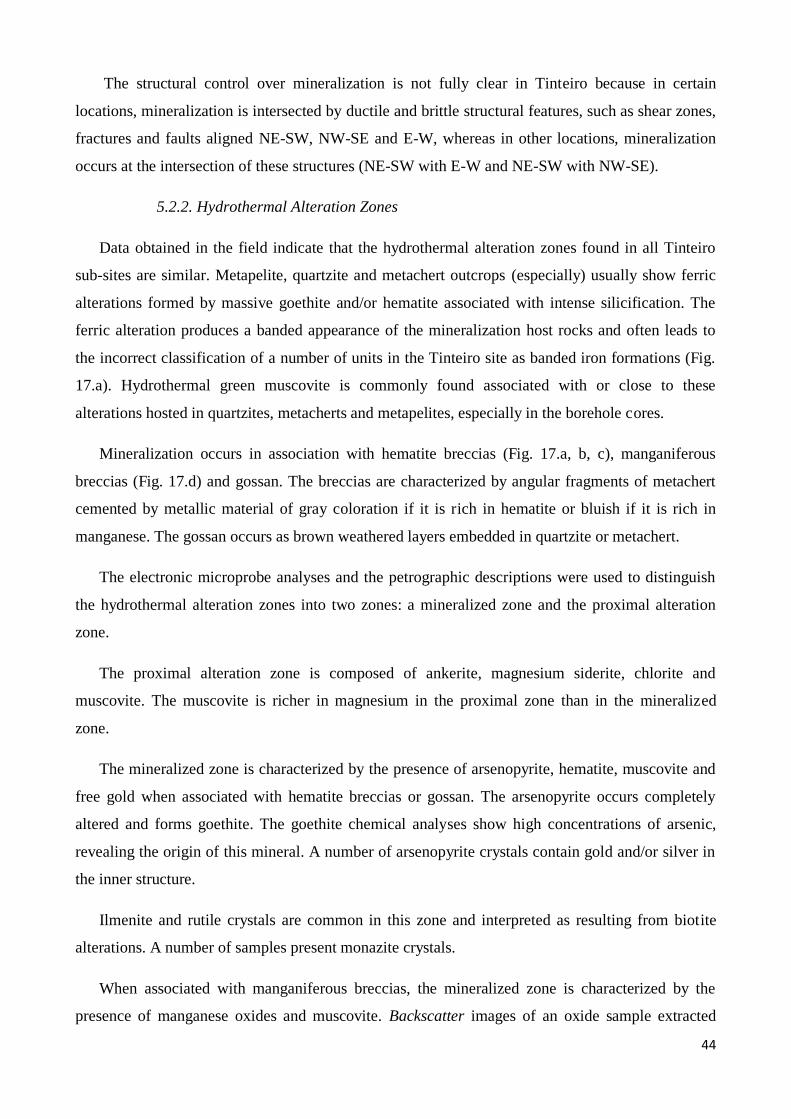
44
The structural control over mineralization is not fully clear in Tinteiro because in certain
locations, mineralization is intersected by ductile and brittle structural features, such as shear zones,
fractures and faults aligned NE-SW, NW-SE and E-W, whereas in other locations, mineralization
occurs at the intersection of these structures (NE-SW with E-W and NE-SW with NW-SE).
5.2.2. Hydrothermal Alteration Zones
Data obtained in the field indicate that the hydrothermal alteration zones found in all Tinteiro
sub-sites are similar. Metapelite, quartzite and metachert outcrops (especially) usually show ferric
alterations formed by massive goethite and/or hematite associated with intense silicification. The
ferric alteration produces a banded appearance of the mineralization host rocks and often leads to
the incorrect classification of a number of units in the Tinteiro site as banded iron formations (Fig.
17.a). Hydrothermal green muscovite is commonly found associated with or close to these
alterations hosted in quartzites, metacherts and metapelites, especially in the borehole cores.
Mineralization occurs in association with hematite breccias (Fig. 17.a, b, c), manganiferous
breccias (Fig. 17.d) and gossan. The breccias are characterized by angular fragments of metachert
cemented by metallic material of gray coloration if it is rich in hematite or bluish if it is rich in
manganese. The gossan occurs as brown weathered layers embedded in quartzite or metachert.
The electronic microprobe analyses and the petrographic descriptions were used to distinguish
the hydrothermal alteration zones into two zones: a mineralized zone and the proximal alteration
zone.
The proximal alteration zone is composed of ankerite, magnesium siderite, chlorite and
muscovite. The muscovite is richer in magnesium in the proximal zone than in the mineralized
zone.
The mineralized zone is characterized by the presence of arsenopyrite, hematite, muscovite and
free gold when associated with hematite breccias or gossan. The arsenopyrite occurs completely
altered and forms goethite. The goethite chemical analyses show high concentrations of arsenic,
revealing the origin of this mineral. A number of arsenopyrite crystals contain gold and/or silver in
the inner structure.
Ilmenite and rutile crystals are common in this zone and interpreted as resulting from biotite
alterations. A number of samples present monazite crystals.
When associated with manganiferous breccias, the mineralized zone is characterized by the
presence of manganese oxides and muscovite. Backscatter images of an oxide sample extracted
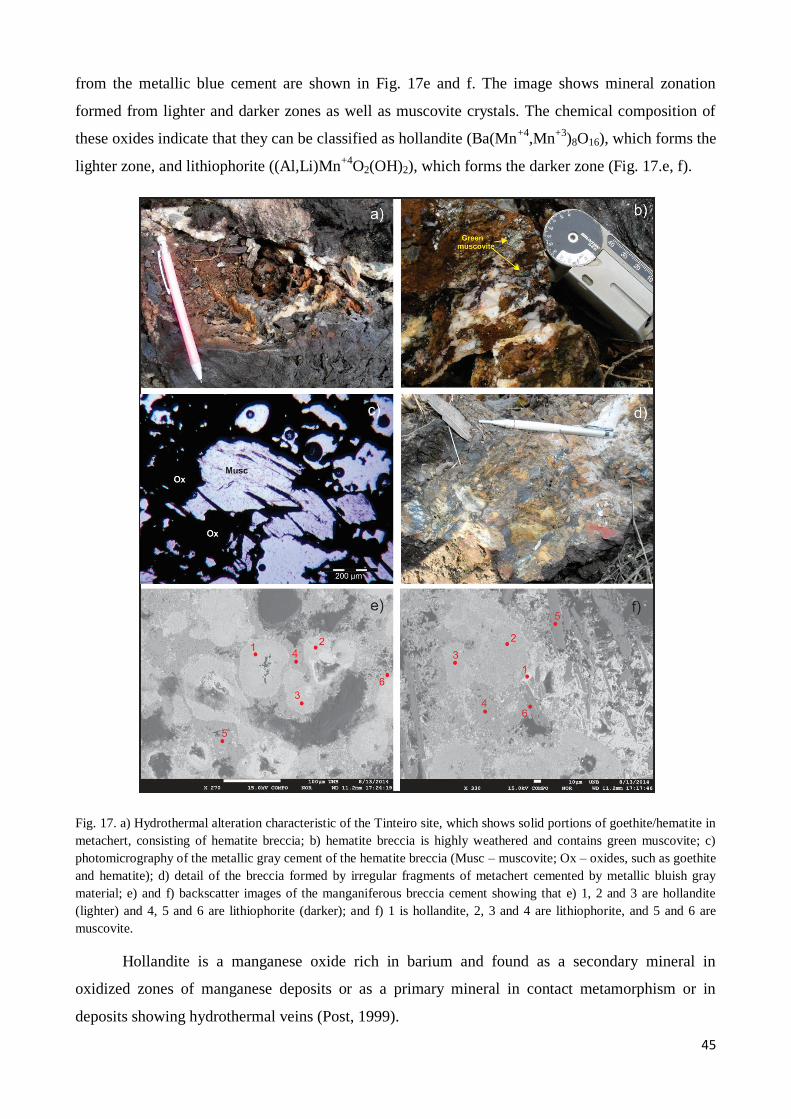
45
from the metallic blue cement are shown in Fig. 17e and f. The image shows mineral zonation
formed from lighter and darker zones as well as muscovite crystals. The chemical composition of
these oxides indicate that they can be classified as hollandite (Ba(Mn+4
,Mn+3
)8O16), which forms the
lighter zone, and lithiophorite ((Al,Li)Mn+4
O2(OH)2), which forms the darker zone (Fig. 17.e, f).
Fig. 17. a) Hydrothermal alteration characteristic of the Tinteiro site, which shows solid portions of goethite/hematite in
metachert, consisting of hematite breccia; b) hematite breccia is highly weathered and contains green muscovite; c)
photomicrography of the metallic gray cement of the hematite breccia (Musc – muscovite; Ox – oxides, such as goethite
and hematite); d) detail of the breccia formed by irregular fragments of metachert cemented by metallic bluish gray
material; e) and f) backscatter images of the manganiferous breccia cement showing that e) 1, 2 and 3 are hollandite
(lighter) and 4, 5 and 6 are lithiophorite (darker); and f) 1 is hollandite, 2, 3 and 4 are lithiophorite, and 5 and 6 are
muscovite.
Hollandite is a manganese oxide rich in barium and found as a secondary mineral in
oxidized zones of manganese deposits or as a primary mineral in contact metamorphism or in
deposits showing hydrothermal veins (Post, 1999).
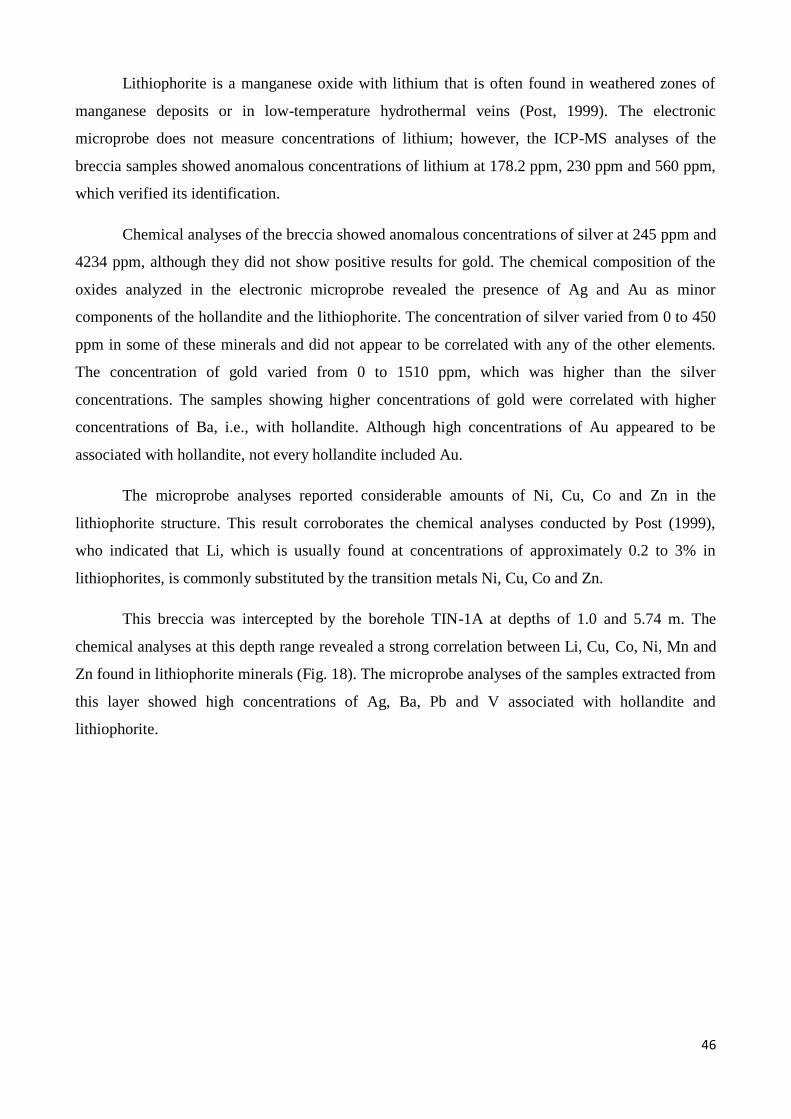
46
Lithiophorite is a manganese oxide with lithium that is often found in weathered zones of
manganese deposits or in low-temperature hydrothermal veins (Post, 1999). The electronic
microprobe does not measure concentrations of lithium; however, the ICP-MS analyses of the
breccia samples showed anomalous concentrations of lithium at 178.2 ppm, 230 ppm and 560 ppm,
which verified its identification.
Chemical analyses of the breccia showed anomalous concentrations of silver at 245 ppm and
4234 ppm, although they did not show positive results for gold. The chemical composition of the
oxides analyzed in the electronic microprobe revealed the presence of Ag and Au as minor
components of the hollandite and the lithiophorite. The concentration of silver varied from 0 to 450
ppm in some of these minerals and did not appear to be correlated with any of the other elements.
The concentration of gold varied from 0 to 1510 ppm, which was higher than the silver
concentrations. The samples showing higher concentrations of gold were correlated with higher
concentrations of Ba, i.e., with hollandite. Although high concentrations of Au appeared to be
associated with hollandite, not every hollandite included Au.
The microprobe analyses reported considerable amounts of Ni, Cu, Co and Zn in the
lithiophorite structure. This result corroborates the chemical analyses conducted by Post (1999),
who indicated that Li, which is usually found at concentrations of approximately 0.2 to 3% in
lithiophorites, is commonly substituted by the transition metals Ni, Cu, Co and Zn.
This breccia was intercepted by the borehole TIN-1A at depths of 1.0 and 5.74 m. The
chemical analyses at this depth range revealed a strong correlation between Li, Cu, Co, Ni, Mn and
Zn found in lithiophorite minerals (Fig. 18). The microprobe analyses of the samples extracted from
this layer showed high concentrations of Ag, Ba, Pb and V associated with hollandite and
lithiophorite.
47
Fig. 18. Chemical analyses of the borehole TIN-1A, highlighting the layer intercepting the manganiferous breccia and
showing anomalous concentrations of Ag, Ba, Pb and V in addition to Co, Cu, Mn, Ni, Zn and Li, which occur in the
lithiophorite structure.
The description and interpretation of the mineralized and proximal alteration zones were used to
determine the paragenesis of the hydrothermal alteration halos in Tinteiro (Table 4).
Table 4. Paragenesis of the hydrothermal alteration halos in Tinteiro prospect.
5.2.3. Rock Physical Properties
The magnetic susceptibility measurements (SI*10-3
) were obtained for the rock samples of
the varied lithology collected during field work in Tinteiro and covering the mineralized and non-
mineralized zones. The results (Table 5) showed values that were relatively higher in Tinteiro than
in Cascavel because of the enrichment of iron minerals, such as goethite, hematite and magnetite.
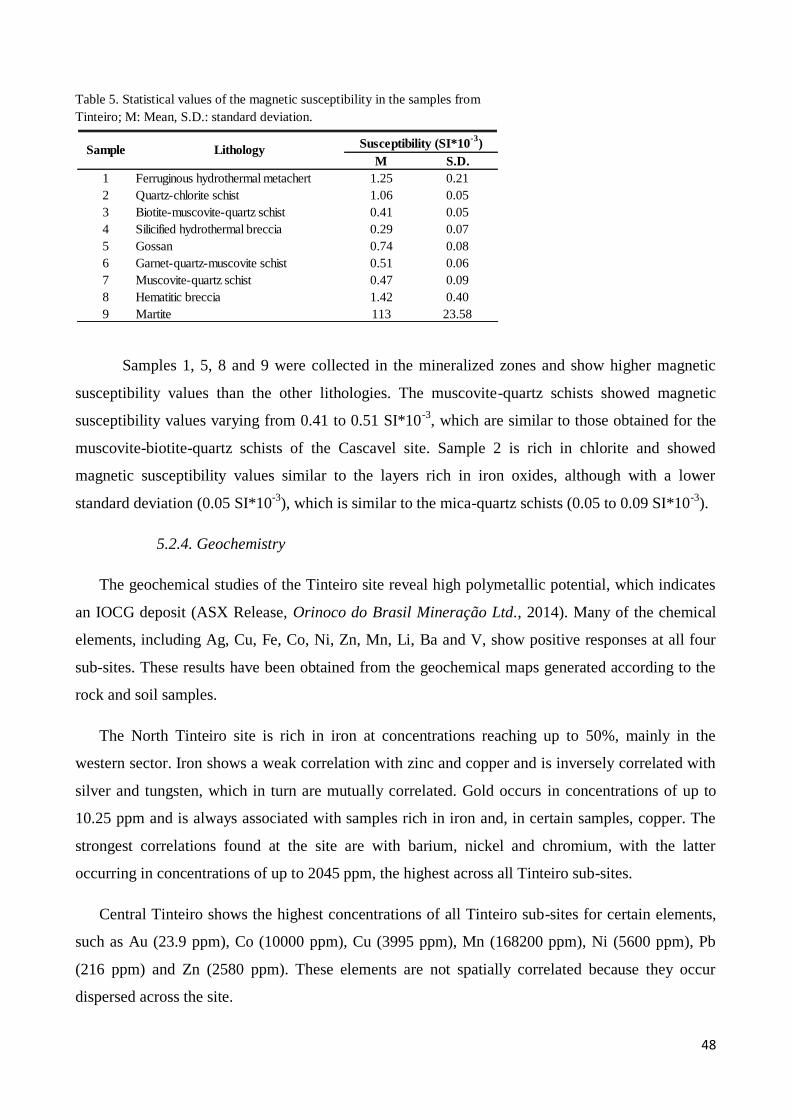
48
Table 5. Statistical values of the magnetic susceptibility in the samples from
Tinteiro; M: Mean, S.D.: standard deviation.
Samples 1, 5, 8 and 9 were collected in the mineralized zones and show higher magnetic
susceptibility values than the other lithologies. The muscovite-quartz schists showed magnetic
susceptibility values varying from 0.41 to 0.51 SI*10-3
, which are similar to those obtained for the
muscovite-biotite-quartz schists of the Cascavel site. Sample 2 is rich in chlorite and showed
magnetic susceptibility values similar to the layers rich in iron oxides, although with a lower
standard deviation (0.05 SI*10-3
), which is similar to the mica-quartz schists (0.05 to 0.09 SI*10-3
).
5.2.4. Geochemistry
The geochemical studies of the Tinteiro site reveal high polymetallic potential, which indicates
an IOCG deposit (ASX Release, Orinoco do Brasil Mineração Ltd., 2014). Many of the chemical
elements, including Ag, Cu, Fe, Co, Ni, Zn, Mn, Li, Ba and V, show positive responses at all four
sub-sites. These results have been obtained from the geochemical maps generated according to the
rock and soil samples.
The North Tinteiro site is rich in iron at concentrations reaching up to 50%, mainly in the
western sector. Iron shows a weak correlation with zinc and copper and is inversely correlated with
silver and tungsten, which in turn are mutually correlated. Gold occurs in concentrations of up to
10.25 ppm and is always associated with samples rich in iron and, in certain samples, copper. The
strongest correlations found at the site are with barium, nickel and chromium, with the latter
occurring in concentrations of up to 2045 ppm, the highest across all Tinteiro sub-sites.
Central Tinteiro shows the highest concentrations of all Tinteiro sub-sites for certain elements,
such as Au (23.9 ppm), Co (10000 ppm), Cu (3995 ppm), Mn (168200 ppm), Ni (5600 ppm), Pb
(216 ppm) and Zn (2580 ppm). These elements are not spatially correlated because they occur
dispersed across the site.
M S.D.
1 Ferruginous hydrothermal metachert 1.25 0.21
2 Quartz-chlorite schist 1.06 0.05
3 Biotite-muscovite-quartz schist 0.41 0.05
4 Silicified hydrothermal breccia 0.29 0.07
5 Gossan 0.74 0.08
6 Garnet-quartz-muscovite schist 0.51 0.06
7 Muscovite-quartz schist 0.47 0.09
8 Hematitic breccia 1.42 0.40
9 Martite 113 23.58
Sample LithologySusceptibility (SI*10
-3)
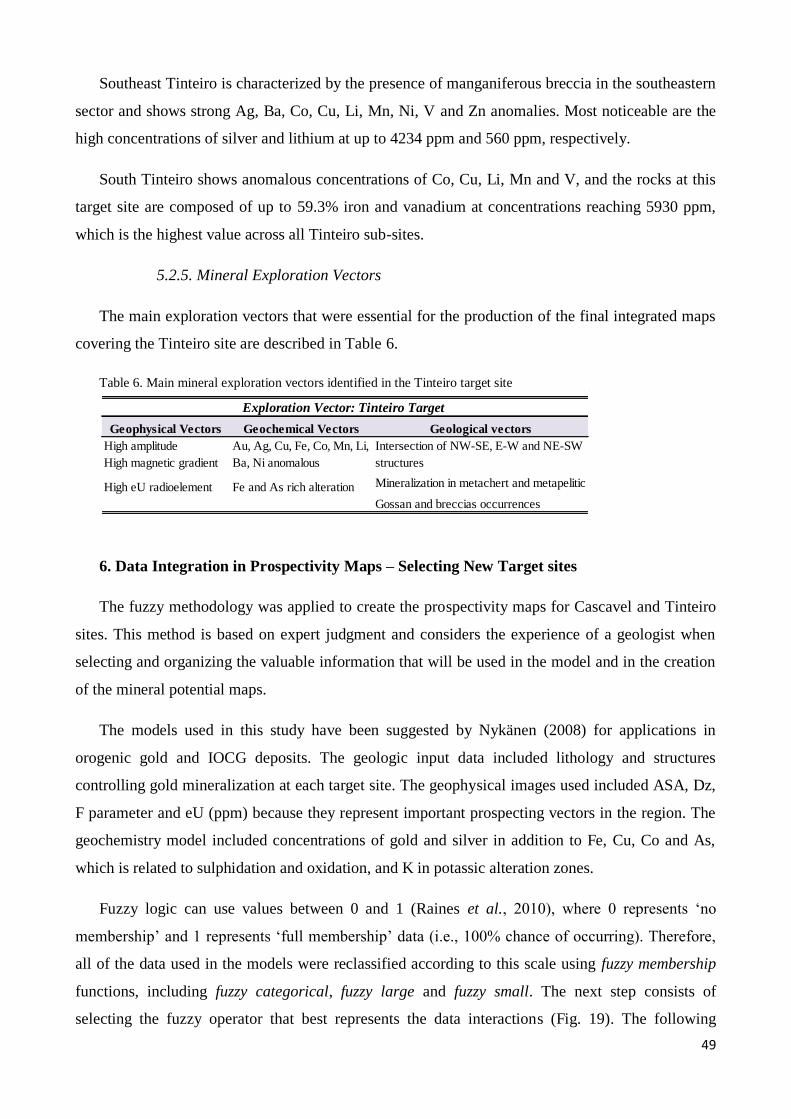
49
Southeast Tinteiro is characterized by the presence of manganiferous breccia in the southeastern
sector and shows strong Ag, Ba, Co, Cu, Li, Mn, Ni, V and Zn anomalies. Most noticeable are the
high concentrations of silver and lithium at up to 4234 ppm and 560 ppm, respectively.
South Tinteiro shows anomalous concentrations of Co, Cu, Li, Mn and V, and the rocks at this
target site are composed of up to 59.3% iron and vanadium at concentrations reaching 5930 ppm,
which is the highest value across all Tinteiro sub-sites.
5.2.5. Mineral Exploration Vectors
The main exploration vectors that were essential for the production of the final integrated maps
covering the Tinteiro site are described in Table 6.
Table 6. Main mineral exploration vectors identified in the Tinteiro target site
6. Data Integration in Prospectivity Maps – Selecting New Target sites
The fuzzy methodology was applied to create the prospectivity maps for Cascavel and Tinteiro
sites. This method is based on expert judgment and considers the experience of a geologist when
selecting and organizing the valuable information that will be used in the model and in the creation
of the mineral potential maps.
The models used in this study have been suggested by Nykänen (2008) for applications in
orogenic gold and IOCG deposits. The geologic input data included lithology and structures
controlling gold mineralization at each target site. The geophysical images used included ASA, Dz,
F parameter and eU (ppm) because they represent important prospecting vectors in the region. The
geochemistry model included concentrations of gold and silver in addition to Fe, Cu, Co and As,
which is related to sulphidation and oxidation, and K in potassic alteration zones.
Fuzzy logic can use values between 0 and 1 (Raines et al., 2010), where 0 represents ‘no
membership’ and 1 represents ‘full membership’ data (i.e., 100% chance of occurring). Therefore,
all of the data used in the models were reclassified according to this scale using fuzzy membership
functions, including fuzzy categorical, fuzzy large and fuzzy small. The next step consists of
selecting the fuzzy operator that best represents the data interactions (Fig. 19). The following
Geophysical Vectors Geochemical Vectors Geological vectors
High amplitude
High magnetic gradient
High eU radioelement Fe and As rich alteration Mineralization in metachert and metapelitic
Gossan and breccias occurrences
Exploration Vector: Tinteiro Target
Au, Ag, Cu, Fe, Co, Mn, Li,
Ba, Ni anomalous
Intersection of NW-SE, E-W and NE-SW
structures
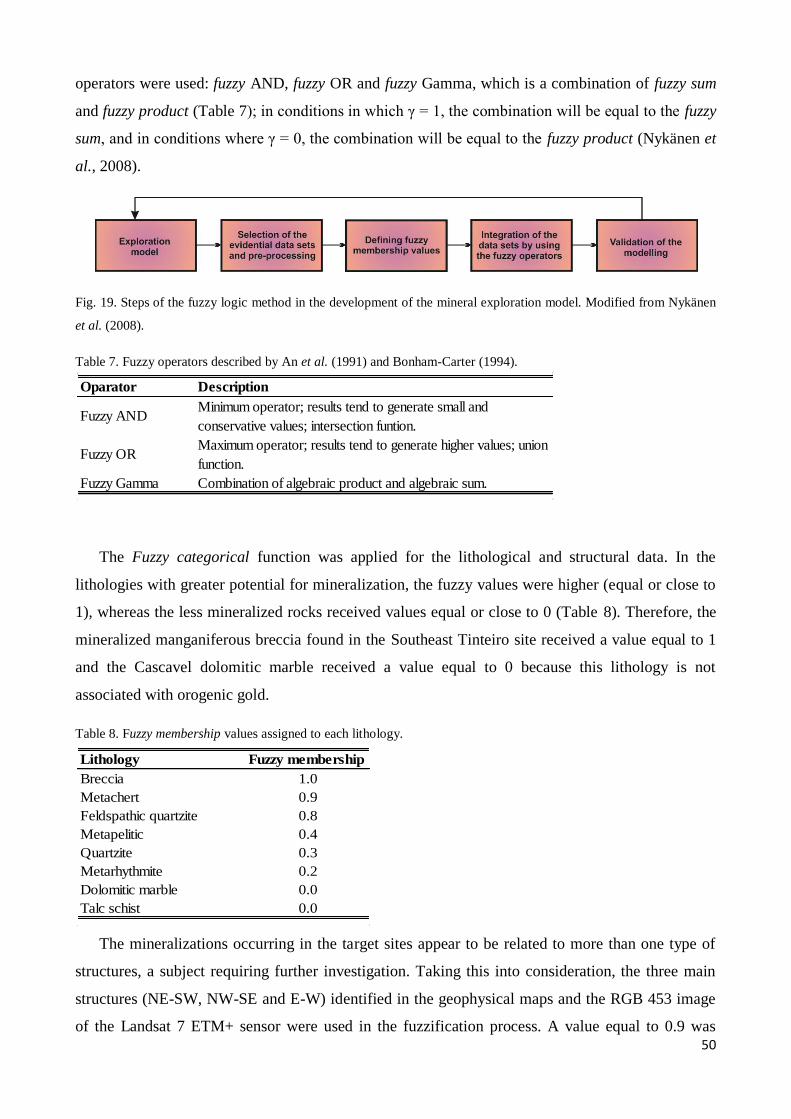
50
operators were used: fuzzy AND, fuzzy OR and fuzzy Gamma, which is a combination of fuzzy sum
and fuzzy product (Table 7); in conditions in which γ = 1, the combination will be equal to the fuzzy
sum, and in conditions where γ = 0, the combination will be equal to the fuzzy product (Nykänen et
al., 2008).
Fig. 19. Steps of the fuzzy logic method in the development of the mineral exploration model. Modified from Nykänen
et al. (2008).
Table 7. Fuzzy operators described by An et al. (1991) and Bonham-Carter (1994).
The Fuzzy categorical function was applied for the lithological and structural data. In the
lithologies with greater potential for mineralization, the fuzzy values were higher (equal or close to
1), whereas the less mineralized rocks received values equal or close to 0 (Table 8). Therefore, the
mineralized manganiferous breccia found in the Southeast Tinteiro site received a value equal to 1
and the Cascavel dolomitic marble received a value equal to 0 because this lithology is not
associated with orogenic gold.
Table 8. Fuzzy membership values assigned to each lithology.
The mineralizations occurring in the target sites appear to be related to more than one type of
structures, a subject requiring further investigation. Taking this into consideration, the three main
structures (NE-SW, NW-SE and E-W) identified in the geophysical maps and the RGB 453 image
of the Landsat 7 ETM+ sensor were used in the fuzzification process. A value equal to 0.9 was
Oparator Description
Fuzzy ANDMinimum operator; results tend to generate small and
conservative values; intersection funtion.
Fuzzy ORMaximum operator; results tend to generate higher values; union
function.
Fuzzy Gamma Combination of algebraic product and algebraic sum.
Lithology Fuzzy membership
Breccia 1.0
Metachert 0.9
Feldspathic quartzite 0.8
Metapelitic 0.4
Quartzite 0.3
Metarhythmite 0.2
Dolomitic marble 0.0
Talc schist 0.0
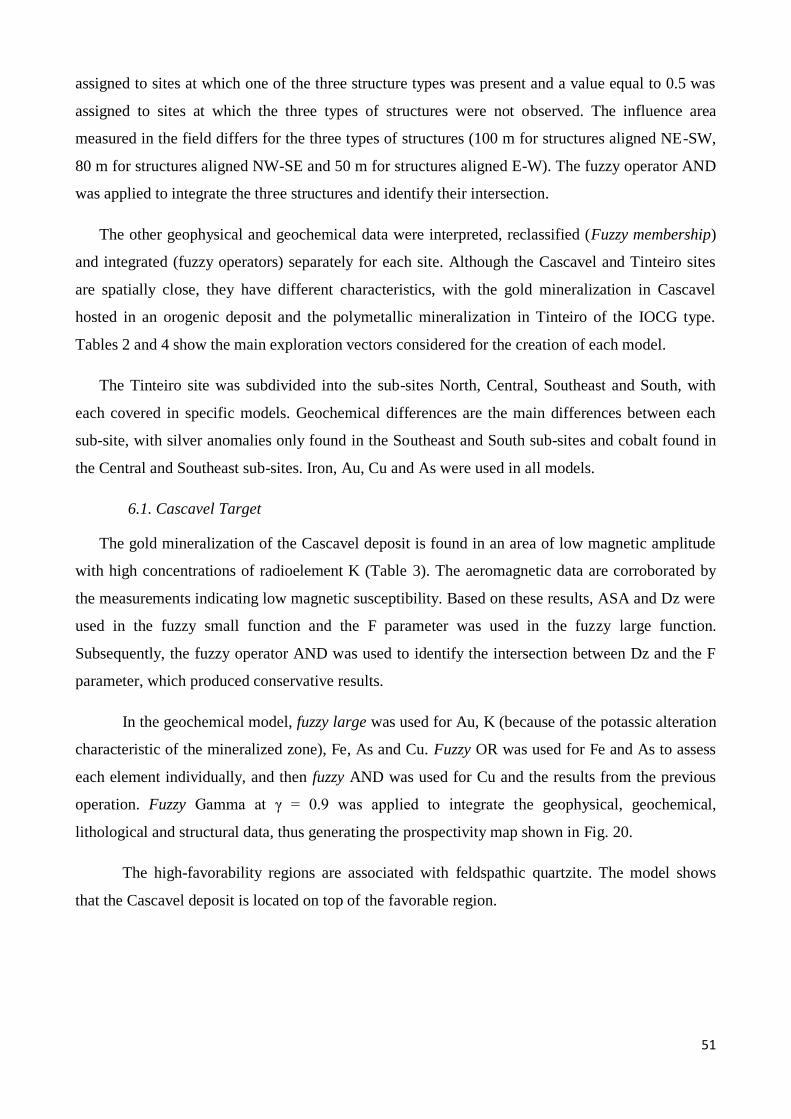
51
assigned to sites at which one of the three structure types was present and a value equal to 0.5 was
assigned to sites at which the three types of structures were not observed. The influence area
measured in the field differs for the three types of structures (100 m for structures aligned NE-SW,
80 m for structures aligned NW-SE and 50 m for structures aligned E-W). The fuzzy operator AND
was applied to integrate the three structures and identify their intersection.
The other geophysical and geochemical data were interpreted, reclassified (Fuzzy membership)
and integrated (fuzzy operators) separately for each site. Although the Cascavel and Tinteiro sites
are spatially close, they have different characteristics, with the gold mineralization in Cascavel
hosted in an orogenic deposit and the polymetallic mineralization in Tinteiro of the IOCG type.
Tables 2 and 4 show the main exploration vectors considered for the creation of each model.
The Tinteiro site was subdivided into the sub-sites North, Central, Southeast and South, with
each covered in specific models. Geochemical differences are the main differences between each
sub-site, with silver anomalies only found in the Southeast and South sub-sites and cobalt found in
the Central and Southeast sub-sites. Iron, Au, Cu and As were used in all models.
6.1. Cascavel Target
The gold mineralization of the Cascavel deposit is found in an area of low magnetic amplitude
with high concentrations of radioelement K (Table 3). The aeromagnetic data are corroborated by
the measurements indicating low magnetic susceptibility. Based on these results, ASA and Dz were
used in the fuzzy small function and the F parameter was used in the fuzzy large function.
Subsequently, the fuzzy operator AND was used to identify the intersection between Dz and the F
parameter, which produced conservative results.
In the geochemical model, fuzzy large was used for Au, K (because of the potassic alteration
characteristic of the mineralized zone), Fe, As and Cu. Fuzzy OR was used for Fe and As to assess
each element individually, and then fuzzy AND was used for Cu and the results from the previous
operation. Fuzzy Gamma at γ = 0.9 was applied to integrate the geophysical, geochemical,
lithological and structural data, thus generating the prospectivity map shown in Fig. 20.
The high-favorability regions are associated with feldspathic quartzite. The model shows
that the Cascavel deposit is located on top of the favorable region.
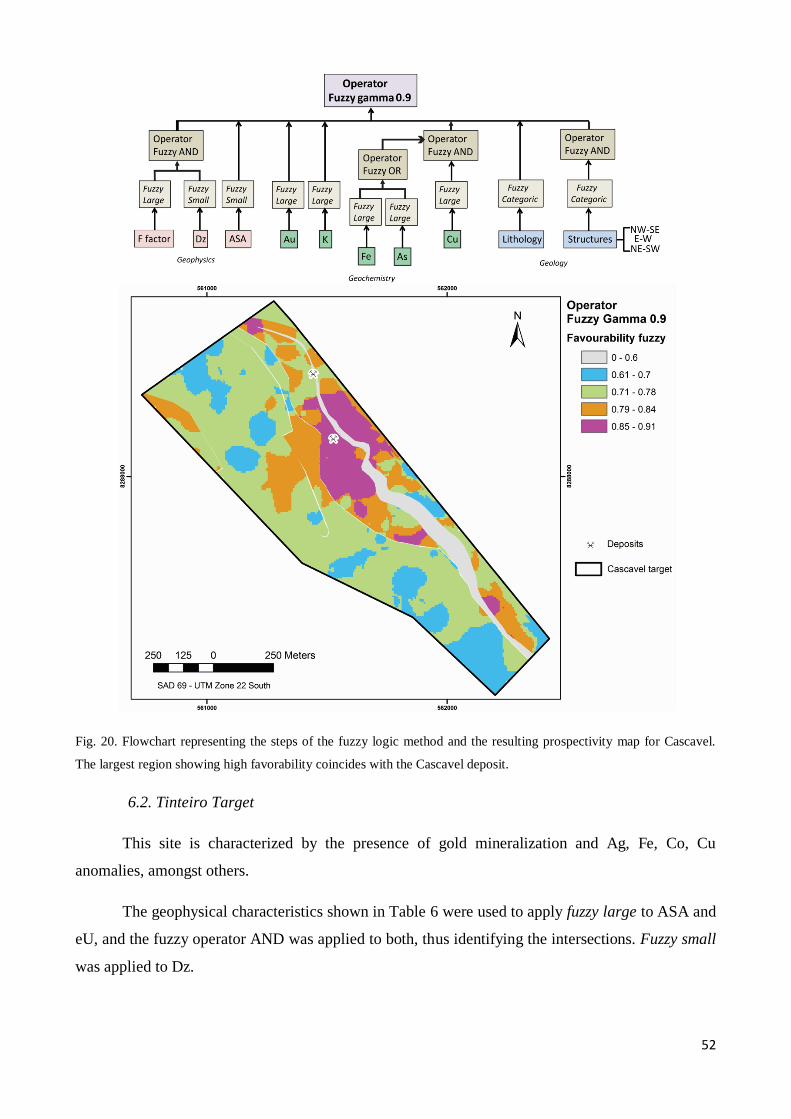
52
Fig. 20. Flowchart representing the steps of the fuzzy logic method and the resulting prospectivity map for Cascavel.
The largest region showing high favorability coincides with the Cascavel deposit.
6.2. Tinteiro Target
This site is characterized by the presence of gold mineralization and Ag, Fe, Co, Cu
anomalies, amongst others.
The geophysical characteristics shown in Table 6 were used to apply fuzzy large to ASA and
eU, and the fuzzy operator AND was applied to both, thus identifying the intersections. Fuzzy small
was applied to Dz.
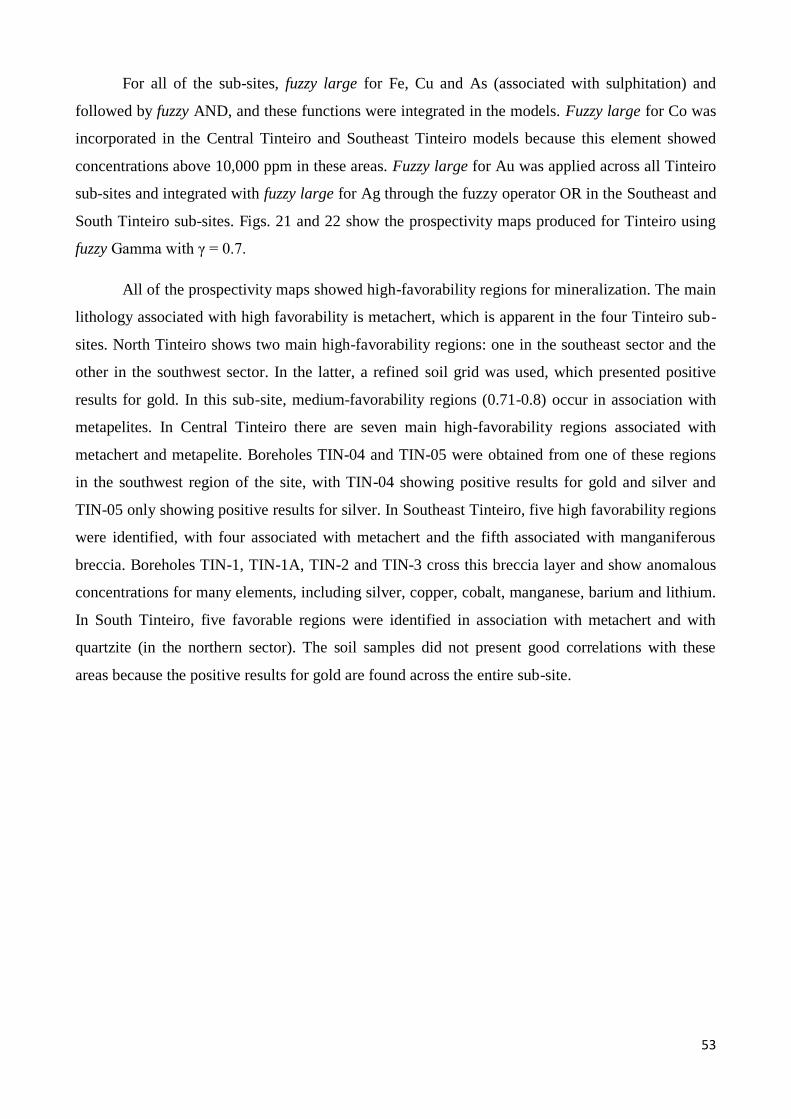
53
For all of the sub-sites, fuzzy large for Fe, Cu and As (associated with sulphitation) and
followed by fuzzy AND, and these functions were integrated in the models. Fuzzy large for Co was
incorporated in the Central Tinteiro and Southeast Tinteiro models because this element showed
concentrations above 10,000 ppm in these areas. Fuzzy large for Au was applied across all Tinteiro
sub-sites and integrated with fuzzy large for Ag through the fuzzy operator OR in the Southeast and
South Tinteiro sub-sites. Figs. 21 and 22 show the prospectivity maps produced for Tinteiro using
fuzzy Gamma with γ = 0.7.
All of the prospectivity maps showed high-favorability regions for mineralization. The main
lithology associated with high favorability is metachert, which is apparent in the four Tinteiro sub-
sites. North Tinteiro shows two main high-favorability regions: one in the southeast sector and the
other in the southwest sector. In the latter, a refined soil grid was used, which presented positive
results for gold. In this sub-site, medium-favorability regions (0.71-0.8) occur in association with
metapelites. In Central Tinteiro there are seven main high-favorability regions associated with
metachert and metapelite. Boreholes TIN-04 and TIN-05 were obtained from one of these regions
in the southwest region of the site, with TIN-04 showing positive results for gold and silver and
TIN-05 only showing positive results for silver. In Southeast Tinteiro, five high favorability regions
were identified, with four associated with metachert and the fifth associated with manganiferous
breccia. Boreholes TIN-1, TIN-1A, TIN-2 and TIN-3 cross this breccia layer and show anomalous
concentrations for many elements, including silver, copper, cobalt, manganese, barium and lithium.
In South Tinteiro, five favorable regions were identified in association with metachert and with
quartzite (in the northern sector). The soil samples did not present good correlations with these
areas because the positive results for gold are found across the entire sub-site.
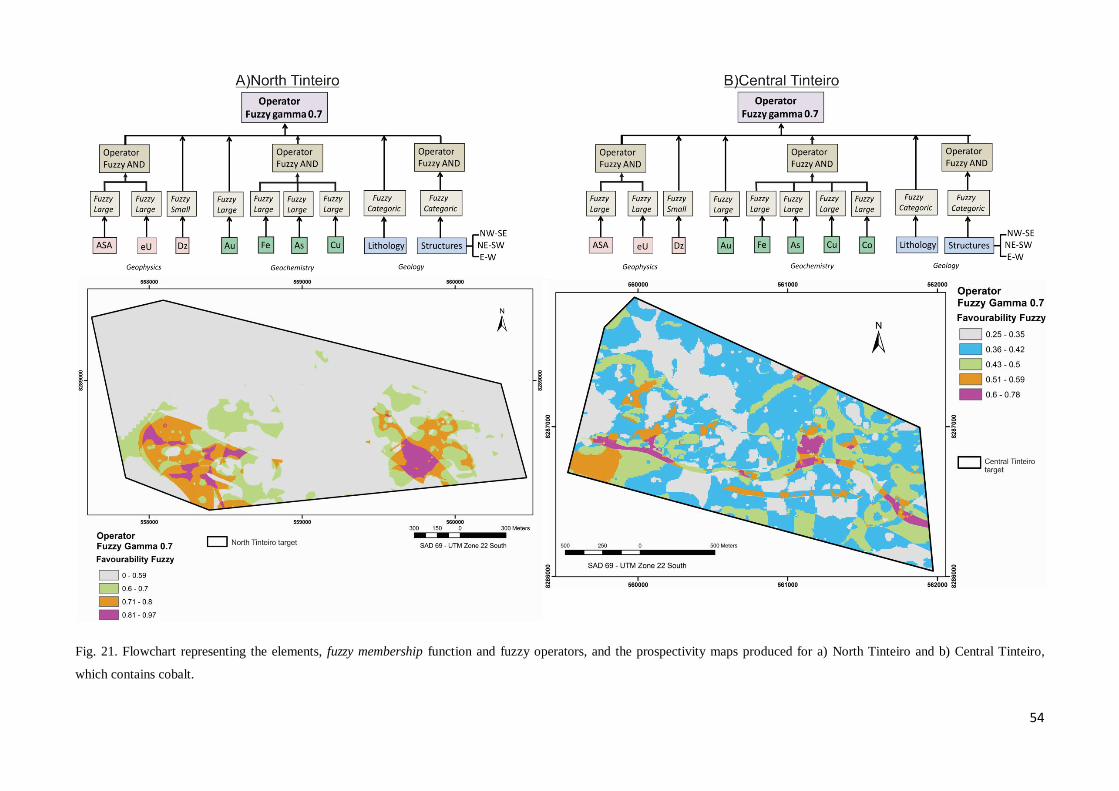
54
Fig. 21. Flowchart representing the elements, fuzzy membership function and fuzzy operators, and the prospectivity maps produced for a) North Tinteiro and b) Central Tinteiro,
which contains cobalt.
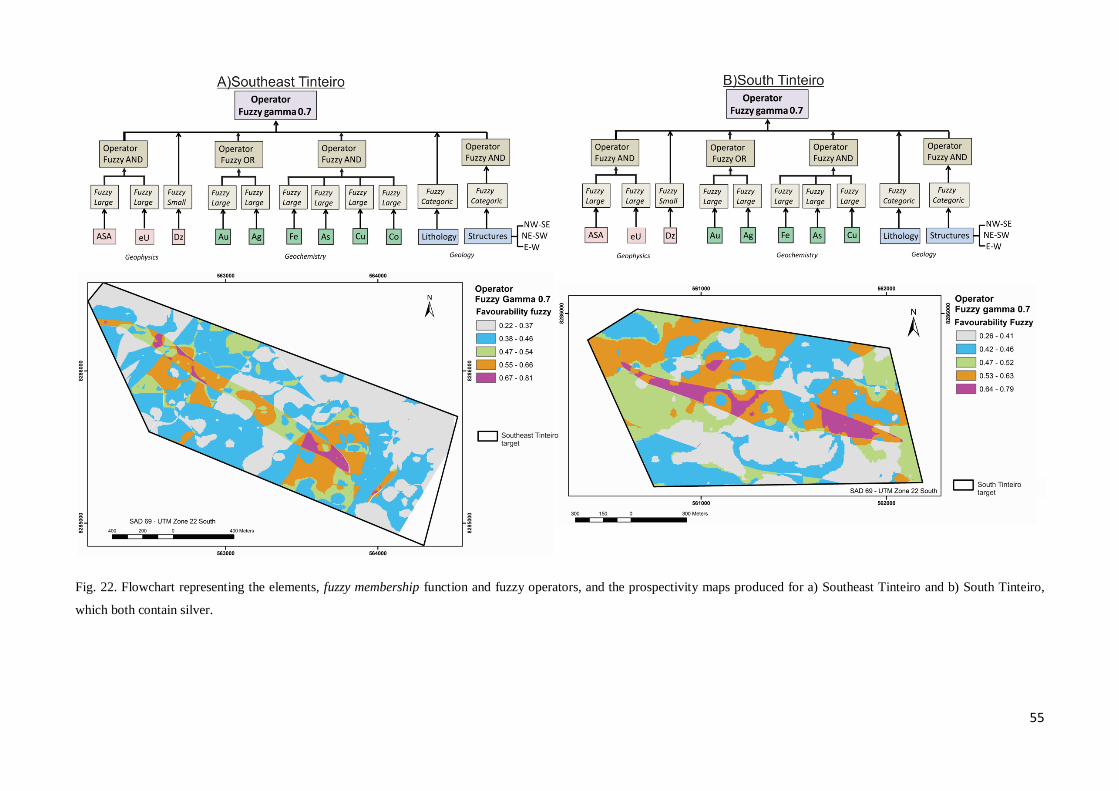
55
Fig. 22. Flowchart representing the elements, fuzzy membership function and fuzzy operators, and the prospectivity maps produced for a) Southeast Tinteiro and b) South Tinteiro,
which both contain silver.
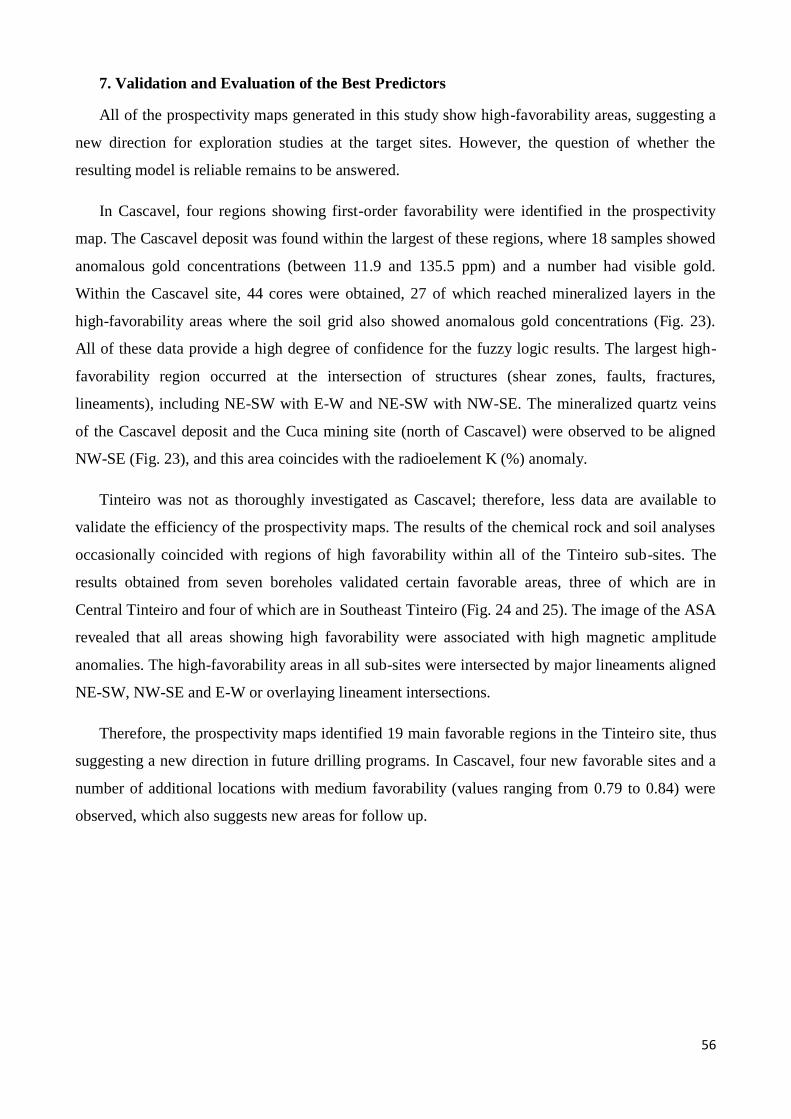
56
7. Validation and Evaluation of the Best Predictors
All of the prospectivity maps generated in this study show high-favorability areas, suggesting a
new direction for exploration studies at the target sites. However, the question of whether the
resulting model is reliable remains to be answered.
In Cascavel, four regions showing first-order favorability were identified in the prospectivity
map. The Cascavel deposit was found within the largest of these regions, where 18 samples showed
anomalous gold concentrations (between 11.9 and 135.5 ppm) and a number had visible gold.
Within the Cascavel site, 44 cores were obtained, 27 of which reached mineralized layers in the
high-favorability areas where the soil grid also showed anomalous gold concentrations (Fig. 23).
All of these data provide a high degree of confidence for the fuzzy logic results. The largest high-
favorability region occurred at the intersection of structures (shear zones, faults, fractures,
lineaments), including NE-SW with E-W and NE-SW with NW-SE. The mineralized quartz veins
of the Cascavel deposit and the Cuca mining site (north of Cascavel) were observed to be aligned
NW-SE (Fig. 23), and this area coincides with the radioelement K (%) anomaly.
Tinteiro was not as thoroughly investigated as Cascavel; therefore, less data are available to
validate the efficiency of the prospectivity maps. The results of the chemical rock and soil analyses
occasionally coincided with regions of high favorability within all of the Tinteiro sub-sites. The
results obtained from seven boreholes validated certain favorable areas, three of which are in
Central Tinteiro and four of which are in Southeast Tinteiro (Fig. 24 and 25). The image of the ASA
revealed that all areas showing high favorability were associated with high magnetic amplitude
anomalies. The high-favorability areas in all sub-sites were intersected by major lineaments aligned
NE-SW, NW-SE and E-W or overlaying lineament intersections.
Therefore, the prospectivity maps identified 19 main favorable regions in the Tinteiro site, thus
suggesting a new direction in future drilling programs. In Cascavel, four new favorable sites and a
number of additional locations with medium favorability (values ranging from 0.79 to 0.84) were
observed, which also suggests new areas for follow up.
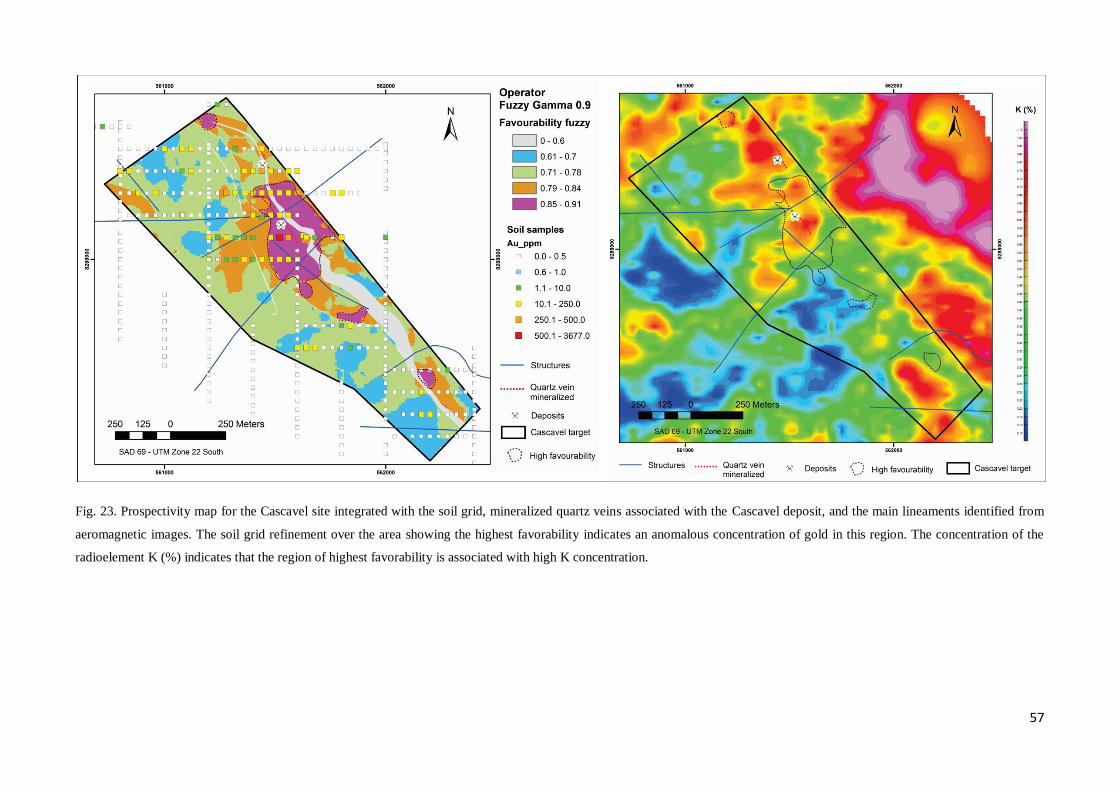
57
Fig. 23. Prospectivity map for the Cascavel site integrated with the soil grid, mineralized quartz veins associated with the Cascavel deposit, and the main lineaments identified from
aeromagnetic images. The soil grid refinement over the area showing the highest favorability indicates an anomalous concentration of gold in this region. The concentration of the
radioelement K (%) indicates that the region of highest favorability is associated with high K concentration.
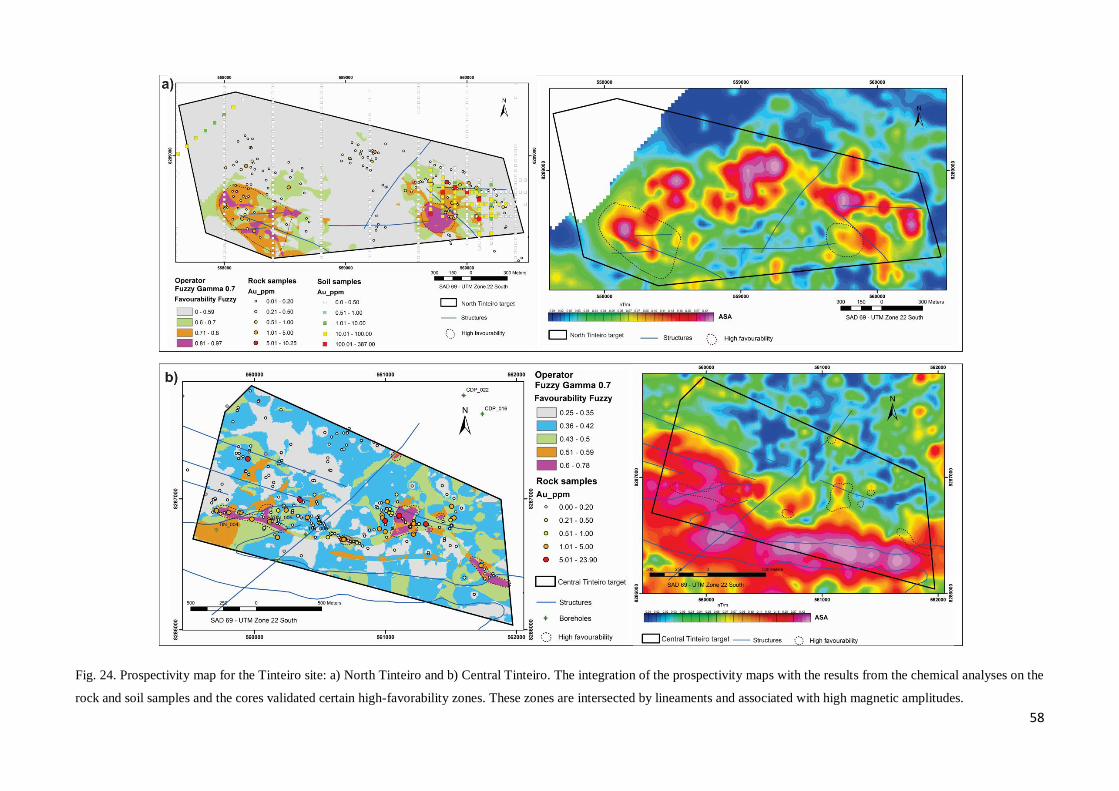
58
Fig. 24. Prospectivity map for the Tinteiro site: a) North Tinteiro and b) Central Tinteiro. The integration of the prospectivity maps with the results from the chemical analyses on the
rock and soil samples and the cores validated certain high-favorability zones. These zones are intersected by lineaments and associated with high magnetic amplitudes.
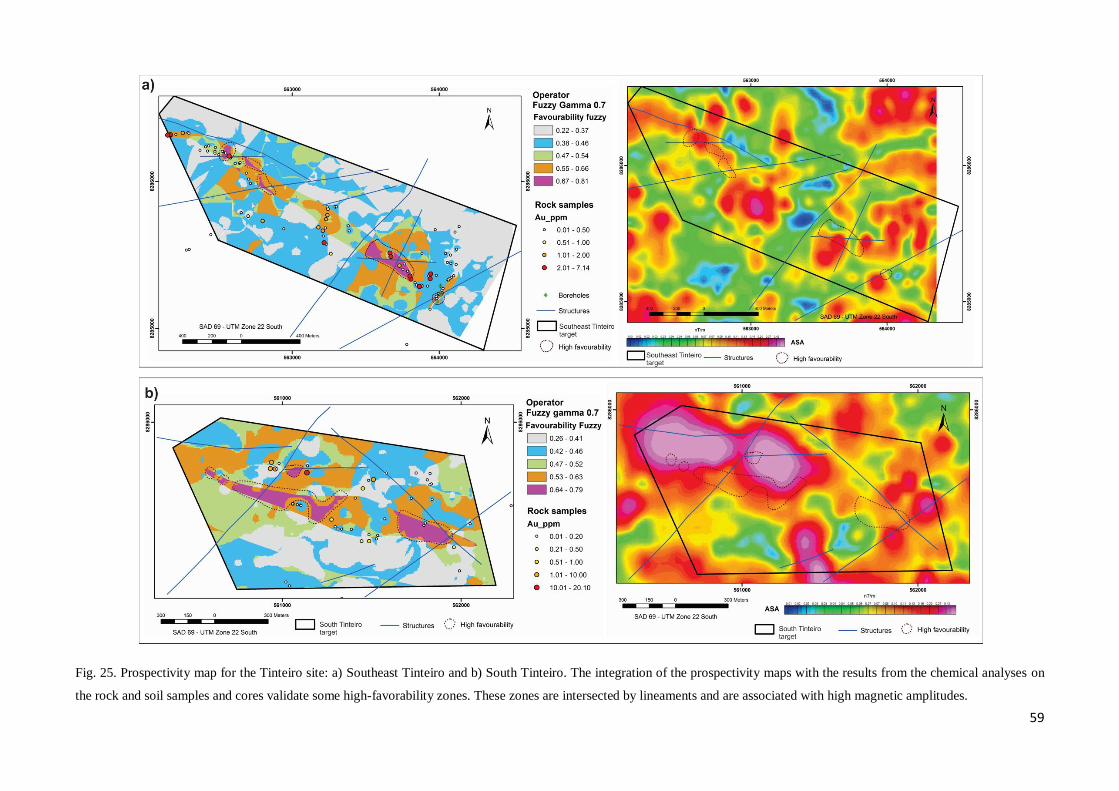
59
Fig. 25. Prospectivity map for the Tinteiro site: a) Southeast Tinteiro and b) South Tinteiro. The integration of the prospectivity maps with the results from the chemical analyses on
the rock and soil samples and cores validate some high-favorability zones. These zones are intersected by lineaments and are associated with high magnetic amplitudes.
60
8. Discussion and Conclusions
A detailed study of all of the available multi-source data was undertaken to create prospectivity
maps that can be used to identify the most important vectors for the resulting model. During this
process, the main characteristics of the study area were identified and used to generate the final
integrated map.
(1) Three main structural groups were identified in the study area based on the interpretation of
airborne geophysical images and the RGB (453) image of the Landsat 7 ETM+ sensor. These
structures are as follows: faults, shear zones and major lineaments aligned NW-SE, NE-SW and E-
W. Apparently, all of the structures were related to mineralizations. However, the NE-SW
lineaments were usually observed in areas where mineralization occurred in association with the
intersection of structures.
(2) The mineralization and sedimentary deposits found at Cascavel and Tinteiro were different,
with Cascavel found to be orogenic and Tinteiro found to be IOCG.
According to Groves et al. (1998) and Robert et al. (2007), orogenic deposits are characterized
by their occurrence in quartz-carbonate veins, concentration along regional and secondary
compressional-transpressional structures, strong lateral hydrothermal zonation proximal to distal
alteration assemblages. The characteristics of the Cascavel deposit described here classify it as
orogenic.
Williams et al. (2005) noted the following key characteristics of IOCG deposits: (1) presence of
Cu with or without Au as economic metals; (2) hydrothermal veins, breccias and/or replacement ore
styles, characteristically in specific structural sites; (3) abundant magnetite and/or hematite; (4) iron
oxides with lower concentrations of Ti compared with the oxides occurring in igneous rocks; and
(5) clear spatial association with igneous intrusions. Comparing these characteristics with those
observed in Tinteiro, it is possible to classify the deposits as IOCG, although the association of
mineralization and igneous intrusions has not been clearly identified in this study.
(3) The hydrothermal alteration halo in Cascavel was characterized according to its
presentation of silicification and potassification in its most inner region. The mineralization was
marked by the occurrence of free gold associated with quartz, green muscovite and siderite, thus
forming a mineralized zone that was primarily hosted in feldspathic quartzites.
(4) The hydrothermal alteration halo in Tinteiro was characterized according to its presentation
of a zone rich in arsenopyrite, which was weathered to form goethite, and muscovite, thus forming a
61
mineralized zone when associated with hematite breccias and gossan. In manganiferous breccias,
the mineralized zone was formed by hollandite, lithiophorite and muscovite. Both hollandite and
lithiophorite presented gold and silver in their structure. The hollandite was also a source of Ba and
Mn, and the lithiophorite was a source of Li, Mn, Cu, Ni, Co and Zn. The mineralization was
primarily hosted mainly in metacherts and also occurred in quartzites and metapelites.
(5) The boreholes in Cascavel showed anomalous concentrations of Au, Ag, Cu, Zn, Ni, Co,
Cr, Pb and W; however, Au was not correlated to any other element. The gold mineralization was
hosted in quartz veins within feldspathic quartzites, whereas the other mineralizations were
associated with dolomitic marble.
(6) Tinteiro indicated polymetallic potential and showed anomalous concentrations of Au, Ag,
Cu, Fe, Co, Ni, Mn, Ba, Pb, Zn, Cr, Li and V that were primarily associated with manganiferous
breccias.
(7) The prospectivity map for Cascavel identified four regions of high favorability and new
medium-favorability focus with values between 0.79 and 0.84.
(8) The prospectivity maps for Tinteiro identified 19 new high-favorability foci, thus suggesting
a change in direction for subsequent sampling and coring phases.
9. Acknowledgments
The authors would like to thank ORINOCO DO BRASIL MINERAÇÃO LTD., especially
geologists M. Carvalho, V. Rodrigues, K. Araujo and T. Andrade, for supporting the development
of this project. We also acknowledge the Institute of Geosciences of University of Brasilia for
providing access to analytical facilities, in particular Professor Nilson F.Botelho and Ricardo Lívio
S. Marques, for the acquisition of microprobe data. D.S. Campos acknowledges the Brazilian
CAPES for providing a Master scholarship (Grant 2013/15). A.M. Silva thanks the National
Council for Scientific and Technological Development (CNPq) for the research grant and the
support through the “MODELAGEM GEOLÓGICO-GEOFÍSICA APLICADA À
RECONSTRUÇÃO DA ARQUITETURA DE TERRENOS GRANITO-GREENSTONE E
IMPLICAÇÕES PARA EXPLORAÇÃO MINERAL: O EXEMPLO DA PORÇÃO
MERIDIONAL DO BLOCO ARQUEANO DE GÓIAS Project (Grant 474336/2013-1)”.
10. References
Almeida, F. F. M., Hasui, Y., Brito Neves, B. B., Fuck, R. A., 1977. Províncias Estruturais Brasileiras. In:
SBG, Simpósio de Geologia do Nordeste, 8, Campina Grande, Anais, 363-391.
62
An, P., Moon, W.M., Rencz, A., 1991. Application of fuzzy set theory to integrated mineral exploration.
Canadian Journal of Exploration Geophysics, 27 (1), 1-11.
Baêta Jr., J.D., Souza, J.O., Moreton, L.C., 1998. Programa Levantamentos Geológicos Básicos do Brasil –
PLGB. Folha SD.22-Z-C-II – Morro Agudo de Goiás; Folha SD.22-Z-C-V, Goiás; Folha SE.22-X-A-II -
Sanclerlândia. Escala 1:100.000. CPRM, Goiânia, Relatório Interno.
Beghelli Junior, L.P., 2012. Charnockitos e ortognaisses da porção Centro-Oeste do Bloco Arqueano de
Goiás: dados geoquímicos e isotópicos. Dissertação de Mestrado n° 307. UnB. 77p.
Bonham-Carter, G.F., 1994. Geographic information systems for Geoscientists: Modelling with GIS: Oxford,
Pergamon, 398p.
Carrino, T.A., Silva, A.M., Botelho, N.F., Silva, A.A.C., 2011. Lógica Fuzzy e Técnica SAM para
Modelagem Previsional do Ouro no Setor Oeste da Província Mineral do Tapajós usando Dados
Aerogeofísicos e de Sensoriamento Remoto. Revista Brasileira de Geofísica, 29(3), 535-554.
Costa e Silva, E., Silva, A.M., Toledo, C.L.B., Mol, A.G., Otterman, D.W., Souza, S.R.C., 2012. Mineral
Potencial Mapping for Orogenic Gold Deposits in the Rio Maria Granite Greenstone Terrane, Southeastern
Para state, Brazil. Economic Geology, 107, 1387-1402.
Danni. J.C.M., Dardenne. M.A., Fuck. R.A., 1981. Geologia da região de Goiás (GO): O "Greenstone Belt"
da Serra de Santa Rita e a Sequência Serra do Cantagalo. In: SIMP. GEOL. DO CENTRO-OESTE, I,
Goiânia, SBG. 265-280.
Dickson, B.L., Scott, K.M. 1997., Interpretation of aerial gamma-ray surveys – adding the geochimical
factores. Journal of Australian Geology & Geophysics,17(2), 187-200.
Fornazzari Neto, L. & Ferreira, F.J.F., 2003. Gamaespectometria integrada a dados exploratórios multifontes
em ambiente SIG aplicada à prospecção de ouro na folha Botuverá, SC. Revista Brasileira de Geociências, v.
33 (2-suplemento). 197-208.
Gnojek, I., Prichystal, A., 1985. A new zinc mineralization detected by airborne gamma-ray spectrometry in
northern Moravia (Czechoslovakia). Geoexploration, 23, 491-502.
Groves, D.I., Goldfarb, R.J., Genre-Mariam, M., Hagemann, S.G., And Robert, F., 1998, Orogenic gold
deposits: A proposed classification in the context of their crustal distribution and relationships to other gold
deposit types. Ore Geology Reviews, 13, 7-17.
Gunn, P.J., Dentith, M.C., 1997. Magnetic responses associated with mineral deposits. AGSO Journal of
Australian Geology & Geophysics, 17 (2), 145-158.
Harris, J.R., Sanborn-Barrie, M., 2006. Mineral potential mapping: examples from the Red Lake Greenstone
Belt, Northwest Ontario. In: Harris, J.R. (ed.) GIS for the Earth Sciences. Geological Association of Canada.
Special Publication, 44, 1–21.
Holden, E., Wong, J.C., Koveski, P., Wedge, D., Dentith, M., Bagas, L., 2012. Identifying structural
complexity in aeromagnetic data: An image analysis approach to greenfields gold exploration. Ore Geology
Reviews,46, 47-59.
Jost, H., Carvalho, M.J, Rodrigues, V.G., and Martins, R., 2014. Metalogênese dos greenstone belts de
Goiás. In: Metalogênese das Províncias Tectônicas Brasileiras, CPRM, Belo Horizonte, 141-168.
63
Jost, H., Chemale Junior, F., Fuck, R.A., Dussin, I.A., 2013. Uvá complex, the oldest orthogneisses of the
Archean-Paleoproterozoic terrane of central Brazil. Journal of South American Earth Sciences, 47, 201-212.
Jost, H., Fortes, P.T.F.O., 2001. Gold deposits and occurrences of the Crixás Goldfield, central Brazil.
Mineralium Deposita, 36, 358-376.
Jost, H., Fuck, R.A., Dantas, E.L., Rancan, C.C., Rezende, D.B., Santos, E., Portela, J.F., Mattos, L.,
Chiarini, M.F.N., Oliveira, R.C., Silva, S.E., 2005. Geologia e geocronologia do Complexo Uvá, bloco
arqueano de Goiás. Rev. Brasil. Geociências, 35, 559-572.
Jost H., Oliveira A.M., 1991. Stratigraphy of the greenstone belts, Crixás region, Goiás, Central Brazil.
Journal of South American Earth Sciences, 4(3), 201 -214.
Kuyumjian, R.M., Jost, H., 2006. Low- and high-alumina komatiites of Goiás, Central Brazil. Journal of
South American Earth Sciences. 20, 315-326.
Lowrie, W., 2007. Fundamentals of Geophysics. 2 ed. Cambridge University Press. 381p.
Miller, H.G., Singh, V., 1994. Potential field tilt – a new concept for location of potential field sources.
Journal of Applied Geophysics, 32(2-3), 213-217.
Nykänen, V., 2008. Spatial data analysis as a tool for mineral prospectivity mapping: Espoo, Geological
Survey of Finland, 27 p.
Nykänen, V., Groves, D.I., Ojala, V.J., Eilu, P., Gardoll, S.J., 2008. Reconnaissance-scale conceptual fuzzy-
logic prospectivity modelling for iron oxide copper-gold deposits in the northern Fennoscandian Shield,
Finland. Australian Journal of Earth Sciences, 55, 25-38.
Orinoco do Brasil Mineração Ltda., 2014. Orinoco expands Cascavel Gold Project. ASX Release. 8p.
Pan, G., Harris, D.P., 2000. Information Synthesis for Mineral Exploration. Oxford University Press, New
York, 461 p.
Pimentel, M.M., Fuck, R.A., Jost, H., Ferreira Filho, C.F., Araújo, S.M., 2000. The basement of the Brasília
Fold Belt and the Goiás Magmatic Arc. In: Tectonic Evolution of South America. 31st International
Geological Congress Special Publication, Rio de Janeiro.195-229.
Pimentel, M.M., Jost, H., Fuck, R.A., 2004. O embasamento da Faixa Brasília e o Arco Magmático de Goiás,
Cap. XXI. In: Geologia do Continente Sul-Americano: Evolução e Obra de Fernando Flávio Marques de
Almeida. 355-368.
Post, J.E., 1999. Manganese oxide minerals: Crystal structures and economic and environmental
significance. Proc. Natl. Acad. Sci. USA, vol. 96. Colloquium Paper. 3447 – 3454.
Queiróz, C.L., Jost, H., Da Silva, L.C., Mcnaughton, N.J., 2008. U-Pb SHRIMP and Sm-Nd geochronology
of granite-gneiss complexes and implications for the evolution os the Central Brazil Archean Terrain. Jornal
of South American earth Sciences, 26, 100-124.
Raines, G.L, Sawatzky, D.L., Bonham-Carter, G.F., 2010. New fuzzy logic tools in ArcGis 10: ArcUser,
ESRI, 13 p.
Resende M.G., Jost H., Lima B.E.M., Teixeira A.A., 1999. Proveniência e idades modelos Sm/Nd das rochas
siliciclásticas arqueanas dos greenstone belts de Faina e Santa Rita, Goiás. Revista Brasileira de Geociencias,
29, 281-290.
64
Resende M.G., Jost H., Osborne G.A., Mol A.G., 1998. Stratygraphy of the Goiás and Faina greenstone
belts, Central Brazil: a new proposal. Revista Brasileira de Geociencias, 28, 77-94.
Robert, F., Brommecker, R., Bourne, B.T., Dobak, P.J., Mcewan, C.J., Rowe, R.R., Zhou, X., 2007. Models
and Exploration Methods for Major Gold Deposit Types. Ore Depos. And Expl. Tecnh., Paper 48, 691-711.
Roest, W.R., Verhoef, J., Pilkington, M., 1992. Magnetic interpretation using the 3-D analytic signal,
Geophysics, 57(1), 116-125.
Sabins, F. F., 1996. Remote Sensing: Principles and Interpretation, 3 rd ed.: W. H. Freeman and Company,
New York, 494 p.
Saunders, D.F., Terry, S.A., Thompson, C.K., 1987. Test of National Uranium Resource Evaluation gamma-
ray spectral data in petroleum reconnaissance. In: Geophysics, 52, 1547-1556.
Toledo, C.L.B.; Silva, A.M.; Chemale Jr, F.; Almeida, T.; Garnier, J.; Araujo Filho, J.O.; Hauser, N.;
Botelho, N.F.; Jost, H.; Bernardi, G.B.; Paiva, R.G.; Magaldi, T.T.; Ferreira, V.H.C.S.; Magalhães, H.V.B.;
Araujo, B.V.B.; Silva, L.B.C.; Bastos, Y.M.M.; Teixeira, C.D.; Vieira, H.A.; Moraes, F.G.M.; Neiva Jr,
F.B.; Mansur, E.T.; Soares, T.M.; Valle, R.S.C.; Silva, S.P.; Oliveira, A.L.; Martins, P.L.G.; Franco, G.S.;
Lamblém, H.S.; Leite, A.M.; Fazio, G.; Topan, J.G.O.; Daldegan, L.C.B.; Cassemiro, R.B., 2014. Projeto
Faina-Goiás – Mapeamento Geológico na escala 1:25.000. Trabalho de Formatura da UnB.
Williams, P.J., Barton, M.D., Johnson, D.A., Fonteboté, L., Haller, A., Mark, G., Oliver, N.H.S., Marschik,
R., 2005. Iron Oxide Copper-Gold Deposits: Geology, Space-Time Distribution, and Possible Modes of
Origin. Economic Geology. 100th Anniversary Volume. 371-405.

65
III. DISCUSSÕES E CONSIDERAÇÕES FINAIS
66
III. Discussões e Considerações Finais
A ocorrência de dois tipos distintos de mineralização em um mesmo terreno do tipo
greenstone representou um desafio para este trabalho. Os greenstone belts mais bem estudados do
Brasil, geralmente são hospedeiros de um único tipo de mineralização. Como exemplo temos o
Greenstone Belt Andorinha, no terreno granito-greenstone Rio Maria, situado na Província Mineral
de Carajás, Pará, com vários depósitos de ouro, todos do tipo lode orogênico, diferindo apenas no
tipo de rocha hospedeira: greenstone-hosted (mina Mamão), turbidite-hosted (depósito Lagoa Seca)
e BIF-hosted (alvo Marcinho) (Costa e Silva et al., 2012; Tunussi, 2012). O Greenstone Belt Rio
das Velhas, no Quadrilátero Ferrífero, Minas Gerais, possui vários depósitos de ouro, todos do tipo
orogênico, separados apenas pela idade e natureza das rochas hospedeiras (Ribeiro-Rodrigues,
1998).
As características geofísicas, geoquímicas e geológicas apontaram o depósito Cascavel
como orogênico e o alvo Tinteiro como do tipo IOCG. A mineralização do alvo Tinteiro é posterior
á orogênica do depósito Cascavel. Estas diferenças acarretaram complexidade na geração dos
modelos. Contudo, terrenos do tipo greenstone com superimposição de mineralizações são
encontradas em todo o mundo. O Greenstone Belt Central Lapland, Finlândia, é um exemplo de
cinturão com duas mineralizações distintas: uma orogênica e a outra do tipo IOCG (Nykänen,
2008). Em seu trabalho, esse autor gera diferentes modelos para cada tipo de mineralização. Isto
pode ser feito porque a metodologia lógica fuzzy se revela como uma ferramenta flexível para testar
modelos exploratórios (Nykänen & Salmirinne, 2007). Baseado nesta premissa, cada alvo foi
estudado separadamente a fim de se determinar os principais vetores exploratórios para a
composição do modelo. Os resultados obtidos foram bastante satisfatórios e puderam ser validados
por outras etapas exploratórias, tais como malha de solo, amostragem de rochas, furos de sonda, e
“checagem” de estruturas através das imagens aeromagnéticas de alta resolução. Em função dos
resultados obtidos, esta metodologia pode representar um novo conceito de como explorar
greenstone belts no Brasil, e se tornar a propulsora de novas descobertas minerais.
As mineralizações superimpostas também representaram um desafio na etapa inicial da
interpretação aerogeofísica, pois as alterações hidrotermais geradas, e suas relações com as rochas
hospedeiras, apresentam diferentes comportamentos gamaespectrométricos. O mesmo tipo de
alteração em diferentes rochas hospedeiras, muitas vezes, mostra respostas diferentes na imagem
ternária (RGB), ressaltando a rocha, e não a alteração hidrotermal, mas em campo isso é difícil de
ser observado. Em outros locais o comportamento é exatamente o inverso, pois, rochas diferentes
67
aparecem com as mesmas características gamaespectrométricas, por estarem submetidas ao mesmo
tipo de alteração. Inicialmente, isso pareceu ser um problema na individualização de litotipos a
partir da imagem ternária (RGB), uma vez que os tipos de alterações ainda não haviam sido
estudados. Posteriormente, percebeu-se que as áreas onde incidem problemas na separação de
litotipos, a partir da imagem RGB, devem ser mais bem analisadas, pois provavelmente este
comportamento está relacionado com algum tipo de alteração hidrotermal. Esta situação destaca a
grande importância de se utilizar geofísica de alta resolução para evidenciar as alterações
hidrotermais e, consequentemente, para a seleção de alvos potenciais em greenstone belts.
Para o estudo detalhado dos alvos utilizou-se dados multifontes e etapas de pesquisa em
diferentes escalas, o que permitiu determinar os principais vetores exploratórios para cada alvo em
separado. Foram interpretados três grupos estruturais com orientações NW, NE e E-W, compondo
feições estruturais dúcteis e rúpteis, tais como zonas de cisalhamento, falhas e fraturas. As
mineralizações dos dois alvos aparecem relacionadas aos três grupos estruturais, principalmente na
intersecção dessas estruturas.
A mineralização do alvo Cascavel é caracterizada por ouro livre grosso hospedado em veios
de quartzo, associada a forte zoneamento lateral hidrotermal. Os halos de alteração hidrotermal
foram subdivididos em quatro zonas distintas, caracterizadas por silicificação e alteração potássica
na zona mais interna (proximal) e alteração cálcica na zona mais externa (distal). O mapa
prospectivo deste alvo identificou quatro regiões favoráveis como hospedeira da mineralização
aurífera, e outros novos focos com favorabilidade média.
A mineralização do alvo Tinteiro é classificada como polimetálica por apresentar
concentrações anômalas de Au, Cu, Ag, Fe, Co, Ni, Mn, Ba, Zn, Li, Cr, Pb e V, associadas a
gossan, brechas hematíticas e brechas manganesíferas. A brecha hematítica e o gossan são
compostos por arsenopirita e hematita, alterados para goethita, e muscovita. A brecha
manganesífera é caracterizada por hollandita, litioforita e muscovita. Os mapas prospectivos para os
sub-alvos do Tinteiro identificaram 19 novos focos favoráveis como hospedeiros da mineralização
polimetálica.

68
IV. REFERÊNCIAS
69
IV. Referências
Allen, R.L., Weihed, P., and Global VMS Research Project Team., 2002. Global comparisons of volcanic-
associated massive sulphide districts. In: The Timing and Location of Major Ore Deposits in an Evolving
Orogen: Geological Society of London Special Publication 204, 13-37.
Almeida, F. F. M., Hasui, Y., Brito Neves, B. B., Fuck, R. A., 1977. Províncias Estruturais Brasileiras. In:
SBG, Simpósio de Geologia do Nordeste, 8, Campina Grande, Anais, 363-391.
An, P., Moon, W.M., Rencz, A., 1991. Application of fuzzy set theory to integrated mineral exploration.
Canadian Journal of Exploration Geophysics, 27 (1), 1-11.
Baêta Jr, J.D.A., 2000. Carta geológica. Folha Goiás – SD.22-Z-C-V Escala 1:100.000. CPRM.
Baêta Jr., J.D., Souza, J.O., Moreton, L.C., 1998. Programa Levantamentos Geológicos Básicos do Brasil –
PLGB. Folha SD.22-Z-C-II – Morro Agudo de Goiás; Folha SD.22-Z-C-V, Goiás; Folha SE.22-X-A-II -
Sanclerlândia. Escala 1:100.000. CPRM, Goiânia, Relatório Interno.
Beghelli Junior, L.P., 2012. Charnockitos e ortognaisses da porção Centro-Oeste do Bloco Arqueano de
Goiás: dados geoquímicos e isotópicos. Dissertação de Mestrado n° 307. UnB. 77p.
Bonham-Carter, G.F., 1994. Geographic information systems for Geoscientists: Modelling with GIS: Oxford,
Pergamon, 398 p.
Cawood, P.A., Hawkesworth, C.J., 2015. Temporal relations between mineral deposits and global tectonic
cycles. Geological Society, London, Special Publications, 393, 9-21.
Carrino, T.A., Silva, A.M., Botelho, N.F., Silva, A.A.C., 2011. Lógica Fuzzy e Técnica SAM para
Modelagem Previsional do Ouro no Setor Oeste da Província Mineral do Tapajós usando Dados
Aerogeofísicos e de Sensoriamento Remoto. Revista Brasileira de Geofísica, 29(3), 535-554.
Condie, K.C., 1981. Archean Greenstone Belts. Developments in Precambrian Geology, 3, 434pp.
Costa e Silva, E., Silva, A.M., Toledo, C.L.B., Mol, A.G., Otteman, D.W., Souza, S.R.C., 2012. Mineral
potential mapping for orogenic gold deposits in the Rio Maria Granite Greenstone Terrane, Southestern Pará
State, Brazil. Economic Geology, 107, 1387-1402.
Danni. J.C.M., Dardenne. M.A., Fuck. R.A., 1981. Geologia da região de Goiás (GO): O "Greenstone Belt"
da Serra de Santa Rita e a Sequência Serra do Cantagalo. In: SIMP. GEOL. DO CENTRO-OESTE, I,
Goiânia, SBG. 265-280.
Dickson, B.L., Scott, K.M., 1997. Interpretation of aerial gamma-ray surveys – adding the geochimical
factores. Journal of Australian Geology & Geophysics,17(2), 187-200.
Fiorentini, M., Beresford, S., Barley, M., Duuring, P., Bekker, A., Rosengren, N., Cas, R., Hronsky, J., 2012.
District to camp controls on the genesis of komatiite-hosted nickel sulfide deposits, Agnew-Wiluna
greenstone belt, western Australia: insights from the multiple sulfur isotopes. Economic Geology, 107 (5),
781-796.
Fornazzari Neto, L. & Ferreira, F.J.F., 2003. Gamaespectometria integrada a dados exploratórios multifontes
em ambiente SIG aplicada à prospecção de ouro na folha Botuverá, SC. Revista Brasileira de Geociências, v.
33 (2-suplemento). 197-208.
70
Gnojek, I., Prichystal, A., 1985. A new zinc mineralization detected by airborne gamma-ray spectrometry in
northern Moravia (Czechoslovakia). Geoexploration, 23, 491-502.
Goldfarb, R.J., Groves, D.I., Gardoll, S., 2001. Orogenic gold and geologic time: a global synthesis. Ore
Geology Reviews, 18, 1-75.
Groves, D.I., Goldfarb, R.J., Genre-Mariam, M., Hagemann, S.G., And Robert, F., 1998, Orogenic gold
deposits: A proposed classification in the context of their crustal distribution and relationships to other gold
deposit types. Ore Geology Reviews, 13, 7-17.
Groves, D.I., Vielreicher, R.M., Goldfarb, R.J., Condie, K.C., 2005. Controls on the heterogeneous
distribution of mineral deposits through time. Geological Society, London, Special Publications, 248, 71-
101.
Gunn, P.J., Dentith, M.C., 1997. Magnetic responses associated with mineral deposits. AGSO Journal of
Australian Geology & Geophysics, 17 (2), 145-158.
Harris, J.R., Sanborn-Barrie, M., 2006. Mineral potential mapping: examples from the Red Lake Greenstone
Belt, Northwest Ontario. In: Harris, J.R. (ed.) GIS for the Earth Sciences. Geological Association of Canada.
Special Publication, 44, 1–21.
Holden, E., Wong, J.C., Koveski, P., Wedge, D., Dentith, M., Bagas, L., 2012. Identifying structural
complexity in aeromagnetic data: An image analysis approach to greenfields gold exploration. Ore Geology
Reviews,46, 47-59.
Jost, H., Carvalho, M.J, Rodrigues, V.G., and Martins, R., 2014. Metalogênese dos greenstone belts de
Goiás. In: Metalogênese das Províncias Tectônicas Brasileiras, CPRM, Belo Horizonte, 141-168.
Jost, H., Chemale Junior, F., Fuck, R.A., Dussin, I.A., 2013. Uvá complex, the oldest orthogneisses of the
Archean-Paleoproterozoic terrane of central Brazil. Journal of South American Earth Sciences, 47, 201-212.
Jost, H., Fortes, P.T.F.O., 2001. Gold deposits and occurrences of the Crixás Goldfield, central Brazil.
Mineralium Deposita, 36, 358-376.
Jost, H., Fuck, R.A., Dantas, E.L., Rancan, C.C., Rezende, D.B., Santos, E., Portela, J.F., Mattos, L.,
Chiarini, M.F.N., Oliveira, R.C., Silva, S.E., 2005. Geologia e geocronologia do Complexo Uvá, bloco
arqueano de Goiás. Revista Brasileira de Geociências, 35, 559-572.
Jost H., Oliveira A.M., 1991. Stratigraphy of the greenstone belts, Crixás region, Goiás, Central Brazil.
Journal of South American Earth Sciences, 4(3), 201 -214.
Kuyumjian, R.M., Jost, H., 2006. Low- and high-alumina komatiites of Goiás, Central Brazil. Journal of
South American Earth Sciences. 20, 315-326.
Lowrie, W., 2007. Fundamentals of Geophysics. 2 ed. Cambridge University Press. 381p.
Mercier-Langevin, P., Dubé, B., Hannington, M.D., Davis, D.W., Lafrance, B., Gosselin, G., 2007. The
LaRonde Penna Au-rich volcanogenic massive sulfide deposit, Abitibi greenstone belt, Quebec: part I.
Geology and geochronology. Economic Geology and the Bulletin of Society of Economic Geologists 102,
585-609.
Miller, H.G., Singh, V., 1994. Potential field tilt – a new concept for location of potential field sources.
Journal of Applied Geophysics, 32(2-3), 213-217.
71
Nykänen, V., Salmirinne, H., 2007. Prospectivity analysis of gold using regional geophysical and
geochemical data from the Central Lapland Greenstone belt, Finland. In: Ojala, V.J. (ed.) Gold in the Central
Lapland Greenstone Belt, Finland. Geological Survey of Finland, Special Paper 44, 235–253.
Nykänen, V., 2008. Spatial data analysis as a tool for mineral prospectivity mapping: Espoo, Geological
Survey of Finland, 27p.
Nykänen, V., Groves, D.I., Ojala, V.J., Eilu, P., Gardoll, S.J., 2008. Reconnaissance-scale conceptual fuzzy-
logic prospectivity modelling for iron oxide copper-gold deposits in the northern Fennoscandian Shield,
Finland. Australian Journal of Earth Sciences, 55, 25-38.
Orinoco do Brasil Mineração Ltda., 2014. Orinoco expands Cascavel Gold Project. ASX Release. 8p.
Pan, G. & Harris, D.P., 2000. Information Synthesis for Mineral Exploration. Oxford University Press, New
York, 461p.
Pimentel, M.M., Fuck, R.A., Jost, H., Ferreira Filho, C.F., Araújo, S.M., 2000. The basement of the Brasília
Fold Belt and the Goiás Magmatic Arc. In: Tectonic Evolution of South America. 31st International
Geological Congress Special Publication, Rio de Janeiro.195-229.
Pimentel, M.M., Jost, H., Fuck, R.A., 2004. O embasamento da Faixa Brasília e o Arco Magmático de Goiás,
Cap. XXI. In: Geologia do Continente Sul-Americano: Evolução e Obra de Fernando Flávio Marques de
Almeida. 355-368.
Post, J.E., 1999. Manganese oxide minerals: Crystal structures and economic and environmental
significance. Proc. Natl. Acad. Sci. USA, vol. 96. Colloquium Paper. 3447 – 3454.
Queiróz, C.L., Jost, H., Da Silva, L.C., Mcnaughton, N.J., 2008. U-Pb SHRIMP and Sm-Nd geochronology
of granite-gneiss complexes and implications for the evolution os the Central Brazil Archean Terrain. Jornal
of South American earth Sciences, 26, 100-124.
Raines, G.L, Sawatzky, D.L., Bonham-Carter, G.F., 2010. New fuzzy logic tools in ArcGis 10: ArcUser,
ESRI, 13 p.
Resende M.G., Jost H., Osborne G.A., Mol A.G., 1998. Stratygraphy of the Goiás and Faina greenstone
belts, Central Brazil: a new proposal. Revista Brasileira de Geociencias, 28, 77-94.
Resende M.G., Jost H., Lima B.E.M., Teixeira A.A., 1999. Proveniência e idades modelos Sm/Nd das rochas
siliciclásticas arqueanas dos greenstone belts de Faina e Santa Rita, Goiás. Revista Brasileira de Geociências,
29, 281-290.
Ribeiro-Rodrigues, L.C., 1998. Gold mineralization in Archean banded iron formation, Quadrilátero
Ferrífero, Minas Gerais, Brazil – The Cuiabá Mine. Ph.D. thesis, RWTH Aachen, Germany, Aachener
Geowinssenschftiche.
Robert, F., Brommecker, R., Bourne, B.T., Dobak, P.J., Mcewan, C.J., Rowe, R.R., Zhou, X., 2007. Models
and Exploration Methods for Major Gold Deposit Types. Ore Depos. And Expl. Tecnh., Paper 48, 691-711.
Roest, W.R., Verhoef, J., Pilkington, M., 1992. Magnetic interpretation using the 3-D analytic signal,
Geophysics, 57(1), 116-125.
Sabins, F. F., 1996. Remote Sensing: Principles and Interpretation, 3rd ed.: W. H. Freeman and Company,
New York, 494p.
72
Saunders, D.F., Terry, S.A., Thompson, C.K., 1987. Test of National Uranium Resource Evaluation gamma-
ray spectral data in petroleum reconnaissance. Geophysics, 52, 1547-1556.
Toledo, C.L.B.; Silva, A.M.; Chemale Jr, F.; Almeida, T.; Garnier, J.; Araujo Filho, J.O.; Hauser, N.;
Botelho, N.F.; Jost, H.; Bernardi, G.B.; Paiva, R.G.; Magaldi, T.T.; Ferreira, V.H.C.S.; Magalhães, H.V.B.;
Araujo, B.V.B.; Silva, L.B.C.; Bastos, Y.M.M.; Teixeira, C.D.; Vieira, H.A.; Moraes, F.G.M.; Neiva Jr,
F.B.; Mansur, E.T.; Soares, T.M.; Valle, R.S.C.; Silva, S.P.; Oliveira, A.L.; Martins, P.L.G.; Franco, G.S.;
Lamblém, H.S.; Leite, A.M.; Fazio, G.; Topan, J.G.O.; Daldegan, L.C.B.; Cassemiro, R.B., 2014. Projeto
Faina-Goiás – Mapeamento Geológico na escala 1:25.000. Trabalho de Formatura da UnB.
Tunussi, C., 2012. Integração de dados multifonte para caracterização das zonas de alteração hidrotermal
associadas às mineralizações de ouro no Greenstone Belt Andorinha, Província Mineral de Carajás.
Dissertação de mestrado n° 304. UnB – Brasília. 144p.
Williams, P.J., Barton, M.D., Johnson, D.A., Fonteboté, L., Haller, A., Mark, G., Oliver, N.H.S., Marschik,
R., 2005. Iron Oxide Copper-Gold Deposits: Geology, Space-Time Distribution, and Possible Modes of
Origin. Economic Geology. 100th Anniversary Volume. 371-405.